Attached files
| file | filename |
|---|---|
| EX-10.12 - EXHIBIT 10.12 - Madison Square Garden Sports Corp. | tmsgcexhibit10120630201810k.htm |
| EX-32.2 - EXHIBIT 32.2 - Madison Square Garden Sports Corp. | tmsgcexhibit3220630201810k.htm |
| EX-32.1 - EXHIBIT 32.1 - Madison Square Garden Sports Corp. | tmsgcexhibit3210630201810k.htm |
| EX-31.2 - EXHIBIT 31.2 - Madison Square Garden Sports Corp. | tmsgcexhibit3120630201810k.htm |
| EX-31.1 - EXHIBIT 31.1 - Madison Square Garden Sports Corp. | tmsgcexhibit3110630201810k.htm |
| EX-23.1 - EXHIBIT 23.1 - Madison Square Garden Sports Corp. | tmsgcexhibit2310630201810k.htm |
| EX-21.1 - EXHIBIT 21.1 - Madison Square Garden Sports Corp. | tmsgcexhibit2110630201810k.htm |
| EX-10.60 - EXHIBIT 10.60 - Madison Square Garden Sports Corp. | tmsgcexhibit10600630201810k.htm |
| EX-10.13 - EXHIBIT 10.13 - Madison Square Garden Sports Corp. | tmsgcexhibit10130630201810k.htm |
UNITED STATES
SECURITIES AND EXCHANGE COMMISSION
Washington, D.C. 20549
FORM 10-K
(Mark One)
þ | ANNUAL REPORT PURSUANT TO SECTION 13 OR 15(d) OF THE SECURITIES EXCHANGE ACT OF 1934 |
For the fiscal year ended June 30, 2018
or
o | TRANSITION REPORT PURSUANT TO SECTION 13 OR 15(d) OF THE SECURITIES EXCHANGE ACT OF 1934 |
For the transition period from ___________ to _____________
Commission File Number: 1-36900

(Exact name of registrant as specified in its charter)
Delaware | 47-3373056 | |
(State or other jurisdiction of incorporation or organization) | (I.R.S. Employer Identification No.) | |
Two Penn Plaza New York, NY | 10121 | |
(Address of principal executive offices) | (Zip Code) | |
Registrant’s telephone number, including area code: (212) 465-6000 | ||
Securities registered pursuant to Section 12(b) of the Act: Title of each class: | Name of each Exchange on which Registered: | |
Class A Common Stock | New York Stock Exchange | |
Indicate by check mark if the Registrant is a well-known seasoned issuer, as defined in Rule 405 of the Securities Act. Yes þ No o
Indicate by check mark if the Registrant is not required to file reports pursuant to Section 13 or Section 15(d) of the Act. Yes o No þ
Indicate by check mark whether the Registrant (1) has filed all reports required to be filed by Section 13 or 15(d) of the Securities Exchange Act of 1934 during the preceding 12 months (or for such shorter period that the Registrant has been required to file such reports), and (2) has been subject to such filing requirements for the past 90 days. Yes þ No o
Indicate by check mark whether the registrant has submitted electronically and posted on its corporate Web site, if any, every Interactive Data File required to be submitted and posted pursuant to Rule 405 of Regulation S-T during the preceding 12 months (or for such shorter period that the registrant was required to submit and post such files). Yes þ No o
Indicate by a check mark if disclosure of delinquent filers pursuant to Item 405 of Regulation S-K is not contained herein, and will not be contained, to the best of the Registrant’s knowledge, in definitive proxy or information statements incorporated by reference in Part III of this Form 10-K or any amendment to this Form 10-K. o
Indicate by check mark whether each Registrant is a large accelerated filer, an accelerated filer, a non-accelerated filer, a smaller reporting company, or an emerging growth company. See the definitions of “large accelerated filer,” “accelerated filer,” “smaller reporting company” and “emerging growth company” in Exchange Act Rule 12b-2.
Large accelerated filer þ | Accelerated filer o | |
Non-accelerated filer o (Do not check if a smaller reporting company) | Smaller reporting company o | |
Emerging growth company o | ||
If an emerging growth company, indicate by check mark if the registrant has elected not to use the extended transition period for complying with any new or revised financial accounting standards provided pursuant to Section 13(a) of the Exchange Act. o
Indicate by check mark whether the Registrant is a shell company (as defined in Rule 12b-2 of the Exchange Act). Yes o No þ
Aggregate market value of the voting and non-voting common equity held by non-affiliates of The Madison Square Garden Company as of June 30, 2018 computed by reference to the price at which the common equity was last sold on New York Stock Exchange as of December 29, 2017, the last business day of the registrant’s most recently completed second fiscal quarter, was approximately: $3,897,326,309
Number of shares of common stock outstanding as of July 31, 2018:
Class A Common Stock par value $0.01 per share | — | 19,136,976 |
Class B Common Stock par value $0.01 per share | — | 4,529,517 |
Documents incorporated by reference — Certain information required for Part III of this report is incorporated herein by reference to the proxy statement for the 2018 annual meeting of the Company’s shareholders, expected to be filed within 120 days after the close of our fiscal year.
TABLE OF CONTENTS
Page | |
PART I
Item 1. Business
The Madison Square Garden Company is a Delaware corporation with our principal executive offices at Two Pennsylvania Plaza, New York, NY, 10121. Unless the context otherwise requires, all references to “we,” “us,” “our,” “Madison Square Garden,” “MSG” or the “Company” refer collectively to The Madison Square Garden Company, a holding company, and its direct and indirect subsidiaries. We conduct substantially all of our business activities discussed in this Annual Report on Form 10-K through MSG Sports & Entertainment, LLC and its direct and indirect subsidiaries. Our telephone number is 212-465-6000, our Internet address is http://www.themadisonsquaregardencompany.com and the investor relations section of our web site is http://investor.msg.com. We make available, free of charge through the investor relations section of our web site, annual reports on Form 10-K, quarterly reports on Form 10-Q and current reports on Form 8-K and amendments to those reports filed or furnished pursuant to Section 13(a) or 15(d) of the Securities Exchange Act of 1934, as amended (the “Exchange Act”), as well as proxy statements, as soon as reasonably practicable after we electronically file such material with, or furnish it to, the Securities and Exchange Commission (“SEC”). References to our web site in this report are provided as a convenience and the information contained on, or available through, our web site is not part of this or any other report we file with or furnish to the SEC.
The Company was incorporated on March 4, 2015 as an indirect, wholly-owned subsidiary of MSG Networks Inc. (“MSG Networks”), formerly known as The Madison Square Garden Company. All the outstanding common stock of the Company was distributed to MSG Networks shareholders (the “Distribution”) on September 30, 2015 (the “Distribution Date”).
On June 27, 2018, the Company announced that its board of directors (“Board”) has authorized the Company’s management to explore a possible spin-off that would create a separately-traded public company comprised of its sports businesses, including the New York Knicks and New York Rangers professional sports franchises. We refer to the potential spin-off as the “Sports Distribution.” If the Company proceeds with the Sports Distribution, it would be structured as a tax-free transaction to all MSG shareholders. Upon completion of the contemplated separation, record holders of MSG common stock would receive a pro-rata distribution, expected to be equivalent, in aggregate, to an approximately two-thirds economic interest in the sports company. The remaining common stock, expected to be equivalent to an approximately one-third economic interest in the sports company, would be retained by the Company. There can be no assurance that the proposed transaction will be completed in the manner described above, or at all. The Company has not set a timetable for completion of this process. Completion of the transaction would be subject to various conditions, including certain league approvals, a private letter ruling from the IRS, receipt of a tax opinion from counsel and final Board approval. The Company may file a Form 10 registration statement with the SEC which would contain additional information about the proposed Sports Distribution.
Overview
The Madison Square Garden Company is a leader in live experiences comprised of celebrated venues, legendary sports teams, exclusive entertainment productions, and other entertainment assets which include dining and nightlife venues and music festivals. Utilizing our powerful assets, brands and live event expertise, the Company delivers premium and unique experiences that set the standard for excellence and innovation while forging deep connections with diverse and passionate audiences. We manage our business through the following two operating segments:
MSG Sports: This segment includes the Company’s professional sports franchises: the New York Knicks (the “Knicks”) of the National Basketball Association (the “NBA”), the New York Rangers (the “Rangers”) of the National Hockey League (the “NHL”), the New York Liberty (the “Liberty”) of the Women’s National Basketball Association (the “WNBA”), the Hartford Wolf Pack of the American Hockey League (the “AHL”) and the Westchester Knicks of the NBA G League (the “NBAGL”). Our professional sports franchises are collectively referred to herein as “our sports teams.” The MSG Sports segment also includes Counter Logic Gaming (“CLG”), a premier North American esports organization, and Knicks Gaming, MSG’s franchise that competes in the NBA 2K League. CLG and Knicks Gaming are collectively referred to herein as “our esports teams,” and, together with our sports teams, “our teams.” In addition, the MSG Sports segment promotes, produces and/or presents a broad array of other live sporting events, including professional boxing, college basketball, college hockey, professional bull riding, mixed martial arts, esports, tennis and college wrestling.
MSG Entertainment: This segment features the Company’s live entertainment events — including concerts, family shows, performing arts and special events — which we present or host in our diverse collection of venues. Those venues are: Madison Square Garden (“The Garden”), The Hulu Theater at Madison Square Garden, Radio City Music Hall, the Beacon Theatre, the Forum, The Chicago Theatre and the Wang Theatre. Our MSG Entertainment segment also includes our original production — Christmas Spectacular Starring the Radio City Rockettes (“Christmas Spectacular”) — as well as Boston Calling Events, LLC (“BCE”), the entertainment production company that owns and operates the Boston Calling Music Festival, and TAO Group Holdings LLC (“TAO Group”), a hospitality group with globally-recognized entertainment dining and nightlife brands.
1
Our Strengths
• | Ownership of legendary sports franchises; |
• | Iconic venues in top live entertainment markets; |
• | Marquee entertainment brands and content, including the Christmas Spectacular and the Radio City Rockettes (“Rockettes”); |
• | Powerful presence in the New York City metropolitan area with established core assets and expertise for strategic expansion; |
• | Strong industry relationships that create opportunities for new content and brand extensions; |
• | Deep connections with loyal and passionate fan bases that span a wide demographic mix; |
• | First-class experience in managing venues, bookings, marketing, sales and hospitality in multiple markets; |
• | Ability to forge strategic partnerships that utilize the Company’s assets, core competencies and scale, while allowing the Company to benefit from growth in those businesses; |
• | Established history of successfully planning and executing comprehensive venue design and construction projects; |
• | Extensive range of proprietary marketing assets, including a customer database that allows us to drive engagement with our brands; and |
• | Strong and seasoned management team. |
Our Strategy
The Madison Square Garden Company pursues opportunities that strengthen our portfolio of live experiences and capitalize on our iconic venues, popular sports franchises and exclusive entertainment content, as well as our expertise in venue management, bookings, marketing, sales and hospitality. We believe the Company’s unique assets and capabilities, coupled with our deep relationships in the sports and entertainment industries and our strong connection with our diverse and passionate audiences, are what set the Company apart. We continue to look for ways to improve our core operations, while we explore new opportunities to grow and innovate. Specific initiatives we are focused on include:
• | Developing championship caliber teams. The core goal of our sports strategy is to develop teams that consistently compete for championships in their leagues and support and drive revenue streams across the Company. We continue to explore new ways to increase engagement and revenue opportunities across the teams’ broad consumer and corporate customer bases. |
• | Monetizing our exclusive sports content. The Company has media rights agreements with MSG Networks that provide a significant recurring and growing revenue stream to the Company, subject to the terms of such agreements. In addition, these agreements and our relationship with MSG Networks provide our fans with the ability to watch locally televised home and away games of the Knicks and Rangers, as well as other programming related to our teams, on MSG Networks’ award-winning regional sports networks. |
• | Utilizing our integrated approach to marketing and sales. The Company possesses powerful sports and entertainment assets that can create significant value for our business. For example: |
◦ | Our integrated approach to marketing partnerships allows us to use and sell our broad array of assets together in order to maximize their collective value, both for the Company and for our marketing partners. Our ability to offer compelling, broad-based marketing platforms, which we believe are unparalleled in sports and entertainment, enables us to attract world-class partners, such as our “Marquee” marketing partner, JPMorgan Chase, and our “Signature” marketing partners, which include — Anheuser-Busch, Charter Communications, Delta Airlines, DraftKings, Kia, Lexus, PepsiCo (beginning September 1, 2018), SAP and Squarespace. |
◦ | We continue to forge deep direct-to-consumer relationships with customers and fans, with a focus on understanding how consumers interact with every aspect of the Company. A key component of this strategy is our large and growing proprietary customer database, which drives revenue and engagement across segments, benefiting the Company through ticket sales, merchandise sales and sponsorship activation. This database provides us with an opportunity to cross-promote our products and services, introducing customers to our wide range of assets and brands. |
2
• | Utilizing a unique strategy for our performance venues. The Company has a collection of performance venues through which we deliver high-quality live sports and entertainment. In addition to our New York venues: The Garden, The Hulu Theater at Madison Square Garden, Radio City Music Hall and the Beacon Theatre, our portfolio includes: the Forum in Inglewood, CA and The Chicago Theatre, and we have an exclusive booking agreement with respect to the Wang Theatre in Boston. These venues, along with our venue management capabilities, effective bookings strategy and proven expertise in sponsorships, marketing, ticketing and hospitality, have positioned the Company as an industry leader in live entertainment. We intend to leverage our unique assets, expertise and approach to drive growth and stockholder value, and to ensure we continue to create unmatched experiences for the benefit of all our stakeholders. |
◦ | Maximizing the live entertainment experience for our customers. We use our first-class operations, coupled with new innovations and our ability to attract top talent, to deliver unforgettable experiences for our customers — whether they are first-time visitors, repeat customers, season ticket holders, or suite holders — ensuring they return to our venues. We have a track record of designing world-class facilities that exceed our customers’ expectations. This includes our renovations of Radio City Music Hall, the Beacon Theatre, The Garden and the Forum to deliver top-quality amenities such as state-of-the-art lighting, sound and staging, a full suite of hospitality offerings and enhanced premium products. In addition to better onsite amenities, we continue to explore new ways to utilize technology to improve the customer experience and create communities around our live events. From the way our customers buy their food and beverage; to how we market and process their tickets; to the content we provide them to enhance their sports and entertainment experience, we want to give our customers the best in-venue experience in the industry. |
◦ | Leveraging our live entertainment expertise to increase productivity across our performance venues. Part of what drives our success is our “artist first” approach. This includes our renovation of the Forum, which set a new bar for the artist experience by delivering superior acoustics and an intimate feel, along with amenities such as nine star-caliber dressing rooms and dedicated areas for production and touring crews. This talent-friendly environment, coupled with more date availability and our top-tier service, is not only attracting artists to our West Coast venue, but also bringing them back for repeat performances. We will continue to use our “artist first” approach to attract the industry’s top talent with the goal of increasing utilization across all our venues through more multi-night and multi-market concerts and other events, including more recurring high-profile shows that help expand our base of events. Examples of this strategy include our residencies — which feature legendary performers playing our venues each month, and have included Billy Joel at The Garden and Jerry Seinfeld at the Beacon Theatre. |
◦ | Selectively expanding our performance venues in key music and entertainment markets. With the renovation of the Forum, we created the country’s only arena-sized venue dedicated to music and entertainment, which quickly established a strong presence in the market. We believe that, similar to Los Angeles, there are other select markets where our proven ability to develop music and entertainment-focused venues — coupled with our unique capabilities, expertise and “artist first” approach — will deliver a differentiated experience for artists, fans and partners. In May 2016, the Company announced plans to build a state-of-the-art new venue in Las Vegas focused specifically on music and entertainment. In February 2018, we further unveiled our vision for these venues, which will be known as MSG Sphere. We believe MSG Sphere venues will change live entertainment by pioneering the next generation of immersive experiences. The first MSG Sphere venue will debut in Las Vegas, one of the world’s most important entertainment destination cities. In February 2018, we also announced the purchase of land in Stratford, London, which we expect will become home to the Company’s first large-scale international venue and the second MSG Sphere. MSG Sphere venues will utilize advanced, cutting-edge technologies to create an entirely new platform that is expected to redefine how immersion and storytelling come together in live experiences. Because of the transformative nature of these venues, we believe there will be other markets — both domestic and international — where MSG Sphere can be successful. The design of MSG Sphere will be flexible to accommodate a wide range of sizes and capacities — from large-scale to smaller and more intimate — based on the needs of the individual market. Controlling and booking a network of world-class venues provides the Company with a number of avenues for potential growth, including driving increased bookings and greater marketing and sponsorship opportunities. As we explore selectively extending the MSG Sphere network, we will be open to multiple types of transaction structures, including owned, operated, and joint ventures. As we work with various companies to develop the technologies needed for MSG Sphere venues, we are focused on obtaining appropriate strategic rights with respect to intellectual property. |
3
• | Expanding our entertainment dining and nightlife venues. The Company owns a controlling interest in TAO Group — a leader in the hospitality industry. TAO Group currently operates 25 entertainment dining and nightlife venues in New York City, Las Vegas, Los Angeles, Singapore and Sydney, Australia with globally-recognized brands that include: TAO, Marquee, Lavo, Avenue, The Stanton Social, Beauty & Essex and Vandal. TAO Group is actively developing opportunities in select markets — both domestically and internationally — to expand and, in June 2018, announced that it plans to open new entertainment dining and nightlife venues as part of Moxy Chelsea hotel in New York City, as well as TAO Chicago and Marquee Singapore. |
• | Growing our portfolio of proprietary content. We continue to explore the creation of proprietary content and attractions that enable us to benefit from being both content creator and venue operator. This includes opportunities to develop theatrical productions for our existing and planned venues. For our planned MSG Sphere venues, we are developing a set of tools that will allow both MSG and third parties to create content for the platform, making content creation an intuitive experience — whether someone is adapting existing content or developing original creations that maximize the potential of the venue’s technologies. MSG expects to use these tools to create our own catalogue of content and original productions, establishing a library of unique and compelling material that can be used across MSG Sphere venues. |
• | Exploring adjacencies that strengthen our business. As part of our commitment to creating unmatched experiences, we explore adjacencies that strengthen our position in sports and entertainment. Potential opportunities include new types of events and festivals, and new opportunities in hospitality, clubs, and food and beverage. Examples over the last several years include the Company’s purchase of a controlling interest in BCE, the entertainment production company known for creating and operating New England’s premier music festival — the Boston Calling Music Festival; TAO Group, a hospitality group with globally-recognized entertainment dining and nightlife brands; and CLG, a premier North American esports organization. |
• | Continuing to explore external strategic opportunities. We continue to seek strategic opportunities to add compelling assets and brands that resonate with our customers and partners, fit with our core competencies and allow new opportunities for growth across the Company. One of the ways we try to capitalize on our unique combination of dynamic assets, established industry relationships and deep customer connections is through strategic partnerships that bring together the expertise and capabilities of each partner, and enable us to team with recognized leaders in their fields and benefit from growth in those businesses. For example, we own 50% of Azoff MSG Entertainment LLC (“AMSGE”) which is backed by one of the music and entertainment industry’s most respected and influential executives, Irving Azoff. The joint venture owns and operates music, media and entertainment businesses, which allows us to pursue various businesses in the entertainment space. In addition, we own 50% of Tribeca Enterprises LLC (“Tribeca Enterprises”), bringing together two of New York’s cultural and entertainment icons to enhance the reach and impact of both brands, while allowing us to partner with one of the most respected teams in the film and entertainment industry. |
Our Business
MSG Sports
Our Company is synonymous with some of the greatest sporting events in history. Today that tradition continues with our commitment to delivering a broad array of world-class sporting events that create lasting and indelible memories for sports fans. Our MSG Sports segment includes some of the world’s most recognized sports franchises, as well as a diverse selection of other live sporting events, that the Company promotes, produces and/or presents, primarily at The Garden, The Hulu Theater at Madison Square Garden and the Forum.
Our Sports Franchises
The Knicks and Rangers are two of the most recognized franchises in professional sports, with storied histories and passionate, multi-generational fan bases. These teams are the primary occupants of The Garden, playing a combined total of 82 regular season home games, often to at or near capacity attendance. The Liberty currently play 15 home games at the Westchester County Center, located in White Plains, NY, in addition to two regular season home games at The Garden. For all of our sports teams, the number of home games increases if they qualify for the playoffs.
New York Knicks
As an original franchise of the NBA, the Knicks have a rich history that includes eight trips to the NBA Finals and two NBA Championships, as well as some of the greatest athletes to ever play the game. In May 2018, the Knicks introduced a new head coach, David Fizdale, who will lead a young and exciting franchise into the 2018-19 season focused on fielding a championship-caliber team over the long-term. The Knicks ranked in the top three in the NBA for ticket sales receipts for the 2017-18 regular season.
4
New York Rangers
The Rangers hockey club is one of the “original six” franchises of the NHL, with 2017-18 marking the team’s 91st season. Winners of four Stanley Cup Championships and 11 conference titles over their history, the Rangers continue to be one of the league’s marquee teams, advancing to the playoffs in 11 of the past 13 seasons. The Rangers are known to have one of the most passionate, loyal and enthusiastic fan bases in all of sports, and ranked in the top three in the NHL for ticket sales receipts for the 2017-18 regular season.
New York Liberty
Established in October 1996, when New York was selected as one of eight charter members of the WNBA, the Liberty have won three conference championships and appeared in the playoffs 15 times. In the 2017 season, the Liberty finished with the best record in the Eastern Conference for a third straight season and qualified for the WNBA playoffs as the number three overall seed. In November 2017, the Company announced that it is pursuing the sale of the Liberty.
Westchester Knicks
The Westchester Knicks, an NBAGL team, plays its home games at the Westchester County Center in White Plains, NY and serves as the exclusive NBAGL affiliate of the Knicks. In the 2017-18 season, the Westchester Knicks had the best regular season record in the Eastern Conference.
Hartford Wolf Pack
The Hartford Wolf Pack, a minor-league hockey team, is the player development team for the Rangers and is also competitive in its own right in the AHL. The Rangers send draft picks and other players to the Hartford Wolf Pack for skill development and injury rehabilitation, and can call up players for the Rangers roster to enhance the team’s competitiveness. The Hartford Wolf Pack have reached the playoffs 15 times in 21 seasons.
Esports
The Company’s portfolio of live experiences includes a presence in the esports industry through a controlling interest in CLG, a premier North American esports organization. Founded in 2010, CLG is one of the most established and successful organizations in the industry, operating eight teams across several well-known esports games: “League of Legends,” “Fortnite,” “Counter-Strike: Global Offensive,” “Super Smash Bros.,” “Smite,” “H1Z1,” and “Clash Royale.” In 2018, Knicks Gaming, our franchise in the NBA 2K Esports League, made its debut as part of the league’s inaugural season and qualified for the playoffs.
The Role of the Leagues in Our Operations
As franchises in professional sports leagues, our teams are members of their respective leagues and, as such, are subject to certain limitations, under certain circumstances, on the control and management of their affairs. The respective league constitutions of our sports teams, under which each league is operated, together with the collective bargaining agreements (each a “CBA”) each league has signed with its players’ association, contain numerous provisions that, as a practical matter in certain circumstances, could impact the manner in which we operate our businesses. In addition, under the respective league constitutions of our sports teams, the commissioner of each league, either acting alone or with the consent of a majority (or, in some cases, a supermajority) of the other sports teams in the league, may be empowered in certain circumstances to take certain actions felt to be in the best interests of the league, whether or not such actions would benefit our sports teams and whether or not we consent or object to those actions.
While the precise rights and obligations of member teams vary from league to league, the leagues have varying degrees of control exercisable under certain circumstances over the length and format of the playing season, including preseason and playoff schedules; the operating territories of the member teams; national and international media and other licensing rights; admission of new members and changes in ownership; franchise relocations; indebtedness affecting the franchises; and labor relations with the players’ associations, including collective bargaining, free agency, and rules applicable to player transactions, luxury taxes and revenue sharing. See “Part II — Item 7. Management’s Discussion and Analysis of Financial Condition and Results of Operations — Business Overview — MSG Sports — Expenses.” Additionally, CLG operates multiple teams that participate in several different esports leagues. The rights and obligations of each CLG team (and member teams generally) vary from league to league. The leagues are generally empowered to and have implemented rules with respect to our league participation, as well as operation, and monetization of the CLG teams and brand. From time to time, we may disagree with or challenge actions the leagues take or the power and authority they assert, although the leagues’ governing documents and our agreements with the leagues purport to limit the manner in which we may challenge decisions and actions by a league commissioner or the league itself.
5
Other Sporting Events
The Company’s MSG Sports segment also includes a broad array of live sporting events that the Company promotes, produces and/or presents, including professional boxing, college basketball, college hockey, professional bull riding, mixed martial arts, esports, tennis and college wrestling. Many of these events are among the most popular in our history and are perennial highlights on our annual calendar, as well as some of The Garden’s longest-running associations.
Professional boxing, beginning with John L. Sullivan in 1882, has had a long history with The Garden. The Arena famously hosted Muhammad Ali and Joe Frazier’s 1971 “Fight of the Century,” considered among the greatest sporting events in modern history, as well as numerous bouts featuring dozens of other boxing greats. These have included: Joe Louis, Rocky Marciano, Sugar Ray Robinson, Willie Pep, Emile Griffith, George Foreman, Roberto Duran, Oscar De La Hoya, Sugar Ray Leonard, Lennox Lewis, Roy Jones, Jr., Mike Tyson, Evander Holyfield, Miguel Cotto, Wladimir Klitschko, Gennady Golovkin, and Vasiliy Lomachenko, one of the world’s best pound-for-pound fighters, who captured the WBA lightweight title at The Garden in May 2018.
The Company has also expanded its presence in the popular sport of mixed martial arts. In June 2016, the Forum hosted its first-ever Ultimate Fighting Championship (“UFC”) event with Michael Bisping capturing the middleweight title in an upset victory over Luke Rockhold at UFC 199. The Garden then hosted the historic UFC 205 in November 2016, the first professional mixed martial arts event in New York state since 1995, during which Conor McGregor knocked out Eddie Alvarez to become the first simultaneous two-weight champion in UFC history. In November 2017, UFC returned to The Garden, as mixed martial arts legend Georges St. Pierre made his much-anticipated comeback to the octagon to capture the middleweight title at UFC 217, one of three championship belts to change hands that evening. Bellator MMA has also hosted internationally-broadcasted events at both The Garden and the Forum, and Professional Fighters League has hosted events at The Hulu Theater at Madison Square Garden and The Chicago Theatre.
College sports have been a mainstay at The Garden for decades, with college basketball’s longest running holiday showcase, the Holiday Festival, first tipping off more than 60 years ago. In addition to St. John’s University calling The Garden its “home away from home,” this past year the highly-anticipated Big East Tournament celebrated its 36th year and the Big Ten Men’s Basketball Tournament held its championship at The Garden in March for the first time. Other college basketball highlights include visits from Duke University’s Blue Devils and the Villanova Wildcats, who played four games at The Garden on their way to winning the 2018 National Championships, as well as the annual Jimmy V Classic and the 2K Sports Classic.
In 2007, The Garden sold out its first college hockey game — Red Hot Hockey featuring Cornell University versus Boston University — which has become a popular biennial event that Cornell won for the first time in 2017. College hockey has continued to grow at The Garden and become a fan-favorite over the last decade, attracting top national teams such as Boston College, North Dakota, Michigan and Minnesota.
Other recent world-class sporting events have included the NBA All-Star Game, which The Garden last hosted in 2015, marking the fifth time the arena has hosted the illustrious professional basketball event and the NCAA Division I Men’s Basketball East Regional Finals, which The Garden hosted in 2014 and 2017, and will again in 2020. Additionally, The Garden has featured numerous tennis legends on its court, including Pete Sampras, Roger Federer and Rafael Nadal, and in March 2018, welcomed tennis luminaries Serena and Venus Williams back for Tie Break Tens, the competition’s first event held in the United States.
These live sporting events are not contemplated to be included as part of the possible Sports Distribution.
MSG Entertainment
Our Company delivers unforgettable entertainment experiences — including live events and spectacular productions — all in extraordinary settings that span some of the country’s largest entertainment markets. This creates a significant demand for an association with our brands — by artists, premier companies and the public. And with a foundation of iconic venues, our Company has a proven ability to leverage the strength of our industry relationships, marketing assets, customer database and live event expertise to create performance, promotion and distribution opportunities for artists, events and productions, and to increase utilization of our venues.
Specifically, our MSG Entertainment segment includes concerts, family shows, performing arts events and special events that we present or host at our venues, which are: The Garden, The Hulu Theater at Madison Square Garden, Radio City Music Hall, the Beacon Theatre, the Forum and The Chicago Theatre. In addition, we have an exclusive booking agreement with respect to the Wang Theatre. With seating capacities and configurations that range from 2,800 to 21,000, our collection of diverse venues enables us to showcase acts that cover a wide spectrum of genres and popular appeal.
6
Our MSG Entertainment segment also includes the beloved holiday show, the Christmas Spectacular — created for Radio City Music Hall and featuring the world-famous Rockettes. The Company is also exploring opportunities for a second, streamlined show featuring the iconic Rockettes at Radio City Music Hall.
Over the past couple of years, the Company has been executing on its plans to build a robust, diversified portfolio of live experiences. In July 2016, the Company acquired a controlling interest in BCE, the entertainment production company that owns and operates the Boston Calling Music Festival. This was followed in January 2017 by the Company’s purchase of a controlling interest in TAO Group, a hospitality group with globally-recognized entertainment dining and nightlife brands.
Our Live Entertainment Bookings
Our Company is an established industry leader that books a wide variety of live entertainment events in our venues, which perennially include some of the biggest names in music and entertainment. Over the last several years, our venues have been a key destination for artists such as the Eagles, U2, Pearl Jam, Foo Fighters, Paul McCartney, Kendrick Lamar, Bruno Mars, Justin Bieber, Dead and Company, Madonna, Mumford & Sons, Phish, Fleetwood Mac, Adele, Eric Clapton, Bruce Springsteen, Rihanna, Justin Timberlake, Katy Perry, Kanye West, Stevie Wonder, Ariana Grande and Dave Chappelle.
Our efforts to find new ways to increase the utilization of our venues led to a unique partnership between our Company and Billy Joel that made the renowned performer a staple of The Garden, playing monthly performances since January 2014. This extraordinary residency has been a great success, with 54 sold-out performances through July 2018, and has cemented Billy Joel’s record for the most performances by any artist at “The World’s Most Famous Arena.” In December 2015, the legendary New Yorker and comedian Jerry Seinfeld began a two-year residency at the Beacon Theatre, with monthly appearances in 2016 and twice monthly appearances in 2017. All 36 performances — which concluded in December 2017 — were sold out.
Our venues also attract family shows and theatrical productions, which this past year included: PAW Patrol Live!, Sesame Street Live!, PJ Masks Live!, and Elf The Musical. In addition, we frequently serve as the backdrop for high-profile special events such as the 60th Annual Grammy Awards, which returned to The Garden for the first time in 15 years in 2018. Other significant events that have been hosted in our venues include the Tony Awards, “America’s Got Talent,” and the MTV Video Music Awards; appearances by luminaries such as His Holiness Pope Francis, His Holiness the Dalai Lama and the Prime Minister of India, Narendra Modi; graduations, television upfronts, product launches and film premieres.
Although we primarily license our venues to third-party promoters for a fee, we also promote or co-promote shows where we have economic risk relating to the event. MSG Entertainment currently does not promote or co-promote events outside of our venues.
Our Productions
One of the Company’s core properties, the Christmas Spectacular, has been performed at Radio City Music Hall for 85 years. The world-famous Rockettes, along with show-stopping performances, festive holiday scenes and state-of-the-art special effects, have played an important role in the critically-acclaimed show’s enduring popularity. This past year the show featured several new technology enhancements, including the ability to project content on all eight of Radio City Music Hall’s proscenium arches. This large-scale projection, along with a backdrop that now includes one of the world’s largest 8K resolution LED screens, visually transformed entire scenes of the production. During the 2017 holiday season, the Christmas Spectacular sold more than one million tickets.
We acquired the rights to the Christmas Spectacular in 1997, and those rights are separate from, and do not depend on the continuation of, our lease of Radio City Music Hall. We also hold rights to the Rockettes brand in the same manner.
The Company believes it has significant and unique assets in both Radio City Music Hall and the Rockettes, and is exploring the creation of a second, streamlined show that leverages not only these brands, but also the technology enhancements we have invested at the venue.
In addition, we continue to strengthen and broaden our Rockettes brand, targeting the most prominent and effective vehicles that elevate their visibility and underscore their reputation as beloved American cultural icons. The Rockettes have appeared or performed at high-profile events, including Presidential Inaugurations, the Macy’s Thanksgiving Day Parade, Macy’s 4th of July Fireworks event, the New Year’s Eve Times Square Ball Drop, the Tony Awards, and television shows (“America’s Got Talent,” “Project Runway,” “The Today Show,” “Live with Kelly and Ryan,” and “The Tonight Show with Jimmy Fallon”), among many others. We continue to pursue opportunities to generate greater brand awareness, including television and public appearances and dance education offerings.
7
Our Entertainment Dining and Nightlife Offerings
The Company owns a controlling interest in TAO Group, which strengthens the Company’s portfolio of live offerings with a complementary, hospitality group with widely-recognized brands that include: TAO, Marquee, Lavo, Avenue, The Stanton Social, Beauty & Essex and Vandal. Since 2000, TAO Group has been creating some of the most innovative premium experiences in the entertainment dining and hospitality industry. Today, TAO Group operates 25 venues – 12 venues in New York City, six venues in Las Vegas, five venues in Los Angeles, one venue in Singapore and one venue in Sydney, Australia — and is actively developing opportunities to expand on their success with new venues. In June 2018, TAO Group announced that it will debut new entertainment dining and nightlife venues as part of Moxy Chelsea hotel in New York City, which is expected to open this Fall, as well as TAO Chicago restaurant and nightclub in September, followed by Marquee Singapore, located in the Marina Bay Sands hotel, in 2019.
A majority of TAO Group’s venues are leased, while the rest are managed. Essentially all of the venues have either long-term leases or long-term management agreements with options to renew for multiple years.
Our Festival Offering
The Company owns a controlling interest in BCE, the entertainment production company known for successfully creating and operating New England’s premier music festival — Boston Calling. The 2018 three-day festival took place over Memorial Day weekend at the Harvard Athletic Complex, and was headlined by Eminem, The Killers and Jack White. Additionally, the festival featured 54 performances from musicians, bands, podcasts and comedians across its three stages and indoor arena, as well as the first-ever Boston Calling Film Festival, curated by Academy Award-winning actress, producer and director Natalie Portman.
Our Performance Venues
The Company operates a mix of iconic performance venues that continue to build on their historic prominence as destinations for unforgettable experiences and events. Individually, these venues are each premier showplaces, with a passionate and loyal following of fans, performers and events. Taken together, we believe they represent an outstanding collection of venues.
We own or operate under long-term leases a total of six venues in New York City, Chicago and Inglewood, CA and have an exclusive booking agreement with respect to the Wang Theatre in Boston. Our New York City venues are the Madison Square Garden Complex (which includes both The Garden and The Hulu Theater at Madison Square Garden), Radio City Music Hall and the Beacon Theatre. Our portfolio of venues also includes the Forum in Inglewood, CA and the landmark The Chicago Theatre.
The Garden
The Garden has been a celebrated center of New York life since it first opened its doors in 1879. Over its 139-year history, there have been four Garden buildings, each known for showcasing the best of the era’s live sports and entertainment offerings. We believe that The Garden has come to epitomize the power and passion of live sports and entertainment to people around the world, with an appearance at The Garden often representing a pinnacle of an athlete’s or performer’s career. Known as “The World’s Most Famous Arena,” The Garden has been the site of some of the most memorable events in sports and entertainment, and, together with The Hulu Theater at Madison Square Garden, has hosted hundreds of events and millions of visitors this past year. In 2009, Billboard Magazine ranked The Garden the number one venue of the decade in its respective class based upon gross ticket sales. Music industry subscribers of the trade magazine Pollstar have voted The Garden “Arena of the Year” 19 out of the last 25 years. The Garden is the highest-grossing entertainment venue of its size in the nation and the second highest in the world based on Billboard Magazine’s 2018 mid-year rankings.
The Garden is home to the Knicks and Rangers and is associated with countless “big events,” inspired performances and one-of-a-kind moments. Highlights include: “The Fight of the Century” between Muhammad Ali and Joe Frazier in 1971; the 1970 Knicks’ NBA Championship; the Rangers’ 1994 Stanley Cup Championship; three Democratic National Conventions and one Republican National Convention; Marilyn Monroe’s famous birthday serenade to President John F. Kennedy; Frank Sinatra’s “Main Event” concert in 1974; the only U.S. concerts from the reunited Cream; the 25th Anniversary Rock and Roll Hall of Fame concerts and Billy Joel’s record-breaking 100 total performances at The Garden (through July 2018). In September 2015, His Holiness Pope Francis celebrated Mass at The Garden as part of his successful U.S. visit, which marked the first time a current pope has visited The Garden since Pope John Paul II in 1979. The Garden has also hosted four prominent benefit concerts, which galvanized the public to respond to national and global crises, including the first of its kind, “The Concert for Bangladesh” in 1972, as well as “The Concert for New York City,” following the events of 9/11; “From the Big Apple to the Big Easy,” held after Hurricane Katrina in 2005; and “12-12-12, The Concert for Sandy Relief” in 2012.
8
The current Madison Square Garden Complex, located between 31st and 33rd Streets and Seventh and Eighth Avenues on Manhattan’s West Side, opened on February 11, 1968 with a salute to the United Service Organizations hosted by Bob Hope and Bing Crosby. From a structural standpoint, the construction of the current Garden was considered an engineering wonder for its time, including its famous circular shape and unique, cable-supported ceiling, which contributes to its intimate feel. It was the first large structure built over an active railroad track. The builder, R.E. McKee, had a national reputation and was later recognized as a “Master Builder” by the construction industry. Architect Charles Luckman had one of the largest firms in the country and designed such buildings as the Prudential Tower in Boston, NASA’s flight center in Houston and the Forum in Inglewood, CA.
Following a three-year, top-to-bottom transformation, in October 2013, the Company debuted a fully-transformed Garden, featuring improved sightlines; additional entertainment and dining options; new concourses; upgraded hospitality areas; new technology; unique historic exhibits; and a completely transformed interior, where the intimacy of the arena bowl and The Garden’s world-famous ceiling were maintained. Focused on the total fan experience, the transformation was designed to benefit everyone in attendance, whether first time visitors, season ticket subscribers, athletes, artists, suite holders or marketing partners. The Garden’s transformation ensured that attending an event at “The World’s Most Famous Arena” remained unlike anywhere else.
We own the Madison Square Garden Complex, the platform on which it is built and development rights (including air rights) above our property. Madison Square Garden sits atop Pennsylvania Station (“Penn Station”), a major commuter hub in Manhattan, which is owned by the National Railroad Passenger Corporation (Amtrak). While the development rights we own would permit us to expand in the future, any such use of development rights would require various approvals from the City of New York. The Garden seats up to approximately 21,000 spectators for sporting and entertainment events and, along with The Hulu Theater at Madison Square Garden, contains approximately 1,100,000 square feet of floor space over 11 levels.
The Hulu Theater at Madison Square Garden
The Hulu Theater at Madison Square Garden, which has approximately 5,600 seats, opened as part of the fourth Madison Square Garden Complex in 1968 with seven nights of performances by Judy Garland. Since then, some of the biggest names in live entertainment have played The Hulu Theater at Madison Square Garden, including The Who, Bob Dylan, Diana Ross, Elton John, James Taylor, Mary J Blige, Pentatonix, Sara Bareilles, Ellie Goulding, Chris Rock, Neil Young, Bill Maher, Radiohead, Jerry Seinfeld and Van Morrison. The Hulu Theater at Madison Square Garden has also hosted boxing events and the NBA Draft; award shows such as The Daytime Emmys; and other special events including “Wheel of Fortune” and audition shows for “America’s Got Talent,” as well as a variety of theatrical productions and family shows, including A Christmas Story, Elf The Musical, Paw Patrol Live!, and Sesame Street Live!. In March 2018, the Company and Hulu, a leading premium streaming service, announced a multi-faceted marketing partnership that included exclusive naming rights to the venue, which has now been rebranded as The Hulu Theater at Madison Square Garden. The Hulu Theater at Madison Square Garden is the fifth highest-grossing entertainment venue of its size in the world, based on Billboard Magazine’s 2018 mid-year rankings.
Radio City Music Hall
Radio City Music Hall has a rich history as a national theatrical and cultural mecca since it was first built by theatrical impresario S.L. “Roxy” Rothafel in 1932. Known as “The Showplace of the Nation,” it was the first building in the Rockefeller Center complex and, at the time, the largest indoor theater in the world. Radio City Music Hall, a venue with approximately 6,000 seats, hosts concerts, family shows and special events, and is home to the Christmas Spectacular. See “— MSG Entertainment — Our Productions.” Entertainers who have graced the Great Stage include: Yes, Lady Gaga, Brian Wilson, Harry Styles, Bastille, John Mulaney, Jack White, Kelly Clarkson, Britney Spears, Tony Bennett, Khalid, Sebastian Maniscalco and Dave Chappelle. In 2009, Billboard Magazine ranked Radio City Music Hall the number one venue of the decade in its respective class based upon gross ticket sales. Radio City Music Hall is the highest-grossing entertainment venue of its size in the world, based on Billboard Magazine’s 2018 mid-year rankings.
In 1978, Radio City Music Hall was designated a New York City landmark by the NYC Landmarks Preservation Commission and a national landmark on the National Register of Historic Places. We acquired the lease in 1997, and in 1999, we invested in a complete restoration that returned the legendary theater to its original grandeur. Our acclaimed restoration touched all aspects of the venue and included burnishing the ceilings of Radio City Music Hall with 720,000 sheets of gold and aluminum leaf, replacing the existing stage curtain with a new 112-foot wide golden silk curtain, and cleaning the three-story tall mural “The Fountain of Youth,” by Ezra Winter, which looms above the grand staircase. State-of-the-art sound systems, lighting and HDTV capabilities were also installed.
We lease Radio City Music Hall, located at Sixth Avenue and 50th Street in Manhattan, pursuant to a long-term lease agreement. The lease on Radio City Music Hall expires in 2023. We have the option to renew the lease for an additional 10 years by providing two years’ notice prior to the initial expiration date.
9
Beacon Theatre
In November 2006, we entered into a long-term lease agreement to operate the legendary Beacon Theatre, a venue with approximately 2,800 seats, which sits on the corner of Broadway and 74th Street in Manhattan. The Beacon Theatre was conceived of by S. L. “Roxy” Rothafel and is considered the “older sister” to Radio City Music Hall. Designed by Chicago architect Walter Ahlschlager, the Beacon Theatre opened in 1929 as a forum for vaudeville acts, musical productions, drama, opera, and movies. The Beacon Theatre was designated a New York City landmark by the NYC Landmarks Preservation Commission in 1979 and a national landmark on the National Register of Historic Places in 1982. Over its history, the Beacon Theatre has been a venerable rock and roll room for some of the greatest names in music including Steely Dan, Coldplay, Mariah Carey, Crosby Stills & Nash, Elton John, John Fogerty, Ray LaMontagne, Tom Petty and the Heartbreakers, Tedeschi Trucks Band, Eddie Vedder and Bob Dylan, as well as The Allman Brothers Band, which played their 238th show at the Beacon Theatre in October 2014, marking their final concert as a band. The venue has also hosted special events such as film premieres for the Tribeca Film Festival and comedy events, including our Jerry Seinfeld residency, along with numerous luminaries such as His Holiness the Dalai Lama in 2009 and 2013, and President Bill Clinton in 2006 when the Rolling Stones played a private concert in honor of his 60th birthday.
In August of 2008 we closed the Beacon Theatre for a seven-month restoration project to return the theater to its original 1929 grandeur. The restoration of the Beacon Theatre focused on all historic, interior public spaces of the building, backstage and back-of-house areas, and was based on extensive historic research, as well as detailed, onsite examination of original, decorative painting techniques that had been covered by decades-old layers of paint. The Beacon Theatre has won several architectural awards recognizing its outstanding restoration. The widely acclaimed, comprehensive restoration was similar to our restoration of Radio City Music Hall, and reflects our commitment to New York City. The Beacon Theatre is the tenth highest-grossing entertainment venue of its size in the world, based on Billboard Magazine’s 2018 mid-year rankings.
Our lease on the Beacon Theatre expires in 2026.
The Forum
In June 2012, we added a West Coast home with the purchase of the Forum in Inglewood, CA, which serves the Greater Los Angeles area. Following an extensive reinvention of the historic venue, on January 15, 2014, the Forum re-opened with the first of six concerts by the legendary Eagles and is once again a thriving destination for both artists and music fans. With both the Forum and The Garden, the Company has an iconic arena in each of the country’s two largest entertainment markets.
The Forum is the only arena-sized venue in the country dedicated to music and entertainment, and offers something exceptional for everyone. Architecturally, the interior of the bowl has been completely modernized and features superior acoustics, along with flexible seating that ranges from 7,000 seats to 17,600 seats. Fans seated on the floor have access to one of the largest general admission floors in the country, with approximately 8,000 square feet of event level hospitality offerings. The Forum also offers exclusive spaces for VIP customers, including the historic Forum Club, and, for artists, delivers a first-class experience that includes nine, star-caliber dressing rooms with high-end amenities. Among the key features that were resurrected in an effort to replicate the original design is the exterior color of the venue, which was returned to the 1960’s “California sunset red,” and is now known as “Forum Red.” Other outdoor features include the addition of a distinct and iconic Forum marquee and a 40,000-square foot terrace that surrounds the perimeter of the building.
The original Forum was designed by renowned architect, Charles Luckman, who also designed The Garden that opened in 1968. The historic West Coast venue, which opened in 1967, has played host to some of the greatest musical performers of all time, including The Rolling Stones, The Jackson 5, Bob Dylan, Led Zeppelin, Madonna, Van Halen, Foo Fighters, Coldplay, Prince and many others. In addition, the Forum was home to the Los Angeles Lakers and Los Angeles Kings until 1999.
Since re-opening in 2014, the Forum has received several architectural awards recognizing its outstanding restoration. The venue’s impressive lineup of entertainers has included: the Eagles, Justin Timberlake, U2, Maroon 5, Drake, Kanye West, Eric Clapton, Guns N’ Roses, Stevie Wonder, Aerosmith, Steely Dan, Fleetwood Mac, Tom Petty and the Heartbreakers, Mumford & Sons, Foo Fighters, The Weeknd, P!nk and Rihanna as well as His Holiness the Dalai Lama. The Forum has also hosted a number of special events such as the MTV Video Music Awards and Nickelodeon’s Kids’ Choice Awards, as well as select sporting events, including Championship Boxing and mixed martial arts. The Forum is the third highest-grossing entertainment venue of its size in the world, based on Billboard Magazine’s 2018 mid-year rankings.
The Chicago Theatre
In October 2007, to provide us with an anchor for content and distribution in a key market in the Midwest, we purchased the legendary Chicago Theatre, a venue with approximately 3,600 seats. The Chicago Theatre, which features its famous six-story-high “C-H-I-C-A-G-O” marquee, was built in 1921 and designed in the French Baroque style by architects Cornelius W. Rapp and George L. Rapp. It is the oldest surviving example of this architectural style in Chicago today, and was designated a Chicago landmark building in 1983 by the Mayor of Chicago and the Chicago City Council.
10
The Chicago Theatre has become a highly attractive destination for concerts, comedy shows and other live events, hosting a wide range of entertainers, including Bob Dylan, Mumford & Sons, David Byrne, Neil Young, Steve Winwood, Jerry Seinfeld, Janet Jackson, The National, Jim Gaffigan, Conan O’Brien, Aziz Ansari and Steely Dan. The venue has also hosted theatrical tours such as A Christmas Story, The Wizard of Oz and Dr. Seuss’ How The Grinch Stole Christmas!. The Chicago Theatre is the seventh highest-grossing entertainment venue of its size in the world, based on Billboard Magazine’s 2018 mid-year rankings.
Wang Theatre
Since August 2008, we have had a booking agreement with respect to the historic Wang Theatre in Boston. Under the booking agreement, we have been utilizing our diverse relationships and experience in event production and entertainment marketing to maximize the quantity and diversity of performances staged at the Wang Theatre. These performances have included theatrical productions and family shows such as the Tony award-winning Annie the Musical, Irving Berlin’s White Christmas the Musical, The Sound of Music, A Christmas Story, and Elf The Musical. The Wang Theatre has also welcomed a variety of concerts, including multi-night runs by Steely Dan, Sting, Neil Young, Chris Rock, Jerry Seinfeld, Steve Martin and The National and performances from Leonard Cohen, Ringo Starr, Wilco, Tegan and Sara, John Legend and The Shins. The Wang Theatre seats approximately 3,600.
Our booking agreement expires in 2019. The expiration of the booking agreement will not have a material negative effect on our business.
MSG Sphere
The Company is moving forward with its plans to create the “venue of the future.” These structures — known as MSG Sphere — will use cutting-edge technologies to create the next-generation of immersive experiences. The Company will build its first MSG Sphere in Las Vegas on land leased from Las Vegas Sands Corp. (“Sands”), which is adjacent to the Venetian/Palazzo/Sands Expo Complex. The Company plans to break ground on the more than 18,000-seat venue during September 2018 with the start of site preparations, with the goal of opening in fiscal 2021.
Key design features of MSG Sphere are expected to include (i) a fully programmable LED exterior and an interior bowl that features the world’s largest and highest resolution LED screen known today, (ii) a multi-layered audio system that will deliver a spectacular acoustical experience, (iii) a custom video system capable of capturing, curating and distributing both today’s and tomorrow’s content, and (iv) an advanced architecture for connectivity that will enable a broader range of content, greater interaction among guests and more immersive entertainment experiences. Sands will provide us with $75 million to help fund the construction costs, including the cost of a pedestrian bridge from MSG Sphere Las Vegas to the Venetian/Palazzo/Sands Expo Complex. Sands will receive priority access to purchase tickets to events at the venue for inclusion in hotel packages or other uses, as well as certain rent-free use of the venue to support its Expo Center business. The ground lease will have no fixed rent; however, if certain return objectives are achieved, Sands will receive 25% of the after-tax cash flow in excess of such objectives. The lease is for a term of 50 years.
In February 2018, we announced the purchase of land in Stratford, London, which we expect will become home to the Company’s second MSG Sphere. Subject to the timely completion of the planning and governmental approval process, our goal is to have our MSG Sphere London debut approximately one year after the Las Vegas venue. We currently expect that MSG Sphere London will be substantially similar to MSG Sphere Las Vegas, including having approximately the same seating capacity.
We continue to explore additional domestic and international markets where next-generation venues can be successful. The design of MSG Sphere will be flexible to accommodate a wide range of sizes and capacities — from large-scale to smaller and more intimate — based on the needs of any individual market. As we explore selectively extending the MSG Sphere network, we will be open to multiple types of transaction structures, including owned, operated, and joint ventures.
See “Part II — Item 7. Management’s Discussion and Analysis of Financial Condition and Results of Operations — Liquidity and Capital Resources — MSG Spheres.”
11
Our Interactive Initiatives
The Company has a digital presence that includes web sites, social networking sites and mobile applications for our sports and entertainment properties. In 2017, the Company consolidated a collection of individual web sites dedicated to our venues into a new platform, MSG.com, designed to deliver greater value to our customers by providing one place where they can explore upcoming events in all our venues, learn more about our brands, and purchase tickets. Web sites dedicated to our teams (nhl.com/rangers, nba.com/knicks, liberty.wnba.com, westchester.gleague.nba.com, hartfordwolfpack.com, clg.gg, knicksgaming.nba.com) remain separate from MSG.com, as do the web sites for TAO Group (taogroup.com) and Boston Calling (bostoncalling.com). Like our MSG Sports business, the online operations relating to our teams may, in certain circumstances, be subject to certain agreements, rules, policies, regulations and directives of the leagues in which the respective team operates. See “— Our Business — Regulation.” In addition to driving ticket sales to our events, this interactive business generates revenue for the Company’s segments via the sale of advertising and sponsorships on these digital properties. Additionally, it offers strategic marketing assets that create opportunities to market directly to our fans and cross-promote our businesses.
Other Investments
We continue to explore additional opportunities that strengthen our existing position within the sports and entertainment landscape and/or allow us to exploit our assets and core competencies for growth.
In August 2013, the Company, in a partnership with the owners of Brooklyn Bowl, invested in building a venue in Las Vegas. See “Part II — Item 7. Management’s Discussion and Analysis of Financial Condition and Results of Operations — Investments in Nonconsolidated Affiliates” for further discussion.
In September 2013, the Company acquired a 50% interest in AMSGE. The AMSGE entity owns and operates businesses in the entertainment industry and is currently focused on music management, performance rights, strategic marketing and venue management consulting services. This strategic partnership brings together the expertise and capabilities of each partner with the goal of jointly entering into attractive new businesses that generate revenue and cash flow. AMSGE currently has a controlling interest in both Full Stop Management LLC., its core music management business, and Global Music Rights, a performance rights company. In addition, AMSGE has a non-controlling interest in Oak View Group, Digital Brand Architects, Burns Entertainment and On Board Experiential Marketing. AMSGE will remain focused on capitalizing on investment opportunities within its existing businesses as well as on others in its pipeline, with the goal of accelerating its revenue growth.
In March 2014, the Company acquired a 50% interest in Tribeca Enterprises, the company that owns and operates the acclaimed Tribeca Film Festival, bringing together two of New York’s most important cultural and entertainment icons to enhance the reach and impact of both brands. Now in its 17th year, the annual Film Festival celebrates storytelling in a variety of forms – from film to television to virtual reality, music and gaming. The Festival supports emerging and established voices, discovers award-winning filmmakers, curates innovative and interactive experiences, and introduces new technology and ideas through panels, premieres, exhibitions, and live performance. Tribeca Enterprises’ businesses also include Tribeca Studios, a branded entertainment content business that has produced award-winning stories, and year-round live events. This joint venture augments our portfolio of premier New York City live entertainment brands, while also providing us with a high-profile entry into the festival business, with a team that has created one of the most successful festivals in the world.
In July 2014, MSG Networks completed the sale of Fuse to SiTV Media, Inc., which has since been renamed Fuse Media, Inc., the parent company of NUVOtv. NUVOtv is an English language entertainment network created for modern Latinos. As part of the transaction, MSG Networks received a 15% equity interest in SiTV Media, LLC, which has since been renamed Fuse Media, LLC (“Fuse Media”), and such equity interest was transferred to the Company in connection with the Distribution. See “Part II — Item 7. Management’s Discussion and Analysis of Financial Condition and Results of Operations — Investments in Nonconsolidated Affiliates” for further discussion.
In August 2016, the Company acquired an approximately 12% common equity stake in Townsquare Media, Inc., a leading media, entertainment and digital marketing solutions company that, like us, believes in the value of creating communities around shared experiences and compelling content.
In addition to the investments discussed above, the Company also has other investments in various sports and entertainment companies and related technologies, accounted for either under the cost method or equity method.
12
Garden of Dreams Foundation
Our Company has a close association with The Garden of Dreams Foundation (the “Foundation”), a 501(c)(3) non-profit charity that is dedicated to making dreams come true for children facing obstacles. The Foundation works with 28 partner organizations throughout the tristate area, including hospitals, wish organizations and community-based organizations, to reach children who are facing challenges such as homelessness, extreme poverty, illness and foster care. Since it began in 2006, Garden of Dreams has used the magic of The Madison Square Garden Company — including the Rangers, Knicks, Liberty, Rockettes and famed showplaces — to brighten the lives of nearly 375,000 children and their families. The Foundation takes pride in its commitment to truly change lives, hosting more than 500 events and programs each year. They include: events with the Knicks, Rangers and Liberty; special celebrations and event attendance at The Garden, Radio City Music Hall and the Beacon Theatre; visits by Madison Square Garden celebrities; The Garden of Dreams Talent Show, where children perform on the Great Stage at Radio City Music Hall; The Garden of Dreams Prom, which brings together teens who may not otherwise have the opportunity to attend their own proms; toy drives; and the “Make A Dream Come True Program,” where children enjoy unforgettable experiences with celebrities and at events. In addition, through its Garden of Dreams Giving program, the Foundation helps its partner organizations meet the critical needs of the children they serve through direct support of scholarships and tangible, targeted community projects. To date, the Foundation has awarded scholarships to 60 children. Garden of Dreams has also served its partners by refurbishing pediatric wards at area hospitals, activity rooms and gymnasiums at community facilities and by creating brand new spaces such as music and dance studios — with plans for many more vital civic enhancements in the years to come.
Regulation
Our sports and entertainment businesses are subject to legislation governing the sale and resale of tickets and consumer protection statutes generally.
In addition, our venues, like all public spaces, are subject to building and health codes and fire regulations imposed by the state and local governments in the jurisdictions in which they are located. Our venues are also subject to zoning and outdoor advertising regulations, and, with respect to Radio City Music Hall and the Beacon Theatre, landmark regulations which restrict us from making certain modifications to our facilities as of right or from operating certain types of businesses. Our venues also require a number of licenses in order for us to operate, including occupancy permits, exhibition licenses, food and beverage permits, liquor licenses and other authorizations and, with respect to The Garden, a zoning special permit granted by the New York City Planning Commission. In the jurisdictions in which our venues are located, we are subject to statutes that generally provide that serving alcohol to a visibly intoxicated or minor patron is a violation of the law and may provide for strict liability for certain damages arising out of such violations. In addition, our venues are subject to the federal Americans with Disabilities Act, which requires us to maintain certain accessibility features at each of our facilities. We and our venues are also subject to environmental laws and regulations. See “Item 1A. Risk Factors — General Risks — We Are Subject to Extensive Governmental Regulation and Our Failure to Comply with These Regulations May Have a Material Negative Effect on Our Business and Results of Operations.” The professional sports leagues in which we operate, primarily the NBA and NHL, have the right under certain circumstances to regulate important aspects of our sports business and our team-related online and mobile businesses. See “— Our Business — MSG Sports — The Role of the Leagues in Our Operations.”
Our sports and entertainment businesses are also subject to certain regulations applicable to our Internet web sites and mobile applications. We maintain various web sites and mobile applications that provide information and content regarding our businesses, offer merchandise and tickets for sale, make available sweepstakes and/or contests and offer hospitality services. The operation of these web sites and applications may be subject to a range of federal, state and local laws such as privacy and protection of personal information, accessibility for persons with disabilities and consumer protection regulations. In addition, to the extent any of our web sites collect information from children under 13 years of age or are intended primarily for children under 13 years of age, we must comply with certain limits on commercial matter.
Our businesses are also subject to regulation regarding working conditions and minimum wage requirements. See “Item 1A. Risk Factors — Risks Relating to Our Entertainment Business — Increases in Labor Costs Could Slow the Growth of or Harm TAO Group.”
Our international operations are subject to laws and regulations of the countries in which they operate, as well as international bodies, such as the European Union. We are subject to laws and regulations relating to, among other things, foreign privacy and data protection, currency and repatriation of funds, anti-bribery, anti-money laundering and anti-corruption, such as the Foreign Corrupt Practices Act and the U.K. Bribery Act. These laws and regulations apply to the activities of the Company and, in some cases, to individual directors, officers, and employees of the Company and agents acting on our behalf. Certain of these laws impose stringent requirements on how we can conduct our foreign operations and place restrictions on our business and partnering activities.
13
Competition
Competition in Our Sports Business
Our sports business operates in a market in which numerous sports and entertainment opportunities are available. In addition to the NBA, NHL, WNBA, AHL and NBAGL teams that we own and operate, the New York City metropolitan area is home to two Major League Baseball teams (the New York Yankees (the “Yankees”) and the New York Mets (the “Mets”)), two National Football League teams (the New York Giants (the “Giants”) and the New York Jets (the “Jets”)), two additional NHL teams (the New York Islanders (the “Islanders”) and the New Jersey Devils (the “Devils”)), a second NBA team (the Brooklyn Nets (the “Nets”) and two Major League Soccer franchises (the New York Red Bulls and the New York City Football Club). In addition, there are a number of other amateur and professional teams that compete in other sports, including at the collegiate and minor league levels. New York is also home to the U.S. Open tennis event each summer, as well as many other non-sports related entertainment options.
As a result of the large number of options available, we face strong competition for the New York area sports fan. We must compete with these other sporting events in varying respects and degrees, including on the basis of the quality of the teams we field, their success in the leagues in which they compete, our ability to provide an entertaining environment at our games and the prices we charge for our tickets. In addition, for fans who prefer the unique experience of NHL hockey, we must compete with the Islanders and Devils as well as, in varying respects and degrees, with other NHL hockey teams and the NHL itself. Similarly, for those fans attracted to the equally unique experience of NBA basketball, we must compete with the Nets as well as, in varying respects and degrees, with other NBA teams and the NBA itself. In addition, we also compete to varying degrees with other productions and live entertainment events for advertising and sponsorship dollars.
The amount of revenue we earn is influenced by many factors, including the popularity and on-court or on-ice performance of our sports teams and general economic conditions. In particular, when our sports teams have strong on-court and on-ice performance, we benefit from increased demand for tickets, potentially greater food and merchandise sales from increased attendance and increased sponsorship opportunities. When our sports teams qualify for the playoffs, we also benefit from the attendance and in-game spending at the playoff games. The year-to-year impact of team performance is somewhat moderated by the fact that a significant portion of our revenue derives from rights fees, suite rental fees and sponsorship and signage revenue, all of which are generally contracted on a multi-year basis. Nevertheless, the long-term performance of our business is tied to the success and popularity of our sports teams and our ability to attract other compelling sports content.
In July 2017, we acquired a controlling interest in CLG, a premier North American esports organization. Due to the nature of esports, CLG competes with other teams across North America and globally. CLG competes for sponsorship, merchandise rights, media rights, and event prize winnings. Esports teams vary in their amount of funding, size of existing business, and amount of social following, among other factors, which can impact our ability to compete effectively.
See “Item 1A. Risk Factors — Risks Relating to Our Sports Business — Our Sports Business Faces Intense and Wide-Ranging Competition, Which May Have a Material Negative Effect on Our Business and Results of Operations” and “— Our Businesses Are Substantially Dependent on the Continued Popularity and/or Competitive Success of the Knicks and Rangers, Which Cannot Be Assured.”
Competition in Our Entertainment Business
Our entertainment business competes, in certain respects and to varying degrees, with other live performances, sporting events, movies, home entertainment (including the Internet and online services, television, video and gaming devices), restaurants and nightlife venues, and the large number of other entertainment and public attraction options available to members of the public. Our businesses typically represent alternative uses for the public’s entertainment dollars. The primary geographic area in which we operate, New York City, is among the most competitive entertainment markets in the world, with the world’s largest live theater industry and extensive performing arts venues, 12 major professional sports teams, thousands of restaurants and nightlife venues, numerous museums, galleries and other attractions, and numerous movie theaters available to the public. We also have significant operations in Los Angeles and Las Vegas. Our venues and live offerings outside of New York City similarly compete with other entertainment, dining and nightlife options in their respective markets and elsewhere. We compete with these other entertainment options on the basis of the quality of our productions, the public’s interest in our content, the price of our tickets, the quality, location and atmosphere, including the nature and condition of the setting, of our venues, our service, the price, quality and presentation of our food and the overall experience we provide.
We compete for bookings with a large number of other venues both in the cities in which our venues are located and in alternative locations capable of booking the same productions and events. Generally, we compete for bookings on the basis of the size, quality, expense and nature of the venue required for the booking. Some of our competitors may have a larger network of venues and/or greater financial resources.
14
In addition to competition for ticket sales and bookings, we also compete to varying degrees with other productions and sporting events for advertising and sponsorship dollars.
See “Item 1A. Risk Factors — Risks Relating to Our Entertainment Business — Our Entertainment Business Faces Intense and Wide-Ranging Competition Which May Have a Material Negative Effect on Our Business and Results of Operations,” “— The Success of Our Entertainment Business Depends on the Continued Popularity of Our Live Productions, Particularly the Christmas Spectacular, the Decline of Which Could Have a Material Negative Effect on Our Business and Results of Operations” and “ — Negative Publicity with Respect to Any of the Existing or Future TAO Group Brands Could Reduce Sales at One or More of the Existing or Future TAO Group Venues and Make the TAO Group Brands Less Valuable, Which Could Have a Material Negative Effect on Our Business and Results of Operations.”
Employees
As of June 30, 2018 we had approximately 2,900 full-time union and non-union employees and 8,800 part-time union and non-union employees. Approximately 58% of our employees were represented by unions as of June 30, 2018. Approximately 24% of such union employees are subject to CBAs that expired as of June 30, 2018 and approximately 16% are subject to CBAs that will expire by June 30, 2019 if they are not extended prior thereto. Labor relations in general and in the sports and entertainment industry in particular can be volatile, though our current relationships with our unions taken as a whole are positive. We have from time to time faced labor action or had to make contingency plans because of threatened or potential labor actions.
The NHL players and the NBA players are covered by CBAs between the NHL Players’ Association (“NHLPA”) and the NHL and between the National Basketball Players Association (“NBPA”) and the NBA, respectively. Both the NHL and the NBA have experienced labor difficulties in the past and may have labor issues in the future. On June 30, 2011 the prior CBA between the NBA and NBPA expired and there was a work stoppage for approximately five months until a new CBA was entered into in December 2011. On September 15, 2012 the prior CBA between the NHL and NHLPA expired and there was a work stoppage for approximately four months until a new CBA was entered into in January 2013. See “Item 1A. Risk Factors — General Risks — Organized Labor Matters May Have a Material Negative Effect on Our Business and Results of Operations.”
Financial Information about Segments and Geographic Areas
Substantially all of the Company’s revenues and assets are attributed to or located in the United States and are primarily concentrated in the New York City metropolitan area. Financial information by business segments for each of the years ended June 30, 2018, 2017, and 2016 is set forth in “Part II — Item 7. Management’s Discussion and Analysis of Financial Condition and Results of Operations” and “Part II — Item 8. Financial Statements and Supplementary Data — Consolidated Financial Statements — Notes to Consolidated Financial Statements — Note 18. Segment Information.”
15
Item 1A. Risk Factors
Risks Relating to Our Sports Business
Our Sports Business Faces Intense and Wide-Ranging Competition, Which May Have a Material Negative Effect on Our Business and Results of Operations.
The success of a sports business, like ours, is dependent upon the performance and/or popularity of its franchises. Our Knicks and Rangers and other sports franchises compete, in varying respects and degrees, with other live sporting events, and with sporting events delivered over television networks, radio, the Internet and online services, mobile applications and other alternative sources. For example, our sports teams compete for attendance, viewership and advertising with a wide range of alternatives available in the New York City metropolitan area. During some or all of the basketball and hockey seasons, our sports teams face competition, in varying respects and degrees, from professional baseball (including the Yankees and the Mets), professional football (including the Giants and the Jets), professional soccer (including the New York Red Bulls and the New York City Football Club) and each other. For fans who prefer the unique experience of NHL hockey, we must compete with two other NHL hockey teams located in the New York City metropolitan area (the Islanders and the Devils) as well as, in varying respects and degrees, with other NHL hockey teams and the NHL itself. Similarly, for those fans attracted to the equally unique experience of NBA basketball, we must compete with another NBA team located in the New York City metropolitan area (the Nets) as well as, in varying respects and degrees, with other NBA teams and the NBA itself.
As a result of the large number of options available, we face strong competition for the New York area sports fan. We must compete with these other sports teams and sporting events, in varying respects and degrees, including on the basis of the quality of the teams we field, their success in the leagues in which they compete, our ability to provide an entertaining environment at our games, prices we charge for tickets and the viewing availability of our teams on multiple media alternatives. Given the nature of sports, there can be no assurance that we will be able to compete effectively, including with companies that may have greater resources than we have, and as a consequence, our business and results of operations may be materially negatively affected.
Our Businesses Are Substantially Dependent on the Continued Popularity and/or Competitive Success of the Knicks and Rangers, Which Cannot Be Assured.
Our financial results have historically been dependent on, and are expected to continue to depend in large part on, the Knicks and Rangers remaining popular with our fan bases and, in varying degrees, on the teams achieving on-court and on-ice success, which can generate fan enthusiasm, resulting in sustained ticket, premium seating, suite, concession and merchandise sales during the season. In addition, the popularity of our sports teams can impact television ratings, which could affect the long-term value of the media rights for the Knicks and/or Rangers. Furthermore, success in the regular season may qualify one of our sports teams for participation in post-season playoffs, which provides us with additional revenue by increasing the number of games played by our sports teams and, more importantly, by generating increased excitement and interest in our sports teams, which can improve attendance and television ratings in subsequent seasons. There can be no assurance that any of our sports teams, including the Knicks and Rangers, will maintain continued popularity or compete in post-season play in the future.
Our Basketball and Hockey Decisions, Especially Those Concerning Player Selection and Salaries, May Have a Material Negative Effect on Our Business and Results of Operations.
Creating and maintaining our sports teams’ popularity and/or on-court and on-ice competitiveness is key to the success of our sports business. Accordingly, efforts to improve our revenues and earnings from operations from period to period may be secondary to actions that management believes will generate long-term value. As with other sports teams, the competitive positions of our sports teams depend primarily on our ability to develop, obtain and retain talented players, coaches and team executives, for which we compete with other professional sports teams. Our efforts in this regard may include, among other things, trading for highly compensated players, signing draft picks, free agents or current players to new contracts, engaging in salary arbitration with existing players, terminating and waiving players and replacing team executives. Any of these actions could increase expenses for a particular period, subject to any salary cap restrictions contained in the respective leagues’ CBAs. There can be no assurance that any actions taken by management to increase our long-term value will be successful.
16
A significant factor in our ability to attract and retain talented players is player compensation. NBA and NHL player salaries have generally increased significantly and may continue to increase. Although CBAs between the NBA and the NBPA and the NHL and the NHLPA generally cap league-wide player salaries at a prescribed percentage of league-wide revenues, we may pay our players different aggregate salaries and a different proportion of our revenues than other NBA or NHL franchises. Future CBAs may increase the percentage of league-wide revenues to which NBA or NHL players are entitled or impose other conditions, which may further increase our costs. In addition, we may also be obligated to pay the NBA a luxury tax each year, the calculation of which is determined by a formula based on the aggregate salaries paid to our NBA players. See “Part II — Item 7. Management’s Discussion and Analysis of Financial Condition and Results of Operations — MSG Sports — Expenses — Player Salaries, Escrow System/Revenue Sharing and NBA Luxury Tax.”
We have incurred, and may in the future incur, significant charges for costs associated with transactions relating to players on our sports teams for season-ending and career-ending injuries and for trades, waivers and contract terminations of players and other team personnel, including team executives. These transactions can result in significant charges as the Company recognizes the estimated ultimate costs of these events in the period in which they occur, although amounts due to these individuals are generally paid over their remaining contract terms. These expenses add to the volatility of the results of our MSG Sports segment.
The Actions of the Basketball and Hockey Leagues May Have a Material Negative Effect on Our Business and Results of Operations.
The governing bodies of the NBA (including the WNBA and the NBAGL) and the NHL have certain rights under certain circumstances to take actions that they deem to be in the best interests of their respective leagues, which may not necessarily be consistent with maximizing our results of operations and which could affect our sports teams in ways that are different than the impact on other sports teams. Certain of these decisions by the NBA or the NHL could have a material negative effect on our business and results of operations. From time to time, we may disagree with or challenge actions the leagues take or the power and authority they assert. The following discussion highlights certain areas in which decisions of the NBA and the NHL could materially affect our businesses.
The NBA and the NHL may assert control over certain matters, under certain circumstances, that may affect our revenues such as the national and international rights to telecast the games of league members, including the Knicks and Rangers, licensing of the rights to produce and sell merchandise bearing the logos and/or other intellectual property of our sports teams and the leagues, and the Internet-based activities of our sports teams. The NBA and NHL have each entered into agreements regarding the national and international telecasts of NBA and NHL games. We receive a share of the income the NBA and the NHL generate from these contracts, which expire from time to time. There can be no assurance that the NBA or the NHL will be able to renew these contracts following their expiration on terms as favorable to us as those in the current agreements or that we will continue to receive the same level of revenues in the future. We receive significant revenues from MSG Networks for the right to telecast games of the Knicks and Rangers. Changes to league rules, regulations and/or agreements, including national and international media rights, could impact the availability of games covered by our local media rights and could negatively affect the rights fees we receive from MSG Networks and our business and results of operations. The sports leagues have asserted control over certain other important decisions, under certain circumstances, such as the length and format of the playing season, preseason and playoff schedules, the operating territories of the member teams, admission of new members, franchise relocations, labor relations with the players associations, collective bargaining, free agency, luxury taxes and revenue sharing. The esports leagues have adopted a number of rules and regulations governing the length and format of the playing season, how teams may generate revenue, and player rosters. Decisions on these matters, some of which are also subject to the terms of a CBA, may materially negatively affect our business and results of operations. In addition, the NBA imposes a luxury tax and escrow system with respect to player salaries and a revenue sharing plan, and the NHL imposes an escrow system with respect to player salaries and a revenue sharing plan. For fiscal year 2018, the Knicks and Rangers recorded approximately $57.7 million in estimated revenue sharing expenses, net of escrow receipts. The actual amounts for the 2017-18 season may vary significantly from the estimate based on actual operating results for the respective leagues and all teams for the season and other factors. For a discussion of the NBA luxury tax impacts, see “— Our Basketball and Hockey Decisions, Especially Those Concerning Player Selection and Salaries, May Have a Material Negative Effect on Our Business and Results of Operations.”
The NBA and the NHL have imposed certain restrictions on the ability of owners to undertake some types of transactions in respect of teams, including a change in ownership and a relocation of a team. The NBA and NHL have also imposed restrictions on certain types and/or amounts of financing transactions. In certain instances, these restrictions could impair our ability to proceed with a transaction that is in the best interest of the Company and its stockholders if we were unable to obtain any required league approvals in a timely manner or at all.
17
The leagues impose certain rules that define, under certain circumstances, the territories in which we operate, including the markets in which our games can be telecast. Changes to these rules could have a material negative effect on our business and results of operations.
Each league’s governing body has imposed a number of rules, regulations, guidelines, bulletins, directives, policies and agreements upon its teams. Changes to these provisions may apply to our teams and their personnel, and the Company as a whole, regardless of whether we agree or disagree with such changes, have voted against such changes or have challenged them through other means, and it is possible that any such changes could materially negatively affect our business and results of operations to the extent they are ultimately determined to bind our teams. The commissioners of each of the NBA and NHL assert significant authority to take certain actions on behalf of their respective leagues under certain circumstances. Decisions by the commissioners of the NBA and the NHL, including on the matters described above, may materially negatively affect our businesses and results of operations. The leagues’ governing documents and our agreements with the leagues purport to limit the manner in which we may challenge decisions and actions by a league commissioner or the league itself.
Injuries to Players on Our Sports Teams Could Hinder Our Success.
To the degree that our financial results are dependent on our sports teams’ popularity and/or on-court and on-ice success, the likelihood of achieving such popularity or competitive success may, given the nature of sports, be substantially impacted by serious and/or untimely injuries to key players. Nearly all of our Knicks and Rangers players, including those with multi-year contracts, have partially or fully guaranteed contracts, meaning that in some cases (subject to the terms of the applicable player contract and CBA), a player or his estate may be entitled to receive his salary even if the player dies, or is unable to play as a result of injury. These salaries represent significant financial commitments for our sports teams. We are generally insured against having to pay salaries in the event of a player’s death and seek to obtain disability insurance policies for substantially all of our material player contracts. In the event of injuries sustained resulting in lost services (as defined in the applicable insurance policies), generally the insurance policies provide for payment to us of a portion of the player’s salary for the remaining term of the contract or until the player can resume play, in each case following a deductible number of missed games. Such insurance may not be available in every circumstance or on terms that are commercially feasible or such insurance may contain significant dollar limits and/or exclusions from coverage for preexisting medical conditions. We may choose not to obtain (or may not be able to obtain) such insurance in some cases and we may change coverage levels (or be unable to change coverage levels) in the future.
In the absence of disability insurance, we may be obligated to pay all of an injured player’s salary. In addition, player disability insurance policies do not cover any NBA luxury tax that we may be required to pay under the NBA CBA. For purposes of determining NBA luxury tax under the NBA CBA, salary payable to an injured player is included in team salary, unless and until that player’s salary is removed from the team salary for purposes of calculating NBA luxury tax which, pursuant to the terms of the NBA CBA, requires a waiting period of one year and satisfaction of other conditions. Replacement of an injured player may result in an increase in salary and NBA luxury tax expense for us.
Risks Relating to Our Entertainment Business
Our Entertainment Business Faces Intense and Wide-Ranging Competition Which May Have a Material Negative Effect on Our Business and Results of Operations.
Our entertainment business competes, in certain respects and to varying degrees, with other leisure-time activities such as television, radio, motion pictures, sporting events, other live performances, restaurants and nightlife venues, the Internet, and online and mobile services, including sites for online content distribution, video on demand and other alternative sources of entertainment and information, in addition to competing for concerts with other event venues, and other restaurants and nightlife venues, for total entertainment dollars in our marketplace. The success of our entertainment business is largely dependent on the continued success of our Christmas Spectacular and the TAO Group business, and the availability of, and our venues’ ability to attract, concerts, family shows and other events, competition for which is intense, and the ability of acts to attract strong attendance at our venues. For example, The Garden, The Hulu Theater at Madison Square Garden, Radio City Music Hall and the Beacon Theatre all compete with other entertainment options in the New York City metropolitan area. The Forum, The Chicago Theatre and the Wang Theatre face similar competition from other entertainment options in their respective markets and elsewhere. A proposed new stadium in Inglewood, CA, is reportedly scheduled to open in 2020. In addition, there are plans to open an indoor arena as part of the same complex in Inglewood. Either of these venues could materially adversely affect the performance of the Forum. The restaurant, nightlife and hospitality industries are intensely competitive with respect to, among other things, service, price, food quality and presentation, location, atmosphere, overall experience, and the nature and condition of the setting. Competitors of TAO Group business include a large and diverse group of well-recognized upscale restaurants and nightlife venues and brands. Some of our competitors may have a larger network of venues and/or greater financial resources.
18
Further, in order to maintain the competitive positions of The Garden and our other venues, we must invest on a continuous basis in state-of-the-art technology. In addition, we must maintain a competitive pricing structure for events that may be held in our venues, many of which have alternative venue options available to them in New York and other cities. In addition, we invest a substantial amount in our Christmas Spectacular and in new productions to continue to attract audiences. We cannot assure you that such investments will generate revenues that are sufficient to justify our investment or even that exceed our expenses.
The Success of Our Entertainment Business Depends on the Continued Popularity of Our Live Productions, Particularly the Christmas Spectacular, the Decline of Which Could Have a Material Negative Effect on Our Business and Results of Operations.
The financial results of our entertainment business are dependent on the popularity of our live productions, particularly the Christmas Spectacular, which represented 15% of our MSG Entertainment segment’s revenues in fiscal year 2018. Should the popularity of the Christmas Spectacular decline, our revenues from ticket sales, and concession and merchandise sales would likely also decline, and we might not be able to replace the lost revenue with revenues from other sources.
We Plan to Build and Operate Entertainment Venues in Las Vegas and London and are Exploring Other Potential Sites. These State-of-the-Art Venues Will Use Cutting-Edge Technologies and Will Require Significant Capital Investment by the Company. There Can Be No Assurance That The Company’s Sphere Projects Will Be Successful.
The Company is moving forward with its venue strategy to create, build and operate new music and entertainment-focused venues — called MSG Sphere - that will utilize cutting-edge technologies to create the next generation of immersive experiences. There is no assurance that the MSG Sphere in Las Vegas or London will be successful. We are building the first MSG Sphere in Las Vegas with the goal of opening in fiscal year 2021. Subject to the timely completion of the planning and governmental approval process, our goal is to have our London venue debut approximately one year after the Las Vegas venue. Our primary focus now is to build the Las Vega and London MSG Spheres, but we also continue to explore additional domestic and international markets where these next-generation venues can be successful. While both the Las Vegas and London venues would have a scalable capacity of more than 18,000 seats, moving forward, our goal is to develop a venue model that will accommodate a wide range of sizes and seating capacities — from large-scale to more intimate — based on the needs of any individual market.
Given the transformative nature of these venues, we expect that construction of these venues will require greater capital spend than would be required for a traditional arena-sized venue. As is the case with any large-scale real estate development, as the Company moves forward with the planning and construction of these and other major new venues, the Company may face unexpected project delays and costs. In light of the ambitious and unique design of MSG Sphere, including the use of technologies that have not previously been employed in major entertainment venues, the risk of delays and higher than anticipated costs are elevated. In connection with the construction of the MSG Sphere venues, the Company will need to obtain additional capital beyond what is available from cash on hand, cash flows from operations and borrowings under our revolving credit facilities. There is no assurance that we will be able to obtain such capital. The NBA and NHL have imposed restrictions on certain types and/or amounts of financing transactions. See also “ — The Actions of the Basketball and Hockey Leagues May Have a Material Negative Effect on Our Business and Results of Operations.”
While the Company believes that these next-generation venues will enable new experiences and innovative opportunities to engage with audiences, there can be no assurance that customers, artists, promoters, advertisers and marketing partners will embrace this new platform.
Our Entertainment Business is Highly Sensitive to Customer Tastes and Depends on Our Ability to Attract Artists and Events.
The success of our entertainment business depends in part upon our ability to offer live entertainment that is popular with customers. We contract with promoters and others to provide performers and events at our venues. There may be a limited number of popular artists, groups or events that can attract audiences to our venues, and our entertainment segment would suffer to the extent that we are unable to continue to attract such artists, groups and events to perform at our venues.
19
TAO Group Plans to Add a Significant Number of New Venues. This Will Require Additional Capital and There Can Be No Guarantee of Success.
TAO Group has an aggressive plan to add new venues. In pursuing its expansion strategy, TAO Group faces a number of risks associated with cost overruns and construction delays, obtaining financing and operating in new or existing markets. In addition, TAO Group faces the risk that new venues may not be successful and that TAO Group may lose all or a part of its investment in existing and new venues, which could have a material negative effect on our business and results of operations.
Our Strategy for Our Entertainment Business Includes the Development of New Live Productions and the Possible Addition of New Venues, Each of Which Could Require Us to Make Considerable Investments for Which There Can Be No Guarantee of Success.
As part of our business strategy, we intend to develop new productions, attractions and live entertainment events, which may include expansions or enhancements of our existing productions or relationships or the creation of entirely new live productions. Expansion or enhancement of productions and/or the development of new productions, attractions and live entertainment events could require significant upfront investment in sets, staging, creative processes, licensing of intellectual property, casting and advertising and dislocation of other alternative sources of entertainment that may have played in our venues absent these productions. To the extent that any efforts at expanding or enhancing productions or creating new productions do not result in a viable live show, or to the extent that any such productions do not achieve expected levels of popularity among audiences, we may be subject to a write-down of all or a portion of such investments. In addition, any delay in launching such productions or enhancements could result in the incurrence of operating costs which may not be recouped. In March 2016, we wrote off approximately $41.8 million of deferred production costs of the New York Spectacular Starring the Radio City Rockettes (“New York Spectacular”). Subsequently, due to assessments of the show’s creative direction, timing and scale, the Company wrote off the remaining balance of deferred production costs related to the New York Spectacular in the amount of $33.6 million during the fourth quarter of fiscal year 2017.
A Lack of Availability of Suitable Locations for New TAO Group Venues or a Decline in the Quality of the Locations of Current TAO Group Venues May Have a Material Negative Effect on Our Business and Results of Operations.
The success of the existing TAO Group venues depends in large part on their locations. Possible declines in neighborhoods where TAO Group venues are located or adverse economic conditions in areas surrounding those neighborhoods could result in reduced sales in those venues. Further, TAO Group’s growth strategy is based, in part, on the expansion of TAO Group venues into new geographic markets where its business has not previously operated. Desirable locations for new openings or for the relocation of existing venues may not be available at an acceptable cost when TAO Group identifies a particular opportunity for a new venue or relocation. In addition, the success of new TAO Group venues tends to expand or revive interest in TAO Group venues that have been in operation for an extended period of time. Thus, the inability to successfully open new TAO Group venues could also negatively impact the existing TAO Group business. The occurrence of one or more of these events could have a material negative effect on our business and results of operations.
The Success of TAO Group Depends in Part Upon the Continued Retention of Certain Key Personnel.
The success of TAO Group depends, in part, on certain key members of its management, including its four original founders. The expertise of TAO Group’s senior management team in developing, acquiring, reinventing, integrating and growing businesses, particularly those focused on entertainment and hospitality, has been and will continue to be a significant factor in the growth of TAO Group’s business and the ability of TAO Group to execute its business strategy. The loss of such key personnel could have a material negative effect on our business and results of operations.
The Geographic Concentration of Our Businesses Could Subject Us to Greater Risk Than Our Competitors and Have a Material Negative Effect on Our Business and Results of Operations.
The Company primarily operates in three markets — New York City, Las Vegas and Los Angeles — and, as a result, is subject to greater degrees of risk than competitors with more operating properties or that operate in more markets. The Garden, The Hulu Theater at Madison Square Garden, Radio City Music Hall and the Beacon Theatre are all located in New York City, our sports teams are all based in the New York City metropolitan area, and TAO Group currently operates 12 venues in New York City, including the food and beverage operations at the Dream Downtown and Dream Midtown hotels. In addition, TAO Group currently operates six venues in Las Vegas, where the Company plans to construct its first MSG Sphere. The Forum is located in Inglewood, California, which is adjacent to Los Angeles, where TAO Group currently operates five venues. Therefore, the Company is particularly vulnerable to adverse events (including acts of terrorism, natural disasters, weather conditions, labor market disruptions and government actions) and economic conditions in New York City, Las Vegas, Los Angeles and surrounding areas. Any adverse event or conditions in those markets could have a material negative effect on our business and results of operations.
20
Negative Publicity with Respect to Any of the Existing or Future TAO Group Brands Could Reduce Sales at One or More of the Existing or Future TAO Group Venues and Make the TAO Group Brands Less Valuable, Which Could Have a Material Negative Effect on Our Business and Results of Operations.
The success of TAO Group depends upon the reputation and popularity of the TAO Group venues and brands. If customers have a poor experience at a restaurant or nightlife venue owned, operated or managed by TAO Group, the TAO Group venues may experience a decrease in customer traffic. Negative publicity with respect to any of the TAO Group brands could adversely affect TAO Group. Such publicity could relate to food quality, illness, injury or other health concerns, poor service, negative experiences or other problems and reduce demand in the TAO Group business. The risk of negative publicity is exacerbated by the growing influence of social media, which can result in immediate and widespread dissemination of information (which may be false) with limited ability on our part to respond or correct such reports.
Increases in Labor Costs Could Slow the Growth of or Harm TAO Group.
TAO Group has a substantial number of hourly employees whose compensation may be impacted by increases in government-imposed minimum wage rates. In addition, TAO Group employs a substantial number of employees whose income is supplemented through the receipt of gratuities. In certain jurisdictions in which TAO Group operates, the minimum hourly wage to which gratuity eligible employees are entitled under law is lower than the minimum wage required to be paid to other employees, subject to the former’s receipt of sufficient gratuities. The difference between the two minimum rates is referred to as a “tip credit”. Governmental entities have acted to increase minimum wage rates in jurisdictions where TAO Group operates or may operate in the future. In addition, governmental entities have acted to eliminate, or considered the elimination of, tip credits in the application of minimum wage laws. As minimum wage rates increase, or if tip credits are reduced or eliminated, TAO Group may need to increase wages paid to a substantial number of employees, which will increase the labor costs of TAO Group. In addition, TAO Group’s labor costs may increase if certain employees elect to be union represented and to collectively bargain their compensation. TAO Group may be unable offset these increased labor cost either through increased prices or changes to its operations, which could have a material negative effect on our business and results of operations.
General Risks
Our Business Has Been Adversely Impacted and May, in the Future, Be Materially Adversely Impacted by an Economic Downturn and Financial Instability or Changes in Consumer Tastes and Preferences.
Our businesses depend upon the ability and willingness of consumers and businesses to purchase tickets (including season tickets) at our venues, license suites at The Garden, spend on concessions and merchandise, and drive continued advertising and sponsorship revenues. Further, the restaurant, nightlife and hospitality industries are often affected by changes in consumer tastes, national, regional and local economic conditions, discretionary spending priorities, demographic trends, traffic patterns and the type, number and location of competing businesses.
As a result, instability and weakness of the U.S. and global economies and the negative effects on consumers’ and businesses’ discretionary spending may materially negatively affect our business and results of operations.
We Have in Past Periods Incurred Substantial Operating Losses, Negative Adjusted Operating Income and Negative Cash Flow and There is No Assurance We Will Have Operating Income, Positive Adjusted Operating Income or Positive Cash Flow in the Future.
We have in past periods incurred operating losses and negative cash flow and there is no assurance that we will have operating income or positive cash flow in the future. Our MSG Entertainment segment recognized operating losses during the years ended June 30, 2017, 2016 and 2014 and our MSG Sports segment recognized an operating loss during the year ended June 30, 2014. Significant operating losses may limit our ability to raise necessary financing, or to do so on favorable terms, as such losses could be taken into account by potential investors, lenders and the organizations that issue investment ratings on indebtedness. See “Part II — Item 7. Management’s Discussion and Analysis of Financial Condition and Results of Operations — MSG Sports — Factors Affecting Operating Results” and “Part II — Item 7. Management’s Discussion and Analysis of Financial Condition and Results of Operations — MSG Entertainment — Factors Affecting Operating Results.”
21
Our Operating Results and Cash Flow Can Vary Substantially from Period to Period.
Our operating results and cash flow reflect significant variation from period to period and will continue to do so in the future. Therefore, period-to-period comparisons of our operating results may not necessarily be meaningful and the operating results of one period are not indicative of our financial performance during a full fiscal year. This variability may adversely affect our business, results of operations and financial condition.
Weather or Other Conditions May Impact Events at Our Venues, Which May Have a Material Negative Effect on Our Business and Results of Operations.
Weather or other conditions, including natural disasters, acts of terrorism and similar events, in the New York metropolitan area and other locations in which we own or operate venues may affect patron attendance as well as sales of concessions and merchandise, among other things. Weather conditions may also require us to cancel or postpone events. Any of these events may have a material negative effect on our business and results of operations.
Our Business Could Be Adversely Affected by Terrorist Activity or the Threat of Terrorist Activity and Other Developments that Discourage Congregation at Prominent Places of Public Assembly.
The success of our businesses is dependent upon the willingness and ability of patrons to attend events at our venues. The venues we operate, like all prominent places of public assembly, could be the target of terrorist activities or other actions that discourage attendance. Any such activity at or near one of our venues or other similar venues could result in a material negative effect on our business and results of operations. In addition, terrorist activity or other actions that discourage attendance at other locations, or even the threat of such activity, could result in reduced attendance at our venues. Similarly, a major epidemic or pandemic, or the threat of such an event, could adversely affect attendance at our events.
We May Pursue Acquisitions and Other Strategic Transactions to Complement or Expand Our Business that May Not Be Successful; We Have Significant Investments in Businesses We Do Not Control.
From time to time, we explore opportunities to purchase or invest in other businesses, venues or assets that we believe will complement, enhance or expand our current business or that might otherwise offer us growth opportunities, including opportunities that may differ from the Company’s current business. Any transactions that we are able to identify and complete may involve risks, including the commitment of significant capital, the incurrence of indebtedness, the payment of advances, the diversion of management’s attention and resources, litigation or other claims in connection with acquisitions or against companies we invest in or acquire, our lack of control over certain joint venture companies and other minority investments, the inability to successfully integrate such business into our operations or even if successfully integrated, the risk of not achieving the intended results and the exposure to losses if the underlying transactions or ventures are not successful. We have significant investments in businesses that we account for under the equity method of accounting. These investments have generated operating losses each year and certain have required additional investments from us in the form of equity or loans. We incurred losses in our equity method investments of approximately $7.8 million, $30.0 million, $19.1 million, and $40.6 million in the 2018, 2017, 2016 and 2015 fiscal years, respectively. There can be no assurance that these investments will become profitable individually or in the aggregate or that they will not require material additional funding from us in the future.
We do not control the day-to-day operations of these investments. We have in the past written down and, to the extent that these investments are not successful in the future, we may write down of all or a portion of such investments. Additionally, these businesses are subject to laws, rules and other circumstances, and have risks in their operations, which may be similar to, or different from, those to which we are subject. Any of the foregoing risks could result in a material negative effect on our business and results of operations or adversely impact the value of our investments.
We Do Not Own All of Our Venues and Our Failure to Renew Our Leases or Venue Management Agreements on Economically Attractive Terms May Have a Material Negative Effect on Our Business and Results of Operations; Our Lease on Radio City Music Hall Requires Us to Maintain a Certain Net Worth or Meet Certain Other Requirements.
The lease on Radio City Music Hall expires in 2023. We have the option to renew the lease at fair market value for an additional ten years by providing two years’ notice prior to the initial expiration date. Similarly, we lease the Beacon Theatre pursuant to a lease that expires in 2026. If we are unable to renew these leases on economically attractive terms, our business could be materially negatively affected. Our booking agreement with the Wang Theatre in Boston expires in 2019. The expiration of the booking agreement will not have a material negative effect on our business. MSG Sports & Entertainment, LLC, the entity that guarantees the Radio City Music Hall lease, is required to maintain a certain net worth or, if such net worth is not maintained, the entity must either post a letter of credit or provide cash collateral. The MSG Sphere Las Vegas will be constructed on property we lease from Sands under a 50 year lease.
22
TAO Group operates venues under various agreements that include leases with third parties and management agreements. The long-term success of TAO Group will depend in part on the availability of real estate, the ability to lease this real estate and the ability to enter into management agreements. As many of these agreements are with third parties over whom TAO Group has little or no control, they may be unable to renew these agreements or enter into new agreements on acceptable terms or at all, and may be unable to obtain favorable agreements with venues. The ability to renew these agreements and obtain new agreements on favorable terms depends on a number of other factors, many of which are beyond the control of us or TAO Group, such as national and local business conditions and competition from other businesses. There can be no assurance that TAO Group will be able to renew these agreements on acceptable terms or at all, or that they will be able to obtain attractive agreements with appropriate venues or real estate owners, which could have a material negative effect on our business and results of operations.
We Are Subject to Extensive Governmental Regulation and Our Failure to Comply with These Regulations May Have a Material Negative Effect on Our Business and Results of Operations.
Our operations are subject to federal, state and local laws and regulations.
We hold liquor licenses at each of our venues and are subject to licensing requirements with respect to the sale of alcoholic beverages in the jurisdictions in which we serve those beverages. Failure to receive or retain, or the suspension of, liquor licenses or permits could interrupt or terminate our ability to serve alcoholic beverages at the applicable venue and could have a material negative effect on our business and our results of operations. Additional regulation relating to liquor licenses may limit our activities in the future or significantly increase the cost of compliance, or both. In the jurisdictions in which our venues are located, we are subject to statutes that generally provide that serving alcohol to a visibly intoxicated or minor patron is a violation of the law and may provide for strict liability for certain damages arising out of such violations. Our liability insurance coverage may not be adequate or available to cover any potential liability.
We and our venues are subject to environmental laws and regulations relating to the use, disposal, storage, emission and release of hazardous and non-hazardous substances, as well as zoning and noise level restrictions which may affect, among other things, the operations of our venues. Additionally, certain laws and regulations could hold us strictly, jointly and severally responsible for the remediation of hazardous substance contamination at our facilities or at third-party waste disposal sites, and could hold us responsible for any personal or property damage related to any contamination. Any requirements to dispose of, or remediate, such hazardous or non-hazardous materials and any associated costs and impact on operations of such efforts may be heightened as a result of the purchase, construction or renovation of a venue.
Our venues are subject to zoning and building regulations including permits relating to the operation of The Garden. In addition, The Garden requires a zoning special permit. The original permit was granted by the New York City Planning Commission in 1963 and renewed in July 2013 for 10 years. In connection with the renewal, certain government officials and special interest groups sought to use the renewal process to pressure us to improve Penn Station or to relocate The Garden. There can be no assurance regarding the future renewal of the permit or the terms thereof.
In January 2016, New York Governor Andrew Cuomo announced a request for proposal (“RFP”) process for proposals on transforming Penn Station. For example, he noted the possibility of seeking to move The Hulu Theater at Madison Square Garden to create a new Penn Station entrance, but noted that New York State was ready to explore all RFP proposals. The Governor has not announced a final decision on any of the proposals received. We have no assurance on how the final approved proposal may impact the Madison Square Garden Complex.
Our businesses are, and may in the future be, subject to a variety of other laws and regulations, including licensing, permitting, and historic designation and similar requirements; working conditions, labor, immigration and employment laws; health, safety and sanitation requirements; compliance with the Americans with Disabilities Act; and privacy laws.
Our failure to comply with applicable governmental laws and regulations, or to maintain necessary permits or licenses, could have a material negative effect on our business and results of operations.
23
Our Properties Are Subject to, and Benefit from, Certain Easements, the Availability of Which May Not Continue on Terms Favorable to Us or at All.
Our properties are subject to, and benefit from, certain easements. For example, the “breezeway” into the Madison Square Garden Complex from Seventh Avenue in New York City is a significant easement that we share with other property owners. Additionally, our planned MSG Sphere Las Vegas will have the benefit of an easement with respect to the planned pedestrian bridge to the Sands Expo & Convention Center. Our ability to continue to utilize these and other easements, including for advertising purposes, requires us to comply with a number of conditions. Moreover, certain adjoining property owners have easements over our property, which we are required to maintain so long as those property owners meet certain conditions. It is possible that we will be unable to continue to access or maintain any easements on terms favorable to us, or at all, which could have a material negative effect on our business and results of operations.
We May Be Exposed to Business, Reputational and Litigation Risk if There is Loss, Disclosure or Misappropriation of or Access to Stored Personal Information or Other Breaches of Our Information Security.
Through our operations, we may collect and store, including by electronic means, certain personal information and payment card information that is provided to us through purchases, registration on our web sites, or otherwise in communication or interaction with us. These activities require the use of centralized data storage, including through third party service providers. Data maintained in electronic form is subject to the risk of intrusion, tampering, theft or other malicious activity. Our ability to safeguard such personal information and other confidential information, including information regarding the Company and our distributors, advertisers and employees, is important to our business. We take these matters seriously and take significant steps to protect our stored information. These protections are costly and require ongoing monitoring and updating as technologies change and efforts to overcome security measures become more sophisticated. Despite our efforts, the risks of a data breach cannot be entirely eliminated and our information technology and other systems that maintain and transmit consumer, distributor, advertiser, Company, employee and other confidential information may be compromised. This compromise of information on our network security or that of a third party service provider could result in personal information and/or confidential information being lost, disclosed, accessed or taken without consent, as well as the security of our other confidential information may be compromised. For example, on November 22, 2016, the Company announced that it was notifying customers that it had identified and addressed a payment card issue that affected cards used at merchandise and food and beverage locations at several of the Company’s New York venues and The Chicago Theatre. The Company, working with security firms, promptly fixed the issue and implemented enhanced security measures. The Company also continues to review and enhance our security measures in light of changes in the industry. The Company has incurred and expects to incur expenses associated with the payment card incident.
If our electronically stored data is compromised, our ability to conduct business may be interrupted or impaired, we may lose profitable opportunities or the value of those opportunities may be diminished and we may lose revenue as a result of unlicensed use of our intellectual property. Further, a penetration of our network security or other misappropriation or misuse of personal or confidential information could subject us to business and litigation risk and damage our reputation, which could have a material negative effect on our business and results of operations.
A Change to or Withdrawal of New York City Real Estate Tax Exemption May Have a Material Negative Effect on Our Business and Results of Operations.
Many arenas, ballparks and stadiums nationally and in New York City have received significant public support, such as tax exempt financing, other tax benefits, direct subsidies and other contributions, including for public infrastructure critical to the facilities such as parking lots and transit improvements. Our Madison Square Garden Complex benefits from a more limited real estate tax exemption pursuant to an agreement with the City of New York, subject to certain conditions, and legislation enacted by the State of New York in 1982. For fiscal year 2018, the tax exemption was $41.5 million. From time to time there have been calls to repeal or amend the tax exemption. Repeal or amendment would require legislative action by New York State. There can be no assurance that the tax exemption will not be amended in a manner adverse to us or repealed in its entirety, either of which could have a material negative effect on our business and results of operations.
24
Certain of Our Subsidiaries Have Incurred Indebtedness, and the Occurrence of an Event of Default Under Our Subsidiaries’ Credit Facilities Could Substantially Impair the Assets of Those Subsidiaries; Failure of Our Joint Ventures to Perform as Expected Could Have a Negative Effect on Our Business.
Certain of our subsidiaries have incurred indebtedness, which indebtedness in the case of the TAO Group is significant relative to the assets of the TAO Group business. New York Knicks, LLC and New York Rangers, LLC, which own the assets of the Knicks and Rangers franchises, respectively, have also entered into credit facilities, both of which were undrawn as of June 30, 2018. The occurrence of an event of default under our subsidiaries’ credit facilities could substantially impair the assets of those subsidiaries and, as a result, have a negative effect on our business and results of operations.
In addition, we have made investments in, or otherwise extended loans to, one or more of our joint ventures and may make additional investments in, or otherwise extend loans to, one or more of our joint ventures or their affiliates in the future. To the extent that those joint ventures or related affiliates do not perform as expected, including with respect to repayment of such loans, it could impair such assets or create losses related to such loans, and, as a result, have a negative effect on our business and results of operations.
We May Require Financing to Fund Our Ongoing Operations and Capital Expenditures, the Availability of Which is Highly Uncertain.
The capital and credit markets can experience volatility and disruption. Such markets can exert extreme downward pressure on stock prices and upward pressure on the cost of new debt capital and can severely restrict credit availability for most issuers.
Our business has been characterized by significant expenditures for properties, businesses, renovations and productions. In the future we may engage in transactions that depend on our ability to obtain financing. We may also seek financing to fund our ongoing operations.
Depending upon conditions in the financial markets and/or the Company’s financial performance, we may not be able to raise additional capital on favorable terms, or at all. In addition, as described above, the leagues in which our sports teams compete may have, under certain circumstances, approval rights over certain financing transactions, and in connection with those rights, could affect our ability to obtain such financing. If we are unable to pursue our current and future spending programs, we may be forced to cancel or scale back those programs. Failure to successfully pursue our capital expenditure and other spending plans could negatively affect our ability to compete effectively and have a material negative effect on our business and results of operations.
Our Business is Subject to Seasonal Fluctuations.
Our revenues have been seasonal and we expect they will continue to be seasonal. For example, 15% of our MSG Entertainment segment’s revenues and 7% of our consolidated revenues in fiscal year 2018 were derived from the Christmas Spectacular. Revenues of the MSG Entertainment segment are highest in the second quarter of our fiscal year when these performances primarily occur. As a result, MSG Entertainment earns a disproportionate amount of its revenue and operating income in the second quarter of each fiscal year. Similarly, because of the nature of the NBA and NHL playing seasons, revenues from our sports teams are concentrated in the second and third quarters of each fiscal year. Revenues from our business on a consolidated basis tend to be at their lowest in the first and fourth quarters of the fiscal year.
Organized Labor Matters May Have a Material Negative Effect on Our Business and Results of Operations.
Our business is dependent upon the efforts of unionized workers. Approximately 58% of our employees are represented by unions. Any labor disputes, such as strikes or lockouts, with the unions with which we have CBAs could have a material negative effect on our business and results of operations (including our ability to produce or present concerts, theatrical productions, sporting events and other events).
25
NBA players are covered by a CBA between the NBPA and the NBA. NHL players are covered by a CBA between the NHLPA and the NHL. Both the NBA and the NHL have experienced labor difficulties in the past and may have labor issues in the future. Labor difficulties may include players’ strikes or management lockouts. For example, the NHL has experienced labor difficulties, including a lockout during the 1994-95 NHL season, which resulted in the regular season being shortened from 84 to 48 games, a lockout beginning in September 2004, which resulted in the cancellation of the entire 2004-05 NHL season, and a lockout during the 2012-13 NHL season, which resulted in the regular season being shortened from 82 to 48 games. The current NHL CBA expires on September 15, 2022 (although the NHL and NHLPA each have the right to terminate the CBA effective following the 2019-20 season). The NBA has also experienced labor difficulties, including a lockout during the 1998-99 season, which resulted in the regular season being shortened from 82 to 50 games, and a lockout during the 2011-12 season, which resulted in the regular season being shortened from 82 games to 66 games. The current NBA CBA expires after the 2023-24 season (although the NBA and NBPA each has the right to terminate the CBA effective following the 2022-23 season).
The Unavailability of Systems Upon Which We Rely May Have a Material Negative Effect on Our Business and Results of Operations.
We rely upon various internal and third-party software or systems in the operation of our business, including, with respect to ticket sales, credit card processing, email marketing, point of sale transactions, database, inventory, human resource management and financial systems. From time to time, certain of these arrangements may not be covered by long-term agreements. The failure or unavailability of these internal or third-party services or systems, depending upon its severity and duration, could have a material negative effect on our business and results of operations.
We May Become Subject to Infringement or Other Claims Relating to Our Content or Technology.
From time to time, third parties may assert against us alleged intellectual property (e.g., copyright, trademark and patent) or other claims relating to our productions, technologies or other content or material, some of which may be important to our business. In addition, our productions could potentially subject us to claims of defamation or similar types of allegations. Any such claims, regardless of their merit, could cause us to incur significant costs. In addition, if we are unable to continue use of certain intellectual property rights, our business and results of operations could be materially negatively impacted.
There Is the Risk of Personal Injuries and Accidents in Connection with Our Venues, Which Could Subject Us to Personal Injury or Other Claims; We are Subject to the Risk of Adverse Outcomes in Other Types of Litigation.
There are inherent risks associated with producing and hosting events and operating, maintaining or renovating our venues and in operating the restaurant and nightlife venues. As a result, personal injuries, accidents and other incidents have occurred and may occur from time to time, which could subject us to claims and liabilities.
These risks might not be covered by insurance or could involve exposures that exceed the limits of any applicable insurance. Incidents in connection with events at any of our venues could also reduce attendance at our events, and cause a decrease in our revenue and operating income. While we seek to obtain contractual indemnities for events at our venues that we do not promote and we maintain insurance policies that provide coverage for incidents in the ordinary course of business, there can be no assurance that such indemnities or insurance will be adequate at all times and in all circumstances.
From time to time, we become subject to other kinds of litigation. The outcome of litigation is inherently unpredictable. As a result, we could incur liability from litigation which could be material and for which we may have inadequate or no insurance coverage or be subject to other forms of relief which might adversely affect the Company.
26
We face risks from doing business internationally.
We have operations and own property outside of the United States. As a result, our business is subject to certain risks inherent in international business, many of which are beyond our control. These risks include:
• | laws and policies affecting trade and taxes, including laws and policies relating to currency, the repatriation of funds and withholding taxes, and changes in these laws; |
• | changes in local regulatory requirements, including restrictions on foreign ownership; |
• | exchange rate fluctuation; |
• | exchange controls, tariffs and other trade barriers; |
• | differing degrees of protection for intellectual property and varying attitudes towards the piracy of intellectual property; |
• | foreign privacy and data protection laws and regulations and changes in these laws; |
• | the instability of foreign economies and governments; |
• | war and acts of terrorism; |
• | anti-corruption laws and regulations such as the Foreign Corrupt Practices Act and the U.K. Bribery Act that impose stringent requirements on how we conduct our foreign operations and changes in these laws and regulations; and |
• | shifting consumer preferences regarding entertainment. |
Events or developments related to these and other risks associated with international operations could have a material negative effect on our business and results of operations.
The Distribution Could Result in Significant Tax Liability.
We have received an opinion from Sullivan & Cromwell LLP substantially to the effect that, among other things, the Distribution qualified as a tax-free distribution under the Internal Revenue Code (the “Code”). The opinion is not binding on the Internal Revenue Service (the “IRS”) or the courts. Additionally, MSG Networks received a private letter ruling from the IRS concluding that certain limited aspects of the Distribution do not prevent the Distribution from satisfying certain requirements for tax-free treatment under the Code. The opinion and the private letter ruling relied on factual representations and reasonable assumptions, which if incorrect or inaccurate may jeopardize the ability to rely on such opinion and letter ruling.
If the Distribution does not qualify for tax-free treatment for U.S. federal income tax purposes, then, in general, MSG Networks would recognize taxable gain in an amount equal to the excess of the fair market value of the common stock of our Company over MSG Networks’ tax basis therein (i.e., as if it had sold the common stock of our Company in a taxable sale for its fair market value). In addition, the receipt by MSG Networks’ stockholders of common stock of our Company would be a taxable distribution, and each U.S. holder that participated in the Distribution would recognize a taxable distribution as if the U.S. holder had received a distribution equal to the fair market value of our common stock that was distributed to it, which generally would be treated first as a taxable dividend to the extent of MSG Networks’ earnings and profits, then as a non-taxable return of capital to the extent of each U.S. holder’s tax basis in its MSG Networks common stock, and thereafter as capital gain with respect to any remaining value. It is expected that the amount of any such taxes to MSG Networks’ stockholders and MSG Networks would be substantial. See “— We May Have a Significant Indemnity Obligation to MSG Networks if the Distribution Is Treated as a Taxable Transaction.”
We May Have a Significant Indemnity Obligation to MSG Networks if the Distribution Is Treated as a Taxable Transaction.
We have entered into a Tax Disaffiliation Agreement with MSG Networks, which sets out each party’s rights and obligations with respect to deficiencies and refunds, if any, of federal, state, local or foreign taxes for periods before and after the Distribution and related matters such as the filing of tax returns and the conduct of IRS and other audits. Pursuant to the Tax Disaffiliation Agreement, we are required to indemnify MSG Networks for losses and taxes of MSG Networks resulting from the breach of certain covenants and for certain taxable gain recognized by MSG Networks, including as a result of certain acquisitions of our stock or assets. If we are required to indemnify MSG Networks under the circumstances set forth in the Tax Disaffiliation Agreement, we may be subject to substantial liabilities, which could materially adversely affect our financial position.
27
We are Controlled by the Dolan Family. As a Result of Their Control, the Dolan Family Has the Ability to Prevent or Cause a Change in Control or Approve, Prevent or Influence Certain Actions by the Company.
We have two classes of common stock:
• | Class A Common Stock, par value $0.01 per share (“Class A Common Stock”), which is entitled to one vote per share and is entitled collectively to elect 25% of our Board of Directors; and |
• | Class B Common Stock, par value $0.01 per share (“Class B Common Stock”), which is entitled to ten votes per share and is entitled collectively to elect the remaining 75% of our Board of Directors. |
As of July 31, 2018, the Dolan family, including trusts for the benefit of members of the Dolan family (collectively, the “Dolan Family Group”), collectively own all of our Class B Common Stock, approximately 2.8% of our outstanding Class A Common Stock and approximately 71.1% of the total voting power of all our outstanding common stock. The members of the Dolan Family Group holding Class B Common Stock have executed a stockholders agreement (the “Stockholders Agreement”) that has the effect of causing the voting power of the holders of our Class B Common Stock to be cast as a block with respect to all matters to be voted on by holders of Class B Common Stock. Under the Stockholders Agreement, the shares of Class B Common Stock owned by members of the Dolan Family Group are to be voted on all matters in accordance with the determination of the Dolan Family Committee, except that the decisions of the Dolan Family Committee are non-binding with respect to the Class B Common Stock owned by certain Dolan family trusts that collectively own 40.5% of the outstanding Class B Common Stock (“Excluded Trust”). The “Dolan Family Committee” consists of Charles F. Dolan and his six children, James L. Dolan, Thomas C. Dolan, Patrick F. Dolan, Kathleen M. Dolan, Marianne Dolan Weber and Deborah A. Dolan-Sweeney. The Dolan Family Committee generally acts by majority vote, except that approval of a going-private transaction must be approved by a two-thirds vote and approval of a change-in-control transaction must be approved by not less than all but one vote. The voting members of the Dolan Family Committee are James L. Dolan, Thomas C. Dolan, Kathleen M. Dolan, Deborah A. Dolan-Sweeney and Marianne Dolan Weber, with each member having one vote other than James L. Dolan, who has two votes. Because James L. Dolan has two votes, he has the ability to block Dolan Family Committee approval of any Company change in control transaction. Shares of Class B Common Stock owned by Excluded Trusts are to be voted on all matters in accordance with the determination of the Excluded Trusts holding a majority of the Class B Common Stock held by all Excluded Trusts, except in the case of a vote on a going-private transaction or a change in control transaction, in which case a vote of trusts holding two-thirds of the Class B Common Stock owned by Excluded Trusts is required.
The Dolan Family Group is able to prevent a change in control of our Company and no person interested in acquiring us will be able to do so without obtaining the consent of the Dolan Family Group. The Dolan Family Group, by virtue of their stock ownership, have the power to elect all of our directors subject to election by holders of Class B Common Stock and are able collectively to control stockholder decisions on matters on which holders of all classes of our common stock vote together as a single class. These matters could include the amendment of some provisions of our certificate of incorporation and the approval of fundamental corporate transactions.
In addition, the affirmative vote or consent of the holders of at least 66 2⁄3% of the outstanding shares of the Class B Common Stock, voting separately as a class, is required to approve:
• | the authorization or issuance of any additional shares of Class B Common Stock; and |
• | any amendment, alteration or repeal of any of the provisions of our certificate of incorporation that adversely affects the powers, preferences or rights of the Class B Common Stock. |
As a result, the Dolan Family Group also has the power to prevent such issuance or amendment.
The Dolan Family Group also controls MSG Networks and AMC Networks Inc. (“AMC Networks”).
We Have Elected to Be a “Controlled Company” for NYSE Purposes Which Allows Us Not to Comply with Certain of the Corporate Governance Rules of NYSE.
Members of the Dolan Family Group have entered into a Stockholders Agreement relating, among other things, to the voting of their shares of our Class B Common Stock. As a result, we are a “controlled company” under the corporate governance rules of NYSE. As a controlled company, we have the right to elect not to comply with the corporate governance rules of NYSE requiring: (i) a majority of independent directors on our Board, (ii) an independent corporate governance and nominating committee and (iii) an independent compensation committee. Our Board of Directors has elected for the Company to be treated as a “controlled company” under NYSE corporate governance rules and not to comply with the NYSE requirement for a majority independent board of directors and for an independent corporate governance and nominating committee because of our status as a controlled company. Nevertheless, our Board of Directors has elected to comply with the NYSE requirement for an independent compensation committee.
28
Future Stock Sales, Including as a Result of the Exercise of Registration Rights by Certain of Our Stockholders, Could Adversely Affect the Trading Price of Our Class A Common Stock.
Certain parties have registration rights covering a portion of our shares. We have entered into registration rights agreements with Charles F. Dolan, members of his family, certain Dolan family interests, and the Dolan Family Foundation that provide them with “demand” and “piggyback” registration rights with respect to approximately 5.1 million shares of Class A Common Stock, including shares issuable upon conversion of shares of Class B Common Stock. Sales of a substantial number of shares of Class A Common Stock could adversely affect the market price of the Class A Common Stock and could impair our future ability to raise capital through an offering of our equity securities.
Transfers and Ownership of Our Common Stock Are Subject to Restrictions Under Rules of the NBA, NHL and WNBA and Our Certificate of Incorporation Provides Us with Remedies Against Holders Who Do Not Comply with Those Restrictions.
The Company is the owner of professional sports franchises in the NBA, NHL and WNBA. As a result, transfers and ownership of our common stock are subject to certain restrictions under the governing documents of the NBA, NHL and WNBA as well as the Company’s consent and other agreements with the NBA, NHL and WNBA in connection with their approval of the Distribution. These restrictions are described under “Description of Capital Stock — Class A Common Stock and Class B Common Stock — Transfer Restrictions” in our Information Statement filed as Exhibit 99.1 to Amendment No. 6 to the registration statement on Form 10 filed with the SEC on September 11, 2015. In order to protect the Company and its NBA, NHL and WNBA franchises from sanctions that might be imposed by the NBA, NHL or WNBA as a result of violations of these restrictions, our amended and restated certificate of incorporation provides that, if a transfer of shares of our common stock to a person or the ownership of shares of our common stock by a person requires approval or other action by a league and such approval or other action was not obtained or taken as required, the Company shall have the right by written notice to the holder to require the holder to dispose of the shares of common stock which triggered the need for such approval. If a holder fails to comply with such a notice, in addition to any other remedies that may be available, the Company may redeem the shares at 85% of the fair market value of those shares.
We Share Certain Key Executives and Directors with MSG Networks and/or AMC Networks, Which Means Those Executives Do Not Devote Their Full Time and Attention to Our Affairs and the Overlap May Give Rise to Conflicts; Certain Directors Are Also Directors and/or Executives of AMC Networks.
Our Executive Chairman and Chief Executive Officer, James L. Dolan, also serves as the Executive Chairman of MSG Networks, and our Executive Vice President, General Counsel and Secretary, Lawrence J. Burian, also serves as the Executive Vice President, General Counsel and Secretary of MSG Networks. As a result, not all of our executive officers devote their full time and attention to the Company’s affairs. In addition, our Vice Chairman, Gregg G. Seibert, also serves as the Vice Chairman of both MSG Networks and AMC Networks, and one of our directors, Charles F. Dolan, is the Executive Chairman of AMC Networks. Furthermore, six members of our Board of Directors (including James L. Dolan) are also directors of MSG Networks, and seven members of our Board of Directors (including James L. Dolan) are also directors of AMC Networks. The overlapping officers and directors may have actual or apparent conflicts of interest with respect to matters involving or affecting each company. For example, the potential for a conflict of interest exists when we on the one hand, and MSG Networks and/or AMC Networks on the other hand, look at certain acquisitions and other corporate opportunities that may be suitable for more than one of the companies. Also, conflicts may arise if there are issues or disputes under the commercial arrangements that exist between MSG Networks or AMC Networks and us. In addition, certain of our directors and officers hold MSG Networks and/or AMC Networks stock, stock options, restricted stock units and/or cash performance awards. These ownership interests could create actual, apparent or potential conflicts of interest when these individuals are faced with decisions that could have different implications for our Company and MSG Networks or AMC Networks. See “Certain Relationships and Potential Conflicts of Interest” in our Proxy Statement filed with the SEC on October 27, 2016 and “Certain Relationships and Related Party Transactions — Certain Relationships and Potential Conflicts of Interest” in our Information Statement filed as Exhibit 99.1 to Amendment No. 6 to the registration statement on Form 10 filed with the SEC on September 11, 2015 for a discussion of certain procedures we instituted to help ameliorate such potential conflicts with MSG Networks and/or AMC Networks that may arise.
29
Our Overlapping Directors and Executive Officers with MSG Networks and/or AMC Networks May Result in the Diversion of Corporate Opportunities to MSG Networks and/or AMC Networks and Other Conflicts and Provisions in Our Amended and Restated Certificate of Incorporation May Provide Us No Remedy in That Circumstance.
The Company’s amended and restated certificate of incorporation acknowledges that directors and officers of the Company (the “Overlap Persons”) may also be serving as directors, officers, employees or agents of MSG Networks and/or AMC Networks (each an “Other Entity”), and that the Company may engage in material business transactions with such Other Entities. The Company has renounced its rights to certain business opportunities and the Company’s amended and restated certificate of incorporation provides that no director or officer of the Company who is also serving as a director, officer, employee or agent of one or more of the Other Entities will be liable to the Company or its stockholders for breach of any fiduciary duty that would otherwise occur by reason of the fact that any such individual directs a corporate opportunity (other than certain limited types of opportunities set forth in our amended and restated certificate of incorporation) to one or more of the Other Entities instead of the Company, or does not refer or communicate information regarding such corporate opportunities to the Company. These provisions in our amended and restated certificate of incorporation also expressly validate certain contracts, agreements, arrangements and transactions (and amendments, modifications or terminations thereof) between the Company and the Other Entities and, to the fullest extent permitted by law, provide that the actions of the overlapping directors or officers in connection therewith are not breaches of fiduciary duties owed to the Company, any of its subsidiaries or their respective stockholders. See “Certain Relationships and Potential Conflicts of Interest” in our Proxy Statement filed with the SEC on October 27, 2017 and “Description of Capital Stock — Certain Corporate Opportunities and Conflicts” in our Information Statement filed as Exhibit 99.1 to Amendment No. 6 to the registration statement on Form 10 filed with the SEC on September 11, 2015.
Item 1B. Unresolved Staff Comments
None.
Item 2. Properties
We own the Madison Square Garden Complex, which includes The Garden (with a maximum capacity of approximately 21,000 seats) and The Hulu Theater at Madison Square Garden (approximately 5,600 seats) in New York City, comprising approximately 1,100,000 square feet; a training center in Greenburgh, NY with approximately 105,000 square feet of space; The Chicago Theatre (approximately 3,600 seats) in Chicago comprising approximately 72,600 square feet; and the Forum (approximately 17,600 seats) in Inglewood, CA comprising approximately 307,000 square feet.
Significant properties that are leased in New York City include approximately 328,500 square feet housing Madison Square Garden’s administrative and executive offices, approximately 577,000 square feet comprising Radio City Music Hall (approximately 6,000 seats) and approximately 57,000 square feet comprising the Beacon Theatre (approximately 2,800 seats). We also lease storage space in various other locations. For more information on our venues, see “Item 1. Business — Our Business — Our Performance Venues.”
We also lease property in Las Vegas, Nevada and own property in Stratford, London on which we intend to construct new venues — known as “MSG Sphere.” See “Item 1. Business — Our Business — Our Performance Venues — MSG Sphere.”
Our Madison Square Garden Complex is subject to and benefits from various easements, including over the “breezeway” into Madison Square Garden from Seventh Avenue in New York City (which we share with other property owners). Additionally, our planned MSG Sphere Las Vegas will have the benefit of an easement with respect to the planned pedestrian bridge to the Sands Expo & Convention Center. Our ability to continue to utilize these and other easements requires us to comply with certain conditions. Moreover, certain adjoining property owners have easements over our property, which we are required to maintain so long as those property owners meet certain conditions.
In addition, TAO Group is engaged in the management and operation of restaurants, nightlife and hospitality venues in New York City, Las Vegas, Los Angeles, Singapore and Australia, of which 14 venues are leased properties as well as five leased offices located in in New York and Las Vegas. The size of the TAO Group’s leased venues ranges from approximately 4,200 to 26,000 square feet and total approximately 200,000 square feet including office space. TAO Group also manages 11 venues (including one venue located in Australia and one venue located in Singapore) that are not owned or leased properties.
30
Item 3. Legal Proceedings
The Company owns 50% of AMSGE, which in turn owns a majority interest in Global Music Rights, LLC (“GMR”). GMR is primarily a performance rights organization, whose business includes obtaining the right to license the public performance rights of songs composed by leading songwriters. GMR engaged in negotiations with the Radio Music Licensing Committee (“RMLC”), which represents over ten thousand commercial radio stations. On November 18, 2016, RMLC filed a complaint against GMR in the United States District Court for the Eastern District of Pennsylvania alleging that GMR is violating Section 2 of the Sherman Antitrust Act and seeking an injunction, requiring, among other things, that GMR issue radio stations licenses for GMR’s repertory, upon request, at a rate set through a judicial rate-making procedure, that GMR offer “economically viable alternatives to blanket licenses,” and that GMR offer only licenses for songs which are fully controlled by GMR. GMR and RMLC agreed to an interim license arrangement through September 30, 2017, which has been extended through September 30, 2018. GMR has advised the Company that it believes that the RMLC Complaint is without merit and is vigorously defending itself. On January 20, 2017, GMR filed a motion to dismiss or to transfer venue, asserting that the Eastern District of Pennsylvania is not a proper venue for the matter, lacks personal jurisdiction of GMR and that in any event the complaint fails to state a claim. On December 6, 2016, GMR filed a complaint against RMLC in the United States District Court for the Central District of California, alleging that RMLC operates as an illegal cartel that unreasonably restrains trade in violation of Section 1 of the Sherman Antitrust Act and California state law, and seeking an injunction restraining RMLC and its co-conspirators from enforcing or establishing agreements that unreasonably restrict competition for public performance licenses. The judge in the Central District of California denied RMLC’s motion to dismiss GMR’s claim for lack of ripeness and, on the basis that the two cases involve similar facts, stayed the California action in order to assess the status of the Pennsylvania case. On July 21, 2017, RMLC filed a preliminary injunction motion in the United States District Court for the Eastern District of Pennsylvania to extend the duration of the interim licenses which GMR had granted to certain radio stations. The district court determined that the jurisdictional matter should be decided prior to addressing the motion for preliminary injunction and referred the jurisdictional questions to the Magistrate Judge in the United States District Court Eastern District of Pennsylvania. On November 29, 2017, the Magistrate Judge issued a report and recommendation that personal jurisdiction was not appropriate over GMR in the Eastern District of Pennsylvania and recommending the dismissal of RMLC’s action without prejudice. RMLC has filed objections to the Magistrate Judge’s report and recommendation. On May 3, 2018, GMR filed a motion to lift the stay in GMR’s California action on the basis that a continuation of the stay would cause undue prejudice to GMR. On May 14, 2018, RMLC opposed GMR’s motion to lift the stay and, on May 23, 2018, GMR filed a reply in support of its motion to lift the stay. On August 14, 2018, the court denied GMR’s motion to lift the stay.
The Company is a defendant in various other lawsuits. Although the outcome of these other lawsuits cannot be predicted with certainty (including the extent of available insurance, if any), management does not believe that resolution of these other lawsuits will have a material adverse effect on the Company.
Item 4. Mine Safety Disclosures
Not applicable.
31
PART II
Item 5. Market for the Registrant’s Common Equity, Related Stockholder Matters and Issuer Purchases of Equity Securities
Our Class A Common Stock, par value $0.01 per share (“Class A Common Stock”), is listed on the New York Stock Exchange (“NYSE”) under the symbol “MSG.” The Company’s Class A Common Stock began “regular way” trading on the NYSE on October 1, 2015.
Performance Graph
The following graph compares the relative performance of our Class A Common Stock, the Russell 3000 Index and the Bloomberg Americas Entertainment Index. This graph covers the period from October 1, 2015 through June 30, 2018. The stock price performance included in this graph is not necessarily indicative of future stock performance.
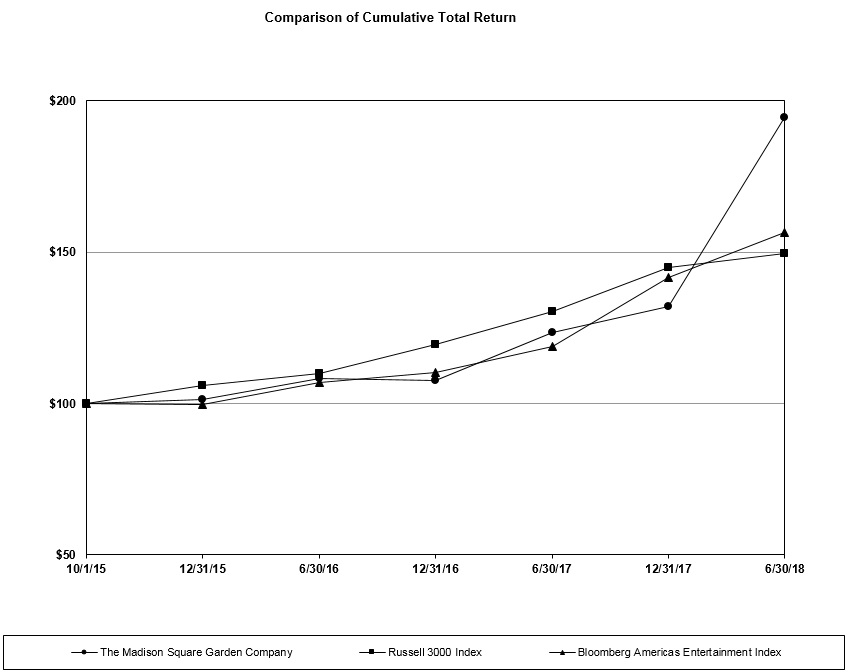
Base Period 10/1/15 | 12/31/15 | 6/30/16 | 12/31/16 | 6/30/17 | 12/31/17 | 6/30/18 | ||||||||||||||||||||||
The Madison Square Garden Company | $ | 100.00 | $ | 101.45 | $ | 108.16 | $ | 107.54 | $ | 123.46 | $ | 132.20 | $ | 194.49 | ||||||||||||||
Russell 3000 Index | 100.00 | 106.11 | 109.96 | 119.62 | 130.31 | 144.90 | 149.56 | |||||||||||||||||||||
Bloomberg Americas Entertainment Index | 100.00 | 99.65 | 106.98 | 110.36 | 118.88 | 141.61 | 156.68 | |||||||||||||||||||||
This performance graph shall not be deemed “filed” for purposes of Section 18 of the Securities Exchange Act of 1934, as amended (the “Exchange Act”) or incorporated by reference into any of our filings under the Securities Act of 1933, as amended, or the Exchange Act, except as expressly set forth by specific reference in such filing.
32
As of June 30, 2018, there were 693 holders of record of our Class A Common Stock. There is no public trading market for our Class B Common Stock, par value $.01 per share (“Class B Common Stock”). As of June 30, 2018, there were 14 holders of record of our Class B Common Stock.
We did not pay any dividend on our common stock during fiscal year 2018 and do not have any current plans to pay a cash dividend on our common stock for the foreseeable future.
Price Range of Madison Square Garden Class A Common Stock
The following tables set forth for the periods indicated the intra-day high and low sales prices per share of our Class A Common Stock as reported on NYSE:
Year ended June 30, 2018 | High | Low | |||||
For the Quarter ended September 30, 2017 | $ | 226.95 | $ | 189.96 | |||
For the Quarter ended December 31, 2017 | 231.44 | 207.98 | |||||
For the Quarter ended March 31, 2018 | 254.50 | 205.22 | |||||
For the Quarter ended June 30, 2018 | 321.92 | 236.78 | |||||
Year ended June 30, 2017 | High | Low | |||||
For the Quarter ended September 30, 2016 | $ | 188.80 | $ | 166.13 | |||
For the Quarter ended December 31, 2016 | 178.29 | 160.96 | |||||
For the Quarter ended March 31, 2017 | 206.24 | 166.86 | |||||
For the Quarter ended June 30, 2017 | 206.60 | 192.15 | |||||
Issuer Purchases of Equity Securities
As of June 30, 2018, the Company had approximately $260 million remaining under the $525 million Class A Common Stock share repurchase program authorized by the Company’s board of directors (“Board”) on September 11, 2015. Under the authorization, shares of Class A Common Stock may be purchased from time to time in accordance with applicable insider trading and other securities laws and regulations, with the timing and amount of purchases depending on market conditions and other factors. The Company has been funding and expects to continue to fund stock repurchases through a combination of cash on hand and cash generated by operations. During the three months ended June 30, 2018, the Company did not engage in any share repurchase activity under its share repurchase program.
Item 6. Selected Financial Data
The operating and balance sheet data included in the following selected financial data table have been derived from the consolidated and combined financial statements of The Madison Square Garden Company and its subsidiaries. The balance sheet data as of June 30, 2018, 2017 and 2016 and the operating data for the years ended June 30, 2018 and 2017 and the nine months ended June 30, 2016 are presented on a consolidated basis, as the Company became a standalone public company on the September 30, 2015 (the “Distribution Date”). Operating data prior to the Distribution Date, which included operating data for the years ended June 30, 2015 and 2014, as well as operating data for the three months ended September 30, 2015 that is included in results of operations for the year ended June 30, 2016, were prepared on a standalone basis derived from the consolidated financial statements and accounting records of MSG Networks Inc. (“MSG Networks” or “Former Parent”) and are presented as carve-out financial statements as the Company was not a standalone public company prior to the Distribution Date (“carve-out and combined basis”). Balance sheet data as of June 30, 2015 and 2014 were also presented on a carve-out and combined basis.
For periods prior to the Distribution Date, the financial information presented below does not necessarily reflect what our results of operations and financial position would have been if we had operated as a separate publicly-traded entity. The selected financial data presented below should be read in conjunction with the consolidated financial statements included in Item 8 of this Annual Report on Form 10-K and with “Item 7. Management’s Discussion and Analysis of Financial Condition and Results of Operations.” As discussed in note (a) below, our operating results for the year ended June 30, 2018 are not directly comparable with the year ended June 30, 2017 primarily due to the timing of our acquisition of a controlling interest in TAO Group Holdings LLC ( “TAO Group”).
33
Years Ended June 30, | |||||||||||||||||||
2018 | 2017 | 2016 | 2015 | 2014 | |||||||||||||||
(in thousands, except per share data) | |||||||||||||||||||
Operating Data (a): | |||||||||||||||||||
Revenues | $ | 1,559,095 | $ | 1,318,452 | $ | 1,115,311 | $ | 1,071,551 | $ | 913,615 | |||||||||
Operating income (loss) | 18,876 | (60,356 | ) | (58,631 | ) | (406 | ) | (114,028 | ) | ||||||||||
Net income (loss) | 134,448 | (76,789 | ) | (77,290 | ) | (40,684 | ) | (116,933 | ) | ||||||||||
Less: Net income (loss) attributable to nonredeemable noncontrolling interests | (6,518 | ) | 304 | — | — | — | |||||||||||||
Less: Net loss attributable to redeemable noncontrolling interests | (628 | ) | (4,370 | ) | — | — | — | ||||||||||||
Net Income (loss) attributable to The Madison Square Garden Company’s stockholders | $ | 141,594 | $ | (72,723 | ) | $ | (77,290 | ) | $ | (40,684 | ) | $ | (116,933 | ) | |||||
Basic earnings (loss) per common share attributable to The Madison Square Garden Company’s stockholders | $ | 5.99 | $ | (3.05 | ) | $ | (3.12 | ) | $ | (1.63 | ) | $ | (4.69 | ) | |||||
Diluted earnings (loss) per common share attributable to The Madison Square Garden Company’s stockholders | $ | 5.94 | $ | (3.05 | ) | $ | (3.12 | ) | $ | (1.63 | ) | $ | (4.69 | ) | |||||
Weighted-average number of common shares outstanding (b): | |||||||||||||||||||
Basic | 23,639 | 23,853 | 24,754 | 24,928 | 24,928 | ||||||||||||||
Diluted | 23,846 | 23,853 | 24,754 | 24,928 | 24,928 | ||||||||||||||
Balance Sheet Data (a): | |||||||||||||||||||
Total assets | $ | 3,736,173 | $ | 3,712,753 | $ | 3,543,950 | $ | 2,148,942 | $ | 2,137,191 | |||||||||
Long-term debt (including current portion), net of deferred financing costs (c) | 105,700 | 105,433 | — | — | — | ||||||||||||||
Total The Madison Square Garden Company stockholders’ equity / divisional equity | 2,536,483 | 2,408,163 | 2,586,421 | 1,223,275 | 1,191,203 | ||||||||||||||
(a) | Operating and balance sheet data beginning in fiscal year 2017 includes results from the acquisitions of Boston Calling Events, LLC (“BCE”) operating information from July 1, 2016 to June 30, 2017 and TAO Group operating information from February 1, 2017 to March 26, 2017. Operating and balance sheet data beginning in fiscal year 2018 includes results from the acquisitions of Counter Logic Gaming (“CLG”) and Obscura Digital (“Obscura”) since their acquisition dates. See Item 7. Management’s Discussion and Analysis of Financial Condition and Results of Operations — Introduction — Factors Affecting Operating Results from Acquisitions. In addition, see “Item 8. Financial Statements and Supplementary Data — Consolidated Financial Statements — Notes to Consolidated Financial Statements — Note 2. Summary of Significant Accounting Policies — Business Combinations and Noncontrolling Interests” for more information on our acquisitions of BCE, TAO Group and CLG, as well as “Item 8. Financial Statements and Supplementary Data — Consolidated Financial Statements — Notes to Consolidated Financial Statements — Note 3. Acquisitions” for more information on our current year’s acquisitions of CLG and Obscura. |
(b) | Following the Distribution Date, the Company had 24,928 common shares outstanding on September 30, 2015. This amount has been utilized to calculate earnings (loss) per share for the periods prior to the Distribution Date as no Madison Square Garden common stock or equity based awards were outstanding prior to September 30, 2015. |
(c) | Long-term debt presented above is net of debt issuance costs of $3,613 and $4,567 as of June 30, 2018 and 2017, respectively. See “Part II — Item 8. Financial Statements and Supplementary Data — Consolidated Financial Statements — Notes to Consolidated Financial Statements — Note 11. Credit Facilities” for more information. |
34
Item 7. Management’s Discussion and Analysis of Financial Condition and Results of Operations
This Management’s Discussion and Analysis of Financial Condition and Results of Operations (“MD&A”) contains forward-looking statements within the meaning of the Private Securities Litigation Reform Act of 1995. In this MD&A, there are statements concerning the future operating and future financial performance of The Madison Square Garden Company and its direct and indirect subsidiaries (collectively, “we,” “us,” “our,” “Madison Square Garden,” “MSG,” or the “Company”), including possible impacts from the timing and costs of new venue construction and the potential spin-off of the Company’s sports businesses (the “Sports Distribution”). See “Part I — Item 1. Business” for further discussion of the Sports Distribution. Words such as “expects,” “anticipates,” “believes,” “estimates,” “may,” “will,” “should,” “could,” “potential,” “continue,” “intends,” “plans,” and similar words and terms used in the discussion of future operating and future financial performance identify forward-looking statements. Investors are cautioned that such forward-looking statements are not guarantees of future performance, results or events and involve risks and uncertainties and that actual results or developments may differ materially from the forward-looking statements as a result of various factors. Factors that may cause such differences to occur include, but are not limited to:
• | the level of our revenues, which depends in part on the popularity and competitiveness of our sports teams and the level of popularity of the Christmas Spectacular Starring the Radio City Rockettes (“Christmas Spectacular”) and other entertainment events which are presented in our venues; |
• | costs associated with player injuries, and waivers or contract terminations of players and other team personnel; |
• | changes in professional sports teams’ compensation, including the impact of signing free agents and trades, subject to league salary caps and the impact of luxury tax; |
• | the level of our capital expenditures and other investments; |
• | general economic conditions, especially in the New York City, Los Angeles, Las Vegas and London metropolitan areas where we have operations; |
• | the demand for sponsorship arrangements and for advertising; |
• | competition, for example, from other teams, other venues and other sports and entertainment options, including the construction of new competing venues; |
• | Our ability to successfully design, construct, finance and operate new venues in Las Vegas, London and other markets, and the investments, costs and timing associated with those efforts, including the impact of unexpected construction delays and cost overruns; |
• | changes in laws, National Basketball Association (the “NBA”) or National Hockey League (the “NHL”) rules, regulations, guidelines, bulletins, directives, policies and agreements (including the leagues’ respective collective bargaining agreements (each a “CBA”) with their players’ associations, salary caps, revenue sharing, NBA luxury tax thresholds and media rights) or other regulations under which we operate; |
• | any NBA or NHL work stoppage; |
• | seasonal fluctuations and other variation in our operating results and cash flow from period to period; |
• | the level of our expenses, including our corporate expenses; |
• | the successful development of new live productions, enhancements or changes to existing productions and the investments associated with such development, enhancements, or changes; |
• | the continued popularity and success of the TAO Group restaurants and nightlife and hospitality venues, as well as its existing brands, and the ability to successfully open and operate new restaurants and nightlife and hospitality venues; |
• | the ability of BCE to attract attendees and performers to its festival; |
• | the evolution of the esports industry and its potential impact on our esports businesses; |
• | the acquisition or disposition of assets or businesses and/or the impact of, and our ability to successfully pursue, acquisitions or other strategic transactions; |
• | our ability to successfully integrate acquisitions, new venues or new businesses into our operations; |
• | the operating and financial performance of our strategic acquisitions and investments, including those we do not control; |
35
• | the costs associated with, and the outcome of, litigation and other proceedings to the extent uninsured, including litigation or other claims against companies we invest in or acquire; |
• | the impact of governmental regulations or laws, including changes in how those regulations and laws are interpreted and the continued benefit of certain tax exemptions and the ability to maintain necessary permits or licenses; |
• | the impact of any government plans to redesign Pennsylvania Station; |
• | business, reputational and litigation risk if there is a loss, disclosure or misappropriation of stored personal information or other breaches of our information security; |
• | a default by our subsidiaries under their respective credit facilities; |
• | financial community and rating agency perceptions of our business, operations, financial condition and the industry in which we operate; |
• | the ability of our investees and others to repay loans and advances we have extended to them; |
• | our ownership of professional sports franchises in the NBA and NHL and certain related transfer restrictions on our common stock; |
• | the tax free treatment of the Distribution; |
• | whether or not we pursue and complete the Sports Distribution and, if so, its impact on our business, financial condition and results of operations; and |
• | the factors described under “Part I — Item 1A. Risk Factors” included in this Annual Report on Form 10-K. |
We disclaim any obligation to update or revise the forward-looking statements contained herein, except as otherwise required by applicable federal securities laws.
36
All dollar amounts included in the following MD&A are presented in thousands, except as otherwise noted.
Introduction
MD&A is provided as a supplement to, and should be read in conjunction with, the audited consolidated financial statements and footnotes thereto included in Item 8 of this Annual Report on Form 10-K to help provide an understanding of our financial condition, changes in financial condition and results of operations.
Factors Affecting Results of Operations
The Company’s financial information for the three months ended September 30, 2015 that is included in the results of operations for the year ended June 30, 2016, was prepared on a standalone basis derived from the consolidated financial statements and accounting records of Former Parent and are presented as carve-out financial statements as the Company was not a standalone public company prior to the Distribution Date.
During the first quarter of fiscal year 2017, the Company refined its approach to allocating corporate, performance venues operating and other shared expenses. Management analyzed the specific support provided by individual corporate and venue personnel, in part using a detailed efforts-based analysis. The Company considered the new approach to better define segment profitability for users of the financial information and, therefore, made this change in the first quarter of fiscal year 2017. Fiscal year 2016 results are reflected as originally reported and have not been restated. Had the revised approach been used in fiscal year 2016, operating income reported in MSG Sports would have increased and operating loss reported in MSG Entertainment would have improved by $6,045 and $337, respectively. These changes in the MSG Sports and MSG Entertainment segments operating income (loss) would have been offset by an increase of $6,382 in the operating loss of “Corporate and Other” for the year ended June 30, 2016. The adjusted operating income, as defined in “— Consolidated Results of Operations — Adjusted operating income,” reported in MSG Sports would have increased and adjusted operating loss reported in MSG Entertainment would have improved during the year ended June 30, 2016 by $5,908 and $2,680, respectively. These improvements would have been offset by an increase of $8,588 in the adjusted operating loss of “Corporate and Other” for the year ended June 30, 2016.
Our MD&A is organized as follows:
Business Overview. This section provides a general description of our business, as well as other matters that we believe are important in understanding our results of operations and financial condition and in anticipating future trends.
Results of Operations. This section provides an analysis of our results of operations for the years ended June 30, 2018, 2017 and 2016 on both a consolidated and segment basis. Our segments are MSG Entertainment and MSG Sports.
Liquidity and Capital Resources. This section provides a discussion of our financial condition, as well as an analysis of our cash flows for the years ended June 30, 2018, 2017 and 2016. The discussion of our financial condition and liquidity includes summaries of (i) our primary sources of liquidity and (ii) our contractual obligations and off balance sheet arrangements that existed at June 30, 2018.
Seasonality of Our Business. This section discusses the seasonal performance of our MSG Sports and MSG Entertainment segments.
Recently Issued Accounting Pronouncements and Critical Accounting Policies. This section includes a discussion of accounting policies considered to be important to our financial condition and results of operations and which require significant judgment and estimates on the part of management in their application. In addition, all of our significant accounting policies, including our critical accounting policies, are discussed in the notes to our consolidated financial statements included in Item 8 of this Annual Report on Form 10-K.
Business Overview
The Company is a sports and entertainment business comprised of dynamic and powerful assets and brands. The Company is comprised of two business segments: MSG Entertainment and MSG Sports, which is built on a foundation of iconic venues and compelling content, including live sports and entertainment events that we create, produce and present. The Company conducts a significant portion of its operations at venues that it either owns or operates under long-term leases. The Company owns Madison Square Garden (“The Garden”) and The Hulu Theater at Madison Square Garden in New York City, the Forum in Inglewood, CA and The Chicago Theatre in Chicago. In addition, the Company leases Radio City Music Hall and the Beacon Theatre in New York City, and has a booking agreement with respect to the Wang Theatre in Boston. A description of our segments follows:
37
MSG Entertainment
Our MSG Entertainment segment, which represented approximately 50% of our consolidated revenues for the year ended June 30, 2018, is one of the country’s leaders in live entertainment. MSG Entertainment presents or hosts live entertainment events, including concerts, family shows, performing arts events and special events, in our diverse collection of venues. Those venues include The Garden, The Hulu Theater at Madison Square Garden, Radio City Music Hall, the Beacon Theatre, the Forum, and The Chicago Theatre. In addition, we have an exclusive booking agreement with respect to the Wang Theatre. The scope of our collection of venues enables us to showcase acts that cover a wide spectrum of genres and popular appeal.
Although we primarily license our venues to third-party promoters for a fee, we also promote or co-promote shows in which case we have economic risk relating to the event.
MSG Entertainment also creates, produces and/or presents live productions that are performed in the Company’s venues. This includes the Christmas Spectacular, which is the top grossing live holiday family show in North America, featuring the Rockettes. The Christmas Spectacular has been performed at Radio City Music Hall for 85 years and more than one million tickets were sold for performances during the 2017 holiday season.
In July 2016, the Company acquired a controlling interest in BCE, the entertainment production company that owns and operates the Boston Calling Music Festival. This was followed in January 2017 by the Company’s purchase of a controlling interest in TAO Group, a hospitality group with globally-recognized entertainment dining and nightlife brands. These companies are part of the MSG Entertainment segment. In November 2017, the Company acquired a 100% controlling interest in Obscura, a creative studio, globally-recognized for its work in designing and developing next-generation immersive experiences. Third-party revenues generated by Obscura and related costs are reflected in the MSG Entertainment segment. Any costs incurred by Obscura that are associated with the Company’s business development initiatives are reported in “Corporate and Other.”
Revenue Sources
Our primary sources of revenue in our MSG Entertainment segment are ticket sales to our audiences for live events that we produce or promote/co-promote and license fees for our venues paid by third-party promoters in connection with events that we do not produce or promote/co-promote. We also generate revenue from other sources, including facility and ticketing fees, concessions, sponsorships and signage, a portion of suite license fees at The Garden, merchandising and tours of our venues. The amount of revenue and expense we record in our MSG Entertainment segment for a given event depends to a significant extent on whether we are promoting or co-promoting the event or are licensing our venue to a third party. In addition, a significant component of the MSG Entertainment segment revenues are generated by the TAO Group through entertainment dining and nightlife offerings, which primarily consist of food and beverage sales.
Ticket Sales and Suite Licenses
For our productions and for entertainment events in our venues that we promote, we recognize revenues from the sale of tickets to our audiences. We sell tickets to the public through our box office, via our web sites and ticketing agencies and through group sales. The amount of revenue we earn from ticket sales depends on the number of shows and the mix of events that we promote, the capacity of the venue used, the extent to which we can sell to fully utilize the capacity and our ticket prices. During the fiscal year 2017, we implemented significant changes to how we sell Christmas Spectacular tickets. By eliminating block sales to third party brokers, we brought a significant number of tickets back in-house, which created the opportunity for more customers to buy tickets to the production directly from us.
The Garden has 21 Event Level suites, 58 Lexus Madison Level suites, and 18 Signature Level suites. Suite licenses at The Garden are generally sold to corporate customers pursuant to multi-year licenses. Under standard suite licenses, the licensees pay an annual license fee, which varies depending on the location of the suite. The license fee includes, for each seat in the suite, tickets for events at The Garden for which tickets are sold to the general public, subject to certain exceptions. In addition, suite holders separately pay for food and beverage service in their suites at The Garden. Revenues from the sale of suite licenses are shared between our MSG Entertainment and MSG Sports segments.
Venue License Fees
For entertainment events held at our venues that we do not produce, promote or co-promote, we typically earn revenue from venue license fees charged to the third-party promoter of the event. The amount of license fees we charge varies by venue, as well as by the size of the production and the number of days utilized, among other factors. Our fees include both the cost of renting space in our venues and costs for providing event staff, such as front-of-house and back-of-house staff, including stagehands, electricians, laborers, box office staff, ushers and security as well as production services such as staging, lighting and sound.
38
Facility and Ticketing Fees
For all public and ticketed entertainment events held in our venues, we also earn additional revenues on substantially all tickets sold, whether we promote/co-promote the event or license the venue to a third party. These revenues are earned in the form of certain fees and assessments, including the facility fee we charge, and vary by venue.
Concessions
We sell food and beverages during substantially all entertainment events held at our venues. In addition to concession-style sales of food and beverages, which represent the majority of our concession revenues, we also generate revenue from catering for our suites at The Garden.
Merchandise
We earn revenues from the sale of merchandise relating to our proprietary productions and other live entertainment events that take place at our venues. The majority of our merchandise revenues are generated through on-site sales during performances of our productions and other live events. We also generate revenues from the sales of our Christmas Spectacular merchandise, such as ornaments and apparel, through traditional retail channels. Typically, revenues from our merchandise sales at our non-proprietary events relate to sales of merchandise provided by the artist, the producer or promoter of the event and are generally subject to a revenue sharing arrangement.
Venue Signage and Sponsorship
We earn revenues through the sale of signage space and sponsorship rights in connection with our venues, productions and other live entertainment events. Signage revenues generally involve the sale of advertising space at The Garden during entertainment events and otherwise in our venues.
Sponsorship rights may require us to use the name, logos and other trademarks of sponsors in our advertising and in promotions for our venues, productions and other live entertainment events. Sponsorship arrangements may be exclusive within a particular sponsorship category or non-exclusive and generally permit a sponsor to use the name, logos and other trademarks of our productions, events and venues in connection with their own advertising and in promotions in our venues or in the community.
Entertainment Dining and Nightlife Offerings
We earn revenues from entertainment dining and nightlife offerings through our operations of the TAO Group’s restaurants and nightlife and hospitality venues. These revenues primarily consist of food and beverage sales and banquet hosting services at TAO Group leased restaurants and nightclubs. In addition, we earn fees from our real estate partners for operating certain of our restaurants and nightclubs.
Expenses
Our MSG Entertainment segment’s principal expenses are payments made to performers, staging costs and day-of-event costs associated with events, and advertising costs. We charge a portion of our actual expenses associated with the ownership, lease, maintenance and operation of our venues, along with a portion of our corporate expenses, to our MSG Entertainment segment. However, the operating results of our MSG Entertainment segment benefit from the fact that no rent is charged to the segment for use of the Company’s owned venues. We do not allocate to our segments depreciation expense on property and equipment related to The Garden, The Hulu Theater at Madison Square Garden or the Forum.
Performer Payments
Our productions are performed by talented actors, dancers, singers, musicians and entertainers. In order to attract and retain this talent, we are required to pay our performers an amount that is commensurate with both their abilities and the demand for their services from other entertainment companies. Our productions typically feature ensemble casts (such as the Rockettes), where most of our performers are paid based on a standard “scale,” pursuant to CBAs we negotiate with the performers’ unions. Certain performers, however, have individually negotiated contracts.
Staging Costs
Staging costs for our proprietary events as well as other events that we promote include the costs of sets, lighting, display technologies, special effects, sound and all of the other technical aspects involved in presenting a live entertainment event. These costs vary substantially depending on the nature of the particular show, but tend to be highest for large-scale theatrical productions, such as the Christmas Spectacular. For concerts we promote, the performer usually provides a fully-produced show. Along with performer salaries, the staging costs associated with a given production are an important factor in the determination of ticket prices.
39
Day-of-Event Costs
For days on which MSG Entertainment stages its productions, promotes an event or provides one of our venues to a third-party promoter under a license fee arrangement, the event is charged the variable costs associated with such event, including box office staff, stagehands, ticket takers, ushers, security, and other similar expenses. In situations where we provide our venues to a third-party promoter under a license fee arrangement, day-of-event costs are typically included in the license fees charged to the promoter.
Marketing and Advertising Costs
We incur significant costs promoting our productions and other events through various advertising campaigns, including advertising on outdoor platforms and in newspapers, on television and radio, and on social and digital platforms. In light of the intense competition for entertainment events, such expenditures are a necessity to drive interest in our productions and encourage members of the public to purchase tickets to our shows.
Entertainment Dining and Nightlife Offerings Costs
Through our ownership in the operations of the TAO Group restaurants and nightlife and hospitality venues, we incur costs for providing food and beverage as well as banquet hosting services to our customers. Our dining and nightlife offering costs primarily include the following:
• | labor costs, consisting of restaurant management salaries, hourly staff payroll and other payroll-related items, including taxes and fringe benefits; |
• | food and beverage costs; |
• | operating costs, consisting of maintenance, utilities, bank and credit card charges, and any other restaurant-level expenses; and |
• | occupancy costs, consisting of both fixed and variable portions of rent, common area maintenance charges, insurance premiums and taxes. |
Factors Affecting Operating Results
The operating results of our MSG Entertainment segment are largely dependent on our ability to attract concerts, family shows and other events to our venues, as well as the continuing popularity of the Christmas Spectacular at Radio City Music Hall. Our MSG Entertainment segment recognized operating losses during the years ended June 30, 2017 and 2016. The operating results for the year ended June 30, 2017 include a $33,629 write-off of the remaining balance of deferred production costs related to the New York Spectacular Starring the Radio City Rockettes (“New York Spectacular”) due to the assessments of the show’s creative direction, timing and scale. The operating results for the year ended June 30, 2016 include a $41,816 write-off of deferred production costs associated with the New York Spectacular due to the creative decision to not include, in the summer of 2016 performances, certain scenes from the previous show of the New York Spectacular.
Our MSG Entertainment segment’s future performance is dependent in part on general economic conditions and the effect of these conditions on our customers. Weak economic conditions may lead to lower demand for our entertainment and nightlife offerings, suite licenses and tickets to our live productions, concerts, family shows and other events, which would also negatively affect concession and merchandise sales, as well as lower levels of sponsorship and venue signage. These conditions may also affect the number of concerts, family shows and other events that take place in the future. An economic downturn could adversely affect our business and results of operations.
The Company continues to explore additional opportunities to expand our presence in the entertainment industry. Any new investment may not initially contribute to operating income, but is intended to become operationally profitable over time. Our results will also be affected by investments in, and the success of, new productions.
40
MSG Sports
Our MSG Sports segment, which represented approximately 50% of our consolidated revenues for the year ended June 30, 2018, owns and operates professional sports franchises, including the New York Knicks (the “Knicks”), a founding member of the NBA, and the New York Rangers (the “Rangers”), one of the “original six” franchises of the NHL. MSG Sports also owns and operates the New York Liberty (the “Liberty”) of the Women’s National Basketball Association, one of the league’s founding franchises, and the Hartford Wolf Pack of the American Hockey League (the “AHL”), which is the primary player development team for the Rangers and is also competitive in its own right in the AHL. Since 2014, the Company has owned and operated an NBA G League team, named the Westchester Knicks, which plays its home games at the Westchester County Center in White Plains, NY. The Knicks and Rangers play their home games at The Garden. The Liberty currently play 15 home games at the Westchester County Center, located in White Plains, NY, in addition to two regular season home games at The Garden. Our professional sports franchises are collectively referred to herein as “our sports teams.” The MSG Sports segment also includes CLG, a premier North American esports organization, and Knicks Gaming, MSG’s franchise that competes in the NBA 2K League. CLG and Knicks Gaming are collectively referred to herein as “our esports teams,” and, together with our sports teams, “our teams.” In addition, our sports business also promotes, produces and/or presents a broad array of live sporting events including professional boxing, college basketball, college hockey, professional bull riding, mixed martial arts, esports, tennis and college wrestling.
Revenue Sources
We earn revenue in our MSG Sports segment from several primary sources: ticket sales and a portion of suite rental fees at The Garden, our share of distributions from NHL and NBA league-wide national and international television contracts and other league-wide revenue sources, venue signage and other sponsorships, concessions and merchandising. Our MSG Sports segment also earns substantial fees from MSG Networks for the local media rights to telecast the games of our professional sports teams. We also earn venue license fees, primarily from the rental of The Garden to third-party promoters or conferences holding sporting events at our arena. The amount of revenue we earn is influenced by many factors, including the popularity and on-court or on-ice performance of our sports teams and general economic conditions. In particular, when our sports teams have strong on-court and on-ice performance, we benefit from increased demand for tickets, potentially greater food and merchandise sales from increased attendance and increased sponsorship opportunities. When our sports teams qualify for the playoffs, we also benefit from the attendance and in-game spending at the playoff games. The year-to-year impact of team performance is somewhat moderated by the fact that a significant portion of our revenue derives from rights fees, suite rental fees and sponsorship and signage revenue, all of which are generally contracted on a multi-year basis. Nevertheless, the long-term performance of our business is tied to the success and popularity of our sports teams and our ability to attract other compelling sports content.
Ticket Sales, Suite Licenses, Venue Licenses, Facility and Ticketing Fees
Ticket sales have historically constituted the largest single source of revenue for our MSG Sports segment. We sell tickets to our sports teams’ home games through season tickets, which are typically held by long-term season subscribers, through group sales, and through single-game tickets, which are purchased by fans either individually or in multi-game packages. The prices of our tickets vary, depending on the sports team and the location of the seats. We generally review and set the price of our tickets before the start of each team’s season. During the fiscal year 2017 we made changes to our ticketing polices, resulting in fewer full season tickets sold and more sales of individual and group tickets, as well as partial season plans.
Revenues from the sale of suite licenses are shared between the MSG Entertainment and MSG Sports segments. See “— MSG Entertainment — Revenue Sources” for further discussion.
In addition to our sports teams’ home games, we also present or host other live sporting events at our venues. When the Company acts as the promoter or co-promoter of such events, the Company typically earns revenues from ticket sales and incurs expenses associated with the event. When these events are promoted by third-party promoters, the Company typically earns venue license fees from the promoter for use of our venues. When licensing our venues, the amount recorded as revenue also includes the event’s variable costs such as the costs of front-of-house and back-of-house staffs, including electricians, laborers, box office staff, ushers, security and building services, which we pass along to the promoter. The number and mix of live sporting events, including whether we are the promoter or co-promoter of an event or license our venues to a third-party promoter, could have a significant impact on the level of revenues and expenses that we record in our MSG Sports segment.
Our MSG Sports segment also earns revenues in the form of certain fees added to ticket prices for events held at our venues, regardless of whether we act as promoter or co-promoter for such events. This currently includes a facility fee the Company charges on tickets it sells to all events at our venues, except for our sports teams’ season tickets and certain other limited exceptions.
41
Media Rights
We earn revenue from the licensing of media rights for our sports teams’ home and away games and also through the receipt of our share of fees paid for league-wide media rights, which are awarded under contracts negotiated and administered by each league.
In connection with the Distribution, the Company and MSG Networks entered into media rights agreements covering the local telecast rights for the Knicks and Rangers. The financial success of our MSG Sports segment is significantly dependent on the rights fees we receive from MSG Networks in connection with the telecast of our Knicks and Rangers games.
National and international telecast arrangements differ by league. Fees paid by telecasters under these arrangements are pooled by each league and then generally shared equally among all teams.
Venue Signage and Sponsorships and Ad Sales Commission
We earn revenues through the sale of signage space at The Garden and sponsorship rights in connection with our teams and certain other sporting events. Our strategy is to develop marketing partnerships with world-class brands by creating customized platforms that achieve our partners’ business objectives. Signage sales generally involve the sale of advertising space within The Garden during our sports teams’ home games and include the sale of signage on the ice and on the boards of the hockey rink during Rangers games, courtside during Knicks and Liberty games, and/or on the various scoreboards and display panels at The Garden. We offer both television camera-visible and non-camera-visible signage space.
Sponsorship rights generally require us to use the name, logos and other trademarks of a sponsor in our advertising and in promotions for our teams and during our sports events. Sponsorship arrangements may be exclusive within a particular sponsorship category or non-exclusive and generally permit a sponsor to use the name, logos and other trademarks of our teams and venues in connection with their own advertising and in promotions in The Garden or in the community.
In connection with the Distribution, we entered into an advertising sales representation agreement with MSG Networks. Pursuant to the agreement, we have the exclusive right and obligation to sell advertising availabilities of MSG Networks. We are entitled to and earn commission revenue on such sales. The expense associated with advertising personnel, which was transferred from MSG Networks in connection with this advertising sales representation agreement, is recognized in selling, general and administrative expenses.
Concessions
We sell food and beverages during all sporting events held at our venues. In addition to concession-style sales of food and beverages, which represent the majority of our concession revenues, we also provide higher-end dining at our full service restaurant and clubs as well as catering for suites at The Garden.
Merchandise
We earn revenues from the sale of our teams’ merchandise both through the in-venue (and in some cases, online) sale of items bearing the logos or other marks of our teams and through our share of sports league distributions of royalties and other revenues from the sports leagues’ licensing of team and sports league trademarks, which revenues are generally shared equally among the teams in the sports leagues. By agreement among the teams, each of the sports leagues in which we operate acts as an agent for the sports teams to license their logos and other marks, as well as the marks of the leagues, subject to certain rights retained by the teams to license these marks within their arenas and the geographic areas in which they operate.
Expenses
The most significant expenses in our MSG Sports segment are player and other team personnel salaries and charges for transactions relating to players for career-ending and season-ending injuries, trades, and waivers and contract termination costs of players and other team personnel, including team executives. We also incur costs for travel, player insurance, league operating assessments (including a 6% NBA assessment on regular season ticket sales), NHL and NBA revenue sharing and NBA luxury tax. We charge a portion of our actual expenses associated with the ownership, lease, maintenance and operation of our venues, along with a portion of our corporate expenses, to our MSG Sports segment. However, the operating results of our MSG Sports segment benefit from the fact that no rent is charged to the segment for use of the Company’s owned venues. We do not allocate to our segments depreciation expense on property and equipment related to The Garden, The Hulu Theater at Madison Square Garden or the Forum.
42
Player Salaries, Escrow System/Revenue Sharing and NBA Luxury Tax
The amount we pay an individual player is determined by negotiation between the player (typically represented by an agent) and us, and is generally influenced by the player’s individual playing statistics, the amounts paid to players with comparable playing statistics by other sports teams and restrictions in the CBAs, including the salary caps and NBA luxury tax. The leagues’ CBAs typically contain restrictions on when players may move between league clubs following expiration of their contracts and what rights their current and former clubs have.
NBA CBA. The NBA CBA expires after the 2023-24 season (although the NBA and the National Basketball Players Association (“NBPA”) each have the right to terminate the CBA following the 2022-23 season). The NBA CBA contains a “soft” salary cap (i.e., a cap on each team’s aggregate player salaries but with certain exceptions that enable teams to pay players more, sometimes substantially more, than the cap).
NBA Luxury Tax. Amounts in this paragraph are in thousands, except for luxury tax rates. The NBA CBA provides for a luxury tax that is applicable to all teams with aggregate player salaries exceeding a threshold that is set prior to each season based upon projected league-wide revenues (as defined under the CBA). The luxury tax rates for teams with aggregate player salaries above such threshold start at $1.50 for each $1.00 of team salary above the threshold up to $5,000 and scale up to $3.25 for each $1.00 of team salary that is from $15,000 to $20,000 over the threshold, and an additional tax rate increment of $0.50 applies for each additional $5,000 (or part thereof) of team salary in excess of $20,000 over the threshold. In addition, for teams that are taxpayers in at least three of four previous seasons, the above tax rates are increased by $1.00 for each increment. Fifty percent of the aggregate luxury tax payments is a funding source for the revenue sharing plan and the remaining 50% of such payments is distributed in equal shares to non-taxpaying teams. The Knicks incurred a luxury tax expense of $8,300, $38,100 and $5,100 with respect to the 2012-13, 2013-14 and 2014-15 seasons, respectively. For the 2015-16, 2016-17 and 2017-18 seasons, the Knicks were not a luxury tax payer and we recorded approximately $2,500, $500 and $2,200, respectively, of luxury tax proceeds from tax-paying teams. Tax obligations for years beyond the 2017-18 season will be subject to contractual player payroll obligations and corresponding NBA luxury tax thresholds. The Company recognizes the estimated amount associated with luxury tax expense or the amount it expects to receive as a non-tax paying team, if applicable, on a straight-line basis over the NBA regular season as a component of direct operating expenses.
NBA Escrow System/Revenue Sharing. The NBA CBA also provides that players collectively receive a designated percentage of league-wide revenues (net of certain direct expenses) as compensation (approximately 51%), and the teams retain the remainder. The percentage of league-wide revenues paid as compensation and retained by the teams does not apply evenly across all teams and, accordingly, the Company may pay its players a higher or lower percentage of the Knicks’ revenues than other NBA teams. Throughout each season, NBA teams withhold 10% of each player’s salary and contribute the withheld amounts to an escrow account. If the league’s aggregate player compensation exceeds the designated percentage of league-wide revenues, some or all of such escrowed amounts are distributed equally to all NBA teams. In the event that the league’s aggregate player compensation is below the designated percentage of league-wide revenues, the teams will remit the shortfall to the NBPA for distribution to the players.
The NBA also has a revenue sharing plan that generally requires the distribution of a pool of funds to teams with below-average net revenues (as defined in the plan), subject to reduction or elimination based on individual team market size and profitability. The plan is funded by a combination of disproportionate contributions from teams with above-average net revenues, subject to certain profit-based limits (each as defined in the plan); 50% of aggregate league-wide luxury tax proceeds (see above); and collective league sources, if necessary. Additional amounts may also be distributed on a discretionary basis, funded by assessments on playoff ticket revenues and through collective league sources.
We record our revenue sharing expense net of the amount we expect to receive from the escrow. Our net provision for these items for the year ended June 30, 2018 was approximately $36,600. The actual amounts for the 2017-18 season may vary significantly from the recorded provision based on actual operating results for the league and all NBA teams for the season and other factors.
NHL CBA. The NHL CBA expires September 15, 2022 (although the NHL and NHL Players’ Association each have the right to terminate the CBA effective following the 2019-20 season). The NHL CBA provides for a “hard” salary cap (i.e., teams may not exceed a stated maximum that has been negotiated for the 2013-14 season and is adjusted each season thereafter based upon league-wide revenues).
43
NHL Escrow System/Revenue Sharing. The NHL CBA provides that each season the players receive as player compensation 50% of that season’s league-wide revenues. Because the aggregate amount to be paid to the players is based upon league-wide revenues and not on a team-by-team basis, the Company may pay its players a higher or lower percentage of the Rangers’ revenues than other NHL teams pay of their own revenues. In order to implement the salary cap system, NHL teams withhold a portion of each player’s salary and contribute the withheld amounts to an escrow account. If the league’s aggregate player compensation for a season exceeds the designated percentage (50%) of that season’s league-wide revenues, the excess is retained by the league. Any such excess funds are distributed to all teams in equal shares.
The NHL CBA also provides for a revenue sharing plan. The plan generally requires the distribution of a pool of funds approximating 6.055% of league-wide revenues to certain qualifying lower-revenue teams and is funded as follows: (a) 50% from contributions by the top ten revenue earning teams (based on pre-season and regular season revenues) in accordance with a formula; (b) then from payments by teams participating in the playoffs, with each team contributing 35% of its gate receipts for each home playoff game; and (c) the remainder from centrally-generated NHL sources. We record our revenue sharing expense net of the amount we expect to receive from the escrow. Our net provisions for these items for the years ended June 30, 2018 and 2017 were approximately $21,100 and $24,800 (including approximately $6,300 related to the 2016-17 season’s playoff), respectively. The actual amounts for the 2016-17 and 2017-18 seasons may vary significantly from the recorded provision based on actual operating results for the league and all NHL teams for the season and other factors.
Other Team Operating Expenses
Our teams also pay expenses associated with day-to-day operations, including for travel, equipment maintenance and player insurance. Direct variable day-of-event costs incurred at The Garden, such as the costs of front-of-house and back-of-house staff, including electricians, laborers, box office staff, ushers, security, and event production are charged to our MSG Sports segment.
Operating costs of the Company’s training center in Greenburgh, NY are also charged to our MSG Sports segment. The operation of the Hartford Wolf Pack is also a net Rangers player development expense for our MSG Sports segment.
As members of the NBA and NHL, the Knicks and Rangers, respectively, are also subject to league assessments. The governing bodies of each league determine the amount of each season’s league assessments that are required from each member team. For the 2017-18 season, the NBA imposed on each team a 6% assessment on regular season ticket revenue.
Our MSG Sports segment also incurs costs associated with VIP amenities provided to certain ticket holders.
Other Expenses
MSG Sports also incurs selling, general and administrative expenses.
Factors Affecting Operating Results
The operating results of our MSG Sports segment are largely dependent on the continued popularity and/or on-ice or on-court competitiveness of our Rangers and Knicks teams, which have a direct effect on ticket sales for the teams’ home games and are each team’s largest single source of revenue, as well as our ability to attract high-caliber sporting events. As with other sports teams, the competitive positions of our sports teams depend primarily on our ability to develop, obtain and retain talented players, for which we compete with other professional sports teams. A significant factor in our ability to attract and retain talented players is player compensation. Our MSG Sports segment results reflect the impact of high costs for player salaries (including NBA luxury tax, if any) and salaries of non-player team personnel. In addition, we have incurred significant charges for costs associated with transactions relating to players on our sports teams for season-ending and career-ending injuries and for trades, waivers and contract terminations of players and other team personnel, including team executives. Waiver and termination costs reflect our efforts to improve the competitiveness of our sports teams. These transactions can result in significant charges as the Company recognizes the estimated ultimate costs of these events in the period in which they occur, although amounts due to these individuals are generally paid over their remaining contract terms. For example, the expense for these items was $27,514, $42,337 and $7,484 for fiscal years 2018, 2017 and 2016, respectively. These expenses add to the volatility of the results of our MSG Sports segment. We expect to continue to pursue opportunities to improve the overall quality of our sports teams and our efforts may result in continued significant expenses and charges. Such expenses and charges may result in future operating losses for our MSG Sports segment although it is not possible to predict their timing or amount. Our MSG Sports segment’s performance has been, and may in the future be, impacted by work stoppages. See “Part I — Item 1A. Risk Factors— General Risks — Organized Labor Matters May Have a Material Negative Effect on Our Business and Results of Operations.”
44
In addition to our MSG Sports segment’s future performance being dependent upon the continued popularity and/or on-ice or on-court competitiveness of our Rangers and Knicks teams, it is also dependent on general economic conditions, in particular those in the New York City metropolitan area, and the effect of these conditions on our customers. An economic downturn could adversely affect our business and results of operations as it may lead to lower demand for suite licenses and tickets to the games of our sports teams, which would also negatively affect merchandise and concession sales, as well as decrease levels of sponsorship and venue signage revenues. These conditions may also affect the number of other live sporting events that this segment is able to present.
Factors Affecting Operating Results from Acquisitions
TAO Group’s Operating Results
The Company completed the TAO Group acquisition on January 31, 2017. TAO Group’s financial statements are not available within the time constraints the Company requires to ensure the financial accuracy of the operating results. Therefore, the Company records TAO Group’s operating results in its consolidated statements of operations under the MSG Entertainment segment on a three-month lag basis. As a result, TAO Group’s related operating results for the year ended June 30, 2018 are for the period from March 27, 2017 to April 1, 2018. TAO Group’s related operating results for the year ended June 30, 2017 are for the period from February 1, 2017 to March 26, 2017. The Company’s results for the year ended June 30, 2016 do not include any of TAO Group’s operating results. In addition, the Company’s consolidated balance sheets as of June 30, 2018 and 2017 reflects the financial position of TAO Group as of April 1, 2018 and March 26, 2017, respectively. All disclosures related to TAO Group’s financial position are therefore also reported as of April 1, 2018 and March 26, 2017, as applicable.
CLG’s Operating Results
The results of operations of the Company and the MSG Sports segment for the year ended June 30, 2018 include CLG’s results of operations from the date of acquisition, which was July 28, 2017. The Company’s results for the years ended June 30, 2017 and 2016 do not include any of CLG’s operating results.
Obscura’s Operating Results
The results of operations of the Company and the MSG Entertainment segment for the year ended June 30, 2018 include Obscura’s results of operations from the date of acquisition, which was November 20, 2017. The Company’s results for the year ended June 30, 2017 and 2016 do not include any of Obscura’s operating results. Third-party revenues generated by Obscura and related costs are reflected in the MSG Entertainment segment. Any costs incurred by Obscura that are associated with the Company’s business development initiatives are reported in “Corporate and Other.”
BCE’s Operating Results
The results of operations of the Company and the MSG Entertainment segment for the years ended June 30, 2018 and 2017 include BCE ’s results of operations from the date of acquisition, which was July 1, 2016. The Company’s results for the year ended June 30, 2016 do not include any of BCE ’s operating results.
Corporate Expenses and Venue Operating Costs
The Company allocates certain corporate costs and its performance venues operating expenses to both reportable segments. Allocated performance venue operating expenses include the non-event related costs of operating the Company’s performance venues, and include such costs as rent for the Company’s leased venues, real estate taxes, insurance, utilities, repairs and maintenance, and labor related to the overall management of the venues. Depreciation expense on property and equipment related to The Garden, The Hulu Theater at Madison Square Garden and the Forum is not allocated to the reportable segments.
Amounts that we collect for ticket sales, sponsorships and suite rentals in advance are recorded as deferred revenue and are recognized as revenues when earned for both accounting and tax purposes. In connection with the reorganization transactions related to the Distribution, the tax recognition on most of these deferred revenues was accelerated to the date of the reorganization, rather than being recognized over the course of the year ending June 30, 2016. The applicable tax on the acceleration of such deferred revenue at the time of the Distribution was approximately $152,000. Such tax was paid by MSG Networks and not the Company. The Company will not reimburse MSG Networks for the payment of such taxes. As a result, for the year ended June 30, 2016, approximately $348,000 of taxable revenue that would have been reflected on the Company’s income tax returns were instead reported on MSG Networks’ income tax returns, and consequently, the Company generated a taxable loss for the year ended June 30, 2016.
45
Purchase Accounting Adjustments
In connection with the BCE, TAO Group, CLG and Obscura acquisitions in the past two fiscal years (“Recent Business Acquisitions”), the Company recorded certain fair value adjustments related to acquired assets and liabilities in accordance with Accounting Standards Codification (“ASC”) Topic 805, Business Combinations. For the Company’s Recent Business Acquisitions, the Company recognized fair value adjustments primarily for (i) recognition of intangible assets such as trade names, venue management contracts, favorable leases, and festival rights, (ii) step-up of property and equipment, (iii) step-up of inventory, (iv) unfavorable lease obligation, and (v) goodwill. The aforementioned fair value adjustments, except for goodwill, will be expensed as incremental non-cash expenses in the Company’s consolidated statements of operations based on their estimated useful lives (“Purchase Accounting Adjustments”). The Company does not allocate any Purchase Accounting Adjustments to the reporting segments and reports any Purchase Accounting Adjustments as reconciliation items in reporting segment operating results. See “Part II — Item 8. Financial Statements and Supplementary Data — Consolidated Financial Statements — Notes to Consolidated Financial Statements — Note 3. Acquisitions” for more information on the Recent Business Acquisitions and “Part II — Item 8. Financial Statements and Supplementary Data — Consolidated Financial Statements — Notes to Consolidated Financial Statements — Note 18. Segment Information” for more information on the presentation of Purchase Accounting Adjustments.
Investments in Nonconsolidated Affiliates
The Company’s investments in nonconsolidated affiliates primarily include investments in Brooklyn Bowl Las Vegas, LLC (“BBLV”), Azoff MSG Entertainment LLC (“AMSGE”), Tribeca Enterprises LLC (“Tribeca Enterprises”), and Fuse Media LLC (“Fuse Media”), which are accounted for under the equity method of accounting.
In August 2013, the Company acquired an interest in BBLV. In March 2014, BBLV opened a new venue in Las Vegas which brings together live music, bowling and a restaurant. As a result of BBLV’s liquidity position, the Company evaluated whether or not an impairment of its investment had occurred as of December 31, 2014. This evaluation resulted in the Company recording a pre-tax non-cash impairment charge of $23,600 to write-off the remaining equity portion of its investment in BBLV.
In September 2013, the Company acquired a 50% interest in AMSGE. The AMSGE entity owns and operates businesses in the entertainment industry and is currently focused on music management, performance rights, comedy and productions, and strategic marketing. As of June 30, 2018, the Company’s investment in AMSGE was $101,369. In addition, as of June 30, 2018, AMSGE had outstanding loans of $63,500 under a $100,000 credit facility with the Company.
In March 2014, the Company acquired a 50% interest in Tribeca Enterprises, the company that owns and operates the Tribeca Film Festival and certain other businesses. Tribeca Enterprises’ businesses also include Tribeca Studios, a branded entertainment content business that has produced award-winning stories, and year-round live events. As of June 30, 2018, the Company’s investment in Tribeca Enterprises was $8,007. The Company provides a $17,500 revolving credit facility to Tribeca Enterprises. As of June 30, 2018, the $17,500 revolving credit facility was fully drawn. In addition, Tribeca Enterprises also owed $2,025 of payments-in-kind (“PIK”) interest as of June 30, 2018. PIK interest owed does not reduce availability under the revolving credit facility.
In July 2014, MSG Networks sold Fuse to Fuse Media, Inc., and as part of the transaction MSG Networks received a 15% equity interest in Fuse Media which was transferred to the Company in connection with the Distribution. In the third quarter of fiscal year 2017, certain Fuse Media warrant holders notified Fuse Media of their intent to exercise certain put options (which Fuse Media disputed). The purported exercise of the put options triggered an assessment of Fuse Media’s fair value. This assessment, which was performed during the third quarter of fiscal 2017, resulted in unfavorable fair value measurements of Fuse Media. As a result, the Company evaluated whether or not an other-than-temporary impairment of its investment had occurred as of the third quarter of fiscal 2017. This evaluation resulted in the Company recording a pre-tax non-cash impairment charge of $20,613 to write off the carrying value of its equity investment in Fuse Media, which is reflected in loss in equity method investments in the accompanying consolidated statements of operations for the year ended June 30, 2017.
In addition to the investments discussed above, the Company also has other investments in various sports and entertainment companies and related technologies, accounted for either under the cost method or equity method. See Note 6 to the consolidated financial statements included in Item 8 of this Annual Report on Form 10-K for more information on our investments in nonconsolidated affiliates.
In August 2016, the Company acquired a common equity stake of approximately 12% in Townsquare Media, Inc., a leading media, entertainment and digital marketing solutions company, which is accounted for under available-for-sale securities. See Note 10 to the consolidated financial statements included in Item 8 of this Annual Report on Form 10-K for more information on our investment in available-for-sale securities.
46
Results of Operations
Comparison of the Year Ended June 30, 2018 versus the Year Ended June 30, 2017
Consolidated Results of Operations
The table below sets forth, for the periods presented, certain historical financial information.
Years Ended June 30, | Change | ||||||||||||||
2018 | 2017 | Amount | Percentage | ||||||||||||
Revenues | $ | 1,559,095 | $ | 1,318,452 | $ | 240,643 | 18 | % | |||||||
Direct operating expenses | 945,428 | 861,381 | 84,047 | 10 | % | ||||||||||
Selling, general and administrative expenses | 472,305 | 410,039 | 62,266 | 15 | % | ||||||||||
Depreciation and amortization | 122,486 | 107,388 | 15,098 | 14 | % | ||||||||||
Operating income (loss) | 18,876 | (60,356 | ) | 79,232 | NM | ||||||||||
Other income (expense): | |||||||||||||||
Loss in equity method investments | (7,770 | ) | (29,976 | ) | 22,206 | 74 | % | ||||||||
Interest income, net | 6,167 | 7,647 | (1,480 | ) | (19 | )% | |||||||||
Miscellaneous income | 303 | 1,492 | (1,189 | ) | (80 | )% | |||||||||
Income (loss) from operations before income taxes | 17,576 | (81,193 | ) | 98,769 | NM | ||||||||||
Income tax benefit | 116,872 | 4,404 | 112,468 | NM | |||||||||||
Net income (loss) | 134,448 | (76,789 | ) | 211,237 | NM | ||||||||||
Less: Net income (loss) attributable to nonredeemable noncontrolling interests | (6,518 | ) | 304 | (6,822 | ) | NM | |||||||||
Less: Net loss attributable to redeemable noncontrolling interests | (628 | ) | (4,370 | ) | 3,742 | 86 | % | ||||||||
Net income (loss) attributable to The Madison Square Garden Company’s stockholders | $ | 141,594 | $ | (72,723 | ) | $ | 214,317 | NM | |||||||
NM — Percentage is not meaningful
The following is a summary of changes in segments’ operating results for the year ended June 30, 2018 as compared to the prior year.
Changes attributable to | Revenues | Direct operating expenses | Selling, general and administrative expenses | Depreciation and amortization | Operating income (loss) | |||||||||||||||
MSG Entertainment segment (a) | $ | 274,258 | $ | 104,938 | $ | 72,433 | $ | 7,176 | $ | 89,711 | ||||||||||
MSG Sports segment (a) | (33,331 | ) | (15,896 | ) | (23,027 | ) | (1,838 | ) | 7,430 | |||||||||||
Corporate and Other | — | 120 | 12,564 | (5,222 | ) | (7,462 | ) | |||||||||||||
Purchase accounting adjustments | — | (4,831 | ) | 223 | 14,982 | (10,374 | ) | |||||||||||||
Inter-segment eliminations | (284 | ) | (284 | ) | 73 | — | (73 | ) | ||||||||||||
$ | 240,643 | $ | 84,047 | $ | 62,266 | $ | 15,098 | $ | 79,232 | |||||||||||
(a) See “Business Segment Results” for a more detailed discussion of the operating results of our segments.
47
Direct operating expenses primarily include:
• | compensation expense for our sports teams’ players and certain other team personnel; |
• | cost of team personnel transactions for season-ending player injuries (net of anticipated insurance recoveries), trades, and waivers/contract termination costs of players and other team personnel; |
• | NBA luxury tax, NBA and NHL revenue sharing and league assessments for the MSG Sports segment; |
• | event costs related to the presentation, production and marketing of our live entertainment and other live sporting events; |
• | venue lease, maintenance and other operating expenses; |
• | the cost of concessions, merchandise and food and beverage sold at our venues; and |
• | restaurant operating expenses, inclusive of labor costs. |
In connection with the purchase price allocation of the TAO Group acquisition on January 31, 2017, the inventory value was increased by $8,705 and was fully expensed to direct operating expenses for the year ended June 30, 2017 as the related inventory was consumed. In addition, the direct operating expenses for the year ended June 30, 2018 principally reflect the amortization of favorable leases in connection with the TAO Group acquisition.
Selling, general and administrative expenses
Selling, general and administrative expenses primarily consist of administrative costs, including compensation, reorganization costs, professional fees, as well as sales and marketing costs, including non-event related advertising expenses.
Selling, general and administrative expenses in Corporate and Other for the year ended June 30, 2018 increased $12,564, or 16%, to $92,166 as compared to the prior year. The increase was primarily due to higher employee compensation and related benefits, as well as the inclusion of Obscura expenses associated with the Company’s business development initiatives. The increase was partially offset by a management fee earned for providing management and strategic services to TAO Group (see “— Factors Affecting Operating Results from Acquisitions — TAO Group’s Operating Results” for further discussion), which is eliminated in the Company’s consolidated results of operations presented above, as well as certain favorable adjustments related to contingent payments for the Company’s business acquisitions.
Depreciation and amortization
Depreciation and amortization for the year ended June 30, 2018 increased $15,098, or 14%, to $122,486 as compared to the prior year primarily due to purchase accounting adjustments and the inclusion of depreciation and amortization expense related to property and equipment associated with the business acquisitions (see “— Factors Affecting Operating Results from Acquisitions” for further discussion), partially offset by certain assets being fully depreciated and amortized.
Operating loss - Corporate and Other
Operating loss in Corporate and Other for the year ended June 30, 2018 increased $7,462, or 5%, to $170,642 as compared to the prior year. The increase was primarily due to higher selling, general and administrative expenses as discussed above, partially offset by lower depreciation and amortization as a result of certain assets being fully depreciated and amortized. See Note 18 to the consolidated financial statements included in Item 8 of this Annual Report on Form 10-K for discussion of depreciation and amortization under Corporate and Other.
Loss in equity method investments
Loss in equity method investments for the year ended June 30, 2018 improved $22,206, or 74%, to a loss of $7,770 as compared to the prior year. The year-over-year improvement is primarily due to a pre-tax non-cash impairment charge of $20,613 recorded during the prior year to write off the carrying value of our equity investment in Fuse Media.
Interest income, net
Net interest income for the year ended June 30, 2018 decreased $1,480, or 19%, to $6,167 as compared to the prior year primarily due to interest expense incurred under the TAO Term Loan Facility. See “— Factors Affecting Operating Results from Acquisitions — TAO Group’s Operating Results” for further discussion. The decrease was partially offset by higher interest income earned by the Company as a result of higher interest rates and a change in investment mix. In addition, during the year ended June 30, 2018, the Company recognized interest income of $938, which was received in connection with the repayment of a loan receivable from one of the Company’s nonconsolidated affiliates that was on a nonaccrual status.
48
Miscellaneous income
Miscellaneous income in the current year principally consists of a dividend received from the Company’s investment in Townsquare Media Inc., which is classified as available-for-sale securities (see Note 10 to the consolidated financial statements included in Item 8 of this Annual Report on Form 10-K). Miscellaneous income in the prior year consists principally of the recovery of certain claims in connection with a third-party bankruptcy proceeding.
Income taxes
On December 22, 2017, new tax legislation, commonly referred to as the Tax Cuts and Jobs Act, was enacted, which significantly changed the existing U.S. tax laws, including a reduction in the corporate Federal income tax rate from 35% to 21% effective January 1, 2018. During the second quarter of fiscal year 2018, the Company was required to recognize the effect of tax law changes in the period of enactment even though certain key aspects of the new law became effective January 1, 2018. The Company used a blended statutory Federal income tax rate of 28% based upon the number of days that it will be taxed at the former rate of 35% and the number of days it will be taxed at the new rate of 21% to calculate its most recent effective tax rate.
Income tax benefit for the year ended June 30, 2018 was $116,872 and income tax benefit for the year ended June 30, 2017 was $4,404.
Income tax benefit for the year ended June 30, 2018 of $116,872 differs from the income tax expense derived from applying the blended statutory Federal rate of 28% to pretax income primarily as a result of a deferred income tax benefit of $113,494 related to the revaluation of the Company’s deferred tax assets and liabilities under provisions contained in the new tax legislation, of which (i) $51,015 was due to the reduction of net deferred tax liabilities in connection with the lower Federal income tax rate of 21%, and (ii) $62,479 was due to a reduction in the valuation allowance attributable to the new rules, which provide that future Federal net operating losses have an unlimited carry-forward period. These rules on future Federal net operating losses allow the Company to recognize a portion of its unrecognized deferred tax assets for future deductible items. Other decreases to the statutory rate include $13,211 of income tax benefit related to a decrease in the valuation allowance, which offsets the income tax expense attributable to most of the operating income, and $1,974 of income tax benefit related to the vesting of restricted stock units. These decreases were partially offset by (i) $1,800 of tax expense related to state and local income taxes (net of Federal benefit), (ii) $1,998 of tax expense primarily related to non-deductible expenses, (iii) $2,006 of tax expense related to consolidated partnership book income attributable to non-controlling interest, (iv) $846 of tax expense related to a change in state tax rates and (v) $223 of other.
Income tax benefit for the year ended June 30, 2017 of $4,404 differs from the income tax expense derived from applying the statutory Federal rate of 35% to pretax income primarily as a result of (i) an increase of $30,697 in recorded federal and state valuation allowances, (ii) tax expense of $3,449 related to non-deductible expenses, (iii) the tax impact of consolidated partnership book income attributable to non-controlling interests of $1,414, (iv) deferred expense of $1,329 based on tax amortization on indefinite lived intangibles that are not available as a source of taxable income to support the realization of deferred tax assets, and (v) expense of $672 recorded due to a state rate change computed as a result of filed state tax returns. This tax expense is offset by (i) $6,716 of state tax benefit (net of Federal effect), (ii) $6,477 of tax benefit related to other comprehensive income gains recorded in continuing operations and (iii) $354 of other.
Adjusted operating income
The Company evaluates segment performance based on several factors, of which the key financial measure is their operating income (loss) before (i) depreciation, amortization and impairments of property and equipment and intangible assets, (ii) share-based compensation expense or benefit, (iii) restructuring charges or credits, and (iv) gains or losses on sales or dispositions of businesses, which is referred to as adjusted operating income (loss), a non-GAAP measure. In addition to excluding the impact of items discussed above, the impact of purchase accounting adjustments related to business acquisitions is also excluded in evaluating the Company’s consolidated adjusted operating income (loss). The Company has presented the components that reconcile operating income (loss) to adjusted operating income (loss).
49
The following is a reconciliation of operating income (loss) to adjusted operating income:
________________
Years Ended June 30, | Change | ||||||||||||||
2018 | 2017 | Amount | Percentage | ||||||||||||
Operating income (loss) | $ | 18,876 | $ | (60,356 | ) | $ | 79,232 | NM | |||||||
Share-based compensation | 47,563 | 41,129 | |||||||||||||
Depreciation and amortization (a) | 122,486 | 107,388 | |||||||||||||
Other purchase accounting adjustments (b) | 4,858 | 9,466 | |||||||||||||
Adjusted operating income | $ | 193,783 | $ | 97,627 | $ | 96,156 | 98 | % | |||||||
(a) | Depreciation and amortization included purchase accounting adjustments of $18,134 and $3,152 for the years ended June 30, 2018 and 2017, respectively. |
(b) | Other purchase accounting adjustments for the year ended June 30, 2018 primarily included the amortization of favorable leases in connection with the TAO Group acquisition. Other purchase accounting adjustments for the year ended June 30, 2017 primarily included an inventory adjustment of $8,705 that was expensed to direct operating expenses and associated with the TAO Group acquisition on January 31, 2017 as the related inventory was consumed. |
Adjusted operating income for the year ended June 30, 2018 increased $96,156, or 98%, to $193,783 as compared to the prior year. The net increase is attributable to the following:
Increase in adjusted operating income of the MSG Entertainment segment | $ | 95,064 | |
Increase in adjusted operating income of the MSG Sports segment | 6,542 | ||
Other net decreases | (5,377 | ) | |
Inter-segment eliminations | (73 | ) | |
$ | 96,156 | ||
Other net decreases were primarily due to higher employee compensation and related benefits, excluding share-based compensation expense, and the inclusion of Obscura expenses associated with the Company’s business development initiatives partially offset by a management fee earned for providing management and strategic services to TAO Group (see “— Factors Affecting Operating Results from Acquisitions — TAO Group’s Operating Results” for further discussion), which is eliminated in the Company’s consolidated results of operations presented above. These increases were offset by certain favorable adjustments related to contingent payments for the Company’s business acquisitions.
Net income (loss) attributable to redeemable and nonredeemable noncontrolling interests
For the year ended June 30, 2018, the Company recorded net loss attributable to redeemable noncontrolling interests of $628 and a net loss attributable to nonredeemable noncontrolling interests of $6,518 as compared to $4,370 of net loss attributable to redeemable noncontrolling interests and $304 of net income attributable to nonredeemable noncontrolling interests for the year ended June 30, 2017. These amounts represent the share of net income (loss) of TAO Group, BCE, and CLG that are not attributable to the Company. In addition, the net income (loss) attributable to redeemable and nonredeemable noncontrolling interests includes a proportional share of expenses related to purchase accounting adjustments. See “— Introduction — Factors Affecting Operating Results from Acquisitions” for further discussion.
50
Business Segment Results
MSG Entertainment
The table below sets forth, for the periods presented, certain historical financial information and a reconciliation of operating income (loss) to adjusted operating income for the Company’s MSG Entertainment segment.
Years Ended June 30, | Change | ||||||||||||||
2018 | 2017 | Amount | Percentage | ||||||||||||
Revenues | $ | 780,726 | $ | 506,468 | $ | 274,258 | 54 | % | |||||||
Direct operating expenses | 483,263 | 378,325 | 104,938 | 28 | % | ||||||||||
Selling, general and administrative expenses | 192,929 | 120,496 | 72,433 | 60 | % | ||||||||||
Depreciation and amortization | 18,515 | 11,339 | 7,176 | 63 | % | ||||||||||
Operating income (loss) | $ | 86,019 | $ | (3,692 | ) | $ | 89,711 | NM | |||||||
Reconciliation to adjusted operating income: | |||||||||||||||
Share-based compensation | 12,500 | 14,323 | |||||||||||||
Depreciation and amortization | 18,515 | 11,339 | |||||||||||||
Adjusted operating income | $ | 117,034 | $ | 21,970 | $ | 95,064 | NM | ||||||||
—————
NM — Percentage is not meaningful
Revenues
Revenues for the year ended June 30, 2018 increased $274,258, or 54%, to $780,726 as compared to the prior year. The net increase is attributable to the following:
Inclusion of revenues associated with entertainment dining and nightlife offerings | $ | 208,629 | |
Increase in event-related revenues at The Garden | 28,390 | ||
Increase in event-related revenues at Radio City Music Hall, excluding the Christmas Spectacular and the New York Spectacular | 14,638 | ||
Increase in event-related revenues at the Forum | 11,395 | ||
Increase in event-related revenues at The Hulu Theater at Madison Square Garden | 6,912 | ||
Increase in event-related revenues at The Chicago Theatre | 6,031 | ||
Increase in revenues from the presentation of the Christmas Spectacular | 5,055 | ||
Increase in venue-related sponsorship and signage and suite rental fee revenues | 1,140 | ||
Decrease in revenues from the presentation of the New York Spectacular as a result of no scheduled performances in the current year | (11,483 | ) | |
Decrease in BCE event-related revenues | (2,712 | ) | |
Other net increases, primarily due to the inclusion of revenue associated with the acquisition of Obscura | 6,263 | ||
$ | 274,258 | ||
The inclusion of revenues associated with entertainment dining and nightlife offerings is the result of the acquisition of a 62.5% interest in TAO Group on January 31, 2017, and primarily reflects revenues generated from food and beverage sales. TAO Group’s operating results are recorded in the Company’s consolidated statements of operations on a three-month lag basis. As a result, TAO Group’s related revenues for fiscal year 2018 are for the period from March 27, 2017 to April 1, 2018, as compared to TAO Group’s related revenues for fiscal year 2017, which are for the period from February 1, 2017 to March 26, 2017. See “— Introduction — Factors Affecting Operating Results from Acquisitions — TAO Group’s Operating Results” for further discussion.
The increase in event-related revenues at The Garden was due to a change in the mix of events (including the impact of a large-scale event held during the current year) and additional events held at the venue during the current year as compared to the prior year.
The increase in event-related revenues at Radio City Music Hall, excluding the Christmas Spectacular and the New York Spectacular, was primarily due to additional events held at the venue during the current year as compared to the prior year.
51
The increase in event-related revenues at the Forum was due to a change in the mix of events and an additional event held at the venue during the current year as compared to the prior year.
The increase in event-related revenues at The Hulu Theater at Madison Square Garden was primarily due to a change in the mix of events partially offset by fewer events held at the venue during the current year as compared to the prior year.
The increase in event-related revenues at The Chicago Theatre was primarily due to additional events held at the venue during the current year as compared to the prior year.
The increase in revenues from the presentation of the Christmas Spectacular was primarily due to higher ticket-related revenue, mainly as a result of higher average ticket prices and the impact of additional scheduled performances, partially offset by a decrease in average per-show paid attendance in the current year as compared to the prior year. The Company had 200 scheduled performances of the production this holiday season as compared to 197 scheduled performances in fiscal year 2017. For the 2017 holiday season, more than one million tickets were sold, representing a low single digit percentage decrease as compared to the 2016 holiday season.
The increase in venue-related sponsorship and signage and suite rental fee revenues was due to higher suite rental fee revenue mainly driven by contractual rate increases.
The decrease in revenues from the presentation of the New York Spectacular was driven by no scheduled performances in the current year as compared to 56 scheduled performances presented in the prior year. This was a result of the Company’s decision to suspend the planned 2017 presentation announced in February 2017.
The decrease in BCE event-related revenues was primarily due to a decrease in ticket-related revenue.
Direct operating expenses
Direct operating expenses for the year ended June 30, 2018 increased $104,938, or 28%, to $483,263 as compared to the prior year. The net increase is attributable to the following:
Inclusion of direct operating expenses associated with entertainment dining and nightlife offerings | $ | 112,958 | |
Increase in event-related direct operating expenses at The Garden | 15,273 | ||
Increase in event-related direct operating expenses at the Forum | 7,919 | ||
Increase in event-related direct operating expenses at Radio City Music Hall, excluding the Christmas Spectacular and the New York Spectacular | 4,391 | ||
Increase in BCE event-related direct operating expenses | 3,954 | ||
Increase in event-related direct operating expenses at The Chicago Theatre | 3,842 | ||
Increase in venue operating costs | 3,086 | ||
Increase in event-related direct operating expenses at The Hulu Theater at Madison Square Garden | 2,429 | ||
Increase in direct operating expenses associated with the presentation of the Christmas Spectacular | 1,386 | ||
Decrease in direct operating expenses associated with the presentation of the New York Spectacular as a result of no scheduled performances in the current year | (56,196 | ) | |
Other net increases, principally the inclusion of direct expenses related to Obscura’s third-party business | 5,896 | ||
$ | 104,938 | ||
The inclusion of direct operating expenses associated with entertainment dining and nightlife offerings is the result of the acquisition of a 62.5% interest in TAO Group on January 31, 2017, and primarily reflects costs associated with food and beverage sales, inclusive of labor costs, as well as venue-related operating expenses. TAO Group’s operating results are recorded in the Company’s consolidated statements of operations on a three-month lag basis. As a result, TAO Group’s related direct operating expenses for fiscal year 2018 are for the period from March 27, 2017 to April 1, 2018, as compared to TAO Group’s related direct operating expenses for fiscal year 2017, which are for the period from February 1, 2017 to March 26, 2017. See “— Introduction — Factors Affecting Operating Results from Acquisitions — TAO Group’s Operating Results” for further discussion.
The increase in event-related direct operating expenses at The Garden was due to a change in the mix of events (including the impact of a large-scale event held during the current year) and additional events held at the venue during the current year as compared to the prior year.
52
The increase in event-related direct operating expenses at the Forum was due to a change in the mix of events as well as one additional event held at the venue during the current year as compared to the prior year.
The increase in event-related direct operating expenses at Radio City Music Hall, excluding the Christmas Spectacular and the New York Spectacular, was due to additional events partially offset by a change in the mix of events held at the venue during the current year as compared to the prior year.
The increase in BCE event-related direct operating expenses was due to higher costs related to the Boston Calling Music Festival in the current year.
The increase in event-related direct operating expenses at The Chicago Theatre was primarily due to additional events held at the venue during the current year as compared to the prior year.
The increase in venue operating costs was primarily due to higher labor-related costs at our venues during the current year as compared to the prior year.
The increase in event-related direct operating expenses at The Hulu Theater at Madison Square Garden was due to a change in the mix of events partially offset by fewer events held at the venue during the current year as compared to the prior year.
The increase in direct operating expenses associated with the presentation of the Christmas Spectacular was primarily due to higher labor costs and an increase in deferred production cost amortization, partially offset by lower marketing expenses during the current year as compared to the prior year. The Company had 200 scheduled performances of the production this holiday season as compared to 197 scheduled performances in fiscal year 2017.
The decrease in direct operating expenses associated with the presentation of the New York Spectacular was driven by no scheduled performances in the current year as compared to 56 scheduled performances presented in the prior year. This was a result of the Company’s decision to suspend the planned 2017 presentation announced in February 2017.
Selling, general and administrative expenses
Selling, general and administrative expenses for the year ended June 30, 2018 increased $72,433, or 60%, to $192,929 as compared to the prior year mainly due to (i) inclusion of TAO Group’s selling, general and administrative costs, including a management fee incurred by TAO Group payable to the Company for providing management and strategic services and, to a lesser extent, (ii) higher professional fees and (iii) an increase in corporate general and administrative costs. See “— Introduction — Factors Affecting Operating Results from Acquisitions — TAO Group’s Operating Results” for further discussion.
Depreciation and amortization
Depreciation and amortization for the year ended June 30, 2018 increased $7,176, or 63%, to $18,515 as compared to the prior year primarily due to the inclusion of depreciation and amortization expenses for TAO Group’s property and equipment before the purchase accounting adjustments. See “— Introduction — Factors Affecting Operating Results from Acquisitions — TAO Group’s Operating Results” for further discussion.
Operating income (loss)
Operating income for the year ended June 30, 2018 improved $89,711 to $86,019 as compared to the prior year due to higher revenues, partially offset by increases in direct operating expenses, selling, general and administrative expenses and depreciation and amortization expenses, as discussed above.
Adjusted operating income
Adjusted operating income for the year ended June 30, 2018 increased $95,064 to $117,034 as compared to the prior year due to higher revenues, partially offset by increases in direct operating expenses and selling, general and administrative expenses, as discussed above, excluding share-based compensation expense.
53
MSG Sports
The table below sets forth, for the periods presented, certain historical financial information and a reconciliation of operating income to adjusted operating income for the Company’s MSG Sports segment.
Years Ended June 30, | Change | ||||||||||||||
2018 | 2017 | Amount | Percentage | ||||||||||||
Revenues | $ | 778,653 | $ | 811,984 | $ | (33,331 | ) | (4 | )% | ||||||
Direct operating expenses | 457,694 | 473,590 | (15,896 | ) | (3 | )% | |||||||||
Selling, general and administrative expenses | 186,914 | 209,941 | (23,027 | ) | (11 | )% | |||||||||
Depreciation and amortization | 7,481 | 9,319 | (1,838 | ) | (20 | )% | |||||||||
Operating income | $ | 126,564 | $ | 119,134 | $ | 7,430 | 6 | % | |||||||
Reconciliation to adjusted operating income: | |||||||||||||||
Share-based compensation | 15,498 | 14,548 | |||||||||||||
Depreciation and amortization | 7,481 | 9,319 | |||||||||||||
Adjusted operating income | $ | 149,543 | $ | 143,001 | $ | 6,542 | 5 | % | |||||||
Revenues
Revenues for the year ended June 30, 2018 decreased $33,331, or 4%, to $778,653 as compared to the prior year. The net decrease is attributable to the following:
Decrease in professional sports teams’ playoff related revenues | $ | (29,333 | ) |
Decrease in revenues from league distributions | (24,820 | ) | |
Decrease in event-related revenues from other live sporting events | (10,817 | ) | |
Increase in professional sports teams’ sponsorship and signage revenues and ad sales commission | 12,454 | ||
Increase in local media rights fees from MSG Networks | 6,528 | ||
Increase in professional sports teams’ pre/regular season ticket-related revenues | 5,640 | ||
Increase in suite rental fee revenues | 4,764 | ||
Other net increases, inclusive of certain revenues from CLG | 2,253 | ||
$ | (33,331 | ) | |
The decrease in professional sports team’s playoff related revenues was primarily due to the Rangers playing six home playoff games as the team advanced to the second round of the playoffs in the prior year versus not qualifying for playoffs in the current year.
The decrease in revenues from league distributions primarily reflects an NHL expansion fee of $15,500 and approximately $15,000 of non-recurring distributions from the NHL and NBA, which were both recorded by the Company in fiscal year 2017. These decreases were partially offset by other net increases, inclusive of league distributions related to CLG, which was acquired on July 28, 2017.
The decrease in event-related revenues from other live sporting events was due to a change in the mix of events held during the current year as compared to the prior year and one event that generated lower revenue during the current year as compared to the prior year.
The increase in professional sports teams’ sponsorship and signage revenues and ad sales commissions was primarily due to sales of new sponsorship and signage inventory, increased sales of existing sponsorship and signage inventory and the impact of a marketing partner, upon renewal of its agreement, shifting its marketing partnership spend from a combination of entertainment and sports entirely to sports.
The increase in local media rights fees from MSG Networks was primarily due to contractual rate increases.
The increase in professional sports teams’ pre/regular season ticket-related revenues was primarily due to higher average Rangers per-game revenue, partially offset by lower average Liberty and Knicks per-game revenue.
The increase in suite rental fee revenue was primarily due to contractual rate increases.
54
Direct operating expenses
Direct operating expenses for the year ended June 30, 2018 decreased $15,896, or 3%, to $457,694 as compared to the prior year. The net decrease is attributable to the following:
Decrease in professional sports teams’ playoff related expenses | $ | (14,290 | ) |
Decrease in event-related expenses associated with other live sporting events | (5,612 | ) | |
Decrease in team personnel compensation | (3,726 | ) | |
Decrease in net provisions for NBA and NHL revenue sharing expense (excluding playoffs) and NBA luxury tax | (3,590 | ) | |
Increase in net provisions for certain team personnel transactions | 5,535 | ||
Increase in other team operating expenses | 4,209 | ||
Other net increases | 1,578 | ||
$ | (15,896 | ) | |
The decrease in professional sports teams’ playoff related expenses was primarily due to the Rangers playing six home playoff games as the team advanced to the second round of the playoffs in the prior year versus not qualifying for playoffs in the current year.
The decrease in event-related expenses associated with other live sporting events was primarily due to a change in the mix of events during the current year as compared to the prior year, and to a lesser extent, one event that generated lower expense during the current year as compared to the prior year.
The decrease in team personnel compensation was primarily due to lower overall player salaries during the current year as a result of roster changes, partially offset by higher other team personnel compensation and the inclusion of team personnel compensation for CLG, which was acquired on July 28, 2017.
Net provisions for NBA and NHL revenue sharing expense (excluding playoffs) and NBA luxury tax and for certain team personnel transactions were as follows:
Years Ended June 30, | Increase (Decrease) | |||||||||||
2018 | 2017 | |||||||||||
Net provisions for NBA and NHL revenue sharing expense (excluding playoffs) and NBA luxury tax | $ | 55,450 | $ | 59,040 | $ | (3,590 | ) | |||||
Net provisions for certain team personnel transactions | 27,514 | 21,979 | 5,535 | |||||||||
The decrease in net provisions for NBA and NHL revenue sharing expense (excluding playoffs) and NBA luxury tax reflects a lower provision for NBA and NHL revenue sharing expense of $1,878 and a higher estimated NBA luxury tax receipt of $1,712. Lower NBA and NHL revenue sharing expense primarily reflects an increase in estimated net player escrow recoveries, partially offset by higher estimated NBA and NHL revenue sharing expense for the 2017-18 season and, to a lesser extent, net adjustments to prior season’s revenue sharing expense. The increase in estimated NBA luxury tax receipt is based on the Knicks’ roster, which as of June 30, 2018 did not result in luxury tax for the 2017-18 season. The Knicks were not a luxury tax payer for the 2016-17 season and, therefore, received an equal share of the portion of luxury tax receipts that were distributed to non-tax paying teams. The actual amounts for the 2017-18 season may vary significantly from the recorded provisions based on actual operating results for each league and all teams within each league for the season and other factors.
Team personnel transactions for the year ended June 30, 2018 reflect provisions recorded for (i) waivers/contract terminations of $21,559, (ii) season-ending player injuries of $4,273, which is net of insurance recoveries of $468 and (iii) player trades of $1,682. Team personnel transactions for the year ended June 30, 2017 reflect provisions recorded for waivers/contract terminations and player trades of $13,979 and $8,000, respectively.
The increase in other team operating expenses was primarily due to higher day-of-event costs and league expenses.
55
Selling, general and administrative expenses
Selling, general and administrative expenses for the year ended June 30, 2018 decreased $23,027, or 11%, to $186,914 as compared to the prior year primarily due to lower employee compensation and related benefits, and to a lesser extent, lower marketing costs, partially offset by an increase in corporate general and administrative costs. The reduction in employee compensation and related benefits as compared to the prior year is primarily driven by severance-related costs in the prior year, which were attributable to a separation agreement with a team executive.
Depreciation and amortization
Depreciation and amortization for the year ended June 30, 2018 decreased $1,838, or 20%, to $7,481 as compared to the prior year primarily as a result of an intangible asset becoming fully amortized.
Operating income
Operating income for the year ended June 30, 2018 increased $7,430, or 6%, to $126,564 as compared to the prior year primarily due to lower selling, general and administrative expenses and direct operating expenses, partially offset by a decrease in revenues, as discussed above.
Adjusted operating income
Adjusted operating income for the year ended June 30, 2018 increased $6,542, or 5%, to $149,543, as compared to the prior year primarily due to lower selling, general and administrative expenses, excluding share-based compensation expense, and direct operating expenses, partially offset by a decrease in revenues.
56
Comparison of the Year Ended June 30, 2017 versus the Year Ended June 30, 2016
Consolidated Results of Operations
The table below sets forth, for the periods presented, certain historical financial information.
Years Ended June 30, | Change | ||||||||||||||
2017 | 2016 | Amount | Percentage | ||||||||||||
Revenues | $ | 1,318,452 | $ | 1,115,311 | $ | 203,141 | 18 | % | |||||||
Direct operating expenses | 861,381 | 737,857 | 123,524 | 17 | % | ||||||||||
Selling, general and administrative expenses | 410,039 | 333,603 | 76,436 | 23 | % | ||||||||||
Depreciation and amortization | 107,388 | 102,482 | 4,906 | 5 | % | ||||||||||
Operating loss | (60,356 | ) | (58,631 | ) | (1,725 | ) | (3 | )% | |||||||
Other income (expense): | |||||||||||||||
Loss in equity method investments | (29,976 | ) | (19,099 | ) | (10,877 | ) | (57 | )% | |||||||
Interest income, net | 7,647 | 4,754 | 2,893 | 61 | % | ||||||||||
Miscellaneous income (expense) | 1,492 | (4,017 | ) | 5,509 | NM | ||||||||||
Loss from operations before income taxes | (81,193 | ) | (76,993 | ) | (4,200 | ) | (5 | )% | |||||||
Income tax benefit (expense) | 4,404 | (297 | ) | 4,701 | NM | ||||||||||
Net loss | (76,789 | ) | (77,290 | ) | 501 | 1 | % | ||||||||
Less: Net income attributable to nonredeemable noncontrolling interests | 304 | — | 304 | NM | |||||||||||
Less: Net loss attributable to redeemable noncontrolling interests | (4,370 | ) | — | (4,370 | ) | NM | |||||||||
Net loss attributable to The Madison Square Garden Company’s stockholders | $ | (72,723 | ) | $ | (77,290 | ) | $ | 4,567 | 6 | % | |||||
NM — Percentage is not meaningful
The following is a summary of changes in segments’ operating results for the year ended June 30, 2017 as compared to the prior year.
Changes attributable to | Revenues | Direct operating expenses | Selling, general and administrative expenses | Depreciation and amortization | Operating income (loss) | |||||||||||||||
MSG Entertainment segment (a) | $ | 91,078 | $ | 36,688 | $ | 24,292 | $ | 1,455 | $ | 28,643 | ||||||||||
MSG Sports segment (a) | 112,922 | 77,370 | 27,810 | (1,638 | ) | 9,380 | ||||||||||||||
Corporate and Other | (859 | ) | — | 24,334 | 1,937 | (27,130 | ) | |||||||||||||
Purchase accounting adjustments | — | 9,466 | — | 3,152 | (12,618 | ) | ||||||||||||||
$ | 203,141 | $ | 123,524 | $ | 76,436 | $ | 4,906 | $ | (1,725 | ) | ||||||||||
(a) | See “Business Segment Results” for a more detailed discussion relating to the operating results of our segments. |
(b) | See “Introduction” for the discussion of the Company’s refinement of its methodologies used to allocate its corporate, performance venues operating and other shared expenses in fiscal year 2017. |
Selling, general and administrative expenses - Corporate and Other
Selling, general and administrative expenses in Corporate and Other for the year ended June 30, 2017 increased $24,334, or 44%, to $79,602 as compared to prior year. The increase was primarily due to (i) an increase in employee compensation and related benefits, inclusive of the impact from the change in allocation methodology, (ii) higher professional fees primarily associated with the Company’s business development initiatives and (iii) the Company being subject to New York State and City capital tax for four fiscal quarters in the current year as compared to three fiscal quarters in the prior year.
57
Depreciation and amortization
Depreciation and amortization for the year ended June 30, 2017 increased $4,906, or 5%, to $107,388 as compared to the prior year primarily due to (i) depreciation and amortization of assets related to purchase accounting adjustments associated with the fiscal 2017 acquisitions and (ii) depreciation and amortization expenses of TAO Group’s property and equipment.
Operating loss - Corporate and Other
Operating loss in Corporate and Other for the year ended June 30, 2017 increased $27,130, or 20%, to $163,180. The increase was primarily due to higher selling, general and administrative expenses as discussed above.
Loss in equity method investments
Loss in equity method investments for the year ended June 30, 2017 increased by $10,877, or 57%, to $29,976 as compared to the prior year. The year-over-year increase in loss reflects a pre-tax non-cash impairment charge of $20,613 in the third quarter of fiscal year 2017 to write off the carrying value of the Company’s equity investment in Fuse Media. This increase was partially offset by the non-recurrence of a non-cash impairment charge of $7,270 to write off the carrying value of the Company’s investment in the Broadway production of Finding Neverland during the fourth quarter of fiscal year 2016, as well as improved operating results for certain of the Company’s joint ventures and, to a lesser extent, a distribution in the current year from an equity method investment that was previously written off.
Miscellaneous income (expense)
Miscellaneous income for the year ended June 30, 2017 consisted principally of the recovery of certain claims in connection with a third-party bankruptcy proceeding. Miscellaneous expense in the prior year reflected a pre-tax non-cash impairment charge of $4,080 to partially write down the carrying value of one of the Company’s cost method investments.
Income taxes
Income tax benefit for the year ended June 30, 2017 was $4,404 and income tax expense for the year ended June 30, 2016 was $297.
Income tax benefit for the year ended June 30, 2017 of $4,404 differs from the income tax expense derived from applying the statutory Federal rate of 35% to pretax income primarily as a result of an increase of $30,697 in recorded federal and state valuation allowances, tax expense of $3,449 related to non-deductible expense, the tax impact of consolidated partnership book income attributable to non-controlling interests of $1,414, deferred expense of $1,329 based on tax amortization on indefinite lived intangibles that are not available as a source of taxable income to support the realization of deferred tax assets, and expense of $672 recorded due to a state rate change computed as a result of filed state tax returns. This tax expense is offset by a state tax benefit (net of federal effect) of $6,716, the tax benefit of other comprehensive income gains recorded in continuing operations of $6,477 and other of $354.
Income tax expense for the year ended June 30, 2016 of $297 differs from the income tax expense derived from applying the statutory Federal rate of 35% to pretax income due to the Company not being able to record a tax benefit related to the deferred tax assets established on the operating losses during that year. Due to a lack of history of achieving operating income from operations, we have provided a full valuation allowance against our deferred tax assets.
Adjusted operating income
The following is a reconciliation of operating loss to adjusted operating income:
Years Ended June 30, | Change | ||||||||||||||
2017 | 2016 | Amount | Percentage | ||||||||||||
Operating loss | $ | (60,356 | ) | $ | (58,631 | ) | $ | (1,725 | ) | (3 | )% | ||||
Share-based compensation (a) | 41,129 | 24,476 | |||||||||||||
Depreciation and amortization (b) | 107,388 | 102,482 | |||||||||||||
Other purchase accounting adjustments | 9,466 | — | |||||||||||||
Adjusted operating income | $ | 97,627 | $ | 68,327 | $ | 29,300 | 43 | % | |||||||
(a) | The increase in share-based compensation as compared to prior year, primarily reflects changes the Company made during fiscal year 2016 to its long-term incentive plans. These changes resulted in a shift in the performance-based component of the Company’s long-term incentive awards from cash to performance-based restricted stock units. |
(b) | Depreciation and amortization includes purchase accounting adjustments of $3,152 for the year ended June 30, 2017. |
58
Adjusted operating income for the year ended June 30, 2017 increased $29,300, or 43%, to $97,627 as compared to the prior year. The net increase is attributable to the following:
Increase in adjusted operating income of the MSG Entertainment segment | $ | 36,551 | |
Increase in adjusted operating income of the MSG Sports segment | 11,974 | ||
Other net decreases | (19,225 | ) | |
$ | 29,300 | ||
Other net decreases reflect (i) an increase in employee compensation and related benefits, excluding share-based compensation expense, (ii) higher professional fees and (iii) the Company being subject to New York State and City capital tax for four fiscal quarters in the current year as compared to three fiscal quarters in the prior year.
Net income (loss) attributable to redeemable and nonredeemable noncontrolling interests
For the year ended June 30, 2017, the Company recorded net loss attributable to redeemable noncontrolling interests of $4,370 and a net income attributable to nonredeemable noncontrolling interests of $304. These amounts represent the share of net income (loss) of TAO Group and BCE that are not attributable to the Company. In addition, the net income (loss) attributable to redeemable and nonredeemable noncontrolling interests includes a proportional share of expenses related to purchase accounting adjustments. See “— Introduction — Factors Affecting Operating Results from Acquisitions” for further discussion.
59
Business Segment Results
MSG Entertainment
The table below sets forth, for the periods presented, certain historical financial information and a reconciliation of operating loss to adjusted operating income (loss) for the Company’s MSG Entertainment segment.
Years Ended June 30, | Change | ||||||||||||||
2017 | 2016 | Amount | Percentage | ||||||||||||
Revenues | $ | 506,468 | $ | 415,390 | $ | 91,078 | 22 | % | |||||||
Direct operating expenses | 378,325 | 341,637 | 36,688 | 11 | % | ||||||||||
Selling, general and administrative expenses | 120,496 | 96,204 | 24,292 | 25 | % | ||||||||||
Depreciation and amortization | 11,339 | 9,884 | 1,455 | 15 | % | ||||||||||
Operating loss | $ | (3,692 | ) | $ | (32,335 | ) | $ | 28,643 | 89 | % | |||||
Reconciliation to adjusted operating income (loss): | |||||||||||||||
Share-based compensation | 14,323 | 7,870 | |||||||||||||
Depreciation and amortization | 11,339 | 9,884 | |||||||||||||
Adjusted operating income (loss) | $ | 21,970 | $ | (14,581 | ) | $ | 36,551 | NM | |||||||
NM — Percentage is not meaningful
Revenues
Revenues for the year ended June 30, 2017 increased $91,078, or 22%, to $506,468 as compared to the prior year. The net increase is attributable to the following:
Inclusion of revenues associated with entertainment dining and nightlife offerings | $ | 34,332 | |
Inclusion of BCE events-related revenues | 16,357 | ||
Increase in event-related revenues at the Forum | 14,044 | ||
Increase in revenues from the presentation of the New York Spectacular | 7,768 | ||
Increase in revenues from the presentation of the Christmas Spectacular | 6,778 | ||
Increase in event-related revenues at The Garden | 5,616 | ||
Increase in event-related revenues at Radio City Music Hall, excluding the Christmas Spectacular and the New York Spectacular | 4,017 | ||
Increase in venue-related sponsorship and signage and suite rental fee revenues | 3,001 | ||
Increase in event-related revenues at The Hulu Theater at Madison Square Garden | 2,572 | ||
Decrease in event-related revenues at the Beacon Theatre | (2,926 | ) | |
Decrease in event-related revenues at the Wang Theatre | (1,085 | ) | |
Other net increases | 604 | ||
$ | 91,078 | ||
The inclusion of revenues associated with entertainment dining and nightlife offerings is the result of the acquisition of TAO Group on January 31, 2017, and primarily reflects revenues generated from food and beverage sales. TAO Group’s operating results are recorded in the Company’s consolidated statements of operations on a three-month lag basis. As a result, TAO Group’s related revenues are for the period from February 1, 2017 to March 26, 2017. See “— Introduction — Factors Affecting Operating Results from Acquisitions — TAO Group’s Operating Results” for further discussion.
The inclusion of BCE events-related revenues is the result of the acquisition of BCE in July 2016, and principally consists of event-related revenues generated by the Boston Calling Music Festival, which was held in May 2017. See “— Introduction — Factors Affecting Operating Results from Acquisitions — BCE’s Operating Results” for further discussion.
The increase in event-related revenues at the Forum was primarily due to additional events and a change in the mix of events held at the venue during the year ended June 30, 2017 as compared to the prior year.
60
The increase in revenues from the presentation of the New York Spectacular was primarily due to additional scheduled performances in the year ended June 30, 2017 as compared to the prior year. This was a result of the Company’s decision to shift the timing of the production with the production beginning mid-June 2016 resulting in 56 scheduled performances during fiscal year 2017 versus the prior year production, which began mid-March 2015 with 21 scheduled performances during fiscal year 2016. The Company announced in February 2017 that it was suspending the planned 2017 presentation of the New York Spectacular.
The increase in revenues from the presentation of the Christmas Spectacular was primarily due to higher average ticket prices, inclusive of the impact of eliminating high volume buyers, during the year ended June 30, 2017 as compared to the prior year. During the 2016 holiday season more than one million tickets were sold, which represents a low single digit percentage decrease as compared to the 2015 holiday season due to seven fewer scheduled performances.
The increase in event-related revenues at The Garden was due to a change in the mix of events partially offset by fewer events held at the venue during the year ended June 30, 2017 as compared to the prior year.
The increase in event-related revenues at Radio City Music Hall, excluding the Christmas Spectacular and the New York Spectacular, was due to a change in the mix of events and additional events held at the venue during the year ended June 30, 2017 as compared to the prior year.
The increase in venue-related sponsorship and signage and suite rental fee revenues was primarily due to new sponsorship inventory as well as increased sales of existing sponsorship inventory.
The increase in event-related revenues at The Hulu Theater at Madison Square Garden was due to additional events partially offset by a change in the mix of events held at the venue during the year ended June 30, 2017 as compared to the prior year.
The decrease in event-related revenues at the Beacon Theatre was due to fewer events held at the venue during the year ended June 30, 2017 as compared to the prior year.
The decrease in event-related revenues at the Wang Theatre was due to a change in the mix of events partially offset by additional events held at the venue during the year ended June 30, 2017 as compared to the prior year.
Direct operating expenses
Direct operating expenses for the year ended June 30, 2017 increased $36,688, or 11%, to $378,325 as compared to the prior year. The net increase is attributable to the following:
Inclusion of direct operating expenses associated with entertainment dining and nightlife offerings | $ | 19,648 | |
Inclusion of BCE events-related direct operating expenses | 13,197 | ||
Increase in event-related direct operating expenses at the Forum | 5,799 | ||
Increase in event-related direct operating expenses at Radio City Music Hall, excluding the Christmas Spectacular and the New York Spectacular | 2,940 | ||
Increase in event-related direct operating expenses at The Hulu Theater at Madison Square Garden | 2,534 | ||
Increase in event-related direct operating expenses at The Garden | 631 | ||
Decrease in direct operating expenses associated with the presentation of the Christmas Spectacular | (6,464 | ) | |
Decrease in event-related direct operating expenses at the Beacon Theatre | (2,002 | ) | |
Decrease in direct operating expenses associated with the New York Spectacular | (443 | ) | |
Other net increases | 848 | ||
$ | 36,688 | ||
The inclusion of direct operating expenses associated with entertainment dining and nightlife offerings is the result of the acquisition of TAO Group on January 31, 2017, and primarily reflects costs associated with food and beverage sales, inclusive of labor costs, as well as venue related operating expenses. TAO Group’s operating results are recorded in the Company’s consolidated statements of operations on a three-month lag basis. As a result, TAO Group’s related direct operating expenses are for the period from February 1, 2017 to March 26, 2017. See “— Introduction — Factors Affecting Operating Results from Acquisitions — TAO Group’s Operating Results” for further discussion.
The inclusion of BCE events-related direct operating expenses is the result of the acquisition of BCE in July 2016, and principally consists of direct operating expenses associated with the Boston Calling Music Festival, which was held in May 2017. In addition, BCE incurred other expenses associated with this festival, which are reported as selling, general and administrative expenses. See “— Introduction — Factors Affecting Operating Results from Acquisitions — BCE’s Operating Results” for further discussion.
61
The increase in event-related direct operating expenses at the Forum was primarily due to additional events and a change in the mix of events held at the venue during the year ended June 30, 2017 as compared to the prior year.
The increase in event-related direct operating expenses at Radio City Music Hall, excluding the Christmas Spectacular and the New York Spectacular, was due to a change in the mix of events and additional events held at the venue during the year ended June 30, 2017 as compared to the prior year.
The increase in event-related direct operating expenses at The Hulu Theater at Madison Square Garden was due to additional events partially offset by a change in the mix of events held at the venue during the year ended June 30, 2017 as compared to the prior year.
The increase in event-related direct operating expenses at The Garden was due to a change in mix of events offset by fewer events held at the venue during the year ended June 30, 2017 as compared to the prior year.
The decrease in direct operating expenses associated with the presentation of the Christmas Spectacular was primarily driven by lower costs due to operational efficiencies, a decrease in deferred production cost amortization, fewer scheduled performances during the year ended June 30, 2017 as compared to the prior year, as well as a decrease in marketing expenses.
The decrease in event-related direct operating expenses at the Beacon Theatre was primarily due to fewer events and a change in the mix of events held at the venue during the year ended June 30, 2017 as compared to the prior year.
The decrease in direct operating expenses associated with the New York Spectacular was due to lower write-off of the deferred production costs during fiscal year 2017 as compared to the prior year offset by an increase in the direct operating expenses associated with the presentation of the show.
During the third quarter of fiscal year 2016, the Company recorded a $41,816 write-off of deferred production costs associated with the New York Spectacular due to the creative decision to not include, in the summer of 2016 performances, certain scenes from the previous show. Due to assessments of the show’s creative direction, timing and scale, the Company wrote off the remaining balance of deferred production costs related to the New York Spectacular in the amount of $33,629 during the fourth quarter of fiscal year 2017.
The increase in direct operating expenses associated with the presentation of the New York Spectacular was primarily due to additional scheduled performances in the year ended June 30, 2017 as compared to the prior year. This was a result of the Company’s decision to shift the timing of the production with the production beginning mid-June 2016 resulting in 56 scheduled performances during fiscal year 2017 versus the prior year production, which began mid-March 2015 with 21 scheduled performances during fiscal year 2016. The Company announced in February 2017 that it was suspending the planned 2017 presentation of the New York Spectacular.
Selling, general and administrative expenses
Selling, general and administrative expenses for the year ended June 30, 2017 increased $24,292, or 25%, to $120,496 as compared to the prior year mainly due to (i) inclusion of TAO Group’s selling, general and administrative costs, (ii) an increase in corporate general and administrative costs, (iii) higher professional fees and (iv) an increase in employee compensation and related benefits.
Depreciation and amortization
Depreciation and amortization for the year ended June 30, 2017 increased $1,455, or 15%, to $11,339 as compared to the prior year primarily due to depreciation and amortization expenses for TAO Group’s property and equipment before the purchase accounting adjustments.
Operating income (loss)
Operating loss improved by $28,643, or 89% to a loss of $3,692 for the year ended June 30, 2017 as compared to the prior year primarily due to higher revenues, partially offset by increases in direct operating expenses, selling, general and administrative expenses and depreciation and amortization expenses, as discussed above.
Adjusted operating income (loss)
Adjusted operating income improved by $36,551 to $21,970 for the year ended June 30, 2017 as compared to the prior year primarily due to higher revenues, partially offset by increases in direct operating expenses and selling, general and administrative expenses, as discussed above. The increase in adjusted operating income excludes increases in share-based compensation expense and depreciation and amortization expenses for the year ended June 30, 2017 as compared to the prior year.
62
MSG Sports
The table below sets forth, for the periods presented, certain historical financial information and a reconciliation of operating income to adjusted operating income for the Company’s MSG Sports segment.
Years Ended June 30, | Change | ||||||||||||||
2017 | 2016 | Amount | Percentage | ||||||||||||
Revenues | $ | 811,984 | $ | 699,062 | $ | 112,922 | 16 | % | |||||||
Direct operating expenses | 473,590 | 396,220 | 77,370 | 20 | % | ||||||||||
Selling, general and administrative expenses | 209,941 | 182,131 | 27,810 | 15 | % | ||||||||||
Depreciation and amortization | 9,319 | 10,957 | (1,638 | ) | (15 | )% | |||||||||
Operating income | $ | 119,134 | $ | 109,754 | $ | 9,380 | 9 | % | |||||||
Reconciliation to adjusted operating income: | |||||||||||||||
Share-based compensation | 14,548 | 10,316 | |||||||||||||
Depreciation and amortization | 9,319 | 10,957 | |||||||||||||
Adjusted operating income | $ | 143,001 | $ | 131,027 | $ | 11,974 | 9 | % | |||||||
Revenues
Revenues for the year ended June 30, 2017 increased $112,922, or 16%, to $811,984 as compared to the prior year. The net increase is attributable to the following:
Increase in revenues from league distributions | $ | 66,210 | |
Increase in professional sports teams’ playoff related revenues | 20,694 | ||
Increase in professional sports teams’ pre/regular season ticket-related revenues | 8,399 | ||
Increase in professional sports teams’ sponsorship and signage revenues and ad sales commission | 6,068 | ||
Increase in event-related revenues from other live sporting events | 5,552 | ||
Increase in local media rights fees from MSG Networks | 4,341 | ||
Increase in suite rental fee revenues | 1,056 | ||
Other net increases | 602 | ||
$ | 112,922 | ||
The increase in revenues from league distributions primarily reflects the impact from the NBA’s new national media rights agreements, which began with the 2016-17 NBA regular season, and an NHL expansion fee received from the league. The NHL expansion fee of approximately $15,500 is a non-recurring distribution related to the NHL’s addition of a 31st team located in Las Vegas, Nevada. In addition, the Company recorded approximately $15,000 of non-recurring distributions from the NHL and NBA.
The increase in professional sports teams’ playoff related revenues was primarily due to the Rangers playing six home playoff games as the team advanced to the second round of the playoffs in the year ended June 30, 2017 versus playing two home playoff games in the prior year.
The increase in professional sports teams’ pre/regular season ticket-related revenues was primarily due to higher average per-game revenue, which reflects higher average ticket prices and the changes made to ticketing polices, resulting in fewer full season tickets sold and more sales of individual and group tickets, as well as partial season plans.
The increase in professional sports teams’ sponsorship and signage revenues and ad sales commission was primarily due to increased sales of existing sponsorship and signage inventory.
The increase in event-related revenues from other live sporting events was primarily due to a change in the mix of events during the year ended June 30, 2017 as compared to the prior year.
The increase in local media rights fees from MSG Networks was due to contractual rate increases.
The increase in suite rental fee revenues was primarily due to contractual rate increases partially offset by other net decreases.
63
Direct operating expenses
Direct operating expenses for the year ended June 30, 2017 increased $77,370, or 20%, to $473,590 as compared to the prior year. The net increase is attributable to the following:
Increase in team personnel compensation | $ | 31,709 | |
Increase in net provisions for NBA and NHL revenue sharing expense (excluding playoffs) and NBA luxury tax | 16,699 | ||
Increase in net provisions for certain team personnel transactions | 14,495 | ||
Increase in professional sports teams’ playoff related expenses | 9,363 | ||
Increase in event-related expenses associated with other live sporting events | 1,967 | ||
Increase in other team operating expenses | 1,269 | ||
Increase in venue operating costs | 1,107 | ||
Other net increases | 761 | ||
$ | 77,370 | ||
The increase in team personnel compensation was primarily due to higher overall player salaries during the current year, mainly a result of the impact of roster changes in our sports teams. In connection with the NBA’s new national media rights agreements, the NBA’s player salary cap for the 2016-17 regular season increased significantly, as compared to the salary cap for the 2015-16 regular season.
Net provisions for NBA and NHL revenue sharing expense (excluding playoffs) and NBA luxury tax and for certain team personnel transactions were as follows:
Years Ended June 30, | Increase | |||||||||||
2017 | 2016 | |||||||||||
Net provisions for NBA and NHL revenue sharing expense (excluding playoffs) and NBA luxury tax | $ | 59,040 | $ | 42,341 | $ | 16,699 | ||||||
Net provisions for certain team personnel transactions | 21,979 | 7,484 | 14,495 | |||||||||
The increase in net provisions for NBA and NHL revenue sharing expense (excluding playoffs) and NBA luxury tax reflects higher net provisions for both NBA and NHL revenue sharing expense of $14,657 and lower NBA luxury tax credit of $2,042. Higher NBA and NHL revenue sharing expense reflects higher estimated NBA and NHL revenue sharing expense for the 2016-17 season and lower estimated net player escrow recoveries. The actual amounts for the NHL’s 2016-17 season may vary significantly from the recorded provision based on actual operating results for the league and all NHL teams for the season and other factors. The Knicks were not a luxury tax payer for neither the 2016-17 season or the 2015-16 season. We received an equal share of the portion of luxury tax receipts that were distributed to non-tax paying teams for the 2015-16 season. The luxury tax receipt we expect to receive for the 2016-17 season is lower than the receipt for the 2015-16 season.
Team personnel transactions for the year ended June 30, 2017 reflect provisions recorded for waivers/contract terminations and player trades of $13,979 and $8,000, respectively. Team personnel transactions for the year ended June 30, 2016 reflect provisions recorded for waivers/contract terminations.
The increase in professional sports teams’ playoff related expenses was primarily due to the Rangers playing six home playoff games as the team advanced to the second round of the playoffs in the year ended June 30, 2017 versus playing two home playoff games in the prior year.
The increase in event-related expenses associated with other live sporting events was primarily due to a change in the mix of events during the year ended June 30, 2017 as compared to the prior year.
The increase in other team operating expenses was primarily due to higher team travel expenses, day-of-event costs and other net team operating expense increases partially offset by a decrease in league assessments.
The increase in venue operating costs was primarily due to higher operating costs at The Garden driven by an increase in labor-related costs slightly offset by decreases in operating costs at other venues.
64
Selling, general and administrative expenses
Selling, general and administrative expenses for the year ended June 30, 2017 increased $27,810, or 15%, to $209,941 as compared to the prior year, primarily due to higher employee compensation and related benefits, driven by severance-related costs attributable to a separation agreement with a team executive, slightly offset by other net decreases.
Operating income
Operating income for the year ended June 30, 2017 increased $9,380, or 9%, to $119,134 as compared to the prior year primarily due to higher revenues partially offset by an increase in direct operating expenses and, to a lesser extent, higher selling, general and administrative expenses, as discussed above.
Adjusted operating income
Adjusted operating income for the year ended June 30, 2017 increased $11,974, or 9%, to $143,001, as compared to the prior year primarily due to higher revenues partially offset by an increase in direct operating expenses and, to a lesser extent, higher selling, general and administrative expenses, as discussed above. The increase in adjusted operating income excludes the increase in share-based compensation expense and decrease in depreciation and amortization expenses for the year ended June 30, 2017 as compared to the prior year.
65
Liquidity and Capital Resources
Overview
Our primary sources of liquidity are cash and cash equivalents, cash flows from the operations of our businesses and available borrowing capacity under our $377,000 revolving credit facilities (see “Financing Agreements — Knicks Revolving Credit Facility,” “Financing Agreements — Knicks Unsecured Credit Facility,” “Financing Agreements — Rangers Revolving Credit Facility” and “Financing Agreements — TAO Credit Facilities” below). Our principal uses of cash include working capital-related items, capital spending (including our planned construction of large-scale venues in Las Vegas and London), investments and related loans that we may fund from time to time, repurchases of shares of the Company’s Class A Common Stock, repayment of debt, and the payment of earn-out obligations and mandatory purchases from prior acquisitions. The decisions of the Company as to the use of its available liquidity will be based upon the ongoing review of the funding needs of the business, the optimal allocation of cash resources, and the timing of cash flow generation. To the extent the Company desires to access alternative sources of funding through the capital and credit markets, challenging U.S. and global economic conditions could adversely impact our ability to do so at that time.
We regularly monitor and assess our ability to meet our net funding and investing requirements. Over the next 12 months, we believe we have sufficient liquidity, including approximately $1,226,000 in unrestricted cash and cash equivalents as of June 30, 2018, along with available borrowing capacity under our revolving credit facilities combined with operating cash flows to fund our operations, to pursue the development of the new venues discussed below and other new business opportunities and to repurchase shares of the Company’s Class A Common Stock.
TAO Group’s principal uses of cash include working capital related-items, investments in new venues, tax-related cash distributions, interest expense payments and repayment of debt. TAO Group plans to continue to grow its business through the opening of new venues. TAO Group regularly monitors and assesses its ability to meet its funding and investment requirements. Over the next 12 months, the Company believes that TAO Group has sufficient liquidity from cash on hand, cash generated from operations and its revolving credit facility to fund its operations, service debt obligations and pursue new business opportunities.
MSG Spheres
The Company is moving forward with its venue strategy to create the “venue of the future” — which we refer to as “MSG Sphere” for its spherical shape. See “Part I — Item 1. Business — Our Business — Our Performance Venues — MSG Sphere.”
Our plans are to build the first MSG Sphere in Las Vegas, followed by London. We continue to refine our designs to ensure that we are delivering the most immersive experience for guests and maximizing the efficiencies that come with constructing two venues that will have similar key features. For Las Vegas, the Company plans to break ground during September 2018 with the start of site preparations, with the goal to open in fiscal year 2021.
In London, the Company acquired land in 2017 at a cost, net of value added tax, of $79,518. Subject to the timely completion of the planning and governmental approval process, our goal is to have our London venue debut approximately one year after the Las Vegas venue.
Cost estimates for MSG Sphere Las Vegas and London have not yet been finalized as the Company continues to refine its design plans. MSG Sphere is an ambitious project that we believe will drive substantial new and enhanced revenue and adjusted operating income opportunities for the Company. Given the transformative nature of these venues, we expect that construction of these venues will require greater capital spend than would be required for a traditional arena-sized venue.
We will continue to explore additional domestic and international markets where we believe next-generation venues such as the MSG Sphere can be successful. As is the case for any large scale real estate development projects, when the Company moves forward with the planning and construction for the MSG Spheres and other major new venues, the Company may face unexpected project delays and costs.
In connection with these efforts, the Company will need to pursue additional capital beyond that which is available from cash on hand, cash flows from operations and borrowings under our revolving credit facilities. There is no assurance that we would be able to obtain such capital. The potential Sports Distribution contemplates that the Company would retain an approximate two thirds interest in the sports company which, if completed, could provide the Company with an additional source of funding for its capital and other needs, including for costs associated with the design and construction of MSG Spheres. See also “Part I — Item 1. Business — Our Business — Our Performance Venues — MSG Sphere.”
66
Stock Repurchases
On September 11, 2015, the Board authorized the repurchase of up to $525,000 of the Company’s Class A Common Stock once the shares of the Company’s Class A Common Stock began “regular way” trading on October 1, 2015. Under the authorization, shares of the Company’s Class A Common Stock may be purchased from time to time in accordance with applicable insider trading and other securities laws and regulations. The timing and amount of purchases will depend on market conditions and other factors. As of June 30, 2018, the Company had $259,639 of availability remaining under its stock repurchase authorization.
Financing Agreements
Knicks Revolving Credit Facility
On September 30, 2016, Knicks LLC, a wholly owned subsidiary of the Company, entered into a credit agreement (the “Knicks Credit Agreement”) with a syndicate of lenders providing for a senior secured revolving credit facility of up to $200,000 with a term of five years (the “Knicks Revolving Credit Facility”) to fund working capital needs and for general corporate purposes. Amounts borrowed may be distributed to the Company except during an event of default.
The Knicks Revolving Credit Facility requires Knicks LLC to comply with a debt service ratio of 1.5:1.0 over a trailing four quarter period. As of June 30, 2018, Knicks LLC was in compliance with this financial covenant.
All borrowings under the Knicks Revolving Credit Facility are subject to the satisfaction of certain customary conditions. Borrowings bear interest at a floating rate, which at the option of Knicks LLC may be either (i) a base rate plus a margin ranging from 0.00% to 0.125% per annum or (ii) LIBOR plus a margin ranging from 1.00% to 1.125% per annum. Knicks LLC is required to pay a commitment fee ranging from 0.20% to 0.25% per annum in respect of the average daily unused commitments under the Knicks Revolving Credit Facility. The Knicks Revolving Credit Facility was undrawn as of June 30, 2018.
All obligations under the Knicks Revolving Credit Facility are secured by a first lien security interest in certain of Knicks LLC’s assets, including, but not limited to, (i) the Knicks LLC’s membership rights in the NBA and (ii) revenues to be paid to the Knicks LLC by the NBA pursuant to certain U.S. national broadcast agreements.
Subject to customary notice and minimum amount conditions, Knicks LLC may voluntarily prepay outstanding loans under the Knicks Revolving Credit Facility at any time, in whole or in part, without premium or penalty (except for customary breakage costs with respect to Eurocurrency loans). Knicks LLC is required to make mandatory prepayments in certain circumstances, including without limitation if the maximum available amount under the Knicks Revolving Credit Facility is greater than 350% of qualified revenues.
The Knicks Revolving Credit Facility contains certain restrictions on the ability of Knicks LLC to take certain actions as provided in (and subject to various exceptions and baskets set forth in) the Knicks Revolving Credit Facility, including the following: (i) incurring additional indebtedness and contingent liabilities; (ii) creating liens on certain assets; (iii) making restricted payments during the continuance of an event of default under the Knicks Revolving Credit Facility; (iv) engaging in sale and leaseback transactions; (v) merging or consolidating; and (vi) taking certain actions that would invalidate the secured lenders’ liens on any Knicks LLC’s collateral.
Knicks Unsecured Credit Facility
On September 30, 2016, Knicks LLC entered into an unsecured revolving credit facility with a lender for an initial maximum credit amount of $15,000 and a 364-day term. Knicks LLC renewed this facility with the lender on the same terms effective as of September 29, 2017. This facility was undrawn as of June 30, 2018 and is expected to be renewed on the same terms prior to expiration.
Rangers Revolving Credit Facility
On January 25, 2017, Rangers LLC, a wholly owned subsidiary of the Company, entered into a credit agreement (the “Rangers Credit Agreement”) with a syndicate of lenders providing for a senior secured revolving credit facility of up to $150,000 with a term of five years (the “Rangers Revolving Credit Facility”) to fund working capital needs and for general corporate purposes. Amounts borrowed may be distributed to the Company except during an event of default.
The Rangers Revolving Credit Facility requires Rangers LLC to comply with a debt service ratio of 1.5:1.0 over a trailing four quarter period. As of June 30, 2018, Rangers LLC was in compliance with this financial covenant. All borrowings under the Rangers Revolving Credit Facility are subject to the satisfaction of certain customary conditions.
Borrowings bear interest at a floating rate, which at the option of Rangers LLC may be either (i) a base rate plus a margin ranging from 0.125% to 0.50% per annum or (ii) LIBOR plus a margin ranging from 1.125% to 1.50% per annum. Rangers LLC is
67
required to pay a commitment fee ranging from 0.375% to 0.625% per annum in respect of the average daily unused commitments under the Rangers Revolving Credit Facility. The Rangers Revolving Credit Facility was undrawn as of June 30, 2018.
All obligations under the Rangers Revolving Credit Facility are secured by a first lien security interest in certain of Rangers LLC’s assets, including, but not limited to, (i) Rangers LLC’s membership rights in the NHL, (ii) revenues to be paid to Rangers LLC by the NHL pursuant to certain U.S. and Canadian national broadcast agreements, and (iii) revenues to be paid to Rangers LLC pursuant to local media contracts.
Subject to customary notice and minimum amount conditions, Rangers LLC may voluntarily prepay outstanding loans under the Rangers Revolving Credit Facility at any time, in whole or in part, without premium or penalty (except for customary breakage costs with respect to Eurocurrency loans). Rangers LLC is required to make mandatory prepayments in certain circumstances, including without limitation if qualified revenues are less than 17% of the maximum available amount under the Rangers Revolving Credit Facility.
The Rangers Revolving Credit Facility contains certain restrictions on the ability of Rangers LLC to take certain actions as provided in (and subject to various exceptions and baskets set forth in) the Rangers Revolving Credit Facility, including the following: (i) incurring additional indebtedness and contingent liabilities; (ii) creating liens on certain assets; (iii) making restricted payments during the continuance of an event of default under the Rangers Revolving Credit Facility; (iv) engaging in sale and leaseback transactions; (v) merging or consolidating; and (vi) taking certain actions that would invalidate the secured lenders’ liens on any of Rangers LLC’s assets securing the obligations under the Rangers Revolving Credit Facility.
TAO Credit Facilities
On January 31, 2017, TAO Group Intermediate Holdings LLC (“TAOIH”), TAO Group Operating LLC (“TAOG”), and certain of its subsidiaries entered into a credit and guaranty agreement with a syndicate of lenders providing for a senior secured term loan facility of $110,000 with a term of five years (the “TAO Term Loan Facility”) to fund, in part, the acquisition of TAO Group and a senior secured revolving credit facility of up to $12,000 with a term of five years (the “TAO Revolving Credit Facility,” and together with the TAO Term Loan Facility, the “TAO Credit Facilities”) for working capital and general corporate purposes of TAOG. The TAO Credit Facilities were obtained without recourse to MSG or any of its affiliates (other than TAOIH and its subsidiaries).
The TAO Credit Facilities require TAOIH (i) to maintain, for the relevant TAO entities, a minimum consolidated liquidity of $5,000 at all times, (ii) to comply with a maximum total net leverage ratio of 4.00:1.00 initially and stepping down over time to 2.50:1.00 by the first quarter of calendar year 2021 and through the remainder of the term of the TAO Credit Facilities, and (iii) to comply with a minimum fixed charge coverage ratio of 1.50:1.00 initially and stepping down over time to 1.15:1.00 by the second quarter of calendar year 2021 and through the remainder of the term of the TAO Credit Facilities. TAOIH was in compliance with the financial covenants of the TAO Credit Facilities as of April 1, 2018 (the most recent date at which compliance was assessed under the TAO Credit Facilities). The TAO Revolving Credit Facility was undrawn as of June 30, 2018.
The TAO entities under the TAO Credit Facilities are also subject to certain limitations with respect to making capital expenditures based upon the total net leverage ratio and other factors. The restrictions on capital expenditures are subject to certain “carry-forward” provisions and other customary carve-outs.
All borrowings under the TAO Credit Facilities are subject to the satisfaction of certain customary conditions, including compliance with a maximum leverage multiple, accuracy of representations and warranties and absence of a default or event of default. Borrowings bear interest at a floating rate, which at the option of TAOG may be either (i) a base rate plus a margin ranging from 6.50% to 7.00% per annum or (ii) LIBOR plus a margin ranging from 7.50% to 8.00% per annum. The interest rate on the TAO Credit Facilities as of April 1, 2018 was 9.9375%. TAOG is required to pay a commitment fee of 0.50% per annum in respect of the average daily unused commitments under the TAO Revolving Credit Facility.
All obligations under the TAO Credit Facilities are secured by a first lien security interest in substantially all of the applicable TAO entities’ assets, including, but not limited to, a pledge of all of the capital stock of substantially all of TAOIH’s wholly-owned domestic subsidiaries and 65% of the voting capital stock, and 100% of the non-voting capital stock, of each of its first-tier foreign subsidiaries.
68
Subject to customary notice and minimum amount conditions, TAOG may voluntarily prepay outstanding loans under the TAO Credit Facilities at any time, in whole or in part (subject to customary breakage costs with respect to LIBOR loans) with premiums due in respect of prepayments of the TAO Term Loan Facility or permanent reduction under the TAO Revolving Credit Facility, in each case, starting at 5.0% initially and stepping down to 0% after three years. Beginning March 31, 2018, TAOG is required to make scheduled amortization payments under the TAO Term Loan Facility in consecutive quarterly installments equal to $688 per quarter initially, stepping up over time to $4,125 per quarter by March 31, 2021 and through the final maturity date of the TAO Term Loan Facility with the final balance payable on such maturity date. TAOG is also required to make mandatory prepayments under the TAO Credit Facilities in certain circumstances, including, without limitation, 75% of excess cash flow, with a step-down to 50% when the total net leverage ratio is less than 2.00:1.00.
The TAO Credit Facilities contain certain restrictions on the ability of TAOG to take certain actions as provided in (and subject to various exceptions and baskets set forth in) the TAO Credit Facilities, including, without limitation, the following: (i) incurring additional indebtedness; (ii) creating liens on assets; (iii) making distributions, dividends and other restricted payments; (iv) engaging in sale and leaseback transactions; (v) merging or consolidating; (vi) making investments; and (vii) prepaying certain indebtedness.
Long-term debt maturities over the next five years for the TAO Term Loan Facility as of April 1, 2018 (a) are:
Fiscal year ending June 30, 2019 | $ | 5,304 | |
Fiscal year ending June 30, 2020 | 2,063 | ||
Fiscal year ending June 30, 2021 | 11,000 | ||
Fiscal year ending June 30, 2022 | 90,946 | ||
Fiscal year ending June 30, 2023 | — | ||
Thereafter | — | ||
_________________
(a) | The Company records TAO Group’s operating results in its consolidated financial statements on a three-month lag basis (see Item 8. Financial Statements and Supplementary Data — Consolidated Financial Statements — Notes to Consolidated Financial Statements — Note 2. Summary of Significant Accounting Policies — Business Combinations and Noncontrolling Interests” for further detail). As such, the long-term debt maturities amounts disclosed above did not reflect a mandatory prepayment of $2,554 in May 2018 and a scheduled amortization payment of $688 in June 2018. |
Revolving Credit Facilities Provided to Nonconsolidated Affiliates
In connection with the Company’s investment in AMSGE, the Company provides a $100,000 revolving credit facility to this entity of which $63,500 had been drawn as of June 30, 2018. On April 20, 2018, AMSGE repaid $34,000 and the Company agreed that such amounts could be reborrowed.
In connection with the Company’s investment in Tribeca Enterprises, the Company provided a $17,500 revolving credit facility to this entity, which facility was fully drawn as of June 30, 2018. Tribeca Enterprises also owed PIK interest of $2,025 on this facility as of June 30, 2018.
Bilateral Letters of Credit Lines
The Company has established bilateral credit lines with a bank to issue letters of credit in support of the Company’s business operations. The Company pays fees for the letters of credit that are credited against interest income the Company receives in return from its investments in notes receivable with the same bank. As of June 30, 2018, the Company had $4,110 of letters of credit outstanding pursuant to which fees were credited against note investments. Of which, TAO Group had three letters of credit outstanding for $1,500 as of April 1, 2018. See “— Introduction — Factors Affecting Operating Results from Acquisitions — TAO Group’s Operating Results” for further discussion.
69
Cash Flow Discussion
As of June 30, 2018, cash and cash equivalents totaled $1,225,638, as compared to $1,238,114 as of June 30, 2017. The following table summarizes the Company’s cash flow activities for the years ended June 30, 2018, 2017 and 2016:
Years Ended June 30, | ||||||||||||
2018 | 2017 | 2016 | ||||||||||
Net cash provided by operating activities | $ | 220,647 | $ | 216,623 | $ | 125,785 | ||||||
Net cash used in investing activities | (182,357 | ) | (264,301 | ) | (115,690 | ) | ||||||
Net cash provided by (used in) financing activities | (51,097 | ) | (158,525 | ) | 1,420,011 | |||||||
Effect of exchange rates on cash and cash equivalents | 331 | — | — | |||||||||
Net increase (decrease) in cash and cash equivalents | $ | (12,476 | ) | $ | (206,203 | ) | $ | 1,430,106 | ||||
Operating Activities
Net cash provided by operating activities for the year ended June 30, 2018 improved by $4,024 to $220,647 as compared to the prior year primarily due to higher net income adjusted for non-cash items including (i) a reduction in net deferred tax liabilities as a result of the recently enacted Tax Cuts and Jobs Act effective January 1, 2018, (ii) a write-off of deferred production costs associated with the New York Spectacular in the prior year, (iii) an impairment charge to write off the carrying value of the Company’s equity investment in Fuse Media in the prior year, (iv) purchase accounting adjustments related to business acquisitions, primarily fair value adjustments to inventory in fiscal 2017 and favorable/unfavorable lease agreements of the acquiree, partially offset by increases in depreciation and amortization and share-based compensation expense in the current year as compared to the prior year. This increase was offset by (i) a severance-related payment in the current year attributable to a separation agreement with a team executive which was accrued for as of June 30, 2017, (ii) a decrease in cash received related to deferred revenue primarily due to timing, and (iii) higher cash paid in the prior year for the establishment of restricted cash accounts, partially offset by cash received in the current year related to a non-recurring league distribution which was accrued for as of June 30, 2017.
Net cash provided by operating activities for the year ended June 30, 2017 improved by $90,838 to $216,623 as compared to the prior year primarily due to an increase in other assets and liabilities and other non-cash items. The increase in net cash provided by operating activities resulting from changes in assets and liabilities was primarily due to (i) an increase in deferred revenue primarily due to timing, (ii) a decrease in deferred production costs primarily driven by lower spending and higher amortization of deferred production costs during the year ended June 30, 2017 as compared to the prior year, (iii) luxury tax receipts during the current year (for 2015-16 season) as compared to luxury tax payments in the prior year (for 2014-15 season) offset by an increase in a receivable related to non-recurring distributions from the NHL. The increase in operating cash flows from other non-cash items was primarily due to (i) higher share-based compensation expense during the current year as compared to the prior year, (ii) an increase in loss in equity method investments primarily due to a pre-tax, non-cash impairment charge to write off the carrying value of the Company’s equity investment in Fuse Media during the current year, and (iii) amortization of inventory step-up in connection with the TAO Group acquisition. These increases were partially offset by a higher non-cash write-off of deferred production costs associated with the New York Spectacular in the prior year as compared to the current year and a benefit from deferred income taxes in the current year.
Investing Activities
Net cash used in investing activities for the year ended June 30, 2018 decreased by $81,944 to $182,357 as compared to the prior year primarily due to (i) a net decrease in business acquisitions, (ii) repayments received from loans to nonconsolidated affiliates, and (iii) the acquisition of available-for-sale securities in the prior year. These decreases were partially offset by (i) higher capital expenditures in the current year, primarily associated with the purchase of land in London and costs incurred in developing the Company’s new venues in Las Vegas and London, (ii) new investments made in nonconsolidated affiliates, and (iii) a franchise fee payment made in the current year associated with CLG’s membership in the “League of Legends” North American League Championship Series.
Net cash used in investing activities for the year ended June 30, 2017 increased by $148,611 to $264,301 as compared to the prior year largely driven by the acquisition of a controlling interest in TAO Group and, to a lesser extent, the acquisition of available-for sale securities and a controlling interest in BCE during the year ended June 30, 2017. These increases were partially offset by (i) lower capital expenditures primarily due to the purchase of a new aircraft during the prior year, (ii) a net decrease in outstanding loans to nonconsolidated affiliates under the revolving credit facilities, (iii) payments to acquire notes receivable during the prior year, (iv) cash received upon the maturity of a note receivable during the during the year ended June 30, 2017 and (v) a decrease in the Company’s acquisition of its interest in cost method investments as compared to the prior year.
70
Financing Activities
Net cash used in financing activities for the year ended June 30, 2018 decreased by $107,428 to $51,097 as compared to the prior year largely due to lower repurchases of shares of the Company’s Class A Common Stock in the current year as compared to the prior year. This decrease was partially offset by (i) higher taxes paid in lieu of shares issued for equity-based compensation in the current year as compared to the prior year, (ii) distributions to noncontrolling interest holders related to the acquisition of TAO Group in the current year and (iii) a contingent consideration payment related to the acquisition of CLG in the current year.
Net cash used in financing activities for the year ended June 30, 2017 was $158,525 as compared to net cash provided by financing activities in the prior year of $1,420,011. This change is mainly due to net transfers during the prior year from Former Parent which were primarily comprised of a $1,467,093 cash contribution and, to a lesser extent, an increase in repurchases of shares of the Company’s Class A Common Stock during the year ended June 30, 2017.
Contractual Obligations and Off Balance Sheet Arrangements
Future cash payments required under contracts entered into by the Company in the normal course of business and outstanding letters of credit as of June 30, 2018 are summarized in the following table:
_________________
Payments Due by Period | |||||||||||||||||||
Total | Year 1 | Years 2-3 | Years 4-5 | More Than 5 Years | |||||||||||||||
Off balance sheet arrangements: | |||||||||||||||||||
Contractual obligations (a) | $ | 390,821 | $ | 158,193 | $ | 200,317 | $ | 26,465 | $ | 5,846 | |||||||||
Operating lease obligations (b) | 390,669 | 52,164 | 101,046 | 96,578 | 140,881 | ||||||||||||||
Letters of credit (c) | 4,110 | 4,110 | — | — | — | ||||||||||||||
785,600 | 214,467 | 301,363 | 123,043 | 146,727 | |||||||||||||||
Contractual obligations reflected on the balance sheet (d) | 88,395 | 56,483 | 11,783 | 7,462 | 12,667 | ||||||||||||||
Total (e) | $ | 873,995 | $ | 270,950 | $ | 313,146 | $ | 130,505 | $ | 159,394 | |||||||||
(a) | Contractual obligations not reflected on the balance sheet consist principally of the MSG Sports segment’s obligations under employment agreements that the Company has with its professional sports teams’ personnel that are generally guaranteed regardless of employee injury or termination. |
(b) | Operating lease obligations primarily represent future minimum rental payments on various long-term, noncancelable leases for the Company’s venues, including the TAO Group venues, CLG facility, and various corporate offices. |
(c) | Consist of letters of credit obtained by the Company as collateral for lease agreements. |
(d) | Consist primarily of amounts earned under employment agreements that the Company has with certain of its professional sports teams’ personnel in the MSG Sports segment. |
(e) | Pension obligations have been excluded from the table above as the timing of the future cash payments is uncertain. See Note 12 to the consolidated financial statements included in Item 8 of this Annual Report on Form 10-K for more information on the future funding requirements under our pension obligations. |
See “Financing Agreements — Revolving Credit Facilities Provided to Nonconsolidated Affiliates” above for discussion of the revolving credit facilities provided by the Company to AMSGE and Tribeca Enterprises.
In connection with the TAO Group and CLG acquisitions, the Company has accrued contingent consideration liabilities as part of the purchase price. See Note 10 to the consolidated financial statements included in Item 8 of this Annual Report on Form 10-K for further details of the amount reflected on the balance sheet as of June 30, 2018. In addition, see Note 11 to the consolidated financial statements included in Item 8 of this Annual Report on Form 10-K for further details of the principal repayments required under the TAO Term Loan Facility.
MSG and a subsidiary of the Las Vegas Sands Corp. entered into a 50-year ground lease in Las Vegas pursuant to which MSG has agreed to construct a large-scale venue. MSG has announced plans to construct an MSG Sphere on that site. See “Item 1. Business — Our Business — Our Performance Venues — MSG Sphere.”
71
MSG has the right to increase its equity interest in TAO Group through a call right on the equity of the other TAO Group equityholders after the fifth anniversary of the closing date (January 31, 2022) and prior to such date in certain events. The other TAO Group equityholders have the right to put to TAO Group their equity interests in TAO Group after the fifth anniversary of the closing and, in certain circumstances to put to MSG prior to the fifth anniversary. The put and call prices are at fair market value (or in certain circumstances, subject to a discount). Consideration paid upon the exercise of any such put or call right shall be, at MSG’s option, in cash, debt, or MSG Class A Common Stock, subject to certain limitations.
Other Matters
During the 90 day period commencing September 20, 2018, and on each five year anniversary thereafter, as well as in certain other specified circumstances, either of the parties in AMSGE may commence a buy-sell procedure with respect to their interest in the venture.
Seasonality of Our Business
The dependence of the MSG Sports segment on revenues from its NBA and NHL sports teams generally means it earns a disproportionate share of its revenues in the second and third quarters of the Company’s fiscal year. The dependence of the MSG Entertainment segment on revenues from the Christmas Spectacular generally means it earns a disproportionate share of its revenues and operating income in the second quarter of the Company’s fiscal year. In addition, while it does not have a material impact on seasonality of our business, the first and third calendar quarters are seasonally lighter quarters for TAO Group as compared to its second and fourth calendar quarters. As the Company consolidates TAO Group results of operations on a three-month lag basis, the seasonally lighter quarters for TAO will be reflected in the second and fourth quarters of the Company’s fiscal year.
Recently Issued Accounting Pronouncements and Critical Accounting Policies
Recently Issued Accounting Pronouncements
See Note 2 to the consolidated financial statements included in Item 8 of this Annual Report on Form 10-K for discussion of recently issued accounting pronouncements.
Critical Accounting Policies
The preparation of the Company’s consolidated financial statements in conformity with GAAP requires management to make estimates and assumptions about future events. These estimates and the underlying assumptions affect the amounts of assets and liabilities reported, disclosures about contingent assets and liabilities, and reported amounts of revenues and expenses. Management believes its use of estimates in the consolidated financial statements to be reasonable. The significant accounting policies which we believe are the most critical to aid in fully understanding and evaluating our reported financial results include the following:
Multiple-Deliverable Transactions
The Company enters into multiple-deliverable arrangements, primarily multi-year sponsorship agreements. The deliverables included in each sponsorship agreement vary and may include suite licenses, event tickets and various advertising benefits, which include items such as, but not limited to, signage at The Garden and the Company’s other venues. The timing of revenue recognition for each deliverable is dependent upon meeting the revenue recognition criteria for the respective deliverable.
The Company allocates revenue to each deliverable within the arrangement based on its relative selling price. For many deliverables in an arrangement, such as event tickets and certain advertising benefits, the Company has vendor specific objective evidence (“VSOE”) of selling price as it typically sells the same or similar deliverables regularly on a stand-alone basis. Absent VSOE the Company considers whether third party evidence (“TPE”) is available; however, in most instances TPE is not available. The Company’s process for determining its estimated selling prices for deliverables without VSOE or TPE involves management’s judgment and considers multiple factors including company specific and market specific factors that may vary depending upon the unique facts and circumstances related to each deliverable. Key factors considered by the Company in developing a best estimate of selling price for deliverables include, but are not limited to, prices charged for similar deliverables, the Company’s ongoing pricing strategy and policies, and consideration of pricing of similar deliverables sold in other multiple-deliverable agreements.
72
Impairment of Long-Lived and Indefinite-Lived Assets
The Company’s long-lived and indefinite-lived assets accounted for approximately 55% of the Company’s consolidated total assets as of June 30, 2018 and consisted of the following:
Goodwill | $ | 392,513 | |
Indefinite-lived intangible assets | 174,850 | ||
Amortizable intangible assets, net of accumulated amortization | 243,806 | ||
Property and equipment, net | 1,253,671 | ||
$ | 2,064,840 | ||
In assessing the recoverability of the Company’s long-lived and indefinite-lived assets, the Company must make estimates and assumptions regarding future cash flows and other factors to determine the fair value of the respective assets. These estimates and assumptions could have a significant impact on whether an impairment charge is recognized and also the magnitude of any such charge. Fair value estimates are made at a specific point in time, based on relevant information. These estimates are subjective in nature and involve significant uncertainties and judgments and therefore cannot be determined with precision. Changes in assumptions could significantly affect the estimates. If these estimates or material related assumptions change in the future, the Company may be required to record impairment charges related to its long-lived and/or indefinite-lived assets.
Goodwill
Goodwill is tested annually for impairment as of August 31st and at any time upon the occurrence of certain events or changes in circumstances. The Company performs its goodwill impairment test at the reporting unit level, which is one level below the operating segment level. The Company has two operating and reportable segments, MSG Entertainment and MSG Sports, consistent with the way management makes decisions and allocates resources to the business.
For purposes of evaluating goodwill for impairment, the Company has three reporting units across its two operating segments, which are MSG Sports, MSG Entertainment and TAO Group. TAO Group was acquired after the annual goodwill impairment test for fiscal year 2017 and represents a separate reporting unit within the MSG Entertainment segment for goodwill impairment testing.
The goodwill balance reported on the Company’s consolidated balance sheet as of June 30, 2018 by reporting unit was as follows:
MSG Sports (a) | $ | 226,955 | |
MSG Entertainment (a) | 76,975 | ||
TAO Group (a) | 88,583 | ||
$ | 392,513 | ||
(a) | The goodwill balance reported on the Company’s consolidated balance sheet as of June 30, 2018, as compared to June 30, 2017, increased by $12,426. The net increase primarily reflects: (i) purchase price allocations for the CLG and Obscura acquisitions and (ii) measurement period adjustments for certain assets and liabilities for the TAO Group acquisition. See Note 3 and Note 7 to the consolidated financial statements included in Item 8 of this Annual Report on Form 10-K for discussion of these acquisitions. |
The Company has the option to perform a qualitative assessment to determine if an impairment is more likely than not to have occurred. If the Company can support the conclusion that it is not more likely than not that the fair value of a reporting unit is less than its carrying amount, the Company would not need to perform the two-step impairment test for that reporting unit. If the Company cannot support such a conclusion or the Company does not elect to perform the qualitative assessment, the first step of the goodwill impairment test is used to identify potential impairment by comparing the fair value of a reporting unit with its carrying amount, including goodwill. The estimates of the fair value of the Company’s reporting units are primarily determined using discounted cash flows and comparable market transactions. These valuations are based on estimates and assumptions including projected future cash flows, discount rates, determination of appropriate market comparables and the determination of whether a premium or discount should be applied to comparables. Significant judgments inherent in a discounted cash flow analysis include the selection of the appropriate discount rate, the estimate of the amount and timing of projected future cash flows and identification of appropriate continuing growth rate assumptions. The discount rates used in the analysis are intended to reflect the risk inherent in the projected future cash flows. If the carrying amount of a reporting unit exceeds its fair value, the second step of the goodwill impairment test is performed to measure the amount of impairment loss, if any. The second step of the goodwill impairment test compares the implied fair value of the reporting unit’s goodwill with the carrying amount of that goodwill. If the carrying amount of the reporting unit’s goodwill exceeds the implied fair value of that goodwill, an impairment
73
loss is recognized in an amount equal to that excess. The implied fair value of goodwill is determined in the same manner as the amount of goodwill that would be recognized in a business combination.
The Company elected to perform the qualitative assessment of impairment for all of the Company’s reporting units for the fiscal year 2018 impairment test, and for the MSG Sports reporting unit for the fiscal year 2017 impairment test. These assessments considered factors such as:
• | macroeconomic conditions; |
• | industry and market considerations; |
• | cost factors; |
• | overall financial performance of the reporting unit; |
• | other relevant company-specific factors such as changes in management, strategy or customers; and |
• | relevant reporting unit specific events such as changes in the carrying amount of net assets. |
The Company performed the quantitative assessment of impairment for the MSG Entertainment reporting unit for the fiscal year 2017 impairment test. For MSG Entertainment, the valuation of the reporting unit in fiscal year 2017 included assumptions for the number and expected financial performance of live entertainment events and productions, which include, but are not limited to, the level of ticket sales, concessions and sponsorships.
The Company performed its most recent annual impairment test of goodwill during the first quarter of fiscal year 2018, and there was no impairment of goodwill identified for any of its reporting units. Based on these impairment tests, the Company’s MSG Sports, MSG Entertainment and TAO Group reporting units had sufficient safety margins, defined as the excess of the amount by which the estimated fair value of each reporting unit exceeded the respective carrying value of each reporting unit (including goodwill allocated to each respective reporting unit). For MSG Sports and MSG Entertainment the most recent quantitative assessments were used in making this determination and due to the proximity of the acquisition date for TAO Group to the goodwill impairment test date, the initial purchase price was assumed to be the fair value of the TAO Group reporting unit for purposes of the goodwill impairment test. The Company believes that if the fair value of a reporting unit exceeds its carrying value by greater than 10%, a sufficient safety margin has been realized.
Identifiable Indefinite-Lived Intangible Assets
Identifiable indefinite-lived intangible assets are tested annually for impairment as of August 31st and at any time upon the occurrence of certain events or substantive changes in circumstances. The following table sets forth the amount of identifiable indefinite-lived intangible assets reported in the Company’s consolidated balance sheet as of June 30, 2018 by reportable segment:
Sports franchises (MSG Sports segment) (a) | $ | 109,429 | |
Trademarks (MSG Entertainment segment) | 62,421 | ||
Photographic related rights (MSG Sports segment) | 3,000 | ||
$ | 174,850 | ||
(a) | The Identifiable Indefinite-Lived Intangible Assets balance reported on the Company’s consolidated balance sheet as of June 30, 2018, as compared to June 30, 2017, increased by $8,000, which reflects a franchise fee associated with CLG’s membership in the “League of Legends” North American League Championship Series. |
74
The Company has the option to perform a qualitative assessment to determine if an impairment is more likely than not to have occurred. In the qualitative assessment, the Company must evaluate the totality of qualitative factors, including any recent fair value measurements, that impact whether an indefinite-lived intangible asset other than goodwill has a carrying amount that more likely than not exceeds its fair value. The Company must proceed to conducting a quantitative analysis, if the Company (i) determines that such an impairment is more likely than not to exist, or (ii) forgoes the qualitative assessment entirely. Under the quantitative assessment, the impairment test for identifiable indefinite-lived intangible assets consists of a comparison of the estimated fair value of the intangible asset with its carrying value. If the carrying value of the intangible asset exceeds its fair value, an impairment loss is recognized in an amount equal to that excess. For all periods presented, the Company elected to perform a qualitative assessment of impairment for the indefinite-lived intangible assets in the MSG Sports segment and the majority of the trademarks in the MSG Entertainment segment. These assessments considered the events and circumstances that could affect the significant inputs used to determine the fair value of the intangible asset. Examples of such events and circumstances include:
• | cost factors; |
• | financial performance; |
• | legal, regulatory, contractual, business or other factors; |
• | other relevant company-specific factors such as changes in management, strategy or customers; |
• | industry and market considerations; and |
• | macroeconomic conditions. |
For the fiscal year 2017 impairment test, the Company performed the quantitative assessment of impairment for a certain trademark reported in the MSG Entertainment segment. The Company applied the relief from royalty method to determine the fair value of this intangible asset.
The Company performed its most recent annual impairment test of identifiable indefinite-lived intangible assets during the first quarter of fiscal year 2018, and there were no impairments identified. Based on these impairment tests, the Company’s indefinite-lived intangible assets had sufficient safety margins, representing the excess of each identifiable indefinite-lived intangible asset’s estimated fair value over its respective carrying value. The Company believes that if the fair value of an indefinite-lived intangible asset exceeds its carrying value by greater than 10%, a sufficient safety margin has been realized.
Other Long-Lived Assets
For other long-lived assets, including intangible assets that are amortized, the Company evaluates assets for recoverability when there is an indication of potential impairment. If the undiscounted cash flows from a group of assets being evaluated is less than the carrying value of that group of assets, the fair value of the asset group is determined and the carrying value of the asset group is written down to fair value.
The estimated useful lives and net carrying values of the Company’s intangible assets subject to amortization as of June 30, 2018 are as follows:
Estimated Useful Lives | Net Carrying Value | ||||
Trade names | 5 to 25 years | $ | 95,172 | ||
Venue management contracts | 12 to 25 years | 73,676 | |||
Favorable lease assets | 1.5 to 16 years | 48,567 | |||
Season ticket holder relationships | 15 years | 5,826 | |||
Non-compete agreements | 5 to 5.75 years | 9,134 | |||
Festival rights | 15 years | 7,002 | |||
Other intangibles | 0.3 to 15 years | 4,429 | |||
$ | 243,806 | ||||
The Company has recognized intangible assets for trade names, venue management contracts, favorable lease assets, season ticket holder relationships, non-compete agreements, festival rights and other intangibles as a result of purchase accounting. The Company has determined that these intangible assets have finite lives.
75
The useful lives of the Company’s long-lived assets are based on estimates of the period over which the Company expects the assets to be of economic benefit to the Company. In estimating the useful lives, the Company considers factors such as, but not limited to, risk of obsolescence, anticipated use, plans of the Company, and applicable laws and permit requirements. In light of these facts and circumstances, the Company has determined that its estimated useful lives are appropriate.
Contingent Consideration
Some of the Company’s acquisition agreements include contingent earn-out arrangements, which are generally based on the achievement of future operating targets.
The fair values of these earn-out arrangements are included as part of the purchase price of the acquired companies on their respective acquisition dates. For each transaction, the Company estimates the fair value of contingent earn-out payments as part of the initial purchase price and records the estimated fair value of contingent consideration that the Company will pay to the former owners as a liability in Other liabilities on the consolidated balance sheets.
The Company measures its contingent earn-out liabilities at fair value on a recurring basis using significant unobservable inputs classified within Level III of the fair value hierarchy, which can result in a significantly higher or lower liability with a higher liability capped by the contractual maximum of the contingent earn-out obligation. Ultimately, the liability will be equivalent to the amount paid, and the difference between the fair value estimate and amount paid will be recorded in earnings.
See Note 10 to the consolidated financial statements included in Item 8 of this Annual Report on Form 10-K for more information regarding the fair value of the Company’s contingent consideration liabilities related to the acquisition of TAO Group and CLG.
Defined Benefit Pension Plans and Other Postretirement Benefit Plan
The Company utilizes actuarial methods to calculate pension and other postretirement benefit obligations and the related net periodic benefit cost which are based on actuarial assumptions. Key assumptions, the discount rates and the expected long-term rate of return on plan assets, are important elements of the plans’ expense and liability measurement and we evaluate these key assumptions annually. Other assumptions include demographic factors, such as mortality, retirement age and turnover. The actuarial assumptions used by the Company may differ materially from actual results due to various factors, including, but not limited to, changing economic and market conditions. Differences between actual and expected occurrences could significantly impact the actual amount of net periodic benefit cost and the benefit obligation recorded by the Company. Material changes in the costs of the plans may occur in the future due to changes in these assumptions, changes in the number of the plan participants, changes in the level of benefits provided, changes in asset levels and changes in legislation. Our assumptions reflect our historical experience and our best estimate regarding future expectations.
Accumulated and projected benefit obligations reflect the present value of future cash payments for benefits. We use the Willis Towers Watson U.S. Rate Link: 40-90 Discount Rate Model (which is developed by examining the yields on selected highly rated corporate bonds) to discount these benefit payments on a plan by plan basis, to select a rate at which we believe each plan’s benefits could be effectively settled. Effective July 1, 2016, the Company changed the approach used to measure service and interest cost components of net periodic benefit costs for Pension Plans and Postretirement Plan (as defined in Note 12 to the consolidated financial statements included in Item 8 of this Annual Report on Form 10-K), by electing to measure service and interest costs by applying the specific spot rates along that yield curve to the plans’ liability cash flows (“Spot Rate Approach”). The Company believes the Spot Rate Approach provides a more accurate measurement of service and interest costs by improving the correlation between projected benefit cash flows and their corresponding spot rates on the yield curve. This was accounted for as a change in accounting estimate, and thus was applied prospectively.
Lower discount rates increase the present value of benefit obligations and will usually increase the subsequent year’s net periodic benefit cost. The weighted-average discount rates used to determine benefit obligations as of June 30, 2018 for the Company’s Pension Plans and Postretirement Plan were 4.19% and 4.06%, respectively. A 25 basis point decrease in each of these assumed discount rates would increase the projected benefit obligations for the Company’s Pension Plans and Postretirement Plan at June 30, 2018 by $5,270 and $140, respectively. The weighted-average discount rates used to determine service cost, interest cost and the projected benefit obligation components of net periodic benefit cost were 3.93%, 3.32% and 3.81%, respectively, for the year ended June 30, 2018 for the Company’s Pension Plans. The weighted-average discount rates used to determine service cost, interest cost and the projected benefit obligation components of net periodic benefit cost were 3.83%, 3.05% and 3.54%, respectively, for the year ended June 30, 2018 for the Company’s Postretirement Plan. A 25 basis point decrease in these assumed discount rates would increase the total net periodic benefit cost for the Company’s Pension Plans by $70 and decrease net periodic benefit cost for Postretirement Plan by $9 for the year ended June 30, 2018.
76
The expected long-term return on plan assets is based on a periodic review and modeling of the plans’ asset allocation structures over a long-term horizon. Expectations of returns for each asset class are the most important of the assumptions used in the review and modeling, and are based on comprehensive reviews of historical data, forward-looking economic outlook, and economic/financial market theory. The expected long-term rate of return was selected from within the reasonable range of rates determined by (a) historical real returns, net of inflation, for the asset classes covered by the investment policy, and (b) projections of inflation over the long-term period during which benefits are payable to plan participants. The expected long-term rate of return on plan assets for the Company’s funded pension plans was 3.46% for the year ended June 30, 2018.
Performance of the capital markets affects the value of assets that are held in trust to satisfy future obligations under the Company’s funded plans. Adverse market performance in the future could result in lower rates of return for these assets than projected by the Company which could increase the Company’s funding requirements related to these plans, as well as negatively affect the Company’s operating results by increasing the net periodic benefit cost. A 25 basis point decrease in the long-term return on pension plan assets assumption would increase net periodic pension benefit cost by $291 for the year ended June 30, 2018.
Another important assumption for our Postretirement Plan is healthcare cost trend rates. We developed our estimate of the healthcare cost trend rates through examination of the Company’s claims experience and the results of recent healthcare trend surveys.
Assumptions for healthcare cost trend rates used to determine the net periodic benefit cost and benefit obligation for our Postretirement Plan as of and for the year ended June 30, 2018 are as follows:
Net Periodic Benefit Cost | Benefit Obligation | ||
Healthcare cost trend rate assumed for next year | 7.25% | 7.00% | |
Rate to which the cost trend rate is assumed to decline (the ultimate trend rate) | 5.00% | 5.00% | |
Year that the rate reaches the ultimate trend rate | 2027 | 2027 | |
A one percentage point change in assumed healthcare cost trend rates would have the following effects on the net periodic postretirement benefit cost and benefit obligation for our postretirement plan as of and for the year ended June 30, 2018:
Increase (Decrease) on Total of Service and Interest Cost Components | Increase (Decrease) on Benefit Obligation | ||||||
One percentage point increase | $ | 37 | $ | 597 | |||
One percentage point decrease | (33 | ) | (537 | ) | |||
GAAP includes mechanisms that serve to limit the volatility in the Company’s earnings that otherwise would result from recording changes in the value of plan assets and benefit obligations in our consolidated financial statements in the periods in which those changes occur. For example, while the expected long-term rate of return on the plans’ assets should, over time, approximate the actual long-term returns, differences between the expected and actual returns could occur in any given year. These differences contribute to the deferred actuarial gains or losses, which are then amortized over time.
See Note 12 to the consolidated financial statements included in Item 8 of this Annual Report on Form 10-K for more information on our pension plans and other postretirement benefit plan.
77
Item 7A. Quantitative and Qualitative Disclosures About Market Risk
For sensitivity analysis and other information regarding market risks we face in connection with our Pension Plans and Postretirement Plan, see “Item 7. Management’s Discussion and Analysis of Financial Condition and Results of Operations — Recently Issued Accounting Pronouncements and Critical Accounting Policies — Critical Accounting Policies — Defined Benefit Pension Plans and Other Postretirement Benefit Plan,” which information is incorporated by reference herein.
Borrowings under our Knicks Revolving Credit Facility, Knicks Unsecured Credit Facility and Rangers Revolving Credit Facility, collectively, the “MSG Credit Facilities,” would incur interest, depending on our election, at a floating rate based upon LIBOR, the U.S. Federal Funds Rate or the U.S. Prime Rate, plus, in each case, a fixed spread. If appropriate, we may seek to reduce such exposure through the use of interest rate swaps or similar instruments. See “Item 7. Management’s Discussion and Analysis of Financial Condition and Results of Operations — Liquidity and Capital Resources — Financing Agreements” for more information on our MSG Credit Facilities. We currently have no interest rate risk exposure with our MSG Credit Facilities as we have no debt outstanding under our MSG Credit Facilities.
Borrowings under the TAO Credit Facilities incur interest, depending on TAOG’s election, at a floating rate based upon LIBOR, the U.S. Federal Funds Rate or the U.S. Prime Rate, plus, in each case, an additional spread which is dependent upon the net total leverage ratio at the time. Accordingly, TAO Credit Facilities are subject to interest rate risk with respect to the tenor of any borrowings incurred. The effect of a hypothetical 100 basis point increase in floating interest rates prevailing as of April 1, 2018 and continuing for a full year would increase interest expense of the TAO Term Loan Facility amount outstanding by $1,093. If appropriate, the TAO entities may seek to reduce such exposure through the use of interest rate swaps or similar instruments that qualify for hedge accounting treatment. See “Item 7. Management’s Discussion and Analysis of Financial Condition and Results of Operations — Liquidity and Capital Resources — Financing Agreements” for more information on the TAO Credit Facilities.
We are exposed to market risk resulting from foreign currency fluctuations, primarily to the British pound sterling through our net investment position initiated with our acquisition of land in London. We may evaluate and decide, to the extent desired and practical, to reduce the translation risk of foreign currency fluctuations on this underlying nonfunctional currency exposure by entering into foreign currency forward exchange contracts with financial institutions. If we were to enter into such hedging transactions, the market risk resulting from foreign currency fluctuations is unlikely to be entirely eliminated. We do not plan to enter into derivative financial instrument transactions for foreign currency speculative purposes.
As of June 30, 2018, a uniform hypothetical 5% fluctuation in the GBP/USD exchange rate would have resulted in a change of approximately $5,229 in net asset value. For additional information, see “Item 8. Financial Statements and Supplementary Data — Consolidated Financial Statements — Notes to Consolidated Financial Statements — Note 8. Property and Equipment” for discussion of our recent acquisition of land in London.
We do not have any meaningful commodity risk exposures associated with the operation of our venues.
78
Item 8. Financial Statements and Supplementary Data
The Financial Statements required by this Item 8 appear beginning on page F-1 of this Annual Report on Form 10-K, and are incorporated by reference herein.
Item 9. Changes in and Disagreements with Accountants on Accounting and Financial Disclosure
None.
Item 9A. Controls and Procedures
Evaluation of Disclosure Controls and Procedures
An evaluation was carried out under the supervision and with the participation of the Company’s management, including our Chief Executive Officer and Chief Financial Officer, of the effectiveness of the design and operation of our disclosure controls and procedures (as defined in Rules 13a-15(e) and 15d-15(e) under the Exchange Act) as of the end of the period covered by this report. Based upon that evaluation, the Company’s Chief Executive Officer and Chief Financial Officer concluded that as of June 30, 2018 the Company’s disclosure controls and procedures were effective.
Management’s Report on Internal Control over Financial Reporting
Management is responsible for establishing and maintaining adequate internal control over financial reporting, as such term is defined in Rule 13a-15(f) under the Exchange Act. The Company’s internal control over financial reporting includes those policies and procedures that (i) pertain to the maintenance of records that, in reasonable detail, accurately and fairly reflect the transactions and dispositions of the assets of the Company; (ii) provide reasonable assurance that transactions are recorded as necessary to permit preparation of financial statements in accordance with generally accepted accounting principles, and that receipts and expenditures of the Company are being made only in accordance with authorizations of management and directors of the Company; and (iii) provide reasonable assurance regarding prevention or timely detection of unauthorized acquisition, use, or disposition of the Company’s assets that could have a material effect on the financial statements.
Internal control over financial reporting is designed to provide reasonable assurance regarding the reliability of financial reporting and the preparation of financial statements prepared for external purposes in accordance with generally accepted accounting principles. Because of its inherent limitations, internal control over financial reporting may not prevent or detect misstatements. Also, projections of any evaluation of effectiveness to future periods are subject to the risk that controls may become inadequate because of changes in conditions, or that the degree of compliance with the policies or procedures may deteriorate.
Under the supervision and with the participation of management, including the Company’s Chief Executive Officer and Chief Financial Officer, we conducted an evaluation of the effectiveness of our internal control over financial reporting based on the framework in Internal Control — Integrated Framework (2013) issued by the Committee of Sponsoring Organizations of the Treadway Commission. Based on the results of this evaluation, our management concluded that our internal control over financial reporting was effective as of June 30, 2018.
The effectiveness of our internal control over financial reporting as of June 30, 2018 has been audited by KPMG LLP, an independent registered public accounting firm, as stated in their report which is included herein.
Changes in Internal Control over Financial Reporting
There were no changes in the Company’s internal control over financial reporting (as such term is defined in Rules 13a-15(f) and 15d-15(f) under the Exchange Act) during the fiscal quarter ended June 30, 2018 that have materially affected, or are reasonably likely to materially affect, the Company’s internal control over financial reporting.
Item 9B. Other Information
None.
79
PART III
Item 10. Directors, Executive Officers and Corporate Governance
Information relating to our directors, executive officers and corporate governance will be included in the proxy statement for the 2018 annual meeting of the Company’s stockholders, which is expected to be filed within 120 days of our fiscal year end, and is incorporated herein by reference.
Item 11. Executive Compensation
Information relating to executive compensation will be included in the proxy statement for the 2018 annual meeting of the Company’s stockholders, which is expected to be filed within 120 days of our fiscal year end, and is incorporated herein by reference.
Item 12. Security Ownership of Certain Beneficial Owners and Management and Related Stockholder Matters
Information relating to the beneficial ownership of our common stock will be included in the proxy statement for the 2018 annual meeting of the Company’s stockholders, which is expected to be filed within 120 days of our fiscal year end, and is incorporated herein by reference.
Item 13. Certain Relationships and Related Transactions, and Director Independence
Information relating to certain relationships and related transactions and director independence will be included in the proxy statement for the 2018 annual meeting of the Company’s stockholders, which is expected to be filed within 120 days of our fiscal year end, and is incorporated herein by reference.
Item 14. Principal Accountant Fees and Services
Information relating to principal accountant fees and services will be included in the proxy statement for the 2018 annual meeting of the Company’s stockholders, which is expected to be filed within 120 days of our fiscal year end, and is incorporated herein by reference.
80
PART IV
Item 15. Exhibits and Financial Statement Schedules
Page No. | |||
The following documents are filed as part of this report: | |||
1. | The financial statements as indicated in the index set forth on page | ||
2. | Financial statement schedule: | ||
Schedule supporting consolidated financial statements: | |||
Schedules other than that listed above have been omitted, since they are either not applicable, not required or the information is included elsewhere herein. | |||
3. | Exhibits: | ||
EXHIBIT NO. | DESCRIPTION | |
81
EXHIBIT NO. | DESCRIPTION | |
82
EXHIBIT NO. | DESCRIPTION | |
83
EXHIBIT NO. | DESCRIPTION | |
84
EXHIBIT NO. | DESCRIPTION | |
101.INS | XBRL Instance Document. | |
101.SCH | XBRL Taxonomy Extension Schema. | |
101.CAL | XBRL Taxonomy Extension Calculation Linkbase. | |
101.DEF | XBRL Taxonomy Extension Definition Linkbase. | |
101.LAB | XBRL Taxonomy Extension Label Linkbase. | |
101.PRE | XBRL Taxonomy Extension Presentation Linkbase. | |
+ | Confidential treatment has been granted with respect to certain portions of this exhibit. Omitted portions have been filed separately with the Securities and Exchange Commission. |
** | Confidential treatment has been requested with respect to certain portions of this exhibit. Omitted portions have been filed separately with the Securities and Exchange Commission. |
† | This exhibit is a management contract or a compensatory plan or arrangement. |
Item 16. Form 10-K Summary
The Company has elected not to provide summary information.
85
THE MADISON SQUARE GARDEN COMPANY
SCHEDULE II
VALUATION AND QUALIFYING ACCOUNTS
(in thousands)
(Additions) / Deductions | ||||||||||||||||||||||||
Balance at Beginning of Period | Charged to Costs and Expenses | Charged to Other Accounts | Deductions | Balance at End of Period | ||||||||||||||||||||
Year ended June 30, 2018 | ||||||||||||||||||||||||
Allowance for doubtful accounts | $ | (601 | ) | $ | (647 | ) | $ | — | $ | 471 | $ | (777 | ) | |||||||||||
Deferred tax valuation allowance | (218,639 | ) | 130,393 | (a) | — | — | (88,246 | ) | ||||||||||||||||
$ | (219,240 | ) | $ | 129,746 | $ | — | $ | 471 | $ | (89,023 | ) | |||||||||||||
Year ended June 30, 2017 | ||||||||||||||||||||||||
Allowance for doubtful accounts | $ | (1,282 | ) | $ | (111 | ) | $ | — | $ | 792 | $ | (601 | ) | |||||||||||
Deferred tax valuation allowance | (190,602 | ) | (30,697 | ) | — | 2,660 | (b) | (218,639 | ) | |||||||||||||||
$ | (191,884 | ) | $ | (30,808 | ) | $ | — | $ | 3,452 | $ | (219,240 | ) | ||||||||||||
Year ended June 30, 2016 | ||||||||||||||||||||||||
Allowance for doubtful accounts | $ | (467 | ) | $ | (31 | ) | $ | (914 | ) | (c) | $ | 130 | $ | (1,282 | ) | |||||||||
Deferred tax valuation allowance | (171,336 | ) | (31,301 | ) | — | 12,035 | (d) | (190,602 | ) | |||||||||||||||
$ | (171,803 | ) | $ | (31,332 | ) | $ | (914 | ) | $ | 12,165 | $ | (191,884 | ) | |||||||||||
(a) | Net decrease in valuation allowance reflects $51,015 of reduction to net deferred tax liabilities in connection with the lower Federal income tax rate of 21% and other of $2,453. |
(b) | Net decrease in valuation allowance is primarily due to the reclassification of tax impact to the accumulated other comprehensive loss. |
(c) | The increase was primarily due to a balance transfer made in connection with the Distribution. |
(d) | Net decrease in valuation allowance represents $15,613 for pre-Distribution activity partially offset by $3,578 recorded to accumulated other comprehensive loss. |
86
SIGNATURES
Pursuant to the requirements of the Section 13 or 15(d) the Securities Exchange Act of 1934, as amended, the Registrant has duly caused this report to be signed on its behalf by the undersigned, thereunto duly authorized, on the 16th day of August 2018.
The Madison Square Garden Company | ||
By: | /s/ DONNA COLEMAN | |
Name: | Donna Coleman | |
Title: | Executive Vice President and Chief Financial Officer | |
POWER OF ATTORNEY
KNOW ALL MEN BY THESE PRESENTS, that each person whose signature appears below constitutes and appoints Andrew Lustgarten and Donna Coleman, and each of them, as such person’s true and lawful attorneys-in-fact and agents, with full power of substitution and resubstitution, for such person in such person’s name, place and stead, in any and all capacities, to sign this report, and file the same, with all exhibits thereto, and other documents in connection therewith, with the Securities and Exchange Commission, granting unto said attorneys-in-fact and agents, full power and authority to do and perform each and every act and thing requisite and necessary to be done as fully to all intents and purposes as he might or could do in person, hereby ratifying and confirming all that said attorneys-in-fact and agents or any of them may lawfully do or cause to be done by virtue hereof.
Pursuant to the requirements of the Securities Exchange Act of 1934, as amended, this report has been signed below by the following persons in the capacities and on the dates indicated.
Name | Title | Date | ||
/s/ JAMES L. DOLAN | Executive Chairman and Chief Executive Officer (Principal Executive Officer) and Director | August 16, 2018 | ||
James L. Dolan | ||||
/s/ DONNA COLEMAN | Executive Vice President and Chief Financial Officer (Principal Financial Officer) | August 16, 2018 | ||
Donna Coleman | ||||
/s/ JOSEPH F. YOSPE | Senior Vice President, Controller and Principal Accounting Officer | August 16, 2018 | ||
Joseph F. Yospe | ||||
/s/ FRANK J. BIONDI, JR. | Director | August 16, 2018 | ||
Frank J. Biondi, Jr. | ||||
/s/ CHARLES F. DOLAN | Director | August 16, 2018 | ||
Charles F. Dolan | ||||
/s/ CHARLES P. DOLAN | Director | August 16, 2018 | ||
Charles P. Dolan | ||||
/s/ KRISTIN A. DOLAN | Director | August 16, 2018 | ||
Kristin A. Dolan | ||||
87
Name | Title | Date | ||
/s/ MARIANNE DOLAN WEBER | Director | August 16, 2018 | ||
Marianne Dolan Weber | ||||
/s/ THOMAS C. DOLAN | Director | August 16, 2018 | ||
Thomas C. Dolan | ||||
/s/ JOSEPH J. LHOTA | Director | August 16, 2018 | ||
Joseph J. Lhota | ||||
/s/ RICHARD D. PARSONS | Director | August 16, 2018 | ||
Richard D. Parsons | ||||
/s/ NELSON PELTZ | Director | August 16, 2018 | ||
Nelson Peltz | ||||
/s/ ALAN D. SCHWARTZ | Director | August 16, 2018 | ||
Alan D. Schwartz | ||||
/s/ SCOTT M. SPERLING | Director | August 16, 2018 | ||
Scott M. Sperling | ||||
/s/ BRIAN G. SWEENEY | Director | August 16, 2018 | ||
Brian G. Sweeney | ||||
/s/ VINCENT TESE | Director | August 16, 2018 | ||
Vincent Tese | ||||
88
INDEX TO CONSOLIDATED FINANCIAL STATEMENTS
Page | |
F- 1
Report of Independent Registered Public Accounting Firm
To the Stockholders and Board of Directors
The Madison Square Garden Company:
Opinion on the Consolidated Financial Statements
We have audited the accompanying consolidated balance sheets of The Madison Square Garden Company and subsidiaries (the “Company”) as of June 30, 2018 and 2017, and the related consolidated statements of operations, comprehensive income (loss), equity and redeemable noncontrolling interests and cash flows for each of the years in the three-year period ended June 30, 2018, and the related notes and financial statement schedule II (collectively, the “consolidated financial statements”). In our opinion, the consolidated financial statements present fairly, in all material respects, the financial position of the Company as of June 30, 2018 and 2017, the results of its operations and its cash flows for each of the years in the three-year period ended June 30, 2018, in conformity with U.S. generally accepted accounting principles.
We also have audited, in accordance with the standards of the Public Company Accounting Oversight Board (United States) (“PCAOB”), the Company’s internal control over financial reporting as of June 30, 2018, based on criteria established in Internal Control — Integrated Framework (2013) issued by the Committee of Sponsoring Organizations of the Treadway Commission, and our report dated 8/16/2018 expressed an unqualified opinion on the effectiveness of the Company’s internal control over financial reporting.
Basis for Opinion
These consolidated financial statements are the responsibility of the Company’s management. Our responsibility is to express an opinion on these consolidated financial statements based on our audits. We are a public accounting firm registered with the PCAOB and are required to be independent with respect to the Company in accordance with the U.S. federal securities laws and the applicable rules and regulations of the Securities and Exchange Commission and the PCAOB.
We conducted our audits in accordance with the standards of the PCAOB. Those standards require that we plan and perform the audit to obtain reasonable assurance about whether the consolidated financial statements are free of material misstatement, whether due to error or fraud. Our audits included performing procedures to assess the risks of material misstatement of the consolidated financial statements, whether due to error or fraud, and performing procedures that respond to those risks. Such procedures included examining, on a test basis, evidence regarding the amounts and disclosures in the consolidated financial statements. Our audits also included evaluating the accounting principles used and significant estimates made by management, as well as evaluating the overall presentation of the consolidated financial statements. We believe that our audits provide a reasonable basis for our opinion.
/s/ KPMG LLP
We have served as the Company’s auditor since 2015.
New York, New York
August 16, 2018
F- 2
Report of Independent Registered Public Accounting Firm
To the Stockholders and Board of Directors
The Madison Square Garden Company:
Opinion on Internal Control Over Financial Reporting
We have audited The Madison Square Garden Company’s (the “Company”) internal control over financial reporting as of June 30, 2018, based on criteria established in Internal Control — Integrated Framework (2013) issued by the Committee of Sponsoring Organizations of the Treadway Commission. In our opinion, the Company maintained, in all material respects, effective internal control over financial reporting as of June 30, 2018, based on criteria established in Internal Control — Integrated Framework (2013) issued by the Committee of Sponsoring Organizations of the Treadway Commission.
We also have audited, in accordance with the standards of the Public Company Accounting Oversight Board (United States) (“PCAOB”), the consolidated balance sheets of the Company as of June 30, 2018 and 2017, the related consolidated statements of operations, comprehensive income (loss), equity and redeemable noncontrolling interests, and cash flows for each of the years in the three-year period ended June 30, 2018, and the related notes and financial statement schedule II (collectively, the “consolidated financial statements”), and our report dated 8/16/2018 expressed an unqualified opinion on those consolidated financial statements.
Basis for Opinion
The Company’s management is responsible for maintaining effective internal control over financial reporting and for its assessment of the effectiveness of internal control over financial reporting, included in the accompanying Management’s Report on Internal Control over Financial Reporting. Our responsibility is to express an opinion on the Company’s internal control over financial reporting based on our audit. We are a public accounting firm registered with the PCAOB and are required to be independent with respect to the Company in accordance with the U.S. federal securities laws and the applicable rules and regulations of the Securities and Exchange Commission and the PCAOB.
We conducted our audit in accordance with the standards of the PCAOB. Those standards require that we plan and perform the audit to obtain reasonable assurance about whether effective internal control over financial reporting was maintained in all material respects. Our audit of internal control over financial reporting included obtaining an understanding of internal control over financial reporting, assessing the risk that a material weakness exists, and testing and evaluating the design and operating effectiveness of internal control based on the assessed risk. Our audit also included performing such other procedures as we considered necessary in the circumstances. We believe that our audit provides a reasonable basis for our opinion.
Definition and Limitations of Internal Control Over Financial Reporting
A company’s internal control over financial reporting is a process designed to provide reasonable assurance regarding the reliability of financial reporting and the preparation of financial statements for external purposes in accordance with generally accepted accounting principles. A company’s internal control over financial reporting includes those policies and procedures that (1) pertain to the maintenance of records that, in reasonable detail, accurately and fairly reflect the transactions and dispositions of the assets of the company; (2) provide reasonable assurance that transactions are recorded as necessary to permit preparation of financial statements in accordance with generally accepted accounting principles, and that receipts and expenditures of the company are being made only in accordance with authorizations of management and directors of the company; and (3) provide reasonable assurance regarding prevention or timely detection of unauthorized acquisition, use, or disposition of the company’s assets that could have a material effect on the financial statements.
Because of its inherent limitations, internal control over financial reporting may not prevent or detect misstatements. Also, projections of any evaluation of effectiveness to future periods are subject to the risk that controls may become inadequate because of changes in conditions, or that the degree of compliance with the policies or procedures may deteriorate.
/s/ KPMG LLP
New York, New York
August 16, 2018
F- 3
THE MADISON SQUARE GARDEN COMPANY
CONSOLIDATED BALANCE SHEETS
(in thousands, except per share data)
June 30, | ||||||||
2018 | 2017 | |||||||
ASSETS | ||||||||
Current Assets: | ||||||||
Cash and cash equivalents | $ | 1,225,638 | $ | 1,238,114 | ||||
Restricted cash | 30,982 | 34,000 | ||||||
Accounts receivable, net | 100,725 | 102,085 | ||||||
Net related party receivables | 567 | 2,714 | ||||||
Prepaid expenses | 28,761 | 23,358 | ||||||
Other current assets | 28,996 | 49,458 | ||||||
Total current assets | 1,415,669 | 1,449,729 | ||||||
Investments and loans to nonconsolidated affiliates | 209,951 | 242,287 | ||||||
Property and equipment, net | 1,253,671 | 1,159,271 | ||||||
Amortizable intangible assets, net | 243,806 | 256,975 | ||||||
Indefinite-lived intangible assets | 174,850 | 166,850 | ||||||
Goodwill | 392,513 | 380,087 | ||||||
Other assets | 45,713 | 57,554 | ||||||
Total assets | $ | 3,736,173 | $ | 3,712,753 | ||||
LIABILITIES, REDEEMABLE NONCONTROLLING INTERESTS AND EQUITY | ||||||||
Current Liabilities: | ||||||||
Accounts payable | $ | 28,939 | $ | 24,084 | ||||
Net related party payables | 13,675 | 17,576 | ||||||
Current portion of long-term debt, net of deferred financing costs | 4,365 | — | ||||||
Accrued liabilities: | ||||||||
Employee related costs | 123,992 | 138,858 | ||||||
Other accrued liabilities | 180,272 | 191,344 | ||||||
Deferred revenue | 414,262 | 390,180 | ||||||
Total current liabilities | 765,505 | 762,042 | ||||||
Long-term debt, net of deferred financing costs | 101,335 | 105,433 | ||||||
Defined benefit and other postretirement obligations | 49,240 | 52,997 | ||||||
Other employee related costs | 53,501 | 47,913 | ||||||
Deferred tax liabilities, net | 78,968 | 196,436 | ||||||
Other liabilities | 56,905 | 47,441 | ||||||
Total liabilities | 1,105,454 | 1,212,262 | ||||||
Commitments and contingencies (see Note 9) | ||||||||
Redeemable noncontrolling interests | 76,684 | 80,630 | ||||||
The Madison Square Garden Company Stockholders’ Equity: | ||||||||
Class A Common stock, par value $0.01, 120,000 shares authorized; 19,136 and 19,014 shares outstanding as of June 30, 2018 and 2017, respectively | 204 | 204 | ||||||
Class B Common stock, par value $0.01, 30,000 shares authorized; 4,530 shares outstanding as of June 30, 2018 and 2017 | 45 | 45 | ||||||
Preferred stock, par value $0.01,15,000 shares authorized; none outstanding as of June 30, 2018 and 2017 | — | — | ||||||
Additional paid-in capital | 2,817,873 | 2,832,516 | ||||||
Treasury stock, at cost, 1,312 and 1,433 shares as of June 30, 2018 and 2017, respectively | (223,662 | ) | (242,077 | ) | ||||
Accumulated deficit | (11,059 | ) | (148,410 | ) | ||||
Accumulated other comprehensive loss | (46,918 | ) | (34,115 | ) | ||||
Total The Madison Square Garden Company stockholders’ equity | 2,536,483 | 2,408,163 | ||||||
Nonredeemable noncontrolling interests | 17,552 | 11,698 | ||||||
Total equity | 2,554,035 | 2,419,861 | ||||||
Total liabilities, redeemable noncontrolling interests and equity | $ | 3,736,173 | $ | 3,712,753 | ||||
See accompanying notes to consolidated financial statements.
F- 4
THE MADISON SQUARE GARDEN COMPANY
CONSOLIDATED STATEMENTS OF OPERATIONS
(in thousands, except per share data)
Years Ended June 30, | ||||||||||||
2018 | 2017 | 2016 | ||||||||||
Revenues (a) | $ | 1,559,095 | $ | 1,318,452 | $ | 1,115,311 | ||||||
Operating expenses: | ||||||||||||
Direct operating expenses (b) | 945,428 | 861,381 | 737,857 | |||||||||
Selling, general and administrative expenses (c) | 472,305 | 410,039 | 333,603 | |||||||||
Depreciation and amortization | 122,486 | 107,388 | 102,482 | |||||||||
Operating income (loss) | 18,876 | (60,356 | ) | (58,631 | ) | |||||||
Other income (expense): | ||||||||||||
Loss in equity method investments | (7,770 | ) | (29,976 | ) | (19,099 | ) | ||||||
Interest income (d) | 21,582 | 11,836 | 6,782 | |||||||||
Interest expense | (15,415 | ) | (4,189 | ) | (2,028 | ) | ||||||
Miscellaneous income (expense) | 303 | 1,492 | (4,017 | ) | ||||||||
(1,300 | ) | (20,837 | ) | (18,362 | ) | |||||||
Income (loss) from operations before income taxes | 17,576 | (81,193 | ) | (76,993 | ) | |||||||
Income tax benefit (expense) | 116,872 | 4,404 | (297 | ) | ||||||||
Net income (loss) | 134,448 | (76,789 | ) | (77,290 | ) | |||||||
Less: Net income (loss) attributable to nonredeemable noncontrolling interests | (6,518 | ) | 304 | — | ||||||||
Less: Net loss attributable to redeemable noncontrolling interests | (628 | ) | (4,370 | ) | — | |||||||
Net income (loss) attributable to The Madison Square Garden Company’s stockholders | $ | 141,594 | $ | (72,723 | ) | $ | (77,290 | ) | ||||
Basic earnings (loss) per common share attributable to The Madison Square Garden Company’s stockholders | $ | 5.99 | $ | (3.05 | ) | $ | (3.12 | ) | ||||
Diluted earnings (loss) per common share attributable to The Madison Square Garden Company’s stockholders | $ | 5.94 | $ | (3.05 | ) | $ | (3.12 | ) | ||||
Weighted-average number of common shares outstanding: | ||||||||||||
Basic | 23,639 | 23,853 | 24,754 | |||||||||
Diluted | 23,846 | 23,853 | 24,754 | |||||||||
(a) | Include revenues from related parties of $156,368, $150,534 and $153,538 for the years ended June 30, 2018, 2017 and 2016, respectively. |
(b) | Include net charges from related parties of $1,082, $1,284 and $1,133 for the years ended June 30, 2018, 2017 and 2016, respectively. |
(c) | Include net charges to related parties of $5,188, $5,852 and $28,536 for the years ended June 30, 2018, 2017 and 2016, respectively. |
(d) | Interest income includes interest income from nonconsolidated affiliates of $5,696, $4,157 and $2,930 for the years ended June 30, 2018, 2017 and 2016, respectively. In addition, interest income includes interest income from MSG Networks of $307 for the year ended June 30, 2016. |
See accompanying notes to consolidated financial statements.
F- 5
THE MADISON SQUARE GARDEN COMPANY
CONSOLIDATED STATEMENTS OF COMPREHENSIVE INCOME (LOSS)
(in thousands)
Years Ended June 30, | ||||||||||||||||||||||||
2018 | 2017 | 2016 | ||||||||||||||||||||||
Net income (loss) | $ | 134,448 | $ | (76,789 | ) | $ | (77,290 | ) | ||||||||||||||||
Other comprehensive income (loss), before income taxes: | ||||||||||||||||||||||||
Pension plans and postretirement plan: | ||||||||||||||||||||||||
Net unamortized gains (losses) arising during the period | $ | (3,415 | ) | $ | 4,027 | $ | (9,239 | ) | ||||||||||||||||
Amounts reclassified from accumulated other comprehensive loss: | ||||||||||||||||||||||||
Amortization of net actuarial loss included in net periodic benefit cost | 1,319 | 1,365 | 1,039 | |||||||||||||||||||||
Amortization of net prior service credit included in net periodic benefit cost | (37 | ) | (48 | ) | (92 | ) | ||||||||||||||||||
Settlement loss | 87 | (2,046 | ) | — | 5,344 | — | (8,292 | ) | ||||||||||||||||
Cumulative translation adjustments | (502 | ) | — | — | ||||||||||||||||||||
Net changes related to available-for-sale securities | (12,095 | ) | 9,629 | — | ||||||||||||||||||||
Other comprehensive income (loss), before income taxes | (14,643 | ) | 14,973 | (8,292 | ) | |||||||||||||||||||
Income tax expense related to items of other comprehensive income | — | (6,477 | ) | — | ||||||||||||||||||||
Other comprehensive income (loss), net of income taxes | (14,643 | ) | 8,496 | (8,292 | ) | |||||||||||||||||||
Comprehensive income (loss) | 119,805 | (68,293 | ) | (85,582 | ) | |||||||||||||||||||
Less: Comprehensive income (loss) attributable to nonredeemable noncontrolling interests | (6,518 | ) | 304 | — | ||||||||||||||||||||
Less: Comprehensive loss attributable to redeemable noncontrolling interests | (628 | ) | (4,370 | ) | — | |||||||||||||||||||
Comprehensive income (loss) attributable to The Madison Square Garden Company’s stockholders | $ | 126,951 | $ | (64,227 | ) | $ | (85,582 | ) | ||||||||||||||||
See accompanying notes to consolidated financial statements.
F- 6
THE MADISON SQUARE GARDEN COMPANY
CONSOLIDATED STATEMENTS OF CASH FLOWS
(in thousands)
Years Ended June 30, | ||||||||||||
2018 | 2017 | 2016 | ||||||||||
Cash flows from operating activities: | ||||||||||||
Net income (loss) | $ | 134,448 | $ | (76,789 | ) | $ | (77,290 | ) | ||||
Adjustments to reconcile net income (loss) to net cash provided by operating activities: | ||||||||||||
Depreciation and amortization | 122,486 | 107,388 | 102,482 | |||||||||
Share-based compensation expense | 47,563 | 41,129 | 24,476 | |||||||||
Loss in equity method investments, net of income distributions | 7,770 | 30,831 | 19,099 | |||||||||
Provision for (benefit from) deferred income taxes | (117,311 | ) | (4,404 | ) | 297 | |||||||
Write-off of deferred production costs | — | 33,629 | 41,816 | |||||||||
Impairment of cost method investments | 250 | — | 4,080 | |||||||||
Purchase accounting adjustments associated with rent-related intangibles and deferred rent | 4,628 | 718 | — | |||||||||
Purchase accounting adjustments associated with amortization of inventory step-up | — | 8,705 | — | |||||||||
Other non-cash adjustments | (289 | ) | 693 | 31 | ||||||||
Change in assets and liabilities, net of acquisitions: | ||||||||||||
Accounts receivable, net | 2,435 | (20,363 | ) | (25,053 | ) | |||||||
Net related party receivables | 2,147 | 2,826 | (5,096 | ) | ||||||||
Prepaid expenses and other assets | 19,389 | 1,840 | (34,354 | ) | ||||||||
Accounts payable | 5,067 | 2,047 | 9,096 | |||||||||
Net related party payables | (3,901 | ) | 2,301 | 13,687 | ||||||||
Accrued and other liabilities | (26,617 | ) | 32,716 | 42,077 | ||||||||
Deferred revenue | 22,582 | 53,356 | 10,437 | |||||||||
Net cash provided by operating activities | 220,647 | 216,623 | 125,785 | |||||||||
Cash flows from investing activities: | ||||||||||||
Capital expenditures, net of acquisitions | (191,914 | ) | (44,224 | ) | (71,716 | ) | ||||||
Payments to acquire available-for-sale securities | — | (23,222 | ) | — | ||||||||
Payments for acquisition of businesses, net of cash acquired | (8,288 | ) | (192,095 | ) | — | |||||||
Payments for acquisition of assets | (6,000 | ) | (1,000 | ) | (2,000 | ) | ||||||
Investments and loans to nonconsolidated affiliates | (11,255 | ) | (8,235 | ) | (36,417 | ) | ||||||
Loan repayments received from nonconsolidated affiliates | 36,600 | — | — | |||||||||
Cash received / (paid) for notes receivable | (1,500 | ) | 4,475 | (7,085 | ) | |||||||
Capital distribution from equity method investments | — | — | 1,528 | |||||||||
Net cash used in investing activities | (182,357 | ) | (264,301 | ) | (115,690 | ) | ||||||
Cash flows from financing activities: | ||||||||||||
Net transfers from MSG Networks and MSG Networks’ subsidiaries | — | — | 1,525,241 | |||||||||
Repurchases of common stock | (11,830 | ) | (147,967 | ) | (105,736 | ) | ||||||
Proceeds from stock option exercises | — | 7 | 787 | |||||||||
Taxes paid in lieu of shares issued for equity-based compensation | (34,393 | ) | (7,335 | ) | (281 | ) | ||||||
Noncontrolling interest capital contributions | 4,000 | — | — | |||||||||
Distributions to noncontrolling interest holders | (4,124 | ) | — | — | ||||||||
Payment of contingent consideration | (4,000 | ) | — | — | ||||||||
Principal repayment on long-term debt | (688 | ) | — | — | ||||||||
Payments for financing costs | (62 | ) | (3,230 | ) | — | |||||||
Net cash provided by (used in) financing activities | (51,097 | ) | (158,525 | ) | 1,420,011 | |||||||
Effect of exchange rates on cash and cash equivalents | 331 | — | — | |||||||||
Net increase (decrease) in cash and cash equivalents | (12,476 | ) | (206,203 | ) | 1,430,106 | |||||||
Cash and cash equivalents at beginning of period | 1,238,114 | 1,444,317 | 14,211 | |||||||||
Cash and cash equivalents at end of period | $ | 1,225,638 | $ | 1,238,114 | $ | 1,444,317 | ||||||
Non-cash investing and financing activities: | ||||||||||||
Investments and loans to nonconsolidated affiliates | $ | 16 | $ | 368 | $ | 2,237 | ||||||
Capital expenditures incurred but not yet paid | 9,688 | 8,834 | 5,793 | |||||||||
Accrued earn-out liability and other contingencies | 4,573 | 7,900 | — | |||||||||
Acquisition of assets not yet paid | 3,000 | — | — | |||||||||
Non-cash transfers resulting from the Distribution, net | — | — | (1,934 | ) | ||||||||
See accompanying notes to consolidated financial statements.
F- 7
THE MADISON SQUARE GARDEN COMPANY
CONSOLIDATED STATEMENTS OF EQUITY
AND REDEEMABLE NONCONTROLLING INTERESTS
(in thousands)
Common Stock Issued | MSG Networks’ Investment | Additional Paid-In Capital | Treasury Stock | Accumulated Deficit | Accumulated Other Comprehensive Loss | Total The Madison Square Garden Company Stockholders’ Equity | Non - redeemable Noncontrolling Interests | Total Equity | Redeemable Noncontrolling Interests | |||||||||||||||||||||||||||||||
Balance as of June 30, 2015 | $ | — | $ | 1,263,490 | $ | — | $ | — | $ | — | $ | (40,215 | ) | $ | 1,223,275 | $ | — | $ | 1,223,275 | $ | — | |||||||||||||||||||
Net loss | — | (1,603 | ) | — | — | (75,687 | ) | — | (77,290 | ) | — | (77,290 | ) | — | ||||||||||||||||||||||||||
Other comprehensive loss | — | — | — | — | — | (8,292 | ) | (8,292 | ) | — | (8,292 | ) | — | |||||||||||||||||||||||||||
Comprehensive loss | — | — | — | — | — | — | (85,582 | ) | — | (85,582 | ) | — | ||||||||||||||||||||||||||||
Exercise of stock options | — | — | (2,682 | ) | 3,469 | — | — | 787 | — | 787 | — | |||||||||||||||||||||||||||||
Share-based compensation | — | — | 21,514 | — | — | — | 21,514 | — | 21,514 | — | ||||||||||||||||||||||||||||||
Tax withholding associated with shares issued for equity-based compensation | — | — | (281 | ) | — | — | — | (281 | ) | — | (281 | ) | — | |||||||||||||||||||||||||||
Shares issued upon distribution of Restricted Stock Units | — | — | (385 | ) | 385 | — | — | — | — | — | — | |||||||||||||||||||||||||||||
Repurchases of common stock | — | — | — | (105,736 | ) | — | — | (105,736 | ) | — | (105,736 | ) | — | |||||||||||||||||||||||||||
Net increase in MSG Networks’ Investment | — | 1,525,982 | — | — | — | — | 1,525,982 | — | 1,525,982 | — | ||||||||||||||||||||||||||||||
Conversion of MSG Networks’ Investment | 249 | (2,787,869 | ) | 2,787,620 | — | — | — | — | — | — | — | |||||||||||||||||||||||||||||
Adjustments related to the transfer of certain assets and liabilities as a result of the Distribution | — | — | 566 | — | — | — | 566 | — | 566 | — | ||||||||||||||||||||||||||||||
Adjustment related to the transfer of Pension Plans and Postretirement Plan liabilities as a result of the Distribution | — | — | — | — | — | 5,896 | 5,896 | — | 5,896 | — | ||||||||||||||||||||||||||||||
Balance as of June 30, 2016 | $ | 249 | $ | — | $ | 2,806,352 | $ | (101,882 | ) | $ | (75,687 | ) | $ | (42,611 | ) | $ | 2,586,421 | $ | — | $ | 2,586,421 | $ | — | |||||||||||||||||
Net income (loss) | — | — | — | — | (72,723 | ) | — | (72,723 | ) | 304 | (72,419 | ) | (4,370 | ) | ||||||||||||||||||||||||||
Other comprehensive income | — | — | — | — | — | 8,496 | 8,496 | — | 8,496 | — | ||||||||||||||||||||||||||||||
Comprehensive income (loss) | — | — | — | — | — | — | (64,227 | ) | 304 | (63,923 | ) | (4,370 | ) | |||||||||||||||||||||||||||
Exercise of stock options | — | — | (39 | ) | 46 | — | — | 7 | — | 7 | — | |||||||||||||||||||||||||||||
Share-based compensation | — | — | 41,264 | — | — | — | 41,264 | — | 41,264 | — | ||||||||||||||||||||||||||||||
Tax withholding associated with shares issued for equity-based compensation | — | — | (6,003 | ) | (1,332 | ) | — | — | (7,335 | ) | — | (7,335 | ) | — | ||||||||||||||||||||||||||
Common stock issued under stock incentive plans | — | — | (9,058 | ) | 9,058 | — | — | — | — | — | — | |||||||||||||||||||||||||||||
Repurchases of common stock | — | — | — | (147,967 | ) | — | — | (147,967 | ) | — | (147,967 | ) | — | |||||||||||||||||||||||||||
Noncontrolling interests from acquisitions | — | — | — | — | — | — | — | 11,394 | 11,394 | 85,000 | ||||||||||||||||||||||||||||||
Balance as of June 30, 2017 | $ | 249 | $ | — | $ | 2,832,516 | $ | (242,077 | ) | $ | (148,410 | ) | $ | (34,115 | ) | $ | 2,408,163 | $ | 11,698 | $ | 2,419,861 | $ | 80,630 | |||||||||||||||||
Change in accounting policy related to share-based forfeiture rates | — | — | 2,403 | — | (2,403 | ) | — | — | — | — | — | |||||||||||||||||||||||||||||
Adoption of ASU 2018-02 | — | — | — | — | (1,840 | ) | 1,840 | — | — | — | — | |||||||||||||||||||||||||||||
Net income (loss) | — | — | — | — | 141,594 | — | 141,594 | (6,518 | ) | 135,076 | (628 | ) | ||||||||||||||||||||||||||||
Other comprehensive loss | — | — | — | — | — | (14,643 | ) | (14,643 | ) | — | (14,643 | ) | — | |||||||||||||||||||||||||||
Comprehensive income (loss) | — | — | — | — | — | — | 126,951 | (6,518 | ) | 120,433 | (628 | ) | ||||||||||||||||||||||||||||
Share-based compensation | — | — | 47,592 | — | — | — | 47,592 | — | 47,592 | — | ||||||||||||||||||||||||||||||
Tax withholding associated with shares issued for equity-based compensation | — | — | (34,393 | ) | — | — | — | (34,393 | ) | — | (34,393 | ) | — | |||||||||||||||||||||||||||
Common stock issued under stock incentive plans | — | — | (30,245 | ) | 30,245 | — | — | — | — | — | — | |||||||||||||||||||||||||||||
Repurchases of common stock | — | — | — | (11,830 | ) | — | — | (11,830 | ) | — | (11,830 | ) | — | |||||||||||||||||||||||||||
Distributions to noncontrolling interest holders | — | — | — | — | — | — | — | (806 | ) | (806 | ) | (3,318 | ) | |||||||||||||||||||||||||||
Noncontrolling interests from acquisition | — | — | — | — | — | — | — | 8,182 | 8,182 | — | ||||||||||||||||||||||||||||||
Contribution of joint venture interests | — | — | — | — | — | — | — | 4,996 | 4,996 | — | ||||||||||||||||||||||||||||||
Balance as of June 30, 2018 | $ | 249 | $ | — | $ | 2,817,873 | $ | (223,662 | ) | $ | (11,059 | ) | $ | (46,918 | ) | $ | 2,536,483 | $ | 17,552 | $ | 2,554,035 | $ | 76,684 | |||||||||||||||||
See accompanying notes to consolidated financial statements.
F- 8
THE MADISON SQUARE GARDEN COMPANY
NOTES TO CONSOLIDATED FINANCIAL STATEMENTS
All amounts included in the following Notes to Consolidated Financial Statements are presented in thousands, except per share data or as otherwise noted.
Note 1. Description of Business and Basis of Presentation
The Distribution
The Madison Square Garden Company (together with its subsidiaries, the “Company” or “Madison Square Garden”), formerly named MSG Spinco, Inc., was incorporated on March 4, 2015 as an indirect, wholly-owned subsidiary of MSG Networks Inc. (“MSG Networks” or “Former Parent”), formerly known as The Madison Square Garden Company. On September 11, 2015, MSG Networks’ board of directors approved the distribution of all the outstanding common stock of Madison Square Garden to MSG Networks’ stockholders (the “Distribution”), which occurred on September 30, 2015. Each holder of record of MSG Networks Class A common stock as of close of business on September 21, 2015 (the “Record Date”) received one share of Madison Square Garden Class A common stock, par value $0.01 per share (“Class A Common Stock”), for every three shares of MSG Networks Class A common stock held. Each holder of record of MSG Networks Class B common stock as of the Record Date received one share of Madison Square Garden Class B common stock, par value $0.01 per share (“Class B Common Stock”), for every three shares of MSG Networks Class B common stock held.
Description of Business
Madison Square Garden is a live sports and entertainment business. The Company classifies its business interests into two reportable segments: MSG Entertainment and MSG Sports. MSG Entertainment includes live entertainment events such as concerts, family shows, performing arts and special events, which are presented or hosted in the Company’s diverse collection of venues along with live offerings through TAO Group Holdings LLC (“TAO Group”) and Boston Calling Events LLC (“BCE”). TAO Group is a hospitality group with globally-recognized entertainment dining and nightlife brands: TAO, Marquee, Lavo, Avenue, The Stanton Social, Beauty & Essex and Vandal. BCE owns and operates New England’s premier Boston Calling Music Festival. MSG Entertainment also includes the Company’s original production — the Christmas Spectacular Starring the Radio City Rockettes (the “Christmas Spectacular”). In November 2017, the Company acquired a 100% controlling interest in Obscura Digital (“Obscura”), a creative studio, which is now part of the MSG Entertainment segment. See Note 3 for discussion on certain costs incurred by Obscura.
MSG Sports includes the Company’s professional sports franchises: the New York Knicks (the “Knicks”) of the National Basketball Association (the “NBA”), the New York Rangers (the “Rangers”) of the National Hockey League (the “NHL”), the New York Liberty (the “Liberty”) of the Women’s National Basketball Association (the “WNBA”), the Hartford Wolf Pack of the American Hockey League (the “AHL”) and the Westchester Knicks of the NBA G League (the “NBAGL”). The MSG Sports segment also includes other live sporting events, including professional boxing, college basketball, professional bull riding, mixed martial arts, esports, tennis and college wrestling, all of which the Company promotes, produces and/or presents. In July 2017, the Company acquired a controlling interest in Counter Logic Gaming (“CLG”), a premier North American esports organization, which is now part of the MSG Sports segment.
The Company conducts a significant portion of its operations at venues that it either owns or operates under long-term leases. The Company owns the Madison Square Garden Arena (“The Garden”) and The Hulu Theater at Madison Square Garden in New York City, the Forum in Inglewood, CA and The Chicago Theatre in Chicago. In addition, the Company leases Radio City Music Hall and the Beacon Theatre in New York City, and has a booking agreement with respect to the Wang Theatre in Boston. Additionally, TAO Group operates various restaurants, nightlife and hospitality venues under long-term leases and management contracts in New York, Las Vegas, Los Angeles, Australia and Singapore.
Basis of Presentation
For the periods after the Distribution, the financial information disclosed is presented on a consolidated basis, as the Company became a standalone public company on September 30, 2015. For the periods prior to the Distribution, the financial information was prepared on a standalone basis derived from the consolidated financial statements and accounting records of Former Parent and are presented as carve-out financial statements as the Company was not a standalone public company prior to the Distribution, and separate financial statements were not prepared for the Company historically. As a result, the Company’s financial statements as of and for the fiscal years ended June 30, 2018, 2017, 2016 are presented on a consolidated basis, except the financial information for the three months ended September 30, 2015 that is included in the results of operations for the year ended June 30, 2016.
F- 9
THE MADISON SQUARE GARDEN COMPANY
NOTES TO CONSOLIDATED FINANCIAL STATEMENTS
(Continued)
These combined financial statements for the periods prior to the Distribution reflect the combined historical results of operations and cash flows of Former Parent’s sports and entertainment businesses, as well as its venues and joint ventures (“combined financial statements”), in accordance with generally accepted accounting principles (“GAAP”) and Securities and Exchange Commission (“SEC”) Staff Accounting Bulletin Topic 1-B, Allocation of Expenses and Related Disclosure in Financial Statements of Subsidiaries, Divisions or Lesser Business Components of Another Entity. References to GAAP issued by the Financial Accounting Standards Board (“FASB”) in these footnotes are to the FASB Accounting Standards Codification, also referred to as “ASC.”
The financial information for the three months ended September 30, 2015 that is included in the results of operations for the year ended June 30, 2016 include allocations for certain support functions that were provided on a centralized basis by MSG Networks and not historically recorded at the business unit level, such as expenses related to finance, human resources, information technology, and facilities, among others. These expenses were allocated on the basis of direct usage when identifiable, with the remainder allocated on a pro-rata basis of combined revenues, headcount or other measures. Management believes the assumptions underlying the combined financial statements, including the assumptions regarding allocating general corporate expenses, are reasonable. Nevertheless, the combined financial statements do not include all of the actual expenses that would have been incurred by the Company and do not reflect its combined results of operations and cash flows had it been a separate, standalone public company during the periods presented on a combined basis. Actual costs that would have been incurred if the Company had been a separate, standalone public company would depend on multiple factors, including organizational structure and strategic decisions made in various areas, including information technology and infrastructure.
After the Distribution, the Company had been providing certain services to MSG Networks through a transition services agreement (“TSA”). The Company and MSG Networks entered into a new services agreement (“Services Agreement”) effective July 1, 2017, which provides for each party to furnish substantially the same services, as well as the executive support services described below, in exchange for service fees. In connection with the expiration of the Services Agreement on June 30, 2018, the Company entered into an interim agreement with MSG Networks, pursuant to which each party provides the other with the same services on the same terms. The Company expects to enter into a new services agreement this calendar year which will be retroactive to July 1, 2018.
MSG Networks historically used a centralized approach to cash management and financing of operations, with net earnings reinvested and working capital requirements met from existing liquid funds. The Company’s cash was available for use and was regularly “swept” by MSG Networks at its discretion. Accordingly, the cash and cash equivalents held by MSG Networks at the corporate level were not attributed to the Company in the combined statement of cash flows as of June 30, 2015, which was used to prepare the accompanying consolidated statements of cash flows for the year ended June 30, 2016. Additionally, cash held in accounts legally owned by the Company was attributed to the combined statement of cash flows as of June 30, 2015. Transfers of cash both to and from MSG Networks are included as components of MSG Networks’ investment on the consolidated statements of equity and redeemable noncontrolling interests. In connection with the Distribution, the Company received $1,467,093 of cash from MSG Networks.
MSG Networks’ net investment in the Company has been presented as a component of the Company’s equity in the financial statements. Distributions made by MSG Networks to the Company or to MSG Networks from the Company are recorded as transfers to and from MSG Networks and the net amount is presented on the consolidated statements of cash flows as “Net transfers from MSG Networks and MSG Networks’ subsidiaries.” As of the Distribution date, MSG Networks’ net investment in the Company was contributed to Former Parent’s stockholders through the distribution of all the common stock of the Company. The par value of the Company’s stock was recorded as a component of common stock, with the remaining balance recorded as additional paid-in capital in the consolidated balance sheet on the Distribution date.
Reclassifications
Certain reclassifications have been made in order to conform to the current period’s presentation. The reclassifications consisted of certain employee related costs liabilities, which were previously reported in Other liabilities in the accompanying consolidated balance sheets, to Other employee related costs in the accompanying consolidated balance sheets.
F- 10
THE MADISON SQUARE GARDEN COMPANY
NOTES TO CONSOLIDATED FINANCIAL STATEMENTS
(Continued)
Note 2. Summary of Significant Accounting Policies
Principles of Consolidation
For the periods prior to the Distribution, the financial statements include certain assets and liabilities that were historically held at Former Parent’s corporate level but were specifically identifiable or otherwise attributable to the Company. All intercompany transactions between the Company and Former Parent have been included in the consolidated financial statements as components of MSG Networks’ investment (primarily for balances as of June 30, 2015 and for the activities during the three months ended September 30, 2015). All significant intracompany transactions and accounts within the Company’s consolidated financial statements have been eliminated. Expenses related to corporate allocations prior to the Distribution were considered to be effectively settled in the consolidated financial statements at the time the transaction was recorded, with the offset recorded against MSG Networks’ investment.
Business Combinations and Noncontrolling Interests
The acquisition method of accounting for business combinations requires management to use significant estimates and assumptions, including fair value estimates, as of the business combination date and to refine those estimates as necessary during the measurement period (defined as the period, not to exceed one year, in which the Company is allowed to adjust the provisional amounts recognized for a business combination).
Under the acquisition method of accounting, the Company recognizes separately from goodwill the identifiable assets acquired, the liabilities assumed, and any noncontrolling interests in an acquiree, generally at the acquisition date fair value. The Company measures goodwill as of the acquisition date as the excess of consideration transferred, which is also measured at fair value if the consideration is non-cash, over the net of the acquisition date amounts of the identifiable assets acquired and liabilities assumed. Costs that the Company incurs to complete a business combination such as investment banking, legal and other professional fees are not considered part of consideration and the Company charges these costs to selling, general and administrative expense as they are incurred. In addition, the Company recognizes measurement-period adjustments in the period in which the amount is determined, including the effect on earnings of any amounts the Company would have recorded in previous periods if the accounting had been completed at the acquisition date.
Interests held by third parties in consolidated majority-owned subsidiaries are presented as noncontrolling interests, which represent the noncontrolling stockholders’ interests in the underlying net assets of the Company’s consolidated majority-owned subsidiaries. Noncontrolling interests that are not redeemable are reported in the equity section of the consolidated balance sheets. Noncontrolling interests, where the Company may be required to repurchase under put options or other contractual redemption requirements that are not solely within the Company’s control, are reported in the consolidated balance sheets between liabilities and equity, as redeemable noncontrolling interests.
In July 2016 and 2017, the Company acquired controlling interests in BCE and CLG, respectively. In accordance with ASC Topic 805, Business Combinations (“ASC Topic 805”), and ASC Topic 810, Consolidation (“ASC Topic 810”), the financial position of BCE has been consolidated with the Company’s consolidated balance sheets as of June 30, 2018 and 2017. In addition, the financial position of CLG has been consolidated with the Company’s consolidated balance sheet as of June 30, 2018. The results of operations for BCE and CLG have been included in the Company’s consolidated results of operations from the date of acquisition in the MSG Entertainment segment and MSG Sports segment, respectively. The relevant amounts attributable to investors other than the Company are reflected under “Nonredeemable noncontrolling interests,” “Net income (loss) attributable to nonredeemable noncontrolling interests” and “Comprehensive income (loss) attributable to nonredeemable noncontrolling interests” on the accompanying consolidated balance sheets, consolidated statements of operations and consolidated statements of comprehensive income (loss), respectively. See Note 3 for more information regarding the Company’s acquisitions of BCE and CLG.
On January 31, 2017, the Company acquired a controlling interest in TAO Group. In accordance with ASC Topic 805 and ASC Topic 810, the financial position of TAO Group has been consolidated with the Company’s consolidated balance sheet as of June 30, 2018. TAO Group’s financial statements are not available within the time constraints the Company requires to ensure the financial accuracy of the operating results. Therefore, the Company records TAO Group’s operating results in its consolidated statements of operations on a three-month lag basis. Any specific events having significant financial impact that occur during the lag period are included in the Company’s current period results. TAO Group reports on a fiscal year reflecting the retail-based calendar (containing 4-4-5 week calendar quarters) and its fiscal year periodically results in a 53-week year instead of a normal 52-week year. Accordingly, the Company’s results of operations for the years ended June 30, 2018 and 2017
F- 11
THE MADISON SQUARE GARDEN COMPANY
NOTES TO CONSOLIDATED FINANCIAL STATEMENTS
(Continued)
include TAO Group’s operating results from March 27, 2017 to April 1, 2018 and February 1, 2017 to March 26, 2017, respectively, as part of the MSG Entertainment segment. In addition, the Company’s consolidated balance sheets as of June 30, 2018 and 2017 reflect the financial position of TAO Group as of April 1, 2018 and March 26, 2017, respectively. All disclosures related to TAO Group's financial position are therefore also reported as of April 1, 2018 and March 26, 2017, as applicable.
The TAO Group purchase agreement contains a put option to require the Company to purchase the other owners’ equity interests under certain circumstances. The noncontrolling interest combined with the put option is classified as redeemable noncontrolling interest in the consolidated balance sheet, separate from equity. The relevant amounts attributable to investors other than the Company are reflected under “Redeemable noncontrolling interests,” “Net income (loss) attributable to redeemable noncontrolling interests” and “Comprehensive income (loss) attributable to redeemable noncontrolling interests” on the accompanying consolidated balance sheets, consolidated statements of operations and consolidated statements of comprehensive income (loss), respectively. See Note 3 for more information regarding the Company’s acquisition of TAO Group. The put option can be settled, at the Company’s option, in cash, debt or shares of the Company’s Class A Common Stock. The ultimate amount paid upon the exercise of the put option will likely be different from the estimated fair value, given the calculation required pursuant to the TAO Group operating agreement.
Use of Estimates
The preparation of the accompanying financial statements in conformity with GAAP requires management to make estimates and assumptions about future events. These estimates and the underlying assumptions affect the amounts of assets and liabilities reported, disclosures about contingent assets and liabilities, and reported amounts of revenues and expenses. Such estimates include the valuation of accounts receivable, investments, goodwill, intangible assets, other long-lived assets, tax accruals and other liabilities. In addition, estimates are used in revenue recognition, revenue sharing expense (net of escrow), luxury tax expense, income tax expense, performance and share-based compensation, depreciation and amortization, litigation matters and other matters, as well as in the valuation of contingent consideration and noncontrolling interests resulting from business combination transactions. Management believes its use of estimates in the financial statements to be reasonable.
Management evaluates its estimates on an ongoing basis using historical experience and other factors, including the general economic environment and actions it may take in the future. The Company adjusts such estimates when facts and circumstances dictate. However, these estimates may involve significant uncertainties and judgments and cannot be determined with precision. In addition, these estimates are based on management’s best judgment at a point in time and as such these estimates may ultimately differ from actual results. Changes in estimates resulting from weakness in the economic environment or other factors beyond the Company’s control could be material and would be reflected in the Company’s financial statements in future periods.
Revenue Recognition
The Company recognizes revenue when the following conditions are satisfied: (a) persuasive evidence of a sales arrangement exists, (b) delivery occurs or services are rendered, (c) the sales price is fixed or determinable and (d) collectability is reasonably assured. Revenue recognition from the Company’s various revenue sources is discussed further in each respective segment’s revenue recognition policies below.
MSG Entertainment
The Company’s MSG Entertainment segment earns revenues from the sale of tickets for events that the Company produces or promotes/co-promotes. In addition, for entertainment events held at the Company’s venues that MSG Entertainment does not produce or promote/co-promote, revenues are earned from venue license fees charged to the third-party promoters of the event. Event-related revenues from the sale of tickets, venue license fees from third-party promoters, sponsorships, concessions and merchandise are recognized when the event occurs. Amounts collected in advance of an event are recorded as deferred revenue and are recognized as revenues when earned. Deferred revenue reported in the accompanying consolidated balance sheets as of June 30, 2018 and 2017 includes amounts due to the third-party promoters of $89,513 and $72,400, respectively.
Revenues from the sale of advertising in the form of venue signage and sponsorships, which are not related to any specific event, are recorded and recognized ratably over the period of benefit of the respective agreements.
Revenues from the rental of The Garden’s suites are recognized ratably over the period of benefit of the respective agreements for the benefit of both of the Company’s segments.
F- 12
THE MADISON SQUARE GARDEN COMPANY
NOTES TO CONSOLIDATED FINANCIAL STATEMENTS
(Continued)
Revenues from dining, nightlife and hospitality offerings through TAO Group are recognized at the point food, beverages and/or services are provided to the customer. In addition, management fee revenues which are derived by the performance of the underlying venues as defined within the specific venue management agreements are recorded as earned.
MSG Sports
The Knicks, Rangers and Liberty derive revenues principally from ticket sales and distributions of league-wide national and international television contracts and other league-wide revenue sources, which are recognized over the respective team’s season. Event-related revenues from other live sporting events, including the sale of tickets, venue license fees earned in connection with other live sporting events that the Company does not produce or promote, sponsorships, concessions and merchandise are recognized when the event occurs. Amounts collected in advance of an event are recorded as deferred revenue and are recognized as revenues when earned. Local media rights revenue recognized by MSG Sports for the licensing of team-related programming to MSG Networks is generally recognized on a straight-line basis over the fiscal year.
Revenues from the sale of advertising in the form of venue signage and sponsorships, which are not related to any specific event, are recognized ratably over the period of benefit of the respective agreements.
Revenues from the rental of The Garden’s suites are recognized ratably over the period of benefit of the respective agreements for the benefit of both of the Company’s segments.
Multiple-Deliverable Transactions
The Company enters into multiple-deliverable arrangements, primarily multi-year sponsorship agreements. The deliverables included in each sponsorship agreement vary and may include suite licenses, event tickets and various advertising benefits, which include items such as, but not limited to, signage at The Garden and the Company’s other venues. The timing of revenue recognition for each deliverable is dependent upon meeting the revenue recognition criteria for the respective deliverable.
The Company allocates revenue to each deliverable within the arrangement based on its relative selling price. For many deliverables in an arrangement, such as event tickets and certain advertising benefits, the Company has vendor specific objective evidence (“VSOE”) of selling price as it typically sells the same or similar deliverables regularly on a stand-alone basis. Absent VSOE, the Company considers whether third party evidence (“TPE”) is available; however, in most instances TPE is not available. The Company’s process for determining its estimated selling prices for deliverables without VSOE or TPE involves management’s judgment and considers multiple factors including company specific and market specific factors that may vary depending upon the unique facts and circumstances related to each deliverable. Key factors considered by the Company in developing a best estimate of selling price for deliverables include, but are not limited to, prices charged for similar deliverables, the Company’s ongoing pricing strategy and policies, and consideration of pricing of similar deliverables sold in other multiple-deliverable agreements.
Gross versus Net Revenue Recognition
The Company reports revenue on a gross or net basis based on management’s assessment of whether the Company acts as a principal or agent in the transaction. To the extent the Company acts as the principal, revenue is reported on a gross basis. The determination of whether the Company acts as a principal or an agent in a transaction is based on an evaluation of several qualitative factors, including for co-promotions where the Company has a 50% or lower economic interest. Generally, when the Company is the promoter or co-promoter of an event the Company reports revenue on a gross basis. When the Company acts as an agent, revenue is reported on a net basis. The Company accounts for taxes collected from customers and remitted to governmental authorities on a net basis and excludes these amounts from revenues.
In connection with the Distribution, the Company entered into an advertising sales representation agreement with MSG Networks. Pursuant to the agreement, the Company has the exclusive right and obligation to sell advertising availabilities of MSG Networks. The Company is entitled to and earns commission revenue as MSG Networks records advertising revenue, which is typically recognized when the advertisements are aired. The Company recognizes the advertising commission revenue on a net basis in accordance with ASC Topic 605-45.
Nonmonetary Transactions
The Company enters into nonmonetary transactions that involve the exchange of goods or services, such as advertising and promotional benefits as well as tickets, for other goods or services. Such transactions are measured and recorded at the fair value of the goods or services surrendered unless the goods or services received have a more readily determinable fair value. In addition, the Company enters into other monetary transactions in which nonmonetary consideration is also included and the
F- 13
THE MADISON SQUARE GARDEN COMPANY
NOTES TO CONSOLIDATED FINANCIAL STATEMENTS
(Continued)
entire transaction is recorded at fair value. If the fair values cannot be determined for either the asset(s) surrendered or received within reasonable limits, then the nonmonetary transaction is measured and recorded at the book value of the item(s) surrendered, which typically is zero.
Direct Operating Expenses
Direct operating expenses include, but are not limited to, compensation expense for the Company’s professional sports teams’ players and certain other team personnel, as well as NBA luxury tax, NBA and NHL revenue sharing and league assessments for the MSG Sports segment; event costs related to the presentation and production of the Company’s live entertainment and sporting events; and venue lease, maintenance and other operating expenses.
Player Costs and Other Team Personnel Transactions, NBA Luxury Tax, Escrow System/Revenue Sharing and League Assessments for the MSG Sports Segment
Player Costs and Other Team Personnel Transactions
Costs incurred to acquire player contracts, including signing bonuses, are deferred and amortized over the applicable NBA or NHL regular season on a straight-line basis over the fixed contract period of the respective player. The NBA and NHL seasons are typically from mid-October through April and October through April, respectively. Player salaries are also expensed over the applicable NBA, NHL or WNBA regular season typically on a straight-line basis. In certain player contracts the annual contractual salary amounts (including any applicable signing bonuses) may fluctuate such that expensing the salary for the entire contract on a straight-line basis over each regular season more appropriately reflects the economic benefit of the services provided.
In instances where a player sustains what is deemed to be a season-ending or career-ending injury, a provision is recorded, when that determination can be reasonably made, for the remainder of the player’s seasonal or contractual salary and related costs, together with any associated NBA luxury tax, net of any anticipated insurance recoveries. When players are traded, waived or contracts are terminated, any remaining unamortized signing bonuses and prepaid salaries are expensed to current operations. Amounts due to these individuals are generally paid over their remaining contract terms. Team personnel contract termination costs are recognized in the period in which those events occur. See Note 5 for further discussion of significant team personnel transactions.
The NBA and NHL each have collective bargaining agreements (each a “CBA”) with the respective league’s players association, to which the Company is subject. The NBA CBA expires after the 2023-24 season (although the NBA and the National Basketball Players Association (“NBPA”) each have the right to terminate the CBA following the 2022-23 season). The NHL CBA expires on September 15, 2022 (although the NHL and National Hockey League Players’ Association each have the right to terminate the CBA following the 2019-20 season).
The NBA CBA contains a “soft” salary cap (i.e., a cap on each team’s aggregate player salaries but with certain exceptions that enable teams to pay more, sometimes substantially more, than the cap). The NHL CBA provides for a “hard” salary cap (i.e., teams may not exceed a stated maximum that has been negotiated for the 2013-14 season and is adjusted each season thereafter based upon league-wide revenues).
NBA Luxury Tax
Amounts in this paragraph are in thousands, except for luxury tax rates.
The NBA CBA provides for a luxury tax that is applicable to all teams with aggregate player salaries exceeding a threshold that is set prior to each season based upon projected league-wide revenues (as defined under the CBA). The luxury tax rates for teams with aggregate player salaries above such threshold start at $1.50 for each $1.00 of team salary above the threshold up to $5,000 and scale up to $3.25 for each $1.00 of team salary that is from $15,000 to $20,000 over the threshold, and an additional tax rate increment of $0.50 applies for each additional $5,000 (or part thereof) of team salary in excess of $20,000 over the threshold. In addition, for teams that are taxpayers in at least three of four previous seasons, the above tax rates are increased by $1.00 for each increment. Fifty percent of the aggregate luxury tax payments is a funding source for the revenue sharing plan and the remaining 50% of such payments is distributed in equal shares to non-taxpaying teams. The Company recognizes the estimated amount associated with luxury tax expense or the amount it expects to receive as a non-tax paying team, if applicable, on a straight-line basis over the NBA regular season as a component of direct operating expenses.
F- 14
THE MADISON SQUARE GARDEN COMPANY
NOTES TO CONSOLIDATED FINANCIAL STATEMENTS
(Continued)
NBA and NHL Escrow System/Revenue Sharing
The NBA CBA also provides that players collectively receive a designated percentage of league-wide revenues (net of certain direct expenses) as compensation (approximately 51%), and the teams retain the remainder. The percentage of league-wide revenues paid as compensation and retained by the teams does not apply evenly across all teams and accordingly the Company may pay its players a higher or lower percentage of the Knicks’ revenues than other NBA teams. Throughout each season, NBA teams withhold 10% of each player’s salary and contribute the withheld amounts to an escrow account. If the league’s aggregate player compensation exceeds the designated percentage of league-wide revenues, some or all of such escrowed amounts are distributed equally to all NBA teams. In the event that the league’s aggregate player compensation is below the designated percentage of league-wide revenues, the teams will remit the shortfall to the NBPA for distribution to the players.
The NBA also has a revenue sharing plan that generally requires the distribution of a pool of funds to teams with below-average net revenues (as defined in the plan), subject to reduction or elimination based on individual team market size and profitability. The plan is funded by a combination of disproportionate contributions from teams with above-average net revenues, subject to certain profit-based limits (each as defined in the plan); 50% of aggregate league-wide luxury tax proceeds; and collective league sources, if necessary. Additional amounts may also be distributed on a discretionary basis, funded by assessments on playoff ticket revenues and through collective league sources.
The NHL CBA provides that each season the players receive as player compensation 50% of that season’s league-wide revenues, excluding the impact of agreed-upon aggregate transition payments of $300,000 paid on a deferred basis over three years beginning in 2014. Because the aggregate amount to be paid to the players is based upon league-wide revenues and not on a team-by-team basis, the Company may pay its players a higher or lower percentage of the Rangers’ revenues than other NHL teams pay of their own revenues. In order to implement the salary cap system, NHL teams withhold a portion of each player’s salary and contribute the withheld amounts to an escrow account. If the league’s aggregate player compensation for a season exceeds the designated percentage (50%) of that season’s league-wide revenues, the excess is retained by the league. Any excess funds will be distributed by the NHL to all teams in equal shares.
The NHL CBA provides for a revenue sharing plan which generally requires the distribution of a pool of funds approximating 6.055% of league-wide revenues to certain qualifying lower-revenue teams. Under the NHL CBA, the pool is funded as follows: (a) 50% from contributions by the top ten revenue earning teams (based on pre-season and regular season revenues) in accordance with a formula; (b) then from payments by teams participating in the playoffs, with each team contributing 35% of its gate receipts for each home playoff game; and (c) the remainder from centrally-generated NHL sources. The Rangers are consistently among the top ten revenue teams and, accordingly, have consistently contributed to the top ten revenue teams component of the plan.
The Company recognizes the amount of its estimated revenue sharing expense associated with the pre-season and regular season, net of the amount the Company expects to receive from the escrow, on a straight-line basis over the applicable NBA and NHL seasons as a component of direct operating expenses. In years when the Knicks or Rangers participate in the playoffs, the Company recognizes its estimate of the playoff revenue sharing contribution in the periods when the playoffs occur.
League Assessments
As members of the NBA and NHL, the Knicks and Rangers, respectively, are also subject to annual league assessments. The governing bodies of each league determine the amount of each season’s league assessments that are required from each member team. The Company recognizes its teams’ estimated league assessments on a straight-line basis over the applicable NBA or NHL season.
Production Costs for the MSG Entertainment Segment
The Company defers certain costs of productions such as creative design, scenery, wardrobes, rehearsal and other related costs for the Company’s proprietary shows. Deferred production costs are amortized on a straight-line basis over the course of a production’s performance period using the expected life of a show’s assets, which is currently 5 years. Deferred production costs are subject to recoverability assessments whenever there is an indication of potential impairment. During the third quarter of fiscal year 2016, the Company recorded a $41,816 write-off of deferred production costs associated with the New York Spectacular Starring the Radio City Rockettes (“New York Spectacular”) due to the creative decision to not include, in the summer of 2016 performances, certain scenes from the previous show. Subsequently, due to assessments of the show’s creative direction, timing and scale, the Company wrote off the remaining balance of deferred production costs associated with this production in the amount of $33,629 during the fourth quarter of fiscal year 2017. The Company has $6,288 and $6,702 of net deferred production costs recorded within other current assets and other assets in the accompanying consolidated balance sheets
F- 15
THE MADISON SQUARE GARDEN COMPANY
NOTES TO CONSOLIDATED FINANCIAL STATEMENTS
(Continued)
as of June 30, 2018 and 2017, respectively.
Advertising Expenses
Advertising costs are typically charged to expense when incurred, however, advertising for productions and other live entertainment events are generally deferred within interim periods and expensed over the run of the show, but by no later than the end of the fiscal year. Total advertising costs classified in direct operating and selling, general and administrative expenses were $16,314, $18,963 and $20,834 for the years ended June 30, 2018, 2017 and 2016, respectively.
Income Taxes
The Company accounts for income taxes in accordance with ASC Topic 740, Income Taxes (“ASC Topic 740”). For the periods before the Distribution, income taxes as presented herein attribute current and deferred income taxes of MSG Networks to the Company’s stand-alone financial statements in a manner that is systematic, rational, and consistent with the asset and liability method prescribed by ASC Topic 740. Accordingly, the Company’s income tax provision was prepared following the separate return method. The separate return method applies ASC Topic 740 to the stand-alone financial statements of each member of the combined group as if the group member were a separate taxpayer and the benefits of a consolidated return have been reflected where such returns have or could be filed based on the entities’ jurisdictions included in the combined financial statements. As a result, actual tax transactions included in the consolidated financial statements of MSG Networks may not be included in the combined financial statements. Similarly, the tax treatment of certain items reflected in the combined financial statements may not be reflected in the consolidated financial statements and tax returns of MSG Networks. Therefore, portions of items such as net operating losses, credit carryforwards, other deferred taxes, uncertain tax positions and valuation allowances may exist in the combined financial statements that may or may not exist in MSG Networks’ consolidated financial statements.
Because the Company’s operations prior to the Distribution were included in MSG Networks’ tax returns, payments to certain tax authorities were made by MSG Networks, and not by the Company. The Company only maintains taxes payable to/from the taxing authorities for legal entities that are fully-dedicated to the Company’s business. The Company did not maintain taxes payable to/from MSG Networks and the payments were deemed to settle the annual current tax payable balances immediately with the legal entities paying the tax in the respective jurisdictions through changes in MSG Networks’ investment.
For the periods after the Distribution, the Company’s provision for income taxes is based on current period income, changes in deferred tax assets and liabilities and changes in estimates with regard to uncertain tax positions. Deferred tax assets are subject to an ongoing assessment of realizability. In assessing the realizability of deferred tax assets, management considers whether it is more likely than not that some portion or all of the deferred tax asset will not be realized. The Company’s ability to realize its deferred tax assets depends upon the generation of sufficient future taxable income to allow for the realization of its deductible temporary differences. If such estimates and related assumptions change in the future, the Company may be required to record valuation allowances against its deferred tax assets, resulting in additional income tax expense in the Company’s consolidated statements of operations.
Interest and penalties, if any, associated with uncertain tax positions are included in income tax expense.
The Company accounts for investment tax credits using the “flow-through” method, under which the tax benefit generated from an investment tax credit is recorded in the period the credit is generated.
Share-based Compensation
Prior to Distribution, the Company’s employees participated in MSG Networks’ share-based compensation plans. Share-based compensation expense has been attributed to the Company based on the awards and terms previously granted to MSG Networks’ employees. For purposes of the combined financial statements, an allocation of share-based compensation expense related to corporate employees was recorded in addition to the expense attributed to the Company’s direct employees. The allocated expense includes both directors and corporate executives of MSG Networks, allocated using a proportional allocation method which management has deemed to be reasonable.
F- 16
THE MADISON SQUARE GARDEN COMPANY
NOTES TO CONSOLIDATED FINANCIAL STATEMENTS
(Continued)
Following the Distribution, the Company measures the cost of employee services received in exchange for an award of equity-based instruments based on the grant date fair value of the award. Share-based compensation cost is recognized in earnings (net of estimated forfeitures) over the period during which an employee is required to provide service in exchange for the award, except for restricted stock units granted to non-employee directors which, unless otherwise provided under the applicable award agreement, are fully vested, and are expensed at the grant date. Up until the adoption of Accounting Standards Update (“ASU”) No. 2016-09, Compensation - Stock Compensation (Topic 718): Improvements to Employee Share-based Payment Accounting, the Company estimated forfeitures based upon historical experience and its expectations regarding future vesting of awards. To the extent actual forfeitures were different from the Company’s estimates, share-based compensation was adjusted accordingly.
Beginning in the first quarter of fiscal year 2018, upon the adoption of ASU No. 2016-09, the Company elected to account for forfeitures as they occur on a prospective basis effective July 1, 2017, rather than estimating expected forfeitures as was required under the prior guidance. See “— Recently Adopted Accounting Pronouncements” for further discussion on the impact from the adoption of ASU No. 2016-09.
In addition, for the Company’s stock option awards, the Company applies the fair value recognition provisions of ASC Topic 718 “Compensation — Stock Compensation”. ASC Topic 718 requires companies to estimate the fair value of share-based payment awards on the date of grant using an option-pricing model. The Company determines the fair value as of the grant date. For awards with graded vesting conditions, the values of the awards are determined by valuing all vesting tranches in the aggregate as one award using an average expected term. For stock options, the Black-Scholes option pricing model considers, among other factors, the expected life of the award and the expected volatility of the Company’s stock price.
The Company determines its assumptions for the Black-Scholes option-pricing model in accordance with ASC Topic 718 and SEC Staff Accounting Bulletin (“SAB”) No. 107, “Share-Based Payment” based on the following:
• | The expected term of stock options is estimated using the simplified method. |
• | The expected risk-free interest rate is based on the U.S. Treasury interest rate which term is consistent with the expected term of the stock options. |
• | The expected volatility is based on the historical volatility of the Company’s stock price. |
In December 2007, the SEC staff issued SAB No. 110, “Certain Assumptions Used In Valuation Methods — Expected Term”. SAB No. 110 allows companies to continue to use the simplified method, as defined in SAB No. 107, to estimate the expected term of stock options under certain circumstances. The simplified method for estimating expected term uses the mid-point between the vesting term and the contractual term of the stock option. The Company has analyzed the circumstances in which the use of the simplified method is allowed. The Company has opted to use the simplified method for stock options the Company granted in fiscal year 2018 because management believes that the Company does not have sufficient historical exercise data to provide a reasonable basis upon which to estimate the expected term.
Earnings (Loss) Per Common Share
Basic earnings (loss) per common share (“EPS”) attributable to the Company’s common stockholders is based upon net income (loss) attributable to the Company’s common stockholders divided by the weighted-average number of common shares outstanding during the period. Diluted EPS reflects the effect of the assumed vesting of restricted stock units and exercise of stock options (see Note 13) only in the periods in which such effect would have been dilutive. For the periods when a net loss is reported, the computation of diluted EPS equals the basic EPS calculation since common stock equivalents were antidilutive due to losses from continuing operations.
Cash and Cash Equivalents
The Company considers the balance of its investment in funds that substantially hold highly liquid securities that mature within three months or less from the date the fund purchases these securities to be cash equivalents. The carrying amount of cash and cash equivalents either approximates fair value due to the short-term maturity of these instruments or is at fair value. Checks outstanding in excess of related book balances are included in accounts payable in the accompanying consolidated balance sheets. The Company presents the change in these book cash overdrafts as cash flows from operating activities.
F- 17
THE MADISON SQUARE GARDEN COMPANY
NOTES TO CONSOLIDATED FINANCIAL STATEMENTS
(Continued)
Restricted Cash
The Company’s restricted cash includes cash deposited in escrow accounts. For example, the Company has deposited cash in an interest-bearing escrow account as credit support and collateral to its workers compensation and general liability insurance obligations. Separately, cash is required to be withheld from player salaries and deposited in an escrow account which is in the name of the Company pursuant to the NHL CBA. That escrow account will be distributed subsequent to the end of the season to the players and NHL teams based on the provisions of the NHL CBA. The carrying amount of restricted cash approximates fair value due to the short-term maturity of these instruments. Changes in restricted cash are reflected in cash flows from either operating or investing activities, depending on the circumstances to which the changes in the underlying restricted cash relate.
Accounts Receivable
Accounts receivable is recorded at net realizable value. The Company maintains an allowance for doubtful accounts to reserve for potentially uncollectible receivables. The allowance for doubtful accounts is estimated based on the Company’s analysis of receivables aging, specific identification of certain receivables that are at risk of not being paid, past collection experience and other factors. The Company’s allowance for doubtful accounts was $777 and $601 as of June 30, 2018 and 2017, respectively.
Investments in and Loans to Nonconsolidated Affiliates
The Company’s investments in nonconsolidated affiliates are primarily accounted for using the equity method of accounting and are carried at cost, plus or minus the Company’s share of net earnings or losses of the investment, subject to certain other adjustments. The cost of equity method investments includes transaction costs of the acquisition. As required by GAAP, to the extent that there is a basis difference between the cost and the underlying equity in the net assets of an equity investment, companies are required to allocate such differences between tangible and intangible assets. The Company’s share of net earnings or losses of the investment, inclusive of amortization expense for intangible assets associated with the investment, is reflected in equity in earnings (loss) of nonconsolidated affiliates on the Company’s consolidated statements of operations. Dividends received from the investee reduce the carrying amount of the investment. Due to the timing of receiving financial information from its nonconsolidated affiliates, the Company records its share of net earnings or losses of such affiliates on a three-month lag basis, with the exception of the amortization expense of intangible assets which are recorded currently.
In addition to the equity method investments, the Company also has other investments accounted for under the cost method of accounting.
The Company also provides revolving credit facilities to certain of its nonconsolidated affiliates. The outstanding loan balances, including accrued interest, are reflected in investments in and loans to nonconsolidated affiliates in the accompanying consolidated balance sheets. Interest income on the outstanding loan balances and related facility fees are recorded currently and are reflected in interest income in the accompanying consolidated statements of operations.
Impairment of Investments
The Company reviews its investments at least quarterly to determine whether a decline in fair value below the cost basis is other-than-temporary. The primary factors the Company considers in its determination are the length of time that the fair value of the investment is below the Company’s carrying value; future prospects of the investee; and the Company’s intent and ability to hold the security for a period of time sufficient to allow for any anticipated recovery in fair value. In addition, the Company considers other factors such as general market conditions, industry conditions, and analysts’ ratings. If the decline in fair value is deemed to be other-than-temporary, the cost basis of the investment is written down to fair value and the loss is realized as a component of net income. See Note 6 for further discussion of impairments of investments.
Long-Lived and Indefinite-Lived Assets
The Company’s long-lived and indefinite-lived assets consist of property and equipment, goodwill, indefinite-lived intangible assets and amortizable intangible assets.
Property and equipment is stated at cost. Depreciation is calculated on a straight-line basis over the estimated useful lives of the assets or, with respect to leasehold improvements, amortized over the shorter of the lease term or the asset’s estimated useful life. The useful lives of the Company’s long-lived assets are based on estimates of the period over which the Company expects the assets to be of economic benefit to the Company. In estimating the useful lives the Company considers factors such as, but not limited to, risk of obsolescence, anticipated use, plans of the Company, and applicable laws and permit requirements. In July 2013, the permit for The Garden was renewed for ten years and these financial statements have been prepared assuming further renewal of that permit.
F- 18
THE MADISON SQUARE GARDEN COMPANY
NOTES TO CONSOLIDATED FINANCIAL STATEMENTS
(Continued)
Identifiable intangible assets with finite useful lives are amortized on a straight-line basis over their respective estimated useful lives. Goodwill and identifiable intangible assets that have indefinite useful lives are not amortized.
Impairment of Long-Lived and Indefinite-Lived Assets
In assessing the recoverability of the Company’s long-lived and indefinite-lived assets, the Company must make estimates and assumptions regarding future cash flows and other factors to determine the fair value of the respective assets. These estimates and assumptions could have a significant impact on whether an impairment charge is recognized as well as the magnitude of any such charge. Fair value estimates are made at a specific point in time, based on relevant information. These estimates are subjective in nature and involve significant uncertainties and judgments and therefore cannot be determined with precision. Changes in assumptions could significantly affect the estimates. If these estimates or material related assumptions change in the future, the Company may be required to record impairment charges related to its long-lived and/or indefinite-lived assets.
Goodwill is tested annually for impairment as of August 31st and at any time upon the occurrence of certain events or changes in circumstances. The Company has the option to perform a qualitative assessment to determine if an impairment is more likely than not to have occurred. If the Company can support the conclusion that it is not more likely than not that the fair value of a reporting unit is less than its carrying amount, the Company would not need to perform the two-step impairment test for that reporting unit. If the Company cannot support such a conclusion or the Company does not elect to perform the qualitative assessment then the first step of the goodwill impairment test is used to identify potential impairment by comparing the fair value of a reporting unit with its carrying amount, including goodwill. The Company generally determines the fair value of a reporting unit using an income approach, such as the discounted cash flow method, in instances when it does not perform the qualitative assessment of goodwill. If the carrying amount of a reporting unit exceeds its fair value, the second step of the goodwill impairment test is performed to measure the amount of impairment loss, if any. The second step of the goodwill impairment test compares the implied fair value of the reporting unit’s goodwill with the carrying amount of that goodwill. If the carrying amount of the reporting unit’s goodwill exceeds the implied fair value of that goodwill, an impairment loss is recognized in an amount equal to that excess. The implied fair value of goodwill is determined in the same manner as the amount of goodwill that would be recognized in a business combination.
The Company performs its goodwill impairment test at the reporting unit level, which is one level below the operating segment level. The Company has two operating and reportable segments, MSG Sports and MSG Entertainment, consistent with the way management makes decisions and allocates resources to the business. For the year ended June 30, 2018, the Company had three reporting units across its two operating segments for goodwill impairment testing purposes: MSG Sports, MSG Entertainment and TAO Group. During the first quarter of fiscal year 2018, the Company performed its annual impairment test of goodwill and determined that there were no impairments of goodwill identified for any of its reporting units as of the impairment test date.
Identifiable indefinite-lived intangible assets are tested annually for impairment as of August 31st and at any time upon the occurrence of certain events or substantive changes in circumstances. The Company has the option to perform a qualitative assessment to determine if an impairment is more likely than not to have occurred. In the qualitative assessment, the Company must evaluate the totality of qualitative factors, including any recent fair value measurements, that impact whether an indefinite-lived intangible asset other than goodwill has a carrying amount that more likely than not exceeds its fair value. The Company must proceed to conducting a quantitative analysis if the Company (i) determines that such an impairment is more likely than not to exist, or (ii) foregoes the qualitative assessment entirely. Under the quantitative assessment, the impairment test for identifiable indefinite-lived intangible assets consists of a comparison of the estimated fair value of the intangible asset with its carrying value. If the carrying value of the intangible asset exceeds its fair value, then an impairment loss is recognized in an amount equal to that excess. The Company generally determines the fair value of an indefinite-lived intangible asset using an income approach, such as the relief from royalty method, in instances when it does not perform the qualitative assessment of the intangible asset.
For other long-lived assets, including intangible assets that are amortized, the Company evaluates assets for recoverability when there is an indication of potential impairment. If the undiscounted cash flows from a group of assets being evaluated is less than the carrying value of that group of assets, the fair value of the asset group is determined and the carrying value of the asset group is written down to fair value. The Company generally determines the fair value of a finite-lived intangible asset using an income approach, such as the discounted cash flow method.
F- 19
THE MADISON SQUARE GARDEN COMPANY
NOTES TO CONSOLIDATED FINANCIAL STATEMENTS
(Continued)
Contingencies
Liabilities for loss contingencies arising from claims, assessments, litigation, fines and penalties and other sources are recorded when it is probable that a liability has been incurred and the amount of the assessment can be reasonably estimated.
Contingent Consideration
Some of the Company’s acquisition agreements include contingent earn-out arrangements, which are generally based on the achievement of future operating targets.
The fair values of these earn-out arrangements are included as part of the purchase price of the acquired companies on their respective acquisition dates. For each transaction, the Company estimates the fair value of contingent earn-out payments as part of the initial purchase price and records the estimated fair value of contingent consideration that the Company expects to pay to the former owners as a liability in “Other accrued liabilities” and “Other liabilities” on the consolidated balance sheets.
The Company measures its contingent earn-out liabilities at fair value on a recurring basis using significant unobservable inputs classified within Level III of the fair value hierarchy, which can result in a significantly higher or lower liability with a higher liability capped by the contractual maximum of the contingent earn-out obligation. Ultimately, the liability will be equivalent to the amount paid, and the difference between the fair value estimate and amount paid will be recorded in earnings as operating expense.
See Note 10 for more information regarding the fair value of the Company’s contingent consideration liabilities related to the acquisitions.
Defined Benefit Pension Plans and Other Postretirement Benefit Plan
As more fully described in Note 12, certain of our employees participated in defined benefit pension plans (“Shared Plans”) sponsored by MSG Networks prior to the Distribution, which included participants of other MSG Networks subsidiaries. The Company accounted for the Shared Plans under the guidance of ASC Topic 715, Compensation - Retirement Benefits. Accordingly, the Company recorded an asset or liability to recognize the funded status of the Shared Plans, as well as a liability only for any required contributions to the Shared Plans that were accrued and unpaid at the balance sheet date. The related pension expenses attributed to the Company were based primarily on pensionable compensation of active participants. For the Shared Plans’ liabilities, the consolidated financial statements reflect the full impact of such plans. The pension expense related to employees of other MSG Networks businesses participating in any of the Shared Plans is reflected as a contributory credit from MSG Networks to the Company, resulting in a decrease to the expense recognized in the consolidated statements of operations.
In addition to the Shared Plans, the Company sponsors a plan that certain of our employees participate in, accounted for as a defined benefit pension plan, both prior to and after the Distribution. Accordingly, the funded and unfunded position of the Direct Plan is recorded in the Company’s consolidated balance sheet.
Actuarial gains and losses that have not yet been recognized through income are recorded in accumulated other comprehensive income, until they are amortized as a component of net periodic benefit cost.
After the Distribution, the Company maintains its own, both funded and unfunded, defined benefit plans, as well as a contributory other postretirement benefit plan, covering certain full-time employees and retirees. The majority of the defined benefit pension benefits are based on formulas that reflect the employees’ years of service and compensation during their employment period and participation in the plans. The expense recognized by the Company is determined using certain assumptions, including the expected long-term rate of return, discount rate and rate of compensation increases, among others. The Company recognizes the funded status of its defined benefit pension and other postretirement plans (other than multiemployer plans) as an asset or liability in the consolidated balance sheets and recognizes changes in the funded status in the year in which the changes occur through other comprehensive income (loss).
F- 20
THE MADISON SQUARE GARDEN COMPANY
NOTES TO CONSOLIDATED FINANCIAL STATEMENTS
(Continued)
Fair Value Measurements
The fair value hierarchy is based on inputs to valuation techniques that are used to measure fair value that are either observable or unobservable. Observable inputs reflect assumptions market participants would use in pricing an asset or liability based on market data obtained from independent sources while unobservable inputs reflect a reporting entity’s pricing based upon their own market assumptions. The fair value hierarchy consists of the following three levels:
• | Level I — Quoted prices for identical instruments in active markets. |
• | Level II — Quoted prices for similar instruments in active markets; quoted prices for identical or similar instruments in markets that are not active; and model-derived valuations whose inputs are observable or whose significant value drivers are observable. |
• | Level III — Instruments whose significant value drivers are unobservable. |
Foreign Currency Translations
The consolidated financial statements are presented in U.S. Dollars. Assets and liabilities of non-U.S. subsidiaries that operate in a local currency environment, where that local currency is the functional currency, are translated to U.S. Dollars at exchange rates in effect at the balance sheet date. Operating results of non-U.S. subsidiaries are translated at weighted-average exchange rates during the year which approximate the rates in effect at the transaction dates. Foreign currency translation gains and losses are included as a component of accumulated other comprehensive income (loss) as changes in cumulative translation adjustments in the accompanying consolidated balance sheets.
Recently Adopted Accounting Pronouncements
In March, the FASB issued Accounting Standards Update (“ASU”) No. 2016-07, Investments - Equity Method and Joint Ventures (Topic 323), Simplifying the Transition to the Equity Method of Accounting. ASU No. 2016-07 eliminates the requirement for an investor to retrospectively apply the equity method when an investment that it had accounted for by another method qualifies for use of the equity method. This standard was adopted by the Company prospectively in the first quarter of fiscal year 2018. The adoption of the standard did not have an impact on the Company’s consolidated financial statements.
In March 2016, the FASB issued ASU No. 2016-09, Compensation - Stock Compensation (Topic 718): Improvements to Employee Share-based Payment Accounting. ASU No. 2016-09, among other things, (i) requires the income tax effects of all awards to be recognized in the statement of operations when the awards vest or are settled, (ii) allows an employer to repurchase more of an employee’s shares for tax withholding purposes than currently allowable, without triggering liability accounting, and provides companies with the option to make a policy election to account for forfeitures as they occur, and (iii) requires companies to present excess tax benefits as operating activity rather than as financing activity on the statement of cash flows. This standard was adopted by the Company in the first quarter of fiscal year 2018. In connection with the Company’s election to record forfeitures as they occur, the Company used the modified retrospective transition method and recorded a cumulative effect of $2,403, which was an increase in beginning accumulated deficits with the offset by an equal increase in additional paid in capital. In addition, the Company prospectively adopted the provision regarding the presentation of excess tax benefits in the statement of cash flows, which did not result in a change in the net cash provided by operating activities for the year ended June 30, 2018 because the Company currently is in a net operating loss position.
In May 2017, the FASB issued ASU No. 2017-09, Compensation - Stock Compensation (Topic 718): Scope of Modification Accounting. ASU No. 2017-09 provides clarification on when modification accounting should be used for changes to the terms or conditions of a share-based payment award. This standard does not change the accounting for modifications but clarifies that modification accounting guidance should only be applied if there is a change to the value, vesting conditions or award classification and would not be required if the changes are considered non-substantive. This standard was early adopted by the Company prospectively in the first quarter of fiscal year 2018. The adoption of the standard did not have an impact on the Company’s consolidated financial statements.
F- 21
THE MADISON SQUARE GARDEN COMPANY
NOTES TO CONSOLIDATED FINANCIAL STATEMENTS
(Continued)
In February 2018, the FASB issued ASU No. 2018-02, Income Statement - Reporting Comprehensive Income (Topic 220): Reclassification of Certain Tax Effects from Accumulated Other Comprehensive Income. The amendments in this update allow a reclassification from accumulated other comprehensive income to retained earnings for stranded tax effects resulting from the Tax Cuts and Jobs Act. This standard is required to be applied either in the period of adoption or retrospectively to each period (or periods) in which the effect of the change in the U.S. federal corporate income tax rate in the Tax Cuts and Jobs Act is recognized. Early adoption is permitted. The Company elected to early adopt this standard in the fourth quarter of fiscal year 2018. The adoption of this standard resulted in a reclassification of the disproportionate tax effects from accumulated other comprehensive loss to retained earnings (accumulated deficit) in the period of adoption. See Note 16 for more information.
Recently Issued Accounting Pronouncements Not Yet Adopted
In May 2014, the FASB issued ASU No. 2014-09, Revenue from Contracts with Customers (Topic 606) , which supersedes the revenue recognition requirements in FASB Accounting Standards Codification (“ASC”) Topic 605, Revenue Recognition. ASC Topic 606, among other things, (i) is based on the principle that revenue is recognized to depict the transfer of goods or services to customers in an amount that reflects the consideration to which the entity expects to be entitled in exchange for those goods or services, and (ii) requires additional disclosure about the nature, amount, timing and uncertainty of revenue and cash flows arising from customer contracts, including significant judgments and changes in judgments and assets recognized from costs incurred to obtain or fulfill a contract. In August 2015, the FASB issued ASU No. 2015-14, Revenue from Contracts with Customers (Topic 606): Deferral of the Effective Date, which defers the effective date of ASU No. 2014-09 for all entities by one year. In March 2016, the FASB issued ASU No. 2016-08, Revenue from Contracts with Customers (Topic 606), Principal versus Agent Considerations (Reporting Revenue versus Net), which clarifies the implementation guidance on principal versus agent considerations in the new revenue recognition standard under ASU No. 2014-09. ASU No. 2016-08 clarifies how an entity should identify the unit of accounting (i.e., the specified good or service) for the principal versus agent evaluation and how it should apply the control principle to certain types of arrangements. In April 2016, the FASB issued ASU No. 2016-10, Revenue from Contracts with Customers (Topic 606): Identifying Performance Obligations and Licensing, which clarifies the principle in ASU No 2014-09 for determining whether a good or service is separately identifiable from other promises in the contract and, therefore, should be accounted for separately. ASU No. 2016-10 also clarifies that entities are not required to identify promised goods or services that are immaterial in the context of the contract and allows entities to elect to account for shipping and handling activities as a fulfillment cost rather than as an additional promised service. In May 2016, the FASB issued ASU No. 2016-12, Revenue from Contracts with Customers (Topic 606) — Narrow-Scope Improvements and Practical Expedients, which clarifies the following aspects in ASU No. 2014-09: collectability, presentation of sales taxes and other similar taxes collected from customers, noncash considerations, contract modifications at transition, completed contracts at transition, and technical correction. In December, the FASB issued ASU No. 2016-20, Technical Corrections and Improvements to Topic 606, Revenue from Contracts with Customers, which allows entities not to make quantitative disclosures about remaining performance obligations in certain cases and requires entities that use any of the new or previously existing optional exemptions to expand their qualitative disclosures.
ASC Topic 606 and the related updates will be effective for the Company beginning in the first quarter of fiscal year 2019 using one of two retrospective application methods. The Company’s evaluation of the impact this standard will have on its consolidated financial statements is ongoing. Based on the review to date, the Company believes that for certain revenue streams the adoption of the new accounting standard will affect the timing of revenue recognition across the quarters of the fiscal year. For example, a vast majority of local media right fees from MSG Networks will now be recognized over the Company’s professional sports teams’ seasons as opposed to being recognized straight line over the fiscal year. Additionally, season ticket revenue will be recognized as home games are played as opposed to being recognized straight-line over the Company’s professional sports teams’ seasons. Suite revenue, which used to be recognized straight line over the fiscal year, will now generally be recognized proportionally in line with the number of events that occur in a given period.
Additionally, certain revenue streams with multi-year arrangements that historically were accounted for following the contractual terms of the respective agreements will now be accounted for as arrangements containing performance obligations that are considered to be a “series” under the new accounting standard. If specific criteria are met, series accounting requires the total contract value to be aggregated at the inception of the contract and then recognized as the Company’s underlying performance obligations are satisfied over the contractual term of the entire multi-year agreement. This rule, which affects the Company’s accounting for suite licenses and most of MSG’s sponsorship revenue, results in accelerated revenue recognition for newer contracts and lower revenue for more mature contracts when compared to current accounting rules. Generally for MSG this means that revenues for multi-year suite licenses and sponsorship arrangements will be recognized straight-line over the multi-year arrangement irrespective of contractual annual fee escalators. The Company plans to adopt the new standard using
F- 22
THE MADISON SQUARE GARDEN COMPANY
NOTES TO CONSOLIDATED FINANCIAL STATEMENTS
(Continued)
the modified retrospective method. With the exceptions for revenues from suites and sponsorship arrangements, where the Company continues to determine the amount of the transition adjustment, the Company does not believe the impact of adopting the new revenue standard will be material to the Company’s consolidated financial position or results of operations.
In January 2016, the FASB issued ASU No. 2016-01, Financial Instruments - Overall (Subtopic 825-10): Recognition and Measurement of Financial Assets and Financial Liabilities, addressing certain aspects of recognition, measurement, presentation, and disclosure of financial instruments. This standard, among other things, (i) requires equity investments, with certain exceptions, to be measured at fair value with changes in fair value recognized in net income and (ii) simplifies the impairment assessment of equity investments without readily determinable fair values by requiring a qualitative assessment to identify impairment. In February 2018, the FASB issued ASU No. 2018-03, Technical Corrections and Improvements to Financial Instruments Overall (Subtopic 825-10): Recognition and Measurement of Financial Assets and Financial Liabilities, which clarifies certain aspects of the guidance issued in ASU No. 2016-01. Among other items, the amendment clarifies that an entity that uses the measurement alternative for equity securities without readily determinable fair values can change its measurement approach to fair value. Once the election is made, the measurement approach is irrevocable and the entity is required to apply the selected approach to that security and all identical or similar investments of the same issuer. Early adoption of ASU No. 2016-01 is not permitted with the exception of certain provisions related to the presentation of other comprehensive income. This standard will be effective for the Company beginning in the first quarter of fiscal year 2019. The Company is currently evaluating the impact this standard will have on its consolidated financial statements.
In February 2016, the FASB issued ASU No. 2016-02, Leases (Topic 842), which supersedes existing guidance on accounting for leases in FASB ASC Topic 840, Leases. ASU No. 2016-02, among other things, (i) requires lessees to account for leases as either finance leases or operating leases and generally requires all leases to be recorded on the balance sheet, including those leases classified as operating leases under previous accounting guidance, through the recognition of right-of-use assets and corresponding lease liabilities, and (ii) requires extensive qualitative and quantitative disclosures about leasing activities. The accounting applied by a lessor is largely unchanged from that applied under previous accounting guidance. In January 2018, the FASB issued ASU No. 2018-01, Leases (Topic 842) - Land Easement Practical Expedient for Transition to Topic 842, which provides a lessee or lessor the option to not assess at transition whether existing land easements, not currently accounted for as leases under the current lease guidance, should be treated as leases under the new standard. The effective date and transition requirements for ASU No. 2018-01 are the same as ASU No. 2016-02. This standard, as amended, will be effective for the Company beginning in the first quarter of fiscal year 2020 and is required to be applied using the modified retrospective approach for all leases existing as of the effective date. Early adoption is permitted; however, the Company currently does not plan to adopt this standard early. The Company’s evaluation of the impact this standard will have on its consolidated financial statements is ongoing. Based on efforts to date, the adoption of the standard is expected to result in the recognition of right of use assets and lease liabilities related to the Company’s operating leases.
In June 2016, the FASB issued ASU 2016-13, Financial Instruments - Credit Losses. ASU 2016-13 replaces the incurred loss impairment methodology in current U.S. GAAP with a methodology that will require the reflection of expected credit losses and will also require consideration of a broader range of reasonable and supportable information to determine credit loss estimates. For most financial instruments, the standard will require the use of a forward-looking expected loss model rather than the incurred loss model for recognizing credit losses, which will generally result in the earlier recognition of credit losses on financial instruments. This standard will be effective for the Company beginning in the first quarter of fiscal year 2021, with early adoption permitted. The Company is currently evaluating the impact this standard will have on its consolidated financial statements.
In August 2016, the FASB issued ASU No. 2016-15, Statement of Cash Flows (Topic 230). ASU No. 2016-15 addresses eight specific cash flow issues and is intended to reduce diversity in practice in how certain cash receipts and cash payments are presented and classified in the statement of cash flows. This standard will be effective for the Company beginning in the first quarter of fiscal year 2019. Early adoption is permitted. The adoption of this standard is not expected to have a material impact on the Company’s consolidated financial statements.
In October 2016, the FASB issued ASU No. 2016-16, Income Taxes (Topic 740): Intra-Entity Transfers of Assets Other Than Inventory. ASU No. 2016-16 requires entities to recognize income tax consequences of an intra-entity transfer of an asset other than inventory when the transfer occurs. This standard will be effective for the Company beginning in the first quarter of fiscal year 2019. Early adoption is permitted as of the beginning of an annual reporting period for which financial statements have not been issued or made available for issuance. The adoption of this standard is not expected to have a material impact on the Company’s consolidated financial statements.
F- 23
THE MADISON SQUARE GARDEN COMPANY
NOTES TO CONSOLIDATED FINANCIAL STATEMENTS
(Continued)
In November 2016, the FASB issued ASU No. 2016-18, Statement of Cash Flows: Restricted Cash. The primary purpose of ASU No. 2016-18 is to reduce the diversity in practice that exists in the classification and presentation of changes in restricted cash on the statement of cash flows. This standard will require that a statement of cash flows explain the change during the period in the total of cash, cash equivalents, and amounts generally described as restricted cash or restricted cash equivalents. Therefore, amounts generally described as restricted cash and restricted cash equivalents should be included with cash and cash equivalents when reconciling the beginning-of-period and end-of-period total amounts shown on the statement of cash flows. This standard will be effective retrospectively for the Company beginning in the first quarter of fiscal year 2019, and will result in a change to the Company’s presentation of net cash provided by (used in) operating activities in the statement of cash flows for the impact of changes in restricted cash balances. Early adoption is permitted in any interim or annual period.
In January 2017, the FASB issued ASU No. 2017-01, Business Combinations (Topic 805) Clarifying the Definition of a Business. The primary purpose of this ASU is to clarify the definition of a business with the objective of adding guidance to assist entities with evaluating whether transactions should be accounted for as acquisitions (or disposals) of assets or businesses, which will affect many areas of accounting including acquisitions, disposals, goodwill, and consolidation. This standard will be effective for the Company beginning in the first quarter of fiscal year 2019 and is required to be applied prospectively. Early adoption is permitted. The adoption of this standard is not expected to have a material impact on the Company’s consolidated financial statements.
In January 2017, the FASB issued ASU No. 2017-04, Intangibles - Goodwill and Other (Topic 350): Simplifying the Accounting for Goodwill Impairment. ASU No. 2017-04 removes Step 2 of the goodwill impairment test, which requires a hypothetical purchase price allocation. A goodwill impairment will now be the amount by which a reporting unit’s carrying value exceeds its fair value, not to exceed the carrying amount of goodwill. This standard will be effective for the Company beginning in the first quarter of fiscal year 2021 and is required to be applied prospectively. Early adoption is permitted for interim or annual goodwill impairment tests performed on testing dates after January 1, 2017. The adoption of this standard is not expected to have a material impact on the Company’s consolidated financial statements.
In March 2017, the FASB issued ASU No. 2017-07, Compensation - Retirement Benefits (Topic 715): Improving the Presentation of Net Periodic Pension Cost and Net Periodic Postretirement Benefit Cost. ASU No. 2017-07 requires employers to disaggregate the service cost component from the other components of net benefit cost and disclose by line item the amount of net benefit cost that is included in the statement of operations or capitalized in assets. The standard requires employers to report the service cost component in the same line item(s) as other compensation costs arising from services rendered by the pertinent employees during the period and to report other components of net benefit cost separately and outside the subtotal of operating income. The standard also allows only the service cost component to be eligible for capitalization. This standard will be effective for the Company beginning in the first quarter of fiscal year 2019. The guidance requires application on a retrospective basis for the presentation of the service cost component and the other components of net benefit cost in the statements of operations and on a prospective basis for the capitalization of the service cost component of net benefit cost in assets. Early adoption is permitted as of the beginning of an annual reporting period for which financial statements have not been issued or made available for issuance. For the year ended June 30, 2018, net periodic pension and other postretirement employee benefit cost reported within operating income totaled $4,386, of which $205 represented service cost. For the year ended June 30, 2017, net periodic pension and other postretirement employee benefit cost reported within operating loss totaled $4,253, of which $207 represented service cost.
In June 2018, the FASB issued ASU No. 2018-07, Compensation — Stock Compensation (Topic 718): Improvements to Nonemployee Share-Based Payment Accounting, which expands the scope of FASB ASC Topic 718 to include all share-based payment transactions for acquiring goods and services from nonemployees. ASU No. 2018-07 specifies that FASB ASC Topic 718 applies to all share-based payment transactions in which the grantor acquires goods and services to be used or consumed in its own operations by issuing share-based payment awards. ASU No. 2018-07 also clarifies that Topic 718 does not apply to share-based payments used to effectively provide (i) financing to the issuer or (ii) awards granted in conjunction with selling goods or services to customers as part of a contract accounted for under FASB ASC Topic 606. This standard will be effective for the Company beginning in the first quarter of fiscal year 2020, with early adoption permitted, but no earlier than the adoption of FASB ASC Topic 606. The adoption of this standard is not expected to have a material impact on the Company’s consolidated financial statements.
F- 24
THE MADISON SQUARE GARDEN COMPANY
NOTES TO CONSOLIDATED FINANCIAL STATEMENTS
(Continued)
Note 3. Acquisitions
Obscura Acquisition
On November 20, 2017, the Company acquired a 100% controlling interest in Obscura, a creative studio, globally-recognized for its work in designing and developing next-generation immersive experiences. Obscura’s results of operations since the acquisition date, which are included in the Company’s consolidated statement of operations for the year ended June 30, 2018, were not material. Pro forma information is not provided since the acquisition was not material when compared with the Company’s consolidated financial statements. Third-party revenues generated by Obscura and related costs are reflected in the MSG Entertainment segment. Any costs incurred by Obscura that are associated with the Company’s business development initiatives are reported in “Corporate and Other.”
CLG Acquisition
On July 28, 2017, the Company acquired a 65% controlling interest in CLG, a premier North American esports organization. CLG’s results of operations since the acquisition date, which are included in the Company’s consolidated statement of operations for the year ended June 30, 2018, were not material. The CLG financial results of operations are reflected in the MSG Sports segment. Pro forma information is not provided since the acquisition was not material when compared with the Company’s consolidated financial statements.
TAO Group Acquisition
In connection with the Company’s strategy to broaden its portfolio of live offerings, on January 31, 2017 the Company entered into a transaction agreement pursuant to which it acquired a 62.5% common equity interest and a preferred equity interest in TAO Group, which indirectly owns all of the equity of TAO Group Operating LLC (“TAOG”). TAO Group is engaged in the management and operation of restaurants, nightlife and hospitality venues in Las Vegas, New York City, Los Angeles, Australia and Singapore. The initial purchase price of $178,627, including $8,746 to acquire preferred equity in TAO Group, was net of cash acquired of $11,344. In addition, the Company will be responsible to pay an earn-out of up to approximately $25,500, if certain performance conditions based upon earnings growth are met during the first five years following the transaction.
As a result of the purchase price allocation for this acquisition, the Company recorded $90,193 of goodwill (including certain measurement period adjustments) as of June 30, 2017. During the year ended June 30, 2018, the Company recorded additional measurement period adjustments for a total of $1,610, which were primarily related to accrued liabilities as of the acquisition date. The carrying amount of goodwill for the TAO Group acquisition was $88,583 as of June 30, 2018.
In addition, the Company recorded $7,900 as the initial fair value of contingent consideration liabilities as a part of purchase price. See Note 10 for more information regarding the change in fair value of the Company’s contingent consideration liabilities arisen from this acquisition recorded during the year ended June 30, 2018.
For the years ended June 30, 2017 and 2016, the Company recognized $7,153 and $2,457, respectively, of acquisition-related expenses in connection with the TAO Group acquisition within selling, general and administrative expenses in the accompanying consolidated statements of operations.
In connection with the TAO Group acquisition, TAO Group Intermediate Holdings LLC (“TAOIH”), a subsidiary of TAO Group, TAOG and certain of its subsidiaries obtained a five-year term senior secured term loan facility of $110,000 from a third party group of lenders to fund the acquisition of TAO Group and a senior secured revolving credit facility of up to $12,000 with a term of five years for working capital and general corporate purposes of TAOG. These credit facilities are provided without recourse to the Company or any of its affiliates (other than TAOIH and its subsidiaries). See Note 11 for more information regarding these credit facilities.
F- 25
THE MADISON SQUARE GARDEN COMPANY
NOTES TO CONSOLIDATED FINANCIAL STATEMENTS
(Continued)
BCE Acquisition
On July 1, 2016, in connection with the Company’s strategy to broaden its live experience offerings, the Company acquired a controlling interest in BCE, the live events production company that owns and operates the Boston Calling Music Festival. The Company acquired net tangible assets of $2,221 and based on the purchase price allocation, the Company recognized $11,610 of amortizable intangible assets, $12,728 of goodwill and $11,394 of initial fair value of the nonredeemable noncontrolling interest. In addition, an additional $1,750 was placed in escrow during fiscal year 2017 for a potential earn-out. The net adjustment to the potential earn-out and the amortizable intangible assets (excluding the effect of scheduled amortization expense) recorded for the year ended June 30, 2018 was not material.
Note 4. Computation of Earnings (Loss) per Common Share
The following table presents a reconciliation of weighted-average shares used in the calculations of basic and diluted earnings (loss) per common share attributable to the Company’s stockholders (“EPS”).
Years Ended June 30, | |||||||||
2018 | 2017 | 2016 | |||||||
Weighted-average shares (denominator): | |||||||||
Weighted-average shares for basic EPS | 23,639 | 23,853 | 24,754 | ||||||
Dilutive effect of shares issuable under share-based compensation plans | 207 | — | — | ||||||
Weighted-average shares for diluted EPS | 23,846 | 23,853 | 24,754 | ||||||
Anti-dilutive shares | 28 | — | — | ||||||
Note 5. Team Personnel Transactions
Direct operating and selling, general and administrative expenses in the accompanying consolidated statements of operations include net provisions for transactions relating to players and certain other team personnel on the Company’s sports teams for (i) waivers/contract termination costs, (ii) trades and (iii) season-ending injuries (“Team Personnel Transactions”). Team Personnel Transactions amounted to $27,514, $42,337 and $7,484 for the years ended June 30, 2018, 2017 and 2016, respectively.
F- 26
THE MADISON SQUARE GARDEN COMPANY
NOTES TO CONSOLIDATED FINANCIAL STATEMENTS
(Continued)
Note 6. Investments and Loans to Nonconsolidated Affiliates
The Company’s investments and loans to nonconsolidated affiliates which are accounted for under the equity method and cost method of accounting in accordance with ASC Topic 323, Investments - Equity Method and Joint Ventures, and ASC Topic 325, Investments - Other, respectively, consisted of the following:
_________________
Ownership Percentage | Investment | Loan (a) | Total | ||||||||||||
June 30, 2018 | |||||||||||||||
Equity method investments: | |||||||||||||||
Azoff MSG Entertainment LLC (“AMSGE”) | 50% | $ | 101,369 | $ | 63,500 | $ | 164,869 | ||||||||
Tribeca Enterprises LLC (“Tribeca Enterprises”) | 50% | 8,007 | 19,525 | (b) | 27,532 | ||||||||||
Others | 6,977 | — | 6,977 | ||||||||||||
Cost method investments | 10,573 | — | 10,573 | ||||||||||||
Total investments and loans to nonconsolidated affiliates | $ | 126,926 | $ | 83,025 | $ | 209,951 | |||||||||
June 30, 2017 | |||||||||||||||
Equity method investments: | |||||||||||||||
AMSGE | 50% | $ | 104,024 | $ | 97,592 | (c) | $ | 201,616 | |||||||
Brooklyn Bowl Las Vegas, LLC (“BBLV”) | (d) | — | 2,662 | (d) | 2,662 | ||||||||||
Tribeca Enterprises | 50% | 12,864 | 14,370 | (b) | 27,234 | ||||||||||
Cost method investments | 10,775 | — | 10,775 | ||||||||||||
Total investments and loans to nonconsolidated affiliates | $ | 127,663 | $ | 114,624 | $ | 242,287 | |||||||||
(a) | In connection with the Company's investments in AMSGE and Tribeca Enterprises, the Company provides $100,000 and $17,500 revolving credit facilities to these entities, respectively. Pursuant to their terms, the AMSGE and Tribeca Enterprises revolving credit facilities will terminate on September 20, 2020 and June 30, 2021, respectively. During the fourth quarter of fiscal year 2018, AMSGE repaid $34,000 and the Company agreed that such amounts could be reborrowed. The $17,500 revolving credit facility to Tribeca Enterprises was fully drawn as of June 30, 2018. |
(b) | Includes outstanding payments-in-kind (“PIK”) interest of $2,025 and $870 as of June 30, 2018 and 2017, respectively. PIK interest owed does not reduce availability under the revolving credit facility. |
(c) | Represents outstanding loan balances, inclusive of amounts due to the Company for interest of $92 as of June 30, 2017. |
(d) | As of June 30, 2017, the Company was entitled to receive back its capital, which was 74% of BBLV’s total capital, plus a preferred return, after which the Company would own a 20% interest in BBLV. The outstanding loan balance was inclusive of amounts due to the Company for interest of $62 as of June 30, 2017. In December 2017, in connection with the amendment of the BBLV’s operating agreement, the Company received a payment of $2,662, which represented the outstanding loan principal and accrued interest balance. In addition, the Company recognized interest income of $938 for the year ended June 30, 2018, which was received in connection with the repayment of the loan receivable since the loan balance was on a nonaccrual status. As a result of the amendment to the BBLV operating agreement, the Company now owns a 35% interest in BBLV with no preferred return as of June 30, 2018. |
The Company determined that these investments are not VIEs and therefore each was analyzed under the voting model. The Company determined that due to a lack of a voting majority and consistent with the accounting for partnership (or similar entities) interests, it does not control these entities. Accordingly, the Company accounts for these investments under the equity method of accounting or cost method of accounting in accordance with ASC Topic 323 and ASC Topic 325, respectively. In addition, for an investment in a limited liability company in which the Company has an ownership interest that exceeds 3-5%, the Company also accounts for such investment under the equity method of accounting.
F- 27
THE MADISON SQUARE GARDEN COMPANY
NOTES TO CONSOLIDATED FINANCIAL STATEMENTS
(Continued)
In September 2013, the Company acquired a 50% interest in AMSGE for $125,000. The AMSGE entity owns and operates businesses in the entertainment industry and is currently focused on music management, performance rights, strategic marketing and venue management consulting services. As of the acquisition date the carrying amount of the investment was greater than the Company’s equity in the underlying assets of AMSGE. As such, the Company allocated the difference to goodwill and amortizable intangible assets of $108,220 and $17,350, respectively. The difference attributable to amortizable intangible assets is being amortized on a straight-line basis over the expected useful lives of the intangible assets, which range from 5 to 7 years. In connection with the Company’s investment in AMSGE, the Company provides a $100,000 revolving credit facility to the entity.
In August 2013, the Company acquired an interest in BBLV. In March 2014, BBLV opened a new venue in Las Vegas which brings together live music, bowling and a restaurant. The Company does not manage or otherwise control BBLV but has approval rights over certain decisions. Additionally, the Company agreed to loan up to $2,600 to BBLV. During the second quarter of fiscal year 2015, as a result of BBLV’s liquidity position, the Company evaluated whether or not an impairment of its investment had occurred. This evaluation resulted in the Company recording a pre-tax non-cash impairment charge of $23,600 to write-off the carrying value of its equity investment in BBLV. The impairment charge was based on a comparison of the fair value of the investment, which was determined using a discounted cash flow analysis, to its carrying value.
In March 2014, the Company acquired a 50% interest in Tribeca Enterprises for $22,500. Tribeca Enterprises owns and operates the Tribeca Film Festival and certain other businesses. As of the acquisition date the carrying amount of the investment was greater than the Company’s equity in the underlying assets of Tribeca Enterprises. As such, the Company allocated the difference to indefinite-lived and amortizable intangible assets of $5,750 and $5,350, respectively. The difference attributable to amortizable intangible assets is being amortized straight-line over 10 years, the expected useful life of the intangible asset. In connection with the Company’s investment in Tribeca Enterprises, the Company has provided a $17,500 revolving credit facility to Tribeca Enterprises as of June 30, 2018.
In July 2018, the Company acquired a 30% interest in a display technology company that we plan to utilize for technology for MSG Sphere, for approximately $47,244, which consists of a $42,444 payment at close and a $4,800 deferred payment.
In addition to the investments discussed above, the Company also has other investments in various sports and entertainment companies and related technologies, accounted for either under the cost method or equity method.
The following is summarized financial information for all of the Company’s equity method investments as required by the guidance in SEC Regulation S-X Rule 4-08(g). The amounts shown below represent 100% of these equity method investments’ financial position and results of operations.
Balance Sheet | June 30, 2018 | June 30, 2017 | ||||||
Current assets | $ | 149,054 | $ | 103,319 | ||||
Noncurrent assets | 414,247 | 399,485 | ||||||
$ | 563,301 | $ | 502,804 | |||||
Current liabilities | $ | 116,695 | $ | 116,454 | ||||
Noncurrent liabilities | 384,580 | 399,165 | ||||||
Noncontrolling interests | 54,684 | 59,205 | ||||||
Shareholders’ equity | 7,342 | (72,020 | ) | |||||
$ | 563,301 | $ | 502,804 | |||||
Years Ended June 30, | ||||||||||||
Results of Operations | 2018 | 2017 | 2016 | |||||||||
Revenues | $ | 308,070 | $ | 328,533 | $ | 280,924 | ||||||
Loss from continuing operations | (19,016 | ) | (16,923 | ) | (31,206 | ) | ||||||
Net loss | (19,016 | ) | (16,923 | ) | (31,206 | ) | ||||||
Net loss attributable to controlling interest | (21,845 | ) | (17,399 | ) | (32,006 | ) | ||||||
F- 28
THE MADISON SQUARE GARDEN COMPANY
NOTES TO CONSOLIDATED FINANCIAL STATEMENTS
(Continued)
Note 7. Goodwill and Intangible Assets
The carrying amounts of goodwill, by reportable segment, as of June 30, 2018 and 2017 are as follows:
_________________
June 30, 2018 | June 30, 2017 | |||||||
MSG Entertainment (a) | $ | 165,558 | $ | 161,900 | ||||
MSG Sports (a) | 226,955 | 218,187 | ||||||
$ | 392,513 | $ | 380,087 | |||||
(a) | The net increase in the carrying amounts of goodwill, as compared to June 30, 2017, primarily reflects: (i) purchase price allocations for the CLG and Obscura acquisitions in the MSG Entertainment segment and MSG Sports segment, respectively, and (ii) measurement period adjustments for certain assets and liabilities for the TAO Group acquisition in the MSG Entertainment segment. |
During the first quarter of fiscal year 2018, the Company performed its annual impairment test of goodwill and determined that there were no impairments of goodwill identified for any of its reporting units as of the impairment date.
The Company’s indefinite-lived intangible assets as of June 30, 2018 and 2017 are as follows:
_________________
June 30, 2018 | June 30, 2017 | |||||||
Sports franchises (MSG Sports segment) (a) | $ | 109,429 | $ | 101,429 | ||||
Trademarks (MSG Entertainment segment) | 62,421 | 62,421 | ||||||
Photographic related rights (MSG Sports segment) | 3,000 | 3,000 | ||||||
$ | 174,850 | $ | 166,850 | |||||
(a) | The increase in the carrying amount of indefinite-lived intangible assets in MSG Sports segment reflects a franchise fee associated with CLG’s membership in the “League of Legends” North American League Championship Series. |
During the first quarter of fiscal year 2018, the Company performed its annual impairment test of identifiable indefinite-lived intangible assets and determined that there were no impairments identified.
F- 29
THE MADISON SQUARE GARDEN COMPANY
NOTES TO CONSOLIDATED FINANCIAL STATEMENTS
(Continued)
The Company’s intangible assets subject to amortization are as follows:
June 30, 2018 | Estimated Useful Lives | Gross | Accumulated Amortization | Net | ||||||||||
Trade names (a) | 5 to 25 years | $ | 101,830 | $ | (6,658 | ) | $ | 95,172 | ||||||
Venue management contracts | 12 to 25 years | 79,000 | (5,324 | ) | 73,676 | |||||||||
Favorable lease assets | 1.5 to 16 years | 54,253 | (5,686 | ) | 48,567 | |||||||||
Season ticket holder relationships | 15 years | 50,032 | (44,206 | ) | 5,826 | |||||||||
Non-compete agreements (b) | 5 to 5.75 years | 11,400 | (2,266 | ) | 9,134 | |||||||||
Festival rights (c) | 15 years | 8,080 | (1,078 | ) | 7,002 | |||||||||
Other intangibles (d) | 0.3 to 15 years | 10,064 | (5,635 | ) | 4,429 | |||||||||
$ | 314,659 | $ | (70,853 | ) | $ | 243,806 | ||||||||
June 30, 2017 | Gross | Accumulated Amortization | Net | |||||||||||
Trade names | 98,530 | (1,003 | ) | $ | 97,527 | |||||||||
Venue management contracts | 79,000 | (761 | ) | 78,239 | ||||||||||
Favorable lease assets | 54,253 | (812 | ) | 53,441 | ||||||||||
Season ticket holder relationships | 50,032 | (40,871 | ) | 9,161 | ||||||||||
Non-compete agreements | 9,000 | (261 | ) | 8,739 | ||||||||||
Festival rights | 9,080 | (739 | ) | 8,341 | ||||||||||
Other intangibles | 4,217 | (2,690 | ) | 1,527 | ||||||||||
$ | 304,112 | $ | (47,137 | ) | $ | 256,975 | ||||||||
(a) | The increase in gross carrying amount of trade names, as compared to June 30, 2017, was attributable to the CLG and Obscura acquisitions. The trade names were valued using unobservable inputs within Level III of the fair value hierarchy, utilizing the discounted cash flow models and relief-from-royalty approach with a weighted-average amortization period of approximately 6.5 years. |
(b) | The increase in gross carrying amount of non-compete agreements, as compared to June 30, 2017, was attributable to the CLG acquisition. The non-compete agreement was valued using unobservable inputs within Level III of the fair value hierarchy, utilizing the discounted cash flow models with a weighted-average amortization period of approximately 5 years. |
(c) | The decrease in gross carrying value of festival rights, as compared to June 30, 2017, was attributable to the write-off of a specific intangible asset in connection with a business decision to no longer continue a certain BCE-related festival during the year ended June 30, 2018. |
(d) | The other intangibles, which are attributable to the CLG and Obscura acquisitions, were primarily valued using unobservable inputs within Level III of the fair value hierarchy, utilizing (i) the income approach based on excess earning method or incremental income method and (ii) cost approach based on replacement costs method with a weighted-average amortization period of approximately 3.75 years. |
Amortization expense for intangible assets, excluding the amortization of favorable lease assets of $4,874 and $812 for the years ended June 30, 2018 and 2017, which is reported in rent expense, was $20,194, $7,805, and $6,595 for the years ended June 30, 2018, 2017 and 2016, respectively.
F- 30
THE MADISON SQUARE GARDEN COMPANY
NOTES TO CONSOLIDATED FINANCIAL STATEMENTS
(Continued)
The Company expects its aggregate annual amortization expense for existing intangible assets subject to amortization for each fiscal year from 2019 through 2023 to be as follows:
Fiscal year ending June 30, 2019 | $ | 22,262 | |
Fiscal year ending June 30, 2020 | $ | 20,673 | |
Fiscal year ending June 30, 2021 | $ | 18,139 | |
Fiscal year ending June 30, 2022 | $ | 18,029 | |
Fiscal year ending June 30, 2023 | $ | 15,982 | |
Note 8. Property and Equipment
As of June 30, 2018 and 2017, property and equipment consisted of the following assets:
June 30, 2018 | June 30, 2017 | Estimated Useful Lives | ||||||||
Land | $ | 175,731 | $ | 91,678 | ||||||
Buildings | 1,118,526 | 1,110,366 | Up to 45 years | |||||||
Equipment | 316,705 | 292,935 | 1 to 20 years | |||||||
Aircraft | 38,090 | 38,090 | 20 years | |||||||
Furniture and fixtures | 52,293 | 49,622 | 1 to 10 years | |||||||
Leasehold improvements | 180,952 | 176,786 | Shorter of term of lease or life of improvement | |||||||
Construction in progress | 84,731 | 22,880 | ||||||||
1,967,028 | 1,782,357 | |||||||||
Less accumulated depreciation and amortization | (713,357 | ) | (623,086 | ) | ||||||
$ | 1,253,671 | $ | 1,159,271 | |||||||
The increase in gross property and equipment during the year ended June 30, 2018 includes the impact of the purchase of land in London during the second quarter of fiscal year 2018. The purchase price of the land was $79,518 (£60,000), excluding transactional taxes of $20,661 (£15,590). The transactional taxes include a value-added tax of $15,904 (£12,000), which the Company recovered in full during the third quarter of fiscal year 2018.
Depreciation and amortization expense on property and equipment was $102,292, $99,583 and $95,887 for the years ended June 30, 2018, 2017 and 2016, respectively.
F- 31
THE MADISON SQUARE GARDEN COMPANY
NOTES TO CONSOLIDATED FINANCIAL STATEMENTS
(Continued)
Note 9. Commitments and Contingencies
Contractual Obligations and Off Balance Sheet Arrangements
The Company has various long-term noncancelable operating lease agreements, primarily for entertainment venues and office space expiring at various dates through 2038. Certain leases include renewal provisions at the Company’s option and provide for additional rent based on sales. The rent expense associated with such operating leases is recognized on a straight-line basis over the initial lease term. The difference between rent expense and rent paid is recorded as deferred rent. Rent expense including amortization of favorable lease assets and an unfavorable lease liability under these lease agreements totaled $53,591, $39,044 and $35,617 for the years ended June 30, 2018, 2017 and 2016, respectively.
In addition, the Company has certain future cash payments required under contracts entered into by the Company in the normal course of business and outstanding letters of credit.
As of June 30, 2018, future minimum rental payments under leases having noncancelable initial lease terms, other cash payments required under contracts entered into by the Company in the normal course of business in excess of one year and outstanding letters of credit are as follows:
Off-Balance Sheet Commitments | Contractual Obligations reflected on the Balance Sheet (d) | |||||||||||||||||||||||
Operating Leases (a) | Contractual Obligations (b) | Letters of Credits (c) | Total | Total (e) | ||||||||||||||||||||
Fiscal year ending June 30, 2019 | $ | 52,164 | $ | 158,193 | $ | 4,110 | $ | 214,467 | $ | 56,483 | $ | 270,950 | ||||||||||||
Fiscal year ending June 30, 2020 | 50,956 | 136,814 | — | 187,770 | 8,932 | 196,702 | ||||||||||||||||||
Fiscal year ending June 30, 2021 | 50,090 | 63,503 | — | 113,593 | 2,851 | 116,444 | ||||||||||||||||||
Fiscal year ending June 30, 2022 | 50,095 | 22,930 | — | 73,025 | 4,249 | 77,274 | ||||||||||||||||||
Fiscal year ending June 30, 2023 | 46,483 | 3,535 | — | 50,018 | 3,213 | 53,231 | ||||||||||||||||||
Thereafter | 140,881 | 5,846 | — | 146,727 | 12,667 | 159,394 | ||||||||||||||||||
$ | 390,669 | $ | 390,821 | $ | 4,110 | $ | 785,600 | $ | 88,395 | $ | 873,995 | |||||||||||||
_________________
(a) | Include contractually obligated minimum lease payments for operating leases having an initial noncancelable term in excess of one year for the Company’s venues, including the TAO Group venues, CLG facility, and various corporate offices. |
(b) | Consist principally of the MSG Sports segment’s obligations under employment agreements that the Company has with its professional sports teams’ personnel that are generally guaranteed regardless of employee injury or termination. |
(c) | Consist of letters of credit obtained by the Company as collateral for lease agreements. |
(d) | Consist primarily of amounts earned under employment agreements that the Company has with certain of its professional sports teams’ personnel in the MSG Sports segment. |
(e) | Pension obligations have been excluded from the table above as the timing of the future cash payments is uncertain. See Note 12 for information on the future funding requirements under our pension obligations. |
In addition, see Note 6 for information on the revolving credit facilities provided by the Company to AMSGE and Tribeca Enterprises as well as the Company’s investment in a technology company in July 2018.
In connection with the TAO Group and CLG acquisitions, the Company has accrued contingent consideration as part of the purchase price. See Note 10 for further details of the amount recorded in the accompanying consolidated balance sheet as of June 30, 2018. In addition, see Note 11 for the principal repayments required under the senior secured term loan facility.
F- 32
THE MADISON SQUARE GARDEN COMPANY
NOTES TO CONSOLIDATED FINANCIAL STATEMENTS
(Continued)
Under the terms of lease agreements and related guaranties, subsidiaries of the Company have certain operating requirements, with one of these subsidiaries being also required to meet a certain net worth obligation. In the event that these subsidiaries were to fail to meet the required obligations and were unable to avail themselves of the cure options, the landlord could terminate the lease.
The Company and a subsidiary of the Las Vegas Sands Corp. (“Sands”) entered into a 50-year ground lease in Las Vegas pursuant to which the Company has agreed to construct a large-scale venue. The Company has announced plans to construct an MSG Sphere on that site. The ground lease will have no fixed rent; however, if certain return objectives are achieved, Sands will receive 25% of the after-tax cash flow in excess of such objectives.
The Company has the right to increase its equity interest in TAO Group through a call right on the equity of the other TAO Group equityholders after the fifth anniversary of the closing date (January 31, 2022) and prior to such date in certain events. The other TAO Group equityholders have the right to put their equity interests in TAO Group after the fifth anniversary of the closing and, in certain circumstances prior to the fifth anniversary. The put and call prices are at fair market value (or in certain circumstances, subject to a discount). Consideration paid upon exercise of such call right shall be, at MSG’s option, in cash, debt, or MSG Class A Common Stock, subject to certain limitations.
Legal Matters
The Company owns 50% of AMSGE, which in turn owns a majority interest in Global Music Rights, LLC (“GMR”). GMR is primarily a performance rights organization, whose business includes obtaining the right to license the public performance rights of songs composed by leading songwriters. GMR engaged in negotiations with the Radio Music Licensing Committee (“RMLC”), which represents over ten thousand commercial radio stations. On November 18, 2016, RMLC filed a complaint against GMR in the United States District Court for the Eastern District of Pennsylvania alleging that GMR is violating Section 2 of the Sherman Antitrust Act and seeking an injunction, requiring, among other things, that GMR issue radio stations licenses for GMR’s repertory, upon request, at a rate set through a judicial rate-making procedure, that GMR offer “economically viable alternatives to blanket licenses,” and that GMR offer only licenses for songs which are fully controlled by GMR. GMR and RMLC agreed to an interim license arrangement through September 30, 2017, which has been extended through September 30, 2018. GMR has advised the Company that it believes that the RMLC Complaint is without merit and is vigorously defending itself. On January 20, 2017, GMR filed a motion to dismiss or to transfer venue, asserting that the Eastern District of Pennsylvania is not a proper venue for the matter, lacks personal jurisdiction of GMR and that in any event the complaint fails to state a claim. On December 6, 2016, GMR filed a complaint against RMLC in the United States District Court for the Central District of California, alleging that RMLC operates as an illegal cartel that unreasonably restrains trade in violation of Section 1 of the Sherman Antitrust Act and California state law, and seeking an injunction restraining RMLC and its co-conspirators from enforcing or establishing agreements that unreasonably restrict competition for public performance licenses. The judge in the Central District of California denied RMLC’s motion to dismiss GMR’s claim for lack of ripeness and, on the basis that the two cases involve similar facts, stayed the California action in order to assess the status of the Pennsylvania case. On July 21, 2017, RMLC filed a preliminary injunction motion in the United States District Court for the Eastern District of Pennsylvania to extend the duration of the interim licenses which GMR had granted to certain radio stations. The district court determined that the jurisdictional matter should be decided prior to addressing the motion for preliminary injunction and referred the jurisdictional questions to the Magistrate Judge in the United States District Court Eastern District of Pennsylvania. On November 29, 2017, the Magistrate Judge issued a report and recommendation that personal jurisdiction was not appropriate over GMR in the Eastern District of Pennsylvania and recommending the dismissal of RMLC’s action without prejudice. RMLC has filed objections to the Magistrate Judge’s report and recommendation. On May 3, 2018, GMR filed a motion to lift the stay in GMR’s California action on the basis that a continuation of the stay would cause undue prejudice to GMR. On May 14, 2018, RMLC opposed GMR’s motion to lift the stay and, on May 23, 2018, GMR filed a reply in support of its motion to lift the stay. On August 14, 2018, the court denied GMR’s motion to lift the stay.
The Company is a defendant in various other lawsuits. Although the outcome of these other lawsuits cannot be predicted with certainty (including the extent of available insurance, if any), management does not believe that resolution of these other lawsuits will have a material adverse effect on the Company.
F- 33
THE MADISON SQUARE GARDEN COMPANY
NOTES TO CONSOLIDATED FINANCIAL STATEMENTS
(Continued)
Note 10. Fair Value Measurements
The following table presents the Company’s assets that are measured at fair value on a recurring basis, which include cash equivalents, marketable securities and available-for-sale securities:
Fair Value Hierarchy | June 30, | |||||||||
2018 | 2017 | |||||||||
Assets: | ||||||||||
Commercial paper | I | $ | 147,098 | $ | 105,476 | |||||
Money market accounts | I | 151,887 | 102,884 | |||||||
Time deposits | I | 891,923 | 1,007,302 | |||||||
Available-for-sale securities | I | 20,756 | 32,851 | |||||||
Total assets measured at fair value | $ | 1,211,664 | $ | 1,248,513 | ||||||
All assets listed above are classified within Level I of the fair value hierarchy as they are valued using observable inputs that reflect quoted prices for identical assets in active markets. The carrying amount of the Company’s commercial paper, money market accounts and time deposits approximates fair value due to their short-term maturities.
The carrying value and fair value of the Company’s financial instruments reported in the accompanying consolidated balance sheets are as follows:
_________________
June 30, 2018 | June 30, 2017 | |||||||||||||||
Carrying Value | Fair Value | Carrying Value | Fair Value | |||||||||||||
Assets | ||||||||||||||||
Notes receivable, including interest accruals | $ | 4,116 | $ | 4,116 | $ | 2,610 | $ | 2,610 | ||||||||
Available-for-sale securities (a) | 20,756 | 20,756 | 32,851 | 32,851 | ||||||||||||
Liabilities | ||||||||||||||||
Long-term debt, including current portion (b) | 109,313 | 111,588 | 110,000 | 110,091 | ||||||||||||
(a) | Aggregate cost basis for available-for-sale securities, including transaction costs, was $23,222 as of June 30, 2018 and 2017, respectively. The pretax unrealized gain (loss) recorded in accumulated other comprehensive loss was $(2,466) and $9,629 as of June 30, 2018 and 2017, respectively. The fair value of the available-for-sale securities is determined based on quoted market prices in active market at NYSE, which is classified as a Level I input within the fair value hierarchy. |
(b) | On January 31, 2017, TAOIH, TAOG and certain of its subsidiaries entered into a $110,000 senior secured five-year term loan facility. The Company’s long-term debt is classified within Level II of the fair value hierarchy as it is valued using quoted indices of similar securities for which the inputs are readily observable. |
Contingent Consideration Liabilities
In connection with the TAO Group acquisition (see Note 3 for further details), the Company may be required to pay an earn-out of up to approximately $25,500, if certain performance conditions based upon earnings growth are met during the first five years following the transaction. The Company recorded $7,900 as the initial fair value of contingent consideration liabilities as a part of the purchase price. The fair value was estimated using a Monte-Carlo simulation model which included significant unobservable Level III inputs such as projected financial performance over the earn-out period (five years) along with estimates for market volatility and the discount rate applicable to potential cash payouts.
In connection with the CLG acquisition, the Company may be required to make future payments for deferred and contingent consideration up to a total of $9,150 based upon the achievement of certain specified objectives during the three years following the transaction as defined under the membership interest purchase agreement. The Company recorded $6,586 as the initial fair value of deferred and contingent consideration liabilities as part of the preliminary purchase price allocation. The fair values of these deferred and contingent consideration liabilities were estimated using weighted probabilities of achievement for the possible objective and earn-out events and adjusted for a discount rate applicable to the deferred and potential cash payouts.
F- 34
THE MADISON SQUARE GARDEN COMPANY
NOTES TO CONSOLIDATED FINANCIAL STATEMENTS
(Continued)
The following table provides a reconciliation of the deferred and contingent consideration liabilities in connection with the acquisitions discussed above:
Balance as of June 30, 2017 | $ | 7,900 | ||
Purchase price contingent consideration | 6,586 | |||
Contingent consideration payment | (4,000 | ) | ||
Change in fair value of contingent consideration (a) | (2,291 | ) | ||
Balance as of June 30, 2018 | $ | 8,195 | ||
_________________
(a) | The change in fair value of contingent consideration, including accretion, was recorded within Selling, general and administrative expenses in the accompanying consolidated statement of operations for the year ended June 30, 2018. |
Note 11. Credit Facilities
Knicks Revolving Credit Facility
On September 30, 2016, New York Knicks, LLC (“Knicks LLC”), a wholly owned subsidiary of the Company, entered into a credit agreement (the “Knicks Credit Agreement”) with a syndicate of lenders providing for a senior secured revolving credit facility of up to $200,000 with a term of five years (the “Knicks Revolving Credit Facility”) to fund working capital needs and for general corporate purposes. Amounts borrowed may be distributed to the Company except during an event of default.
The Knicks Revolving Credit Facility requires Knicks LLC to comply with a debt service ratio of 1.5:1.0 over a trailing four quarter period. As of June 30, 2018, Knicks LLC was in compliance with this financial covenant.
All borrowings under the Knicks Revolving Credit Facility are subject to the satisfaction of certain customary conditions. Borrowings bear interest at a floating rate, which at the option of Knicks LLC may be either (i) a base rate plus a margin ranging from 0.00% to 0.125% per annum or (ii) LIBOR plus a margin ranging from 1.00% to 1.125% per annum. Knicks LLC is required to pay a commitment fee ranging from 0.20% to 0.25% per annum in respect of the average daily unused commitments under the Knicks Revolving Credit Facility. The Knicks Revolving Credit Facility was undrawn as of June 30, 2018.
All obligations under the Knicks Revolving Credit Facility are secured by a first lien security interest in certain of Knicks LLC’s assets, including, but not limited to, (i) the Knicks LLC’s membership rights in the NBA and (ii) revenues to be paid to the Knicks LLC by the NBA pursuant to certain U.S. national broadcast agreements.
Subject to customary notice and minimum amount conditions, Knicks LLC may voluntarily prepay outstanding loans under the Knicks Revolving Credit Facility at any time, in whole or in part, without premium or penalty (except for customary breakage costs with respect to Eurocurrency loans). Knicks LLC is required to make mandatory prepayments in certain circumstances, including without limitation if the maximum available amount under the Knicks Revolving Credit Facility is greater than 350% of qualified revenues.
In addition to the financial covenant described above, the Knicks Credit Agreement and related security agreements contain certain customary representations and warranties, affirmative covenants and events of default. The Knicks Revolving Credit Facility contains certain restrictions on the ability of Knicks LLC to take certain actions as provided in (and subject to various exceptions and baskets set forth in) the Knicks Revolving Credit Facility, including the following: (i) incurring additional indebtedness and contingent liabilities; (ii) creating liens on certain assets; (iii) making restricted payments during the continuance of an event of default under the Knicks Revolving Credit Facility; (iv) engaging in sale and leaseback transactions; (v) merging or consolidating; and (vi) taking certain actions that would invalidate the secured lenders’ liens on any Knicks LLC’s collateral.
F- 35
THE MADISON SQUARE GARDEN COMPANY
NOTES TO CONSOLIDATED FINANCIAL STATEMENTS
(Continued)
Knicks Unsecured Credit Facility
On September 30, 2016, Knicks LLC entered into an unsecured revolving credit facility with a lender for an initial maximum credit amount of $15,000 and a 364-day term (the “Knicks Unsecured Credit Facility”). Knicks LLC renewed this facility with the lender on the same terms effective as of September 29, 2017. This facility was undrawn as of June 30, 2018 and is expected to be renewed on the same terms prior to expiration.
Rangers Revolving Credit Facility
On January 25, 2017, New York Rangers, LLC (“Rangers LLC”), a wholly owned subsidiary of the Company, entered into a credit agreement (the “Rangers Credit Agreement”) with a syndicate of lenders providing for a senior secured revolving credit facility of up to $150,000 with a term of five years (the “Rangers Revolving Credit Facility”) to fund working capital needs and for general corporate purposes. Amounts borrowed may be distributed to the Company except during an event of default.
The Rangers Revolving Credit Facility requires Rangers LLC to comply with a debt service ratio of 1.5:1.0 over a trailing four quarter period. As of June 30, 2018, Rangers LLC was in compliance with this financial covenant. All borrowings under the Rangers Revolving Credit Facility are subject to the satisfaction of certain customary conditions.
Borrowings bear interest at a floating rate, which at the option of Rangers LLC may be either (i) a base rate plus a margin ranging from 0.125% to 0.50% per annum or (ii) LIBOR plus a margin ranging from 1.125% to 1.50% per annum. Rangers LLC is required to pay a commitment fee ranging from 0.375% to 0.625% per annum in respect of the average daily unused commitments under the Rangers Revolving Credit Facility. The Rangers Revolving Credit Facility was undrawn as of June 30, 2018.
All obligations under the Rangers Revolving Credit Facility are secured by a first lien security interest in certain of Rangers LLC’s assets, including, but not limited to, (i) Rangers LLC’s membership rights in the NHL, (ii) revenues to be paid to Rangers LLC by the NHL pursuant to certain U.S. and Canadian national broadcast agreements, and (iii) revenues to be paid to Rangers LLC pursuant to local media contracts.
Subject to customary notice and minimum amount conditions, Rangers LLC may voluntarily prepay outstanding loans under the Rangers Revolving Credit Facility at any time, in whole or in part, without premium or penalty (except for customary breakage costs with respect to Eurocurrency loans). Rangers LLC is required to make mandatory prepayments in certain circumstances, including without limitation if qualified revenues are less than 17% of the maximum available amount under the Rangers Revolving Credit Facility.
In addition to the financial covenant described above, the Rangers Credit Agreement and related security agreements contain certain customary representations and warranties, affirmative covenants and events of default. The Rangers Revolving Credit Facility contains certain restrictions on the ability of Rangers LLC to take certain actions as provided in (and subject to various exceptions and baskets set forth in) the Rangers Revolving Credit Facility, including the following: (i) incurring additional indebtedness and contingent liabilities; (ii) creating liens on certain assets; (iii) making restricted payments during the continuance of an event of default under the Rangers Revolving Credit Facility; (iv) engaging in sale and leaseback transactions; (v) merging or consolidating; and (vi) taking certain actions that would invalidate the secured lenders’ liens on any of Rangers LLC’s assets securing the obligations under the Rangers Revolving Credit Facility.
TAO Credit Facilities
On January 31, 2017, TAOIH, TAOG , and certain of its subsidiaries entered into a credit and guaranty agreement with a syndicate of lenders providing for a senior secured term loan facility of $110,000 with a term of five years (the “TAO Term Loan Facility”) to fund, in part, the acquisition of TAO Group and a senior secured revolving credit facility of up to $12,000 with a term of five years (the “TAO Revolving Credit Facility,” and together with the TAO Term Loan Facility, the “TAO Credit Facilities”) for working capital and general corporate purposes of TAOG. The TAO Credit Facilities were obtained without recourse to MSG or any of its affiliates (other than TAOIH and its subsidiaries).
F- 36
THE MADISON SQUARE GARDEN COMPANY
NOTES TO CONSOLIDATED FINANCIAL STATEMENTS
(Continued)
The TAO Credit Facilities require TAOIH (i) to maintain, for the relevant TAO entities, a minimum consolidated liquidity of $5,000 at all times, (ii) to comply with a maximum total net leverage ratio of 4.00:1.00 initially and stepping down over time to 2.50:1.00 by the first quarter of calendar year 2021 and through the remainder of the term of the TAO Credit Facilities, and (iii) to comply with a minimum fixed charge coverage ratio of 1.50:1.00 initially and stepping down over time to 1.15:1.00 by the second quarter of calendar year 2021 and through the remainder of the term of the TAO Credit Facilities., TAOIH was in compliance with the financial covenants of the TAO Credit Facilities as of April 1, 2018 (the most recent date at which compliance was assessed under the TAO Credit Facilities). The TAO Revolving Credit Facility was undrawn as of June 30, 2018.
The TAO entities under the TAO Credit Facilities are also subject to certain limitations with respect to making capital expenditures based upon the total net leverage ratio and other factors. The restrictions on capital expenditures are subject to certain “carry-forward” provisions and other customary carve-outs.
All borrowings under the TAO Credit Facilities are subject to the satisfaction of certain customary conditions, including compliance with a maximum leverage multiple, accuracy of representations and warranties and absence of a default or event of default. Borrowings bear interest at a floating rate, which at the option of TAOG may be either (i) a base rate plus a margin ranging from 6.50% to 7.00% per annum or (ii) LIBOR plus a margin ranging from 7.50% to 8.00% per annum. The interest rate on the TAO Credit Facilities as of April 1, 2018 was 9.9375%. TAOG is required to pay a commitment fee of 0.50% per annum in respect of the average daily unused commitments under the TAO Revolving Credit Facility. During the years ended June 30, 2018 and 2017, the Company made interest payments under the TAO Term Loan Facility of $11,278 and $770, respectively.
All obligations under the TAO Credit Facilities are secured by a first lien security interest in substantially all of the applicable TAO entities’ assets, including, but not limited to, a pledge of all of the capital stock of substantially all of TAOIH’s wholly-owned domestic subsidiaries and 65% of the voting capital stock, and 100% of the non-voting capital stock, of each of its first-tier foreign subsidiaries.
Subject to customary notice and minimum amount conditions, TAOG may voluntarily prepay outstanding loans under the TAO Credit Facilities at any time, in whole or in part (subject to customary breakage costs with respect to LIBOR loans) with premiums due in respect of prepayments of the TAO Term Loan Facility or permanent reduction under the TAO Revolving Credit Facility, in each case, starting at 5.0% initially and stepping down to 0% after three years. Beginning March 31, 2018, TAOG is required to make scheduled amortization payments under the TAO Term Loan Facility in consecutive quarterly installments equal to $688 per quarter initially, stepping up over time to $4,125 per quarter by March 31, 2021 and through the final maturity date of the TAO Term Loan Facility with the final balance payable on such maturity date. TAOG is also required to make mandatory prepayments under the TAO Credit Facilities in certain circumstances, including, without limitation, 75% of excess cash flow, with a step-down to 50% when the total net leverage ratio is less than 2.00:1.00.
The TAO Credit Facilities contain certain restrictions on the ability of TAOG to take certain actions as provided in (and subject to various exceptions and baskets set forth in) the TAO Credit Facilities, including, without limitation, the following: (i) incurring additional indebtedness; (ii) creating liens on assets; (iii) making distributions, dividends and other restricted payments; (iv) engaging in sale and leaseback transactions; (v) merging or consolidating; (vi) making investments; and (vii) prepaying certain indebtedness.
F- 37
THE MADISON SQUARE GARDEN COMPANY
NOTES TO CONSOLIDATED FINANCIAL STATEMENTS
(Continued)
Long-term debt maturities over the next five years for the TAO Term Loan Facility (a) are:
_________________
Fiscal year ending June 30, 2019 | $ | 5,304 | |
Fiscal year ending June 30, 2020 | 2,063 | ||
Fiscal year ending June 30, 2021 | 11,000 | ||
Fiscal year ending June 30, 2022 | 90,946 | ||
Fiscal year ending June 30, 2023 | — | ||
Thereafter | — | ||
(a) | With respect to the balances from TAO Term Loan Facility above, the Company reports the maturities on a three-month lag basis consistent with the Company's consolidation policy. See Business Combinations and Noncontrolling Interests section under Note 2. Summary of Significant Accounting Policies for further discussion on consolidation of TAO Group. |
Deferred Financing Costs
The following table summarizes the presentation of the TAO Term Loan Facility and the related deferred financing costs in the accompanying consolidated balance sheets as of June 30, 2018 and 2017.
June 30, 2018 | ||||||||||||
TAO Term Loan Facility | Deferred Financing Costs (a) | Total | ||||||||||
Current portion of long-term debt, net of deferred financing costs | $ | 5,304 | $ | (939 | ) | $ | 4,365 | |||||
Long-term debt, net of deferred financing costs | 104,009 | (2,674 | ) | 101,335 | ||||||||
Total | $ | 109,313 | $ | (3,613 | ) | $ | 105,700 | |||||
June 30, 2017 | ||||||||||||
TAO Term Loan Facility | Deferred Financing Costs (a) | Total | ||||||||||
Long-term debt, net of deferred financing costs | $ | 110,000 | $ | (4,567 | ) | $ | 105,433 | |||||
_________________
(a) | With respect to the TAO Term Loan Facility, the deferred financing costs are amortized on a straight-line basis over the five-year term of the facility, which approximates the effective interest method. |
The following table summarizes deferred financing costs, net of amortization, related to the Knicks Revolving Credit Facility, Knicks Unsecured Credit Facility, Rangers Revolving Credit Facility, and TAO Revolving Credit Facility as reported on the accompanying consolidated balance sheet:
June 30, 2018 | June 30, 2017 | |||||||
Other current assets | $ | 778 | $ | 806 | ||||
Other assets | 1,906 | 2,784 | ||||||
F- 38
THE MADISON SQUARE GARDEN COMPANY
NOTES TO CONSOLIDATED FINANCIAL STATEMENTS
(Continued)
Note 12. Pension Plans and Other Postretirement Benefit Plan
Defined Benefit Pension Plans and Postretirement Benefit Plans
Pre-Distribution
Prior to the Distribution, MSG Networks sponsored a non-contributory, qualified cash balance retirement plan covering its non-union employees (the “Cash Balance Pension Plan”) and an unfunded non-contributory, non-qualified excess cash balance plan covering certain employees who participate in the underlying qualified plan (collectively, the “Cash Balance Plans”). Since March 1, 2011, the Cash Balance Pension Plan has also included the assets and liabilities of a frozen (as of December 31, 2007) non-contributory qualified defined benefit pension plan covering non-union employees hired prior to January 1, 2001. These plans had participants from each of MSG Networks’ historical businesses (Media, Sports and Entertainment) as well as corporate employees.
Also, MSG Networks historically sponsored an unfunded non-contributory, non-qualified defined benefit pension plan for the benefit of certain employees who participate in an underlying qualified plan which was merged into the Cash Balance Pension Plan on March 1, 2011 (the “Excess Plan”). As of December 31, 2007, the Excess Plan was amended to freeze all benefits earned through December 31, 2007 and to eliminate the ability of participants to earn benefits for future service under these plans.
The Cash Balance Plans have been amended to freeze participation and future benefit accruals effective December 31, 2015 for all employees. Therefore, after December 31, 2015, no employee of the Company who was not already a participant may become a participant in the plans and no further annual pay credits will be made for any future year. Existing account balances under the plans will continue to be credited with monthly interest in accordance with the terms of the plans.
In addition, MSG Networks sponsored a non-contributory, qualified defined benefit pension plan covering certain of its union employees (the “Union Plan”). Benefits payable to retirees under the Union Plan are based upon years of Benefit Service (as defined in the Union Plan document) and this plan is specific to employees of the businesses constituting Madison Square Garden.
The Cash Balance Plans, Union Plan, and Excess Plan are collectively referred to as the “Pension Plans.”
MSG Networks also sponsored a contributory welfare plan which provides certain postretirement healthcare benefits to certain employees hired prior to January 1, 2001 who are eligible to commence receipt of early or normal benefits under the Cash Balance Pension Plan and their dependents, as well as certain union employees (“Postretirement Plan”).
For purposes of the combined financial statements issued prior to the Distribution, it was determined that the Company was to be treated as the obligor for the Pension Plans’ and Postretirement Plan’s liabilities. Therefore, the consolidated financial statements reflect the full impact of such plans on the financial information for the three months ended September 30, 2015 that is included in the results of operations for the year ended June 30, 2016. The pension expense related to employees of MSG Networks participating in any of these plans during this period was reflected as a contributory charge from the Company to MSG Networks, resulting in a decrease to the expense recognized in the consolidated statements of operations.
Post-Distribution
As of the Distribution date, the Company and MSG Networks entered into an employee matters agreement (the “Employee Matters Agreement”) which determined each company’s obligations after the Distribution with regard to liabilities historically under the former MSG Networks’ Pension Plans and Postretirement Plan. Under the Employee Matters Agreement, the Company assumed or retained certain of the Pension Plans and the Postretirement Plan previously sponsored by MSG Networks, as discussed in further detail in “Certain Relationships and Related Party Transactions — Relationship Between MSG and Us After the Distribution — Employee Matters Agreement” in the Company’s Information Statement filed as Exhibit 99.1 to Amendment No. 6 to the registration statement on Form 10 filed with the SEC on September 11, 2015.
F- 39
THE MADISON SQUARE GARDEN COMPANY
NOTES TO CONSOLIDATED FINANCIAL STATEMENTS
(Continued)
The following table summarizes the projected benefit obligations, assets, funded status and the amounts recorded on the Company’s consolidated balance sheets as of June 30, 2018 and 2017, associated with the Pension Plans and Postretirement Plan based upon actuarial valuations as of those measurement dates.
Pension Plans | Postretirement Plan | ||||||||||||||
June 30, | June 30, | ||||||||||||||
2018 | 2017 | 2018 | 2017 | ||||||||||||
Change in benefit obligation: | |||||||||||||||
Benefit obligation at beginning of period | $ | 166,003 | $ | 173,585 | $ | 5,734 | $ | 6,224 | |||||||
Service cost | 85 | 85 | 120 | 122 | |||||||||||
Interest cost | 5,231 | 4,956 | 215 | 156 | |||||||||||
Actuarial loss (gain) | (3,153 | ) | (6,820 | ) | 1,436 | (589 | ) | ||||||||
Benefits paid | (6,424 | ) | (5,803 | ) | (755 | ) | (179 | ) | |||||||
Plan settlements paid | (506 | ) | — | — | — | ||||||||||
Benefit obligation at end of period | 161,236 | 166,003 | 6,750 | 5,734 | |||||||||||
Change in plan assets: | |||||||||||||||
Fair value of plan assets at beginning of period | 114,722 | 110,261 | — | — | |||||||||||
Actual return on plan assets | (2,498 | ) | (999 | ) | — | — | |||||||||
Employer contributions | 9,760 | 11,263 | — | — | |||||||||||
Benefits paid | (6,424 | ) | (5,803 | ) | — | — | |||||||||
Plan settlements paid | (506 | ) | — | — | — | ||||||||||
Fair value of plan assets at end of period | 115,054 | 114,722 | — | — | |||||||||||
Funded status at end of period | $ | (46,182 | ) | $ | (51,281 | ) | $ | (6,750 | ) | $ | (5,734 | ) | |||
Amounts recognized in the consolidated balance sheets as of June 30, 2018 and 2017 consist of:
Pension Plans | Postretirement Plan | ||||||||||||||
June 30, | June 30, | ||||||||||||||
2018 | 2017 | 2018 | 2017 | ||||||||||||
Current liabilities (included in accrued employee related costs) | $ | (3,319 | ) | $ | (3,818 | ) | $ | (373 | ) | $ | (200 | ) | |||
Non-current liabilities (included in defined benefit and other postretirement obligations) | (42,863 | ) | (47,463 | ) | (6,377 | ) | (5,534 | ) | |||||||
$ | (46,182 | ) | $ | (51,281 | ) | $ | (6,750 | ) | $ | (5,734 | ) | ||||
Accumulated other comprehensive income (loss), before income tax, as of June 30, 2018 and 2017 consists of the following amounts that have not yet been recognized in net periodic benefit cost:
Pension Plans | Postretirement Plan | ||||||||||||||
June 30, | June 30, | ||||||||||||||
2018 | 2017 | 2018 | 2017 | ||||||||||||
Actuarial gain (loss) | $ | (37,989 | ) | $ | (37,317 | ) | $ | (1,331 | ) | $ | 6 | ||||
Prior service credit | — | — | 7 | 44 | |||||||||||
$ | (37,989 | ) | $ | (37,317 | ) | $ | (1,324 | ) | $ | 50 | |||||
F- 40
THE MADISON SQUARE GARDEN COMPANY
NOTES TO CONSOLIDATED FINANCIAL STATEMENTS
(Continued)
Components of net periodic benefit cost for the Pension Plans and Postretirement Plan recognized in direct operating and selling, general and administrative expenses in the accompanying consolidated statements of operations for the years ended June 30, 2018, 2017 and 2016 are as follows:
Pension Plans | Postretirement Plan | |||||||||||||||||||||||
Years Ended June 30, | Years Ended June 30, | |||||||||||||||||||||||
2018 | 2017 | 2016 | 2018 | 2017 | 2016 | |||||||||||||||||||
Service cost | $ | 85 | $ | 85 | $ | 3,054 | $ | 120 | $ | 122 | $ | 137 | ||||||||||||
Interest cost | 5,231 | 4,956 | 6,986 | 215 | 156 | 253 | ||||||||||||||||||
Expected return on plan assets | (2,634 | ) | (2,383 | ) | (2,960 | ) | — | — | — | |||||||||||||||
Recognized actuarial loss | 1,219 | 1,365 | 1,039 | 100 | — | — | ||||||||||||||||||
Amortization of unrecognized prior service cost (credit) | — | — | 14 | (37 | ) | (48 | ) | (106 | ) | |||||||||||||||
Settlement loss recognized (a) | 87 | — | — | — | — | — | ||||||||||||||||||
Net periodic benefit cost | $ | 3,988 | $ | 4,023 | $ | 8,133 | $ | 398 | $ | 230 | $ | 284 | ||||||||||||
_________________
(a) | For the year ended June 30, 2018, lump-sum payments totaling $506 were distributed to vested participants of the non-qualified excess cash balance plan, triggering the recognition of a settlement loss in accordance with ASC Topic 715. Due to this pension settlement, the Company was required to remeasure its pension plan liability as of March 31, 2018. Discount rates used for the projected benefit obligation and interest cost were 3.53% and 2.16% as of March 31, 2018, respectively. Additionally, a settlement charge of $87 was recognized in direct operating and selling, general and administrative expenses for the year ended June 30, 2018. |
The net periodic benefit cost for the Pension Plans and the Postretirement Plan reported in the table above includes $520 and $18, respectively, of expenses related to MSG Networks employees. This represents the contributory charges from the Company to MSG Networks for participation in the Pension Plans and the Postretirement Plan during the year ended June 30, 2016. In addition, during the year ended June 30, 2016 the Company allocated to MSG Networks $229 and $11 of net periodic benefit cost for the Pension Plans and the Postretirement Plan, respectively, related to corporate employees not specifically identified to either the Company or MSG Networks.
Other pre-tax changes in plan assets and benefit obligations recognized in other comprehensive income (loss) for the years ended June 30, 2018, 2017 and 2016 are as follows:
Pension Plans | Postretirement Plan | ||||||||||||||||||||||
Years Ended June 30, | Years Ended June 30, | ||||||||||||||||||||||
2018 | 2017 | 2016 | 2018 | 2017 | 2016 | ||||||||||||||||||
Actuarial gain (loss), net | $ | (1,978 | ) | $ | 3,438 | $ | (8,532 | ) | $ | (1,437 | ) | $ | 589 | $ | (707 | ) | |||||||
Recognized actuarial loss | 1,219 | 1,365 | 1,039 | 100 | — | — | |||||||||||||||||
Recognized prior service (credit) cost | — | — | 14 | (37 | ) | (48 | ) | (106 | ) | ||||||||||||||
Settlement loss recognized | 87 | — | — | — | — | — | |||||||||||||||||
Total recognized in other comprehensive income (loss) | $ | (672 | ) | $ | 4,803 | $ | (7,479 | ) | $ | (1,374 | ) | $ | 541 | $ | (813 | ) | |||||||
The estimated net loss for the Pension Plans and Postretirement Plan expected to be amortized from accumulated other comprehensive income (loss) and recognized as a component of net periodic benefit cost over the next fiscal year is $1,268 and $114, respectively. The estimated prior service credit for the Postretirement Plan expected to be amortized from accumulated other comprehensive income (loss) into net periodic benefit credit over the next fiscal year is $7.
F- 41
THE MADISON SQUARE GARDEN COMPANY
NOTES TO CONSOLIDATED FINANCIAL STATEMENTS
(Continued)
Funded Status
The accumulated benefit obligation for the Pension Plans aggregated to $161,236 and $166,003 at June 30, 2018 and 2017, respectively. As of June 30, 2018 and 2017 each of the Pension Plans had accumulated benefit obligations and projected benefit obligations in excess of plan assets.
Pension Plans and Postretirement Plan Assumptions
Weighted-average assumptions used to determine benefit obligations (made at the end of the period) as of June 30, 2018 and 2017 are as follows:
Pension Plans | Postretirement Plan | ||||||||||
June 30, | June 30, | ||||||||||
2018 | 2017 | 2018 | 2017 | ||||||||
Discount rate | 4.19 | % | 3.81 | % | 4.06 | % | 3.54 | % | |||
Healthcare cost trend rate assumed for next year | n/a | n/a | 7.00 | % | 7.25 | % | |||||
Rate to which the cost trend rate is assumed to decline (the ultimate trend rate) | n/a | n/a | 5.00 | % | 5.00 | % | |||||
Year that the rate reaches the ultimate trend rate | n/a | n/a | 2027 | 2027 | |||||||
Weighted-average assumptions used to determine net periodic benefit cost (made at the beginning of the period) for the years ended June 30, 2018, 2017 and 2016 are as follows:
_________________
Pension Plans | Postretirement Plan | ||||||||||||||||
Years Ended June 30, | Years Ended June 30, | ||||||||||||||||
2018 | 2017 | 2016 | 2018 | 2017 | 2016 | ||||||||||||
Discount rate | n/a | n/a | 4.46 | % | n/a | n/a | 4.05 | % | |||||||||
Discount rate - projected benefit obligation (a) | 3.81 | % | 3.61 | % | n/a | 3.54 | % | 3.27 | % | n/a | |||||||
Discount rate - service cost (a) | 3.93 | % | 3.74 | % | n/a | 3.83 | % | 3.53 | % | n/a | |||||||
Discount rate - interest cost (a) | 3.32 | % | 2.99 | % | n/a | 3.05 | % | 2.72 | % | n/a | |||||||
Expected long-term return on plan assets | 3.46 | % | 3.38 | % | 4.06 | % | n/a | n/a | n/a | ||||||||
Healthcare cost trend rate assumed for next year | n/a | n/a | n/a | 7.25 | % | 7.25 | % | 7.25 | % | ||||||||
Rate to which the cost trend rate is assumed to decline (the ultimate trend rate) | n/a | n/a | n/a | 5.00 | % | 5.00 | % | 5.00 | % | ||||||||
Year that the rate reaches the ultimate trend rate | n/a | n/a | n/a | 2027 | 2026 | 2021 | |||||||||||
(a) | Effective July 1, 2016, the Company changed the approach used to measure service and interest cost components of net periodic benefit costs for Pension Plans and Postretirement Plan. Previously, the Company measured service and interest costs utilizing a single weighted-average discount rate derived from the yield curve used to measure the plans’ obligations. Beginning fiscal year 2017, the Company elected to measure service and interest costs by applying the specific spot rates along that yield curve to the plans’ liability cash flows (“Spot Rate Approach”). The Company believes the Spot Rate Approach provides a more accurate measurement of service and interest costs by improving the correlation between projected benefit cash flows and their corresponding spot rates on the yield curve. This change did not affect the measurement of the plans’ obligations and it was accounted for as a change in accounting estimate, which was applied prospectively. |
F- 42
THE MADISON SQUARE GARDEN COMPANY
NOTES TO CONSOLIDATED FINANCIAL STATEMENTS
(Continued)
The discount rates were determined (based on the expected duration of the benefit payments for the plans) from the Willis Towers Watson U.S. Rate Link: 40-90 Discount Rate Model as of June 30, 2018 and 2017 to select a rate at which the Company believed the plans’ benefits could be effectively settled. This model was developed by examining the yields on selected highly rated corporate bonds. The expected long-term return on plan assets is based on a periodic review and modeling of the plans’ asset allocation structures over a long-term horizon. Expectations of returns for each asset class are the most important of the assumptions used in the review and modeling and are based on comprehensive reviews of historical data, forward-looking economic outlook, and economic/financial market theory. The expected long-term rate of return was selected from within the reasonable range of rates determined by (a) historical real returns, net of inflation, for the asset classes covered by the investment policy and (b) projections of inflation over the long-term period during which benefits are payable to plan participants.
Assumed healthcare cost trend rates are a key assumption used for the amounts reported for the Postretirement Plan. A one percentage point change in assumed healthcare cost trend rates would have the following effects:
Increase (Decrease) in Total of Service and Interest Cost Components for the | Increase (Decrease) in Benefit Obligation at | ||||||||||||||||||
Years Ended June 30, | June 30, | ||||||||||||||||||
2018 | 2017 | 2016 | 2018 | 2017 | |||||||||||||||
One percentage point increase | $ | 37 | $ | 34 | $ | 29 | $ | 597 | $ | 578 | |||||||||
One percentage point decrease | (33 | ) | (30 | ) | (27 | ) | (537 | ) | (155 | ) | |||||||||
Plan Assets and Investment Policy
The weighted-average asset allocation of the Pension Plans’ assets at June 30, 2018 and 2017 was as follows:
_____________________
June 30, | |||||
Asset Classes (a): | 2018 | 2017 | |||
Fixed income securities | 81 | % | 83 | % | |
Cash equivalents | 19 | % | 17 | % | |
100 | % | 100 | % | ||
(a) | The Company’s target allocation for pension plan assets is 80% fixed income securities and 20% cash equivalents as of June 30, 2018. |
Prior to the Distribution, investment allocation decisions were made by MSG Networks’ Investment and Benefits Committee. After the Distribution, investment allocation decisions have been made by the Company’s Investment and Benefits Committee, which considers investment advice provided by the Company’s external investment consultant. The investment consultant takes into account expected long-term risks, returns, correlation, and other prudent investment assumptions when recommending asset classes and investment managers to the Company’s Investment and Benefits Committee. The investment consultant also considers the pension plans’ liabilities when making investment allocation recommendations. The Company's Investment and Benefits Committee's decisions are influenced by asset/liability studies conducted by the external investment consultant who combines actuarial considerations and strategic investment advice. The major investment categories of the pension plan assets are in cash equivalents and long duration fixed income securities that are marked-to-market on a daily basis. As a result, the pension plan assets are subjected to interest-rate risk, specifically to a rising interest rate environment, as the majority of the pension plan assets are invested in long duration fixed income securities. However, the pension plan assets are structured in an asset/liability framework, and consequently, an increase in interest rates would cause a corresponding decrease to the overall liability of the pension plans, thus creating a hedge against rising interest rates. Additional risks involving the asset/liability framework include earning insufficient investment returns to cover future pension plan liabilities and imperfect hedging of such liabilities. In addition, a portion of the long duration fixed income securities portfolio is invested in non-government securities that are subject to credit risk of the issuers who might default on interest and/or principal payments.
F- 43
THE MADISON SQUARE GARDEN COMPANY
NOTES TO CONSOLIDATED FINANCIAL STATEMENTS
(Continued)
Investments at Estimated Fair Value
The cumulative fair values of the individual plan assets at June 30, 2018 and 2017 by asset class are as follows:
Fair Value Hierarchy | June 30, | |||||||||
2018 | 2017 | |||||||||
Fixed income securities: | ||||||||||
U.S. Treasury Securities | I | $ | 20,130 | $ | 21,852 | |||||
U.S. corporate bonds | II | 61,381 | 62,295 | |||||||
Foreign issued corporate bonds | II | 11,055 | 10,979 | |||||||
Municipal bonds | II | 353 | 217 | |||||||
Money market accounts | I | 22,135 | 19,379 | |||||||
Total investments measured at fair value | $ | 115,054 | $ | 114,722 | ||||||
Contributions for Qualified Defined Benefit Pension Plans
During the year ended June 30, 2018, the Company contributed $9,000 to the Cash Balance Pension Plan and $250 to the Union Plan. The Company expects to contribute $11,000 and $225 to the Cash Balance Pension Plan and Union Plan, respectively, in fiscal year 2019.
Estimated Future Benefit Payments
The following table presents estimated future fiscal year benefit payments for the Pension Plans and Postretirement Plan:
Pension Plans | Postretirement Plan | ||||||
Fiscal year ending June 30, 2019 | $ | 17,220 | $ | 380 | |||
Fiscal year ending June 30, 2020 | 8,340 | 448 | |||||
Fiscal year ending June 30, 2021 | 7,420 | 496 | |||||
Fiscal year ending June 30, 2022 | 7,390 | 538 | |||||
Fiscal year ending June 30, 2023 | 7,820 | 589 | |||||
Fiscal years ending June 30, 2024 – 2028 | 41,700 | 3,152 | |||||
Defined Contribution Pension Plans
Prior to the Distribution, MSG Networks sponsored the MSG Holdings, L.P. 401(k) Savings Plan (renamed The Madison Square Garden 401(k) Savings Plan) and the MSG Holdings, L.P. Excess Savings Plan. In connection with the Distribution, The Madison Square Garden 401(k) Savings Plan was converted into a multiple employer plan and, pursuant to the Employee Matters Agreement, the Company became the sponsor and a contributing employer to this plan. Additionally, the Company established the MSG S&E, LLC Excess Savings Plan (collectively with the MSG 401(k) Savings Plan, the “Savings Plans”), assuming the liabilities from the MSG Holdings, L.P. Excess Savings Plan relating to the Company’s employees.
For the years ended June 30, 2018, 2017 and 2016, expenses related to the Savings Plans, excluding expenses related to MSG Networks’ employees, included in the accompanying consolidated statements of operations were $8,571, $8,374 and $4,191, respectively. These amounts include $89 of expenses related to the Company’s corporate employees which were allocated to MSG Networks for the year ended June 30, 2016.
In addition, prior to the Distribution, MSG Networks sponsored the MSG Holdings, L.P. 401(k) Union Plan (renamed The Madison Square Garden 401(k) Union Plan, the “Union Savings Plan”). In connection with the Distribution, the Union Savings Plan was converted into a multiple employer plan and, pursuant to the Employee Matters Agreement, the Company became the sponsor and a contributing employer to this plan. For the years ended June 30, 2018, 2017 and 2016, expenses related to the Union Savings Plan included in the accompanying consolidated statements of operations were $533, $646 and $676, respectively.
F- 44
THE MADISON SQUARE GARDEN COMPANY
NOTES TO CONSOLIDATED FINANCIAL STATEMENTS
(Continued)
Multiemployer Plans
The Company contributes to a number of multiemployer defined benefit pension plans, multiemployer defined contribution pension plans, and multiemployer health and welfare plans that provide benefits to retired union-represented employees under the terms of CBAs.
Multiemployer Defined Benefit Pension Plans
The multiemployer defined benefit pension plans to which the Company contributes generally provide for retirement and death benefits for eligible union-represented employees based on specific eligibility/participant requirements, vesting periods and benefit formulas. The risks to the Company of participating in these multiemployer defined benefit pension plans are different from single-employer defined benefit pension plans in the following aspects:
• | Assets contributed to a multiemployer defined benefit pension plan by one employer may be used to provide benefits to employees of other participating employers. |
• | If a participating employer stops contributing to a multiemployer defined benefit pension plan, the unfunded obligations of the plan may be borne by the remaining participating employers. |
• | If the Company chooses to stop participating in some of these multiemployer defined benefit pension plans, the Company may be required to pay those plans an amount based on the Company’s proportion of the underfunded status of the plan, referred to as a withdrawal liability. However, cessation of participation in a multiemployer defined benefit pension plan and subsequent payment of any withdrawal liability is subject to the collective bargaining process. |
The following table outlines the Company’s participation in multiemployer defined benefit pension plans for the years ended June 30, 2018, 2017 and 2016, and summarizes the contributions that the Company has made during each period. The “EIN” and “Pension Plan Number” columns provide the Employer Identification Number and the three-digit plan number for each applicable plan. The most recent Pension Protection Act zone status available as of June 30, 2018 and 2017 relates to the plan’s two most recent years ended which are indicated. Among other factors, plans in the red zone are generally less than 65% funded, plans in the orange zone are both less than 80% funded and have an accumulated funding deficiency or are expected to have a deficiency in any of the next six plan years, plans in the yellow zone are less than 80% funded, and plans in the green zone are at least 80% funded. The “FIP/RP Status Pending/Implemented” column indicates whether a funding improvement plan (“FIP”) for yellow/orange zone plans or a rehabilitation plan (“RP”) for red zone plans is either pending or has been implemented by the trustees of such plan. The zone status and any FIP or RP information is based on information that the Company received from the plan, and the zone status is as certified by the plan’s actuary. The last column lists the expiration date(s) or a range of expiration dates of the CBA to which the plans are subject. There are no other significant changes that affect such comparability.
PPA Zone Status | FIP/RP Status Pending / Implemented | Madison Square Garden Contributions | |||||||||||||||||||||||
As of June 30, | Years Ended June 30, | ||||||||||||||||||||||||
Plan Name | EIN | Pension Plan Number | 2018 | 2017 | 2018 | 2017 | 2016 | Surcharge Imposed | Expiration Date of CBA | ||||||||||||||||
National Basketball Association Players’ Pension Plan | 13-5582586 | 003 | Yellow as of 2/1/2017 | Yellow as of 2/1/2016 | Implemented | $ | 1,932 | $ | 1,830 | $ | 1,814 | No | 6/2024 (with certain termination rights becoming effective 6/2023) | ||||||||||||
Pension Fund of Local No. 1 of I.A.T.S.E. | 13-6414973 | 001 | Green as of 12/31/2016 | Green as of 12/31/2015 | No | 2,377 | 2,325 | 2,236 | No | 9/30/2018 - 5/1/2023 | |||||||||||||||
National Hockey League Players’ Retirement Benefit Plan | 46-2555356 | 001 | Green as of 4/30/2017 | Green as of 4/30/2016 | No | 1,200 | 1,364 | 1,311 | No | 9/2022 (with certain termination rights becoming effective 9/2020) | |||||||||||||||
All Other Multiemployer Defined Benefit Pension Plans | 3,457 | 3,397 | 3,026 | ||||||||||||||||||||||
$ | 8,966 | $ | 8,916 | $ | 8,387 | ||||||||||||||||||||
F- 45
THE MADISON SQUARE GARDEN COMPANY
NOTES TO CONSOLIDATED FINANCIAL STATEMENTS
(Continued)
The Company was listed in the following plans’ Form 5500’s as providing more than 5 percent of the total contributions for the following plans and plan years:
Fund Name | Year Contributions to Plan Exceeded 5 Percent of Total Contributions (As of Plan’s Year-End) |
Pension Fund of Local No. 1 of I.A.T.S.E | December 31, 2016, 2015 and 2014 |
Pension Fund of Wardrobe Attendants Union Local 764 | December 31, 2016, 2015 and 2014 |
32BJ/Broadway League Pension Fund | December 31, 2016, 2015 and 2014 |
Treasurers and Ticket Sellers Local 751 Pension Fund | August 31, 2017, 2016 and 2015 |
I.A.T.S.E Local No. 33 Pension Trust Fund | December 31, 2016 |
Multiemployer Defined Contribution Pension Plans and Multiemployer Plans That Provide Health and Welfare Benefits
The Company contributed $7,286, $6,838 and $6,225 for the years ended June 30, 2018, 2017 and 2016, respectively, to multiemployer defined contribution pension plans. In addition, the Company contributed $2,746, $1,763 and $1,613 for the years ended June 30, 2018, 2017 and 2016, respectively, to multiemployer plans that provide health and welfare benefits to retired employees.
Note 13. Share-based Compensation
In connection with the Distribution, the Company adopted its 2015 Employee Stock Plan (the “Employee Stock Plan”) and its 2015 Stock Plan for Non-Employee Directors (the “Non-Employee Director Plan”).
Under the Employee Stock Plan, the Company is authorized to grant incentive stock options, non-qualified stock options, restricted shares, restricted stock units (“RSUs”), stock appreciation rights and other equity-based awards. The Company may grant awards for up to 2,650 shares of Madison Square Garden Class A Common Stock (subject to certain adjustments). Options and stock appreciation rights under the Employee Stock Plan must be granted with an exercise price of not less than the fair market value of a share of Madison Square Garden Class A Common Stock on the date of grant and must expire no later than 10 years from the date of grant (or up to one additional year in the case of the death of a holder). The terms and conditions of awards granted under the Employee Stock Plan, including vesting and exercisability, are determined by the Compensation Committee of the Board of Directors (“Compensation Committee”) and may include terms or conditions based upon performance criteria. RSUs that were awarded under the Employee Stock Plan are generally subject to three-year cliff vesting, or vest ratably over three years, with some RSUs being subject to certain performance conditions. RSUs that were awarded by the Company to its employees will settle in shares of the Company’s Class A Common Stock (either from treasury or with newly issued shares), or, at the option of the Compensation Committee, in cash.
Under the Non-Employee Director Plan, the Company is authorized to grant non-qualified stock options, restricted shares, restricted stock units, stock appreciation rights and other equity-based awards. The Company may grant awards for up to 160 shares of Madison Square Garden Class A Common Stock (subject to certain adjustments). Options under the Non-Employee Director Plan must be granted with an exercise price of not less than the fair market value of a share of the Company’s Class A Common Stock on the date of grant and must expire no later than 10 years from the date of grant (or up to one additional year in the case of the death of a holder). The terms and conditions of awards granted under the Non-Employee Director Plan, including vesting and exercisability, are determined by the Compensation Committee. Unless otherwise provided in an applicable award agreement, options granted under this plan will be fully vested and exercisable, and restricted stock units granted under this plan will be fully vested, upon the date of grant and will settle in shares of the Company’s Class A Common Stock (either from treasury or with newly issued shares), or, at the option of the Compensation Committee, in cash, on the first business day after ninety days from the date the director’s service on the Board of Directors ceases or, if earlier, upon the director’s death.
F- 46
THE MADISON SQUARE GARDEN COMPANY
NOTES TO CONSOLIDATED FINANCIAL STATEMENTS
(Continued)
Treatment After the Distribution of Share-based Payment Awards Initially Granted Under MSG Networks Equity Award Programs
Prior to the Distribution, certain Company employees and non-employee directors, as well as employees and non-employee directors of MSG Networks (some of whom are employees or directors of the Company) participated in MSG Networks’ equity award programs (“MSG Networks Stock Plans”). In connection with the Distribution, each holder of MSG Networks stock options at the Distribution date received Company stock options based on the one for three distribution ratio (i.e., one share of the Company’s Class A Common Stock for every three shares of MSG Networks Class A Common Stock). The existing exercise price was allocated between the existing MSG Networks options and the Company’s new options based upon the ten-day volume-weighted average prices of the MSG Networks Class A Common Stock and the Company’s Class A Common Stock, taking into account the one for three distribution ratio. As a result of this adjustment, 25.64% of the pre-Distribution exercise price of options was allocated to the MSG Networks options and 74.36% was allocated to the new Company options. The options with respect to the Company’s Class A Common Stock were issued under the Employee Stock Plan or the Non-Employee Director Plan, as applicable.
In connection with the Distribution, one restricted stock unit of the Company (“MSG RSUs”) was issued in respect of every three MSG Networks’ restricted stock units (“Networks RSUs”) that were granted to employees prior to July 1, 2015 and were outstanding as of the Distribution date.
In addition, all Networks RSUs and MSG Networks performance restricted stock units (“Networks PSUs”) granted to the Company’s employees during the three months ended September 30, 2015 and outstanding as of the Distribution date were converted into MSG RSUs and Company performance restricted stock units (“MSG PSUs”), respectively. Further, all Networks RSUs and Networks PSUs granted during the three months ended September 30, 2015 to employees that were employed by both MSG Networks and the Company following the Distribution were converted such that 70% of the value of such grants became MSG RSUs and MSG PSUs, respectively. All conversions described in this paragraph were calculated based upon the ten-day volume-weighted average price of the Company’s Class A Common Stock through October 14, 2015. The MSG RSUs and MSG PSUs with respect to the Company’s Class A Common Stock were issued under the Employee Stock Plan.
Further, in connection with the Distribution, one share of the Company’s Class A Common Stock was issued in respect of every three Networks RSUs outstanding under MSG Networks’ 2010 Non-Employee Director Plan. These shares were issued under the Non-Employee Director Plan.
As a result of the Distribution, 26, 432 and 95 of the Company’s stock options, RSUs and PSUs, respectively, were issued to holders of MSG Networks equity awards.
Share-based Compensation Expense
Share-based compensation expense is generally recognized straight-line over the vesting term of the award, which typically provides for three-year cliff or graded vesting subject to continued employment. For awards that are graded vesting and subject to performance conditions to satisfy tax deductibility for executive officers, in addition to continued employment, the Company uses the graded-vesting method to recognize share-based compensation expense. For MSG PSUs granted during fiscal year 2016, the Company did not recognize share-based compensation expense during the first quarter of fiscal year 2016 as the performance conditions were not yet determined and therefore there was not a grant date for accounting purposes. On December 18, 2015, the Company’s Compensation Committee approved the conversion of the awards to three-year, time-vested awards. Such awards will cliff-vest on the third anniversary of the original grant date without a performance condition (other than conditions to satisfy tax deductibility for executive officers). As such, the Company began recognizing share-based compensation expense during the second quarter of fiscal year 2016.
F- 47
THE MADISON SQUARE GARDEN COMPANY
NOTES TO CONSOLIDATED FINANCIAL STATEMENTS
(Continued)
Share-based compensation expense was recognized in the consolidated statements of operations as a component of direct operating expenses or selling, general and administrative expenses. The following table presents the share-based compensation expense recorded during the years ended June 30, 2018, 2017 and 2016.
Years Ended June 30, | ||||||||||||
2018 | 2017 | 2016 | ||||||||||
Company RSUs and PSUs | $ | 46,307 | $ | 39,960 | $ | 18,404 | ||||||
Company stock options | 899 | — | — | |||||||||
MSG Networks RSUs | 357 | 1,169 | 6,072 | |||||||||
Total share-based compensation expense | $ | 47,563 | $ | 41,129 | $ | 24,476 | ||||||
As of June 30, 2018, there was $51,627 of unrecognized compensation cost related to unvested RSUs and PSUs held by the Company’s employees. The cost is expected to be recognized over a weighted-average period of approximately 1.8 years for unvested RSUs and PSUs. In addition, the Company had $4,101 of unrecognized compensation cost related to unvested stock options, which is expected to be recognized over approximately 2.5 years as of June 30, 2018. There were no costs related to share-based compensation that were capitalized for the years ended June 30, 2018, 2017 and 2016.
Restricted Stock Units Award Activity
The following table summarizes activity relating to the Company’s RSUs and PSUs for the year ended June 30, 2018:
Number of | Weighted-Average Fair Value Per Share At Date of Grant | ||||||||
Nonperformance Based Vesting RSUs | PSUs and Performance Based Vesting RSUs | ||||||||
Unvested award balance as of June 30, 2017 | 208 | 464 | $ | 172.78 | |||||
Granted | 131 | 180 | $ | 214.08 | |||||
Vested | (96 | ) | (249 | ) | $ | 177.05 | |||
Forfeited | (18 | ) | (137 | ) | $ | 185.12 | |||
Unvested award balance as of June 30, 2018 | 225 | 258 | $ | 192.41 | |||||
The fair value of RSUs and PSUs that vested and distributed during the year ended June 30, 2018 was $76,226. Upon delivery, RSUs granted under the MSG Employee Stock Plan were net share-settled to cover the required statutory tax withholding obligations. To fulfill the employees’ statutory minimum tax withholding obligations for the applicable income and other employment taxes, 162 of these RSUs, with an aggregate value of $34,393 were retained by the Company and reflected as financing activity in the accompanying consolidated statement of cash flows for the year ended June 30, 2018.
The fair value of RSUs and PSUs that vested during the years ended June 30, 2017 and 2016 was $16,315 and $2,164, respectively. The weighted-average fair value per share at grant date of RSUs and PSUs granted during the years ended June 30, 2017 and 2016 was $172.10 and $176.04, respectively.
F- 48
THE MADISON SQUARE GARDEN COMPANY
NOTES TO CONSOLIDATED FINANCIAL STATEMENTS
(Continued)
Stock Options Award Activity
The following table summarizes activity related to a holder of the Company’s stock options for the year ended June 30, 2018:
Number of | Weighted-Average Exercise Price Per Share | Weighted-Average Remaining Contractual Term (In Years) | Aggregate Intrinsic Value | |||||||||
Time Vesting Options | ||||||||||||
Balance as of June 30, 2017 | — | $ | — | $ | — | |||||||
Granted | 94 | $ | 210.13 | |||||||||
Balance as of June 30, 2018 | 94 | $ | 210.13 | 9.47 | $ | 9,388 | ||||||
Exercisable as of June 30, 2018 | — | $ | — | 0 | $ | — | ||||||
During the year ended June 30, 2018, the Company granted 94 stock options that vest ratably over three years and are being expensed on a straight-line basis over the vesting period of the stock options. The maximum contractual term is 10 years. The Company calculated the fair value of these options on the date of grant using the Black-Scholes option pricing model, which resulted in a weighted-average grant-date fair value of $53.29.
The following are key assumptions used to calculate the weighted-average grant-date fair value of stock options:
Expected term | 6 years | |
Expected volatility | 20.38 | % |
Risk-free interest rate | 2.22 | % |
Note 14. Stock Repurchase Program
On September 11, 2015, the Company’s board of directors authorized the repurchase of up to $525,000 of the Company’s Class A Common Stock once the shares of the Company’s Class A Common Stock began “regular way” trading on October 1, 2015. Under the authorization, shares of Class A Common Stock may be purchased from time to time in accordance with applicable insider trading and other securities laws and regulations. The timing and amount of purchases will depend on market conditions and other factors.
During the year ended June 30, 2018, the Company repurchased 56 shares of Class A Common Stock for a total cost of $11,685, including commissions and fees. These acquired shares have been classified as treasury stock in the accompanying consolidated balance sheet as of June 30, 2018. As of June 30, 2018, the Company had $259,639 of availability remaining under its stock repurchase authorization.
Note 15. Related Party Transactions
As of June 30, 2018, members of the Dolan family including trusts for members of the Dolan family (collectively, the “Dolan Family Group”), for purposes of Section 13(d) of the Securities Exchange Act of 1934, as amended, collectively beneficially own all of the Company’s outstanding Class B Common Stock and own approximately 2.8% of the Company’s outstanding Class A Common Stock. Such shares of the Company’s Class A Common Stock and Class B Common Stock, collectively, represent approximately 71.1% of the aggregate voting power of the Company’s outstanding common stock. Members of the Dolan family are also the controlling stockholders of MSG Networks and AMC Networks Inc. (“AMC Networks”).
In connection with the Distribution, the Company has entered into various agreements with MSG Networks, including media rights agreements covering the Knicks and the Rangers games, an advertising sales representation agreement, and the TSA. The Company and MSG Networks replaced the TSA with a services agreement (“Services Agreement”) effective July 1, 2017, which provides for each party to furnish substantially the same services, as well as the executive support services described below, in exchange for service fees. In connection with the expiration of the Services Agreement on June 30, 2018, the Company entered into an interim agreement with MSG Networks, pursuant to which each party provides the other with the same services on the same terms. We expect to enter into a new services agreement this calendar year which will be retroactive to July 1, 2018.
F- 49
THE MADISON SQUARE GARDEN COMPANY
NOTES TO CONSOLIDATED FINANCIAL STATEMENTS
(Continued)
During fiscal year 2016, the Company had various agreements with Altice USA (formerly Cablevision). These agreements included arrangements with respect to a number of ongoing commercial relationships. On June 21, 2016, Cablevision was acquired by a subsidiary of Altice N.V. and a change in control occurred, which resulted in members of the Dolan Family no longer being controlling stockholders of the surviving company, Altice USA. Accordingly, Altice USA is no longer a related party of the Company, and thus the related party transactions disclosed herein that relate to Cablevision were recognized prior to June 21, 2016.
Beginning in June 2016, the Company agreed to share certain executive support costs, including office space, executive assistants, security and transportation costs, for (i) the Company’s Executive Chairman with MSG Networks and (ii) the Company’s Vice Chairman with MSG Networks and AMC Networks.
On June 16, 2016, the Company entered into an arrangement with the Dolan Family Office, LLC (“DFO”), AMC Networks and MSG Networks providing for the sharing of certain expenses associated with executive office space which is available to James L. Dolan (the Executive Chairman, Chief Executive Officer and a director of the Company, the Executive Chairman and a director of MSG Networks, and a director of AMC Networks), Charles F. Dolan (the Executive Chairman and a director of AMC Networks and a director of the Company and MSG Networks), and the DFO which is controlled by Charles F. Dolan.
On January 11, 2017, the Company, through a wholly-owned subsidiary, and Quart 2C, LLC (“Q2C”), a company controlled by James L. Dolan, the Company’s Executive Chairman and Chief Executive Officer, and Kristin A. Dolan, his wife and a director of the Company, entered into reciprocal aircraft lease agreements pursuant to which the Company and Q2C have agreed from time to time to make available for lease each party’s aircraft to the other party on a non-exclusive basis for rent at an hourly rate and specified expenses of each flight. On February 8, 2017, the Company, through a wholly-owned subsidiary, and AMC Networks entered into aircraft time sharing agreements, pursuant to which the Company has agreed from time to time to make the aircraft owned or leased by it available to AMC Networks for lease on a “time sharing” basis.
On May 22, 2017, the Company, through a wholly-owned subsidiary, and Charles F. Dolan, a director of the Company, entered into an aircraft dry lease agreement pursuant to which the Company has agreed to make available for lease its G550 aircraft on a non-exclusive basis for rent at an hourly rate and specified expenses of each flight. Additionally, on May 22, 2017, the Company, through a wholly-owned subsidiary, and Sterling Aviation, LLC, a company controlled by Charles F. Dolan, also entered into a reciprocal aircraft dry lease agreement pursuant to which Sterling Aviation, LLC has agreed to make available for lease its GV aircraft on a non-exclusive basis for rent at an hourly rate and specified expenses of each flight.
The Company, through a wholly-owned subsidiary, and MSG Networks are party to an aircraft time sharing agreement, pursuant to which the Company has agreed from time to time to make its aircraft available to MSG Networks for lease on a “time sharing” basis. Additionally, the Company and MSG Networks have agreed on an allocation of the costs of certain helicopter use by its shared executives.
Effective July 1, 2018, the Company entered into certain aircraft support agreements with entities controlled by the Company’s Executive Chairman and Chief Executive Officer and/or Charles F. Dolan, a director of the Company. In connection with these agreements, certain of the aircraft arrangements described above were replaced with new time sharing and/or dry lease agreements, effective July 1, 2018.
The Company also has certain arrangements with its nonconsolidated affiliates. See Note 6 for information on outstanding loans provided by the Company to its nonconsolidated affiliates.
F- 50
THE MADISON SQUARE GARDEN COMPANY
NOTES TO CONSOLIDATED FINANCIAL STATEMENTS
(Continued)
Revenues and Operating Expenses
The following table summarizes the composition and amounts of the transactions with the Company’s affiliates, primarily with MSG Networks and Cablevision (until its sale to Altice N.V. on June 21, 2016). These amounts are reflected in revenues and operating expenses in the accompanying consolidated statements of operations for the years ended June 30, 2018, 2017 and 2016:
Years Ended June 30, | ||||||||||||
2018 | 2017 | 2016 | ||||||||||
Revenues | $ | 156,368 | $ | 150,534 | $ | 153,538 | ||||||
Operating expenses (credits): | ||||||||||||
Corporate general and administrative, net — MSG Networks | $ | (9,961 | ) | $ | (9,832 | ) | $ | (38,122 | ) | |||
Consulting fees | 3,929 | 3,943 | 3,444 | |||||||||
Advertising expenses | 993 | 1,249 | 1,609 | |||||||||
Transactions with Cablevision | — | — | 5,651 | |||||||||
Other, net | 933 | 72 | 15 | |||||||||
Revenues
Revenues from related parties primarily consist of local media rights recognized by the Company’s Sports segment from the licensing of team-related programming to MSG Networks under the media rights agreements covering the Knicks and Rangers, which provide MSG Networks with exclusive media rights to team games in their local markets, as well as commissions earned in connection with the advertising sales representation agreement pursuant to which the Company has the exclusive right and obligation to sell MSG Networks’ advertising availabilities. In addition, the Company and Tribeca Enterprises have a service agreement pursuant to which the Company provides marketing inventory, advertising sales and consulting services to Tribeca Enterprises for a fee. The Company is also a party to certain commercial arrangements with AMC Networks and its subsidiaries.
Corporate General and Administrative Expense, net - MSG Networks
The Company’s corporate overhead expenses are primarily related to centralized functions, including executive compensation, finance, treasury, tax, internal audit, legal, information technology, human resources and risk management functions. Prior to the Distribution, allocations of corporate overhead and shared services expense were based on direct usage or the relative proportion of revenue or headcount. In addition, the Company’s Sports and Entertainment segments charged MSG Networks for various services performed on behalf of Former Parent.
For the year ended June 30, 2018, Corporate general and administrative expense, net - MSG Networks reflects charges from the Company to MSG Networks under the Services Agreement of $9,969. Furthermore, for the years ended June 30, 2017 and 2016, Corporate general and administrative expense, net - MSG Networks reflects charges from the Company to MSG Networks under the TSA of $8,507 and $6,595, respectively, net of general and administrative costs charged to the Company by MSG Networks, under the TSA, which was replaced by the Services Agreement effective July 1, 2017.
Consulting Fees
The Company pays AMSGE and its nonconsolidated affiliates for advisory and consulting services that AMSGE and its nonconsolidated affiliates provide to the Company, and for the reimbursement of certain expenses in connection with such services. In the fourth quarter of fiscal year 2016, the Company paid $5,000 to AMSGE for work performed towards securing the right to lease property to be developed in Las Vegas. That amount is included in other assets in the accompanying consolidated balance sheets as of June 30, 2018 and 2017 and will be amortized over the term of the lease.
F- 51
THE MADISON SQUARE GARDEN COMPANY
NOTES TO CONSOLIDATED FINANCIAL STATEMENTS
(Continued)
Advertising Expenses
The Company incurs advertising expenses for services rendered by its related parties, primarily MSG Networks and Cablevision (until its sale to Altice N.V. on June 21, 2016), most of which are related to the utilization of advertising and promotional benefits by the Company.
Transactions with Cablevision
Amounts represent charges to the Company by Cablevision (until its sale to Altice N.V. on June 21, 2016) for corporate general and administrative expenses and telephone and other fiber optic transmission services. In addition, transactions with Cablevision included net charges related to a reciprocal aircraft arrangement between the Company and Cablevision (until its sale to Altice N.V. on June 21, 2016).
Other Operating Expenses, net
The Company and its related parties enter into transactions with each other in the ordinary course of business. Amounts charged to the Company for other transactions with its related parties are net of amounts charged by the Company to the Knickerbocker Group, LLC, an entity owned by James L. Dolan, the Executive Chairman, Chief Executive Officer and a director of the Company, for office space equal to the allocated cost of such space and the cost of certain technology services. In addition, other operating expenses include net charges relating to (i) reciprocal aircraft arrangements between the Company and each of Q2C and DFO/Sterling Aviation, LLC and (ii) time sharing agreements with MSG Networks and AMC Networks.
Other
See Note 6 for information on outstanding loans provided by the Company to its nonconsolidated affiliates.
Cash Management
Historically, MSG Networks used a centralized approach to cash management and financing of operations. The Company’s cash was available for use and was regularly “swept” by MSG Networks at its discretion. Transfers of cash both to and from MSG Networks are included as components of MSG Networks’ investment on the consolidated statements of equity and redeemable noncontrolling interests. The primary components of the net transfers to/from MSG Networks are cash pooling/general financing activities, various expense allocations to/from MSG Networks, and receivables/payables from/to MSG Networks deemed to be effectively net settled at the Distribution date.
MSG Networks’ Investment
All balances and transactions among the Company and MSG Networks and its subsidiaries, which, prior to the Distribution, include intercompany activities, are shown as components of the Company’s equity. As the books and records of the Company were not kept on a separate basis from MSG Networks prior to the Distribution, the determination of the average net balance due to or from MSG Networks was not practicable for the periods prior to the Distribution.
F- 52
THE MADISON SQUARE GARDEN COMPANY
NOTES TO CONSOLIDATED FINANCIAL STATEMENTS
(Continued)
Note 16. Accumulated Other Comprehensive Loss
The following table details the components of accumulated other comprehensive loss:
Pension Plans and Postretirement Plan | Cumulative Translation Adjustments | Unrealized Gain (Loss) on Available-for-sale Securities | Accumulated Other Comprehensive Loss | ||||||||||||
Balance as of June 30, 2017 | $ | (39,408 | ) | $ | — | $ | 5,293 | $ | (34,115 | ) | |||||
Reclassification of stranded tax effects (a) | 608 | — | 1,232 | 1,840 | |||||||||||
Other comprehensive loss before reclassifications, before income taxes | (3,415 | ) | (502 | ) | (12,095 | ) | (16,012 | ) | |||||||
Amounts reclassified from accumulated other comprehensive loss, before income taxes (b) | 1,369 | — | — | 1,369 | |||||||||||
Other comprehensive income (loss) | (2,046 | ) | (502 | ) | (12,095 | ) | (14,643 | ) | |||||||
Balance as of June 30, 2018 | $ | (40,846 | ) | $ | (502 | ) | $ | (5,570 | ) | $ | (46,918 | ) | |||
Pension Plans and Postretirement Plan | Cumulative Translation Adjustments | Unrealized Gain (Loss) on Available-for-sale Securities | Accumulated Other Comprehensive Loss | ||||||||||||
Balance as of June 30, 2016 | $ | (42,611 | ) | $ | — | $ | — | $ | (42,611 | ) | |||||
Other comprehensive income (loss) before reclassifications, before income taxes | 4,027 | — | 9,629 | 13,656 | |||||||||||
Amounts reclassified from accumulated other comprehensive loss, before income taxes (b) | 1,317 | — | — | 1,317 | |||||||||||
Income tax expense | (2,141 | ) | — | (4,336 | ) | (6,477 | ) | ||||||||
Other comprehensive income (loss) | 3,203 | — | 5,293 | 8,496 | |||||||||||
Balance as of June 30, 2017 | $ | (39,408 | ) | $ | — | $ | 5,293 | $ | (34,115 | ) | |||||
F- 53
THE MADISON SQUARE GARDEN COMPANY
NOTES TO CONSOLIDATED FINANCIAL STATEMENTS
(Continued)
Pension Plans and Postretirement Plan | Cumulative Translation Adjustments | Unrealized Gain (Loss) on Available-for-sale Securities | Accumulated Other Comprehensive Loss | ||||||||||||
Balance as of June 30, 2015 | $ | (40,215 | ) | $ | — | $ | — | $ | (40,215 | ) | |||||
Adjustment related to the transfer of Pension Plans and Postretirement Plan liabilities as a result of the Distribution | 5,896 | — | — | 5,896 | |||||||||||
Other comprehensive income before reclassifications, before income taxes | (9,239 | ) | — | — | (9,239 | ) | |||||||||
Amounts reclassified from accumulated other comprehensive loss, before income taxes (b) | 947 | — | — | 947 | |||||||||||
Other comprehensive income (loss) | (8,292 | ) | — | — | (8,292 | ) | |||||||||
Balance as of June 30, 2016 | $ | (42,611 | ) | $ | — | $ | — | $ | (42,611 | ) | |||||
________________
(a) | During the fourth quarter of 2018, the Company elected to early adopt ASU No. 2018-02, Income Statement - Reporting Comprehensive Income (Topic 220): Reclassification of Certain Tax Effects from Accumulated Other Comprehensive Income, which allowed the Company to reclassify the stranded income tax effects resulting from the Tax Cuts and Jobs Act from accumulated other comprehensive income (loss) to retained earnings (accumulated deficit). |
(b) | Amounts reclassified from accumulated other comprehensive loss, before income taxes, represent amortization of net actuarial loss and net unrecognized prior service credit included in net periodic benefit cost, which is reflected in direct operating expenses and selling, general and administrative expenses in the accompanying consolidated statements of operations (see Note 12). |
Note 17. Income Taxes
On December 22, 2017, new tax legislation, commonly referred to as the Tax Cuts and Jobs Act, was enacted, which significantly changed the existing U.S. tax laws, including a reduction in the corporate Federal income tax rate from 35% to 21% effective January 1, 2018. During the second quarter of fiscal year 2018, the Company was required to recognize the effect of tax law changes in the period of enactment even though certain key aspects of the new law became effective January 1, 2018. The Company used a blended statutory Federal income rate of 28% based upon the number of days that it will be taxed at the former rate of 35% and the number of days it will be taxed at the new rate of 21% to calculate its most recent effective tax rate.
For the period prior to the Distribution, the Company did not file separate tax returns as the Company was included in the tax grouping of other MSG Networks entities within the respective entity’s tax jurisdiction. The income tax provision included in this period has been calculated using the separate return basis, as if the Company filed a separate tax return.
F- 54
THE MADISON SQUARE GARDEN COMPANY
NOTES TO CONSOLIDATED FINANCIAL STATEMENTS
(Continued)
Income tax expense (benefit) is comprised of the following components:
Years Ended June 30, | ||||||||||||
2018 | 2017 | 2016 | ||||||||||
Current expense: | ||||||||||||
State and other | $ | 439 | $ | — | $ | — | ||||||
439 | — | — | ||||||||||
Deferred expense (benefit): | ||||||||||||
Federal | (114,211 | ) | (3,382 | ) | 325 | |||||||
State and other | (3,100 | ) | (1,022 | ) | (28 | ) | ||||||
(117,311 | ) | (4,404 | ) | 297 | ||||||||
Income tax expense (benefit) | $ | (116,872 | ) | $ | (4,404 | ) | $ | 297 | ||||
The income tax expense differs from the amount derived by applying the statutory federal rate to pre-tax income principally due to the effect of the following items:
_________________
Years Ended June 30, | ||||||||||||
2018 | 2017 | 2016 | ||||||||||
Federal tax expense (benefit) at statutory federal rate | $ | 4,933 | $ | (28,418 | ) | $ | (26,948 | ) | ||||
State income taxes, net of federal benefit | 1,800 | (6,716 | ) | (6,843 | ) | |||||||
Change in the estimated applicable corporate tax rate used to determine deferred taxes | (50,169 | ) | 672 | (192 | ) | |||||||
Nondeductible disability insurance premiums expense | 1,436 | 1,983 | 1,806 | |||||||||
Tax effect of pre-distribution earnings | — | — | 519 | |||||||||
Federal tax credits | — | (354 | ) | (426 | ) | |||||||
Gains in other comprehensive income | — | (6,477 | ) | — | ||||||||
Book income of consolidated partnership attributable to non-controlling interest | 2,006 | 1,414 | — | |||||||||
Tax effect of indefinite intangible amortization | 1,236 | 1,329 | — | |||||||||
Change in valuation allowance (a) | (76,925 | ) | 30,697 | 31,301 | ||||||||
Nondeductible expenses and other | (1,189 | ) | 1,466 | 1,080 | ||||||||
Income tax expense (benefit) | $ | (116,872 | ) | $ | (4,404 | ) | $ | 297 | ||||
(a) | For the year ended June 30, 2018, the valuation allowance is revalued under provisions contained in the new tax legislation, comprised of the following: (i) $62,479 was due to a reduction in the valuation allowance attributable to the new rules, which provide that future Federal net operating losses have an unlimited carry-forward period and (ii) $14,446, reduction in valuation allowance relating to current operations. For the year ended June 30, 2016, the valuation allowance reflects an increase on the Company’s net deferred tax asset related to fiscal year 2016 activity from the time of the Distribution. As part of the Distribution, MSG Networks is responsible for paying taxes on approximately $348,000 of deferred revenue from ticket sales, sponsorship and suite rentals collected in advance related to the Company’s business. This initially created a deferred tax asset on which the Company recorded a full valuation allowance at the time of the Distribution as it was more likely than not that the deferred tax asset would not be realized. |
F- 55
THE MADISON SQUARE GARDEN COMPANY
NOTES TO CONSOLIDATED FINANCIAL STATEMENTS
(Continued)
The tax effects of temporary differences which give rise to significant portions of the deferred tax assets and liabilities at June 30, 2018 and 2017 are as follows:
June 30, | |||||||
2018 | 2017 | ||||||
Deferred tax asset: | |||||||
Net operating loss carryforwards | $ | 73,599 | $ | 104,648 | |||
Tax credit carryforwards | 784 | 706 | |||||
Accrued employee benefits | 66,147 | 84,809 | |||||
Accrued expenses | 20,053 | 25,672 | |||||
Restricted stock units and stock options | 13,879 | 28,937 | |||||
Deferred production costs | — | 2,843 | |||||
Other | 7,445 | 8,774 | |||||
Total deferred tax assets | $ | 181,907 | $ | 256,389 | |||
Less valuation allowance | (88,246 | ) | (218,639 | ) | |||
Net deferred tax assets | $ | 93,661 | $ | 37,750 | |||
Deferred tax liabilities: | |||||||
Intangible and other assets | $ | (141,676 | ) | $ | (198,786 | ) | |
Property and equipment | (10,579 | ) | (17,162 | ) | |||
Prepaid expenses | (7,178 | ) | (7,782 | ) | |||
Investments | (13,196 | ) | (10,456 | ) | |||
Total deferred tax liabilities | $ | (172,629 | ) | $ | (234,186 | ) | |
Net deferred tax liability | $ | (78,968 | ) | $ | (196,436 | ) | |
In assessing the realizability of deferred tax assets, management considers whether it is more likely than not that some portion or all of the deferred tax asset will not be realized. The Company’s ability to realize its deferred tax assets depends upon the generation of sufficient future taxable income to allow for the utilization of its deductible temporary differences carryforwards. At this time, based on current facts and circumstances, management believes that it is not more likely than not that the Company will realize the benefit for its net deferred tax asset excluding the deferred tax liability on indefinite lived intangibles, and a valuation allowance has been recorded on the same.
The federal and state income tax net operating loss carryforwards of $217,989 and $276,266, respectively will primarily expire in 2036. The expected benefit from these net operating loss carryforwards is recorded as a deferred tax asset of $73,599. At this time, based on current facts and circumstances, management believes that it is not more likely than not that the Company will realize the benefit for its federal and state net operating loss deferred tax asset, therefore a full valuation allowance has been recorded.
The Company does not have any recorded unrecognized tax benefit for uncertain tax positions as of June 30, 2018 and 2017.
The Company was notified during the third quarter of fiscal year 2018 that the Internal Revenue Service was commencing an examination of our federal income tax returns as filed for the tax year ended June 30, 2016. The Company does not expect the audit to result in any material changes to the return as filed.
F- 56
THE MADISON SQUARE GARDEN COMPANY
NOTES TO CONSOLIDATED FINANCIAL STATEMENTS
(Continued)
Note 18. Segment Information
The Company is comprised of two reportable segments: MSG Entertainment and MSG Sports. In determining its reportable segments, the Company assessed the guidance of FASB ASC 280-10-50-1, which provides the definition of a reportable segment. In accordance with the FASB's guidance, the Company takes into account whether two or more operating segments can be aggregated together as one reportable segment as well as the type of discrete financial information that is available and regularly reviewed by its chief operating decision maker. The Company has evaluated this guidance and determined that there are two reportable segments. The Company allocates certain corporate costs and its performance venues operating expenses to each of its reportable segments. Allocated venue operating expenses include the non-event related costs of operating the Company’s venues, and include such costs as rent for the Company’s leased venues, real estate taxes, insurance, utilities, repairs and maintenance, and labor related to the overall management of the venues. Depreciation and amortization expense related to The Garden, The Hulu Theater at Madison Square Garden, the Forum, and certain corporate property, equipment and leasehold improvements not allocated to the reportable segments is reported in “Corporate and Other.” Additionally, the Company does not allocate any purchase accounting adjustments to the reporting segments.
During the first quarter of fiscal year 2017, the Company refined its approach to allocating corporate, performance venues operating and other shared expenses. Management analyzed the specific support provided by individual corporate and venue personnel, in part using a detailed efforts-based analysis. The Company considered the new approach to better define segment profitability for users of the financial information and, therefore, made this change in the first quarter of fiscal year 2017. Fiscal year 2016 results are reflected as originally reported and have not been restated. Had the revised approach been used in fiscal year 2016, operating income reported in MSG Sports would have increased and operating loss reported in MSG Entertainment would have improved by $6,045 and $337, respectively. These changes in the MSG Sports and MSG Entertainment segments operating income (loss) would have been offset by an increase of $6,382 in the operating loss of “Corporate and Other” for the year ended June 30, 2016. The adjusted operating income, as defined below, reported in MSG Sports would have increased and adjusted operating loss reported in MSG Entertainment would have improved during the year ended June 30, 2016 by $5,908 and $2,680, respectively. These improvements would have been offset by an increase of $8,588 in the adjusted operating loss of “Corporate and Other” for the year ended June 30, 2016.
The Company evaluates segment performance based on several factors, of which the key financial measure is their operating income (loss) before (i) depreciation, amortization and impairments of property and equipment and intangible assets, (ii) share-based compensation expense or benefit, (iii) restructuring charges or credits, and (iv) gains or losses on sales or dispositions of businesses, which is referred to as adjusted operating income (loss), a non-GAAP measure. In addition to excluding the impact of the items discussed above, the impact of purchase accounting adjustments related to business acquisitions is also excluded in evaluating the Company’s consolidated adjusted operating income (loss). Because it is based upon operating income (loss), adjusted operating income (loss) also excludes interest expense (including cash interest expense) and other non-operating income and expense items. Management believes that the exclusion of share-based compensation expense or benefit allows investors to better track the performance of the various operating units of the Company’s business without regard to the settlement of an obligation that is not expected to be made in cash. The Company believes adjusted operating income (loss) is an appropriate measure for evaluating the operating performance of its business segments and the Company on a consolidated basis. Adjusted operating income (loss) and similar measures with similar titles are common performance measures used by investors and analysts to analyze the Company’s performance. The Company uses revenues and adjusted operating income (loss) measures as the most important indicators of its business performance, and evaluates management’s effectiveness with specific reference to these indicators.
Adjusted operating income (loss) should be viewed as a supplement to and not a substitute for operating income (loss), net income (loss), cash flows from operating activities, and other measures of performance and/or liquidity presented in accordance with GAAP. The Company has presented the components that reconcile operating income (loss), the most directly comparable GAAP financial measure to adjusted operating income (loss).
F- 57
THE MADISON SQUARE GARDEN COMPANY
NOTES TO CONSOLIDATED FINANCIAL STATEMENTS
(Continued)
Information as to the operations of the Company’s reportable segments is set forth below.
Year ended June 30, 2018 | ||||||||||||||||||||||||
MSG Entertainment | MSG Sports | Corporate and Other | Purchase accounting adjustments | Inter-segment eliminations | Total | |||||||||||||||||||
Revenues | $ | 780,726 | $ | 778,653 | $ | — | $ | — | $ | (284 | ) | $ | 1,559,095 | |||||||||||
Direct operating expenses | 483,263 | 457,694 | 120 | 4,635 | (284 | ) | 945,428 | |||||||||||||||||
Selling, general and administrative expenses | (a) | 192,929 | 186,914 | 92,166 | 223 | 73 | 472,305 | |||||||||||||||||
Depreciation and amortization | (b) | 18,515 | 7,481 | 78,356 | 18,134 | — | 122,486 | |||||||||||||||||
Operating income (loss) | 86,019 | 126,564 | (170,642 | ) | (22,992 | ) | (73 | ) | 18,876 | |||||||||||||||
Loss in equity method investments | (7,770 | ) | ||||||||||||||||||||||
Interest income | 21,582 | |||||||||||||||||||||||
Interest expense | (15,415 | ) | ||||||||||||||||||||||
Miscellaneous income | 303 | |||||||||||||||||||||||
Income from operations before income taxes | $ | 17,576 | ||||||||||||||||||||||
Reconciliation of operating income (loss) to adjusted operating income (loss): | ||||||||||||||||||||||||
Operating income (loss) | 86,019 | 126,564 | (170,642 | ) | (22,992 | ) | (73 | ) | 18,876 | |||||||||||||||
Add back: | ||||||||||||||||||||||||
Share-based compensation expense | 12,500 | 15,498 | 19,565 | — | — | 47,563 | ||||||||||||||||||
Depreciation and amortization | 18,515 | 7,481 | 78,356 | 18,134 | — | 122,486 | ||||||||||||||||||
Other purchase accounting adjustments | — | — | — | 4,858 | — | 4,858 | ||||||||||||||||||
Adjusted operating income (loss) | $ | 117,034 | $ | 149,543 | $ | (72,721 | ) | $ | — | $ | (73 | ) | $ | 193,783 | ||||||||||
Other information: | ||||||||||||||||||||||||
Capital expenditures | (c) | $ | 24,403 | $ | 4,552 | $ | 162,959 | $ | — | $ | — | $ | 191,914 | |||||||||||
F- 58
THE MADISON SQUARE GARDEN COMPANY
NOTES TO CONSOLIDATED FINANCIAL STATEMENTS
(Continued)
Year ended June 30, 2017 | ||||||||||||||||||||
MSG Entertainment | MSG Sports | Corporate and Other | Purchase accounting adjustments | Total | ||||||||||||||||
Revenues | $ | 506,468 | $ | 811,984 | $ | — | $ | — | $ | 1,318,452 | ||||||||||
Direct operating expenses | (d) | 378,325 | 473,590 | — | 9,466 | 861,381 | ||||||||||||||
Selling, general and administrative expenses | (a) | 120,496 | 209,941 | 79,602 | — | 410,039 | ||||||||||||||
Depreciation and amortization | (b) | 11,339 | 9,319 | 83,578 | 3,152 | 107,388 | ||||||||||||||
Operating income (loss) | (3,692 | ) | 119,134 | (163,180 | ) | (12,618 | ) | (60,356 | ) | |||||||||||
Loss in equity method investments | (e) | (29,976 | ) | |||||||||||||||||
Interest income | 11,836 | |||||||||||||||||||
Interest expense | (4,189 | ) | ||||||||||||||||||
Miscellaneous income | (f) | 1,492 | ||||||||||||||||||
Loss from operations before income taxes | $ | (81,193 | ) | |||||||||||||||||
Reconciliation of operating income (loss) to adjusted operating income (loss): | ||||||||||||||||||||
Operating income (loss) | (3,692 | ) | 119,134 | (163,180 | ) | (12,618 | ) | (60,356 | ) | |||||||||||
Add back: | ||||||||||||||||||||
Share-based compensation expense | 14,323 | 14,548 | 12,258 | — | 41,129 | |||||||||||||||
Depreciation and amortization | 11,339 | 9,319 | 83,578 | 3,152 | 107,388 | |||||||||||||||
Other purchase accounting adjustments | — | — | — | 9,466 | 9,466 | |||||||||||||||
Adjusted operating income (loss) | $ | 21,970 | $ | 143,001 | $ | (67,344 | ) | $ | — | $ | 97,627 | |||||||||
Other information: | ||||||||||||||||||||
Capital expenditures | $ | 11,460 | $ | 2,393 | $ | 30,371 | $ | — | $ | 44,224 | ||||||||||
F- 59
THE MADISON SQUARE GARDEN COMPANY
NOTES TO CONSOLIDATED FINANCIAL STATEMENTS
(Continued)
Year ended June 30, 2016 | ||||||||||||||||
MSG Entertainment | MSG Sports | Corporate and Other | Total | |||||||||||||
Revenues | $ | 415,390 | $ | 699,062 | $ | 859 | $ | 1,115,311 | ||||||||
Direct operating expenses | (d) | 341,637 | 396,220 | — | 737,857 | |||||||||||
Selling, general and administrative expenses | (a) | 96,204 | 182,131 | 55,268 | 333,603 | |||||||||||
Depreciation and amortization | (b) | 9,884 | 10,957 | 81,641 | 102,482 | |||||||||||
Operating income (loss) | (32,335 | ) | 109,754 | (136,050 | ) | (58,631 | ) | |||||||||
Loss in equity method investments | (e) | (19,099 | ) | |||||||||||||
Interest income | 6,782 | |||||||||||||||
Interest expense | (2,028 | ) | ||||||||||||||
Miscellaneous expense | (f) | (4,017 | ) | |||||||||||||
Loss from operations before income taxes | $ | (76,993 | ) | |||||||||||||
Reconciliation of operating income (loss) to adjusted operating income (loss): | ||||||||||||||||
Operating income (loss) | (32,335 | ) | 109,754 | (136,050 | ) | (58,631 | ) | |||||||||
Add back: | ||||||||||||||||
Share-based compensation expense | 7,870 | 10,316 | 6,290 | 24,476 | ||||||||||||
Depreciation and amortization | 9,884 | 10,957 | 81,641 | 102,482 | ||||||||||||
Adjusted operating income (loss) | $ | (14,581 | ) | $ | 131,027 | $ | (48,119 | ) | $ | 68,327 | ||||||
Other information: | ||||||||||||||||
Capital expenditures | (c) | $ | 4,974 | $ | 4,578 | $ | 62,164 | $ | 71,716 | |||||||
_________________
(a) | Corporate and Other’s selling, general and administrative expenses primarily consist of unallocated corporate general and administrative costs, including expenses associated with the Company's business development initiatives. The amount for the year ended June 30, 2016 include approximately $6,900 of reorganization costs which primarily consists of severance and related benefits. Such costs were paid during fiscal year 2017. |
(b) | Corporate and Other principally includes depreciation and amortization on The Garden, The Hulu Theater at Madison Square Garden, the Forum, and certain corporate property, equipment and leasehold improvement assets not allocated to the Company’s reportable segments. |
(c) | Corporate and Other’s capital expenditures for the year ended June 30, 2018 are primarily associated with the purchase of land in London and costs incurred in developing the Company’s new venues in Las Vegas and London. See Note 8 for more information regarding the land purchase. MSG Entertainment’s capital expenditures for the year ended June 30, 2018 are primarily associated with capital expenditures made by TAO Group and certain investments with respect to Radio City Music Hall. Corporate and Other’s capital expenditures for the year ended June 30, 2016 are primarily associated with the purchase of a new aircraft, as well as certain investments with respect to The Garden. |
(d) | MSG Entertainment’s direct operating expenses for the years ended June 30, 2017 and 2016 include $33,629 and $41,816, respectively, of write-offs of deferred production costs associated with the New York Spectacular production (see Note 2). |
(e) | Loss in equity method investments for the year ended June 30, 2017 reflects a pre-tax non-cash impairment charge of $20,613 to write off the carrying value of its equity investment in Fuse Media. Loss in equity method investments for the year ended June 30, 2016 reflects a pre-tax non-cash impairment charge of $7,270 to write off the carrying value of its equity investment in Broadway production of Finding Neverland. |
F- 60
THE MADISON SQUARE GARDEN COMPANY
NOTES TO CONSOLIDATED FINANCIAL STATEMENTS
(Continued)
(f) | Miscellaneous income for the year ended June 30, 2017 consists principally of the recovery of certain claims in connection with a third-party bankruptcy proceeding. Miscellaneous expense for the year ended June 30, 2016 primarily include a partial write-down of one of the Company’s cost method investments. |
The table below sets forth, for the periods presented, the Company’s consolidated revenues for the years ended June 30, 2018, 2017 and 2016 by component.
Years Ended June 30, | ||||||||||||
2018 | 2017 | 2016 | ||||||||||
Revenues | ||||||||||||
Event-related revenues (a) | $ | 980,726 | $ | 908,941 | $ | 834,213 | ||||||
Media rights revenues (b) | 229,646 | 220,021 | 179,816 | |||||||||
Advertising sales commission, sponsorship and signage revenues (c) | 76,831 | 74,685 | 68,661 | |||||||||
All other revenues (d) | 271,892 | 114,805 | 32,621 | |||||||||
$ | 1,559,095 | $ | 1,318,452 | $ | 1,115,311 | |||||||
_________________
(a) | Primarily consists of professional sports teams’, entertainment and other live sporting events revenues. These amounts include (i) ticket sales, (ii) other ticket-related revenue, (iii) food, beverage and merchandise sales, (iv) venue license fees, and (v) event-related sponsorship and signage revenues. |
(b) | Primarily consists of telecast rights fees from MSG Networks and the Company’s share of league distributions. |
(c) | Amounts exclude event-related sponsorship and signage revenues. |
(d) | Primarily consists of (i) nonevent-related food and beverage revenues, including TAO Group’s entertainment dining and nightlife offerings, (ii) playoff revenue, which includes ticket sales, food, beverage and merchandise sales, and suite rental fees, and (iii) other non-media rights related league distributions. |
Substantially all revenues and assets of the Company’s reportable segments are attributed to or located in the United States and are primarily concentrated in the New York metropolitan area.
Note 19. Concentrations of Risk
Financial instruments that may potentially subject the Company to a concentration of credit risk consist primarily of cash and cash equivalents and accounts receivable. Cash and cash equivalents are invested in commercial paper, money market accounts and time deposits. The Company monitors the financial institutions and money market funds where it invests its cash and cash equivalents with diversification among counterparties to mitigate exposure to any single financial institution. The Company’s emphasis is primarily on safety of principal and liquidity and secondarily on maximizing the yield on its investments.
The following individual non-affiliated customers accounted for the following percentages of the Company’s consolidated accounts receivable balances:
_________________
June 30, | |||||
2018 | 2017 | ||||
Customer A | 10 | % | 10 | % | |
Customer B (a) | 4 | % | 11 | % | |
(a) | A receivable from Customer B as of June 30, 2017 is primarily associated with a nonrecurring transaction. |
F- 61
THE MADISON SQUARE GARDEN COMPANY
NOTES TO CONSOLIDATED FINANCIAL STATEMENTS
(Continued)
The Company did not have any non-affiliated customer that represented 10% or more of its consolidated revenues for the years ended June 30, 2018, 2017 and 2016. Revenues from MSG Networks amounted to $154,893, $149,197 and $144,947 for the years ended June 30, 2018, 2017 and 2016, which represent 10%, 11% and 13%, respectively, of the Company’s consolidated revenues (see Note 15).
As of June 30, 2018, approximately 6,900 full-time and part-time employees, who represent approximately 58% of the Company’s workforce, are subject to CBAs. Approximately 24% are subject to CBAs that expired as of June 30, 2018 and approximately 16% are subject to CBAs that will expire by June 30, 2019 if they are not extended prior thereto.
Note 20. Interim Financial Information (Unaudited)
The following is a summary of the Company’s selected quarterly financial data for the years ended June 30, 2018 and 2017:
Three Months Ended (a) | Year ended June 30, 2018 | ||||||||||||||||||
September 30, | December 31, | March 31, | June 30, | ||||||||||||||||
2017 | 2017 | 2018 | 2018 | ||||||||||||||||
Revenues | $ | 245,215 | $ | 536,302 | $ | 459,621 | $ | 317,957 | $ | 1,559,095 | |||||||||
Operating expenses | 260,720 | 463,865 | 452,289 | 363,345 | 1,540,219 | ||||||||||||||
Operating income (loss) | $ | (15,505 | ) | $ | 72,437 | $ | 7,332 | $ | (45,388 | ) | $ | 18,876 | |||||||
Net income (loss) | $ | (10,867 | ) | $ | 187,991 | $ | 7,814 | $ | (50,490 | ) | $ | 134,448 | |||||||
Net income (loss) attributable to The Madison Square Garden Company’s stockholders | $ | (11,107 | ) | $ | 189,613 | $ | 9,141 | $ | (46,053 | ) | $ | 141,594 | |||||||
Basic earnings (loss) per common share attributable to The Madison Square Garden Company’s stockholders | $ | (0.47 | ) | $ | 8.03 | $ | 0.39 | $ | (1.94 | ) | $ | 5.99 | |||||||
Diluted earnings (loss) per common share attributable to The Madison Square Garden Company’s stockholders | $ | (0.47 | ) | $ | 7.96 | $ | 0.38 | $ | (1.94 | ) | $ | 5.94 | |||||||
F- 62
THE MADISON SQUARE GARDEN COMPANY
NOTES TO CONSOLIDATED FINANCIAL STATEMENTS
(Continued)
Three Months Ended (a) | Year ended June 30, 2017 | ||||||||||||||||||
September 30, | December 31, | March 31, | June 30, | ||||||||||||||||
2016 | 2016 | 2017 | 2017 | ||||||||||||||||
Revenues | $ | 181,695 | $ | 445,150 | $ | 386,033 | $ | 305,574 | $ | 1,318,452 | |||||||||
Operating expenses | 214,538 | 386,899 | 379,327 | 398,044 | 1,378,808 | ||||||||||||||
Operating income (loss) | $ | (32,843 | ) | $ | 58,251 | $ | 6,706 | $ | (92,470 | ) | $ | (60,356 | ) | ||||||
Net income (loss) | $ | (28,914 | ) | $ | 57,421 | $ | (17,843 | ) | $ | (87,453 | ) | $ | (76,789 | ) | |||||
Net income (loss) attributable to The Madison Square Garden Company’s stockholders | $ | (28,626 | ) | $ | 57,726 | $ | (17,545 | ) | $ | (84,278 | ) | $ | (72,723 | ) | |||||
Basic earnings (loss) per common share attributable to The Madison Square Garden Company’s stockholders | $ | (1.19 | ) | $ | 2.41 | $ | (0.74 | ) | $ | (3.58 | ) | $ | (3.05 | ) | |||||
Diluted earnings (loss) per common share attributable to The Madison Square Garden Company’s stockholders | $ | (1.19 | ) | $ | 2.39 | $ | (0.74 | ) | $ | (3.58 | ) | $ | (3.05 | ) | |||||
(a) | The operating results for the periods in the fiscal year 2018 are not directly comparable with the periods in the fiscal year 2017 primarily due to the timing of the Company’ s acquisition of a controlling interest in TAO Group. TAO Group’s operating results for fiscal year 2018 are for the period from March 27, 2017 to April 1, 2018, as compared to TAO Group’s operating results for fiscal year 2017, which are for the period from February 1, 2017 to March 26, 2017. See Business Combinations and Noncontrolling Interests section under Note 2. Summary of Significant Accounting Policies for further discussion on consolidation of TAO Group. |
F- 63