Attached files
| file | filename |
|---|---|
| EX-31.2 - EXHIBIT 31.2 - Lifevantage Corp | ex312cfosec302certificatio.htm |
| EX-32.2 - EXHIBIT 32.2 - Lifevantage Corp | ex322cfosec906certificatio.htm |
| EX-32.1 - EXHIBIT 32.1 - Lifevantage Corp | ex321ceosec906certificatio.htm |
| EX-31.1 - EXHIBIT 31.1 - Lifevantage Corp | ex311ceosec302certificatio.htm |
| EX-23.1 - EXHIBIT 23.1 - Lifevantage Corp | ex231wsrpconsent06302018.htm |
UNITED STATES
SECURITIES AND EXCHANGE COMMISSION
WASHINGTON, D.C. 20549
________________________________________________________________________________
FORM 10-K
(Mark One)
ý | ANNUAL REPORT UNDER SECTION 13 OR 15(d) OF THE SECURITIES EXCHANGE ACT OF 1934. |
For the fiscal year ended June 30, 2018
¨ | TRANSITION REPORT UNDER SECTION 13 OR 15(d) OF THE SECURITIES EXCHANGE ACT OF 1934. |
For the transition period from __________ to __________
Commission file number: 001-35647
________________________________________________________________________________
LIFEVANTAGE CORPORATION
(Exact name of registrant as specified in its charter)
Delaware | 90-0224471 |
(State or other jurisdiction of incorporation or organization) | (IRS Employer Identification No.) |
9785 S. Monroe, Ste 400, Sandy, Utah 84070 | |
(Address of principal executive offices) | |
Registrant’s telephone number: (801) 432-9000 | |
Securities registered pursuant to Section 12(b) of the Act:
Title of Each Class | Name of Each Exchange on which Registered | |
Common Stock, par value $0.0001 per share | NASDAQ Global Market | |
Securities registered pursuant to Section 12(g) of the Act: None
________________________________________________________________________________
Indicate by check mark if the registrant is a well-known seasoned issuer, as defined in Rule 405 of the Securities Act. Yes ¨ No ý
Indicate by check mark if the registrant is not required to file reports pursuant to Section 13 or Section 15(d) of the Act. Yes ¨ No ý
Indicate by check mark whether the registrant (1) has filed all reports required to be filed by Section 13 or 15(d) of the Securities Exchange Act of 1934 during the preceding 12 months (or for such shorter period that the registrant was required to file such reports), and (2) has been subject to such filing requirements for the past 90 days. Yes ý No ¨
Indicate by check mark whether the registrant has submitted electronically and posted on its corporate Web site, if any, every Interactive Data File required to be submitted and posted pursuant to Rule 405 of Regulation S-T during the preceding 12 months (or for such shorter period that the registrant was required to submit and post such files). Yes ý No ¨
Indicate by check mark if disclosure of delinquent filers pursuant to Item 405 of Regulation S-K is not contained herein, and will not be contained, to the best of registrant’s knowledge, in definitive proxy or information statements incorporated by reference in Part III of this Form 10-K or any amendment to this Form 10-K. ¨
Indicate by check mark whether the registrant is a large accelerated filer, an accelerated filer, a non-accelerated filer, a smaller reporting company, or an emerging growth company. See the definitions of “large accelerated filer,” “accelerated filer,” “smaller reporting company,” and "emerging growth company" in Rule 12b-2 of the Exchange Act.
Large accelerated filer | ¨ | Accelerated filer | ý |
Non-accelerated filer | ¨ (Do not check if a smaller reporting company) | Smaller reporting company | ¨ |
Emerging growth company | ¨ | ||
If an emerging growth company, indicate by check mark if the registrant has elected not to use the extended transition period for complying with any new or revised financial accounting standards provided pursuant to Section 13(a) of the Exchange Act. ¨
Indicate by check mark whether the registrant is a shell company (as defined in Rule 12b-2 of the Act). Yes ¨ No ý
The aggregate market value of the registrant's common stock held by non-affiliates as of December 31, 2017, the end of the registrant's second fiscal quarter, was approximately $67.6 million, based on a closing market price of $4.76 per share.
The number of shares of common stock (par value $0.0001) outstanding as of August 10, 2018 was 14,088,430 shares.
________________________________________________________________________________
DOCUMENTS INCORPORATED BY REFERENCE
Portions of the registrant’s definitive proxy statement to be filed subsequent to the date hereof with the Securities and Exchange Commission pursuant to Regulation 14A in connection with the registrant’s fiscal year 2019 annual meeting of shareholders are incorporated by reference into Part III of this report. Such definitive proxy statement will be filed with the Commission not later than 120 days after the end of the registrant’s fiscal year ended June 30, 2018.
CAUTIONARY NOTE REGARDING FORWARD-LOOKING STATEMENTS
Certain statements contained in this report and the information incorporated by reference herein may contain “forward-looking statements” (as such term is defined in Section 27A of the Securities Act of 1933, as amended, and Section 21E of the Securities Exchange Act of 1934, as amended). These statements, which involve risks and uncertainties, reflect our current expectations, intentions, or strategies regarding our possible future results of operations, performance, and achievements. Forward-looking statements include, without limitation: statements regarding future products or product development; statements regarding future selling, general and administrative costs and research and development spending; statements regarding the future performance of our network marketing efforts; statements regarding our expectations regarding ongoing litigation; statements regarding international growth; and statements regarding future financial performance, results of operations, capital expenditures and sufficiency of capital resources to fund our operating requirements. These forward-looking statements are made pursuant to the safe harbor provisions of the Private Securities Litigation Reform Act of 1995 and applicable rules of the Securities and Exchange Commission and common law.
These forward-looking statements may be identified in this report and the information incorporated by reference by words such as “anticipate”, “believe”, “could”, “estimate”, “expect”, “intend”, “plan”, “predict”, “project”, “should” and similar terms and expressions, including references to assumptions and strategies. These statements reflect our current beliefs and are based on information currently available to us. Accordingly, these statements are subject to certain risks, uncertainties, and contingencies, which could cause our actual results, performance, or achievements to differ materially from those expressed in, or implied by, such statements.
The following factors are among those that may cause actual results to differ materially from our forward-looking statements:
• | Inability to properly manage, motivate and retain our independent distributors or to attract new independent distributors on an ongoing basis; |
• | Inability to manage existing markets, open new international markets or expand our operations; |
• | Non-compliance by our independent distributors with applicable legal requirements or our policies and procedures; |
• | Inability of new products and technological innovations to gain distributor or market acceptance; |
• | Inability to execute our product launch process due to increased pressure on our supply chain, information systems and management; |
• | Inability to appropriately manage our inventory; |
• | Potential adverse effects on our business and stock price due to ineffective internal controls; |
• | Disruptions in our information technology systems; |
• | Inability to protect against cyber security risks and to maintain the integrity of data; |
• | Inability to comply with financial covenants imposed by our credit facility and the impact of debt service obligations and restrictive debt covenants; |
• | International trade or foreign exchange restrictions, increased tariffs, foreign currency exchange fluctuations; |
• | Inability to raise additional capital or complete desired acquisitions; |
• | Dependence upon a few products for revenue; |
• | High quality materials for our products may become difficult to obtain or expensive; |
• | Dependence on third parties to manufacture our products; |
• | Disruptions to the transportation channels used to distribute our products; |
• | We may be subject to a product recall; |
• | Unfavorable publicity on our business or products; |
• | Our direct selling program could be found to not be in compliance with current or newly adopted laws or regulations in various markets; |
2
• | Legal proceedings may be expensive and time consuming; |
• | Strict government regulations on our business; |
• | Regulations governing the production or marketing of our skin care products; |
• | Risk of investigatory and enforcement action by the Federal Trade Commission; |
• | Government authorities may question our tax positions or transfer pricing policies or change their laws in a manner that could increase our effective tax rate or otherwise harm our business; |
• | Failure to comply with anti-corruption laws; |
• | Inability to build and integrate our new management team could harm our business; |
• | Loss of, or inability to attract, key personnel; |
• | We may be held responsible for certain taxes or assessments relating to the activity of our independent distributors; |
• | Competition in the dietary supplement market; |
• | Our inability to protect our intellectual property rights; |
• | Third party claims that we infringe on their intellectual property; |
• | Product liability claims against us; |
• | Economic, political, foreign exchange and other risks associated with international operations; |
• | Potential delisting of our common stock due to non-compliance with Nasdaq's continued listing requirements; |
• | Volatility of the market price of our common stock; |
• | Substantial sales of shares may negatively impact the market price of our common stock; and |
• | Dilution of outstanding common shares may occur if holders of our existing options exercise their securities or upon future vesting of performance restricted stock units. |
When considering these forward-looking statements, you should keep in mind the cautionary statements in this report and the documents incorporated by reference. Except as required by law, we have no obligation and do not undertake to update or revise any such forward-looking statements to reflect events or circumstances after the date of this report.
3
TABLE OF CONTENTS
Page | |
4
PART I
ITEM 1 — BUSINESS
Overview
LifeVantage Corporation (sometimes used herein, the "Company," "we," "us," "our," and similar terms) is a company focused on biohacking the aging code through nutrigenomics, the study of how nutrition and naturally occurring compounds affect our genes. We are dedicated to helping people achieve their health, wellness and financial goals. We provide quality, scientifically-validated products and a financially rewarding direct sales business opportunity to customers and independent distributors. We sell our products in the United States, Japan, Hong Kong, Australia, Canada, Mexico, Thailand, the United Kingdom, the Netherlands, Germany and Taiwan. We also sell our products in a number of countries to customers for personal consumption only. In addition, we sell our products in China through our e-commerce business model.
We engage in the identification, research, development and distribution of advanced nutraceutical dietary supplements and skin care products, including Protandim®, our line of scientifically-validated dietary supplements, TrueScience®, our line of anti-aging skin care products, Petandim™ for Dogs, our companion pet supplement formulated to combat oxidative stress in dogs, Axio®, our Smart Energy Drink mixes, PhysIQ™, our Smart Weight Management System and Omega+, our sustainable fish oil supplement.
We were incorporated in Colorado in June 1988 under the name Andraplex Corporation. We changed our corporate name to Yaak River Resources, Inc. in January 1992, and subsequently changed it again in October 2004 to Lifeline Therapeutics, Inc. In October 2004 and March 2005, we acquired all of the outstanding common stock of Lifeline Nutraceuticals Corporation. In November 2006, we changed our name to LifeVantage Corporation. From our fiscal year 2005 until our fiscal year 2009, we marketed and sold a single product, Protandim®, through traditional retail stores. In October 2008, we announced that we were transitioning our business model from a traditional retail model to a direct sales model in which Protandim® would be sold primarily through our network of independent distributors. Since entering direct sales, we have increased our geographic reach by entering new international markets and increased our product offering by introducing additional scientifically-validated products.
On March 9, 2018, following approval by our stockholders at our 2018 Annual Meeting of Stockholders, we changed our state of incorporation from the State of Colorado to the State of Delaware pursuant to a plan of conversion. All outstanding shares of common stock, options and share units of the Colorado corporation were converted into an equivalent share, option or share unit of the Delaware corporation and the par value of our common stock was adjusted to $0.0001. All directors and officers of the Colorado corporation held the same position within the Delaware corporation on the date of reincorporation.
Fiscal Year 2018 Highlights
Technology Innovation
We released the LifeVantage app, which is available for download on iTunes and Google Play stores. This custom-developed platform is pioneering new ways for us to interact with our distributors and customers and gives us and our distributor leadership valuable insight into the activities of our distributor base. The app provides distributors with tools and communications that help simplify business activities, walk new distributors through starting their business, improve prospecting and close new clients and distributors.
Red Carpet Program
We implemented our Red Carpet program, which is designed to attract and incentivize experienced direct selling sales leaders who are in transition to join LifeVantage. We have seen a strong positive response to our Red Carpet program as evidenced by an increase in revenues. We have significantly increased leadership enrollments, improved retention and hope to see improved active distributor counts as a result of this program.
Vitality Stack
During our Elite Academy event in November 2017, we introduced the Vitality Stack, which is a combination of our activated essentials line, including our Protandim Nrf2, Protandim NRF1, Probio and our new Omega+ product, which is a comprehensive combination of omega-3s, omega-7 and vitamin D3 and was also launched at Elite Academy. This stack and additional stacks that we expect to release in the future will become the primary protocols to support the biohacking culture we are creating across the Company. We expect the Vitality Stack will increase our average order size. In January 2018, we launched Vitality Stack Packets, which combines the same activated essentials daily use products contained in the Vitality Stack, into packets for ease of use and improved portability.
Biohacking Culture
5
We have continued to develop our nutrigenomic story and the biohacking culture we have been building with distributors and customers. Biohacking is becoming the underlying message for our independent distributors, leveraging our core competencies and existing products, and is supporting our unique position in the market. We are focused on capitalizing on this trend by highlighting it across our communications with our independent distributors and in our marketing materials, and have additional marketing and media assets in development to promote this story.
ERP System
We implemented an upgrade to our corporate ERP system, deploying Microsoft Dynamics 365, which was completed on time and without disruption.
Global Expansion
To support our Greater China expansion strategy, we launched our Mainland China business model in February 2018. This is not a direct selling model, but rather an e-commerce model powered by in-country social marketers. This innovative model is on trend with the growth of e-commerce and social selling in China. Initiating this model in China gives us an opportunity to test this new method of marketing without any expected disruptions to our current markets. To further expand our footprint in Greater China, in June 2018, we opened for business in Taiwan. In addition, in September 2017, we opened for business in Germany.
Customer Acquisition
We rolled out our global customer acquisition program in April 2018. This is an initiative designed to expand the number of countries where customers can purchase and use our products for personal consumption only. This program allows us to enter additional markets at low incremental cost and enables our distributors to leverage their international relationships outside of their home countries. The program initially launched in eight markets and we plan to continue exploring additional potential markets.
To further drive customer acquisition, we launched our Auto-Assigned Customer Program, which for the first time allows new customers to order directly through www.lifevantage.com without being required to go through a distributor on their initial order. After the initial order, these new customers are then assigned to distributors for ongoing support. This program will provide consumers easier access to our innovative products while providing referrals to our distributor force.
Our Competitive Advantages
We believe we have a competitive advantage in several key areas:
• | Our Compensation: We believe our distributor compensation plan is one of the more financially rewarding in the direct selling industry. Our percentage of sales paid to independent distributors as compensation and incentives is one of the highest percentages reported in the direct selling industry. Our compensation plan also enables independent distributors to earn compensation early and often as they sell our products. Some elements of our compensation plan are paid weekly, allowing new independent distributors to receive compensation quickly. We believe more frequent payments of compensation helps us retain new independent distributors by allowing them to experience success soon after enrolling. We also offer a variety of incentive programs to our independent distributors for achieving specified sales goals. For example, My LifeVenture® is an incentive program that enables independent distributors to earn the title to a new Jeep Wrangler by achieving and maintaining specified sales goals. We believe our compensation plan and incentive programs help motivate our independent distributors to achieve success. |
• | Our Products: We have a focus in nutrigenomics, the study of how nutrition and naturally occurring compounds affect our genes. We have developed quality, scientifically-validated nutrigenomics products focused on helping individuals look, feel and perform better. Our products are the Protandim® product line, the TrueScience® anti-aging skin care line, Axio® Smart Energy Drink mixes, PhysIQ™ Smart Weight Management System, Petandim™ for Dogs, and Omega+, our sustainable fish oil supplement. The Protandim® product line includes Protandim® NRF1 and Nrf2 Synergizers™. The Protandim® NRF1 Synergizer is formulated to increase cellular energy and performance by boosting mitochondria to support cellular repair and slow cellular aging. The Protandim® Nrf2 Synergizer™ contains a patented blend of ingredients and has been shown to combat oxidative stress by increasing the body’s natural antioxidant protection at the gene level, inducing the production of naturally-occurring protective antioxidant enzymes including superoxide dismutase, catalase, and glutathione synthase. Our TrueScience® anti-aging skin care line includes TrueScience® Facial Cleanser, TrueScience® Perfecting Lotion, TrueScience® Eye Serum, TrueScience® Anti-Aging Cream, and TrueScience® Hand Cream. Axio® is our line of Smart Energy Drink mixes formulated to promote alertness and support mental performance. Petandim™ for Dogs is a supplement specially formulated to combat oxidative stress in dogs through Nrf2 activation. PhysIQ™ is our Smart Weight Management System which includes PhysIQ™ Fat Burn, PhysIQ™ Probio, PhysIQ™ Cleanse and PhysIQ™ Protein Shake mix, all formulated to aid in weight management. Omega+ is a dietary supplement that combines DHA and EPA Omega-3 fatty acids, Omega-7 fatty acids, and Vitamin |
6
D3 to support cognitive health, cardiovascular health, skin health, and the immune system. We believe our significant number of customers who regularly purchase our products without the intention of becoming independent distributors is a strong indicator of the benefits of our products.
• | Technology-Enabled Distributor Training and Resources: We are committed to providing our independent distributors with resources and training designed to increase productivity and increase their potential for success. We are dedicated to using technology to facilitate a streamlined approach for independent distributors to manage their businesses and sell our products. The LifeVantage app, which is available for download on iTunes and Google Play stores, is a custom-developed platform that provides new ways for us to interact with our distributors and customers and gives us and our distributor leadership valuable insight into the activities of our distributor base. The LifeVantage app was designed to allow users to conduct any aspect of their business on a single platform from anywhere in the world. Ultimately, through artificial intelligence and machine learning, we expect that the app will be able to guide users on what to share, when to share it, and with whom. In addition, we provide training materials and we encourage our independent distributors to participate in company-sponsored events, including conventions, promotions and incentives. |
• | Our Culture: We are committed to creating a culture for our independent distributors, customers and employees that focuses on ethical, legal and transparent business practices. At enrollment, our independent distributors agree to abide by our policies and procedures. Our policies and procedures, when followed, ensure that our independent distributors comply with applicable laws and regulations. Our compliance department monitors the activities of our independent distributors as part of our effort to enforce our policies and procedures. Similarly, our code of business conduct and ethics sets forth guidelines and expectations for our employees. We believe our ethical, legal and transparent culture attracts highly qualified employees and independent distributors who share our commitment to these principles. |
• | Our Employees: We believe that our employees are an essential asset. We have a dedicated team of professionals that support our system of independent distributors, work to generate long-term value for our shareholders and contribute to the broader public through charitable programs, including LifeVantage Legacy. In turn, we offer competitive compensation and direct their focus on the long-term goals of our independent distributors and shareholders. |
Scientific Background
Oxidative Stress
Oxidative stress refers to the cellular and tissue damage caused by chemically reactive oxygen species that is generated as a natural result of cellular metabolism and the body's use of oxygen to generate energy. Levels of reactive oxygen species, also known as ROS, and free radicals can be elevated under a wide variety of conditions, including radiation, UV light, smoking, excessive alcohol consumption, as well as medical conditions involving inflammation, cardiovascular disease, neurodegenerative disease, diabetes and advancing age. Elevated ROS levels inflict structural damage on nucleic acid, lipid, carbohydrate and protein components of cells, thereby directly contributing to or exacerbating tissue dysfunction, disease and age-related debilitation.
Cellular antioxidant enzymes normally serve to maintain levels of ROS at those compatible with normal cell function. Important among these cellular antioxidant enzymes are superoxide dismutase and catalase. However, the levels of these protective antioxidant enzymes decrease with age and in a number of disease conditions. As we age, and the levels of antioxidant enzymes decrease, oxidative stress levels increase significantly, and our body is unable to maintain homeostasis relative to elevated ROS levels.
Oxidative stress is widely believed to be a key factor in many of the undesirable effects of aging because it promotes cell death. Additionally, high levels of oxidative stress have also been linked as a causative or associated factor in over 100 diseases.
Nrf2 Activation
Nuclear factor (erythroid-derived 2)-like 2, also known as NFE2L2 or Nrf2, is a transcription factor that in humans is encoded by the NFE2L2 gene. Nrf2 is the master regulator of the antioxidant response, which is important for the reduction of oxidative stress. Because Nrf2 is able to induce gene activity important in combating oxidative stress, thereby activating the body’s own protective response, it helps protect from a variety of complications related to oxidative stress.
Under normal or unstressed conditions, Nrf2 resides in the cytoplasm of the cell, outside the nucleus, and is targeted for degradation. When activated, Nrf2 is able to move into the nucleus where it promotes the expression of several hundred genes, including those that encode antioxidant enzymes as well as anti-inflammatory and stress response proteins.
7
In recent years, Nrf2 has become the subject of intense research. A common theme in much of this research is that activation of Nrf2 upregulates a coordinated antioxidant response and is therefore capable of protecting against oxidative stress-related injury and inflammatory disease in a wide variety of animal models. Therefore, Nrf2 represents an important therapeutic target.
NRF1 Activation
Nuclear Respiratory Factor 1 or NRF1 is a transcription factor that contributes to the expression of many genes required for the maintenance and function of the mitochondria. Mitochondria are subcellular self-autonomous organelles and are primarily responsible for the generation of the chemical energy (ATP) that cells require to stay alive. Mitochondria constantly expand and divide based on the demand of the tissue cells in which they reside. They also play an important role in triggering the signaling cascade that results in the death of cells (apoptosis). Proper regulation of these mitochondrial functions is vitally important for the life and death of cells and for human health.
Dysfunction of mitochondria has been associated with many chronic diseases in a wide variety of animal models. Therefore, the upregulation of NRF1 represents an important therapeutic target to support the proper function of mitochondria and human health.
Research and Development
Historically, we have focused our research and development efforts on creating and supporting scientifically-validated products under the Protandim®, TrueScience®, Petandim™ for Dogs, Axio®, PhysIQ™, and Omega+ federation of brands. We anticipate that our future research and development efforts will be focused on creating, developing and evaluating new products that are consistent with our commitment to provide quality, scientifically-validated products. We intend to build on our foundation of combating oxidative stress and targeting specific benefit areas through biohacking that help individuals feel, look and perform better. We also plan to continue sponsoring additional studies on our current products in an effort to further validate the benefits they provide.
Product Overview
Product Stacking
A stack is multiple products bundled together designed to achieve a specific result. By studying the effects of nutrients and natural compounds, we have developed scientifically-backed nutrigenomics products that promote healthy aging on the cellular level. By stacking these products together, we have created a foundation for biohacking a healthier life.
The Vitality Stack is designed to provide a great foundation for wellness. It includes four of our nutrigenomics products that help support healthy organs, including the brain, heart, eyes, and other vitals. NRF1 Synergizer boosts mitochondrial function to help organs work efficiently and Nrf2 Synergizer protects those same cells from oxidative stress. Omega+ supports the cell membranes and receptors that improve the way the heart, blood, and genes function while providing the heart, eye, and brain the structural support they need. Probio provides an increased diversity of gut bacteria and beta glucans to support healthy immune function, nutrient production and balance and promote better gut-brain health. Vitality Stack is our premier product bundleand we also offer stacks for our PhysIQ™ and TrueScience® product lines.
Protandim® Nrf2 Synergizer
Protandim® Nrf2 Synergizer is a patented dietary supplement that has been shown in a clinical trial to reduce the age-dependent increase in markers of oxidative stress, and has also been shown to provide substantial benefits to combat the variety of negative health effects linked to oxidative stress.
Protandim® Nrf2 Synergizer combats oxidative stress by increasing the body’s natural antioxidant protection at the gene level. The unique blend of phytonutrients in Protandim® Nrf2 Synergizer signals the activation of Nrf2 to increase production of antioxidant enzymes, specifically superoxide dismutase and catalase, and other cell-protective gene products. The body's internally produced antioxidant enzymes provide a better defense against oxidative stress than externally derived sources of antioxidants such as Vitamin C, Vitamin E and Coenzyme Q-10. Unlike externally derived sources of antioxidants, these enzymes are “catalytic,” which means these enzymes are not used up upon neutralizing free radicals.
We hold multiple U.S. and international patents relating to Protandim® Nrf2 Synergizer. We believe these patents set Protandim® apart from other dietary supplements and protect the original formula as well as certain formula modifications we could create to extend our Protandim® product line. We sell Protandim® Nrf2 Synergizer in three formulas.
Protandim® Nrf2 Synergizer has been, and is expected to continue to be, the subject of numerous independent scientific studies at various universities and research facilities including Ohio State University, Louisiana State University, University of Colorado Denver, Virginia Commonwealth University, Colorado State University, Texas Tech University and the National
8
Institute on Aging. The results of these studies have been published in a variety of peer-reviewed scientific journals, including Free Radical Biology & Medicine, Enzyme Research, Circulation-the scientific journal of the American Heart Association, American Journal of Physiology-Lung Cellular and Molecular Physiology, PLoS One, Journal of Dietary Supplements, Molecular Aspects of Medicine, Oxidative Medicine and Cell Longevity, Exercise & Sports Science Reviews, Clinical Pharmacology, the FASEB Journal, and the Journal of Applied Physiology.
Protandim® NRF1 Synergizer
Protandim® NRF1 Synergizer is a dietary supplement which was formulated to strengthen the mitochondria, the powerhouse of all cells, for better cellular health. It is designed to work in tandem with our flagship Protandim® Nrf2 Synergizer and further enhance the body's internal ability to naturally produce antioxidants and reduce the effects of cellular stress. Protandim® NRF1 Synergizer activates NRF1, a protein that regulates the expression of genes involved in mitochondrial DNA transcription, translation and repair. The unique blend of ingredients in Protandim® NRF1 Synergizer supports the mitochondria to slow cellular aging and increase cellular energy.
Omega+
Omega+ is a dietary supplement that combines DHA and EPA Omega-3 fatty acids, Omega-7 fatty acids, and Vitamin D3 to support cognitive health, cardiovascular health, skin health, and the immune system.
PhysIQ™ Smart Weight Management System
We sell a full line of weight management products under our PhysIQ™ brand, which consists of:
• | PhysIQ™ Fat Burn: a supplement containing natural active ingredients to stimulate the breakdown of abdominal fat, increase energy and support long-term weight management. |
• | PhysIQ™ Probio: a supplement designed to support long-term gut health by restoring healthy gut bacteria to support digestive system health. |
• | PhysIQ™ Cleanse: a supplement designed to stimulate healthy digestion and regularity and supports the cleansing of your digestive system. |
• | PhysIQ™ Protein Shake: a combination of fast and slow release proteins designed to satisfy hunger and deliver amino acids to support quick recovery and improved muscle synthesis. |
◦ | PhysIQ™ Beauty: strawberry-flavored PhysIQ Protein shake add-on that works to support and maintain skin health. |
◦ | PhysIQ™ Curb: chocolate-flavored PhysIQ Protein shake add-on that helps to curb appetite. |
LifeVantage TrueScience®
We sell a full line of anti-aging skin care products under our LifeVantage TrueScience® brand, which consists of:
• | TrueScience® Facial Cleanser: a concentrated, ultra-rich cleanser used to remove impurities and light make-up without drying or stripping natural oils in the skin. |
• | TrueScience® Perfecting Lotion: a hybrid lotion formulated for smoother, radiant and brighter looking skin. |
• | TrueScience® Eye Serum: a serum that noticeably improves the visible signs of fine lines, creases and wrinkles around the entire eye area, diminishes puffiness above and below the eye, firms and tightens the upper eyelid area and evens skin tone and dark circles that are visible signs of aging. |
• | TrueScience® Anti-Aging Cream: a cream that deeply moisturizes and helps to combat the appearance of fine lines and wrinkles. |
• | TrueScience® Micro-Lift Serum: a serum that tightens and smooths skin around eyes to combat the appearance of fine lines and wrinkles. |
• | TrueScience® Hand Cream: a cream formulated with Nrf2 ingredients to moisturize skin and improve the visible signs of premature aging on the hands. |
Our TrueScience® Beauty System includes the following products in a TSA-compliant set: TrueScience® Facial Cleanser, TrueScience® Perfecting Lotion, TrueScience® Eye Serum, and TrueScience® Anti-Aging Cream.
9
We received two composition patents for our LifeVantage TrueScience® skin care products, which were tested in an independent third-party clinical study and shown to reduce the visible signs of aging by utilizing Nrf2 technology to mitigate the visible effects of skin damage caused by oxidative stress. Our LifeVantage TrueScience® skin care products leverage our research on Nrf2 activation and oxidative stress.
Petandim™ for Dogs
Petandim™ for Dogs is a supplement specially formulated to combat oxidative stress in dogs through Nrf2 activation. Petandim™ for Dogs builds upon the active ingredients in Protandim® Nrf2 Synergizer to reduce oxidative stress and support joint function, mobility and flexibility in dogs. Petandim™ for Dogs received the Quality Seal from the National Animal Supplement Council.
Axio®
Axio® is our line of Smart Energy Drink mixes, formulated to promote alertness and support mental performance. These energy drink powders deliver sustained energy, as well as improved mental focus and promote a positive mood. Axio® is derived from a unique combination of scientifically-validated ingredients.
Distribution of Products
We believe our products are well suited for person-to-person sales through our direct selling model. This model allows our independent distributors to educate our customers regarding the benefits of our unique products more thoroughly than other business models. Our direct selling model also allows our independent distributors to offer personalized customer service to our customers and encourage regular use of our products.
Product Return Policy
All products purchased directly from us include a customer satisfaction guarantee. Subject to some exceptions based on local regulations, customers may return unopened product to us within 30 days of purchase for a refund of the purchase price less shipping and handling. In addition, our inventory repurchase program allows independent distributors who terminate their distributorship to return certain amounts of unopened, unexpired product purchased within the prior 12 months for a refund of the purchase price less a 10% restocking fee. The amount of inventory we will repurchase from an independent distributor is subject to specified consumption limitations.
Customers
We generally categorize our customers as independent distributors and customers.
Independent Distributors
An independent distributor in our company is someone who participates in our direct sales business opportunity by purchasing our products at wholesale prices and selling our products to others. We believe our independent distributors are typically entrepreneurs who believe in our products and desire to earn income by building a business of their own. Many of our independent distributors are attracted by the opportunity to sell unique, scientifically-validated products without incurring significant start-up costs. Independent distributors sign a contract with us that includes a requirement that they adhere to strict policies and procedures. Independent distributors purchase product from us for individual consumption, but also purchase small quantities of product from us to use for demonstrations and one-off, person-to-person retailing opportunities. They also encourage others to purchase our products, either for personal consumption or resale.
While we provide support, product samples, brochures, magazines, and other sales and marketing materials, independent distributors are primarily responsible for attracting, enrolling and educating new independent distributors with respect to our products and compensation plan. An independent distributor creates multiple levels of compensation by selling our products and enrolling new independent distributors who sell our products. These newly enrolled independent distributors form a “downline” for the independent distributor who enrolled them. If downline independent distributors enroll new independent distributors who purchase our products, they create additional levels of compensation and their downline independent distributors remain in the same downline network as the original enrolling independent distributor. We pay commissions only upon the sale of our products. We do not pay commissions for enrolling independent distributors.
We define “active independent distributors” as those independent distributors who have purchased product from us for retail or personal consumption during the prior three months. As of June 30, 2018 and 2017, we had approximately 63,000 and 64,000 active independent distributors, respectively.
10
Independent Distributor Compensation
We believe our compensation plan is one of the more financially rewarding in the direct selling industry. Our percentage of sales paid to independent distributors as compensation and incentives is one of the highest percentages reported in the direct selling industry. Some elements of our compensation plan are paid weekly. We believe this gives us a competitive advantage and helps retain new distributors by allowing them to experience success quickly from their efforts. Our compensation plan is intended to appeal to a broad cross-section of people, particularly those seeking to supplement family income, start a home-based business or pursue entrepreneurial opportunities full- or part-time. Our independent distributors earn compensation on their product sales and product sales made by independent distributors within their sales organization, or "downline." Our independent distributors can also earn money by purchasing product from us at our wholesale cost and selling that product to others at the retail cost. We generally pay commissions in the local currency of the independent distributor’s home country.
Independent Distributor Motivation and Training
Our revenue depends in part on the success and productivity of our independent distributors. We provide tools, training and technology designed to increase our independent distributors' productivity and increase their potential for success. We offer training and business development opportunities to our independent distributors, including the following:
• | Blueprint: professionally-designed training materials independent distributors can utilize in their sales efforts; |
• | Pro Audio Series: our weekly audio series presented by our independent distributor leaders providing training and tips on becoming more productive independent distributors; |
• | Elite Academy and Global Convention: regularly occurring company-sponsored events intended to provide training and motivation to our independent distributors; |
• | Promotions and Incentive Trips: we hold special promotions and incentive trips from time to time in order to motivate our independent distributors to accomplish specific sales goals; and |
• | Mobile Application: The LifeVantage app was designed to allow users to conduct any aspect of their business on a single platform from anywhere in the world. Ultimately, through artificial intelligence and machine learning, we expect that the app will be able to guide users on what to share, when to share it, and with whom. |
We are continuing to evaluate new ways in which to incorporate new technology and training opportunities to improve distributor success.
Distributor Compliance Activities
Given that our independent distributors are independent contractors, we do not control or direct their promotional efforts. We do, however, require that our independent distributors abide by policies and procedures that require them to act in an ethical manner and in compliance with applicable laws and regulations. As a member of the United States Direct Selling Association and similar organizations in many of the markets where we do business, we are also subject to the ethical business practices and consumer service standards required by the industry's code of ethics.
Independent distributors must represent to us that their receipt of commissions is based on retail sales and substantial personal sales efforts. We must produce or pre-approve all sales aids used by distributors such as brochures and online materials. Products may be promoted only by personal contact or by collateral materials produced or approved by us. Independent distributors may not use our trademarks or other intellectual property without our consent.
We monitor and systematically review alleged independent distributor misbehavior through our internal compliance department. If we determine one of our independent distributors has violated any of our policies and procedures, we may discipline the independent distributor and may terminate the independent distributor’s rights to distribute our products. When necessary, we have brought legal action against independent distributors, or former independent distributors, to enforce our policies and procedures. Short of termination or legal action, we may impose sanctions against independent distributors whose actions are in violation of our policies and procedures. Such sanctions may include warnings, probation, withdrawal or denial of an award, suspension of privileges of a distributorship, fines and/or withholding of commissions until specified conditions are satisfied, or other appropriate injunctive relief.
Customers
Customers purchase products directly from us at our wholesale price on a monthly subscription basis for personal consumption, without the intent to resell or earn commissions from the sale of products. A customer may enroll as an independent distributor at any time if he or she becomes interested in reselling the product. We believe our customers are a
11
great source of word-of-mouth advertising for our products. We also believe our large base of customers validates the benefits of our products, separate from the direct selling business opportunity.
We define an “active customer” as a customer who has purchased product from us within the prior three months. As of June 30, 2018 and 2017, we had approximately 116,000 and 112,000 active customers, respectively.
Sales of Our Products
We accept orders for our products through our own website at www.lifevantage.com and through personalized websites we provide to our independent distributors, which we refer to as “Virtual Offices”. Orders placed through Virtual Offices and through our website are processed daily at our fulfillment centers, where orders are shipped directly to the consumer.
We offer toll-free numbers for our independent distributors and other customers to order product or ask questions. Our customer service representatives assist customers in placing orders through our web order processing system, answering questions, tracking packages, and initiating refunds. The customer service representatives receive extensive training about our products and our direct selling business model. Independent distributors and customers generally pay for products by credit card, prior to shipment, and as a result, we carry minimal accounts receivable.
Seasonality
In addition to general economic factors, we are impacted by seasonal factors and trends such as major cultural events and vacation patterns. We believe that direct selling in Japan and the United States is also generally negatively impacted during our first fiscal quarter, from July 1 through September 30, when many individuals, including our independent distributors, traditionally take vacations.
Although our product launch process may vary by market, we may introduce new products to our independent distributors and customers through limited-time offers and promotions. The limited-time offers and promotions typically generate significant activity and a high level of purchasing, which may result in a higher than normal increase in revenue during the quarter of the limited-time offer and skew year-over-year and sequential comparisons.
Geographic Information
We sell our products in the United States, Japan, Hong Kong, Australia, Canada, Mexico, Thailand, the United Kingdom, the Netherlands, Germany and Taiwan. We also sell our products in a number of countries to customers for personal consumption only. In addition, we sell our products in China through our e-commerce business model. In fiscal year 2018, revenue generated in the United States accounted for approximately 70% of our total revenue and revenue generated from Japan accounted for approximately 21% of our total revenue. For reporting purposes, we generally divide our markets into two geographic regions: the Americas region and the Asia/Pacific & Europe region. The following table sets forth net revenue information by region for the periods indicated (in thousands):
For the fiscal years ended June 30, | ||||||||||||||||||||
2018 | 2017 | 2016 | ||||||||||||||||||
Americas | $ | 151,609 | 74.6 | % | $ | 150,841 | 75.6 | % | $ | 158,291 | 76.6 | % | ||||||||
Asia/Pacific & Europe | 51,595 | 25.4 | % | 48,648 | 24.4 | % | 48,249 | 23.4 | % | |||||||||||
Total | $ | 203,204 | 100.0 | % | $ | 199,489 | 100.0 | % | $ | 206,540 | 100.0 | % | ||||||||
Additional comparative revenue and related financial information is presented in the section captioned "Segment Information" in Note 2 to our consolidated financial statements.
Marketing
We have a sales, marketing, public relations and customer service group consisting of 109 full-time employees as of June 30, 2018. We utilize our network of independent distributors located throughout the United States, Australia, Hong Kong, Japan, Canada, Mexico, Thailand, the United Kingdom, the Netherlands, Germany and Taiwan to market and sell our products. We also market our products in a number of countries to customers for personal consumption only. In addition, we market and sell our products in China through our e-commerce business model powered by in-country social marketers
Raw Materials and Manufacturing
We outsource the primary manufacturing, fulfillment, and shipping components of our business to companies we believe possess a high degree of expertise. We believe outsourcing provides us access to advanced manufacturing process capabilities and expertise without incurring fixed costs associated with manufacturing our own products.
12
We currently outsource the manufacture of our products to multiple contract manufacturers. Our contract manufacturers of Protandim® have a legal obligation to comply with the current Good Manufacturing Practices regulations that are applicable to those who manufacture, package, label and hold dietary supplements. Additionally, we are subject to regulations that, among other things, obligate us to know what and how manufacturing activities are performed so that we can make decisions related to whether the packaged and labeled product conforms to our established specifications and whether to approve and release product for distribution. We maintain and qualify alternative manufacturing options in order to keep our costs low, maintain the quality of our products, and be prepared for unanticipated spikes in demand or manufacturing failure. Our contract manufacturers deliver products to our fulfillment centers based on our purchase orders.
We acquire raw materials for our products from third-party suppliers. Although we generally have good relationships with our suppliers, we believe we could replace any of our current suppliers without great difficulty or significant increase to our cost of goods sold. We also have ongoing relationships with secondary and tertiary suppliers. Please refer to "Risk Factors - High quality material for our products may be difficult to obtain or expensive" for a discussion of the risks and uncertainties associated with our sourcing of raw materials.
Product Liability and Other Insurance
We have product liability insurance coverage for our products that we believe is adequate for our needs. We also maintain commercial property and liability coverage and directors’ and officers’ liability insurance.
Intellectual Property
We use commercially reasonable efforts to protect our intellectual property and license rights through patent protection, trade secrets and contractual protections, and intend to continue to develop a strong brand identity for our company and our products.
Protandim® Nrf2 Synergizer is a proprietary, patented dietary supplement formulation for enhancing antioxidant enzymes including superoxide dismutase and catalase. The patents and patent applications protecting its formulations are held by our wholly-owned subsidiary, Lifeline Nutraceuticals Corporation. Our intellectual property is covered, in part, by many issued U.S. and select foreign patents to cover key markets around the world. Our patents and patent applications claim the benefit of priority of multiple U.S. provisional patent applications, the earliest of which was filed on March 23, 2004, and relate to compositions, methods of use, and methods of manufacture of various compositions, including those embodied by the Protandim® Nrf2 Synergizer formulation. The expected duration of our patent protection via granted patents for Protandim® Nrf2 Synergizer is at least through approximately March 2025 and we continue to research and file new composition and method patents in the U.S. for enhanced and improved product formulations that will extend our patent protection for a variety of product formulations and methods. During fiscal 2018, we received another composition patent for additional products within our LifeVantage TrueScience® line of skin care products. This patent expires in approximately February 2036.
We continue to protect our products and brands using trademarks. We have filed and successfully procured registered trademarks for our key brands consisting of Protandim®, LifeVantage®, and TrueScience® in many countries around the world, and we have pending trademark applications for these and other marks in many other countries. We anticipate seeking protection in other countries as we deem appropriate.
In order to protect the confidentiality of our intellectual property, including trade secrets, know-how and other proprietary technical and business information, it is our policy to limit access to such information to those who require access in order to perform their functions and to enter into agreements with employees, consultants and vendors to contractually protect such information.
Competition
Direct Selling Companies
We compete with other direct selling companies, many of which have longer operating histories and greater visibility, name recognition and financial resources than we do. We also compete with newer direct selling companies that attempt to solicit our independent distributors by offering the possibility of a more financially rewarding opportunity by being among the Company's early distributor base. We compete for new independent distributors with these companies on the basis of our business opportunity, product offerings, compensation plan, management and our operations. In order to successfully compete in the direct selling industry and attract and retain independent distributors, we must maintain the attractiveness of our business opportunity, product offerings and compensation plan.
Dietary Supplement Market
We compete with other companies that sell dietary supplements. We believe the dietary supplement market is a highly fragmented and competitive market. We believe competition in the dietary supplement market is based primarily on quality,
13
price, efficacy of products, brand name and recognition of product benefits. In the dietary supplement industry, our competition includes numerous nutritional supplement companies, pharmaceutical companies and packaged food and beverage companies. Many of these companies have broader product lines, larger sales volumes and greater financial resources than we do. Additionally, some of these companies are able to compete more effectively due to greater vertical integration. Increased competition in the dietary supplement market could have a material adverse effect on our results of operations and financial condition.
Nrf2 Activators
In the last few years we have seen the number of products marketed as Nrf2 activators increase. We anticipate the number of products that claim to activate Nrf2 will continue to increase as the technology becomes more popular and more broadly accepted.
Direct Antioxidants
Vitamin C, Vitamin E, Coenzyme Q-10, and other sources of externally derived antioxidants may be considered competitors of Protandim® but they are mechanistically distinct from Protandim®. These other sources of antioxidants do not increase the body’s elimination of oxidants using internal antioxidant enzymes. Our research indicates that Protandim® increases production of hundreds of stress-related anti-inflammatory, and anti-fibrotic gene products including antioxidant enzymes, such as superoxide dismutase and catalase, within the cells of the body. We believe that the body’s internally produced antioxidant enzymes provide a better defense against oxidative stress than externally derived sources of antioxidants.
Oral Superoxide Dismutase and Catalase
There are many companies performing research into antioxidants. Several companies sell oral forms of superoxide dismutase and catalase. Although we believe Protandim® is a superior alternative to oral forms of superoxide dismutase and catalase, these products do compete with Protandim® in the marketplace. We anticipate additional companies will likely develop, purchase or in-license products that are competitive with Protandim®.
Omega Fatty Acid Products
There are many companies that market Omega supplements, including Omega-3. Although Omega+ contains a unique combination of DHA and EPA Omega-3 fatty acids, Omega-7 fatty acids, and Vitamin D3, we anticipate additional companies will likely develop products that are competitive with Omega+.
Personal Skin Care Market
In the personal skin care market, we compete principally with large, well-known cosmetics companies that manufacture and sell broad product lines through retail establishments. Many of these competitors have greater financial resources and brand recognition than we do. We believe, however, we can compete with these larger companies by leveraging our direct selling model and emphasizing our unique, science-based skin care products.
Animal Supplement Market
We compete principally with large, well-known companies in the animal supplement market. Most of the companies we compete with in the animal supplement market have broad distribution channels that include retail establishments. Many of these competitors have greater financial resources and brand recognition than we do. We believe, however, we can compete with these larger companies by leveraging our direct selling model and emphasizing our unique, science-based animal supplement product.
Energy Drink Market
We compete with large, well-known companies in the energy drink market. Most of the companies we compete with in the energy drink market have broad distribution channels that include big box retail establishments. Many of these competitors have greater financial resources and brand recognition than we do. We intend to compete with these larger companies by leveraging our direct selling model and emphasizing our unique, science-based energy drink product. Axio® is a no sugar, low-carbohydrate and low calorie energy drink that is also non-GMO, gluten-free and vegan.
Weight Management Market
We compete with large, well-known companies in the weight management market. Most of the companies we compete with in the weight management market have broad distribution channels that include big box retail establishments. Many of these competitors have greater financial resources and brand recognition than we do. We intend to compete with these larger companies by leveraging our direct selling model and emphasizing our unique, science-based weight management products.
14
Regulatory Environment
The formulation, manufacturing, packaging, labeling, and advertising of our products in the United States are subject to regulation by the Food and Drug Administration, or FDA, and the Federal Trade Commission, or FTC, as well as comparable state laws.
FDA Regulations and DSHEA
We market our Protandim® products as “dietary supplements” as defined in the Dietary Supplement Health and Education Act of 1994, or DSHEA. DSHEA is intended to promote access to safe, quality dietary supplements, and information about dietary supplements. DSHEA established a new framework governing the composition and labeling of dietary supplements. DSHEA does not apply to animal supplements like Petandim™ for Dogs. We are not required to obtain FDA pre-market approval to sell our products in the United States under current laws.
DSHEA permits statements of nutritional support, called “structure-function” statements, to be included in labeling for dietary supplements without FDA marketing approval. Such statements may claim a benefit related to a classical nutrient deficiency disease and disclose the prevalence of such disease in the United States, describe the role of a nutrient or dietary ingredient intended to affect the structure or function in humans, characterize the documented mechanism by which a nutrient or dietary ingredient acts to maintain such structure or function, or describe general well-being from consumption of a nutrient or dietary ingredient. Such statements may not expressly or impliedly claim that a dietary supplement is intended to diagnose, cure, mitigate, treat, or prevent a disease. A company that uses a statement of nutritional support in labeling must possess evidence substantiating that the statement is truthful and not misleading and is supported by competent and reliable scientific evidence.
The FDA may assert that a particular statement of nutritional support that a company is using is an illegal claim; that assertion, normally, is in the form of a warning letter to that company. We have a duty to send to the FDA a notice that lists each new structure-function statement made by us; we are obligated to send that notice within 30 days after the first marketing of a supplement with such a statement.
DSHEA also permits certain scientific literature, for example a reprint of a peer-reviewed scientific publication, to be used in connection with the sale of a dietary supplement to consumers without the literature being subject to regulation as labeling. However, such literature must not be false or misleading, the literature may not promote a particular manufacturer or brand of dietary supplement and it must include a balanced view of the available scientific information on the subject matter, among other requirements.
The FDA's Center for Veterinary Medicine, or CVM, is responsible for enforcing the portion of the Federal Food, Drug, and Cosmetic Act, or the Act, that relates to animal supplements, like our Petandim™ for Dogs product. CVM's primary responsibility in enforcing the Act is to ensure that animal supplements are safe, effective, and can be manufactured to a consistent standard. CVM has taken the position that DSHEA does not apply to products intended for animals, but it is clear that products like Petandim™ for Dogs are under FDA jurisdiction.
Our Petandim™ for Dogs product follows the labeling rules of the National Animal Supplement Council (NASC) of which LifeVantage is a member. Under the NASC rules, Petandim™ for Dogs is classified as a dosage form animal health product.
While we exercise care in our formulation, manufacturing, packaging, labeling, and advertising of our products, we cannot guarantee the FDA will never inform us that the FDA believes some violation of law has occurred either by us or by our independent distributors. Any allegations of our non-compliance may result in time-consuming and expensive defense of our activities. The FDA’s normal course of action is to issue a warning letter if it believes that a product is misbranded or adulterated. The responsive action requested by the FDA differs depending upon the nature of the product and claims in question. Typically, the FDA expects a written response within 15 working days of the receipt of a warning letter. The warning letter is public information posted on the FDA’s web site. That information could affect our relationships with our investors, independent distributors, vendors, and consumers. Warning letters also often spark private class action litigation under state consumer protection statutes. The FDA could also order compliance activities, such as an inspection of our facilities and products, and could file a civil lawsuit in which an arrest warrant (seizure) could be issued as to some or all of our products. In extraordinary cases, we could be named a defendant and sued for declaratory and injunctive relief.
FTC Regulations
Advertising and marketing of our products in the United States are also subject to regulation by the FTC under the Federal Trade Commission Act, or FTC Act. Among other things, the FTC Act prohibits unfair methods of competition and unfair false or deceptive acts or practices in or affecting commerce. The FTC Act also makes it illegal to disseminate or cause to be disseminated any false advertisement. The FTC Act provides that disseminating any false advertisement pertaining to foods, which would include dietary supplements, is an unfair or deceptive act or practice. An advertiser is required to have competent
15
and reliable scientific evidence for all express and implied health-related product claims at the time the claims are first made. We are required to have adequate scientific substantiation for all material advertising claims made for our products in the United States. The FTC routinely reviews websites to identify questionable advertising claims and practices. Competitors sometimes inform the FTC when they believe other competitors are violating the FTC Act and consumers also notify the FTC of what they believe may be wrongful advertising. The FTC may initiate a non-public investigation that focuses on our advertising claims which usually involves non-public pre-lawsuit extensive formal discovery. Such an investigation may be very expensive to defend, be lengthy, and result in a publicly disclosed Consent Decree, which is a settlement agreement. If no settlement can be reached, the FTC may start an administrative proceeding or a federal court lawsuit against us or our principal officers. The FTC often seeks to recover from the defendants, whether in a Consent Decree or a proceeding, any or all of the following: (i) consumer redress in the form of monetary relief or disgorgement of profits; (ii) significant reporting requirements for several years; and (iii) injunctive relief. In addition, most, if not all, states have statutes prohibiting deceptive and unfair acts and practices. The requirements under these state statutes are similar to those of the FTC Act.
The National Advertising Division, or NAD, of the national Better Business Bureau, a non-governmental not-for-profit organization through its Advertising Self-Regulatory Council, or ASRC, is also actively engaged in conducting investigations, called inquiries, which are focused on determining whether the requisite claim substantiation standard exists for specific structure-function claims. Although the results of each inquiry or proceeding are not binding on the recipient, they are posted on NAD’s website, and the NAD often refers cases to the FTC if the advertisers do not agree to modify their advertising in conformance with the NAD decision. We have been the subject of a NAD proceeding in 2008 and 2009, which was concluded in 2009.
Regulation of Direct Selling Activities
Direct selling activities are regulated by the FTC, as well as various federal, state and local governmental agencies in the United States and foreign countries. These laws and regulations are generally intended to prevent fraudulent or deceptive schemes, often referred to as “pyramid” schemes, which compensate participants primarily for recruiting additional participants without significant emphasis on product sales. The laws and regulations often:
• | require us or our distributors to register with governmental agencies; |
• | impose caps on the amount of commission we can pay; |
• | impose reporting requirements; and |
• | require that we ensure, among other things, that our distributors maintain levels of product sales to qualify to receive commissions and that our distributors are being compensated primarily for sales of products and not primarily for recruiting additional participants. |
The laws and regulations governing direct selling are modified from time to time, and, like other direct selling companies, we may be subject from time to time to government investigations related to our direct selling activities. This may require us to make changes to our business model and our compensation plan.
State Regulations
In addition to United States federal regulation, each state has enacted its own food and drug laws. We may receive requests to supply information regarding our sales or advertising to state regulatory agencies. We remain subject to the risk that, in one or more of our present or future markets, our products, sales, and advertising could be found non-compliant with state laws and regulations. If we fail to comply with these laws and regulations, it could have a material adverse effect on our business in a particular market or in general. In addition, these laws and regulations could affect our ability to enter new markets.
The FDA Food Safety Modernization Act
The FDA Food Safety Modernization Act, or FSMA, was enacted in 2011 and is now part of the Federal Food, Drug and Cosmetic Act, or FFDCA. The FSMA is a comprehensive set of laws that gives the FDA considerable authority with respect to the prevention of food contamination and the serious problems associated with such contamination. Among other things, it does the following:
• | gives the FDA explicit authority to compel a recall if the FDA believes there is a reasonable probability of serious adverse health consequences or death; |
• | places strict obligations on food and dietary supplement importers to verify that food from foreign suppliers is not adulterated or misbranded; and |
16
• | provides whistle blower protection for employees of conventional food or dietary supplement companies who provide information to governmental authorities about violations of the FFDCA. |
International Regulations
In addition to the regulations applicable to our activities in the United States, all other markets in which we operate our business regulate our products under a variety of statutory and regulatory schemes. We typically market our Protandim® line of products in international markets as foods, health foods or dietary supplements under applicable regulatory regimes. However, because of varied regulations, some products or ingredients that are recognized as a “food” in certain markets may be treated as a “pharmaceutical” or equivalent in other markets. In the event a product, or an ingredient in a product, is classified as a drug or pharmaceutical product in any market, we will generally not be able to distribute that product through our distribution channel because of pre-marketing approval requirements and strict regulations applicable to drug and pharmaceutical products. In Japan, for example, ashwagandha was determined to be inappropriate for inclusion in food products. Ashwagandha is one of the ingredients in Protandim® Nrf2 Synergizer. While we disagree with the assessment of ashwagandha by Japanese regulatory authorities, we are restricted from selling a formulation of Protandim® Nrf2 Synergizer that contains ashwagandha in Japan. As such, we reformulated Protandim® Nrf2 Synergizer for the Japan market to exclude ashwagandha. This reformulated Protandim® Nrf2 Synergizer was introduced in Japan in fiscal 2013.
Similarly, our other markets outside the United States regulate advertising and product claims regarding the efficacy of our products and require adequate substantiation of claims. As such, we are unable to claim that any of our products will diagnose, cure, mitigate, treat or prevent diseases. For example, in Japan, Protandim® Nrf2 Synergizer is considered a food product, which significantly limits our ability to make claims regarding the product. If marketing materials make claims that exceed the scope of allowed claims for dietary supplements, regulatory authorities could deem our products to be unapproved drugs and we could experience substantial harm.
Our business model is also subject to regulatory frameworks that may limit or significantly alter the way business is done in foreign markets vis-à-vis the United States. For example, our marketing of products or business opportunity as a distributor in the United Kingdom differs significantly from marketing to United States customers and distributors. Consequently, we may experience additional costs and delays in entering or continuing to do business in foreign markets in order to comply with local regulations.
Potential FDA and Other Regulation
We could become subject to additional laws or regulations administered by the FDA, FTC, or other federal, state, local or international regulatory authorities, to the repeal of laws or regulations that we consider favorable, such as DSHEA, or to more stringent interpretations of current laws or regulations. Because of negative publicity associated with some adulterated or misbranded supplements, including pharmaceutical drugs marketed as dietary supplements, there has been an increased movement in the United States and other markets to expand the regulation of dietary supplements, which could impose additional restrictions or requirements in the future. In recent years, there also has been increased pressure in the United States to enhance regulation of cosmetics. In general, the regulatory environment is becoming more complex with increasingly strict regulations.
The Dietary Supplement and Nonprescription Drug Consumer Protection Act requires us to report to the FDA all serious adverse events and to maintain for six years records of all adverse events, whether or not serious. An adverse event is defined as any health-related event associated with the use of a dietary supplement that is adverse. In addition, this law requires the label of each dietary supplement, including our Protandim® products, to include a domestic address or telephone number by which the company selling the product may receive a report of a serious adverse event associated with such product. The labels of our Protandim® products comply with that statutory provision.
Employees
As of June 30, 2018 and 2017, we had 220 and 211 full-time employees, respectively. As of June 30, 2018, 175 of our full-time employees were based in the United States, 30 were based in Japan, nine were based in Thailand, four were based in Hong Kong and two were based in the Netherlands. We do not include our independent distributors in our number of employees because our independent distributors are independent contractors and not employees. We outsource our manufacturing and distribution operations.
Available Information
Our principal offices are located at 9785 S. Monroe Street, Suite 400, Sandy, UT 84070. Our telephone number is (801) 432-9000 and our fax number is (801) 880-0699. Our website address is www.lifevantage.com; however, information
17
found on our website is not incorporated by reference into this report. Our website address is included in this annual report as an inactive textual reference only.
The reports filed with the Securities and Exchange Commission, or SEC, by us and by our officers, directors, and significant shareholders are available for review on the SEC’s website at www.sec.gov. You may also read and copy materials that we file with the SEC at the SEC’s Public Reference Room at 100 F Street, NE, Washington, DC 20549. You may obtain information on the operation of the Public Reference Room by calling the SEC at 1-800-SEC-0330.
ITEM 1A — RISK FACTORS
Because of the following risks, as well as other risks affecting our financial condition and operating results, past financial performance should not be considered to be a reliable indicator of future performance, and investors should not use historical trends to anticipate results or trends in future periods. The risks described below are those we currently believe could materially affect us. The following risks are not necessarily all of the important factors that could cause our actual results of operations to differ materially from those expressed in the forward-looking statements in this report.
Risks Relating to Our Company
An inability to properly motivate and manage our independent distributors could harm our business.
Motivating our independent distributors and providing them with appropriate resources, including technology, tools and training, are important to the growth and success of our business. From time to time, we face challenges in motivating and managing our independent distributors. For example, as we previously disclosed in Item 9A of our Annual Report on Form 10-K for the year ended June 30, 2016, the audit committee of our board of directors conducted an independent review related to the distribution of our products into countries outside the U.S. in which those products were not registered or that otherwise imposed stringent restrictions on our direct selling model, and the associated revenue and tax and other accruals associated with such sales. This independent review was initiated following internal reviews conducted by Company personnel and was further informed by the content of employee complaints. Actions we take from time to time to enforce our policies and procedures, may cause discord among some of our independent distributors. The loss of key distributors due to various factors including, but not limited to, voluntary termination or involuntary termination or suspension resulting from non-compliance with our policies and procedures, could distract our distributors and disrupt our business. For example, in the past, we have experienced discord among our leading independent distributors in Japan, which is a significant part of our business. If we fail to properly manage any discord among our leading independent distributors in Japan and other markets, we could lose additional leaders, including to competing direct selling companies, which could have a significant negative impact on our revenue. Further, from time to time, we are involved in legal proceedings with former distributors. Such legal proceedings can be a distraction to our active independent distributors and can be expensive, time-consuming and cause a disruption to our business. Our inability to properly manage these and other distractions may have a negative impact on our business.
We may not be successful in expanding our operations.
We may not be successful in expanding our operations. Although we began to sell our products through our direct selling network in fiscal year 2009, we still have limited experience in selling our products through direct selling compared to other companies in our industry. As such, we may have limited insight into trends, disruptions and other factors that may emerge and affect our business. For example, from time to time, we are obliged to terminate one or more of our independent distributors for actions contrary to their contractual obligations with us. In the past, some of these terminations have caused disruption among our independent distributors, and such terminations or resulting disruption in the future may slow our growth. Additionally, we may not be successful in keeping our leading independent distributors focused and motivated or in aligning their goals with the goals of our company. We also have limited experience expanding into new geographic markets. This limited experience was a contributing factor to the conduct that led to the independent review conducted by our audit committee in 2016. Although we are seeking to continue our expansion, if we fail to effectively expand our operations into additional markets, we may be unable to generate consistent operating profit growth in future periods.
If we are able to expand our operations, we may be unable to successfully manage our future growth.
Our business has grown significantly since we initiated our direct selling model in fiscal 2009. This growth placed substantial strain on our management, operational, financial and other resources. If we are able to continue expanding our operations in the United States and in other countries where we believe our products will be successful, such expansion could place increased strain on our management, operational, financial and other resources. In addition, an inability to leverage our current resources in an efficient manner could have a material adverse effect on our business, operating margins and results of operations.
We may not succeed in growing existing markets or opening new markets.
We sell our products in the United States, Japan, Hong Kong, Australia, Canada, Mexico, Thailand, the United Kingdom,
18
the Netherlands, Germany and Taiwan. We also sell our products in a number of countries to customers for personal consumption only. In addition, we sell our products in China through our e-commerce business model. In fiscal 2018, we generated approximately 30% of our revenues from our international operations, most of which was generated from Japan. We believe that our ability to achieve future growth is dependent in part on our ability to effectively expand into new international markets. In some of our international markets, we have experienced unexpected difficulties which have resulted in adverse consequences to our business and financial results, including slower than anticipated growth, the closure of one of our markets (the Philippines) and disruption to our business as we implemented changes to our systems and distributor enrollment requirements as a result of the independent review conducted by our audit committee in 2016. Our business and financial results may also be negatively impacted if a particular market or new business model, such as our China e-commerce business model, is not widely accepted and adopted. We must overcome significant regulatory and legal barriers before we can begin marketing in any international market. Also, before marketing commences in a new country or market, it is difficult to assess the extent to which our products and sales techniques will be accepted or successful in any given country. In addition to significant regulatory barriers, we may also encounter problems conducting operations in new markets with different cultures and legal systems from those encountered elsewhere. We may be required to reformulate one or more of our products before commencing sales of that product in a given country. Once we have entered a market, we must adhere to the regulatory and legal requirements of that market. We may not be able to obtain and retain necessary permits and approvals in new markets, or we may have insufficient capital to finance our expansion efforts in a timely manner.
Our independent distributors could fail to comply with applicable legal requirements or our distributor policies and procedures, which could result in claims against us that could harm our business.
Our independent distributors are independent contractors and, accordingly, we are not in a position to directly provide the same oversight, direction and motivation as we would if they were our employees. As a result, there can be no assurance that our independent distributors will comply with applicable laws or regulations or our distributor policies and procedures, participate in our marketing strategies or plans, or accept our introduction of new products.
Extensive federal, state, local and international laws regulate our business, products and direct selling activities. Because we have expanded into foreign countries, our policies and procedures for our independent distributors differ slightly in some countries due to the different legal requirements of each country in which we do business. In addition, as we have expanded internationally, some of our distributors have carried or shipped our products into countries in which such products are not registered or that otherwise impose stringent restrictions on our direct selling model. While we have taken steps to stop or restrict these sales from occurring, including through our distributor policies and procedures, it can be difficult to enforce these policies and procedures because of the large number of distributors and their independent status. If relevant regulatory authorities determined that any such activities are not compliant with all regulatory requirements, we could be subject to related fines, penalties and other assessments. Activities by our independent distributors that violate applicable laws or regulations could result in government or third-party actions against us, which could harm our business. In addition, violations by our independent distributors of our policies and procedures could reflect negatively on our products and operations and harm our business reputation. Further, it is possible that a court could hold us civilly or criminally accountable based on vicarious liability because of the actions of our independent distributors. In the past, we have had independent distributors investigated by government agencies for conduct violating the law and our policies. This type of investigation can have an adverse effect on us even if we are not involved in the independent distributor's activities.
Inability of new products and technological innovations to gain distributor or market acceptance could harm our business.
We believe our ability to introduce new products that gain acceptance among our distributors and customers is an important part of our ability to grow our revenue in future periods. However, any new products we introduce may not gain distributor and market acceptance to the extent we anticipate or project. Factors that could affect our ability to introduce new products include, among others, government regulations, the inability to attract and retain qualified research and development staff, the termination of third-party research and collaborative arrangements, proprietary protections of competitors that may limit our ability to offer comparable products and the difficulties in anticipating changes in consumer tastes and buying preferences. In addition, new products we introduce may not be successful or generate substantial revenue. The introduction of a new product could also negatively impact other product lines to the extent our distributor leaders focus their efforts on the new product instead of an existing product. If any of our products fails to gain distributor acceptance, we could see an increase in product returns.
In addition, we believe our ability to introduce new technologies that gain acceptance among our distributors and customers is an important part of our ability to grow our revenue in future periods. However, these or other new technologies that we introduce may not gain distributor acceptance to the extent we anticipate or project.
Our business and stock price may be adversely affected if our internal control over financial reporting is not effective.
19
As a public company, we are required to maintain internal controls over financial reporting and to report any material weaknesses in such internal controls. Section 404 of the Sarbanes-Oxley Act of 2002 (the Sarbanes-Oxley Act) requires that we evaluate and determine the effectiveness of our internal controls over financial reporting and provide a management report on the internal controls over financial reporting, which must be attested to by our independent registered public accounting firm.
In September 2016, our audit committee, with the assistance of outside legal counsel, commenced an independent review related to the distribution of our products into countries outside the U.S. in which such products are not registered or that otherwise impose stringent restrictions on our direct selling model, and the associated revenue and tax and other accruals associated with such sales. Based on its review, the audit committee determined that we had sold our products to independent distributors who carried or shipped such products primarily into four countries outside the U.S. in which those products are not registered or that otherwise impose stringent restrictions on our direct selling model and that we had allowed individuals who were resident in countries that impose stringent restrictions on our direct selling model to enroll as our independent distributors. Accordingly, we concluded that we had a material weakness in our internal control over financial reporting related to our business policies, practices, monitoring and training governing our international business operations, including the sale and distribution of our products in international markets. A “material weakness” is a deficiency, or a combination of deficiencies, in internal control over financial reporting such that there is a reasonable possibility that a material misstatement of our annual or interim financial statements will not be prevented or detected on a timely basis. We also evaluated the effectiveness of the design and operation of our disclosure controls and procedures as of June 30, 2016 and concluded that our disclosure controls and procedures were not effective as of that date, because of the material weakness in our internal control over financial reporting.
We adopted various measures that were designed to remediate the material weakness in our internal control over financial reporting, including the development and implementation of new control policies and procedures regarding the international business policies, practices, monitoring and training for each country outside the U.S. in which we do business. However, we cannot assure you that significant deficiencies or material weaknesses in our internal control over financial reporting will not exist in the future. Any failure to maintain or implement required new or improved controls, or any difficulties we encounter in their implementation, could result in significant deficiencies or material weaknesses, cause us to fail to timely meet our periodic reporting obligations, or result in material misstatements in our financial statements. Any such failure could also adversely affect the results of periodic management evaluations and annual auditor attestation reports regarding disclosure controls and the effectiveness of our internal control over financial reporting required under Section 404 of the Sarbanes-Oxley Act of 2002 and the rules promulgated thereunder. The existence of a material weakness could result in errors in our financial statements that could result in a restatement of financial statements, cause us to fail to timely meet our reporting obligations and cause investors to lose confidence in our reported financial information, leading to a decline in our stock price.
Our business could be negatively impacted if we fail to execute our product launch process due to increased pressure on our supply chain, information systems and management.
Although our product launch process may vary by market, we generally introduce new products to our independent distributors and customers through live cyber launches, limited-time offers and promotions. The limited-time offers typically generate significant activity and a high level of purchasing, which may result in a higher than normal increase in revenue during the quarter of the limited-time offer and skew year-over-year and sequential comparisons. We may experience difficulty effectively managing growth associated with these limited-time offers. In addition, the size and condensed schedule of these product launches increases pressure on our supply chain. If we are unable to accurately forecast sales levels in each market, obtain sufficient ingredients or produce a sufficient supply to meet demand, we may incur higher expedited shipping costs and we may temporarily run out of stock of certain products, which could negatively impact the enthusiasm of our independent distributors and customers. Conversely, if demand does not meet our expectations for a product launch, we could incur increased inventory write-offs. Any inventory write-off would negatively impact our gross margins. In addition, our order processing systems could have difficulties handling the high volume of orders generated by limited-time offers. Although our previous limited-time offers have not materially affected our product return rate, these events may increase our product return rate in the future.
Our business may be harmed if we are unable to appropriately manage our inventory.
In the past, we have experienced difficulties in appropriately managing our inventory. For example, when we launched our PhysIQ™ product line in December 2015, we experienced higher than expected demand and did not have sufficient inventory to meet demand. More recently, our inventory balances increased significantly, causing us to engage in a deliberate effort to manage our inventory balances down to levels we view as appropriate. We review all inventory items quarterly for obsolescence, and when items become obsolete or are expired we write down our inventory accordingly. If we are unable to sell our inventory in a timely manner, we may experience additional inventory obsolescence charges, including for finished products in inventory that have expired. If we are unable to appropriately manage our inventory balances, our business may be harmed.
20
We rely on our information technology systems to manage numerous aspects of our business, and a disruption in these systems could adversely affect our business.
We depend on our information technology, or IT, systems to manage numerous aspects of our business, including our finance and accounting transactions, to manage our independent distributor compensation plan and to provide analytical information to management. Our IT systems are an essential component of our business and growth strategies, and a serious disruption to our IT systems could significantly limit our ability to manage and operate our business efficiently. These systems are vulnerable to, among other things, damage and interruption from power loss or natural disasters, computer system and network failures, loss of telecommunications services, physical and electronic loss of data, security breaches and computer viruses. Any disruption could cause our business and competitive position to suffer and adversely affect our business and operating results. In addition, if we experience future growth, we will need to scale or change some of our systems to accommodate the increasing number of independent distributors and other customers.
Cyber security risks and the failure to maintain the integrity of data belonging to our company, employees, independent distributors and customers could expose us to data loss, litigation and liability, and our reputation could be significantly harmed.
We collect and retain large volumes of data relating to our business and from our employees, independent distributors and customers for business purposes, including for transactional and promotional purposes, and our various information technology systems enter, process, summarize and report such data. The integrity and protection of this data is critical to our business. We are subject to significant security and privacy regulations, as well as requirements imposed by the credit card industry. Maintaining compliance with these evolving regulations and requirements could be difficult and may increase our expenses. In addition, a penetrated or compromised data system or the intentional, inadvertent or negligent release or disclosure of data could result in theft, loss or fraudulent or unlawful use of data relating to our company or our employees, independent distributors or customers, which could harm our reputation, disrupt our operations, or result in remedial and other costs, fines or lawsuits.
Inability to comply with financial covenants imposed by our credit facility and the impact of debt service obligations and restrictive covenants could impede our operations and flexibility.
We entered into a Financing Agreement in March 2016, which was subsequently amended in May 2018, that provides for a credit facility consisting of a term loan in an aggregate principal amount of $10 million and a revolving loan facility in an aggregate principal amount not to exceed $2 million. At the end of the fiscal year ended June 30, 2018, the principal amount owing under the credit facility was approximately $5.5 million. The principal amount borrowed under the credit facility is repayable in consecutive quarterly installments. We expect to generate the cash necessary to pay the principal and interest on the credit facility from our cash flows provided by operating activities. However, our ability to meet our debt service obligations will depend on our future performance, which may be affected by financial, business, economic, demographic and other factors. If we do not have enough money to pay our debt service obligations, we may be required to refinance all or part of our debt, sell assets, borrow more money or raise cash through the sale of equity. In such an event, we may not be able to refinance our debt, sell assets, borrow more money or raise cash through the sale of equity on terms acceptable to us or at all. Also, our ability to carry out any of these activities on favorable terms, if at all, may be further impacted by any financial or credit crisis which may limit access to the credit markets and increase the cost of capital.
The credit facility is secured by a lien on substantially all of our assets, and the assets of our subsidiaries, and contains customary covenants, including affirmative and negative covenants, that restrict our ability to incur or guarantee additional indebtedness, declare or pay dividends on or redeem capital stock, make other payments to holders of our equity interests, make certain investments, purchase or otherwise acquire all or substantially all the assets or equity interests of other companies, sell our assets and enter into consolidations, mergers or transfers of all or substantially all of our assets. The credit facility requires that we maintain specified financial ratios and satisfy certain financial condition tests and meet certain informational requirements. Our ability to meet these financial ratios and tests and informational requirements can be affected by events beyond our control and we may be unable to meet these ratios and tests and informational requirements. A breach of any of the covenants, ratios, tests or restrictions imposed by the credit facility would result in an event of default and the lender could declare all amounts outstanding under the credit facility to be immediately due and payable. Our assets may not be sufficient to repay the indebtedness if the lenders accelerate our repayment of the indebtedness under the credit facility.
A substantial portion of our business is conducted in foreign markets, exposing us to the risks of trade or foreign exchange restrictions, increased tariffs, foreign currency fluctuations, disruptions or conflicts with our third-party importers and similar risks associated with foreign operations.
Global economic conditions continue to be challenging and unpredictable. A substantial portion of our sales are generated outside the United States. If we are successful in entering additional foreign markets, we anticipate that the percentage of our sales generated outside the United States will increase. There are substantial risks associated with foreign operations. For example, a foreign government may impose trade or foreign exchange restrictions, increased tariffs or other legal, tax, customs
21
or other financial burdens on us or our independent distributors, due, for example, to the structure of our operations in various markets. Any such actions could negatively impact our operations and financial results. We are also exposed to risks associated with foreign currency fluctuations. For instance, in preparing our financial statements, we translate revenue and expenses in our markets outside the United States from their local currencies into U.S. Dollars using weighted average exchange rates. If the U.S. Dollar strengthens relative to local currencies, our reported revenue, gross profit and net income will likely be reduced. Foreign currency fluctuations can also result in losses and gains resulting from translation of foreign currency denominated balances on our balance sheet. Additionally, purchases from suppliers are generally made in U.S. Dollars while sales to distributors are generally made in local currencies. Accordingly, strengthening of the U.S. Dollar versus a foreign currency could have a negative impact on us. Specifically, because a significant percentage of our revenues are generated in Japan, strengthening of the U.S. Dollar versus the Japanese yen has had and could continue to have an adverse impact on our financial results. Although we may engage in transactions intended to reduce our exposure to foreign currency fluctuations, there can be no assurance that these transactions will be effective. Given the complex global political and economic dynamics that affect exchange rate fluctuations, it is difficult to predict future fluctuations and the effect these fluctuations may have upon future reported results or our overall financial condition.
Additionally, we may be negatively impacted by conflicts with or disruptions caused or faced by third party importers, as well as conflicts between such importers and local governments or regulatory agencies. Our operations in some markets also may be adversely affected by political, economic and social instability in foreign countries.
If we are to expand our product offerings, we may need to raise additional capital.
Although we continue to introduce additional products, we primarily depend on the Protandim® product line for our revenue. We may decide to expand our product portfolio and may seek to do so by acquiring products by license or through product or company acquisitions. If cash generated from operations is insufficient to satisfy our requirements in this regard, we may need to raise additional capital, which may be dilutive to our existing shareholders. If we are unable to raise additional required capital in a timely manner, we could be forced to reduce our growth plans.
Risks Relating to Our Business and Industry
We primarily depend on a few products for our revenue.
Although we generate revenue through the sale of our Petandim™ for Dogs, Axio®, PhysIQ™ and Omega+ products, we primarily rely on our Protandim® and LifeVantage TrueScience® product lines for our revenue, which collectively represent approximately 76.6% of our total revenues and each of which account for over 10% of our total revenues. We do not currently have a broad portfolio of other products that we could rely on to support our operations if we were to experience any difficulty with the manufacture, marketing, sale or distribution of these product lines. If we are unable to sustain or increase the price or sales levels for the Protandim® and LifeVantage TrueScience® product lines, our business could be harmed.
If we are unable to retain our existing independent distributors or attract additional independent distributors, our revenue will not increase and may even decline.
Our independent distributors may terminate their services at any time, and we can and have in the past terminated distributors for conduct violative of our policies and procedures. As such, like most direct selling companies, we have experienced and are likely to continue to experience turnover among independent distributors. The departure for any reason of one of our leading independent distributors can be a major disruption to other independent distributors and can have a significant negative impact on our operating results. Independent distributors who join our company to purchase our products for personal consumption or for short-term income goals may only stay with us for a short time. While we take steps to help train, motivate, and retain independent distributors, we cannot accurately predict the number or productivity of our independent distributors.
Our operating results will be harmed if we and our independent distributor leaders do not generate sufficient interest in our business to retain existing independent distributors and attract new independent distributors. The number and productivity of our independent distributors could be harmed by several factors, including:
• | any adverse publicity regarding us, our products, our distribution channel, or our competitors; |
• | non-compliance by our independent distributors with applicable legal requirements or our policies and procedures; |
• | lack of interest in existing or new products or their failure to achieve desired results; |
• | lack of a compelling business opportunity sufficient to generate the interest and commitment of new independent distributors; |
• | any changes we might make to our independent distributor compensation plan; |
• | any negative public perception of our company or our products or their ingredients; |
22
• | any negative public perception of our independent distributors and direct selling business in general; |
• | our actions to enforce our policies and procedures; |
• | any efforts to sell our products through competitive channels; |
• | any regulatory actions or charges against us or others in our industry; and |
• | general economic and business conditions. |
High quality materials for our products may be difficult to obtain or expensive.
Raw materials account for a significant portion of our manufacturing costs and we rely on third-party suppliers to provide raw materials. Suppliers may be unable or unwilling to provide the raw materials our manufacturers need in the quantities requested, at a price we are willing to pay, or that meet our quality standards. We are also subject to potential delays in the delivery of raw materials caused by events beyond our control, including labor disputes, transportation interruptions and changes in government regulations. Our business could be adversely affected if we are unable to obtain a reliable source of any of the raw materials used in the manufacturing of our products that meets our quality standards. Additionally, if demand for our products exceeds our forecasts, we may have difficulties in obtaining additional raw materials in time to meet the excess demand. Any significant delay in or disruption of the supply of raw materials could, among other things, substantially increase the cost of such materials, require reformulation or repackaging of products, require the qualification of new suppliers, or result in our inability to meet customer demands.
Although our independent distributors are independent contractors, improper distributor actions that violate laws or regulations could harm our business.
Our independent distributors are not employees and act independent of us. However, activities by our independent distributors that violate applicable laws or regulations could result in government or third-party actions against us, which could harm our business. Our independent distributors agree to abide by our strict policies and procedures designed to ensure our independent distributors will comply with legal requirements. We have a compliance department that addresses violations of our independent distributors when they become known to us. However, given the size of our independent distributor network, we experience problems with independent distributors violating our policies and procedures from time to time and are not always able to discover or remedy such violations.
One of our most significant areas of risk with respect to independent distributor activities relates to improper product claims and claims regarding the business opportunity of being an independent distributor. Any determination by the Federal Trade Commission, any state agency or other similar governmental agency outside the United States that we or our independent distributors are not in compliance with applicable laws could materially harm our business. Even if governmental actions do not result in rulings or orders against us, they could create negative publicity that could detrimentally affect our efforts to recruit or motivate independent distributors and attract customers or lead to consumer lawsuits against us. As we experience growth in the number of our independent distributors, we have seen an increase in sales aids and promotional material being produced by distributors and distributor groups in some markets. This places an increased burden on us to monitor compliance of such materials and increases the risk that such materials could contain problematic product or marketing claims in violation of our policies and applicable regulations. As we expand internationally, our distributors sometimes attempt to anticipate additional new markets that we may enter in the future and begin marketing and sponsoring activities in markets where we are not qualified to conduct business. For example, some of our independent distributors have carried or shipped our products into countries in which such products are not registered or that otherwise impose stringent restrictions on our direct selling model. These or other activities by our independent distributors that violate applicable laws or regulations could subject us to legal or regulatory claims or actions, which could result in fines, penalties or negative publicity, any of which could have an adverse impact on our business.
We are dependent upon third parties to manufacture our products.
We currently rely on third parties to manufacture the products we sell. We are dependent on the uninterrupted and efficient operation of third party manufacturers’ facilities. We currently use multiple third-party manufacturers for our products. If any of our current manufacturers are unable or unwilling to fulfill our manufacturing requirements or seek to impose unfavorable terms, we will likely have to seek out other manufacturers, which could disrupt our operations and we may not be successful in finding alternative manufacturing resources. In addition, competitors who perform their own manufacturing may have an advantage over us with respect to pricing, availability of product, and in other areas through their control of the manufacturing process.
23
Disruptions to transportation and other distribution channels for our products may adversely affect our margins and profitability.
We generally rely on the uninterrupted and efficient operation of third-party logistics companies to transport and deliver our products. These third-party logistics companies may experience disruptions to the transportation channels used to distribute our products, including increased airport and shipping port congestion, a lack of transportation capacity, increased fuel expenses, and a shortage of manpower. Disruptions to the transportation channels experienced by our third-party logistics companies may result in increased costs, including the additional use of airfreight to meet demand. In addition, for our China e-commerce business model, we rely on a third party to process transactions, fulfill orders, and manage logistic and money flows. Disruptions to the business model or our relationship with the third party if, for example, performance fails to meet our expectations, could harm our business.
We are subject to risks related to product recalls.
We have implemented measures in our manufacturing process that are designed to prevent and detect defects in our products, including contaminants. However, such measures may not prevent or reveal defects or detect contaminants in our products and such defects and contaminants may not become apparent until after our products have been sold into the market. Accordingly, there is a risk that product defects will occur, or that our products will contain foreign contaminants, and that such defects and contaminants will require a product recall. We do not maintain product recall insurance. In December 2012, we commenced a voluntary recall of certain lots of Protandim® Nrf2 Synergizer to alleviate concerns that some tablets may have included small metal fragments. We discovered these small metal fragments in certain batches of turmeric extract, an ingredient in Protandim® Nrf2 Synergizer we purchase from third-party suppliers. Product recalls and subsequent remedial actions can be expensive to implement and could have a material adverse effect on our business, results of operations and financial condition. In addition, product recalls could result in negative publicity and public concerns regarding the safety of our products, either of which could harm the reputation of our products and our business and could cause the market value of our common stock to decline.
The events that lead to and followed our voluntary product recall in December 2012 strained our relationships with some of our third-party manufacturers. Additionally, following the voluntary recall we implemented more stringent measures, including several redundant measures, in our manufacturing process to detect contaminants. Third-party manufacturers may be reluctant to implement these redundant measures, may refuse to manufacture our products, and these additional measures may increase our cost of goods sold and further strain our relationships with manufacturers.
Laws and regulations may prohibit or severely restrict direct selling and cause our revenue and profitability to decline, and regulators could adopt new regulations that negatively impact our business.
Various government agencies throughout the world regulate direct selling practices. The laws and regulations applicable to us and our independent distributors in Japan are particularly stringent. These laws and regulations are generally intended to prevent fraudulent or deceptive schemes, often referred to as “pyramid” schemes, which compensate participants primarily for recruiting additional participants without significant emphasis on the sale of product to end consumers. The laws and regulations in some of our markets impose cancellations, product returns, inventory buy-backs and cooling-off rights for our independent distributors and customers. Excessive refunds and/or product returns pursuant to local laws and regulations could have a negative impact on our operating results. Complying with these rules and regulations can be difficult and requires the devotion of significant resources on our part. We may not be able to continue business in existing markets or commence operations in new markets if we are unable to comply with these laws or adjust to changes in these laws.
Unfavorable publicity could materially harm our business.
We are highly dependent upon consumers' perceptions of the safety, quality, and efficacy of our products, as well as competitive products distributed by other companies. In the past, we have experienced negative publicity that has harmed our business. Critics of our industry and other individuals whose interests are not aligned with our interests, have in the past and may in the future utilize the Internet, the press and other means to publish criticism of the industry, our company, our products and our competitors, or make allegations regarding our business and operations, or the business and operations of our competitors. For instance, several prominent companies in our industry have been targeted by short sellers who profit if a company's stock price decreases. One such company was targeted by a short seller who, after taking a significant short position, publicly made allegations regarding the legality of the company's direct selling model. Short sellers have an incentive to publicly criticize our industry and business model and any such criticism may adversely affect our stock price.
Future scientific research or publicity may not be favorable to our industry or any particular product. Because of our dependence upon consumer perceptions, adverse publicity associated with illness or other adverse effects resulting or claimed to have resulted from the consumption or use of our products or any similar products distributed by other companies could have a material adverse impact on us. Such adverse publicity could arise even if the claims are unsubstantiated or if the adverse
24
effects associated with such products resulted from failure to consume or use such products as directed. Adverse publicity could also increase our product liability exposure, result in increased regulatory scrutiny and lead to the initiation of private lawsuits.
Our direct selling program could be found to be not in compliance with current or newly adopted laws or regulations in one or more markets, which could prevent us from conducting our business in these markets and harm our financial condition and operating results.
Some of the legal and regulatory requirements concerning the direct selling business model are ambiguous and subject to interpretation. As a result, regulators and courts have discretion in their application of these laws and regulations, and the enforcement or interpretation of these laws and regulations by governmental agencies or courts can change. Recent allegations by short sellers regarding the legality of multi-level marketing companies generally have also created intense public scrutiny of our industry and could cause governmental agencies to change their enforcement and interpretation of applicable laws and regulations. The failure of our business to comply with current or newly adopted regulations or interpretations could negatively impact our business in a particular market or in general and may adversely affect our stock price.
We may become involved in legal proceedings that are expensive, time consuming and, if adversely adjudicated or settled, could adversely affect our financial results.
Litigation claims can be expensive and time consuming to bring or defend against and could result in settlements or damages that could significantly affect our financial results. It is not possible to predict the final resolution of litigation to which we may become a party, and the impact of litigation proceedings on our business, results of operations and financial condition could be material.
We are currently involved in various legal matters, both as a plaintiff and as defendant. While we believe the suits against us are without merit, they are costly to defend and we cannot be assured that we will ultimately prevail. If we do not prevail and are required to pay damages, it could harm our business.
Our business is subject to strict government regulations.
The manufacturing, packaging, labeling, advertising, sale and distribution of our products are subject to federal laws and regulations by one or more federal agencies, including, in the United States, the Food and Drug Administration, or FDA, the Federal Trade Commission, or FTC, the Consumer Product Safety Commission, and the United States Department of Agriculture. These activities are also regulated by various state, local, and international laws and agencies of the states, localities and countries in which our products are sold. For instance, the FDA regulates, among other things, the composition, safety, labeling, and marketing of dietary supplements (including vitamins, minerals, herbs and other dietary ingredients for human use). Government regulations may prevent or delay the introduction, or require the reformulation, of our products, which could result in lost revenues, increased costs and delay our expansion into new international markets.
The FDA may determine that a particular dietary supplement or ingredient is adulterated or misbranded or both, and may determine that a particular claim or statement of nutritional support that we make to support the marketing of a dietary supplement is an impermissible drug claim, or is an unauthorized version of a “health claim.” The FDA or the FTC may also determine that a particular claim we make for our products is not substantiated. Determining whether a claim is improper frequently involves a degree of subjectivity by the regulatory agency or individual regulator. Any of these determinations by the FDA could prevent us from marketing that particular dietary supplement product, or making certain claims for that product. The FDA could also require us to remove a particular product from the market. Any future recall or removal would result in additional costs to us, including lost revenues from any product that we are required to remove from the market, which could be material. Any product recalls or removals could also lead to liability, substantial costs, and reduced growth prospects.
In April 2017, we received a warning letter from the FDA alleging that information on our website contained impermissible drug claims relating to our Protandim® Nrf2 Synergizer product. We believe the letter from the FDA contained factual inaccuracies and we responded promptly to the FDA. The FDA subsequently concluded that the issues set forth in the warning letter have been fully resolved. We do not claim that any of our products prevent, diagnose, treat or cure any disease in any of our marketing materials or labeling and we proactively and consistently engage distinguished experts in FDA law and regulation to ensure our promotional materials and websites adhere to applicable requirements and restrictions. Nevertheless, in the future, we may receive similar warning letters from the FDA if it believes some violation of law has occurred either by us or by our independent distributors. Any allegations of our non-compliance may result in time-consuming and expensive defense of our activities. FDA warning letters are available to the public on the FDA’s website. That information could negatively affect our relationships with our investors, independent distributors, vendors, and consumers. Warning letters may also spark private class action litigation under state consumer protection statutes. The FDA could also order compliance activities, such as an inspection of our facilities and products, and could file a civil lawsuit in which an arrest warrant (seizure) could be issued as to some or all of our products. In extraordinary cases, we could be named a defendant and sued for declaratory and injunctive relief.
25
Additional or more stringent regulations of dietary supplements and other products have been considered from time to time. In recent years, there has been increased pressure in the United States and other markets to increase regulation of dietary supplements. New regulations, or new interpretations of those regulations, could impose additional restrictions, including requiring reformulation of some products to meet new standards, recalls or discontinuance of some products not able to be reformulated, additional record-keeping requirements, increased documentation of the properties of some products, additional or different labeling, additional scientific substantiation, additional adverse event reporting, or other new requirements. Any of these developments could increase our costs significantly.
In the United States, for example, some legislators and industry critics continue to push for increased regulatory authority by the FDA over dietary supplements. Our business could be harmed if more restrictive legislation is successfully introduced and adopted in the future. In the United States, the FTC’s Guides Concerning the Use of Endorsements and Testimonials in Advertising, or Guides, require disclosure of material connections between an endorser and the company they are endorsing and generally do not allow marketing using atypical results. Our independent distributors have historically used testimonials to market and sell our products. Producing marketing materials that conform to the requirements and restrictions of the Guides may diminish the impact of our marketing efforts and negatively impact our sales results. If we or our distributors fail to comply with these Guides, the FTC could bring an enforcement action against us and we could be fined and/or forced to alter our marketing materials. Our operations also could be harmed if new laws or regulations are enacted that restrict our ability to market or distribute dietary supplements or impose additional burdens or requirements on dietary supplement companies or require us to reformulate our products.
In addition, the Dietary Supplement and Nonprescription Drug Consumer Protection Act imposes significant regulatory requirements on dietary supplements, packers and distributors including the reporting of “serious adverse events” to the FDA and record keeping requirements. Complying with this legislation could raise our costs and negatively impact our business. We and our suppliers are also required to comply with FDA regulations with respect to current Good Manufacturing Practices in manufacturing, packaging, or holding dietary ingredients and dietary supplements. These regulations require dietary supplements to be prepared, packaged, and held in compliance with procedures that we and our subcontractors must develop and make available for inspection by the FDA. These regulations could raise our costs and negatively impact our business. Additionally, our third-party suppliers or vendors may not be able to comply with these rules without incurring substantial expenses. If our third-party suppliers or vendors are not able to comply with these rules, we may experience increased cost or delays in obtaining certain raw materials and third-party products.
In 2016, the FDA published an updated draft guidance which is intended, among other things, to help manufacturers and distributors of dietary supplement products determine when they are required to file with the FDA a New Dietary Ingredient, or NDI, notification with respect to a dietary supplement product. In this draft guidance, the FDA highlighted the necessity for marketers of dietary supplements to submit NDI notifications as an important preventive control to ensure that consumers are not exposed to potential unnecessary public health risks in the form of new ingredients with unknown safety profiles. Although we do not believe that any of our products contain an NDI, if the FDA were to conclude that we should have filed an NDI notification for any of our products, then we could be subject to enforcement actions by the FDA. Such enforcement actions could include product seizures and injunctive relief being granted against us, any of which would harm our business.
In May 2016, the FDA released a final rule updating the Nutrition Facts label for packaged foods and the Supplement Facts label for dietary supplements, with the objective to help consumers make better informed decisions. While the original compliance deadline for manufacturers of food and dietary supplements to use the new label was July 26, 2018, FDA recently extended the compliance deadline to January 1, 2020. Change and implementation of the new label may result in additional costs to our business.
Regulations governing the production and marketing of our line of skin care products could harm our business.
LifeVantage TrueScience®, our line of anti-aging skin care products, is subject to various domestic and foreign laws and regulations that regulate cosmetic products and set forth regulations for determining whether a product can be marketed as a “cosmetic” or requires further approval as a drug. A determination that our skin care products impact the structure or function of the human body, including due to improper marketing claims by our independent distributors, may lead to a determination that the LifeVantage TrueScience® skin care products require pre-market approval as a drug. Such regulations in any given market can limit our ability to import products and can delay product launches as we go through the registration and approval process for those products. Furthermore, if we fail to comply with these regulations, we could face enforcement action against us and we could be fined, forced to alter or stop selling our skin care products and/or be required to adjust our operations. Our operations also could be harmed if new laws or regulations are enacted that restrict our ability to market or distribute our skin care products or impose additional burdens or requirements on the contents of our personal care products or require us to reformulate our products.
26
We are subject to the risk of investigatory and enforcement action by the FTC.
We are subject to the risk of investigatory and enforcement action by the FTC based on our advertising claims and marketing practices. The FTC routinely reviews product advertising, including websites, to identify significant questionable advertising claims and practices. The FTC has brought many actions against dietary supplement companies based upon allegations that applicable advertising claims or practices were deceptive or not substantiated. If the FTC initiates an investigation, the FTC can initiate pre-complaint discovery that may be nonpublic in nature. Any investigation may be very expensive to defend and may result in an adverse ruling or in a consent decree.
Government authorities may question our tax positions or transfer pricing policies or change their laws in a manner that could increase our effective tax rate or otherwise harm our business.
As a U.S. company doing business in international markets through subsidiaries, we are subject to various tax and intercompany pricing laws, including those relating to the flow of funds between our company and our subsidiaries. From time to time, we are audited by tax regulators in the United States and in our foreign markets. If regulators challenge our tax positions, corporate structure, transfer pricing mechanisms or intercompany transfers, we may be subject to fines and payment of back taxes, our effective tax rate may increase and our operations may be harmed. Tax rates vary from country to country, and, if tax authorities determine that our profits in one jurisdiction may need to be increased, we may not be able to fully utilize all foreign tax credits that are generated, which will increase our effective tax rate. The various customs, exchange control and transfer pricing laws are continually changing and are subject to the interpretation of government agencies. We may experience increased efforts by customs authorities in foreign countries to reclassify our products or otherwise increase the level of duties we pay on our products. Despite our efforts to be aware of and comply with such laws, and changes to and interpretations thereof, there is a risk that we may not continue to operate in compliance with such laws. We may need to adjust our operating procedures in response to such changes and, as a result, our business may suffer. In addition, due to the international nature of our business, from time to time, we are subject to reviews and audits by taxing authorities of other jurisdictions in which we conduct business throughout the world.
Non-compliance with anti-corruption laws could harm our business.
Our international operations are subject to anti-corruption laws, including the Foreign Corrupt Practices Act, also known as the FCPA. Any allegations that we are not in compliance with anti-corruption laws may require us to dedicate time and resources to an internal investigation of the allegations or may result in a government investigation. Any determination that our operations or activities are not in compliance with existing anti-corruption laws or regulations could result in the imposition of substantial fines, and other penalties. Although we have implemented anti-corruption policies and controls to protect against violation of these laws, we cannot be certain that these efforts will be effective.
If we are unable to build and integrate our new management team, our business could be harmed.
Our executive management team has undergone significant changes, including the termination or resignation from employment of our former Chief Financial Officer and Chief Operating Officer. In March 2017, Charles Wach was appointed as our new Chief Operating Officer and Steven Fife was appointed as our Chief Financial Officer.
Our success depends largely on the development and execution of our business strategy by our senior management team. Our Chief Financial Officer and Chief Operating Officer are relatively new to our company. We cannot assure you that our new management will succeed in working together as a team, working well with our other existing employees or successfully executing our business strategy in the near-term or at all, which could harm our business and financial prospects. Further, integrating new management into existing operations may be challenging. If we are unable to effectively integrate our new executive management team, our operations and prospects could be harmed.
The loss of or inability to attract key personnel could negatively impact our business.
Our future performance will depend upon our ability to attract, retain, and motivate our executive and senior management team and scientific staff. Our success depends to a significant extent both upon the continued services of our current executive and senior management team and scientific staff, as well as our ability to attract, hire, motivate, and retain additional qualified management and scientific staff in the future. Specifically, competition for executive and senior staff in the direct selling and dietary supplement markets is intense, and our operations could be adversely affected if we cannot attract and retain qualified personnel. Additionally, former members of our executive and senior management team have in the past, and could in the future join or form companies that compete against us in the direct selling industry.
All of our employees are “at will” employees, which means any employee may quit at any time and we may terminate any employee at any time. We do not carry “key person” insurance covering members of senior management or our employees.
27
We may be held responsible for certain taxes or assessments relating to the activities of our independent distributors, which could harm our financial condition and operating results.
Our distributors are subject to taxation, and in some instances, legislation or governmental agencies impose an obligation on us to collect or withhold taxes, such as value added taxes or income taxes, and to maintain appropriate records. In the event that local laws and regulations or the interpretation of local laws and regulations change to require us to treat our independent distributors as employees, or that our distributors are deemed by local regulatory authorities in one or more of the jurisdictions in which we operate to be our employees rather than independent contractors under existing laws and interpretations, or our independent distributors are deemed to be conducting business in countries outside of the country in which they are authorized to do business, we may be held responsible for social security, income, and other related taxes in those jurisdictions, plus any related assessments and penalties, which could harm our financial condition and operating results. If our independent distributors were deemed to be employees rather than independent contractors, we would also face the threat of increased vicarious liability for their actions.
The dietary supplement market is highly competitive.
Our flagship product line, Protandim®, competes in the dietary supplements market, which is large, highly competitive and fragmented. Participants include specialty retailers, supermarkets, drugstores, mass merchants, multi-level marketing organizations, on-line merchants, mail-order companies, and a variety of other smaller participants. Many of our competitors have greater financial and other resources available to them and possess better manufacturing, independent distribution and marketing capabilities than we do. We believe some of these competitors with greater resources are currently working on developing and releasing products that will compete directly with the Protandim® product line and be marketed as NRF1 and Nrf2 activators. One or more of these products could significantly reduce the demand for the Protandim® product line and have a material adverse effect on our revenue. We believe that the market is also highly sensitive to the introduction of new products, including various prescription drugs, which may rapidly capture a significant share of the market. Moreover, because of regulatory restrictions concerning claims about the efficacy of dietary supplements, we may have difficulty differentiating our products from our competitors’ products, and competing products entering the dietary supplements market could harm our revenue. In the United States and Japan, we also compete for sales with heavily advertised national brands manufactured by large pharmaceutical and food companies, as well as other retailers. In addition, as some products become more mainstream, we experience increased competition for those products as more participants enter the market. Our international competitors include large international pharmacy chains, major international supermarket chains, and other large U.S.-based companies with international operations. We may not be able to compete effectively and our attempt to do so may result in increased pricing pressure, which may result in lower margins and have a material adverse effect on our results of operations and financial condition.
Our intellectual property rights are valuable, and any inability to protect them could reduce the value of our products and brand.
The loss of our intellectual property rights in our products could permit our competitors to manufacture their own version of our products. We have attempted to protect our intellectual property rights in our products through a combination of patents, patent applications, trademarks, confidentiality agreements, non-compete agreements and other contractual protection mechanisms, and we will continue to do so. While we intend to defend against any threats to our intellectual property, our patents or various contractual protections may not adequately protect our intellectual property. In addition, we could be required to expend significant resources to defend our rights to proprietary information, and may not be successful in such defense.
Moreover, our intellectual property rights are more limited outside of the United States than they are in the United States. As such, we may not be successful in preventing third parties from copying or misappropriating our intellectual property. There can also be no assurance that pending patent applications owned by us will result in patents being issued to us, that patents issued to or licensed by us in the past or in the future will not be challenged or circumvented by competitors or that such patents will be found to be valid or sufficiently broad to protect our products or to provide us with any competitive advantage. Third parties could also obtain patents that may require us to negotiate to obtain licenses to conduct our business, and any required licenses may not be available on reasonable terms or at all. We also rely on confidentiality and non-compete agreements with certain employees, independent distributors, consultants and other parties to protect, in part, trade secrets and other proprietary rights. There can be no assurance that these agreements will not be breached, that we will have adequate remedies for any breach, that others will not independently develop substantially equivalent proprietary information or that third parties will not otherwise gain access to our trade secrets or proprietary knowledge.
Third parties might claim that we infringe on their intellectual property rights.
Although the dietary supplement industry has historically been characterized by products with naturally occurring ingredients, recently it is becoming more common for suppliers and competitors to apply for patents or develop proprietary technologies and processes. Third parties may assert intellectual property infringement claims against us despite our efforts to
28
avoid such infringement. Such claims could prevent us from offering competitive products or result in litigation or threatened litigation.
Our business is susceptible to product liability claims.
The manufacture and sale of any product for human consumption raises the risk of product liability claims. These claims may derive from the product itself or a contaminant found in the product from the manufacturing, packaging, sales process or even due to tampering by unauthorized third parties. Our products consist of vitamins, minerals, herbs, and other ingredients that are classified as foods or dietary supplements and are not subject to pre-market regulatory approval in the United States. Our products could contain contaminated substances, and some of our products contain ingredients that do not have long histories of human consumption. Previously unknown adverse reactions resulting from human consumption of these ingredients could occur. In addition, third-party manufacturers produce all of the products we sell. As a distributor of products manufactured by third parties, we may also be liable for various product liability claims for these products despite not manufacturing them. We may be subject to various product liability claims, including, among others, that our products include inadequate instructions for use or inadequate warnings concerning possible side effects and interactions with other substances. Any product liability claim against us could result in increased costs and could adversely affect our reputation with our customers, which in turn could adversely affect our revenues and operating income. Although we maintain insurance coverage, there is a risk that our insurance will not cover our potential exposure completely or would fail to cover a particular claim, in which case we may not have the financial resources to satisfy such claim. In addition, certain types of damages, such as punitive damages, are not covered by our insurance policy.
Economic, political, and other risks associated with our international operations could adversely affect our revenues and international growth prospects.
As part of our business strategy, we intend to continue to expand our international presence. Our international operations are subject to a number of risks inherent to operating in foreign countries, and any expansion of our international operations will increase the effects of these risks. These risks include, among others:
• | political and economic instability of foreign markets; |
• | foreign governments’ restrictive trade policies; |
• | lack of well-established or reliable legal systems in certain areas in which we operate; |
• | inconsistent product regulation or sudden policy changes by foreign agencies or governments; |
• | the imposition of, or increase in, duties, taxes, government royalties, or non-tariff trade barriers; |
• | difficulty in collecting international accounts receivable and potentially longer payment cycles; |
• | the possibility that a foreign government may limit our ability to repatriate cash; |
• | increased costs in maintaining international marketing efforts; |
• | problems entering international markets with different cultural bases and consumer preferences; and |
• | fluctuations in foreign currency exchange rates. |
Any of these risks could have a material adverse effect on our international operations and our growth strategy.
Risks Related to Ownership of Our Common Stock
If we are unable to maintain compliance with Nasdaq requirements for continued listing, our common stock could be delisted from trading.
As previously disclosed, in fiscal 2016, we were delinquent in the filing of our periodic reports with the SEC and, as a result, were not in compliance with the continued listing requirements of the Nasdaq Stock Market. Accordingly, we were subject to having our stock delisted from trading on Nasdaq though we later were successful in regaining compliance with the Nasdaq continued listing requirements. However, there can be no assurance that our common stock will not be subject to delisting by Nasdaq in the future. If our common stock were to be delisted, there can be no assurance whether or when it would again be listed for trading on Nasdaq or any other exchange. In addition, if our common stock were to be delisted, the market price of our shares will likely decline and become more volatile, and our stockholders may find that their ability to trade in our stock will be adversely affected. Furthermore, institutions whose charters do not allow them to hold securities in unlisted companies might sell our shares, which could have a further adverse effect on the price of our stock.
Our stock price may experience future volatility.
The trading price of our common stock has historically been subject to wide fluctuations. The price of our common stock may fluctuate in the future in response to quarter-to-quarter variations in operating results, material announcements by us or
29
competitors, governmental regulatory action, conditions in the dietary supplement industry, or other events or factors, many of which are beyond our control, and some of which do not have a strong correlation to our operating performance.
Substantial sales of shares may impact the market price of our common stock.
If our shareholders sell substantial amounts of our common stock, the market price of our common stock may decline. These sales also might make it more difficult for us to sell equity or equity-related securities in the future at a time and price that we consider appropriate.
Additional shares that may be issued upon the exercise of currently outstanding options or upon future vesting of performance restricted stock units, would dilute the voting power of our currently outstanding common stock and could cause our stock price to decline.
As of June 30, 2018, we had 14.1 million shares of common stock outstanding. As of June 30, 2018, we also had stock options outstanding for an aggregate of 0.7 million shares of common stock. Additionally, the future vesting of performance restricted stock units may further increase our outstanding shares of common stock. The issuance of these shares will dilute the voting power of our currently outstanding common stock and could cause our stock price to decline.
We have never paid dividends on our capital stock, and we do not currently anticipate paying any cash dividends in the foreseeable future.
We have paid no cash dividends on any of our classes of capital stock to date. We currently intend to retain our future earnings, if any, to fund the development and growth of our business. Additionally, the Financing Agreement we entered into in March 2016, as amended, in connection with our credit facility contains a customary covenant that restricts our ability to pay dividends. As a result, capital appreciation, if any, of our common stock is likely to be the sole source of gain for the foreseeable future.
ITEM 1B — UNRESOLVED STAFF COMMENTS
None.
ITEM 2 — PROPERTIES
Corporate Offices
During fiscal year 2014, we moved into our corporate headquarters located at 9785 South Monroe Street, Suite 400, Sandy, Utah 84070. The lease for our corporate headquarters is for a term of ten years commencing on February 10, 2014, with an option for us to terminate the lease in our discretion after seven years. The lease includes approximately 44,353 square feet with options to occupy additional space in the future if needed.
Our subsidiary, LifeVantage Japan K.K., leases approximately 10,400 square feet of office space in Tokyo, Japan. The lease for the Tokyo, Japan property expires in July 2020.
Warehouse Facilities
Since fiscal year 2010, Visible Supply Chain Management (formerly IntegraCore, LLC) has provided fulfillment services to us, including services relating to procurement, warehousing, ordering, processing and shipping. We have also entered into arrangements to receive similar services in some of our international markets.
ITEM 3 — LEGAL PROCEEDINGS
See Note 11 of the Notes to the Consolidated Financial Statements contained within this Annual Report on Form 10-K for a discussion of the Company's legal proceedings.
ITEM 4 — MINE SAFETY DISCLOSURES
Not applicable.
PART II
ITEM 5 — MARKET FOR REGISTRANT’S COMMON EQUITY, RELATED STOCKHOLDER MATTERS AND ISSUER PURCHASES OF EQUITY SECURITIES
30
Market Information and Holders
Our common stock began trading on the NASDAQ Capital Market ("NASDAQ") under the symbol "LFVN" in September 2012. Our common stock was previously quoted on the OTC Bulletin Board under the symbol “LFVN.” On October 19, 2015, the Company effected a one-for-seven reverse stock split.
The table below sets forth, for the fiscal quarters indicated, the reported high and low prices of our common stock, as quoted on NASDAQ. Our fiscal year-end is June 30.
Fiscal year | |||||||||||||||
2018 | 2017 | ||||||||||||||
High | Low | High | Low | ||||||||||||
First Quarter | $ | 5.23 | $ | 2.86 | $ | 15.97 | $ | 8.01 | |||||||
Second Quarter | $ | 6.84 | $ | 4.25 | $ | 10.20 | $ | 6.43 | |||||||
Third Quarter | $ | 4.95 | $ | 3.57 | $ | 8.34 | $ | 4.61 | |||||||
Fourth Quarter | $ | 6.84 | $ | 3.20 | $ | 5.40 | $ | 3.70 | |||||||
Our common stock is issued in registered form and the following information is taken from the records of our current transfer agent, Computershare Trust Company, Inc., located in Golden, Colorado. As of June 30, 2018, we had 106 shareholders of record and 14.1 million shares of common stock outstanding. This does not include an unknown number of persons who hold shares in street name through brokers and dealers and who are not listed on our shareholder records.
Stock Performance Graph
The following line graph and table compares the cumulative total shareholder return on our common stock with the cumulative total return of (i) the NASDAQ Composite Index and (ii) a market-weighted index of publicly-traded peer companies (the "Peer Group") for the period from June 30, 2013 through June 30, 2018. The data shown assumes an investment on June 30, 2013 of $100 and reinvestment of all dividends into additional shares of the same class of equity, if applicable, to the stock or index. There is no expectation that the rate of return achieved in the prior 5 years will be achievable in the upcoming years.
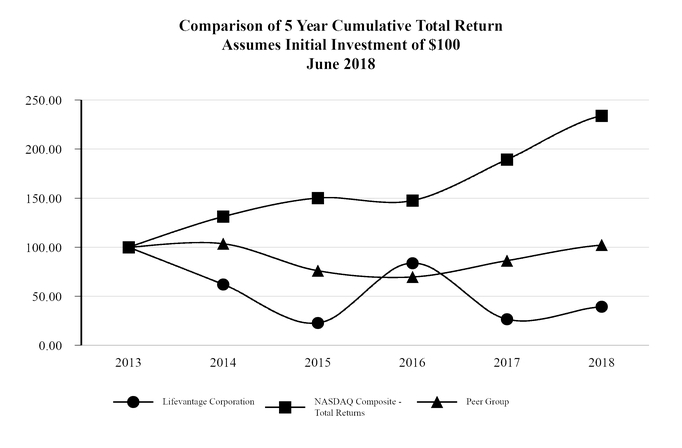
31
The Peer Group consists of the following companies, which compete in our industry and product categories: Nature's Sunshine Products, Inc.; Nu Skin Enterprises, Inc.; Mannatech, Incorporated; Herbalife LTD.; Reliv International, Inc.; Avon Products, Inc.; USANA Health Sciences, Inc. and Tupperware Brands Corporation.
Measured Period | LFVN | NASDAQ Composite | Peer Group | |||||||||
June 30, 2013 | $ | 100.00 | $ | 100.00 | $ | 100.00 | ||||||
June 30, 2014 | $ | 62.07 | $ | 131.17 | $ | 103.49 | ||||||
June 30, 2015 | $ | 22.84 | $ | 150.10 | $ | 76.05 | ||||||
June 30, 2016 | $ | 83.74 | $ | 147.58 | $ | 69.67 | ||||||
June 30, 2017 | $ | 26.66 | $ | 189.34 | $ | 86.30 | ||||||
June 30, 2018 | $ | 39.22 | $ | 234.02 | $ | 102.15 | ||||||
Dividends
We have not declared any dividends on any class of our equity securities since incorporation, and we do not currently anticipate declaring any dividends. Additionally, the 2016 Credit Facility, as amended, contains customary covenants that, among other things, restrict our ability to pay dividends.
Purchases of Equity Securities
During the three months ended June 30, 2018, we withheld 41,858 shares to satisfy tax withholding obligations in connection with the vesting of restricted stock awards.
On November 27, 2017, our Board of Directors approved a stock repurchase plan. Under the plan, which became effective on November 27, 2017, we are authorized to repurchase up to $5.0 million of our outstanding shares of common stock through November 27, 2020. The repurchase plan permits us to purchase shares of our common stock from time to time through a variety of methods, including in the open market, through privately negotiated transactions or other means as determined by our management, in accordance with applicable securities laws. As part of the repurchase plan, we may enter into a pre-arranged stock repurchase plan which will operate in accordance with guidelines specified under Rule 10b5-1 of the Securities Exchange Act of 1934. Accordingly, transactions, if any, under the pre-arranged repurchase plan would be completed in accordance with the terms of the stock repurchase plan, including specified price, volume and timing conditions. The authorization may be suspended or discontinued at any time and expires on November 27, 2020. During the three months ended June 30, 2018, we repurchased 0.2 million shares of our common stock on the open market at an aggregate purchase price of $1.0 million under this repurchase plan.
The following table provides information with respect to all purchases made by the Company during the three months ended June 30, 2018. All purchases listed below were made in the open market at prevailing market prices and pursuant to trading plans adopted by us pursuant to Rule 10b5-1 under the Securities Exchange Act of 1934.
Period | Total Number of Shares Purchased | Average Price Paid Per Share | Total Number of Shares Purchased as Part of Publicly Announced Plans or Programs | Maximum Dollar Value of Shares that May Yet Be Purchased Under the Plans or Programs | ||||||||||
April 1 - April 30 | — | $ | — | — | $ | — | ||||||||
May 1 - May 31 | 71,900 | $ | 4.83 | 71,900 | $ | 4,152,949 | ||||||||
June 1 - June 30 | 126,273 | $ | 5.17 | 126,273 | $ | 3,500,004 | ||||||||
Total | 198,173 | 198,173 | ||||||||||||
Recent Sale of Unregistered Securities
None.
Equity Compensation Plan Information
This information is incorporated by reference to Part III, Item 12 of this report.
32
ITEM 6 — SELECTED FINANCIAL DATA
The following table summarizes certain historical financial information at the dates and for the periods indicated prepared in accordance with GAAP.
The consolidated statement of operations data for each of the fiscal years ended June 30, 2018, 2017 and 2016, and the consolidated balance sheet data as of June 30, 2018 and 2017, have been derived from our consolidated financial statements audited by WSRP, LLC, an independent registered public accounting firm, included elsewhere in this annual report on Form 10-K. The consolidated statement of operations data for each of the fiscal years ended June 30, 2015 and 2014, and the consolidated balance sheet data as of June 30, 2016, 2015 and 2014, have been derived from our financial statements not included herein. The selected consolidated financial data should be read in conjunction with “Management's Discussion and Analysis of Financial Condition and Results of Operations” and the consolidated financial statements and notes thereto, which are included elsewhere in this annual report on Form 10-K. Our historical results are not necessarily indicative of operating results to be expected in the future.
Years Ended June 30, | |||||||||||||||||||
2018 | 2017 | 2016 | 2015 | 2014 | |||||||||||||||
(In thousands, except per share data) | |||||||||||||||||||
Statement of Operations Data: | |||||||||||||||||||
Revenue, net | $ | 203,204 | $ | 199,489 | $ | 206,540 | $ | 190,336 | $ | 213,968 | |||||||||
Cost of sales | 34,848 | 33,456 | 33,932 | 28,010 | 33,194 | ||||||||||||||
Gross profit | 168,356 | 166,033 | 172,608 | 162,326 | 180,774 | ||||||||||||||
Operating expenses: | |||||||||||||||||||
Commissions and incentives | 98,193 | 96,662 | 103,120 | 91,074 | 104,525 | ||||||||||||||
Selling, general and administrative | 59,840 | 64,922 | 56,074 | 57,353 | 56,801 | ||||||||||||||
Total operating expenses | 158,033 | 161,584 | 159,194 | 148,427 | 161,326 | ||||||||||||||
Operating income | 10,323 | 4,449 | 13,414 | 13,899 | 19,448 | ||||||||||||||
Other income (expense): | |||||||||||||||||||
Interest expense | (456 | ) | (570 | ) | (3,321 | ) | (3,087 | ) | (3,177 | ) | |||||||||
Other income (expense), net | (319 | ) | (969 | ) | (1,409 | ) | (159 | ) | 384 | ||||||||||
Total other expense | (775 | ) | (1,539 | ) | (4,730 | ) | (3,246 | ) | (2,793 | ) | |||||||||
Income before income taxes | 9,548 | 2,910 | 8,684 | 10,653 | 16,655 | ||||||||||||||
Income tax expense | (3,787 | ) | (1,302 | ) | (2,578 | ) | (3,528 | ) | (5,857 | ) | |||||||||
Net income | $ | 5,761 | $ | 1,608 | $ | 6,106 | $ | 7,125 | $ | 10,798 | |||||||||
Net income per share: | |||||||||||||||||||
Basic | $ | 0.41 | $ | 0.12 | $ | 0.44 | $ | 0.51 | $ | 0.71 | |||||||||
Diluted | $ | 0.41 | $ | 0.11 | $ | 0.42 | $ | 0.50 | $ | 0.68 | |||||||||
Weighed-average shares outstanding: | |||||||||||||||||||
Basic | 13,992 | 13,881 | 13,730 | 13,899 | 15,113 | ||||||||||||||
Diluted | 14,136 | 14,118 | 14,531 | 14,150 | 15,943 | ||||||||||||||
As of June 30, | |||||||||||||||||||
2018 | 2017 | 2016 | 2015 | 2014 | |||||||||||||||
(In thousands) | |||||||||||||||||||
Balance Sheet Data: | |||||||||||||||||||
Cash and cash equivalents | $ | 16,652 | $ | 11,458 | $ | 7,883 | $ | 13,905 | $ | 20,387 | |||||||||
Working capital | 15,133 | 12,191 | 12,484 | 3,259 | 16,414 | ||||||||||||||
Total assets | 51,142 | 45,249 | 50,855 | 40,065 | 51,826 | ||||||||||||||
Current liabilities | 23,805 | 23,355 | 30,628 | 27,663 | 23,539 | ||||||||||||||
Long-term debt, net of unamortized discount | 3,412 | 5,440 | 7,409 | 8,533 | 23,720 | ||||||||||||||
Total liabilities | 29,195 | 30,722 | 40,206 | 38,259 | 49,493 | ||||||||||||||
Total stockholders' equity | 21,947 | 14,527 | 10,649 | 1,806 | 2,333 | ||||||||||||||
33
ITEM 7 — MANAGEMENT’S DISCUSSION AND ANALYSIS OF FINANCIAL CONDITION AND RESULTS OF OPERATIONS
You should read the following discussion and analysis in connection with our financial statements and related notes beginning on page F-1 following Part III of this report.
Overview
We are a company focused on bio-hacking the aging code through nutrigenomics, the study of how nutrition and naturally occurring compounds affect human genes. We are dedicated to helping people achieve their health, wellness and financial goals. We provide quality, scientifically-validated products and a financially rewarding direct sales business opportunity to customers and independent distributors. We engage in the identification, research, development and distribution of advanced nutraceutical dietary supplements and skin care products. We currently sell our products to customers and independent distributors in two geographic regions that we have classified as the Americas region and the Asia/Pacific & Europe region.
Our revenue depends on the number and productivity of our independent distributors and the number of our customers. When we are successful in attracting and retaining independent distributors and customers, it is largely because of:
• | Our scientifically-validated products, including our Protandim® product line, TrueScience® anti-aging skin care line, Petandim™ for Dogs, Axio® Smart Energy Drink mixes, PhysIQ™ Smart Weight Management System and Omega+, our sustainable fish oil supplement; |
• | Our compensation plan and other sales initiatives; and |
• | Our delivery of superior customer service. |
As a result, it is vital to our success that we leverage our product development resources to develop and introduce compelling and innovative products and provide opportunities for our independent distributors to sell these products in a variety of markets. We sell our products in the United States, Japan, Hong Kong, Australia, Canada, Mexico, Thailand, the United Kingdom, the Netherlands, Germany and Taiwan. We also sell our products in a number of countries to customers for personal consumption only. In addition, we sell our products in China through our e-commerce business model. Entering a new market requires a considerable amount of time, resources and continued support. If we are unable to properly support an existing or new market, our revenue growth may be negatively impacted.
Our Products
Our products are the Protandim® product line, the TrueScience® anti-aging skin care line, Axio® Smart Energy Drink mixes, PhysIQ™ Smart Weight Management System, Petandim™ for Dogs, and Omega+, our sustainable fish oil supplement. The Protandim® product line includes Protandim® NRF1 and Nrf2 Synergizers™. The Protandim® NRF1 Synergizer is formulated to increase cellular energy and performance by boosting mitochondria production to improve cellular repair and slow cellular aging. The Protandim® Nrf2 Synergizer™ contains a proprietary blend of ingredients and has been shown to combat oxidative stress and enhance energy production by increasing the body’s natural antioxidant protection at the gene level, inducing the production of naturally-occurring protective antioxidant enzymes including superoxide dismutase, catalase, and glutathione synthase. Our TrueScience® anti-aging skin care line includes TrueScience® Facial Cleanser, TrueScience® Perfecting Lotion, TrueScience® Eye Serum, TrueScience® Anti-Aging Cream, TrueScience® Micro-Lift Serum and TrueScience® Hand Cream. Axio® is our line of Smart Energy Drink mixes formulated to promote alertness and support mental performance. PhysIQ™ is our Smart Weight Management System which includes PhysIQ™ Fat Burn, PhysIQ™ Probio, PhysIQ™ Cleanse and PhysIQ™ Protein Shake mix, all formulated to aid in weight management. Petandim™ for Dogs is a supplement specially formulated to combat oxidative stress in dogs through Nrf2 activation. Omega+ is a dietary supplement that combines DHA and EPA Omega-3 fatty acids, Omega-7 fatty acids, and Vitamin D3 to support cognitive health, cardiovascular health, skin health, and the immune system. The following table shows revenues by major product line for the fiscal years ended June 30, 2018, 2017 and 2016.
Years ended June 30, | ||||||||||||||||||||
2018 | 2017 | 2016 | ||||||||||||||||||
Protandim® product line | $ | 133,923 | 65.9 | % | $ | 130,873 | 65.6 | % | $ | 128,019 | 62.0 | % | ||||||||
TrueScience® product line | 21,665 | 10.7 | % | 24,440 | 12.3 | % | 32,914 | 15.9 | % | |||||||||||
Other | 47,616 | 23.4 | % | 44,176 | 22.1 | % | 45,607 | 22.1 | % | |||||||||||
Total | $ | 203,204 | 100.0 | % | $ | 199,489 | 100.0 | % | $ | 206,540 | 100.0 | % | ||||||||
34
Our revenues are largely attributed to two product lines, Protandim® and TrueScience®, which each accounted for more than 10% of total revenues for each of the fiscal years ended June 30, 2018, 2017 and 2016. On a combined basis, these products represent approximately 76.6%, 77.9% and 77.9% of our worldwide net revenues for the fiscal years ended June 30, 2018, 2017 and 2016, respectively.
We currently have additional products in development. Any delays or difficulties in introducing compelling products or attractive initiatives or tools into our markets may have a negative impact on our revenue and our ability to attract new independent distributors and customers.
Customers
Because we primarily utilize a direct selling model for the distribution of our products, the success and growth of our business depends in large part on the effectiveness of our independent distributors in selling our products and on our ability to attract new and retain existing independent distributors. Changes in our product sales are typically the result of variations in product sales volume relating to fluctuations in the number of active independent distributors and customers purchasing our products. The number of active independent distributors and customers is, therefore, used by management as a key non-financial measure.
The following tables summarize the changes in our active customer base by geographic region. These numbers have been rounded to the nearest thousand as of the dates indicated. For purposes of this report, we only count as active customers those independent distributors and customers who have purchased from us at any time during the most recent three-month period, either for personal use or for resale.
Active Customers By Region | |||||||||||||||||
As of June 30, | |||||||||||||||||
2018 | 2017 | Change from Prior Year | % Change | ||||||||||||||
Americas | 94,000 | 81.0 | % | 90,000 | 80.4 | % | 4,000 | 4.4 | % | ||||||||
Asia/Pacific & Europe | 22,000 | 19.0 | % | 22,000 | 19.6 | % | — | — | % | ||||||||
116,000 | 100.0 | % | 112,000 | 100.0 | % | 4,000 | 3.6 | % | |||||||||
Active Independent Distributors By Region | |||||||||||||||||
As of June 30, | |||||||||||||||||
2018 | 2017 | Change from Prior Year | % Change | ||||||||||||||
Americas | 45,000 | 71.4 | % | 47,000 | 73.4 | % | (2,000 | ) | (4.3 | )% | |||||||
Asia/Pacific & Europe | 18,000 | 28.6 | % | 17,000 | 26.6 | % | 1,000 | 5.9 | % | ||||||||
63,000 | 100.0 | % | 64,000 | 100.0 | % | (1,000 | ) | (1.6 | )% | ||||||||
Income Statement Presentation
We report revenue in two geographic regions and we translate revenue from each market's local currency into U.S. Dollars using weighted-average exchange rates. Revenue consists primarily of product sales, fee revenues, and shipping and handling fees, net of applicable sales discounts. Revenue is recognized at the time of shipment, which is when the passage of title and risk of loss to customers occurs. Also reflected in revenue is a provision for product returns and allowances, which is estimated based on our historical experience. The following table sets forth net revenue information by region for the years indicated. The following table should be reviewed in connection with the tables presented under "Results of Operations" (in thousands):
For the fiscal years ended June 30, | ||||||||||||||||||||
2018 | 2017 | 2016 | ||||||||||||||||||
Americas | $ | 151,609 | 74.6 | % | $ | 150,841 | 75.6 | % | $ | 158,291 | 76.6 | % | ||||||||
Asia/Pacific & Europe | 51,595 | 25.4 | % | 48,648 | 24.4 | % | 48,249 | 23.4 | % | |||||||||||
Total | $ | 203,204 | 100.0 | % | $ | 199,489 | 100.0 | % | $ | 206,540 | 100.0 | % | ||||||||
35
Cost of sales primarily consists of costs of products purchased from and manufactured by third-party vendors, costs of adjustments to inventory carrying value, and costs of marketing materials which we sell to our distributor sales force, as well as freight, duties and taxes that are associated with the import and export of our products. As our international sales increase as a percentage of total revenue, cost of sales as a percentage of revenue likely will increase as a result of additional duties, freight, and other factors, such as changes in currency exchange rates.
Commissions and incentives expenses are our most significant expenses and are classified as operating expenses. Commissions and incentives expenses include sales commissions paid to our independent distributors, special incentives, costs for incentive trips and other rewards. Commissions and incentives expenses do not include any amounts we pay to our independent distributors for personal purchases. Commissions paid to independent distributors on personal purchases are considered a sales discount and are reported as a reduction to our net revenue. Our global sales compensation plan, which we employ in all our markets, is an important factor in our ability to attract and retain our independent distributors. Under our global sales compensation plan, independent distributors can earn commissions for product sales to their customers as well as the product sales made through the sales networks they have developed and trained. We do not pay commissions on sales materials, which are sold to our independent distributors. Commissions and incentives expenses, as a percentage of net revenue, may be impacted by the timing and magnitude of non-commissionable revenues derived from the sales of marketing materials, event tickets, and promotional items, investment in our Red Carpet program, limited-time offers and the timing, magnitude and number of incentive trips and other promotional activities. From time to time, we make modifications and enhancements to our global sales compensation plan in an effort to help motivate our sales force and develop leadership characteristics, which can have an impact on commissions and incentives expenses.
Selling, general and administrative expenses include wages and benefits, marketing and event costs, professional fees, rents and utilities, depreciation and amortization, research and development, travel costs, and other operating expenses. Wages and benefits represent the largest component of selling, general and administrative expenses. Marketing and event costs include costs of distributor conventions and events held in various markets worldwide, which we expense in the period in which they are incurred. Marketing and event costs also include expenses associated with our sponsorship of the Major League Soccer team, Real Salt Lake.
Sales to customers outside the United States are transacted in the respective local currencies and are translated to U.S. Dollars at weighted-average currency exchange rates for each monthly accounting period to which they relate. Consequently, our net sales and earnings are affected by changes in currency exchange rates. In general, sales and gross profit are affected positively by a weakening U.S. Dollar and negatively by a strengthening U.S. Dollar. Currency fluctuations, however, have the opposite effect on our commissions paid to independent distributors and selling, and general and administrative expenses. In our revenue discussions that follow, we approximate the impact of currency fluctuations on revenue by translating current year revenue at the average exchange rates in effect during the comparable prior year periods.
Results of Operations
For the fiscal years ended June 30, 2018, 2017 and 2016, we generated net revenues of $203.2 million, $199.5 million and $206.5 million, respectively, recognized operating profit of $10.3 million, $4.4 million and $13.4 million, respectively, and recognized net income of $5.8 million, $1.6 million and $6.1 million, respectively.
36
The following table presents certain consolidated earnings data as a percentage of net revenue for the years indicated:
For the fiscal years ended June 30, | ||||||||
2018 | 2017 | 2016 | ||||||
Revenue, net | 100.0 | % | 100.0 | % | 100.0 | % | ||
Cost of sales | 17.1 | 16.8 | 16.4 | |||||
Gross profit | 82.9 | 83.2 | 83.6 | |||||
Operating expenses: | ||||||||
Commissions and incentives | 48.3 | 48.5 | 49.9 | |||||
Selling, general and administrative | 29.4 | 32.5 | 27.1 | |||||
Total operating expenses | 77.7 | 81.0 | 77.0 | |||||
Operating income | 5.2 | 2.2 | 6.6 | |||||
Other expense: | ||||||||
Interest expense | (0.2 | ) | (0.3 | ) | (1.6 | ) | ||
Other expense, net | (0.2 | ) | (0.5 | ) | (0.7 | ) | ||
Total other expense | (0.4 | ) | (0.8 | ) | (2.3 | ) | ||
Income before income taxes | 4.8 | 1.4 | 4.3 | |||||
Income tax expense | (1.9 | ) | (0.7 | ) | (1.2 | ) | ||
Net income | 2.9 | % | 0.7 | % | 3.1 | % | ||
Comparison of Fiscal Years Ended June 30, 2018 and 2017
Revenue, net. We generated net revenue of $203.2 million and $199.5 million during the fiscal years ended June 30, 2018 and 2017, respectively. Foreign currency fluctuations positively impacted our net revenue $0.2 million or 0.1%. The overall increase in sales of $3.7 million in fiscal 2018 primarily was due to increases in revenue generated in our international markets, most notably in Japan, Mexico, Canada and Europe. These increases were partially offset by revenue decreases in the United States and Hong Kong markets due to the remediation steps taken as a result of the 2016 audit committee review regarding international distribution of our products.
Americas. The following table sets forth revenue for the fiscal years ended June 30, 2018 and 2017 for the Americas region (in thousands):
For the fiscal years ended June 30, | ||||||||||
2018 | 2017 | % change | ||||||||
United States | $ | 142,452 | $ | 144,842 | (1.7 | )% | ||||
Other | 9,157 | 5,999 | 52.6 | % | ||||||
Americas Total | $ | 151,609 | $ | 150,841 | 0.5 | % | ||||
Revenue in the Americas region for the fiscal year ended June 30, 2018 increased $0.8 million, or 0.5%, compared to the prior year. We realized considerable increases in revenue in Canada and Mexico during fiscal 2018 as a result of increases in both active customers and distributors in both markets, along with the introduction of new products in both markets, including the launch of our Protandim® Nrf2 product in Mexico. These increases were partially offset by a decrease in revenue in the United States due mainly to the impact of the 2016 audit committee review that was completed during the prior year. We also noted increases in average order sizes during fiscal 2018 as a result of our product bundling and Vitality Stack launches during the year.
37
Asia/Pacific & Europe. The following table sets forth revenue for the fiscal years ended June 30, 2018 and 2017 for the Asia/Pacific & Europe region and its principal markets (in thousands):
For the fiscal years ended June 30, | ||||||||||
2018 | 2017 | % change | ||||||||
Japan | $ | 41,843 | $ | 39,390 | 6.2 | % | ||||
Other | 9,752 | 9,258 | 5.3 | % | ||||||
Asia/Pacific & Europe Total | $ | 51,595 | $ | 48,648 | 6.1 | % | ||||
Revenue in the region for the fiscal year ended June 30, 2018 was negatively impacted approximately $0.1 million, or 0.2%, by foreign currency exchange rate fluctuations.
Revenue in Japan increased by 6.2% as compared to the prior year as a result of increased sales and marketing efforts and new leadership in the market. Local currency revenue in Japan increased 7.6% in fiscal 2018 compared to fiscal 2017. During the fiscal year ended June 30, 2018 the Japanese yen, on average, weakened against the U.S. Dollar, negatively impacting our revenue in this market by $0.6 million or 1.5%.
Our sales and marketing efforts continue to be directed toward building our worldwide sales. During the second half of fiscal year 2018 we saw both sequential and year over year increases in revenue, which we believe relates to the growth initiatives launched earlier in the year. During fiscal 2018, we launched the new LifeVantage App that leverages mobile, artificial intelligence and machine learning to help distributors with their daily efforts to recruit new customers. We also launched new products during fiscal 2018, including our Omega+ supplement and TrueScience® hand cream and expanded our product offerings in our international markets, including the official launch of our Protandim® Nrf2 supplement in Mexico. These product launches contributed to the increased revenue in fiscal 2018 and we expect continued increases in revenues from these products in the future. We expanded geographically during fiscal 2018 by launching Germany during our first fiscal quarter of 2018 and launching our e-commerce model in China during our third fiscal quarter of 2018. During April 2018, we further expanded our footprint in Europe by opening up 5 new countries on a not-for-resale basis and in June 2018, we launched our Taiwan market.
We expect increased revenue in the Americas region as we focus on our growth initiatives, specifically, utilizing our Red Carpet program to recruit experienced industry leaders who are in transition, the development and expansion of new distributor tools, training and technology and the continued scientific research and development of new products. We expect revenue in the Asia/Pacific and Europe region to increase as a result of the recent market launches, planned future expansion into new markets, the continued refinement of our sales and marketing efforts, including the continued international expansion of our product lines, the strengthening of our international management team and creating alignment among all of our markets.
Gross Margin. Cost of sales were $34.8 million for the fiscal year ended June 30, 2018, and $33.5 million for the fiscal year ended June 30, 2017, resulting in a gross margin of $168.4 million, or 82.9%, and $166.0 million, or 83.2%, respectively. The decrease in gross margin as a percent of revenues in fiscal 2018 relative to fiscal 2017 was primarily due to geographic and product sales mix during the year due to geographic expansion and the continued global roll out of our products. Costs of sales were benefited in fiscal 2018 due to the adjustment of transfer pricing related import estimates and accruals and the impact of price increases made during our third fiscal quarter. We expect the gross margin percentage to be in the 82-84% range for the foreseeable future based on our expected inventory and manufacturing related costs and product sales mix. Economic conditions and changes in the supply of raw materials, new products with differing raw material cost basis, and additional manufacturing process costs could impact our gross margins in the future.
Operating Expenses. Total operating expenses for the fiscal year ended June 30, 2018 were $158.0 million as compared to operating expenses of $161.6 million for the fiscal year ended June 30, 2017. Operating expenses consist of commissions and incentives expenses and selling, general and administrative expenses. Operating expenses as a percentage of revenue decreased to 77.7% for the fiscal year ended June 30, 2018 from 81.0% for the fiscal year ended June 30, 2017.
Commissions and Incentives. Commissions and incentives expenses for the fiscal year ended June 30, 2018 were $98.2 million or 48.3% of revenue compared to $96.7 million or 48.5% of revenue for the fiscal year ended June 30, 2017. The increase in total expense of $1.5 million in fiscal 2018 was primarily due to increased investments made in our Red Carpet program to attract and retain new distributor leaders. As a percentage of revenue, commissions and incentives expenses decreased by 0.2% in fiscal 2018. The decrease was primarily driven by the timing and number of promotional and incentive activities and continued refinements made to our commission and incentive programs during fiscal 2018 to better align the programs with current growth and expansion initiatives. We expect commissions and incentives expenses to remain relatively
38
stable as a percentage of net sales, with some fluctuations caused by changes to compensation and incentive programs and initiatives and strategic investing in our Red Carpet program.
Selling, General and Administrative. Selling, general and administrative expenses for the fiscal year ended June 30, 2018 were $59.8 million or 29.4% of revenue compared to $64.9 million or 32.5% of revenue for the fiscal year ended June 30, 2017. The decrease of $5.1 million was primarily due to the significant legal and accounting expenses incurred during the prior year associated with the 2016 independent review conducted by the audit committee of our board of directors. Additionally, event expenses decreased due to one fewer event held during fiscal 2018. We expect selling, general and administrative expenses, as a percent of revenue, to remain relatively consistent with fiscal 2018 as we continue to refine our strategic initiatives and coordinate our spending with sales trends and geographic expansion.
Primary factors that may cause our selling, general and administrative expenses to fluctuate in the future include changes in the number of employees, the timing and number of events we hold, marketing and branding initiatives and costs related to legal matters, if and as they arise. A fluctuation in our stock price may also impact our share-based compensation expense recorded for liability classified awards and equity awards made in future years.
Other Expense, Net. We recognized other expense for the fiscal year ended June 30, 2018 of $0.8 million as compared to $1.5 million for the fiscal year ended June 30, 2017. The decrease of $0.8 million was due to a decrease of $0.1 million in interest expense related to the reduction in the outstanding balance on our term loan during the year and a decrease of $0.7 million in other expenses related to decreased foreign exchange losses and the write-off of intangible assets during fiscal 2017.
The following table sets forth interest expense for the fiscal years ended June 30, 2018 and 2017 (in thousands):
For the fiscal years ended June 30, | |||||||
2018 | 2017 | ||||||
Contractual interest expense: | |||||||
2016 Term Loan | $ | 346 | $ | 439 | |||
Amortization of deferred financing fees: | |||||||
2016 Term Loan | 11 | 12 | |||||
Amortization of debt discount: | |||||||
2016 Term Loan | 21 | 19 | |||||
Other | 78 | 100 | |||||
Total interest expense | $ | 456 | $ | 570 | |||
Income Tax Expense. Our income tax expense for the fiscal year ended June 30, 2018 was $3.8 million as compared to income tax expense of $1.3 million for the fiscal year ended June 30, 2017.
On December 22, 2017, the President of the United States of America signed tax reform legislation (the “2017 Tax Act”), which includes a broad range of tax reform affecting businesses, including corporate tax rates, business deductions, and international tax regulations. Among these changes, the 2017 Tax Act reduces the corporate tax rate from 35% to 21% effective December 31, 2017. This change in tax rate has been recognized in our current fiscal year 2018 expense. Current taxes for fiscal 2018 are accounted for at a blended rate of 28%, and we have revalued our deferred tax assets and liabilities to the reduced rates based on the period in which those assets and liabilities are expected to reverse. The incorporation of the changes resulting from the 2017 Tax Act in our tax related accounts during fiscal 2018 resulted in a significant increase to our year to date effective tax rate due to the revaluation of our deferred tax accounts.
Our provision for income taxes for the fiscal year ended June 30, 2018 consisted primarily of federal, state, and foreign tax on anticipated fiscal 2018 income which was partially offset by tax benefits. We expect our effective rate to fluctuate in future periods based on the impact of permanent items in relation to pre-tax income.
Net Income. As a result of the foregoing factors, net income for the fiscal year ended June 30, 2018 increased to $5.8 million compared to $1.6 million for the fiscal year ended June 30, 2017.
Comparison of Fiscal Years Ended June 30, 2017 and 2016
Revenue, net. We generated net revenue of $199.5 million and $206.5 million during the fiscal years ended June 30, 2017 and 2016, respectively. The overall decrease in sales of $7.0 million in fiscal 2017 primarily was due to decreases in revenue in our United States and Hong Kong markets. During fiscal 2017, we took steps, following the completion of the 2016
39
independent review conducted by the audit committee of our board of directors, to help ensure that our products were not distributed or sold into countries without complying with applicable customs, tax and other regulatory requirements and to appropriately verify the residency of individuals who want to become our independent distributors. During the fiscal years ended June 30, 2017 and 2016, we estimated that approximately $3.0 million and $17.3 million in net revenue, respectively, related to sales of our products to independent distributors who may have carried or shipped such products into countries in which our products are not registered or that otherwise impose stringent restrictions on our direct selling model.
Americas. The following table sets forth revenue for the fiscal years ended June 30, 2017 and 2016 for the Americas region (in thousands):
For the fiscal years ended June 30, | ||||||||||
2017 | 2016 | % change | ||||||||
United States | $ | 144,842 | $ | 152,830 | (5.2 | )% | ||||
Other | 5,999 | 5,461 | 9.9 | % | ||||||
Americas Total | $ | 150,841 | $ | 158,291 | (4.7 | )% | ||||
Revenue in the Americas region for the fiscal year ended June 30, 2017 decreased $7.5 million or 4.7% compared to the prior year. The decrease in revenue during the fiscal year ended June 30, 2017 was due to a decrease in the number of active distributors of 4.1% and a decrease in the number of customers of 5.3%. The more restrictive policies that we implemented in connection with the 2016 audit committee review also contributed to the decline in revenue.
Asia/Pacific & Europe. The following table sets forth revenue for the fiscal years ended June 30, 2017 and 2016 for the Asia/Pacific & Europe region and its principal markets (in thousands):
For the fiscal years ended June 30, | ||||||||||
2017 | 2016 | % change | ||||||||
Japan | $ | 39,390 | $ | 36,343 | 8.4 | % | ||||
Hong Kong | 3,852 | 7,964 | (51.6 | )% | ||||||
Other | 5,406 | 3,942 | 37.1 | % | ||||||
Asia/Pacific & Europe Total | $ | 48,648 | $ | 48,249 | 0.8 | % | ||||
Revenue in the region for the fiscal year ended June 30, 2017 was positively impacted approximately $2.5 million, or 5.3%, by foreign currency exchange rate fluctuations.
Local currency revenue in Japan increased 1.3% in fiscal 2017 compared to fiscal 2016. During the fiscal year ended June 30, 2017, the Japanese yen, on average, continued to strengthen against the U.S. Dollar, positively impacting our revenue in this market by $2.5 million or 6.9%. The more restrictive policies that we implemented in connection with the 2016 audit committee review as disclosed previously contributed to the decline in revenue in Hong Kong.
Gross Margin. Cost of sales were $33.5 million for the fiscal year ended June 30, 2017, and $33.9 million for the fiscal year ended June 30, 2016, resulting in a gross margin of $166.0 million, or 83.2%, and $172.6 million, or 83.6%, respectively. The decrease in gross margin as a percentage of revenues primarily was due to increased costs associated with the obsolescence, storage, handling and shipment of inventory.
Operating Expenses. Total operating expenses for the fiscal year ended June 30, 2017 were $161.6 million as compared to operating expenses of $159.2 million for the fiscal year ended June 30, 2016. Operating expenses as a percentage of revenue increased to 81.0% for the fiscal year ended June 30, 2017 from 77.0% for the fiscal year ended June 30, 2016.
Commissions and Incentives. Commissions and incentives expenses for the fiscal year ended June 30, 2017 were $96.7 million or 48.5% of revenue compared to $103.1 million or 49.9% of revenue for the fiscal year ended June 30, 2016. The decrease in expense of $6.5 million in fiscal year 2017 primarily was due to the overall decrease in sales. As a percentage of revenue, commissions and incentives expenses decreased by 1.4% in fiscal year 2017. The decrease was primarily driven by refinements made to our commission and incentive programs during fiscal 2017 to align the programs with current growth and expansion initiatives.
Selling, General and Administrative. Selling, general and administrative expenses for the fiscal year ended June 30, 2017 were $64.9 million compared to $56.1 million for the fiscal year ended June 30, 2016. The increase of $8.8 million primarily
40
was due to increased legal and accounting expenses associated with the 2016 independent review conducted by the audit committee, which was completed during the quarter ended December 31, 2016. Additionally, expenses increased due to increased event expenses and increased expenses associated with employee salaries, benefits, stock compensation and travel as a result of executive turnover and increased head count compared to the prior year period.
Other Expense, Net. We recognized other expense for the fiscal year ended June 30, 2017 of $1.5 million as compared to $4.7 million for the fiscal year ended June 30, 2016. The decrease of $3.2 million was due to a decrease of $2.8 million in interest expense related to the write-off of debt transaction costs pursuant to the debt refinance completed during the prior year and a decrease of $0.4 million in other expenses related to the disposal of fixed assets recorded during fiscal 2016 partially offset by write-off of intangible assets during fiscal 2017.
Income Tax Expense. Our income tax expense for the fiscal year ended June 30, 2017 was $1.3 million as compared to $2.6 million for the fiscal year ended June 30, 2016. Our provision for income taxes for the fiscal year ended June 30, 2017 consisted primarily of federal, state, and foreign tax on anticipated fiscal 2017 income which was partially offset by tax benefits related to a deduction for domestic production activities and benefits related to foreign tax rate differences as we established a permanent reinvestment assertion during fiscal 2016.
Net Income. As a result of the foregoing factors, net income for the fiscal year ended June 30, 2017 decreased to $1.6 million compared to $6.1 million for the fiscal year ended June 30, 2016.
Liquidity and Capital Resources
Liquidity
Our primary liquidity and capital resource requirements are to service our debt and finance the cost of our planned operating expenses and working capital (principally inventory purchases), as well as capital expenditures. We have generally relied on cash flow from operations to fund operating activities and we have, at times, incurred long-term debt in order to fund stock repurchases and strategic transactions.
At June 30, 2018, our cash and cash equivalents were $16.7 million. This represented an increase of $5.2 million from the $11.5 million in cash and cash equivalents as of June 30, 2017.
During the fiscal year ended June 30, 2018, our net cash provided by operating activities was $13.3 million as compared to net cash provided by operating activities of $6.6 million during the fiscal year ended June 30, 2017. The increase in cash provided by operating activities during the fiscal year ended June 30, 2018 primarily was due to an increase in net income and a decrease in cash used for payables, partially offset by inventory decreasing at a slower rate than the prior year.
During the fiscal year ended June 30, 2018, our net cash used in investing activities was $4.6 million, due to our investment in new technology and the purchase of fixed assets. During the fiscal year ended June 30, 2017, our net cash used in investing activities was $1.1 million, due to the purchase of fixed assets.
Cash used in financing activities during the fiscal year ended June 30, 2018 was $3.5 million primarily as a result of our quarterly principal payments on the 2016 Term Loan, as amended, and our repurchase of shares of our common stock. Cash used in financing activities during the fiscal year ended June 30, 2017 was $2.0 million as a result of principal payments on the 2016 Term Loan.
At June 30, 2018 and 2017, the total amount of our foreign subsidiary cash was $4.3 million and $6.6 million, respectively. As a result of the 2017 Tax Act, companies are required to pay a one-time deemed repatriation tax on net un-taxed foreign unrepatriated earnings. Companies are able to offset this deemed repatriation tax with previously unused foreign tax credits. The 2017 Tax Act also enacted a 100% dividend deduction for greater than 10% owned foreign corporations. Therefore, in the future, if needed, we can repatriate cash from foreign subsidiaries without paying additional U.S. federal income taxes. Foreign withholding taxes on dividend income and potential state taxes are still in effect. We completed our analysis of all foreign based earnings as of June 30, 2018, and do not expect any additional income tax liabilities associated with the deemed repatriation provision due to our large foreign tax pool in Japan.
At June 30, 2018, we had working capital (current assets minus current liabilities) of $15.1 million compared to working capital of $12.2 million at June 30, 2017. The increase in working capital primarily was due to an increase in cash and a decrease in accounts payable, partially offset by a decrease in inventory. We believe that our cash and cash equivalents balances and our ongoing cash flow from operations will be sufficient to satisfy our cash requirements for at least the next 12 months. The majority of our historical expenses have been variable in nature and, as such, a potential reduction in the level of revenue would reduce our cash flow needs. In the event that our current cash balances and future cash flow from operations are not sufficient to meet our obligations or strategic needs, we would consider raising additional funds, which may not be available on terms that are acceptable to us, or at all. Our credit facility, however, contains covenants that restrict our ability to raise
41
additional funds in the debt or equity markets and repurchase our equity securities without prior approval from the lender. Additionally, we would consider realigning our strategic plans including a reduction in capital spending and expenses.
Capital Resources
On March 30, 2016, we entered into a loan agreement (the "2016 Loan Agreement") to refinance our outstanding debt. In connection with the 2016 Loan Agreement and on the same date, we entered into a security agreement (the "Security Agreement"). The 2016 Loan Agreement provides for a term loan in an aggregate principal amount of $10.0 million (the "2016 Term Loan") and a revolving loan facility in an aggregate principal amount not to exceed $2.0 million (the "2016 Revolving Loan," and collectively with the 2016 Term Loan, the 2016 Loan Agreement and the 2016 Security Agreement, the "2016 Credit Facility").
The principal amount of the 2016 Term Loan is payable in consecutive quarterly installments in the amount of $0.5 million plus accrued interest beginning with the fiscal quarter ended June 30, 2016. If we borrow under the 2016 Revolving Loan, interest will be payable quarterly in arrears on the last day of each fiscal quarter.
On May 4, 2018, we entered into a loan modification agreement, which amended the 2016 Credit Facility (“Amendment No. 1”). Amendment No. 1 revised the maturity date from March 30, 2019 to March 31, 2021 and increased the fixed interest rate for the term loan from 4.93% to 5.68%. Amendment No. 1 also revised certain financial covenants. The minimum fixed charge coverage ratio (as defined in Amendment No. 1) was revised from a minimum of 1.50 to 1.00 to 1.25 to 1.00, measured on a trailing twelve-month basis, at the end of each fiscal quarter. The minimum working capital was increased from $5.0 million to $8.0 million. The funded debt to EBITDA ratio was replaced with the total liabilities to tangible net worth ratio (as defined in Amendment No. 1) of not greater than 3.00 to 1.00 at the end of each quarter. The minimum tangible net worth measure was removed from the financial covenants.
Loans outstanding under the 2016 Credit Facility, as amended, may be prepaid in whole or in part at any time without premium or penalty. In addition, if, at any time, the aggregate principal amount outstanding under the 2016 Revolving Loan, as amended, exceeds $2.0 million, we must prepay an amount equal to such excess. Any principal amount of the 2016 Term Loan, as amended, which is prepaid or repaid may not be re-borrowed.
The 2016 Credit Facility, as amended, contains customary covenants, including affirmative and negative covenants that, among other things, restrict our ability to create certain types of liens, incur additional indebtedness, declare or pay dividends on or redeem capital stock, make other payments to holders of our equity interests, make certain investments, purchase or otherwise acquire all or substantially all the assets or equity interests of other companies, sell assets or enter into consolidations, mergers or transfers of all or any substantial part of our assets. As of June 30, 2018, we were in compliance with all applicable non-financial and restrictive covenants under the 2016 Credit Facility, as amended.
The 2016 Credit Facility, as amended, also contains various financial covenants that require us to maintain certain consolidated working capital amounts, total liabilities to tangible net worth ratios and fixed charge coverage ratios. Specifically, we must:
• | Maintain a minimum fixed charge coverage ratio (as defined in the 2016 Loan Agreement, as amended) of at least 1.25 to 1.00 at the end of each fiscal quarter, measured on a trailing twelve month basis; |
• | Maintain minimum consolidated working capital (as defined in the 2016 Loan Agreement, as amended) at the end of each fiscal quarter of at least $8.0 million; and |
• | Maintain a ratio of total liabilities to tangible net worth (as defined in the 2016 Loan Agreement, as amended) of not greater than 3.00 to 1.00 at the end of each quarter, measured on a trailing twelve month basis. |
As of June 30, 2018, we were in compliance with all applicable financial covenants under the 2016 Credit Facility, as amended. Additionally, management anticipates that in the normal course of operations we will be in compliance with the financial covenants during the ensuing year.
42
Commitments and Obligations
The following table summarizes our contractual payment obligations and commitments as of June 30, 2018 (in thousands):
Payments due by period | |||||||||||||||||||
Contractual Obligations | Total | Less than 1 year | 1-3 years | 3-5 years | Thereafter | ||||||||||||||
Long-term debt obligations | $ | 5,500 | $ | 2,000 | $ | 3,500 | $ | — | $ | — | |||||||||
Interest on long-term debt obligations | 479 | 274 | 205 | — | — | ||||||||||||||
Operating lease obligations | 11,011 | 2,815 | 5,805 | 2,391 | — | ||||||||||||||
Other operating obligations (1) | 9,466 | 9,466 | — | — | — | ||||||||||||||
Total | $ | 26,456 | $ | 14,555 | $ | 9,510 | $ | 2,391 | $ | — | |||||||||
(1) | Other operating obligations represent non-cancelable contractual obligations primarily related to marketing and sponsorship commitments, and purchases of inventory. |
Off-Balance Sheet Arrangements
At June 30, 2018 and 2017, we had no off-balance sheet arrangements.
Critical Accounting Policies
We prepare our financial statements in conformity with accounting principles generally accepted in the United States of America. As such, we are required to make certain estimates, judgments, and assumptions that we believe are reasonable based upon the information available. These estimates and assumptions affect the reported amounts of assets and liabilities at the date of the financial statements and the reported amounts of revenues and expenses during the periods presented. Actual results could differ from these estimates. Our significant accounting policies are described in Note 2 to our financial statements. Certain of these significant accounting policies require us to make difficult, subjective, or complex judgments or estimates. We consider an accounting estimate to be critical if (1) the accounting estimate requires us to make assumptions about matters that were highly uncertain at the time the accounting estimate was made and (2) changes in the estimate that are reasonably likely to occur from period to period, or use of different estimates that we reasonably could have used in the current period, would have a material impact on our financial condition or results of operations.
There are other items within our financial statements that require estimation, but are not deemed critical as defined above. Changes in estimates used in these and other items could have a material impact on our financial statements. Management has discussed the development and selection of these critical accounting estimates with our board of directors, and the audit committee has reviewed the disclosures noted below.
Allowances for Product Returns
We record allowances for product returns at the time we ship the product based on estimated return rates. Subject to some exceptions based on local regulations, customers may return unopened product to us within 30 days of purchase for a refund of the purchase price less shipping and handling. As of June 30, 2018, our shipments of products sold totaling approximately $18.4 million were subject to our return policy. In addition, we allow terminating distributors to return up to 30% of unopened, unexpired product that they purchased within the prior twelve months.
We monitor our product returns estimate on an ongoing basis and revise the allowances to reflect our experience. Our allowance for product returns was $0.4 million at June 30, 2018, compared with $0.4 million at June 30, 2017. To date, product expiration dates have not played any role in product returns, and we do not expect they will in the future as it is unlikely that we will ship product with an expiration date earlier than the latest allowable product return date.
Inventory Valuation
We value our inventory at the lower of cost or net realizable value on a first-in, first-out basis. Accordingly, we reduce our inventories for the diminution of value resulting from product obsolescence, damage or other issues affecting marketability equal to the difference between the cost of the inventory and its estimated market value. Factors utilized in the determination of estimated market value include (i) current sales data and historical return rates, (ii) estimates of future demand, (iii) competitive pricing pressures, (iv) new production introductions, (v) product expiration dates, and (vi) component and packaging obsolescence.
During the fiscal years ended June 30, 2018 and 2017, we recognized expenses of $1.4 million and $1.3 million, respectively, related to obsolete and slow-moving inventory.
43
Revenue Recognition
We ship the majority of our product directly to the consumer and receive substantially all payment for these sales in the form of credit card receipts. Revenue from direct product sales to customers is recognized upon shipment, which is when passage of title and risk of loss occurs.
Stock-Based Compensation
We use the fair value approach to account for stock-based compensation in accordance with current accounting guidance. We recognize compensation costs for awards with performance conditions when we conclude it is probable that the performance conditions will be achieved. We reassess the probability of vesting at each balance sheet date and adjust compensation costs based on our probability assessment. For awards with market-based performance conditions, the cost of the awards is recognized as the requisite service is rendered by the employees, regardless of when, if ever, the market-based performance conditions are satisfied.
Research and Development Costs
We expense all of our costs related to research and development activities as incurred.
Legal Accruals
We are occasionally involved in lawsuits and disputes arising in the normal course of business. Management regularly reviews all pending litigation matters in which we are involved and establishes accruals as we deem appropriate for these litigation matters when a probable loss estimate can be made. Estimated accruals require management judgment about future events. The results of lawsuits are inherently unpredictable and unfavorable resolutions could occur. As such, the amount of loss may differ from management estimates.
Recently Issued Accounting Standards
Refer to “Item 8. Financial Statements and Supplementary Data” and Note 2 to our consolidated financial statements included in Part IV, Item 15 of this report for discussion regarding the impact of accounting standards that were recently issued but not yet effective, on our consolidated financial statements.
ITEM 7A — QUANTITATIVE AND QUALITATIVE DISCLOSURES ABOUT MARKET RISK
We conduct business in several countries and intend to continue to grow our international operations. Net revenue, operating income, and net income are affected by fluctuations in currency exchange rates and other uncertainties in doing business and selling products in more than one currency. In addition, our operations are exposed to risks associated with changes in social, political and economic conditions inherent in international operations, including changes in the laws and policies that govern international investment in countries where we have operations, as well as, to a lesser extent, changes in U.S. laws and regulations relating to international trade and investment.
Foreign Currency Risk
During the fiscal year ended June 30, 2018, approximately 30% of our net revenue was realized outside of the United States. The local currency of each international subsidiary is generally the functional currency. All revenues and expenses are translated at weighted average exchange rates for the periods reported. Therefore, our reported revenue and earnings will be positively impacted by a weakening of the U.S. Dollar and will be negatively impacted by a strengthening of the U.S. Dollar. Currency fluctuations, however, have the opposite effect on our expenses incurred outside the United States. Given the large portion of our business derived from Japan, any weakening of the Japanese Yen will negatively impact our reported revenue and profits, whereas a strengthening of the Japanese Yen will positively impact our reported revenue and profits. Because of the uncertainty of exchange rate fluctuations, it is difficult to predict the effect of these fluctuations on our future business, product pricing and results of operations or financial condition. Changes in various currency exchange rates affect the relative prices at which we sell our products. We regularly monitor our foreign currency risks and periodically take measures to reduce the risk of foreign exchange rate fluctuations on our operating results. Additionally, we may seek to reduce our exposure to fluctuations in foreign currency exchange rates through the use of foreign currency exchange contracts. We do not use derivative financial instruments for trading or speculative purposes. At June 30, 2018, we did not have any derivative instruments. A 10% strengthening of the U.S. Dollar compared to all of the foreign currencies in which we transact business would have resulted in a 2.7% decrease of our 2018 fiscal year revenue, in the amount of $5.5 million.
44
Following are the average currency exchange rates of U.S. $1 into local currency for each of our international or foreign markets:
Year ended June 30, 2018 | Year ended June 30, 2017 | ||||||||||||||||||||||
1st Quarter | 2nd Quarter | 3rd Quarter | 4th Quarter | 1st Quarter | 2nd Quarter | 3rd Quarter | 4th Quarter | ||||||||||||||||
Japan | 110.94 | 112.89 | 108.33 | 109.12 | 102.40 | 109.38 | 113.72 | 111.10 | |||||||||||||||
Australia | 1.27 | 1.30 | 1.27 | 1.32 | 1.32 | 1.34 | 1.32 | 1.33 | |||||||||||||||
Hong Kong | 7.82 | 7.81 | 7.83 | 7.85 | 7.76 | 7.76 | 7.76 | 7.79 | |||||||||||||||
Mexico | 17.82 | 18.99 | 18.73 | 19.40 | 18.76 | 19.88 | 20.32 | 18.57 | |||||||||||||||
Canada | 1.25 | 1.27 | 1.26 | 1.29 | 1.30 | 1.34 | 1.32 | 1.35 | |||||||||||||||
Thailand | 33.44 | 32.99 | 31.63 | 31.99 | 34.92 | 35.48 | 35.21 | 34.39 | |||||||||||||||
Europe | 0.85 | 0.85 | 0.81 | 0.84 | 0.90 | 0.93 | 0.94 | 0.91 | |||||||||||||||
Taiwan | 30.26 | 30.13 | 29.32 | 29.80 | 31.67 | 31.74 | 31.04 | 30.22 | |||||||||||||||
ITEM 8 — FINANCIAL STATEMENTS AND SUPPLEMENTARY DATA
The information required by this Item 8 is set forth in the consolidated financial statements included in Part IV, Item 15 of this report and is incorporated into this Item 8 by reference.
ITEM 9 — CHANGES IN AND DISAGREEMENTS WITH ACCOUNTANTS ON ACCOUNTING AND FINANCIAL DISCLOSURE
None.
ITEM 9A — CONTROLS AND PROCEDURES
Disclosure Controls and Procedures
We maintain disclosure controls and procedures (as defined in Rules 13a-15(e) and 15d-15(e) of the Exchange Act) that are designed to ensure that the information required to be disclosed in the reports we file or submit under the Securities Exchange Act of 1934, as amended (the "Exchange Act") is recorded, processed, summarized and reported within the time periods specified in the rules and forms of the SEC and that such information is accumulated and communicated to management, including our Chief Executive Officer and Chief Financial Officer, as appropriate, to allow timely decisions regarding required disclosure. Our management, with the participation of our Chief Executive Officer and our Chief Financial Officer, has evaluated the effectiveness of our disclosure controls and procedures, as defined in Rules 13a-15(e) and 15d-15(e) under the Exchange Act, as amended, as of June 30, 2018. Based on this evaluation, our Chief Executive Officer and Chief Financial Officer concluded that our disclosure controls and procedures were designed and operating effectively as of June 30, 2018.
Management’s Report on Internal Control Over Financial Reporting
Our management is responsible for establishing and maintaining adequate internal control over financial reporting, as defined in Exchange Act Rules 13a-15(f) and 15d-15(f). Our system of internal control over financial reporting is designed to provide reasonable assurance to our management and board of directors regarding the preparation and fair presentation of our consolidated and combined financial statements for external purposes in accordance with GAAP.
Our management, under the supervision of our Chief Executive Officer and our Chief Financial Officer, assessed the effectiveness of our internal control over financial reporting as of June 30, 2018. In making this assessment, we used the framework included in Internal Control - Integrated Framework published by the Committee of Sponsoring Organizations of the Treadway Commission 2013 (COSO). Based on that evaluation, our management has concluded that internal control over financing reporting was effective as of June 30, 2018.
Auditor’s Attestation Report on Internal Control Over Financial Reporting
WSRP, LLC, our independent registered public accounting firm, has audited our consolidated financial statements included in this annual report on Form 10-K and has issued an attestation report, included herein, on the effectiveness of our internal control over financial reporting as of June 30, 2018.
Changes in Internal Control over Financial Reporting
45
There were no changes in our internal control over financial reporting during the quarter ended June 30, 2018 that have materially affected or are reasonably likely to materially affect our internal control over financial reporting.
Inherent Limitations on Effectiveness of Controls
Our management, including our Chief Executive Officer and our Chief Financial Officer, cannot provide absolute assurance that our disclosure controls or our internal control over financial reporting will prevent or detect all error and all fraud. A control system, no matter how well designed and operated, can provide only reasonable, not absolute, assurance that the control system’s objectives will be met. The design of a control system must reflect the fact that there are resource constraints, and the benefits of controls must be considered relative to their costs. Further, because of the inherent limitations in all control systems, no evaluation of controls can provide absolute assurance that misstatements due to error or fraud will not occur or that all control issues and instances of fraud, if any, have been detected. These inherent limitations include the realities that judgments in decision-making can be faulty and that breakdowns can occur because of simple error or mistake. Controls can also be circumvented by the individual acts of some persons, by collusion of two or more people, or by management override of the controls. The design of any system of controls is based in part on certain assumptions about the likelihood of future events, and there can be no assurance that any design will succeed in achieving its stated goals under all potential future conditions. Projections of any evaluation of controls effectiveness to future periods are subject to risks. Over time, controls may become inadequate because of changes in conditions or deterioration in the degree of compliance with policies or procedures.
ITEM 9B — OTHER INFORMATION
None.
PART III
Certain information required by Part III of this report is omitted from this report pursuant to General Instruction G(3) of Form 10-K because we will file a definitive proxy statement pursuant to Regulation 14A for our 2019 annual meeting of shareholders (the “Proxy Statement”) not later than 120 days after the end of the fiscal year covered by this report, and the information included in the Proxy Statement that is required by Part III of this report is incorporated herein by reference.
ITEM 10 — DIRECTORS, EXECUTIVE OFFICERS AND CORPORATE GOVERNANCE
Incorporated herein by reference to the information to be set forth in the Proxy Statement.
ITEM 11 — EXECUTIVE COMPENSATION
Incorporated herein by reference to the information to be set forth in the Proxy Statement.
ITEM 12 — SECURITY OWNERSHIP OF CERTAIN BENEFICIAL OWNERS AND MANAGEMENT AND RELATED STOCKHOLDER MATTERS.
Incorporated herein by reference to the information to be set forth in the Proxy Statement.
ITEM 13 — CERTAIN RELATIONSHIP AND RELATED TRANSACTIONS, AND DIRECTORS INDEPENDENCE
Incorporated herein by reference to the information to be set forth in the Proxy Statement.
ITEM 14 — PRINCIPAL ACCOUNTING FEES AND SERVICES
Incorporated herein by reference to the information to be set forth in the Proxy Statement.
PART IV
ITEM 15 — EXHIBITS, FINANCIAL STATEMENT SCHEDULES
The following documents are being filed as part of this report:
Financial Statements
See the information beginning on page F-1 of this report.
46
Exhibits
Exhibit No. | Document Description | Filed Herewith or Incorporated by Reference From | ||
2.1 | Exhibit to 2.1 to Form 8-K filed on March 13, 2018. | |||
3.1 | Exhibit to 3.1 to Form 8-K filed on March 13, 2018. | |||
3.2 | Exhibit to 3.2 to Form 8-K filed on March 13, 2018. | |||
3.3 | Exhibit to 3.3 to Form 8-K filed on March 13, 2018. | |||
3.4 | Exhibit to 3.4 to Form 8-K filed on March 13, 2018. | |||
4.1 | Exhibit 4.2 to Form 8-K filed on November 18, 2009. | |||
4.2 | Exhibit 4.3 to Form 10-Q for the fiscal quarter ended December 31, 2010 filed on February 16, 2010. | |||
4.3 | Exhibit 4.5 to Form 10-Q for the fiscal quarter ended December 31, 2009 filed on February 16, 2010. | |||
4.4 | Exhibit 4.2 to Form 10-Q for the fiscal quarter ended March 31, 2010 filed on May 14, 2010. | |||
4.5 | Exhibit (a)(1)(ii) to Schedule TO filed on November 29, 2011. | |||
4.6 | Exhibit to 4.1 to Form 8-K filed on March 13, 2018. | |||
10.1 | Exhibit 10.21 to Form 10-K/A for the fiscal year ended June 30, 2009 filed October 28, 2009. | |||
10.2# | Exhibit 10.14 to Form 10-K for the fiscal year ended June 30, 2010 filed on September 15, 2010. | |||
10.3 | Exhibit 10.1 to Form 8-K filed on November 18, 2009. | |||
10.4 | Exhibit 10.3 to Form 10-Q for the fiscal quarter ended December 31, 2009 filed on February 16, 2010. | |||
10.5 | Exhibit 10.1 to Form 10-Q for the fiscal quarter ended March 31, 2010 filed on May 14, 2010. | |||
10.6 | Exhibit 10.2 to Form 10-Q for the fiscal quarter ended March 31, 2010 filed on May 14, 2010. | |||
47
Exhibit No. | Document Description | Filed Herewith or Incorporated by Reference From | ||
10.7 | Exhibit 10.3 to Form 10-Q for the fiscal quarter ended March 31, 2010 filed on May 14, 2010. | |||
10.8 | Exhibit 10.4 to Form 10-Q for the fiscal quarter ended March 31, 2010 filed on May 14, 2010. | |||
10.9# | Appendix B to Proxy Statement on Schedule 14A filed on October 20, 2006. | |||
10.10(a)# | Annex A to Proxy Statement on Schedule A filed on October 6, 2014. | |||
10.10(b)# | Exhibit 4.4 to Registration Statement on Form S-8 (File No. 333-175104) filed on June 23, 2011. | |||
10.10(c)# | Exhibit 4.5 to Registration Statement on Form S-8 (File No. 333-175104) filed on June 23, 2011. | |||
10.10(d)# | Exhibit 10.3 to Form 10-Q for the fiscal quarter ended March 31, 2016 filed on May 4, 2016. | |||
10.11# | Exhibit 10.13 to Form 10-K for the fiscal year ended June 30, 2014 filed on September 10, 2014. | |||
10.12# | Exhibit 10.14 to Form 10-K for the fiscal year ended June 30, 2014 filed on September 10, 2014. | |||
10.13# | Exhibit 10.15 to Form 10-K for the fiscal year ended June 30, 2015 filed on September 1, 2015. | |||
10.14# | Exhibit 10.16 to Form 10-K for the fiscal year ended June 30, 2015 filed on September 1, 2015. | |||
10.15# | Exhibit 10.17 to Form 10-K for the fiscal year ended June 30, 2015 filed on September 1, 2015. | |||
10.16# | Exhibit 10.16 to the Form 10-K for the fiscal year ended June 30, 2016 filed on December 12, 2016. | |||
10.17# | Exhibit 10.17 to the Form 10-K for the fiscal year ended June 30, 2016 filed on December 12, 2016. | |||
10.18# | Exhibit 10.14 to Form 10-K for the fiscal year ended June 30, 2013 filed on September 12, 2013. | |||
10.19# | Exhibit 10.15 to Form 10-K for the fiscal year ended June 30, 2013 filed on September 12, 2013. | |||
10.20# | Exhibit 10.19 to Form 10-K for the fiscal year ended June 30, 2015 filed on September 1, 2015. | |||
48
Exhibit No. | Document Description | Filed Herewith or Incorporated by Reference From | ||
10.21# | Exhibit 10.21 to the Form 10-K for the fiscal year ended June 30, 2016 filed on December 12, 2016. | |||
10.22# | Exhibit 10.1 to Form 8-K filed on February 20, 2015. | |||
10.23# | Exhibit 10.1 to Form 8-K filed on April 29, 2015. | |||
10.24# | Exhibit 10.25 to Form 10-K for the fiscal year ended June 30, 2015 filed on September 1, 2015. | |||
10.25# | Exhibit 10.28 to Form 10-K for the fiscal year ended June 30, 2015 filed on September 1, 2015. | |||
10.26 | Exhibit 10.3 to Form 10-Q for the fiscal quarter ended September 30, 2011 filed on November 14, 2011. | |||
10.27 | Exhibit 10.1 to Form 10-Q for the fiscal quarter ended September 30, 2012 filed on November 8, 2012. | |||
10.28 | Exhibit 10.3 to Form 10-Q for the fiscal quarter ended March 31, 2014 filed on May 6, 2014. | |||
10.29* | Exhibit 10.1 to Form 10-Q for the fiscal quarter ended March 31, 2014 filed on May 6, 2014. | |||
10.30* | Exhibit 10.1 to Form 10-Q/A for the fiscal quarter ended March 31, 2013 filed on May 24, 2013. | |||
10.31* | Exhibit 10.2 to Form 10-Q/A for the fiscal quarter ended March 31, 2013 filed on May 24, 2013. | |||
10.32* | Exhibit 10.29 to Form 10-K for the fiscal year ended June 30, 2014 filed on September 10, 2014. | |||
10.33* | Exhibit 10.30 to Form 10-K for the fiscal year ended June 30, 2014 filed on September 10, 2014. | |||
10.34# | Exhibit (b) to the Schedule TO-I/A filed on October 18, 2013. | |||
10.35# | Exhibit 10.1 to Form 10-Q for the quarter ended March 31, 2015 filed on May 6, 2015. | |||
49
Exhibit No. | Document Description | Filed Herewith or Incorporated by Reference From | ||
10.36 | Exhibit 10.39 to Form 10-K for the fiscal year ended June 30, 2015 filed on September 1, 2015. | |||
10.37 | Exhibit to 99.1 to Form 8-K filed on March 13, 2018. | |||
10.38 | Exhibit 10.1 to Form 8-K filed on April 4, 2016. | |||
10.39 | Exhibit 10.2 to Form 8-K filed on April 4, 2016. | |||
10.40# | Exhibit 99.2 to Form 8-K filed on December 12, 2016. | |||
10.41# | Exhibit 10.1 to Form 8-K filed on January 18, 2017. | |||
10.42# | Exhibit 10.1 to Form 10-Q filed for the fiscal quarter ended December 31, 2016 filed on February 8, 2017. | |||
10.43# | Exhibit 10.1 to Form 8-K filed on March 9, 2017. | |||
10.44# | Exhibit 10.2 to Form 8-K filed on March 9, 2017. | |||
10.45# | Exhibit 10.1 to Form 10-Q filed for the fiscal quarter ended March 31, 2017 filed on May 10, 2017. | |||
10.46# | Exhibit 10.5 to Form 10-Q filed for the fiscal quarter ended March 31, 2017 filed on May 10, 2017. | |||
10.47# | Exhibit 10.6 to Form 10-Q filed for the fiscal quarter ended March 31, 2017 filed on May 10, 2017. | |||
10.48# | Exhibit 10.1 to the Form 8-K filed on February 7, 2018 | |||
10.49# | Exhibit 99.2 to the Registration Statement on Form S-8 (File No. 333-216957) filed on March 27, 2017 | |||
10.50# | Exhibit 99.3 to the Registration Statement on Form S-8 (File No. 333-216957) filed on March 27, 2017 | |||
10.52 | Exhibit 10.1 to Form 10-Q filed for the fiscal quarter ended March 31, 2018 filed on May 9, 2018. | |||
50
Exhibit No. | Document Description | Filed Herewith or Incorporated by Reference From | ||
21.1 | Exhibit 21.1 to Form 10-K for the fiscal year ended June 30, 2014 filed on September 10, 2014. | |||
23.1 | Filed herewith. | |||
24.1 | Power of Attorney | Signature page to this report. | ||
31.1 | Filed herewith. | |||
31.2 | Filed herewith. | |||
32.1 | Furnished herewith. | |||
32.2 | Furnished herewith. | |||
101 | The following financial information from the registrant’s Annual Report on Form 10-K for the year ended June 30, 2018 formatted in XBRL (eXtensible Business Reporting Language): (i) Consolidated Balance Sheets; (ii) Consolidated Statements of Operations and Other Comprehensive Income; (iii) Consolidated Statement of Stockholders’ Deficit; (iv) Consolidated Statements of Cash Flows; and (v) Notes to Consolidated Financial Statements, tagged as blocks of text. | Filed herewith. | ||
# | Management contract or compensatory plan. | |
* | The Company has been granted confidential treatment for portions of this agreement. Accordingly, certain portions of this agreement have been omitted in the version filed with this report and such confidential portions have been filed with the SEC. | |
SIGNATURES
Pursuant to the requirements of Section 13 or 15(d) of the Securities Exchange Act of 1934, the registrant duly caused this report to be signed on its behalf by the undersigned, thereunto duly authorized.
LIFEVANTAGE CORPORATION | |
By: | /s/ Darren Jensen |
Darren Jensen | |
President and Chief Executive Officer | |
Date: | August 15, 2018 |
Each person whose individual signature appears below hereby constitutes and appoints Darren Jensen and Steven Fife, and each of them, with full power of substitution and resubstitution and full power to act without the other, as his or her true and lawful attorney-in-fact and agent to act in his or her name, place and stead and to execute in the name and on behalf of each person, individually and in each capacity stated below, and to file any and all amendments to this report, and to file the same, with all exhibits thereto, and other documents in connection therewith, with the Securities and Exchange Commission, granting unto said attorneys-in-fact and agents, and each of them, full power and authority to do and perform each and every act and
51
thing, ratifying and confirming all that said attorneys-in-fact and agents or any of them or their or his substitute or substitutes may lawfully do or cause to be done by virtue thereof.
Pursuant to the requirements of the Securities Exchange Act of 1934, this report has been signed below by the following persons on behalf of the registrant and in the capacities and on the dates indicated.
Signature | Date | Title | ||
/s/ Darren Jensen | August 15, 2018 | President and Chief Executive Officer (Principal Executive Officer) | ||
Darren Jensen | ||||
/s/ Steven R. Fife | August 15, 2018 | Chief Financial Officer (Principal Financial Officer and Principal Accounting Officer) | ||
Steven R. Fife | ||||
/s/ Garry Mauro | August 15, 2018 | Chairman of the Board | ||
Garry Mauro | ||||
/s/ Michael A. Beindorff | August 15, 2018 | Director | ||
Michael A. Beindorff | ||||
/s/ Raymond B. Greer | August 15, 2018 | Director | ||
Raymond B. Greer | ||||
/s/ Vinayak R. Hedge | August 15, 2018 | Director | ||
Vinayak R. Hedge | ||||
/s/ Darwin K. Lewis | August 15, 2018 | Director | ||
Darwin K. Lewis | ||||
52
LIFEVANTAGE CORPORATION
Index to Consolidated Financial Statements
F - 1
REPORT OF INDEPENDENT REGISTERED PUBLIC ACCOUNTING FIRM
The Board of Directors and Stockholders
LifeVantage Corporation
Sandy, Utah
Opinion on the Financial Statements
We have audited the accompanying consolidated balance sheets of LifeVantage Corporation and subsidiaries (the Company) as of June 30, 2018 and 2017, and the related consolidated statements of operations and comprehensive income, stockholders’ equity, and cash flows for each of the years in the three-year period ended June 30, 2018, and the related notes (collectively referred to as the financial statements). In our opinion, the consolidated financial statements present fairly, in all material respects, the financial position of the Company as of June 30, 2018 and 2017, and the results of its operations and its cash flows for each of the years in the three-year period ended June 30, 2018, in conformity with accounting principles generally accepted in the United States of America.
We also have audited, in accordance with the standards of the Public Company Accounting Oversight Board (United States) (PCAOB), the Company’s internal control over financial reporting as of June 30, 2018, based on criteria established in Internal Control-Integrated Framework (2013) issued by the Committee of Sponsoring Organizations of the Treadway Commission (COSO), and our report dated August 15, 2018, expressed an unqualified opinion.
Basis for Opinion
These consolidated financial statements are the responsibility of the Company’s management. Our responsibility is to express an opinion on the Company’s consolidated financial statements based on our audits. We are a public accounting firm registered with the PCAOB and are required to be independent with respect to the Company in accordance with the U.S. federal securities laws and the applicable rules and regulations of the Securities and Exchange Commission and the PCAOB.
We conducted our audits in accordance with the standards of the PCAOB. Those standards require that we plan and perform the audit to obtain reasonable assurance about whether the financial statements are free of material misstatement, whether due to error or fraud. Our audits included performing procedures to assess the risks of material misstatement of the financial statements, whether due to error or fraud, and performing procedures that respond to those risks. Such procedures included examining, on a test basis, evidence regarding the amounts and disclosures in the financial statements. Our audits also included evaluating the accounting principles used and significant estimates made by management, as well as evaluating the overall presentation of the financial statements. We believe that our audits provide a reasonable basis for our opinion.
/s/ WSRP, LLC
We have served as the Company's auditor since 2016.
Salt Lake City, Utah
August 15, 2018
F - 2
REPORT OF INDEPENDENT REGISTERED PUBLIC ACCOUNTING FIRM
The Board of Directors and Stockholders
LifeVantage Corporation
Sandy, Utah
Opinion on Internal Control over Financial Reporting
We have audited LifeVantage Corporation and subsidiaries’ (the Company) internal control over financial reporting as of June 30, 2018, based on criteria established in Internal Control-Integrated Framework (2013) issued by the Committee of Sponsoring Organizations of the Treadway Commission (COSO). In our opinion, the Company maintained, in all material respects, effective internal control over financial reporting as of June 30, 2018, based on criteria established in Internal Control-Integrated Framework (2013) issued by COSO.
We also have audited, in accordance with the standards of the Public Company Accounting Oversight Board (United States) (PCAOB), the consolidated balance sheets and the related consolidated statements of operations and comprehensive income, stockholders’ equity, and cash flows of the Company, and our report dated August 15, 2018, expressed an unqualified opinion.
Basis for Opinion
The Company’s management is responsible for maintaining effective internal control over financial reporting, and for its assessment of the effectiveness of internal control over financial reporting, included in the accompanying Item 9A, Management Report on Internal Control Over Financial Reporting. Our responsibility is to express an opinion on the Company’s internal control over financial reporting based on our audit. We are a public accounting firm registered with the PCAOB and are required to be independent with respect to the Company in accordance with the U.S. federal securities laws and the applicable rules and regulations of the Securities and Exchange Commission and the PCAOB.
We conducted our audit in accordance with the standards of the PCAOB. Those standards require that we plan and perform the audit to obtain reasonable assurance about whether effective internal control over financial reporting was maintained in all material respects. Our audit of internal control over financial reporting included obtaining an understanding of internal control over financial reporting, assessing the risk that a material weakness exists, and testing and evaluating the design and operating effectiveness of internal control based on the assessed risk. Our audit also included performing such other procedures as we considered necessary in the circumstances. We believe that our audit provides a reasonable basis for our opinion.
Definition and Limitations of Internal Control over Financial Reporting
A company’s internal control over financial reporting is a process designed to provide reasonable assurance regarding the reliability of financial reporting and the preparation of financial statements for external purposes in accordance with generally accepted accounting principles. A company’s internal control over financial reporting includes those policies and procedures that (1) pertain to the maintenance of records that, in reasonable detail, accurately and fairly reflect the transactions and dispositions of the assets of the company; (2) provide reasonable assurance that transactions are recorded as necessary to permit preparation of financial statements in accordance with generally accepted accounting principles, and that receipts and expenditures of the company are being made only in accordance with authorizations of management and directors of the company; and (3) provide reasonable assurance regarding prevention or timely detection of unauthorized acquisition, use, or disposition of the company’s assets that could have a material effect on the financial statements.
Because of its inherent limitations, internal control over financial reporting may not prevent or detect misstatements. Also, projections of any evaluation of effectiveness to future periods are subject to the risk that controls may become inadequate because of changes in conditions, or that the degree of compliance with the policies or procedures may deteriorate.
/s/ WSRP, LLC
Salt Lake City, Utah
August 15, 2018
F - 3
LIFEVANTAGE CORPORATION AND SUBSIDIARIES
CONSOLIDATED BALANCE SHEETS
June 30, | |||||||
2018 | 2017 | ||||||
(In thousands, except per share data) | |||||||
ASSETS | |||||||
Current assets | |||||||
Cash and cash equivalents | $ | 16,652 | $ | 11,458 | |||
Accounts receivable | 2,067 | 1,334 | |||||
Income tax receivable | 451 | 913 | |||||
Inventory, net | 13,627 | 16,575 | |||||
Prepaid expenses and deposits | 6,141 | 5,266 | |||||
Total current assets | 38,938 | 35,546 | |||||
Property and equipment, net | 6,587 | 3,127 | |||||
Intangible assets, net | 1,115 | 1,247 | |||||
Long-term deferred income tax asset | 3,255 | 4,087 | |||||
Other long-term assets | 1,247 | 1,242 | |||||
TOTAL ASSETS | $ | 51,142 | $ | 45,249 | |||
LIABILITIES AND STOCKHOLDERS’ EQUITY | |||||||
Current liabilities | |||||||
Accounts payable | $ | 3,813 | $ | 4,850 | |||
Commissions payable | 7,546 | 6,837 | |||||
Income tax payable | 39 | 215 | |||||
Other accrued expenses | 10,407 | 9,453 | |||||
Current portion of long-term debt | 2,000 | 2,000 | |||||
Total current liabilities | 23,805 | 23,355 | |||||
Long-term debt | |||||||
Principal amount | 3,500 | 5,500 | |||||
Less: unamortized discount and deferred offering costs | (88 | ) | (60 | ) | |||
Long-term debt, net of unamortized discount and deferred offering costs | 3,412 | 5,440 | |||||
Other long-term liabilities | 1,978 | 1,927 | |||||
Total liabilities | 29,195 | 30,722 | |||||
Commitments and contingencies — Note 11 | |||||||
Stockholders’ equity | |||||||
Preferred stock — par value $0.0001 and $0.001 per share, 5,000 and 50,000 shares authorized, no shares issued or outstanding | — | — | |||||
Common stock — par value $0.0001 and $0.001 per share, 40,000 and 250,000 shares authorized and 14,073 and 14,232 issued and outstanding as of June 30, 2018 and 2017, respectively | 1 | 14 | |||||
Additional paid-in capital | 124,663 | 121,599 | |||||
Accumulated deficit | (102,731 | ) | (106,992 | ) | |||
Accumulated other comprehensive income (loss) | 14 | (94 | ) | ||||
Total stockholders’ equity | 21,947 | 14,527 | |||||
TOTAL LIABILITIES AND STOCKHOLDERS’ EQUITY | $ | 51,142 | $ | 45,249 | |||
The accompanying notes are an integral part of these consolidated financial statements.
F - 4
LIFEVANTAGE CORPORATION AND SUBSIDIARIES
CONSOLIDATED STATEMENTS OF OPERATIONS AND COMPREHENSIVE INCOME
For the years ended June 30, | |||||||||||
2018 | 2017 | 2016 | |||||||||
(In thousands, except per share data) | |||||||||||
Revenue, net | $ | 203,204 | $ | 199,489 | $ | 206,540 | |||||
Cost of sales | 34,848 | 33,456 | 33,932 | ||||||||
Gross profit | 168,356 | 166,033 | 172,608 | ||||||||
Operating expenses: | |||||||||||
Commissions and incentives | 98,193 | 96,662 | 103,120 | ||||||||
Selling, general and administrative | 59,840 | 64,922 | 56,074 | ||||||||
Total operating expenses | 158,033 | 161,584 | 159,194 | ||||||||
Operating income | 10,323 | 4,449 | 13,414 | ||||||||
Other expense: | |||||||||||
Interest expense | (456 | ) | (570 | ) | (3,321 | ) | |||||
Other expense, net | (319 | ) | (969 | ) | (1,409 | ) | |||||
Total other expense | (775 | ) | (1,539 | ) | (4,730 | ) | |||||
Income before income taxes | 9,548 | 2,910 | 8,684 | ||||||||
Income tax expense | (3,787 | ) | (1,302 | ) | (2,578 | ) | |||||
Net income | $ | 5,761 | $ | 1,608 | $ | 6,106 | |||||
Net income per share: | |||||||||||
Basic | $ | 0.41 | $ | 0.12 | $ | 0.44 | |||||
Diluted | $ | 0.41 | $ | 0.11 | $ | 0.42 | |||||
Weighted-average shares outstanding: | |||||||||||
Basic | 13,992 | 13,881 | 13,730 | ||||||||
Diluted | 14,136 | 14,118 | 14,531 | ||||||||
Other comprehensive income (loss), net of tax: | |||||||||||
Foreign currency translation adjustment | 108 | (87 | ) | 244 | |||||||
Other comprehensive income (loss), net of tax: | 108 | (87 | ) | 244 | |||||||
Comprehensive income | $ | 5,869 | $ | 1,521 | $ | 6,350 | |||||
The accompanying notes are an integral part of these consolidated financial statements.
F - 5
LIFEVANTAGE CORPORATION AND SUBSIDIARIES
CONSOLIDATED STATEMENTS OF STOCKHOLDERS’ EQUITY
For the years ended June 30, 2018, 2017 and 2016
Common Stock | Additional Paid-In Capital | Accumulated Deficit | Accumulated Other Comprehensive Income (Loss) | Total | ||||||||||||||||||
Shares | Amount | |||||||||||||||||||||
(In thousands) | ||||||||||||||||||||||
Balances, June 30, 2015 | 13,958 | $ | 14 | $ | 116,749 | $ | (114,706 | ) | $ | (251 | ) | $ | 1,806 | |||||||||
Stock-based compensation | — | — | 1,966 | — | — | 1,966 | ||||||||||||||||
Exercise of options and warrants | 52 | — | 527 | — | — | 527 | ||||||||||||||||
Issuance of shares related to restricted stock | 76 | — | — | — | — | — | ||||||||||||||||
Shares canceled or surrendered as payment of tax withholding | (58 | ) | — | — | — | — | — | |||||||||||||||
Currency translation adjustment | — | — | — | — | 244 | 244 | ||||||||||||||||
Net income | — | — | — | 6,106 | — | 6,106 | ||||||||||||||||
Balances, June 30, 2016 | 14,028 | $ | 14 | $ | 119,242 | $ | (108,600 | ) | $ | (7 | ) | $ | 10,649 | |||||||||
Stock-based compensation | — | — | 2,315 | — | — | 2,315 | ||||||||||||||||
Exercise of options and warrants | 76 | — | 42 | — | — | 42 | ||||||||||||||||
Issuance of shares related to restricted stock | 166 | — | — | — | — | — | ||||||||||||||||
Shares canceled or surrendered as payment of tax withholding | (38 | ) | — | — | — | — | — | |||||||||||||||
Currency translation adjustment | — | — | — | — | (87 | ) | (87 | ) | ||||||||||||||
Net income | — | — | — | 1,608 | — | 1,608 | ||||||||||||||||
Balances, June 30, 2017 | 14,232 | $ | 14 | $ | 121,599 | $ | (106,992 | ) | $ | (94 | ) | $ | 14,527 | |||||||||
Stock-based compensation | — | — | 2,990 | — | — | 2,990 | ||||||||||||||||
Exercise of options and warrants | 21 | — | 61 | — | — | 61 | ||||||||||||||||
Issuance of shares related to restricted stock | 190 | — | — | — | — | — | ||||||||||||||||
Shares canceled or surrendered as payment of tax withholding | (66 | ) | — | — | — | — | — | |||||||||||||||
Repurchase of company stock | (304 | ) | — | — | (1,500 | ) | — | (1,500 | ) | |||||||||||||
Change in par value of common stock | — | (13 | ) | 13 | — | — | — | |||||||||||||||
Currency translation adjustment | — | — | — | — | 108 | 108 | ||||||||||||||||
Net income | — | — | — | 5,761 | — | 5,761 | ||||||||||||||||
Balances, June 30, 2018 | 14,073 | $ | 1 | $ | 124,663 | $ | (102,731 | ) | $ | 14 | $ | 21,947 | ||||||||||
The accompanying notes are an integral part of these consolidated financial statements.
F - 6
LIFEVANTAGE CORPORATION AND SUBSIDIARIES
CONSOLIDATED STATEMENTS OF CASH FLOWS
For the years ended June 30, | |||||||||||
2018 | 2017 | 2016 | |||||||||
(In thousands) | |||||||||||
Cash Flows from Operating Activities: | |||||||||||
Net income | $ | 5,761 | $ | 1,608 | $ | 6,106 | |||||
Adjustments to reconcile net income to net cash provided by operating activities: | |||||||||||
Depreciation and amortization | 1,325 | 1,643 | 1,895 | ||||||||
Loss on disposal of fixed assets | — | — | 1,186 | ||||||||
Stock-based compensation | 3,196 | 2,647 | 2,621 | ||||||||
Amortization of deferred financing fees | 11 | 12 | 232 | ||||||||
Amortization of debt discount | 21 | 19 | 183 | ||||||||
Write-off of capitalized debt transaction costs pursuant to debt refinance | — | — | 1,544 | ||||||||
Write-off of intangible assets | — | 350 | — | ||||||||
Deferred income tax | 831 | (740 | ) | (2,118 | ) | ||||||
Changes in operating assets and liabilities: | |||||||||||
Accounts receivable | (730 | ) | 160 | (409 | ) | ||||||
Income tax receivable | 462 | (912 | ) | 2,179 | |||||||
Inventory, net | 2,953 | 8,309 | (15,650 | ) | |||||||
Prepaid expenses and deposits | (993 | ) | 3,318 | (356 | ) | ||||||
Other long-term assets | 109 | 103 | 258 | ||||||||
Accounts payable | (1,024 | ) | (6,210 | ) | 3,673 | ||||||
Income tax payable | (175 | ) | (3,132 | ) | 1,481 | ||||||
Other accrued expenses | 1,935 | 135 | 2,243 | ||||||||
Other long-term liabilities | (426 | ) | (713 | ) | 968 | ||||||
Net Cash Provided by Operating Activities | 13,256 | 6,597 | 6,036 | ||||||||
Cash Flows from Investing Activities: | |||||||||||
Purchase of equipment | (4,649 | ) | (1,055 | ) | (562 | ) | |||||
Net Cash Used in Investing Activities | (4,649 | ) | (1,055 | ) | (562 | ) | |||||
Cash Flows from Financing Activities: | |||||||||||
Proceeds from term loan | — | — | 10,000 | ||||||||
Payment of deferred financing fees | (60 | ) | — | (99 | ) | ||||||
Excess tax benefits from stock-based compensation | — | — | 266 | ||||||||
Repurchase of company stock | (1,500 | ) | — | — | |||||||
Payment on term loan | (2,000 | ) | (2,000 | ) | (22,125 | ) | |||||
Exercise of options and warrants | 61 | 42 | 261 | ||||||||
Net Cash Used in Financing Activities | (3,499 | ) | (1,958 | ) | (11,697 | ) | |||||
Foreign Currency Effect on cash | 86 | (9 | ) | 201 | |||||||
Increase (decrease) in cash and cash equivalents | 5,194 | 3,575 | (6,022 | ) | |||||||
Cash and Cash Equivalents — beginning of period | 11,458 | 7,883 | 13,905 | ||||||||
Cash and Cash Equivalents — end of period | $ | 16,652 | $ | 11,458 | $ | 7,883 | |||||
The accompanying notes are an integral part of these consolidated financial statements.
F - 7
LIFEVANTAGE CORPORATION AND SUBSIDIARIES
CONSOLIDATED STATEMENTS OF CASH FLOWS
For the years ended June 30, | |||||||||||
2018 | 2017 | 2016 | |||||||||
Non Cash Investing and Financing Activities: | |||||||||||
Increase in property and equipment/other long-term liabilities | $ | — | $ | 116 | $ | — | |||||
SUPPLEMENTAL DISCLOSURE OF CASH FLOW INFORMATION | |||||||||||
Cash paid for interest | $ | 345 | $ | 438 | $ | 1,342 | |||||
Cash paid for income taxes | $ | 2,865 | $ | 5,496 | $ | 1,368 | |||||
Common stock shares issued upon cashless warrant exercises | — | 53 | 6 | ||||||||
Total cashless exercise price of warrants | $ | — | $ | 88 | $ | 9 | |||||
Gross warrants underlying cashless exercises | — | 63 | 6 | ||||||||
The accompanying notes are an integral part of these consolidated financial statements.
F - 8
LIFEVANTAGE CORPORATION AND SUBSIDIARIES
NOTES TO CONSOLIDATED FINANCIAL STATEMENTS
Note 1 — The Company
LifeVantage Corporation (the "Company") is a company focused on biohacking the aging code through nutrigenomics, the study of how nutrition and naturally occurring compounds affect our genes. The Company is dedicated to helping people achieve their health, wellness and financial goals. The Company provides quality, scientifically-validated products and a financially rewarding direct sales business opportunity to customers and independent distributors. The Company sells its products in the United States, Japan, Hong Kong, Australia, Canada, Mexico, Thailand, the United Kingdom, the Netherlands, Germany and Taiwan. The Company also sells its products in a number of countries to customers for personal consumption only. In addition, the Company sells its products in China through our e-commerce business model.
The Company engages in the identification, research, development and distribution of advanced nutraceutical dietary supplements and skin care products, including Protandim®, its line of scientifically-validated dietary supplements, TrueScience®, its line of anti-aging skin care products, Petandim™ for Dogs, its companion pet supplement formulated to combat oxidative stress in dogs, Axio®, its Smart Energy Drink mixes, PhysIQ™, its Smart Weight Management System, and Omega+, its sustainable fish oil supplement.
The Company was incorporated in Colorado in June 1988 under the name Andraplex Corporation. The Company changed its corporate name to Yaak River Resources, Inc. in January 1992, and subsequently changed it again in October 2004 to Lifeline Therapeutics, Inc. In October 2004 and March 2005, the Company acquired all of the outstanding common stock of Lifeline Nutraceuticals Corporation. In November 2006, the Company changed its name to LifeVantage Corporation.
On March 9, 2018, following approval by the Company's stockholders and its 2018 Annual Meeting of Stockholders, the Company changed its state of incorporation from the State of Colorado to the State of Delaware pursuant to a plan of conversion. All outstanding shares of common stock, options and share units of the Colorado corporation were converted into an equivalent share, option or share unit of the Delaware corporation and the par value of the Company's common stock was adjusted to $0.0001. All directors and officers of the Colorado corporation held the same position within the Delaware corporation on the date of reincorporation.
Note 2 — Summary of Significant Accounting Policies
Consolidation
The consolidated financial statements include the accounts of the Company and its wholly-owned subsidiaries. All significant intercompany accounts and transactions are eliminated in consolidation. Certain other prior period balances have also been reclassified to conform to the current period presentation.
Use of Estimates
The Company prepares the consolidated financial statements and related disclosures in conformity with accounting principles generally accepted in the United States of America (GAAP). In preparing these statements, the Company is required to use estimates and assumptions that affect the reported amounts of assets and liabilities, the disclosure of contingent assets and liabilities at the date of the financial statements and the reported amounts of revenues and expenses during the reporting period. Actual results could differ materially from those estimates and assumptions. On an ongoing basis, the Company reviews its estimates, including those related to inventory valuation and obsolescence, sales returns, income taxes and tax valuation reserves, transfer pricing methodology and positions, share-based compensation, and loss contingencies. During the fiscal year ended June 30, 2018 the Company made updates to its transfer pricing methodology and related estimates which resulted in adjustments made to certain previously accrued liabilities.
Foreign Currency Translation
A portion of the Company’s business operations occurs outside the United States. The local currency of each of the Company’s subsidiaries is generally its functional currency. All assets and liabilities are translated into U.S. Dollars at exchange rates existing at the balance sheet dates, revenue and expenses are translated at weighted-average exchange rates and stockholders’ equity is recorded at historical exchange rates. The resulting foreign currency translation adjustments are recorded as a separate component of stockholders’ equity in the consolidated balance sheets and as a component of comprehensive income. Transaction gains and losses are included in other expense, net in the consolidated statements of operations and comprehensive income.
F - 9
Fair Value of Financial Instruments
Accounting guidance on fair value measurements and disclosures requires disclosures about the fair value for all financial instruments, whether or not recognized, for financial statement purposes. Disclosures about fair value of financial instruments are based on pertinent information available to management as of June 30, 2018 and 2017. Accordingly, the estimates presented in these consolidated financial statements are not necessarily indicative of the amounts that could be realized on disposition of the financial instruments.
Management has estimated the fair values of cash and cash equivalents, accounts receivable, accounts payable, commissions payable and other accrued expenses to approximate their respective carrying values reported in these consolidated financial statements because of their short maturities.
Cash and Cash Equivalents
The Company considers only its monetary liquid assets with original maturities of three months or less to be cash and cash equivalents.
Accounts Receivable
The Company’s accounts receivable for the fiscal years ended June 30, 2018 and 2017 consist primarily of credit card receivables. Based on the Company’s verification process for customer credit cards and historical information available, management has determined that an allowance for doubtful accounts on credit card sales related to its customer sales as of June 30, 2018 or 2017 is not necessary. No bad debt expense was recorded for the fiscal years ended June 30, 2018, 2017 and 2016.
Inventory
As of June 30, 2018 and 2017, inventory consisted of (in thousands):
June 30, | |||||||
2018 | 2017 | ||||||
Finished goods | $ | 7,859 | $ | 7,817 | |||
Raw materials | 5,768 | 8,758 | |||||
Total inventory | $ | 13,627 | $ | 16,575 | |||
Inventories are carried and depicted above at the lower of cost or market, using the first-in, first-out method, which includes a reduction in inventory values of $1.4 million and $0.9 million at June 30, 2018 and 2017, respectively, related to obsolete and slow-moving inventory.
Property and Equipment
Property and equipment are recorded at cost and depreciated using the straight-line method over the following useful lives:
Years | |
Equipment (includes computer hardware and software) | 3 |
Furniture and fixtures | 5 |
Vehicles | 5 |
Leasehold improvements are depreciated over the shorter of estimated useful life of the related asset or the lease term.
The cost of normal maintenance and repairs is charged to expense as incurred. When an asset is sold or otherwise disposed of, the cost and associated accumulated depreciation are removed from the accounts and the resulting gain or loss is recognized in the consolidated statements of operations and comprehensive income in other expense, net. Significant expenditures that increase the useful life of an asset are capitalized and depreciated over the estimated useful life of the asset. Property and equipment are reviewed for impairment whenever events or changes in circumstances indicate that the carrying amount of such assets may not be recoverable. An impairment loss is recognized if the carrying amount of the asset exceeds its fair value. During the fiscal years ended June 30, 2018 and 2017, there were no losses on disposal of assets. During the fiscal year ended June 30, 2016, the Company recognized a loss on disposal of $1.2 million related to the write-off of previously capitalized software development costs incurred.
F - 10
Intangible Assets
Intangible assets are stated at cost less accumulated amortization. Definite-lived intangible assets are amortized over their related useful lives, using a straight-line method, consistent with the underlying expected future cash flows related to the specific intangible asset. Definite-lived intangible assets are reviewed for impairment whenever events or changes in circumstances exist that indicate the carrying amount of an asset may not be recoverable. When indicators of impairment exist, an estimate of undiscounted net cash flows is used in measuring whether the carrying amount of the asset or related asset group is recoverable. Measurement of the amount of impairment, if any, is based upon the difference between the asset’s carrying value and estimated fair value.
Indefinite-lived intangible assets are not amortized; however, they are tested at least annually for impairment or more frequently if events or changes in circumstances exist that may indicate impairment. An impairment loss is recognized if the carrying amount of the asset exceeds its fair value. Annual impairment tests were completed for the fiscal year ended June 30, 2018 resulting in no impairment charges. During the fiscal year ended June 30, 2017, the Company recognized a loss of $0.4 million upon write-off of previously capitalized indefinite-lived intangible assets.
Impairment of Long-Lived Assets
Pursuant to guidance established for impairment or disposal of assets, the Company assesses impairment whenever events or changes in circumstances indicate that the carrying amount of a long-lived asset may not be recoverable. When an assessment for impairment of long-lived assets, long-lived assets to be disposed of, and certain identifiable intangibles related to those assets is performed, the Company is required to compare the net carrying value of long-lived assets on the lowest level at which cash flows can be determined on a consistent basis to the related estimates of future undiscounted net cash flows for such assets. If the net carrying value exceeds the net cash flows, then an impairment is recognized to reduce the carrying value to the estimated fair value, generally equal to the future discounted net cash flow. Except as noted above, for the fiscal years ended June 30, 2018 and 2017, management has concluded that there are no indications of impairment.
Concentration of Credit Risk
Accounting guidance for financial instruments requires disclosure of significant concentrations of credit risk regardless of the degree of such risk. Financial instruments with significant credit risk include cash and cash equivalents. At June 30, 2018, the Company had $11.4 million in cash accounts at one financial institution and $5.3 million in other financial institutions. As of June 30, 2018 and 2017, and during the years then ended, the Company’s cash balances exceeded federally insured limits.
Revenue Recognition
The Company ships the majority of its product directly to the consumer and receives substantially all payment for these sales in the form of credit card receipts. Revenue from direct product sales to customers is recognized upon shipment, which is when passage of title and risk of loss occurs. Estimated returns are recorded when product is shipped. Subject to some exceptions based on local regulations, the Company’s return policy is to provide a full refund for product returned within 30 days if the returned product is unopened or defective. After 30 days, the Company generally does not issue refunds to direct sales customers for returned product. The Company allows terminating distributors to return up to 30% of unopened, unexpired product that they have purchased within the prior twelve months for a full refund, less a 10% restocking fee. The Company establishes the returns reserve based on historical experience. The returns reserve is evaluated on a quarterly basis. As of June 30, 2018 and 2017, the Company’s reserve balance for returns and allowances was $0.4 million and $0.4 million, respectively.
Commissions and Incentives
Commissions and incentives expenses are the Company’s most significant expenses and are classified as operating expenses. Commissions and incentives expenses include sales commissions paid to the Company's independent distributors, special incentives, costs for incentive trips and other rewards. Commissions and incentives expenses do not include any amounts the Company pays to its independent distributors for personal purchases. Commissions paid to independent distributors on personal purchases are considered a sales discount and are reported as a reduction to net revenue.
Shipping and Handling
Shipping and handling costs associated with inbound freight and freight out to customers, including independent distributors, are included in cost of sales. Shipping and handling fees charged to all customers are included in sales.
F - 11
Research and Development Costs
The Company expenses all costs related to research and development activities as incurred. Research and development expenses for the fiscal years ended June 30, 2018, 2017 and 2016 were $1.2 million, $1.1 million and $1.0 million, respectively.
Stock-Based Compensation
The Company recognizes stock-based compensation by measuring the cost of services to be rendered based on the grant date fair value of the equity award. The Company recognizes stock-based compensation, net of any estimated forfeitures, over the period an employee is required to provide service in exchange for the award, generally referred to as the requisite service period. The Company estimates forfeitures based on historical information and other management assumptions. For awards with market-based performance conditions, the cost of the awards is recognized as the requisite service is rendered by employees, regardless of when, if ever, the market-based performance conditions are satisfied.
The Black-Scholes option pricing model is used to estimate the fair value of stock options. The determination of the fair value of stock options is affected by the Company's stock price and a number of assumptions, including expected volatility, expected life, risk-free interest rate and expected dividends. The Company uses historical volatility as the expected volatility assumption required in the Black-Scholes model. The Company uses historical data for estimating the expected life of stock options. The risk-free interest rate assumption is based on observed interest rates appropriate for the expected terms of the stock options.
The fair value of restricted stock grants is based on the closing market price of the Company's stock on the date of grant less the Company's expected dividend yield. The fair value of performance restricted stock units that include market-based performance conditions is based on the closing market price of the Company's stock on the date of grant less the Company's expected dividend yield, with further adjustments made to reflect the market conditions that must be satisfied in order for the units to vest by using a Monte-Carlo simulation model. Key assumptions for the Monte-Carlo simulation model include the risk-free rate, expected volatility, expected dividends and the correlation coefficient. The fair value of cash-settled performance-based awards, accounted for as liabilities, is remeasured at the end of each reporting period and is based on the closing market price of the Company’s stock on the last day of the reporting period. The Company recognizes compensation costs for awards with performance conditions when it concludes it is probable that the performance conditions will be achieved. The Company reassesses the probability of vesting at each balance sheet date and adjusts compensation costs accordingly.
Reverse Stock Split
In October 2015, following approval of the Company's shareholders, the Company's board of directors approved the filing of an amendment to the Company's amended and restated articles of incorporation to effectuate a reverse split of the issued and outstanding shares of the Company's common stock on a one-for-seven basis. The reverse stock split was effective on October 19, 2015. The par value and authorized number of shares of common stock were not adjusted as a result of the reverse split. All fractional shares resulting from the reverse stock split were rounded up. All issued and outstanding common stock and per share amounts contained within the Company's consolidated financial statements and footnotes have been retroactively adjusted to reflect this reverse stock split for all periods presented.
Income Taxes
Income taxes are accounted for under the asset and liability method. Deferred tax assets and liabilities are recognized for the future tax consequences attributable to differences between the financial statement carrying amounts of existing assets and liabilities and their respective tax bases and operating loss and tax credit carry-forwards. Deferred tax assets and liabilities are measured using statutory tax rates expected to apply to taxable income in the years in which those temporary differences are expected to be recovered or settled. The effect on deferred tax assets and liabilities from a change in tax rates is recognized in income in the period that includes the effective date of the change. The Company recognizes tax liabilities or benefits from an uncertain position only if it is more likely than not that the position will be sustained upon examination by taxing authorities based on the technical merits of the issue. The amount recognized would be the largest liability or benefit that the Company believes has greater than a 50% likelihood of being realized upon settlement.
On December 22, 2017, the President of the United States of America signed tax reform legislation (the “2017 Tax Act”), which includes a broad range of tax reform affecting businesses, including corporate tax rates, business deductions, and international tax regulations. Among these changes, the 2017 Tax Act reduces the corporate tax rate from 35% to 21% effective December 31, 2017. Current taxes for fiscal 2018 are accounted for at a blended rate of 28%, and the Company has revalued its deferred tax assets and liabilities to the reduced rates based on the period in which those assets and liabilities are expected to reverse. The Company has incorporated all other changes resulting from the 2017 Tax Act in its tax related accounts for the fiscal year ended June 30, 2018.
F - 12
Income Per Share
Basic income per common share is computed by dividing the net income by the weighted-average number of common shares outstanding during the period, less unvested restricted stock awards. Diluted income per common share is computed by dividing net income by the weighted-average common shares and potentially dilutive common share equivalents using the treasury stock method.
For the fiscal years ended June 30, 2018 and 2017, the effects of approximately 0.4 million and 0.2 million common shares, respectively, issuable upon exercise of options and non-vested shares of restricted stock, are not included in the computations as their effect was anti-dilutive.
The following is a reconciliation of net income per share and the weighted-average common shares outstanding for purposes of computing basic and diluted net income per share (in thousands, except per share amounts):
Years ended June 30, | |||||||||||
2018 | 2017 | 2016 | |||||||||
Numerator: | |||||||||||
Net income | $ | 5,761 | $ | 1,608 | $ | 6,106 | |||||
Denominator: | |||||||||||
Basic weighted-average common shares outstanding | 13,992 | 13,881 | 13,730 | ||||||||
Effect of dilutive securities: | |||||||||||
Stock awards and options | 144 | 237 | 735 | ||||||||
Warrants | — | — | 66 | ||||||||
Diluted weighted-average common shares outstanding | 14,136 | 14,118 | 14,531 | ||||||||
Net income per share, basic | $ | 0.41 | $ | 0.12 | $ | 0.44 | |||||
Net income per share, diluted | $ | 0.41 | $ | 0.11 | $ | 0.42 | |||||
Segment Information
The Company operates in a single operating segment by selling products to an international network of independent distributors that operates in an integrated manner from market to market. Commissions and incentives expenses are the Company’s largest expense comprised of the commissions paid to its independent distributors. The Company manages its business primarily by managing its international network of independent distributors. The Company does not use profitability reports on a regional or divisional basis for making business decisions. However, the Company does report revenue in two geographic regions: the Americas region and the Asia/Pacific & Europe region. Revenues by geographic area are as follows (in thousands):
Years ended June 30, | |||||||||||
2018 | 2017 | 2016 | |||||||||
Americas | $ | 151,609 | $ | 150,841 | $ | 158,291 | |||||
Asia/Pacific & Europe | 51,595 | 48,648 | 48,249 | ||||||||
Total revenues | $ | 203,204 | $ | 199,489 | $ | 206,540 | |||||
Additional information as to the Company’s revenue from operations in the most significant geographical areas is set forth below (in thousands):
Years ended June 30, | |||||||||||
2018 | 2017 | 2016 | |||||||||
United States | $ | 142,452 | $ | 144,842 | $ | 152,830 | |||||
Japan | $ | 41,843 | $ | 39,390 | $ | 36,343 | |||||
As of June 30, 2018, long-lived assets were $9.8 million in the U.S. and $0.9 million in Japan. As of June 30, 2017, long-lived assets were $6.2 million in the U.S. and $0.9 million in Japan.
Major Products
F - 13
The Company's revenues are largely attributed to two product lines, Protandim® and TrueScience®, which each accounted for more than 10% of total revenues for each of the fiscal years ended June 30, 2018, 2017 and 2016. On a combined basis, these products represent approximately 76.6%, 77.9% and 77.9% of the Company's worldwide gross revenues for the fiscal years ended June 30, 2018, 2017 and 2016, respectively. The following table shows revenues by major product line for the fiscal years ended June 30, 2018, 2017 and 2016.
Years ended June 30, | ||||||||||||||||||||
2018 | 2017 | 2016 | ||||||||||||||||||
Protandim® product line | $ | 133,923 | 65.9 | % | $ | 130,873 | 65.6 | % | $ | 128,019 | 62.0 | % | ||||||||
TrueScience® product line | 21,665 | 10.7 | % | 24,440 | 12.3 | % | 32,914 | 15.9 | % | |||||||||||
Other | 47,616 | 23.4 | % | 44,176 | 22.1 | % | 45,607 | 22.1 | % | |||||||||||
Total | $ | 203,204 | 100.0 | % | $ | 199,489 | 100.0 | % | $ | 206,540 | 100.0 | % | ||||||||
New Accounting Pronouncements
In May 2014, the Financial Accounting Standards Board ("FASB") issued Accounting Standards Update ("ASU") 2014-09, Revenue from Contracts with Customers (Topic 606), and has subsequently issued ASU 2015-14, Revenue from Contracts with Customers (Topic 606): Deferral of the Effective Date, ASU 2016-08, Revenue from Contracts with Customers (Topic 606): Principal versus Agent Considerations (Reporting Revenue Gross versus Net), ASU 2016-10, Revenue from Contracts with Customers (Topic 606): Identifying Performance Obligations and Licensing, ASU 2016-11, Revenue Recognition (Topic 605) and Derivatives and Hedging (Topic 815), ASU 2016-12, Revenue from Contracts with Customers (Topic 606): Narrow-Scope Improvements and Practical Expedients, and ASU 2016-20, Technical Corrections and Improvements to Topic 606, Revenue from Contracts with Customers (collectively, Topic 606).
Topic 606 outlines a single comprehensive model for entities to use in accounting for revenue arising from contracts with customers and supersedes most current revenue recognition guidance, including industry-specific guidance. The core principle of the new guidance is for companies to recognize revenue to depict the transfer of goods or services to customers in amounts that reflect the consideration it expects to receive in exchange for those goods or services. The guidance also requires additional disclosure about the nature, amount, timing and uncertainty of revenue and cash flows arising from customer contracts, including significant judgments and changes in judgments and assets recognized from costs incurred to fulfill a contract. This guidance is effective for the Company beginning on July 1, 2018 with the option to adopt using either a full retrospective or a modified retrospective approach. The Company expects to adopt Topic 606 using the modified retrospective approach, under which the cumulative effect of initially applying Topic 606 is recognized as an adjustment to the opening balance of retained earnings in the first quarter of fiscal 2019.
The Company has evaluated each of its revenue streams and has identified similar performance obligations under Topic 606 as compared to current revenue recognition guidance. During its evaluation, the Company reviewed its loyalty points program and, based on the new guidance, will change the method of accounting from a cost provision method to a deferred revenue method.
There are also considerations related to internal control over financial reporting associated with implementing Topic 606. The Company has substantially completed the evaluation of its control framework for revenue recognition and identified no material changes needed in response to the new guidance. The Company has also evaluated the expanded disclosure requirements under Topic 606 and has substantially completed the design and implementation of the appropriate controls over gathering and reporting the information required under Topic 606.
In February 2016, FASB issued ASU No. 2016-02, Leases (Topic 841). For lessees, this ASU requires that for all leases not considered to be short term, a company recognize both a right-of-use asset and lease liability on its balance sheet, representing the obligation to make payments and the right to use or control the use of a specified asset for the lease term. This ASU is effective for annual periods beginning after December 15, 2018 and interim periods within those annual periods. The Company is currently evaluating the impact of the ASU on the Company’s outstanding leases and expects that adoption will have an impact on its consolidated balance sheets related to recording right-of-use assets and corresponding lease liabilities.
In May 2017, FASB issued ASU No. 2017-09, Compensation - Stock Compensation (Topic 718): Scope of Modification Accounting. The ASU provides guidance about which changes to the terms or conditions of a share-based award require an entity to apply modification accounting in Topic 718. An entity should account for the effects of a modification unless all the following are met: (1) The fair value of the modified award is the same as the fair value of the original award immediately before the original award is modified, (2) The vesting conditions of the modified award are the same as the vesting conditions of the original award immediately before the original award is modified, (3) The classification of the modified award as an
F - 14
equity instrument or a liability instrument is the same as the classification of the original award immediately before the original award is modified. The current disclosure requirements in Topic 718 apply regardless of whether an entity is required to apply modification accounting under this ASU. This ASU will become effective for the Company beginning July 1, 2018 and will be applied to any award modified on or after that date.
Note 3 — Property and Equipment, Net
Property and equipment, net consist of (in thousands):
June 30, | |||||||
2018 | 2017 | ||||||
Equipment (includes computer hardware and software) | $ | 10,504 | $ | 7,420 | |||
Furniture and fixtures | 1,592 | 1,536 | |||||
Leasehold improvements | 3,761 | 3,421 | |||||
Vehicles | 51 | 51 | |||||
Accumulated depreciation | (9,321 | ) | (9,301 | ) | |||
Total property and equipment, net | $ | 6,587 | $ | 3,127 | |||
Depreciation expense totaled $1.2 million, $1.5 million and $1.8 million for the fiscal years ended June 30, 2018, 2017 and 2016, respectively.
Note 4 — Intangible Assets, Net
Intangible assets, net consist of (in thousands):
June 30, | |||||||
2018 | 2017 | ||||||
Patent costs | $ | 2,330 | $ | 2,330 | |||
Accumulated amortization | (1,460 | ) | (1,328 | ) | |||
Total definite-lived intangible assets, net | 870 | 1,002 | |||||
Trademarks and other indefinite-lived intangible assets | 245 | 245 | |||||
Total intangible assets, net | $ | 1,115 | $ | 1,247 | |||
Amortization expense totaled $0.1 million, $0.1 million and $0.1 million for the fiscal years ended June 30, 2018, 2017 and 2016, respectively. As of June 30, 2018, the remaining weighted-average amortization period for definite-lived intangible assets was 6.75 years. Annual estimated amortization expense is expected to approximate $0.1 million for each of the five succeeding fiscal years.
Note 5 — Other Accrued Expenses
Other accrued expenses consist of (in thousands):
June 30, | |||||||
2018 | 2017 | ||||||
Accrued incentive compensation | $ | 2,868 | $ | 1,151 | |||
Accrued other expenses | 2,087 | 2,853 | |||||
Other taxes payable | 1,884 | 1,517 | |||||
Accrued incentives and promotions to distributors | 1,366 | 988 | |||||
Deferred revenue | 1,107 | 1,743 | |||||
Accrued payroll and other employee expenses | 1,095 | 1,201 | |||||
Total other accrued expenses | $ | 10,407 | $ | 9,453 | |||
F - 15
Note 6 — Long-Term Debt
On March 30, 2016, the Company entered into a loan agreement (the "2016 Loan Agreement") to refinance its outstanding debt. In connection with the 2016 Loan Agreement and on the same date, the Company entered into a security agreement (the "2016 Security Agreement"). The 2016 Loan Agreement provides for a term loan in an aggregate principal amount of $10.0 million (the "2016 Term Loan") and a revolving loan facility in an aggregate principal amount not to exceed $2.0 million (the "2016 Revolving Loan," and collectively with the 2016 Term Loan, the 2016 Loan Agreement and the 2016 Security Agreement, the "2016 Credit Facility").
The principal amount of the 2016 Term Loan is payable in consecutive quarterly installments in the amount of $0.5 million plus accrued interest beginning with the fiscal quarter ended June 30, 2016. If the Company borrows under the 2016 Revolving Loan, interest will be payable quarterly in arrears on the last day of each fiscal quarter.
On May 4, 2018, the Company entered into a loan modification agreement, which amended the 2016 Credit Facility (“Amendment No. 1”). Amendment No. 1 revised the maturity date from March 30, 2019 to March 31, 2021 and increased the fixed interest rate for the term loan from 4.93% to 5.68%. Amendment No. 1 also revised certain financial covenants. The minimum fixed charge coverage ratio (as defined in Amendment No. 1) was revised from a minimum of 1.50 to 1.00 to 1.25 to 1.00, measured on a trailing twelve-month basis, at the end of each fiscal quarter. The minimum working capital was increased from $5.0 million to $8.0 million. The funded debt to EBITDA ratio was replaced with the total liabilities to tangible net worth ratio (as defined in Amendment No. 1) of not greater than 3.00 to 1.00 at the end of each quarter. The minimum tangible net worth measure was removed from the financial covenants.
The Company’s obligations under the 2016 Credit Facility, as amended, are secured by a security interest in substantially all of the Company’s assets. Loans outstanding under the 2016 Credit Facility, as amended, may be prepaid in whole or in part at any time without premium or penalty. In addition, if, at any time, the aggregate principal amount outstanding under the 2016 Revolving Loan, as amended, exceeds $2.0 million, the Company must prepay an amount equal to such excess. Any principal amount of the 2016 Term Loan, as amended, which is prepaid or repaid may not be re-borrowed.
The 2016 Credit Facility, as amended, contains customary covenants, including affirmative and negative covenants that, among other things, restrict the Company's ability to create certain types of liens, incur additional indebtedness, declare or pay dividends on or redeem capital stock, make other payments to holders of equity interests in the Company, make certain investments, purchase or otherwise acquire all or substantially all the assets or equity interests of other companies, sell assets or enter into consolidations, mergers or transfers of all or any substantial part of the Company's assets. The 2016 Credit Facility, as amended, also contains various financial covenants that require the Company to maintain a certain consolidated working capital amounts, total liabilities to tangible net worth ratios and fixed charge coverage ratios. Additionally, the 2016 Credit Facility, as amended, contains cross-default provisions, whereby a default under the terms of certain indebtedness or an uncured default of a payment or other material obligation of the Company under a material contract of the Company will cause a default on the remaining indebtedness under the 2016 Credit Facility. As of June 30, 2018, the Company was in compliance with all applicable covenants under the 2016 Credit Facility, as amended.
The Company’s book value for the 2016 Credit Facility, as amended, approximates the fair value. Aggregate future principal payments required in accordance with the terms of the 2016 Credit Facility, as amended, are as follows (in thousands):
Year ending June 30, | Amount | |||
2019 | $ | 2,000 | ||
2020 | 2,000 | |||
2021 | 1,500 | |||
$ | 5,500 | |||
Note 7 — Stockholders’ Equity
During the fiscal years ended June 30, 2018, 2017 and 2016, the Company issued 21,000, 0.1 million and 0.1 million shares, respectively, of common stock as a result of the exercise of options and warrants. During the fiscal years ended June 30, 2018, 2017 and 2016, the Company issued 0.2 million, 0.2 million and 0.1 million shares, respectively, of restricted stock. During the fiscal years ended June 30, 2018, 2017 and 2016, 0.1 million, 38,000 and 0.1 million shares, respectively of restricted stock were canceled or surrendered as payment of tax withholding upon vesting.
On November 27, 2017, the Company announced a share repurchase program authorizing it to repurchase up to $5 million in shares of the Company's common stock. The repurchase program permits the Company to purchase shares through a
F - 16
variety of methods, including in the open market, through privately negotiated transactions or other means as determined by the Company's management. As part of the repurchase program, the Company may enter into a pre-arranged stock repurchase plan which will operate in accordance with guidelines specified under Rule 10b5-1 of the Securities Exchange Act of 1934, as amended. Accordingly, transactions, if any, would be completed in accordance with the terms of the stock repurchase plan, including specified price, volume and timing conditions. The authorization may be suspended or discontinued at any time and expires on November 27, 2020. During year ended June 30, 2018, the Company purchased 0.3 million shares of its common stock on the open market at an aggregate purchase price of $1.5 million under this repurchase program. At June 30, 2018, there is $3.5 million remaining under this repurchase program.
The Company’s Articles of Incorporation authorize the issuance of preferred shares. However, as of June 30, 2018, none have been issued nor have any rights or preferences been assigned to the preferred shares by the Company’s Board of Directors.
Note 8 — Share-Based Compensation
Long-Term Incentive Plans
Equity-Settled Plans
The Company adopted, and the shareholders approved, the 2007 Long-Term Incentive Plan (the “2007 Plan”), effective November 21, 2006, to provide incentives to certain eligible employees, directors and consultants. A maximum of 1.4 million shares of the Company’s common stock can be issued under the 2007 Plan in connection with the grant of awards. Awards to purchase common stock have been granted pursuant to the 2007 Plan and are outstanding to various employees, officers, directors, Scientific Advisory Board members and independent distributors at prices between $1.47 and $10.50 per share, with initial vesting periods of one to three years. Awards expire in accordance with the terms of each award and the shares subject to the award are added back to the 2007 Plan upon expiration of the award. The contractual term of stock options granted is generally ten years. As of June 30, 2018, there were stock option awards outstanding, net of awards expired, for the purchase in aggregate of 0.2 million shares of the Company’s common stock. Effective November 21, 2016, no new awards can be granted under the 2007 Plan.
The Company adopted, and the shareholders approved, the 2010 Long-Term Incentive Plan (the “2010 Plan”), effective September 27, 2010, as amended on August 21, 2014, to provide incentives to certain employees, directors and consultants. A maximum of 1.5 million shares of the Company’s common stock can be issued under the 2010 Plan in connection with the grant of awards. Awards to purchase common stock have been granted pursuant to the 2010 Plan and are outstanding to various employees, officers and directors. Outstanding stock options awarded under the 2010 Plan have exercise prices between $5.60 and $20.09 per share, and vest over one to four year vesting periods. Awards expire in accordance with the terms of each award and the shares subject to the award are added back to the 2010 Plan upon expiration of the award. The contractual term of stock options granted is generally ten years. As of June 30, 2018, there were stock option awards outstanding, net of awards expired, for an aggregate of 0.1 million shares of the Company’s common stock. No new awards will be granted under the 2010 Plan and forfeited or terminated shares will be added to the 2017 Plan pool as described below.
The Company adopted, and the shareholders approved, the 2017 Long-Term Incentive Plan (the “2017 Plan”), effective February 16, 2017 to provide incentives to eligible employees, directors and consultants. On February 2, 2018, the shareholders approved an amendment to the 2017 Plan to increase by 425,000 shares the number of shares of the Company's common stock that are available for issuance under the 2017 Plan. The maximum number of shares that can be issued under the 2017 Plan is not to exceed 1,550,000 shares, calculated as the sum of (i) 1,075,000 shares and (ii) up to 475,000 shares previously reserved for issuance under the 2010 Plan, including shares returned upon cancellation, termination or forfeiture of awards that were previously granted under that plan. As of June 30, 2018, a maximum of 1.5 million shares of the Company's common stock can be issued under the 2017 Plan in connection with the grant of awards. Outstanding stock options awarded under the 2017 Plan have exercise prices of $4.44 per share, and vest over a three year vesting period. Awards expire in accordance with the terms of each award and the shares subject to the award are added back to the 2017 Plan upon expiration of the award. The contractual term of stock options granted are substantially the same as described above for the 2007 Plan and 2010 Plan. As of June 30, 2018, there were stock option awards outstanding, net of awards expired, for an aggregate of 0.5 million shares of the Company’s common stock.
Cash-Settled Plans
Performance Units
The Company adopted a performance incentive plan effective July 1, 2015 (the "Fiscal 2016 Performance Plan"). The Fiscal 2016 Performance Plan is intended to provide selected employees an opportunity to earn performance-based cash bonuses whose value is based upon the Company’s stock value and to encourage such employees to provide services to the Company and to attract new individuals with outstanding qualifications. The Fiscal 2016 Performance Plan seeks to achieve
F - 17
this purpose by providing for awards in the form of performance share units (the “Units”). No shares will be issued under the Fiscal 2016 Performance Plan. Awards may be settled only with cash and will be paid subsequent to award vesting. The fair value of share-based compensation awards, that include performance shares, are accounted for as liabilities. Vesting for the Units is subject to achievement of both service-based and performance-based vesting requirements. Performance-based vesting occurs in three installments if the Company meets certain performance criteria generally set for each year of a three-year performance period. The service-based vesting criteria occurs in a single installment at the end of the third fiscal year after the awards are granted if the participant has continuously remained in service from the date of award through the end of the third fiscal year. The fair value of these awards is based on the trading price of the Company's common stock and is remeasured at each reporting period date until settlement. The Company adopted separate performance incentive plans effective July 1, 2016 (the "Fiscal 2017 Performance Plan") and July 1, 2017 (the "Fiscal 2018 Performance Plan"). The Fiscal 2017 Performance Plan and Fiscal 2018 Performance Plan include performance-based and service-based vesting requirements and payment terms that are substantially the same as described above for the Fiscal 2016 Performance Plan.
Phantom Units
During the fiscal year ended June 30, 2018, the Company awarded phantom units to its executive officers and senior management. The vesting date for the phantom units is December 31, 2018, at which time the units will be settled in cash equal to (i) the number of vested units multiplied by (ii) the positive difference (if any) between the value at December 31, 2018 and $4.76, the closing price of the Company's common stock on the start date. The start date is December 29, 2017, the last business day of calendar year 2017. The fair value of these awards is based on the Black Scholes valuation model and is remeasured at each reporting period date until settlement.
Stock-Based Compensation
In accordance with accounting guidance for stock-based compensation, payments in equity instruments for goods or services are accounted for by the fair value method. For the fiscal years ended June 30, 2018, 2017 and 2016, stock-based compensation of $3.0 million, $2.3 million and $2.0 million, respectively, was reflected as an increase to additional paid in capital and $0.2 million, $0.7 million and $0.7 million, respectively, was reflected as an increase to other accrued expenses, all of which was employee related.
At June 30, 2018, there was $2.7 million of unrecognized compensation cost related to nonvested share-based compensation arrangements under the 2010 and 2017 Plans, based on management's estimate of the shares that will ultimately vest. The Company expects to recognize such costs over a weighted-average period of 1.57 years.
Stock Options
During the fiscal year ended June 30, 2018, the Company awarded stock options ("FY 2018 Stock Options") to its executive officers and senior management. The vesting period for the FY 2018 Stock Options is three years and occurs as follows: (1) one-third of the total number of shares awarded vest on January 1, 2019; (2) one-twelfth of the total number of shares awarded vest on the last day of each fiscal quarter following January 1, 2019. The fair value of the stock options will be recognized on a straight-line basis over the requisite service period of the awards.
There were no stock option grants during the fiscal years ended June 30, 2017 and 2016.
The fair value of stock option awards was estimated using the Black-Scholes option-pricing model with the following assumptions and weighted-average fair value as follows:
June 30, 2018 | |||
Weighted-average grant date fair value | $ | 2.25 | |
Risk-free interest rate | 2.3 | % | |
Expected volatility | 59.0 | % | |
Expected life (years) | 4.7 | ||
The following is a summary of stock option activity for the fiscal years ended June 30, 2018, 2017 and 2016:
F - 18
Options (in thousands) | Weighted Average Exercise Price | Weighted Average Remaining Contractual Term (in years) | Aggregate Intrinsic Value (in thousands) | |||||||||
Outstanding at June 30, 2015 | 462 | $ | 7.87 | |||||||||
Granted | — | $ | — | |||||||||
Exercised | (46 | ) | 5.66 | $ | 209 | |||||||
Forfeited | (33 | ) | 17.85 | |||||||||
Expired or Canceled | — | — | ||||||||||
Outstanding at June 30, 2016 | 383 | 7.28 | ||||||||||
Granted | — | $ | — | |||||||||
Exercised | (4 | ) | 4.14 | $ | 17 | |||||||
Forfeited | (62 | ) | 12.64 | |||||||||
Expired or Canceled | (7 | ) | 2.45 | |||||||||
Outstanding at June 30, 2017 | 310 | 6.35 | ||||||||||
Granted | 461 | $ | 4.44 | |||||||||
Exercised | (21 | ) | 2.96 | $ | 33 | |||||||
Forfeited | (20 | ) | 16.26 | |||||||||
Expired or Canceled | — | — | ||||||||||
Outstanding at June 30, 2018 | 730 | 4.96 | 6.69 | $ | 1,310 | |||||||
Exercisable at June 30, 2018 | 268 | $ | 5.86 | 1.70 | $ | 420 | ||||||
Restricted Shares
The following is a summary of restricted shares granted during the fiscal years ended June 30, 2018, 2017 and 2016:
Nonvested Shares | Shares (in thousands) | Weighted Average Grant Date Fair Value | |||||
Nonvested at June 30, 2015 | 250 | $ | 9.36 | ||||
Granted | 60 | $ | 5.94 | ||||
Vested | (40 | ) | 15.64 | ||||
Forfeited | (39 | ) | 16.21 | ||||
Nonvested at June 30, 2016 | 231 | 6.24 | |||||
Vested at June 30, 2016 | — | — | |||||
Granted | 156 | $ | 5.81 | ||||
Vested | (88 | ) | 8.31 | ||||
Forfeited | (22 | ) | 10.70 | ||||
Nonvested at June 30, 2017 | 277 | 4.98 | |||||
Vested at June 30, 2017 | — | — | |||||
Granted | 190 | $ | 4.57 | ||||
Vested | (355 | ) | 4.62 | ||||
Forfeited | (3 | ) | 5.22 | ||||
Nonvested at June 30, 2018 | 109 | 5.43 | |||||
Vested at June 30, 2018 | — | $ | — | ||||
The total vesting date fair value of restricted shares that vested during the fiscal years ended June 30, 2018, 2017 and 2016 was $1.6 million, $0.7 million and $0.4 million, respectively.
Performance Restricted Stock Units
During the fiscal years ended June 30, 2017 and 2016, the Company awarded performance restricted stock units ("FY 2017 Performance Stock Units" and "FY 2016 Performance Stock Units") to its executive officers and senior management (the
F - 19
"Recipients"). Vesting for the FY 2017 Performance Stock Units and FY 2016 Performance Stock Units occurs in a single installment and is achieved at the end of the three year performance period if the participant has continuously remained in service from the date of the award through the end of the performance period. Each performance restricted stock unit represents a contingent right for the Recipient to receive, within thirty days after the end of the performance period, a distribution of shares of common stock of the Company equal to 0% to 200% of the target number of performance restricted stock units subject to the award. The actual number of shares distributed will be based on the Company's total stockholder return ("TSR") performance during the relevant performance period, subject to acceleration upon a change in control of the Company. The vesting for 50% of the target performance restricted stock units is based upon the Company's absolute TSR for the performance period as compared to a matrix of fixed numeric values and the vesting for the other 50% of the target performance restricted stock units is based upon the relative comparison of the Company's TSR to the Vanguard Russell 2000 exchange traded fund TSR. The fair value of the performance restricted stock units will be recognized on a straight-line basis over the requisite service period of the awards, regardless of when, if ever, the market-based performance conditions are satisfied.
No performance restricted stock units were granted during the fiscal year ended June 30, 2018. The fair values of performance restricted stock units granted during the fiscal years ended June 30, 2017 and 2016 were estimated using a Monte Carlo simulation model which included the following assumptions in order to reflect the performance conditions that must be satisfied for the share units to vest:
June 30, 2017 | June 30, 2016 | ||||
Risk-free interest rate | 1.5 | % | 1.3 | % | |
Dividend yield | — | % | — | % | |
Expected volatility - Company | 62.0 | % | 55.5 | % | |
Expected volatility - peer company | 17.1 | % | 15.7 | % | |
Total measurement period (years) | 2.8 | 3.0 | |||
The following is a summary of performance restricted stock units granted during the fiscal years ended June 30, 2018, 2017 and 2016:
Number of Units (in thousands) | Weighted Average Grant Date Fair Value | ||||||
Nonvested at June 30, 2015 | 115 | $ | 10.76 | ||||
Granted | 848 | $ | 12.30 | ||||
Vested | (15 | ) | 10.76 | ||||
Forfeited | (485 | ) | 11.25 | ||||
Nonvested at June 30, 2016 | 463 | 13.07 | |||||
Granted | 420 | $ | 4.69 | ||||
Vested | (10 | ) | 10.76 | ||||
Forfeited | (111 | ) | 12.86 | ||||
Nonvested at June 30, 2017 | 762 | 8.51 | |||||
Granted | — | $ | — | ||||
Vested | — | — | |||||
Forfeited | (132 | ) | 7.02 | ||||
Nonvested at June 30, 2018 | 630 | 8.82 | |||||
Vested at June 30, 2018 | — | $ | — | ||||
No performance restricted stock units vested during the fiscal year ended June 30, 2018. The total vesting date fair value of performance restricted stock units that vested during the fiscal years ended June 30, 2017 and 2016 was $0.1 million and $0.1 million, respectively.
F - 20
Cash-Settled Performance Units
The following is a summary of cash-settled performance units granted during the fiscal years ended June 30, 2018, 2017 and 2016:
Number of Units (in thousands) | Weighted Average Grant Date Fair Value | ||||||
Outstanding at June 30, 2015, nonvested | — | ||||||
Granted | 77 | $ | 8.47 | ||||
Vested | (13 | ) | — | ||||
Forfeited | (13 | ) | $ | 8.30 | |||
Outstanding at June 30, 2016, nonvested | 51 | ||||||
Granted | 95 | $ | 13.17 | ||||
Vested | (25 | ) | — | ||||
Forfeited | (89 | ) | $ | 12.43 | |||
Outstanding at June 30, 2017, nonvested | 32 | ||||||
Granted | 87 | $ | 4.65 | ||||
Vested | (32 | ) | — | ||||
Forfeited | (29 | ) | $ | 6.48 | |||
Outstanding at June 30, 2018, nonvested | 58 | ||||||
The fair value of vested awards under the cash-settled performance plan for the fiscal years ended June 30, 2018, 2017 and 2016 was $0.2 million, $0.1 million and $0.2 million, respectively. Payments of $0.2 million, $0.2 million and $0.1 million were made to settle vested cash-settled performance units during the fiscal years ended June 30, 2018, 2017 and 2016, respectively.
Cash-Settled Phantom Units
The fair value of phantom unit awards was estimated using the Black-Scholes option-pricing model with the following assumptions and weighted-average fair value as follows:
June 30, 2018 | |||
Weighted-average grant date fair value | $ | 0.40 | |
Risk-free interest rate | 2.1% - 2.3% | ||
Expected volatility | 56.2% - 57.0% | ||
Expected life (years) | 0.5 - 0.8 | ||
The following is a summary of cash-settled phantom units granted during the fiscal year ended June 30, 2018:
Number of Units (in thousands) | Weighted Average Remaining Contractual Term (in years) | Aggregate Intrinsic Value (in thousands) | |||||||
Outstanding at June 30, 2017, nonvested | — | ||||||||
Granted | 170 | ||||||||
Vested | — | ||||||||
Forfeited | — | ||||||||
Outstanding at June 30, 2018, nonvested | 170 | 0.50 | $ | 273 | |||||
No phantom units were outstanding as of June 30, 2017 and 2016.
Warrants
As of June 30, 2018, the Company had no outstanding warrants.
F - 21
The following is a summary of the warrant activity for the fiscal years ended June 30, 2018, 2017 and 2016 (in thousands):
Common Stock Warrants | ||
Outstanding and exercisable, June 30, 2015 | 87 | |
Issued | — | |
Canceled | — | |
Exercised | (7 | ) |
Expired | — | |
Outstanding and exercisable, June 30, 2016 | 80 | |
Issued | — | |
Canceled | — | |
Exercised | (80 | ) |
Expired | — | |
Outstanding and exercisable, June 30, 2017 | — | |
Issued | — | |
Canceled | — | |
Exercised | — | |
Expired | — | |
Outstanding and exercisable, June 30, 2018 | — | |
As of June 30, 2018, 2017 and 2016, the Company had no warrants classified as derivative liabilities.
Note 9 — Other Expense, Net
Other expense, net consists of the following (in thousands):
Year ended June 30, | |||||||||||
2018 | 2017 | 2016 | |||||||||
Foreign currency transaction loss, net | $ | (92 | ) | $ | (182 | ) | $ | (11 | ) | ||
Loss on settlement of forward contract | (175 | ) | (292 | ) | (212 | ) | |||||
Loss on disposal of fixed assets | (6 | ) | (12 | ) | (1,186 | ) | |||||
Write-off of intangible assets | — | (350 | ) | — | |||||||
Other expense, net | (46 | ) | (133 | ) | — | ||||||
Total other expense, net | $ | (319 | ) | $ | (969 | ) | $ | (1,409 | ) | ||
F - 22
Note 10 — Income Taxes
The income tax expense for the fiscal years ended June 30, 2018, 2017 and 2016 consists of the following (in thousands):
Year ended June 30, | |||||||||||
2018 | 2017 | 2016 | |||||||||
Income Before Income Taxes: | |||||||||||
Domestic | $ | 8,234 | $ | 1,642 | $ | 7,518 | |||||
International | 1,315 | 1,268 | 1,166 | ||||||||
$ | 9,549 | $ | 2,910 | $ | 8,684 | ||||||
Current Taxes: | |||||||||||
Federal | $ | 2,413 | $ | 1,324 | $ | 4,180 | |||||
State | 407 | 137 | 561 | ||||||||
Foreign | 150 | 510 | 455 | ||||||||
Total Current Income Tax Provision | $ | 2,970 | $ | 1,971 | $ | 5,196 | |||||
Deferred Taxes: | |||||||||||
Federal | $ | 377 | $ | (473 | ) | $ | (2,326 | ) | |||
State | 59 | (21 | ) | (105 | ) | ||||||
Foreign | 381 | (175 | ) | (187 | ) | ||||||
Total Deferred Income Tax Provision | $ | 817 | $ | (669 | ) | $ | (2,618 | ) | |||
Net Income Tax Provision | $ | 3,787 | $ | 1,302 | $ | 2,578 | |||||
The effective income tax rate for the fiscal years ended June 30, 2018, 2017 and 2016 differs from the U.S. Federal statutory income tax rate due to the following:
Year ended June 30, | ||||||||
2018 | 2017 | 2016 | ||||||
Federal statutory income tax rate | 28.0 | % | 34.0 | % | 35.0 | % | ||
State income taxes, net of federal benefit | 2.5 | % | 5.9 | % | 2.8 | % | ||
Foreign tax rate difference | 1.6 | % | (4.6 | )% | (2.3 | )% | ||
Tax return to provision true-up | (7.4 | )% | 0.6 | % | 0.7 | % | ||
Other differences | 0.2 | % | (2.1 | )% | 0.0 | % | ||
Revalue of deferred for change in federal tax rate | 14.9 | % | 0.0 | % | 0.0 | % | ||
Permanent differences: | ||||||||
— stock based compensation | 0.7 | % | 4.6 | % | 0.9 | % | ||
— domestic production activities deduction | (1.5 | )% | (3.3 | )% | (4.4 | )% | ||
— tax credits | (1.3 | )% | (0.9 | )% | (0.7 | )% | ||
— meals and entertainment | 0.9 | % | 3.4 | % | 1.0 | % | ||
— penalties | 0.1 | % | 1.5 | % | 0.0 | % | ||
— other | 0.9 | % | 4.3 | % | (3.9 | )% | ||
Change in valuation allowance | 0.1 | % | 1.3 | % | 0.6 | % | ||
Net income tax provision | 39.7 | % | 44.7 | % | 29.7 | % | ||
F - 23
The components of the deferred tax assets and liabilities as of June 30, 2018 and 2017 are as follows (in thousands):
June 30, | |||||||
2018 | 2017 | ||||||
Deferred tax assets: | |||||||
Federal, state, and foreign net operating loss carryovers | $ | 574 | $ | 536 | |||
Stock option compensation | 1,367 | 1,531 | |||||
Accrued vacation, allowance for returns, bonuses & other | 2,615 | 3,173 | |||||
Gross deferred tax asset | $ | 4,556 | $ | 5,240 | |||
Deferred tax liabilities: | |||||||
Patents and trademarks | $ | (145 | ) | $ | (253 | ) | |
Property & equipment | (823 | ) | (588 | ) | |||
Other | (13 | ) | — | ||||
Gross deferred tax liabilities | (981 | ) | (841 | ) | |||
Less: valuation allowance | (320 | ) | (312 | ) | |||
Deferred tax assets, net | $ | 3,255 | $ | 4,087 | |||
The Tax Cuts and Jobs Act of 2017 (the " 2017 Tax Act"), which became effective December 22, 2017, overhauls U.S. corporate income tax law by lowering the U.S. federal corporate income tax rate from 35% to 21% (blended rate in year one for fiscal year filers), implementing a territorial tax system, imposing a one time "deemed repatriation" tax on all untaxed offshore earnings, and adding/modifying/deleting several major tax deductions significant to the Company.
In addition, the 2017 Tax Act also includes a provision to tax global intangible low-taxed income ("GILTI") of foreign subsidiaries and a base erosion anti-abuse tax ("BEAT") measure that taxes certain payments between a U.S. Corporation and its subsidiaries. The Company will not be subject to these provisions until its fiscal 2019 tax year. Preliminary analysis suggests that the Company will not have a GILTI liability and that it will not meet the threshold to be subject to BEAT nor does it currently make the types of payments that are subject to BEAT.
The Company has done detailed analysis and computation to determine the impacts of the 2017 Tax Act to its financial statements. The Company has recorded the following items as part of its fiscal 2018 income tax provision (in thousands):
Revalue of Deferred Tax Assets for the Corporate Tax Rate Change | $ | 1,419 | |
Deemed Repatriation Tax on All Untaxed Offshore Earnings | $ | — | |
The Company was able to utilize its unborn foreign tax credits, mainly in Japan, to reduce its tax liability on its deemed repatriated earnings to zero. Any unused unborn foreign tax credits will be unavailable for future use.
Deferred tax assets and liabilities measure the expected amounts that tax expense will increase or decrease by in the future due to temporary differences between book and tax basis. The Company has significant deferred tax assets, meaning we expect to receive a tax deduction in the future, mainly related to stock compensation and fixed assets. These tax assets were valued at a 35% federal rate. When the 2017 Tax Act was enacted, these deferred assets will now give rise to a tax deduction at a 21% rate. This means that the Company will receive less benefit in the future for its deferred tax assets. Therefore, it recognized a one-time tax expense of $1.4 million to reflect this revaluation.
The Company has adopted accounting guidance for uncertain tax positions which provides that in order to recognize an uncertain tax benefit, the taxpayer must be more likely than not of sustaining the position, and the measurement of the benefit is calculated as the largest amount that is more than 50% likely to be realized upon recognition of the benefit. We believe the Company has no material uncertain tax positions and do not expect significant changes within the next twelve months in the amount of unrecognized tax benefits. Accordingly, we have not reserved for interest or penalties. The tax years open for examination by the Internal Revenue Service (“IRS”) include returns for fiscal years June 30, 2015 through present and the open tax years by state tax authorities include returns for fiscal years June 30, 2014 through present. In addition, the IRS and state tax authorities may examine NOL’s for any previous years if utilized by the Company.
As of June 30, 2018, the Company had utilized all of its Federal net operating loss (“NOL”) carry-forwards. The net operating losses were to expire by June 30, 2024 and are subject to review by the Internal Revenue Service, and are subject to
F - 24
U.S. Internal Revenue Code Section 382 limitations. As of June 30, 2018, state NOLs were $8.2 million and foreign NOLs were $1.0 million.
The total recognized tax benefit from settlement of stock based awards for the period ending June 30, 2018 was $0.5 million.
The Company conducts its business globally. As a result, the Company and its subsidiaries file income tax returns in the U.S. federal jurisdiction and various state and foreign jurisdictions, and are subject to examination for the open tax years of June 30, 2014 through June 30, 2018.
Note 11 — Commitments and Contingencies
Operating Leases
The Company leases its facilities under non-cancelable operating leases, which expire at various dates through 2024. The facilities leases contain renewal options and are subject to cost increases. Future minimum annual payments under non-cancelable operating leases at June 30, 2018 are as follows (in thousands):
Year ending June 30, | Amount | |||
2019 | $ | 2,815 | ||
2020 | 2,837 | |||
2021 | 1,589 | |||
2022 | 1,379 | |||
2023 | 1,423 | |||
Thereafter | 968 | |||
Total future minimum lease payments | $ | 11,011 | ||
Rent expense totaled $2.7 million, $2.5 million and $2.3 million for the fiscal years ended June 30, 2018, 2017 and 2016, respectively.
Contingencies
The Company accounts for contingent liabilities in accordance with Accounting Standards Codification ("ASC") Topic 450, Contingencies. This guidance requires management to assess potential contingent liabilities that may exist as of the date of the financial statements to determine the probability and amount of loss that may have occurred, which inherently involves an exercise of judgment. If the assessment of a contingency indicates that it is probable that a material loss has been incurred and the amount of the liability can be estimated, then the estimated liability would be accrued in the Company’s financial statements. If the assessment indicates that a potential material loss contingency is not probable but is reasonably possible, or is probable but cannot be estimated, then the nature of the contingent liability, and an estimate of the range of possible losses, if determinable and material, would be disclosed. For loss contingencies considered remote, no accrual or disclosures are generally made. Management has assessed potential contingent liabilities as of June 30, 2018, and based on the assessment there are no probable loss contingencies requiring accrual or disclosures within its financial statements.
Legal Accruals
In addition to commitments and obligations in the ordinary course of business, from time to time, the Company is subject to various claims, pending and potential legal actions, investigations relating to governmental laws and regulations and other matters arising out of the Company's normal conduct of business. Management assesses contingencies to determine the degree of probability and range of possible loss for potential accrual in the consolidated financial statements. An estimated loss contingency is accrued in the consolidated financial statements if it is probable that a liability has been incurred and the amount of the loss can be reasonably estimated. Because evaluating legal claims and litigation results are inherently unpredictable and unfavorable results could occur, assessing contingencies is highly subjective and requires judgments about future events. When evaluating contingencies, management may be unable to provide a meaningful estimate due to a number of factors, including the procedural status of the matter in question, the presence of complex or novel legal theories, and/or the ongoing discovery and development of information important to the matters. In addition, damage amounts claimed or asserted against the Company may be unsupported, exaggerated or unrelated to possible outcomes, and as such are not meaningful indicators of a potential liability. Management regularly reviews contingencies to determine the adequacy of financial statement accruals and related disclosures. The amount of ultimate loss may differ from these estimates. It is possible that cash flows or results of operations could be materially affected in any particular period by the unfavorable resolution of one or more of these contingencies. Whether any losses finally determined in any claim, action, investigation or proceeding could reasonably have a
F - 25
material effect on the Company's business, financial condition, results of operations or cash flows will depend on a number of variables, including: the timing and amount of such losses; the structure and type of any remedies; the significance of the impact any such losses, damages or remedies may have on the consolidated financial statements; and the unique facts and circumstances of the particular matter that may give rise to additional factors.
Class Action Lawsuit (Smith v. LifeVantage Corp.): On January 24, 2018, a purported class action was filed in the United States District Court for the District of Connecticut, entitled Smith v. LifeVantage Corp., Case No. 3:18-cv-a35 (D. Connecticut filed Jan. 24, 2018). In this action, plaintiff alleged that the Company, its Chief Executive Officer, Chief Sales Officer and Chief Marketing Officer operated a pyramid scheme in violation of a variety of federal and state statutes, including RICO and the Connecticut Unfair Trade Practices Act. On April 16, 2018, the Company filed motions with the court to dismiss the complaint against LifeVantage, dismiss the complaint against the Company's executives, transfer the venue of the case from the State of Connecticut to the State of Utah, and contest class certification. On July 23, 2018, the parties filed a stipulation with the Court agreeing to transfer the case to the Federal District Court for Utah. The Company has not established a loss contingency accrual for this lawsuit as it believes liability is not probable or estimable, and the Company plans to vigorously defend against this lawsuit. Nonetheless, an unfavorable resolution of this matter could have a material adverse effect on the Company's business, results of operations or financial condition.
Class Action Lawsuit (Zhang v. LifeVantage Corp.): As previously reported, on September 15, 2016, a purported securities class action was filed in the United States District Court for the District of Utah, entitled Zhang v. LifeVantage Corp., Case No. 2:16-cv-00965-BCW (D. Utah filed Sept. 15, 2016). In this action (later recaptioned as In re LifeVantage Corp. Securities Litigation), plaintiff alleged that the Company, its Chief Executive Officer and former Chief Financial Officer violated Sections 10(b) and/or 20(a) of the Securities Exchange Act of 1934, 15 U.S.C. §§ 78j(b), 78t(a), and Rule 10b-5, 17 C.F.R. § 240.10b-5, promulgated thereunder. On June 15, 2017, the Court granted defendants’ motion to dismiss the amended complaint, without prejudice, and permitted lead plaintiffs to file a motion for leave to file a second amended complaint. On September 18, 2017, the Court denied lead plaintiffs’ motion for leave to amend and entered final judgment in favor of LifeVantage and the other defendants and dismissed the case with prejudice. On October 17, 2017, the parties executed a stipulation whereby lead plaintiffs agreed not to take an appeal from the final judgment of dismissal in favor of defendants in exchange for mutual releases, without payment of any consideration by or on behalf of defendants. This case is now concluded.
Derivative Action Lawsuits: Also, as previously reported, on October 11, 2016, two purported shareholder derivative actions were filed in the Third District Court of the State of Utah, Salt Lake County, entitled Johnson v. Jensen, Case No. 160906320 MI (Utah Dist. filed Oct. 11, 2016), and Rupp v. Jensen, Case No. 160906321 MI (Utah Dist. filed Oct. 11, 2016). In these actions (which are substantively identical), plaintiffs, purportedly on behalf of the Company, alleged that the Company’s Chief Executive Officer, former Chief Financial Officer and members of the board of directors breached their fiduciary duties owed to the Company in connection with the matters alleged in the securities class action lawsuit noted above. On October 19, 2016, the Court entered an order consolidating the two actions under the Johnson case number, with the new caption In re LifeVantage Corp. Derivative Litigation.
On January 30, 2017, another purported shareholder derivative action was filed in the United States District Court for the District of Utah, entitled Hansen v. Jensen, Case No. 2:17 cv-00075-DN (D. Utah filed Jan. 30, 2017). In this action, plaintiff, purportedly on behalf of the Company, alleged that the Company’s Chief Executive Officer, former Chief Financial Officer and members of the board of directors violated Section 14(a) of the Securities Exchange Act of 1934, 15 U.S.C. § 78n(a), and breached their fiduciary duties owed to the Company in connection with the matters alleged in the securities class action lawsuit noted above. On February 27, 2017, another purported shareholder derivative action was filed in the United States District Court for the District of Utah, entitled Baker v. Jensen, Case No. 2:17-cv-00141-PMW (D. Utah filed Feb. 27, 2017). Also, on April 24, 2017, another purported shareholder derivative action was filed in the United States District Court for the District of Utah, entitled Inforzato v. Jensen, Case No. 2:17-cv-00317-JNP (D. Utah filed Apr. 24, 2017). In these actions, plaintiffs, also purportedly on behalf of the Company, made similar allegations as the plaintiff in Hansen v. Jensen.
Following and in light of the dismissal with prejudice of the securities class action lawsuit noted above, the Company requested that the plaintiffs in the shareholder derivative actions agree to dismiss their lawsuits voluntarily and without payment of any consideration by or on behalf of defendants or the Company. On October 31, 2017, the plaintiffs in In re LifeVantage Corp. Derivative Litigation stipulated to voluntary dismissal of their consolidated action without payment of any consideration by or on behalf of defendants or the Company. On November 17, 2017, the parties in Inforzato, Hansen and Baker stipulated to voluntary dismissal of those actions without payment of any consideration by or on behalf of defendants or the Company.
On November 20, 2017, the Courts in In re LifeVantage Corp. Derivative Litigation and Hansen granted the stipulated motions to dismiss, and on December 12, 2017, the Court in Baker granted the stipulated motion to dismiss. On November 27, 2017, the Court in Inforzato ordered, pursuant to Rule 23.1(c) of the Federal Rules of Civil Procedure, that the parties give notice to shareholders of the voluntary dismissal without prejudice of the Inforzato action before the Inforzato action could be
F - 26
dismissed, which the Company provided on January 8, 2018. On April 5, 2018, the last remaining derivative lawsuit, the Inforzato action, was dismissed without prejudice.
Other Matters. In addition to the matters described above, the Company also may become involved in other litigation and regulatory matters incidental to its business and the matters disclosed in this Annual Report on Form 10-K, including, but not limited to, product liability claims, regulatory actions, employment matters and commercial disputes. The Company intends to defend itself in any such matters and does not currently believe that the outcome of any such matters will have a material adverse effect on the Company's business, financial condition, results of operations and cash flows.
Note 12 — Related Party Transactions
Effective January 2014, the Company commenced a partnership with Real Salt Lake of Major League Soccer, which includes the placement of the Company's logo on the front of the team’s jersey as well as strategic placement of the Company's logo around the stadium and on televised broadcasts of the games. In July 2015, Dell Loy Hansen, the sole owner of Real Salt Lake and Real Monarchs SLC, became a major stockholder of the Company. During the fiscal years ended June 30, 2018, 2017 and 2016, the Company paid $4.0 million, $2.2 million and $2.8 million, respectively, to Real Salt Lake, pursuant to the terms of this partnership, and other various amounts for the endorsement of Real Monarchs SLC and for product marketing expenses.
During fiscal 2017, Dinng, a brand and digital brand studio, provided branding and marketing services to the Company. In June 2017, the Company completed an acquisition of the assets of Dinng. The Company's Chief Marketing Officer, Ryan Goodwin, was the Founder, President and Creative Director of Dinng. The Company paid a total of $0.5 million for branding and marketing services provided during fiscal 2017 and the asset acquisition. The Company paid $0.5 million for branding and marketing services provided during fiscal 2016. During fiscal 2018, no payments were made by the Company to Dinng.
During fiscal 2017, Outhink Inc., a digital media and application development company, provided consulting services to the Company pursuant to an agreement for services dated October 20, 2016 between the Company and Outhink Inc. in the amount of $0.1 million. David Toole, who served as a member of the Company's board of directors until February 2, 2018, is a majority owner and serves as the Chief Executive Officer of Outhink Inc.
During the fiscal years ended June 30, 2018 and 2017, the Company paid $3.0 million and $0.4 million, respectively, to Gig Economy Group ("GEG") for outsourced software application development services, pursuant to an agreement entered into between the Company and GEG. During fiscal 2016, no payments were made by the Company to GEG. David Toole, who served as a member of the Company's board of directors until February 2, 2018, is a majority owner and an officer of GEG.
Note 13 — Interim Financial Results (Unaudited)
The following summarizes selected quarterly financial information for quarterly periods during the fiscal years ended June 30, 2018 and 2017:
LIFEVANTAGE CORPORATION AND SUBSIDIARIES
CONDENSED CONSOLIDATED QUARTERLY RESULTS
(in thousands except per share data)
Fiscal Quarter | Year ended June 30, 2018 | ||||||||||||||||||
First | Second | Third | Fourth | ||||||||||||||||
Revenue, net | $ | 49,127 | $ | 49,482 | $ | 50,562 | $ | 54,033 | $ | 203,204 | |||||||||
Gross profit | 40,388 | 40,365 | 41,641 | 45,962 | 168,356 | ||||||||||||||
Net income | $ | 817 | $ | 317 | $ | 1,635 | $ | 2,992 | $ | 5,761 | |||||||||
Per common share: | |||||||||||||||||||
Income per share, basic | $ | 0.06 | $ | 0.02 | $ | 0.12 | $ | 0.20 | $ | 0.41 | |||||||||
Income per share, diluted | $ | 0.06 | $ | 0.02 | $ | 0.12 | $ | 0.21 | $ | 0.41 | |||||||||
F - 27
Fiscal Quarter | Year ended June 30, 2017 | ||||||||||||||||||
First | Second | Third | Fourth | ||||||||||||||||
Revenue, net | $ | 54,894 | $ | 48,947 | $ | 45,007 | $ | 50,641 | $ | 199,489 | |||||||||
Gross profit | 46,062 | 41,447 | 36,774 | 41,750 | 166,033 | ||||||||||||||
Net income | $ | 1,180 | $ | 283 | $ | 61 | $ | 84 | $ | 1,608 | |||||||||
Per common share: | |||||||||||||||||||
Income per share, basic | $ | 0.09 | $ | 0.02 | $ | 0.00 | $ | 0.01 | $ | 0.12 | |||||||||
Income per share, diluted | $ | 0.08 | $ | 0.02 | $ | 0.00 | $ | 0.01 | $ | 0.11 | |||||||||
F - 28