Attached files
| file | filename |
|---|---|
| EX-99.1 - EXHIBIT 99.1 - BayCom Corp | tv500761_ex99-1.htm |
| EX-2.1 - EXHIBIT 2.1 - BayCom Corp | tv500761_ex2-1.htm |
| 8-K - FORM 8-K - BayCom Corp | tv500761_8k.htm |
Exhibit 99.2

August 13, 2018 Expands Presence in New Mexico
2 Forward Looking Statements This presentation contains forward - looking statements regarding BayCom Corp . (“BayCom”) and the proposed merger with Bethlehem Financial Corporation (“BFC”) that are intended to be covered by the safe harbor for “forward - looking statements” as defined in the Private Securities Litigation Reform Act of 1995 . Statements about the expected timing, completion, the combined company after the closing of the transaction, effects of the proposed merger and all other statements in this communication other than historical facts constitute forward - looking statements . Investors and security holders are cautioned not to place undue reliance on any forward - looking statements, which speak only as of the date such statements are made . These statements may relate to future financial performance, strategic plans or objectives, revenues or earnings projections, or other financial information . By their nature, these statements are subject to numerous uncertainties that could cause actual results to differ materially from those anticipated in the statements . In addition to factors disclosed in the BayCom's SEC reports, important factors that could cause actual results to differ materially from the results anticipated or projected include, but are not limited to, the following : expected revenues, cost savings, synergies and other benefits from the proposed merger of BayCom and BFC might not be realized within the expected time frames or at all and costs or difficulties relating to integration matters, including but not limited to customer and employee retention, might be greater than expected ; the requisite regulatory approvals for the proposed merger of BayCom and BFC may be delayed or may not be obtained (or may result in the imposition of conditions that could adversely affect the combined company or the expected benefits of the proposed merger) ; the requisite approval of BFC shareholders may be delayed or may not be obtained, the other closing conditions to the merger may be delayed or may not be obtained, or the merger agreement may be terminated ; business disruption may occur following or in connection with the proposed merger of BayCom and BFC ; BayCom 's or BFC's businesses may experience disruptions due to transaction - related uncertainty or other factors making it more difficult to maintain relationships with employees, customers, other business partners or governmental entities ; the possibility that the proposed merger is more expensive to complete than anticipated, including as a result of unexpected factors or events ; and the diversion of managements' attention from ongoing business operations and opportunities as a result of the proposed merger or otherwise . Additional factors which could affect the forward - looking statements can be found in the cautionary language included under the headings “Risk Factors” and “Cautionary Note Regarding Forward - Looking Statements” in the Company’s prospectus filed with the SEC pursuant to Rule 424 (b) of the Securities Act on May 4 , 2018 and other documents subsequently filed by BayCom with the SEC which are available online at www . sec . gov . Consequently, no forward - looking statement can be guaranteed . Neither BayCom nor BFC undertakes any obligation to update or revise any forward - looking statements, whether as a result of new information, future events or otherwise . Annualized, pro forma, projected and estimated numbers are used for illustrative purposes only, are not forecasts and may not reflect actual results . This document may be deemed to be solicitation material in respect of the proposed merger of BFC with and into BayCom . BFC intends to send its shareholders a proxy statement regarding the proposed merger . Before making any voting or investment decision, investors and security holders of BFC are urged to carefully read the entire proxy statement, when it becomes available, because it will contain important information about the proposed transaction .

3 □ Balance Sheet: ▪ Assets: $ 156.8 million ▪ Loans: $79.4 million ▪ Deposits: $136.2 million □ Capital Ratios: ▪ TE/TA: 11.97% ▪ Leverage Ratio: 12.36% ▪ Total Risk - Based Capital Ratio: 22.13% □ Asset Quality: ▪ NPAs/Assets (ex. TDRs): 1.40% ▪ Reserves/Loans: 2.63% □ Profitability: ▪ ROAA: 0.90% ▪ ROAE: 7.57% ▪ Net interest margin: 4.32% 1) Bank level financial data for last twelve months ended June 30, 2018 Source : S&P Global Market Intelligence Corporate Overview – MyBank Bethlehem Financial Corporation is the bank holding company for MyBank. MyBank was founded in Belen, New Mexico in July 1992 as The Bank of Belen, and has served Valencia County and outlying areas since that time . MyBank is one of central New Mexico’s largest locally - owned banks. MyBank offers everything the big banks offer while remaining dedicated to its mission of building relationships through exceptional personalized service and commitment to its community. Overview Branch Map Financial Highlights 1 MyBank Locations BCML Location Map excludes BCML locations in California and Washington

4 Transaction Rationale Strategically Compelling Financially Attractive Low Risk □ Comprehensive due diligence process completed □ BCML has a successful track record completing and integrating mergers and acquisitions □ Extends BCML’s New Mexico footprint □ Small tuck - in, low risk acquisition to augment existing branch in Albuquerque, NM □ Complimentary business mix – including significant Owner - Occupied CRE portfolio □ Adding low - cost, core deposits continues to improve BayCom’s overall deposit mix □ 100% cash structure improves performance metrics and leverages capital raised in recent IPO □ Immediate and meaningful accretion to earnings (before merger costs) – in the mid - teens range □ Potential to achieve significant cost savings □ Modest tangible book value dilution; payback approximately 3 years □ Robust internal rate of return – greater than 20% □ Pricing multiples compare favorably with other recent transactions for banks similar in size and geography to MyBank

5 Transaction Terms Aggregate Deal Value 1 Termination Fee Anticipated Closing □ December 2018 □ $23.5 million □ Price/2018 Est. EPS: 17.0x □ Price/2019 Est. EPS after cost saves: 7.5x Purchase Price Consideration Mix P/TBV Required Approvals □ $62.00 per share □ 100% cash □ $1.5 million □ Customary regulatory approvals and Bethlehem shareholder approval 1) Based on 379,404 common shares of Bethlehem outstanding P/E □ 146.2%

6 Key Transaction Assumptions Estimated Cost Savings Capital Contingency: □ 40% □ Identified, but not modeled Purchase Accounting Marks Core Deposit Intangible Revenue Synergies: □ $1.6 million gross loan mark □ $0.8 million OREO mark □ 3.36% on non - maturity deposits □ None

7 Pro Forma Loan Portfolio As of June 30, 2018 Bank level regulatory data shown; does not include purchase accounting adjustments Source: Regulatory call reports, S&P Global Market Intelligence BCML MyBank Pro Forma C&D 3.7% 1 - 4 Fam 8.4% HELOC 0.8% OwnOcc CRE 26.4% Other CRE 33.4% Multifam 12.6% C&I 11.9% Consr & Other 2.9% C&D 15.1% 1 - 4 Fam 17.1% HELOC 7.4% OwnOcc CRE 32.3% Other CRE 14.8% Multifam 4.9% C&I 2.1% Consr & Other 6.2% C&D 4.6% 1 - 4 Fam 9.1% HELOC 1.3% OwnOcc CRE 26.8% Other CRE 31.9% Multifam 12.0% C&I 11.1% Consr & Other 3.1% Composition Composition Composition Loan Type ($000) % of Total Loan Type ($000) % of Total Loan Type ($000) % of Total Constr & Dev 33,388 3.7% Constr & Dev 12,027 15.1% Constr & Dev 45,415 4.6% 1-4 Family Residential 76,620 8.4% 1-4 Family Residential 13,580 17.1% 1-4 Family Residential 90,200 9.1% Home Equity 6,871 0.8% Home Equity 5,894 7.4% Home Equity 12,765 1.3% Owner - Occ CRE 240,894 26.4% Owner - Occ CRE 25,651 32.3% Owner - Occ CRE 266,545 26.8% Other CRE 305,321 33.4% Other CRE 11,713 14.8% Other CRE 317,034 31.9% Multifamily 115,585 12.6% Multifamily 3,909 4.9% Multifamily 119,494 12.0% Commercial & Industrial 108,969 11.9% Commercial & Industrial 1,680 2.1% Commercial & Industrial 110,649 11.1% Consr & Other 26,172 2.9% Consr & Other 4,937 6.2% Consr & Other 31,109 3.1% Total Loans $913,397 100.0% Total Loans $79,391 100.0% Total Loans $993,211 100.0% MRQ Yield on Loans: 5.34% MRQ Yield on Loans: 6.57% MRQ Yield on Loans: 5.44%
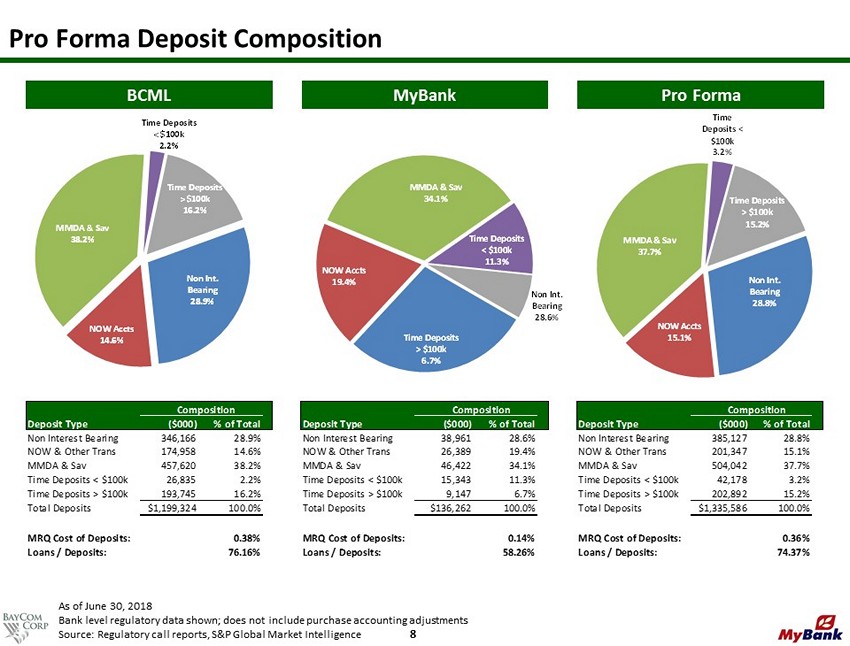
8 Pro Forma Deposit Composition BCML MyBank Pro Forma Composition Composition Composition Deposit Type ($000) % of Total Deposit Type ($000) % of Total Deposit Type ($000) % of Total Non Interest Bearing 346,166 28.9% Non Interest Bearing 38,961 28.6% Non Interest Bearing 385,127 28.8% NOW & Other Trans 174,958 14.6% NOW & Other Trans 26,389 19.4% NOW & Other Trans 201,347 15.1% MMDA & Sav 457,620 38.2% MMDA & Sav 46,422 34.1% MMDA & Sav 504,042 37.7% Time Deposits < $100k 26,835 2.2% Time Deposits < $100k 15,343 11.3% Time Deposits < $100k 42,178 3.2% Time Deposits > $100k 193,745 16.2% Time Deposits > $100k 9,147 6.7% Time Deposits > $100k 202,892 15.2% Total Deposits $1,199,324 100.0% Total Deposits $136,262 100.0% Total Deposits $1,335,586 100.0% MRQ Cost of Deposits: 0.38% MRQ Cost of Deposits: 0.14% MRQ Cost of Deposits: 0.36% Loans / Deposits: 76.16% Loans / Deposits: 58.26% Loans / Deposits: 74.37% Non Int. Bearing 28.9% NOW Accts 14.6% MMDA & Sav 38.2% Time Deposits < $100k 2.2% Time Deposits > $100k 16.2% Non Int. Bearing 28.6% NOW Accts 19.4% MMDA & Sav 34.1% Time Deposits < $100k 11.3% Time Deposits > $100k 6.7% Non Int. Bearing 28.8% NOW Accts 15.1% MMDA & Sav 37.7% Time Deposits < $100k 3.2% Time Deposits > $100k 15.2% As of June 30, 2018 Bank level regulatory data shown; does not include purchase accounting adjustments Source: Regulatory call reports, S&P Global Market Intelligence

9 As of June 30, 2017 Source : S&P Global Market Intelligence, Claritas Pro Forma Deposit Market Share and Demographic Overview Pro Forma Deposit Market Share Demographic Overview Large Employers and Universities Albuquerque MSA □ Largest city in New Mexico □ Population: 914,476 □ Projected Population Growth (2018 - 2023): 1.58% □ Median Household Income: 52,487 □ Projected Household Income Growth (2018 - 2023): 6.63% □ June 2018 Unemployment Rate: 4.9% Albuquerque MSA 2017 # Total Total Of Deposits Market Rank Institution (ST) Branches In Market Share (%) 1 Wells Fargo & Co. (CA) 32 5,245,065 37.11 2 Bank of America Corp. (NC) 16 2,962,227 20.96 3 BOK Financial Corp. (OK) 16 1,433,772 10.14 4 BNP Paribas 19 1,168,473 8.27 5 U.S. Bancorp (MN) 17 979,749 6.93 6 Heartland Financial USA Inc. (IA) 9 680,868 4.82 7 BBVA 12 501,863 3.55 8 FirstSun Capital Bancorp (CO) 3 266,023 1.88 Pro Forma Company 6 173,067 1.22 9 Bethlehem Financial Corp (NM) 5 141,983 1.00 10 Las Vegas Bancorp. Inc. (NM) 1 141,810 1.00 17 BayCom Corp (CA) 1 31,084 0.22 Total For Institutions In Market 153 14,135,162