Attached files
| file | filename |
|---|---|
| EX-10.53 - EXHIBIT 10.53 - KENNAMETAL INC | kmt630201810kex1053.htm |
| EX-32.1 - EXHIBIT 32.1 - KENNAMETAL INC | kmt630201810kex321.htm |
| EX-31.2 - EXHIBIT 31.2 - KENNAMETAL INC | kmt630201810kex312.htm |
| EX-31.1 - EXHIBIT 31.1 - KENNAMETAL INC | kmt630201810kex311.htm |
| EX-23 - EXHIBIT 23 - KENNAMETAL INC | kmt630201810kex23.htm |
| EX-21 - EXHIBIT 21 - KENNAMETAL INC | kmt630201810kex21.htm |
| EX-10.61 - EXHIBIT 10.61 - KENNAMETAL INC | kmt630201810kex1061.htm |
| EX-10.60 - EXHIBIT 10.60 - KENNAMETAL INC | kmt630201810kex1060.htm |
| EX-10.16 - EXHIBIT 10.16 - KENNAMETAL INC | kmt630201810kex1016.htm |
| EX-10.12 - EXHIBIT 10.12 - KENNAMETAL INC | kmt630201810kex1012.htm |
| EX-10.6 - EXHIBIT 10.6 - KENNAMETAL INC | kmt630201810kex106.htm |
UNITED STATES
SECURITIES AND EXCHANGE COMMISSION
Washington, D.C. 20549
FORM 10-K
ANNUAL REPORT PURSUANT TO SECTION 13 OR 15(d) OF THE
SECURITIES EXCHANGE ACT OF 1934
FOR THE FISCAL YEAR ENDED JUNE 30, 2018
Commission File Number 1-5318
KENNAMETAL INC.
(Exact name of registrant as specified in its charter)
Pennsylvania | 25-0900168 | |
(State or other jurisdiction of incorporation or organization) | (I.R.S. Employer Identification No.) | |
600 Grant Street | ||
Suite 5100 | ||
Pittsburgh, Pennsylvania | 15219-2706 | |
(Address of Principal Executive Offices) | (Zip Code) | |
Registrant’s telephone number, including area code: (412) 248-8000
Securities registered pursuant to Section 12(b) of the Act:
Title of each class | Name of each exchange on which registered | |
Capital Stock, par value $1.25 per share | New York Stock Exchange | |
Preferred Stock Purchase Rights | New York Stock Exchange | |
Securities registered pursuant to Section 12(g) of the Act: None.
Indicate by check mark if the registrant is a well-known seasoned issuer, as defined in Rule 405 of the Securities Act. Yes [X] No [ ]
Indicate by check mark if the registrant is not required to file reports pursuant to Section 13 or Section 15(d) of the Act. Yes [ ] No [X]
Indicate by check mark whether the registrant (1) has filed all reports required to be filed by Section 13 or 15(d) of the Securities Exchange Act of 1934 during the preceding 12 months (or for such shorter period that the registrant was required to file such reports), and (2) has been subject to such filing requirements for the past 90 days. Yes [X] No [ ]
Indicate by check mark whether the registrant has submitted electronically and posted on its corporate Web site, if any, every Interactive Data File required to be submitted and posted pursuant to Rule 405 of Regulation S-T (§232.405 of this chapter) during the preceding 12 months (or for such shorter period that the registrant was required to submit and post such files). Yes [X] No [ ]
Indicate by check mark if disclosure of delinquent filers pursuant to Item 405 of Regulation S-K (§229.405 of this chapter) is not contained herein, and will not be contained, to the best of registrant’s knowledge, in definitive proxy or information statements incorporated by reference in Part III of this Form 10-K or any amendment to this Form 10-K. [X]
Indicate by check mark whether the registrant is a large accelerated filer, an accelerated filer, a non-accelerated filer, a smaller reporting company, or an emerging growth company. See the definitions of “large accelerated filer,” “accelerated filer,” “smaller reporting company,” and "emerging growth company" in Rule 12b-2 of the Exchange Act.
Large accelerated filer [X] | Accelerated filer [ ] | |||||
Non-accelerated filer [ ] (Do not check if smaller reporting company) | Smaller reporting company [ ] | |||||
Emerging growth company [ ] | ||||||
If an emerging growth company, indicate by check mark if the registrant has elected not to use the extended transition period for complying with any new or revised financial accounting standards provided pursuant to Section 13(a) of the Exchange Act. [ ]
Indicate by check mark whether the registrant is a shell company (as defined by Rule 12b-2 of the Exchange Act). Yes [ ] No [X]
As of December 31, 2017, the aggregate market value of the registrant’s Capital Stock held by non-affiliates of the registrant, estimated solely for the purposes of this Form 10-K, was approximately $2,922,300,000. For purposes of the foregoing calculation only, all directors and executive officers of the registrant and each person who may be deemed to own beneficially more than 5% of the registrant’s Capital Stock have been deemed affiliates.
As of July 31, 2018, there were 81,647,556 of the Registrant’s Capital Stock outstanding.
DOCUMENTS INCORPORATED BY REFERENCE
Portions of the Proxy Statement for the 2018 Annual Meeting of Shareholders are incorporated by reference into Part III.
Item No. | Page | |
1 | ||
1A. | ||
1B. | ||
2. | ||
3. | ||
4. | ||
5. | ||
6. | ||
7. | ||
7A. | ||
8. | ||
9. | ||
9A. | ||
9B. | ||
10. | ||
11. | ||
12. | ||
13. | ||
14. | ||
15. | ||
16. | ||
2
FORWARD-LOOKING INFORMATION
Statements and financial discussion and analysis contained herein and in the documents incorporated by reference herein that are not historical facts are "forward-looking statements" within the meaning of Section 27A of the Securities Act of 1933, as amended, and Section 21E of the Securities Exchange Act of 1934, as amended (the "Exchange Act"). For example, statements about Kennametal's outlook for earnings, sales volumes, cash flow, and capital expenditures for its fiscal year 2019, its expectations regarding future growth and any statements regarding future operating or financial performance or events are forward-looking. We have also included forward-looking statements in this Annual Report on Form 10-K ("Annual Report") concerning, among other things, our strategy, goals, plans and projections regarding our financial position, liquidity and capital resources, results of operations, market position, and product development. Forward-looking statements are based on management's beliefs, assumptions and estimates using information available to us at the time the statements are made. These statements are not guarantees of future events or performance and are subject to various risks and uncertainties that are difficult to predict. Should one or more of these risks or uncertainties materialize, or should the assumptions underlying the forward-looking statements prove incorrect, our actual results could vary materially from our current expectations. There are a number of factors that could cause our actual results to differ from those indicated in the forward-looking statements. They include: downturns in the business cycle or economic downturns; our ability to achieve all anticipated benefits of our restructuring, simplification and modernization initiatives; risks related to our foreign operations and international markets, such as fluctuations in currency exchange rates, different regulatory environments, trade barriers, exchange controls, and social and political instability; changes in the regulatory environment in which we operate, including environmental, health and safety regulations; potential for future goodwill and other intangible asset impairment charges; our ability to protect and defend our intellectual property; continuity and security of information technology infrastructure; competition; our ability to retain our management and employees; demands on management resources; availability and cost of the raw materials we use to manufacture our products; product liability claims; integrating acquisitions and achieving the expected savings and synergies; global or regional catastrophic events; demand for and market acceptance of our products; business divestitures; labor relations; and implementation of environmental remediation matters. We provide additional information about many of the specific risks we face in the "Risk Factors" section of this Annual Report. We can give no assurance that any goal or plan set forth in forward-looking statements can be achieved and readers are cautioned not to place undue reliance on such statements, which speak only as of the date made. Except as required by law, we do not intend to release publicly any revisions to forward-looking statements as a result of future events or developments, except as otherwise required by law.
3
PART I
ITEM 1 - BUSINESS
OVERVIEW Kennametal Inc. was incorporated in Pennsylvania in 1943 as a manufacturer of tungsten carbide metal cutting tooling. From this beginning, the Company has grown into a global leader in the development and application of tungsten carbides, ceramics, super-hard materials and solutions used in metal cutting and mission-critical wear applications to combat extreme conditions associated with wear fatigue, corrosion and high temperatures. The Company's reputation for material technology, metal cutting application knowledge, as well as expertise and innovation in the development of custom solutions and services, contributes to its leading position in its primary markets.
Our product offering includes a wide selection of standard and customized technologies for metalworking applications, such as turning, milling, hole making, tooling systems and services. End users of the Company's metalworking products include manufacturers engaged in a diverse array of industries including: the manufacturers of transportation vehicles and components, machine tools and light and heavy machinery; airframe and aerospace components; and energy-related components for the oil and gas industry, as well as power generation.
We also produce specialized wear components and metallurgical powders that are used for custom-engineered and challenging applications. End users of these products include producers and suppliers in equipment-intensive operations such as coal mining, road construction, quarrying, oil and gas exploration, refining, production and supply.
Unless otherwise specified, any reference to a “year” refers to our fiscal year ending on June 30.
BUSINESS SEGMENT REVIEW The Company operates in three segments: Industrial, Widia and Infrastructure. The Company's reportable operating segments have been determined in accordance with the Company's internal management structure, which is organized based on operating activities, the manner in which we organize segments for making operating decisions and assessing performance and the availability of separate financial results. Sales and operating income by segment are presented in Management’s Discussion and Analysis of Financial Condition and Results of Operations set forth in Item 7 of this Annual Report (MD&A). Additional segment data is provided in Note 20 of our consolidated financial statements set forth in Item 8 of this Annual Report which is incorporated herein by reference.
INDUSTRIAL In the Industrial segment, we focus on customers in the transportation, general engineering, aerospace and defense market sectors, delivering high performance metalworking tools for specified purposes. Our customers in these end markets use our products and services in the manufacture of engines, airframes, automobiles, trucks, ships and various other types of industrial equipment. The technology and customization services we provide vary by customer, application and industry. Industrial goes to market under the Kennametal® brand through its direct sales force, a network of independent and national chain distributors, integrated supplier channels and via the Internet. Application engineers and technicians are critical to the sales process and directly assist our customers with specified product design, selection, application and support.
WIDIA In the Widia segment, we offer a focused assortment of standard and custom metal cutting solutions to general engineering, aerospace, energy and transportation customers. We serve our customers primarily through a network of value added resellers, integrated supplier channels and via the Internet. Widia markets its products under the WIDIA®, WIDIA Hanita® and WIDIA GTD® brands.
INFRASTRUCTURE In the Infrastructure segment, we focus on customers in the energy and earthworks market sectors that support primary industries such as oil and gas, power generation and chemicals; underground, surface and hard-rock mining; highway construction and road maintenance; and process industries such as food and feed. Our success is determined by our ability to gain an in-depth understanding of our customers’ engineering and development needs, to provide complete system solutions and high-performance capabilities to optimize and add value to their operations. Infrastructure markets its products primarily under the Kennametal® brand and sells through a direct sales force as well as through distributors.
INTERNATIONAL OPERATIONS During 2018, we generated 59 percent of our sales in markets outside of the United States of America (U.S.), with principal international operations in Western Europe, Asia and Canada. We also operate manufacturing and distribution facilities in Israel, Latin America and South Africa, while serving customers through sales offices, agents and distributors in Eastern Europe and other parts of the world. While geographic diversification helps to minimize the sales and earnings impact of demand changes in any one particular region, our international operations are subject to normal risks of doing business globally, including fluctuations in currency exchange rates and changes in social, political and economic environments.
4
Our international assets and sales are presented in Note 20 of the Company’s consolidated financial statements, set forth in Item 8 of this Annual Report and are incorporated herein by reference. Further information about the effects and risks of currency exchange rates is presented in the Quantitative and Qualitative Disclosures About Market Risk section, as set forth in Item 7A of this Annual Report.
STRATEGY AND GENERAL DEVELOPMENT OF BUSINESS In fiscal 2018, we continued making progress on our three initiatives to transform the Company through growth, simplification and modernization. While each of these initiatives will continue during the coming years, we have made significant achievements in each of these areas.
Growth
• | Transitioning customers from the direct to indirect channel to both improve customer service and refocus our direct sales force on larger accounts, enabling our commercial team to grow sales on an account basis |
• | Continued development and refining of our channel strategy |
• | Implementing customer classification and customer relationship management (CRM) software for sales planning and strategy |
Simplification and Modernization
• | Reducing the number of stock keeping units, powder formulations, grades and coatings to reduce manufacturing and supply chain complexity |
• | Enforcing our established minimum order quantities and economic order quantities to improve manufacturing efficiency |
• | Initiated Industrial segment headcount reduction actions expected to deliver annualized pre-tax savings of approximately $10 million within the first half of fiscal 2019 |
• | Completed our legacy restructuring programs in fiscal 2018, achieving ongoing annualized savings of approximately $165 million |
• | Multi-year modernization program for our manufacturing facilities still in early stages |
• | Modernization of Rogers, Arkansas facility, largely complete |
Markets were more positive than in the prior year and exceeded the expectations we set when we embarked on fiscal 2018. Total sales growth was 15.0 percent with year-over-year growth in all segments, end markets and regions, reflecting not only continued strong end market demand but improving commercial execution. We delivered fiscal 2018 results in-line with our multi-year profitability improvement plan. We also expect fiscal 2019 to be on-track and represent another significant step forward in improved profitability and growth for the company.
The cost savings achieved through our restructuring programs do not include the anticipated benefits from our Modernization initiative. The results of these programs are anticipated to accrue to the Company over the next three years. At the same time, we continue to focus on cash flow and liquidity to support our planned investments. Our operating flexibility was enhanced with an amendment to our five-year, multi-currency, revolving credit facility that increased borrowing capacity from $600.0 million to $700.0 million and was extended to June 2023. Further, on June 7, 2018, we completed the offering of $300.0 million of 4.625 percent Senior Unsecured Notes due June 15, 2028. Net proceeds were used for redemption of our previously outstanding $400.0 million of 2.650 percent Senior Unsecured Notes with an original maturity of November 1, 2019 in July 2018. Further discussion and analysis of the development of our business is set forth in MD&A.
ACQUISITIONS AND DIVESTITURES We continue to evaluate new opportunities for the expansion of our existing product lines into new market areas where appropriate. We also continue to evaluate opportunities for the introduction of new and/or complementary product offerings into new and/or existing market areas where appropriate. In the near term, we expect to continue to grow our business and further enhance our market position through the investment opportunities that exist within our core businesses, though we may evaluate acquisition opportunities that have the potential to strengthen or expand our business.
RAW MATERIALS AND SUPPLIES Our major metallurgical raw materials consist of tungsten ore concentrates and scrap carbide, which is used to make tungsten oxide, as well as compounds and secondary materials such as cobalt. Although an adequate supply of these raw materials currently exists, our major sources for raw materials are located abroad and prices fluctuate at times. We have entered into extended raw material supply agreements and expect to implement product price increases as necessary to mitigate rising costs. For these reasons, we exercise great care in selecting, purchasing and managing availability of raw materials. We also purchase steel bars and forgings for making toolholders and other tool parts, as well as for producing rotary cutting tools and accessories. We purchase products for use in manufacturing processes and for resale from thousands of suppliers located in the U.S. and abroad. Our internal capabilities provide access to additional sources of raw materials and offer tungsten carbide recycling capabilities, and therefore, help mitigate our reliance on third parties. Although the trade environment is evolving, we currently do not expect tariffs to have a material effect on our sales or cost structure.
5
RESEARCH AND DEVELOPMENT Our product development efforts focus on providing solutions to our customers’ manufacturing challenges and productivity requirements. Our product development program provides discipline and focus to the product development process by establishing “gateways,” or sequential tests, during the development process to remove inefficiencies and accelerate improvements. This program speeds and streamlines development into a series of actions and decision points, combining efforts and resources to produce new and enhanced products faster. It is designed to assure a strong link between customer requirements and corporate strategy, and to enable us to gain the full benefits of our investment in new product development.
We hold a number of patents and trademarks which, in the aggregate, are material to the operation of our businesses. The duration of our patent protection varies throughout the world by jurisdiction.
Research and development expenses included in operating expense totaled $38.9 million, $38.0 million and $39.4 million in 2018, 2017 and 2016, respectively.
SEASONALITY Our business is affected by seasonal variations to varying degrees by traditional summer vacation shutdowns of customers’ plants and holiday shutdowns that affect our sales levels during the first and second quarters of our fiscal year.
BACKLOG Our backlog of orders generally is not significant to our operations.
COMPETITION As one of the world’s leading producers of metalworking tools and specialty wear-resistant components and coating solutions, we maintain a leading competitive position in major markets worldwide. We continually strengthen our competitive position by developing new and innovative metalworking and earth cutting products and services, innovative surface and wear solutions and innovative products for mining, construction and road milling applications among many others. We actively compete in the sale of all our products with several large global competitors and with many smaller niche businesses offering various capabilities to customers around the world. While several of our competitors are divisions of larger corporations, our industry remains largely fragmented, containing several hundred fabricators, toolmakers and niche specialty coating businesses. Many of our competitors operate relatively small facilities, producing a limited selection of tools while buying cemented tungsten carbide components from original producers of cemented tungsten carbide products, including Kennametal. We also supply coating solutions and other engineered wear-resistant products to both larger corporations and smaller niche businesses. Given the fragmentation, opportunities for consolidation exist from both U.S.-based and internationally-based firms, as well as among thousands of industrial supply distributors.
The principal competitive differentiators in our businesses include customer focused support and application expertise, custom and standard product innovation, product performance and quality, as well as service, pricing and productivity delivered ascribed to our brands. We derive competitive advantage from our premium brand positions, global presence, application expertise and ability to address unique customer needs with new and improved tools, innovative surface and wear solutions, highly engineered components, consistent quality, traditional and digital customer service and technical assistance capabilities, state-of-the-art manufacturing and multiple sales channels. With these strengths, we are able to sell products based on the value-added productivity we deliver to our customers, rather than competing solely on price.
REGULATION From time to time, we are a party to legal claims and proceedings that arise in the ordinary course of business, which may relate to our operations or assets, including real, tangible, or intellectual property assets. While we currently believe that the amount of ultimate liability, if any, we may face with respect to these actions will not materially affect our financial position, results of operations or liquidity, the ultimate outcome of any litigation is uncertain. Were an unfavorable outcome to occur or if protracted litigation were to ensue, the impact on us could be material.
Compliance with government laws and regulations pertaining to the discharge of materials or pollutants into the environment or otherwise relating to the protection of the environment did not have a material effect on our capital expenditures or competitive position for the years covered by this Annual Report, nor is such compliance expected to have a material effect on us in the future.
Among other environmental laws, we are subject to the Comprehensive Environmental Response Compensation and Liability Act of 1980 (Superfund), under which we have been designated by the United States Environmental Protection Agency (USEPA) as a potentially responsible party (PRP) with respect to environmental remedial costs at certain Superfund sites. We have evaluated our claims and potential liability associated with these Superfund sites based upon the best information currently available to us. We believe our environmental accruals will be adequate to cover our portion of the environmental remedial costs at those Superfund sites where we have been designated a PRP, to the extent these expenses are probable and reasonably estimable.
6
Reserves for other potential environmental liabilities at June 30, 2018 and 2017 were $12.5 million and $12.4 million, respectively. The reserves that we have established for our potential environmental liabilities represent our best current estimate of the costs of addressing all identified environmental situations, based on our review of currently available evidence, taking into consideration our prior experience in environmental remediation and the experiences of other companies, as well as public information released by the USEPA, other governmental agencies, and by the PRP groups in which we are participating. Although our reserves currently appear to be sufficient to cover our potential environmental liabilities, there are uncertainties associated with environmental remediation matters, and we can give no assurance that our estimate of any environmental liability will not increase or decrease in the future. Our reserved and unreserved liabilities for environmental matters could change substantially due to factors such as the nature and extent of contamination, changes in remedial requirements, technological changes, discovery of new information, the financial strength of other PRPs, the identification of new PRPs and the involvement of and direction taken by the U.S. government on these matters.
We maintain a Corporate Environmental, Health and Safety (EHS) Department to monitor our compliance with environmental regulations and to oversee our remediation activities. In addition, we have designated EHS coordinators who are responsible for each of our manufacturing facilities. Our financial management team periodically meets with members of the Corporate EHS Department and the Corporate Legal Department to review and evaluate the status of environmental projects and contingencies. On a quarterly basis, we review financial provisions and reserves for environmental contingencies and adjust these reserves when appropriate.
EMPLOYEES We employed approximately 10,500 people at June 30, 2018, of which approximately 3,400 were located in the U.S. and 7,100 were located in other parts of the world, principally Europe, Asia Pacific and India. At June 30, 2018, approximately 3,200 of our employees were represented by labor unions. We consider our labor relations to be generally good.
AVAILABLE INFORMATION Our Internet address is www.kennametal.com. On the SEC Filings page of our Website, which is accessible under the "About Us" tab, under Investor Relations, we post the following filings as soon as reasonably practicable after they are electronically filed with or furnished to the Securities and Exchange Commission (SEC): our annual reports on Form 10-K, our annual proxy statements, our annual conflict minerals disclosure and reports on Form SD, our annual reports on Form 11-K, our quarterly reports on Form 10-Q, our current reports on Form 8-K and any amendments to those reports filed or furnished pursuant to Section 13(a) or 15(d) of the Exchange Act. The SEC Filings page of our Website also includes Forms 3, 4 and 5 filed pursuant to Section 16(a) of the Exchange Act. All filings posted on our SEC Filings page are available to be viewed on our Website free of charge. On the Corporate Governance page of our Website, which is accessible under the "About Us" tab, under Investor Relations, we post the following charters and guidelines: Audit Committee Charter, Compensation Committee Charter, Nominating/Corporate Governance Committee Charter, Kennametal Inc. Corporate Governance Guidelines and Kennametal Inc. Stock Ownership Guidelines. On the Ethics and Compliance page of our Website, which is under the "About Us" tab, under Company Profile, we post our Code of Conduct and our Conflict Minerals Statement. All charters and guidelines posted on our Website are available to be viewed free of charge. Information contained on our Website is not part of this Annual Report or our other filings with the SEC. Copies of this Annual Report and those items disclosed on the Corporate Governance and Ethics and Compliance pages of our Website are available without charge upon written request to: Investor Relations, Kennametal Inc., 600 Grant Street, Suite 5100, Pittsburgh, Pennsylvania 15219-2706. The public may read and copy any materials we file with the SEC at the SEC's Public Reference Room at 100 F Street, NE, Washington, DC 20549. The public may obtain information on the operation of the Public Reference Room by calling the SEC at 1-800-SEC-0330. The SEC maintains an Internet site (www.sec.gov) that contains reports, proxy and information statements, and other information regarding issuers that file electronically with the SEC.
RISK FACTORS
This section describes material risks to our business that are currently known to us. Our business, financial condition or results of operations may be materially affected by a number of factors. Our management regularly monitors the risks inherent in our business, with input and assistance from our Enterprise Risk Management department. In addition to real time monitoring, we periodically conduct a formal enterprise-wide risk assessment to identify factors and circumstances that might present significant risk to the Company. Many of these risks are discussed throughout this report. The risks below, however, are not exhaustive. We operate in a rapidly changing environment. Other risks that we currently believe to be immaterial could become material in the future. We are also subject to legal and regulatory changes. New factors could emerge, and it is not possible to predict the outcome of all such risk factors on our business, financial condition or results of operations. The following discussion details the material risk factors and uncertainties that we believe could cause Kennametal’s actual results to differ materially from those projected in any forward-looking statements.
7
Downturns in the business cycle could adversely affect our sales and profitability. Our business has historically been cyclical and subject to significant impact from economic downturns. Global economic downturn coupled with global financial and credit market disruptions have had a negative impact on our sales and profitability historically. These events could contribute to weak end markets, a sharp drop in demand for our products and services and higher costs of borrowing and/or diminished credit availability. Although we believe that the long-term prospects for our business remain positive, we are unable to predict the future course of industry variables or the strength and pace or sustainability of economic development.
Our restructuring efforts may not have the intended effects. We recently completed our legacy multi-year restructuring programs, and in the future may implement additional programs to improve our manufacturing costs and operating expenses. However, there is no assurance that these efforts, or that any other actions that we have taken or may take, will be sufficient to counter any future economic or industry disruptions. We cannot provide assurance that we will not incur additional restructuring charges or impairment charges, or that we will achieve all of the anticipated benefits from the restructuring actions we have taken or plan to take in the future. If we are unable to effectively restructure our operations in the light of evolving market conditions, it could have a material adverse effect on our business, financial condition, results of operations and cash flows.
Our modernization initiative began in fiscal 2017. The purpose of this initiative is to invest in our plants, equipment and processes to automate and lower our overall labor cost. These capital investments are expected to result in substantial savings from reduced labor, maintenance and supply costs, while at the same time improving the quality of our products. We cannot provide any assurances that we will achieve all of the anticipated savings from these planned actions. These initiatives are expected to put pressure on our cash flows for the near-term. Further, as demand has grown faster than initially expected, it is possible that we may not be able to modernize fast enough to keep up with demand in select locations, causing us to keep direct hourly employment in certain circumstances somewhat higher than previously anticipated. If we are unable to effectively execute our plans, it could have a material adverse effect on our business, financial condition, results of operations and cash flows.
Our international operations pose certain risks that may adversely impact sales and earnings. We have manufacturing operations and assets located outside of the U.S., including but not limited to those in Western Europe, Brazil, Canada, China, India, Israel and South Africa. We also sell our products to customers and distributors located outside of the U.S. During the year ended June 30, 2018, 59 percent of our consolidated sales were derived from non-U.S. markets. These international operations are subject to a number of special risks, in addition to the risks of our domestic operations, including currency exchange rate fluctuations, differing protections of intellectual property, trade barriers, exchange controls, regional economic uncertainty, differing (and possibly more stringent) labor regulations, labor unrest, risk of governmental expropriation, domestic and foreign customs and tariffs, current and changing regulatory environments (including, but not limited to, the risks associated with the importation and exportation of products and raw materials), risk of failure of our foreign employees to comply with both U.S. and foreign laws, including antitrust laws, trade regulations and the Foreign Corrupt Practices Act, difficulty in obtaining distribution support, difficulty in staffing and managing widespread operations, differences in the availability and terms of financing, political instability and unrest and risks of increases in taxes. Also, in some foreign jurisdictions, we may be subject to laws limiting the right and ability of entities organized or operating therein to pay dividends or remit earnings to affiliated companies unless specified conditions are met. To the extent we are unable to effectively manage our international operations and these risks, our international sales may be adversely affected, we may be subject to additional and unanticipated costs, and we may be subject to litigation or regulatory action. As a consequence, our business, financial condition and results of operations could be seriously harmed.
Changes in the regulatory environment, including environmental, health and safety regulations, could subject us to increased compliance and manufacturing costs, which could have a material adverse effect on our business.
Health and Safety Regulations. Certain of our products contain hard metals, including tungsten and cobalt. Hard metal dust is being studied for potential adverse health effects by organizations in several regions throughout the world, including the U.S., Europe and Japan. Future studies on the health effects of hard metals may result in our products being classified as hazardous to human health, which could lead to new regulations in countries in which we operate that may restrict or prohibit the use of, and/or exposure to, hard metal dust. New regulation of hard metals could require us to change our operations, and these changes could affect the quality of our products and materially increase our costs.
8
Environmental Regulations. We are subject to various environmental laws, and any violation of, or our liabilities under, these laws could adversely affect us. Our operations necessitate the use and handling of hazardous materials and, as a result, we are subject to various federal, state, local and foreign laws, regulations and ordinances relating to the protection of the environment, including those governing discharges to air and water, handling and disposal practices for solid and hazardous wastes, the cleanup of contaminated sites and the maintenance of a safe workplace. These laws impose penalties, fines and other sanctions for noncompliance and liability for response costs, property damages and personal injury resulting from past and current spills, disposals or other releases of, or exposure to, hazardous materials. We could incur substantial costs as a result of noncompliance with or liability for cleanup or other costs or damages under these laws. We may be subject to more stringent environmental laws in the future. If more stringent environmental laws are enacted in the future, these laws could have a material adverse effect on our business, financial condition and results of operations.
Regulations affecting the mining and drilling industries or utilities industry. Some of our principal customers are mining and drilling companies and utility companies. Many of our mining and drilling customers supply coal, oil, gas or other fuels as a source of energy to utility companies in the U.S. and other industrialized regions. The operations of these mining and drilling companies are geographically diverse and are subject to or affected by a wide array of regulations in the jurisdictions where they operate, such as applicable environmental laws and regulations governing the mining and drilling industry and the utilities industry. As a result of changes in regulations and laws relating to these industries, our customers’ operations could be disrupted or curtailed by governmental authorities. The high cost of compliance with these regulations may also induce customers to discontinue or limit their operations, and may discourage companies from developing new opportunities. As a result of these factors, demand for our mining- and drilling-related products could be substantially affected by regulations adversely impacting the mining and drilling industries or altering the consumption patterns of utilities.
Impairment of goodwill and other intangible assets with indefinite lives could result in a negative impact on our financial condition and results of operations. At June 30, 2018, goodwill and other indefinite-lived intangible assets totaled $319.4 million, or 11 percent of our total assets. Goodwill results from acquisitions, representing the excess of cost over the fair value of the net tangible and other identifiable intangible assets we have acquired. We assess at least annually whether there has been impairment in the value of our intangible assets. If future operating performance at one or more of our reporting units were to fall significantly below current levels, we could record, under current applicable accounting rules, a non-cash impairment charge for goodwill or other intangible asset impairment. Any determination requiring the impairment of a significant portion of goodwill or other intangible assets would negatively affect our financial condition and results of operations.
Our continued success depends on our ability to protect and defend our intellectual property. Our future success depends in part upon our ability to protect and defend our intellectual property. We rely principally on nondisclosure agreements and other contractual arrangements and trade secret laws and, to a lesser extent, trademark and patent laws, to protect our intellectual property. However, these measures may be inadequate to protect our intellectual property from infringement by others or prevent misappropriation of our proprietary rights. In addition, the laws of some foreign countries do not protect proprietary rights to the same extent as do U.S. laws. If one of our patents is infringed upon by a third party, we may need to devote significant time and financial resources to defend our rights with respect to such patent. We may not be successful in defending our patents. Similarly, while we do not knowingly infringe on the patents, copyrights or other intellectual property rights of others, we may be required to spend a significant amount of time and financial resources to resolve any infringement claims against us, and we may not be successful in defending our position or negotiating alternative remedies. Our inability to protect our proprietary information and enforce or defend our intellectual property rights in proceedings initiated by us or brought against us could have a material adverse effect on our business, financial condition and results of operations.
Failure of, or a breach in security of, our information technology systems could adversely affect our business. We rely on information technology infrastructure to achieve our business objectives. Any disruption of our infrastructure could negatively impact our ability to record or process orders, manufacture and ship in a timely manner, or otherwise carry on business in the normal course. Any disruption could cause us to lose customers or revenue and could require us to incur significant expense to remediate.
In recent years, cybersecurity attacks have become more sophisticated and more prevalent. A security breach of our information technology systems could interrupt or damage our operations or harm our reputation. In addition, we could be subject to liability if confidential information relating to customers, employees, vendors and the extended supply chain or other parties is misappropriated from our computer system. We do not believe we have been the target of a material successful cyber attack. While we have dedicated increased resources to fortify our security measures, our systems may be vulnerable to physical break-ins, computer viruses, human error, programming errors or similar disruptive problems. Therefore, we cannot assure that our system improvements will be sufficient to prevent or limit the damage from any cyber attack or network disruption.
9
We operate in a highly competitive environment. Our domestic and foreign operations are subject to significant competitive pressures. We compete directly and indirectly with other manufacturers and suppliers of metalworking tools, engineered components and advanced materials. Some of our competitors are larger than we are and may have greater access to financial resources or be less leveraged than us. In addition, the industry in which our products are used is a large, fragmented industry that is highly competitive.
If we are unable to retain our qualified management and employees, our business may be negatively affected. Our ability to provide high quality products and services depends in part on our ability to retain our skilled personnel in the areas of management, product engineering, servicing and sales. Competition for such personnel is intense, and our competitors can be expected to attempt to hire our management and skilled employees from time to time. In addition, our restructuring activities and strategies for growth have placed, and are expected to continue to place, increased demands on our management’s skills and resources. If we are unable to retain our management team and professional personnel, our customer relationships and level of technical expertise could be negatively affected, which may materially and adversely affect our business.
Any interruption of our workforce, including interruptions due to our restructuring initiatives, unionization efforts, changes in labor relations or shortages of appropriately skilled individuals could impact our business.
Our future operating results may be affected by fluctuations in the prices and availability of raw materials. The raw materials we use for our products include tungsten ore concentrates and scrap carbide, which is used to make tungsten oxide, as well as compounds and secondary materials such as cobalt. A significant portion of our raw materials is supplied by sources outside of the U.S. The raw materials industry as a whole is highly cyclical and at times pricing and supply can be volatile due to a number of factors beyond our control, including natural disasters, general economic and political conditions, labor costs, competition, import duties, tariffs and currency exchange rate fluctuations. This volatility can significantly affect our raw material costs. In an environment of increasing raw material prices, competitive conditions can affect how much of these price increases we can recover in the form of higher sales prices for our products. To the extent we are unable to pass on any raw material price increases to our customers, our profitability could be adversely affected. Furthermore, restrictions in the supply of tungsten, cobalt and other raw materials could adversely affect our operating results. If the prices for our raw materials increase or we are unable to secure adequate supplies of raw materials on favorable terms, our profitability could be impaired. If the prices for our raw materials decrease, we could face product pricing challenges.
Product liability claims could have a material adverse effect on our business. The sale of metalworking, mining, highway construction and other tools and related products as well as engineered components and advanced materials entails an inherent risk of product liability claims. We cannot give any assurances that the coverage limits of our insurance policies will be adequate or that our policies will cover any particular loss. Insurance can be expensive, and we may not always be able to purchase insurance on commercially acceptable terms, if at all. Claims brought against us that are not covered by insurance or that result in recoveries in excess of our insurance coverage could have a material adverse affect on our business, financial condition and results of operations.
We may not be able to complete, manage or integrate acquisitions successfully. We have acquired companies in the past and we may continue to evaluate acquisition opportunities that have the potential strengthen or expand our business. We can give no assurances, however, that any acquisition opportunities will arise or if they do, that they will be consummated, or that additional financing, if needed, will be available on satisfactory terms. In addition, acquisitions involve inherent risks that the businesses acquired will not perform in accordance with our expectations. We may not be able to achieve the synergies and other benefits we expect from the integration of acquisitions as successfully or rapidly as projected, if at all. Our failure to consummate an acquisition or effectively integrate newly acquired operations could prevent us from realizing our expected strategic growth and rate of return on an acquired business and could have a material and adverse effect on our results of operations and financial condition.
Natural disasters or other global or regional catastrophic events could disrupt our operations and adversely affect results. Despite our concerted effort to minimize risk to our production capabilities and corporate information systems and to reduce the effect of unforeseen interruptions to us through business continuity planning, we still may be exposed to interruptions due to catastrophe, natural disaster, pandemic, terrorism or acts of war, which are beyond our control. Disruptions to our facilities or systems, or to those of our key suppliers, could also interrupt operational processes and adversely impact our ability to manufacture our products and provide services and support to our customers. As a result, our business, our results of operations, financial position, cash flows and stock price could be adversely affected.
ITEM 1B – UNRESOLVED STAFF COMMENTS
None.
10
ITEM 2 – PROPERTIES
Our principal executive offices are located at 600 Grant Street, Suite 5100, Pittsburgh, Pennsylvania, 15219. Our corporate and technology center is located at 1600 Technology Way, P.O. Box 231, Latrobe, Pennsylvania, 15650. A summary of our principal manufacturing facilities and other materially important properties is as follows:
Primary Segment | ||||||
Location | Owned/Leased | Principal Products | IND(1) | WID(2) | INF(3) | |
United States: | ||||||
Gurley, Alabama | Owned | Metallurgical Powders | X | |||
Huntsville, Alabama | Owned | Metallurgical Powders | X | |||
Madison, Alabama | Owned | Tungsten Heavy Alloy | X | |||
Rogers, Arkansas | Owned/Leased | Carbide Products, Pelletizing Die Plates and Downhole Drilling Carbide Components | X | |||
Rockford, Illinois | Owned | Indexable Tooling | X | |||
Goshen, Indiana | Leased | Powders; Welding Rods, Wires and Machines | X | |||
New Albany, Indiana | Leased | High Wear Coating for Steel Parts | X | |||
Greenfield, Massachusetts | Owned | High-Speed Steel Taps | X | |||
Traverse City, Michigan | Owned | Wear Parts | X | |||
Fallon, Nevada | Owned | Metallurgical Powders | X | |||
Asheboro, North Carolina | Owned | Carbide Round Tools | X | |||
Henderson, North Carolina | Owned | Metallurgical Powders | X | |||
Roanoke Rapids, North Carolina | Owned | Metalworking Inserts | X | |||
Cleveland, Ohio | Leased | Distribution | X | |||
Orwell, Ohio | Owned | Metalworking Inserts | X | |||
Solon, Ohio | Owned | Metalworking Toolholders | X | |||
Whitehouse, Ohio | Owned | Metalworking Inserts and Round Tools | X | |||
Bedford, Pennsylvania | Owned/Leased | Mining and Construction Tools, Wear Parts and Distribution | X | |||
Irwin, Pennsylvania | Owned | Carbide Wear Parts | X | |||
New Castle, Pennsylvania | Owned/Leased | Specialty Metals and Alloys | X | |||
Johnson City, Tennessee | Owned | Metalworking Inserts | X | |||
La Vergne, Tennessee | Owned | Metalworking Inserts | X | |||
New Market, Virginia | Owned | Metalworking Toolholders | X | |||
International: | ||||||
La Paz, Bolivia | Owned | Tungsten Concentrate | X | |||
Indaiatuba, Brazil | Leased | Metalworking Carbide Drills and Toolholders | X | |||
Belleville, Canada | Owned | Casting Components, Coatings and Powder Metallurgy Components | X | |||
Victoria, Canada | Owned | Wear Parts | X | |||
Fengpu, China | Owned | Intermetallic Composite Ceramic Powders and Parts | X | |||
Shanghai, China | Owned | Powders, Welding Rods and Wires and Casting Components | X | |||
Shanghai, China | Owned | Distribution | X | |||
Tianjin, China | Owned | Metalworking Inserts, Carbide Round Tools and Metallurgical Powders | X | X | ||
Xuzhou, China | Leased | Mining Tools | X | |||
Ebermannstadt, Germany | Owned | Metalworking Inserts | X | |||
Essen, Germany | Owned | Metalworking Inserts | X | |||
Königsee, Germany | Leased | Metalworking Carbide Drills | X | |||
Lichtenau, Germany | Owned | Metalworking Toolholders | X | |||
Mistelgau, Germany | Owned | Wear Parts and Metallurgical Powders | X | |||
Nabburg, Germany | Owned | Metalworking Toolholders and Metalworking Round Tools, Drills and Mills | X | |||
Neunkirchen, Germany | Owned | Distribution | X | |||
11
Primary Segment | ||||||
Location | Owned/Leased | Principal Products | IND(1) | WID(2) | INF(3) | |
Schongau, Germany | Owned | Ceramic Vaporizer Boats | X | |||
Vohenstrauss, Germany | Owned | Metalworking Carbide Drills | X | |||
Bangalore, India | Owned | Metalworking Inserts, Toolholders and Wear Parts | X | X | X | |
Shlomi, Israel | Owned | High-Speed Steel and Carbide Round Tools | X | |||
Zory, Poland | Leased | Mining and Construction Conicals | X | |||
Boksburg, South Africa | Leased | Mining and Construction Conicals | X | |||
Barcelona, Spain | Leased | Metalworking Cutting Tools | X | |||
Kingswinford, United Kingdom | Leased | Distribution | X | |||
Newport, United Kingdom | Owned | Intermetallic Composite Powders | X | |||
(1) | Industrial segment |
(2) | Widia segment |
(3) | Infrastructure segment |
We also have a network of warehouses and customer service centers located throughout North America, Europe, India, Asia Pacific and Latin America, a significant portion of which are leased. The majority of our research and development efforts are conducted at our technology center located in Latrobe, Pennsylvania, U.S., as well as at our facilities in Rogers, Arkansas, U.S.; Fürth, Germany and Bangalore, India.
We use all of our significant properties in the businesses of powder metallurgy, tools, tooling systems, engineered components and advanced materials. Our production capacity is adequate for our present needs. We believe that our properties have been adequately maintained, are generally in good condition and are suitable for our business as presently conducted.
ITEM 3 - LEGAL PROCEEDINGS
The information set forth in Part I, Item 1, of this Annual Report under the caption “Regulation” is incorporated by reference into this Item 3. From time to time, we are party to legal claims and proceedings that arise in the ordinary course of business, which may relate to our operations or assets, including real, tangible or intellectual property. Although certain of these types of actions are currently pending, we do not believe that any individual proceeding is material or that our pending legal proceedings in the aggregate are material to Kennametal.
ITEM 4 - MINE SAFETY DISCLOSURES
Not applicable.
EXECUTIVE OFFICERS OF THE REGISTRANT
Incorporated by reference into this Part I is the information set forth in Part III, Item 10 of this Annual Report under the caption “Executive Officers of the Registrant.”
12
PART II
ITEM 5 - MARKET FOR THE REGISTRANT’S COMMON EQUITY, RELATED STOCKHOLDER MATTERS AND ISSUER PURCHASES OF EQUITY SECURITIES
Our capital stock is traded on the New York Stock Exchange under the symbol "KMT." The number of shareholders of record as of July 31, 2018 was 1,545. Stock price ranges and dividends declared and paid for 2018 and 2017 were as follows:
Quarter ended | September 30 | December 31 | March 31 | June 30 | ||||||||||||
Fiscal 2018 | ||||||||||||||||
High | $ | 40.78 | $ | 49.31 | $ | 52.52 | $ | 41.51 | ||||||||
Low | 32.23 | 39.89 | 39.40 | 34.37 | ||||||||||||
Dividends | 0.20 | 0.20 | 0.20 | 0.20 | ||||||||||||
Fiscal 2017 | ||||||||||||||||
High | $ | 29.35 | $ | 35.66 | $ | 39.94 | $ | 43.09 | ||||||||
Low | 20.40 | 26.79 | 31.28 | 36.14 | ||||||||||||
Dividends | 0.20 | 0.20 | 0.20 | 0.20 | ||||||||||||
The information incorporated by reference into Part III, Item 12 of this Annual Report from our 2018 Proxy Statement under the heading “Equity Compensation Plans – Equity Compensation Plan Information” is hereby incorporated by reference into this Item 5.
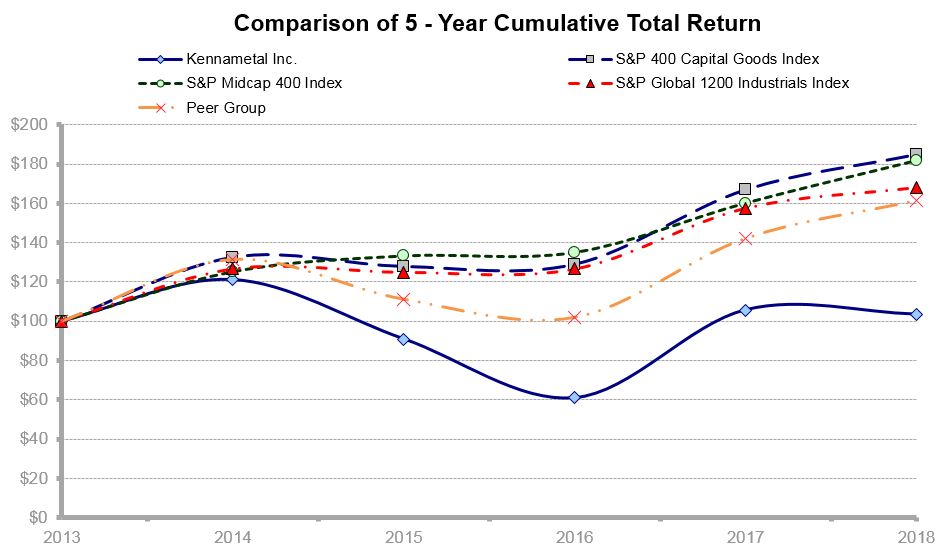
PERFORMANCE GRAPH
The following graph compares cumulative total shareholder return on our capital stock with the cumulative total shareholder return on the common stock of the companies in the Standard & Poor’s Mid-Cap 400 Market Index (S&P Midcap 400), the Standard & Poor’s 400 Capital Goods (S&P 400 Capital Goods), the Standard & Poor's Global 1200 Industrials Index (S&P Global 1200 Industrials) and the peer group of companies determined by us for the period from July 1, 2012 to June 30, 2018.
The Peer Group consists of the following companies: Actuant Corporation; Allegheny Technologies Incorporated; Ametek, Inc.; Barnes Group Inc.; Carpenter Technology Corporation; Crane Co.; Donaldson Company, Inc.; Flowserve Corporation; Graco Inc.; Harsco Corporation; IDEX Corporation; ITT Inc.; Lincoln Electric Holdings, Inc.; The Manitowoc Company, Inc.; Nordson Corporation; Rexnord Corporation; Sandvik AB, Corp.; SPX Corporation; SPX FLOW, Inc.; The Timken Company; and Woodward, Inc.
13
Assumes $100 Invested on July 1, 2013 and All Dividends Reinvested
2013 | 2014 | 2015 | 2016 | 2017 | 2018 | |||||||||||||
Kennametal | $ | 100.00 | $ | 121.09 | $ | 90.95 | $ | 60.95 | $ | 105.70 | $ | 103.48 | ||||||
Peer Group Index | 100.00 | 131.45 | 111.23 | 101.92 | 142.17 | 161.46 | ||||||||||||
S&P Midcap 400 | 100.00 | 125.24 | 133.25 | 135.02 | 160.09 | 181.71 | ||||||||||||
S&P 400 Capital Goods | 100.00 | 132.62 | 128.00 | 129.08 | 166.96 | 184.90 | ||||||||||||
S&P Global 1200 Industrials | 100.00 | 126.67 | 125.00 | 126.65 | 157.56 | 168.15 | ||||||||||||
ISSUER PURCHASES OF EQUITY SECURITIES
Period | Total Number of Shares Purchased(1) | Average Price Paid per Share | Total Number of Shares Purchased as Part of Publicly Announced Plans or Programs | Maximum Number of Shares that May Yet Be Purchased Under the Plans or Programs (2) | ||||||||
April 1 through April 30, 2018 | — | $ | — | — | 10,100,100 | |||||||
May 1 through May 31, 2018 | 2,049 | 38.04 | — | 10,100,100 | ||||||||
June 1 through June 30, 2018 | 39 | 37.28 | — | 10,100,100 | ||||||||
Total | 2,088 | $ | 38.03 | — | ||||||||
(1) | During the fourth quarter of 2018, 1,391 shares were purchased on the open market on behalf of Kennametal to fund the Company’s dividend reinvestment program. Employees also delivered 697 shares of restricted stock to Kennametal, upon vesting, to satisfy tax withholding requirements. |
(2) | On July 25, 2013, the Company publicly announced an open-ended, amended repurchase program for up to 17 million shares of its outstanding common stock outside of the Company's dividend reinvestment program. |
UNREGISTERED SALES OF EQUITY SECURITIES
None.
14
ITEM 6 - SELECTED FINANCIAL DATA
2018 | 2017 | 2016 | 2015 | 2014 | |||||||||||||
OPERATING RESULTS (in thousands) | |||||||||||||||||
Sales | $ | 2,367,853 | $ | 2,058,368 | $ | 2,098,436 | $ | 2,647,195 | $ | 2,837,190 | |||||||
Cost of goods sold | 1,535,561 | 1,400,661 | 1,482,369 | 1,841,202 | 1,940,187 | ||||||||||||
Operating expense | 498,152 | 463,167 | 494,975 | 554,895 | 589,768 | ||||||||||||
Restructuring and asset impairment charges | (1 | ) | 11,907 | 65,018 | 143,810 | 582,235 | 17,608 | ||||||||||
Loss on divestiture | — | — | 131,463 | — | — | ||||||||||||
Interest expense | 30,081 | 28,842 | 27,752 | 31,466 | 32,451 | ||||||||||||
Provision (benefit) for income taxes | 69,981 | 29,895 | 25,313 | (16,654 | ) | 66,611 | |||||||||||
Income (loss) from continuing operations attributable to Kennametal | 200,180 | 49,138 | (225,968 | ) | (373,896 | ) | 158,366 | ||||||||||
Net income (loss) attributable to Kennametal | 200,180 | 49,138 | (225,968 | ) | (373,896 | ) | 158,366 | ||||||||||
FINANCIAL POSITION (in thousands) | |||||||||||||||||
Working capital | $ | 659,635 | $ | 652,423 | $ | 648,066 | $ | 775,802 | $ | 962,440 | |||||||
Total assets | 2,925,737 | 2,415,496 | 2,362,783 | 2,843,655 | 3,860,726 | ||||||||||||
Long-term debt, including capital leases, excluding current maturities | 591,505 | 694,991 | 693,548 | 730,011 | 974,306 | ||||||||||||
Total debt, including capital leases and notes payable | 991,705 | 695,916 | 695,443 | 745,713 | 1,054,423 | ||||||||||||
Total Kennametal shareholders' equity | 1,194,325 | 1,017,294 | 964,323 | 1,345,807 | 1,929,256 | ||||||||||||
PER SHARE DATA ATTRIBUTABLE TO KENNAMETAL SHAREHOLDERS | |||||||||||||||||
Basic earnings (loss) from continuing operations | (2 | ) | $ | 2.45 | $ | 0.61 | $ | (2.83 | ) | $ | (4.71 | ) | $ | 2.01 | |||
Basic earnings (loss) | (2 | ) | 2.45 | 0.61 | (2.83 | ) | (4.71 | ) | 2.01 | ||||||||
Diluted earnings (loss) from continuing operations | (2 | ) | 2.42 | 0.61 | (2.83 | ) | (4.71 | ) | 1.99 | ||||||||
Diluted earnings (loss) | (2 | ) | 2.42 | 0.61 | (2.83 | ) | (4.71 | ) | 1.99 | ||||||||
Dividends | 0.80 | 0.80 | 0.80 | 0.72 | 0.72 | ||||||||||||
Book value (at June 30) | 14.63 | 12.61 | 12.10 | 16.96 | 24.52 | ||||||||||||
Market Price (at June 30) | 35.90 | 37.42 | 22.11 | 34.12 | 46.28 | ||||||||||||
OTHER DATA (in thousands, except number of employees) | |||||||||||||||||
Capital expenditures | $ | 171,004 | $ | 118,018 | $ | 110,697 | $ | 100,939 | $ | 117,376 | |||||||
Number of employees (at June 30) | 10,491 | 10,744 | 11,178 | 12,718 | 13,521 | ||||||||||||
Basic weighted average shares outstanding | 81,544 | 80,351 | 79,835 | 79,342 | 78,678 | ||||||||||||
Diluted weighted average shares outstanding | 82,754 | 81,169 | 79,835 | 79,342 | 79,667 | ||||||||||||
KEY RATIOS | |||||||||||||||||
Sales growth (decline) | (3 | ) | 15.0 | % | (1.9 | )% | (20.7 | )% | (6.7 | )% | 9.6 | % | |||||
Gross profit margin | 35.1 | 32.0 | 29.4 | 30.4 | 31.6 | ||||||||||||
Operating margin | (4 | ) | 13.0 | 5.5 | (8.3 | ) | (13.5 | ) | 9.3 | ||||||||
(1) | In 2018, 2017 and 2014, all charges were related to restructuring. In 2016, the charges related to intangible asset impairment of $108.5 million, restructuring charges of $30.0 million and fixed asset disposal charges of $5.4 million. In 2015, the charges related to intangible asset impairment of $541.7 million and restructuring charges of $40.5 million. |
(2) | 2018 included restructuring and related charges of $0.16, impact of an out of period adjustment to the provision for income taxes of $0.06 and net impact of tax reform of $0.01. 2017 included restructuring and related charges of $0.89 and Australia deferred tax valuation allowance of $0.02. 2016 included U.S. deferred tax valuation allowance of $1.02, divestiture and related charges of $1.39, intangible asset impairment charges of $0.96, restructuring and related charges of $0.50, fixed asset disposal charges of $0.05 and operations of divested businesses of $0.02. 2015 included intangible asset impairment charges of $6.13 and restructuring and related charges of $0.56. |
(3) | Divestiture impact of sales decline was negative 4 percent and negative 5 percent in 2017 and 2016, respectively. |
(4) | Included restructuring and related charges of $15.9 million, $76.2 million, $53.5 million and $58.1 million in 2018, 2017, 2016 and 2015, respectively; intangible asset impairment of $108.5 million and $541.7 million in 2016 and 2015, respectively; and divestiture and related charges of $131.5 million in 2016. |
15
ITEM 7 - MANAGEMENT'S DISCUSSION AND ANALYSIS OF FINANCIAL CONDITION AND RESULTS OF OPERATIONS
The following discussion should be read in connection with the consolidated financial statements of Kennametal Inc. and the related financial statement notes included in Item 8 of this Annual Report. Unless otherwise specified, any reference to a “year” is to our fiscal year ended June 30. Additionally, when used in this Annual Report, unless the context requires otherwise, the terms “we,” “our” and “us” refer to Kennametal Inc. and its subsidiaries.
OVERVIEW Kennametal Inc. was incorporated in Pennsylvania in 1943 as a manufacturer of tungsten carbide metal cutting tooling. From this beginning, the Company has grown into a global leader in the development and application of tungsten carbides, ceramics, super-hard materials and solutions used in metal cutting and mission-critical wear applications to combat extreme conditions associated with wear fatigue, corrosion and high temperatures. The Company's reputation for material technology, metal cutting application knowledge, as well as expertise and innovation in the development of custom solutions and services, contributes to its leading position in its primary markets.
Our product offering includes a wide selection of standard and customized technologies for metalworking applications, such as turning, milling, hole making, tooling systems and services. End users of the Company's metalworking products include manufacturers engaged in a diverse array of industries including: the manufacturers of transportation vehicles and components, machine tools and light and heavy machinery; airframe and aerospace components; and energy-related components for the oil and gas industry, as well as power generation.
We also produce specialized wear components and metallurgical powders that are used for custom-engineered and challenging applications. End users of these products include producers and suppliers in equipment-intensive operations such as coal mining, road construction, quarrying, oil and gas exploration, refining, production and supply.
Throughout the MD&A, we refer to measures used by management to evaluate performance. We also refer to a number of financial measures that are not defined under accounting principles generally accepted in the United States of America (U.S. GAAP), including organic sales growth, constant currency regional sales growth (decline) and constant currency end market sales growth (decline). The explanation at the end of the MD&A provides the definition of these non-GAAP financial measures as well as details on their use and a reconciliation to the most directly comparable GAAP financial measures.
Operational results in 2018 were strong, and we made progress on our growth and margin expansion initiatives in the year. Every business segment reported significant growth and profitability improvement. Sales grew in all end markets and regions as a result of strong end market demand and from our focus on commercial execution. Overall results for 2018 were in-line with our multi-year profitability improvement plan, and our expectations for the next year are also on-track, representing another significant step forward in improved profitability for the Company.
Price realization outpaced raw material cost inflation in 2018, and we expect that price realization to offset anticipated raw material cost inflation in fiscal 2019. Although the trade environment is evolving, we do not currently expect tariffs to have a material effect on our sales or cost structure.
For 2018, sales were $2,367.9 million, an increase of 15 percent compared to prior year sales of $2,058.4 million, driven by organic sales growth and favorable currency exchange, partially offset by a slight decrease due to fewer business days. Operating income was $307.6 million compared to $112.9 million in the prior year. The increase was driven primarily by organic sales growth, lower restructuring and related charges, incremental restructuring benefits, favorable currency exchange and mix and modernization benefits, partially offset by higher raw material costs, salary inflation and higher variable compensation expense due to higher than expected operating results. Earnings per diluted share (EPS) was $2.42 in 2018.
We substantially completed our legacy restructuring program in the September quarter of 2018. Pre-tax benefits from these restructuring actions delivered full fiscal 2018 year-over-year incremental savings of approximately $55 million. In association with our simplification initiative, we recorded $8 million of restructuring and related charges for simplification-related employment reduction in the Industrial segment in the June quarter of fiscal 2018. Annualized run-rate pre-tax savings of approximately $10 million are expected to be achieved in the first half of fiscal 2019 in connection with this initiative. While our modernization efforts are starting to drive improved results along with continuing benefits from simplification, incrementally higher results of those programs are anticipated to accrue to the Company over the next few years.
Our effective tax rate for 2018 was higher than anticipated at the beginning of the fiscal year. This increase in the tax rate is due primarily to the earlier than expected release of substantially all of the valuation allowance on U.S. deferred tax assets. The release of the valuation allowance in the December quarter of fiscal 2018 was triggered by the application of the toll tax provision in the Tax Cuts and Jobs Act of 2017 (TCJA). Along with full-year income in the U.S. in 2018, our domestic deferred taxes are in a net liability position as of June 30, 2018. After other remaining provisions of TCJA are adopted, we anticipate our long-term tax rate will decrease from mid-20s to low-20s. See Note 12 of our consolidated financial statements set forth in Item 8 of this Annual Report (Note 12).
16
We generated cash flow from operating activities of $277.3 million in 2018, driven primarily by higher cash from operations before changes in certain other assets and liabilities and lower restructuring payments. We made capital expenditures of $171.0 million during the year, and returned $65.1 million to shareholders through dividends.
We further enhanced liquidity and strengthened our financial position by issuing $300.0 million of 4.625 percent Senior Unsecured Notes due 2028 (New Notes). Net proceeds were used for redemption of our previously outstanding $400.0 million of 2.650 percent Senior Unsecured Notes with an original maturity of November 1, 2019 ($400.0 million Notes) on July 9, 2018. We also entered into an amendment to the five-year, multi-currency, revolving credit facility. The amendment extends the tenor for a new five-year term to June 2023 and expands borrowing capacity from $600 million to $700 million. The prior facility was scheduled to mature in April 2021. The new facility has lower LIBOR borrowing margins and enhanced commercial terms.
We invested further in technology and innovation to continue delivering high quality products to our customers. Research and development expenses included in operating expense totaled $38.9 million for 2018.
RESULTS OF CONTINUING OPERATIONS
SALES Sales of $2,367.9 million in 2018 increased 15 percent from $2,058.4 million in 2017 reflecting a 12 percent increase from organic sales growth and favorable currency exchange impact of 4 percent, partially offset by 1 percent decrease due to fewer business days. Sales increased by 16 percent in the Infrastructure segment, 15 percent in the Industrial segment and 12 percent in the Widia segment.
Sales of $2,058.4 million in 2017 decreased 2 percent from $2,098.4 million in 2016 reflecting a 4 percent divestiture impact and a 2 percent unfavorable currency exchange impact, partially offset by 4 percent organic sales growth. Sales increased by 4 percent in the Widia segment and 3 percent in the Industrial segment, while sales decreased by 9 percent in the Infrastructure segment.
End Market Sales Growth (Decline): | As Reported | Constant Currency | |||||||||
Year Ended June 30, 2018 | Year Ended June 30, 2017 | Year Ended June 30, 2018 | Year Ended June 30, 2017 | ||||||||
Energy | 19 | % | 2 | % | 17 | % | 9 | % | |||
General engineering | 15 | 2 | 11 | 6 | |||||||
Aerospace and defense | 15 | 2 | 11 | 4 | |||||||
Transportation | 13 | (1 | ) | 8 | 2 | ||||||
Earthworks | 10 | (10 | ) | 7 | (4 | ) | |||||
Regional Sales Growth (Decline): | As Reported | Constant Currency | |||||||||
Year Ended June 30, 2018 | Year Ended June 30, 2017 | Year Ended June 30, 2018 | Year Ended June 30, 2017 | ||||||||
Asia Pacific | 19 | % | 4 | % | 15 | % | 8 | % | |||
Europe, the Middle East and Africa (EMEA) | 16 | (9 | ) | 7 | — | ||||||
Americas | 13 | — | 13 | 4 | |||||||
GROSS PROFIT Gross profit increased $174.6 million to $832.3 million in 2018 from $657.7 million in 2017. This increase was primarily due to organic sales growth, incremental restructuring benefits of approximately $42 million, favorable currency exchange impact of $29.6 million, favorable mix, modernization benefits of approximately $9 million and $4.3 million less restructuring-related charges, partially offset by higher raw material and overtime costs and salary inflation. The gross profit margin for 2018 was 35.1 percent compared to 32.0 percent in 2017.
Gross profit increased $41.6 million to $657.7 million in 2017 from $616.1 million in 2016. This increase was primarily due to incremental restructuring benefits of approximately $36 million, better absorption and productivity, organic sales growth and lower raw material costs, partially offset by an unfavorable currency exchange impact of $12.6 million, unfavorable business mix and divestiture impact of $11.4 million. The gross profit margin for 2017 was 32.0 percent compared to 29.4 percent in 2016.
17
OPERATING EXPENSE Operating expense in 2018 was $498.2 million, an increase of $35.0 million, or 7.6 percent, compared to $463.2 million in 2017. The increase was primarily due to higher variable compensation expense of $14 million due to higher than expected operating results, an unfavorable currency exchange impact of $14.5 million and salary inflation, partially offset by incremental restructuring benefits of approximately $13 million and $2.5 million less in restructuring-related charges.
Operating expense in 2017 was $463.2 million, a decrease of $31.8 million, or 6.4 percent, compared to $495.0 million in 2016. The decrease was primarily due to incremental restructuring benefits of approximately $36 million, divestiture impact of $10.5 million, $12.7 million less in restructuring-related charges and a favorable foreign currency exchange impact of $5.1 million, offset partially by higher performance-based compensation.
RESTRUCTURING AND RELATED CHARGES AND ASSET IMPAIRMENT CHARGES
Restructuring and Related Charges
Legacy Restructuring
In prior years, we implemented certain actions to streamline the Company's cost structure. The purpose of this restructuring initiative was to improve the alignment of our cost structure with the operating environment through employee reductions and to consolidate certain manufacturing facilities. These restructuring actions were substantially completed in the September quarter of 2018, were mostly cash expenditures and achieved annual run rate ongoing pre-tax savings of approximately $165 million.
Total restructuring and related charges since inception of $152.7 million have been recorded for these programs through June 30, 2018: $85.6 million in Industrial, $13.9 million in Widia, $45.9 million in Infrastructure and $7.3 million in Corporate.
Industrial Simplification
In the June quarter of 2018, we implemented and substantially completed restructuring actions to streamline the Industrial segment's cost structure by directing resources to more profitable business and increasing sales force productivity. These actions are currently anticipated to deliver annual ongoing pre-tax savings of approximately $10 million in the first half of fiscal 2019 and are anticipated to be mostly cash expenditures. Total restructuring and related charges since inception of $8.2 million have been recorded for this program in the Industrial segment through June 30, 2018.
Combined Restructuring
During 2018, we recorded restructuring and related charges of $15.9 million, net of a $4.7 million gain on sale of the previously closed Houston manufacturing location that was part of our legacy restructuring programs. Of this amount, restructuring charges totaled $16.4 million, of which benefit of $0.2 million was related to inventory and were recorded in cost of goods sold. Restructuring-related charges of $3.7 million were recorded in cost of goods sold and $0.5 million were recorded in operating expense during 2018.
During 2017, we recorded restructuring and related charges of $76.2 million. Of this amount, restructuring charges totaled $65.6 million, of which $0.6 million were charges related to inventory and were recorded in cost of goods sold. Restructuring-related charges of $7.1 million were recorded in cost of goods sold and $3.5 million were recorded in operating expense during 2017.
During 2016, we recorded restructuring and related charges of $53.5 million. Of this amount, restructuring charges totaled $30.0 million. Restructuring-related charges of $7.3 million were recorded in cost of goods sold and $16.2 million in operating expense during 2016.
Asset Impairment Charges
During 2016, we recorded non-cash pre-tax goodwill and other intangible asset impairment charges of $108.5 million. See Note 2 of our consolidated financial statements set forth in Item 8 of this Annual Report (Note 2).
During 2016, we identified specific machinery and equipment that was no longer being utilized in the manufacturing organization, which we disposed of by abandonment. As a result of this review, we recorded property, plant, and equipment impairment charges of $5.4 million during 2016, which has been presented as restructuring and asset impairment charges in our consolidated statement of income.
LOSS ON DIVESTITURE We recognized a pre-tax loss on the sale of non-core businesses of $131.5 million in 2016, which includes the impact of estimated working capital adjustments, deal costs and transaction costs. Of this amount, $127.9 million and $3.6 million were recorded in the Infrastructure and Industrial segments, respectively. See Note 4 of our consolidated financial statements set forth in Item 8 of this Annual Report.
18
AMORTIZATION OF INTANGIBLES Amortization expense was $14.7 million, $16.6 million and $20.8 million in 2018, 2017 and 2016, respectively. The decrease of $1.9 million from 2017 to 2018 was driven primarily by certain finite-lived intangible assets being fully amortized in 2018, and the decrease of $4.2 million from 2016 to 2017 was driven primarily by the impact of divestiture.
INTEREST EXPENSE Interest expense increased $1.2 million to $30.1 million in 2018, compared with $28.8 million in 2017 primarily due to the incremental interest expense on the New Notes, partially offset by lower average borrowings in 2018. Interest expense increased $1.1 million to $28.8 million in 2017, compared with $27.8 million in 2016 due to higher average borrowings and a higher credit facility fee. The portion of our debt subject to variable rates of interest was less than 1 percent at June 30, 2018, 2017 and 2016.
OTHER EXPENSE (INCOME), NET In 2018, other expense, net was $2.4 million compared to $2.2 million in 2017. Prior year income from transition services provided related to a prior divestiture that did not repeat and a gain on sale of an investment that did not repeat were partially offset by higher interest income and foreign currency transaction gains.
In 2017, other expense, net was $2.2 million compared to other income, net of $4.1 million in 2016. The year-over-year change was due primarily to foreign currency transaction losses and the prior year reduction of a contingent liability associated with a past acquisition that did not repeat in the current year, partially offset by a prior year loss on sale of assets and income from transition services provided to the acquirer of our non-core businesses.
INCOME TAXES The effective tax rate for 2018 was 25.4 percent compared to 36.5 percent for 2017. The change was primarily driven by the prior year U.S. loss, which was mostly attributable to restructuring and related charges, not being tax-effected and current year U.S. income being subject to tax as a result of the aforementioned release of the U.S. valuation allowance, in addition to the net discrete tax charges recorded in 2018 associated with TCJA.
The effective tax rate for 2017 was 36.5 percent (provision on income) compared to 12.7 percent (provision on a loss) for 2016. The change was primarily driven by the 2016 discrete tax charge for a valuation allowance recorded against our net deferred tax assets in the U.S., primarily related to asset impairment charges and the 2016 loss on divestiture.
In 2012, we received an assessment from the Italian tax authority that denied certain tax deductions primarily related to our 2008 tax return. Attempts at negotiating a reasonable settlement with the tax authority were unsuccessful; and as a result, we decided to litigate the matter. The outcome of the litigation is still pending; however, we continue to believe that the assessment is baseless, and do not anticipate making a payment in connection with this assessment. Accordingly, no income tax liability has been recorded in connection with this assessment in any period. However, if the Italian tax authority were to be successful in litigation, settlement of the amount alleged by the Italian tax authority at its face value would result in an approximate €22 million, or $25 million, increase to income tax expense.
NET INCOME (LOSS) ATTRIBUTABLE TO KENNAMETAL Net income attributable to Kennametal was $200.2 million, or $2.42 EPS, in 2018, compared to $49.1 million, or $0.61 EPS, in 2017. The increase is a result of the factors previously discussed.
Net income attributable to Kennametal was $49.1 million, or $0.61 EPS, in 2017, compared to a loss of $226.0 million, or $2.83 loss per diluted share, in 2016. The year-over-year change is a result of the factors previously discussed.
BUSINESS SEGMENT REVIEW We operate in three reportable operating segments consisting of Industrial, Widia and Infrastructure. Corporate expenses that are not allocated are reported in Corporate. Segment determination is based upon internal organizational structure, the manner in which we organize segments for making operating decisions and assessing performance and the availability of separate financial results. See Note 20 of our consolidated financial statements set forth in Item 8 of this Annual Report.
19
Our sales and operating income (loss) by segment are as follows:
(in thousands) | 2018 | 2017 | 2016 | ||||||||
Sales: | |||||||||||
Industrial | $ | 1,292,098 | $ | 1,126,309 | $ | 1,098,439 | |||||
Widia | 198,568 | 177,662 | 170,723 | ||||||||
Infrastructure | 877,187 | 754,397 | 829,274 | ||||||||
Total sales | $ | 2,367,853 | $ | 2,058,368 | $ | 2,098,436 | |||||
Operating income (loss): | |||||||||||
Industrial | $ | 187,495 | $ | 82,842 | $ | 90,324 | |||||
Widia | 4,441 | (9,606 | ) | (9,081 | ) | ||||||
Infrastructure | 119,701 | 40,011 | (246,306 | ) | |||||||
Corporate | (4,072 | ) | (303 | ) | (9,880 | ) | |||||
Total operating income (loss) | $ | 307,565 | $ | 112,944 | $ | (174,943 | ) | ||||
Interest expense | $ | 30,081 | $ | 28,842 | $ | 27,752 | |||||
Other expense (income), net | 2,443 | 2,227 | (4,124 | ) | |||||||
Income (loss) before income taxes | $ | 275,041 | $ | 81,875 | $ | (198,571 | ) | ||||
INDUSTRIAL
(in thousands) | 2018 | 2017 | 2016 | |||||||||
Sales | $ | 1,292,098 | $ | 1,126,309 | $ | 1,098,439 | ||||||
Operating income | 187,495 | 82,842 | 90,324 | |||||||||
Operating margin | 14.5 | % | 7.4 | % | 8.2 | % | ||||||
(in percentages) | 2018 | 2017 | ||||
Organic sales growth | 11 | % | 5 | % | ||
Foreign currency exchange impact | 5 | (2 | ) | |||
Business days impact | (1 | ) | — | |||
Sales growth | 15 | % | 3 | % | ||
Regional sales growth (decline): | As Reported | Constant Currency | ||||||||||
2018 | 2017 | 2018 | 2017 | |||||||||
EMEA | 17 | % | (1 | )% | 8 | % | 2 | % | ||||
Asia Pacific | 16 | 9 | 12 | 11 | ||||||||
Americas | 12 | 3 | 12 | 5 | ||||||||
End market sales growth (decline): | As Reported | Constant Currency | ||||||||||
2018 | 2017 | 2018 | 2017 | |||||||||
Energy | 15 | % | 2 | % | 11 | % | 5 | % | ||||
General engineering | 15 | 5 | 10 | 7 | ||||||||
Aerospace and defense | 14 | 4 | 11 | 6 | ||||||||
Transportation | 13 | (1 | ) | 8 | 2 | |||||||
20
In 2018, Industrial sales of $1,292.1 million increased by $165.8 million, or 15 percent, from 2017. General engineering sales experienced growth from the indirect channel across all regions, a more robust light and general engineering sector in EMEA and the Americas as well as growth in sales to tooling manufacturers in EMEA. Transportation sales to tier suppliers globally increased in the period, as well as to OEMs in EMEA and Asia Pacific. These increases were partially offset by lower sales to OEMs in the Americas. Conditions continue to be favorable in the aerospace sector due to growth in engine sales in the Americas and Asia Pacific supplemented by increasing demand related to frames in the Americas. Oil and gas sales in the Americas continue to provide overall growth in energy in addition to increases in renewable power generation sales in the Americas and EMEA. The sales increases in Asia Pacific and EMEA were primarily driven by the performance in the transportation and general engineering end markets. The sales increase in the Americas was primarily driven by the performance in the general engineering, aerospace and defense and energy end markets.
In 2018, Industrial operating income was $187.5 million, a $104.7 million increase from 2017. The primary drivers for the increase were organic sales growth, incremental restructuring and modernization benefits of approximately $34 million, $31.5 million less restructuring and related charges and favorable currency exchange impact of $10.7 million, partially offset by decreased manufacturing efficiency in part due to modernization efforts in progress, higher variable compensation expense due to higher than expected operating results and salary inflation.
In 2017, Industrial sales of $1,126.3 million increased by $27.9 million, or 3 percent, from 2016. General engineering sales benefited globally from growth in the indirect channel, supported by increasing demand in the U.S. energy markets and China transportation markets, and to a lesser extent the addition of new distributors. Sales to airplane engine manufacturers globally was the primary driver of the sales growth in aerospace. In addition, we experienced growth in frame-related sales in EMEA and Asia Pacific that were offset by declines in the Americas. Oil and gas drilling and power generation in the Americas contributed to the growth in energy sales while energy-related sales were down in EMEA and Asia Pacific. Transportation performance was mixed for the fiscal year with overall growth coming from Asia Pacific. Sales to tier suppliers were up, as strong Asia Pacific growth was offset by declines in EMEA and the Americas. Similarly, growth in sales to OEMs in Asia Pacific was offset by declines in the other regions. In addition, railroad-related sales declined primarily in the Americas. The sales increase in Asia Pacific was driven by transportation, general engineering and aerospace and defense. The sales increase in the Americas was driven by general engineering and energy and to a lesser extent aerospace and defense, offset partially by decreases in transportation. The sales increase in EMEA was driven by general engineering and aerospace and defense, offset partially by decreases in transportation and energy.
In 2017, Industrial operating income was $82.8 million, a $7.5 million decrease from 2016. The primary drivers of the decrease in operating income were $20.6 million more in restructuring charges, unfavorable currency exchange, unfavorable business mix, higher performance-based compensation and higher raw material costs, partially offset by $40 million incremental restructuring benefits, organic sales growth and prior period loss on divestiture and fixed asset disposal charges of $3.6 million and $2.6 million, respectively.
WIDIA
(in thousands) | 2018 | 2017 | 2016 | |||||||||
Sales | $ | 198,568 | $ | 177,662 | $ | 170,723 | ||||||
Operating income (loss) | 4,441 | (9,606 | ) | (9,081 | ) | |||||||
Operating margin | 2.2 | % | (5.4 | )% | (5.3 | )% | ||||||
(in percentages) | 2018 | 2017 | ||||
Organic sales growth | 9 | % | 6 | % | ||
Foreign currency exchange impact | 3 | — | ||||
Business days impact | — | (2 | ) | |||
Sales growth | 12 | % | 4 | % | ||
Regional sales growth (decline): | As Reported | Constant Currency | ||||||||||
2018 | 2017 | 2018 | 2017 | |||||||||
EMEA | 20 | % | (3 | )% | 14 | % | (2 | )% | ||||
Asia Pacific | 18 | 11 | 15 | 12 | ||||||||
Americas | 4 | 4 | 4 | 4 | ||||||||
21
In 2018, Widia sales of $198.6 million increased by $20.9 million, or 12 percent, from 2017. Sales in EMEA have benefited from the reestablishment of the national and local distribution network in Central Europe. Sales growth was broadly strong across Asia Pacific, due in part to tapping into new demand streams and benefits from establishing the brand channel strategy globally. In the Americas, we continue to make steady progress in establishing an effective distribution network. We have selectively exited portions of our portfolio to improve profitability.
In 2018, Widia operating income was $4.4 million compared to an operating loss of $9.6 million in 2017. The year-over-year change of $14.0 million was driven primarily by organic sales growth, $6.0 million less restructuring and related charges and incremental restructuring benefits of approximately $1 million, partially offset by higher variable compensation expense due to higher than expected operating results and unfavorable mix.
In 2017, Widia sales of $177.7 million increased by $6.9 million, or 4 percent, from 2016. Sales benefited globally from growth in the indirect channel, supported by increasing demand in the U.S. energy markets and China transportation markets, and to a lesser extent the addition of new distributors. Unlike the prior year, for those indirect lines where we have visibility, we believe that we did not experience destocking in the indirect channel, as sales were generally consistent with end-user purchases.
In 2017, Widia operating loss was $9.6 million and increased by $0.5 million from 2016. The primary drivers of the increase in operating loss were $3.6 million higher restructuring and related charges, unfavorable mix and unfavorable currency exchange, partially offset by incremental restructuring benefits of approximately $6 million, organic sales growth, a prior period other intangible asset impairment charge of $2.3 million, lower raw material costs, higher absorption and productivity and prior period fixed asset disposal charges of $0.7 million.
INFRASTRUCTURE
(in thousands) | 2018 | 2017 | 2016 | |||||||||
Sales | $ | 877,187 | $ | 754,397 | $ | 829,274 | ||||||
Operating income (loss) | 119,701 | 40,011 | (246,306 | ) | ||||||||
Operating margin | 13.6 | % | 5.3 | % | (29.7 | )% | ||||||
(in percentages) | 2018 | 2017 | ||||
Organic sales growth | 15 | % | 1 | % | ||
Foreign currency exchange impact | 2 | (1 | ) | |||
Business days impact | (1 | ) | — | |||
Divestiture impact | — | (9 | ) | |||
Sales growth | 16 | % | (9 | )% | ||
Regional sales growth (decline): | As Reported | Constant Currency | ||||||||||
2018 | 2017 | 2018 | 2017 | |||||||||
Asia Pacific | 24 | % | (5 | )% | 20 | % | 2 | % | ||||
Americas | 16 | (3 | ) | 16 | 3 | |||||||
EMEA | 10 | (30 | ) | 1 | (6 | ) | ||||||
End market sales growth (decline): | As Reported | Constant Currency | ||||||||||
2018 | 2017 | 2018 | 2017 | |||||||||
Energy | 20 | % | 2 | % | 19 | % | 11 | % | ||||
General Engineering | 19 | (7 | ) | 16 | 6 | |||||||
Earthworks | 10 | (12 | ) | 7 | (6 | ) | ||||||
22
In 2018, Infrastructure sales of $877.2 million increased by $122.8 million, or 16 percent, from 2017. Infrastructure saw improvements in all end markets, including underground mining and construction. Year-over-year growth in energy was strong with an increase in rig count activity and increased power generation activity. Strong growth in general engineering is driven primarily by overall more robust activity in the general economy, particularly in the Americas. The sales increase in Asia Pacific was driven primarily by the performance in the earthworks and general engineering end markets. Growth in the Americas was driven by the performance in all three end markets: energy, general engineering and earthworks. The slight increase in sales in EMEA was driven primarily by the performance in the general engineering end market, partially offset by a decrease in earthworks.
In 2018, Infrastructure operating income was $119.7 million, a 79.7 million increase from 2017. The primary drivers for the increase were organic sales growth, $22.9 million less restructuring and related charges, incremental restructuring and modernization benefits of approximately $21 million, favorable currency exchange impact and favorable mix, partially offset by higher raw material costs, higher variable compensation expense due to higher than expected operating results and higher overtime costs.
In 2017, Infrastructure sales of $754.4 million decreased by $74.9 million, or 9 percent, from 2016. Beginning in 2017, the segment reported year-over-year quarterly sales declines. However, during the year, sales improved sequentially and the year ended with two consecutive quarters of organic sales growth after two and a half years of organic sales declines. For the year, sales were positively impacted by the energy markets which continued to strengthen during 2017. Challenging conditions in underground mining continued to drive sales declines, particularly in North America and Asia, and construction sales primarily in EMEA. The sales increase in the Americas was driven by oil and gas and general engineering, partially offset by a decrease in earthworks. The sales increase in Asia Pacific was driven by general engineering and to a lesser extent energy, partially offset by a decrease in earthworks. The sales decrease in EMEA was driven primarily by a decrease in construction, offset partially by an increase in mining.
In 2017, Infrastructure operating income was $40.0 million, compared to operating loss of $246.3 million in 2016. The year-over-year change in operating results was due primarily to a prior period $127.9 million loss on divestiture and prior period goodwill and other intangible asset impairment charges of $106.1 million. Additionally, comparative operating results were impacted by incremental restructuring benefits of approximately $26 million, lower raw material costs, higher absorption and productivity and prior year divestiture impact of $1.9 million, offset partially by $4.2 million increase in restructuring and related charges and the negative impacts of unfavorable price and mix.
CORPORATE
(in thousands) | 2018 | 2017 | 2016 | |||||||||
Corporate expense | $ | (4,072 | ) | $ | (303 | ) | $ | (9,880 | ) | |||
In 2018, Corporate expense increased $3.8 million from 2017, primarily due to higher professional fees. In 2017, Corporate expense decreased $9.6 million from 2016, primarily due to $5.7 million lower restructuring-related charges and lower professional fees.
LIQUIDITY AND CAPITAL RESOURCES Cash flow from operations is the primary source of funding for our capital expenditures. During the year ended June 30, 2018, cash flow provided by operating activities was $277.3 million.
Our five-year, multi-currency, revolving credit facility, as amended and restated in June 2018 (Credit Agreement), is used to augment cash from operations and as an additional source of funds. The Credit Agreement provides for revolving credit loans of up to $700.0 million for working capital, capital expenditures and general corporate purposes. The Credit Agreement allows for borrowings in U.S. dollars, euros, Canadian dollars, pounds sterling and Japanese yen. Interest payable under the Credit Agreement is based upon the type of borrowing under the facility and may be (1) LIBOR plus an applicable margin, (2) the greater of the prime rate or the Federal Funds effective rate plus an applicable margin or (3) fixed as negotiated by us. The Credit Agreement matures in June 2023. We had no outstanding borrowings on our Credit Agreement as of June 30, 2018.
The Credit Agreement requires us to comply with various restrictive and affirmative covenants, including two financial covenants: a maximum leverage ratio and a minimum consolidated interest coverage ratio (as those terms are defined in the Credit agreement). We were in compliance with all covenants as of June 30, 2018. For the year ended June 30, 2018, average daily borrowings outstanding under the Credit Agreement were approximately $1.0 million. We had no borrowings outstanding under the Credit Agreement as of June 30, 2018 and 2017. Borrowings under the Credit Agreement are guaranteed by our significant domestic subsidiaries.
23
Additionally, we obtain local financing through credit lines with commercial banks in the various countries in which we operate. At June 30, 2018, these borrowings amounted to $0.9 million of notes payable. We believe that cash flow from operations and the availability under our credit lines will be sufficient to meet our cash requirements over the next 12 months.
Based upon our debt structure at June 30, 2018 and 2017, less than 1 percent of our debt was exposed to variable rates of interest.
We consider substantially all of the unremitted earnings of our non-U.S. subsidiaries to be permanently reinvested. As a result of TCJA, which among other provisions allows for a 100 percent dividends received deduction from controlled foreign subsidiaries, we are in the process of re-evaluating our assertion with respect to permanent reinvestment. As part of this evaluation, we are considering our global working capital and capital investment requirements, among other considerations, including the potential tax liabilities that would be incurred if the non-U.S. subsidiaries distribute cash to the U.S. parent. If we determine that an entity should no longer remain subject to the permanent reinvestment assertion, we will accrue additional tax charges, including but not limited to state income taxes, withholding taxes, U.S. tax on foreign currency gains and losses and other relevant foreign taxes in the period the conclusion is determined. As of June 30, 2018, the unremitted earnings and profits of our non-U.S. subsidiaries and affiliates is approximately $1.3 billion. This amount has been subject to U.S. federal income tax, but may remain subject to state and foreign taxes if repatriated. In accordance with SAB 118, we expect to complete our evaluation by December 22, 2018.
During 2018, we estimated the toll tax charge to be $80.9 million after available foreign tax credits. The toll tax charge consumed our entire U.S. federal net operating loss carryforward and other credit carryforwards, which represent a significant portion of our previously available deferred tax assets, and was offset by the release of the valuation allowance associated with these assets. We estimate a cash payment of $3.5 million associated with the toll charge which will be paid over eight years, of which $3.2 million is classified as long-term accrued income taxes in our consolidated balance sheet as of June 30, 2018. The toll tax charge is preliminary, and subject to finalization of the 2018 U.S. federal income tax return and applying any additional regulatory guidance issued after June 30, 2018.
At June 30, 2018, we had cash and cash equivalents of $556.2 million. Total Kennametal Shareholders’ equity was $1,194.3 million and total debt was $991.7 million. Our current senior credit ratings are considered investment grade. We believe that our current financial position, liquidity and credit ratings provide us access to the capital markets. We continue to closely monitor our liquidity position and the condition of the capital markets, as well as the counterparty risk of our credit providers.
The following is a summary of our contractual obligations and other commercial commitments as of June 30, 2018 (in thousands):
Contractual Obligations | Total | 2019 | 2020-2021 | 2022-2023 | Thereafter | ||||||||||||||||||
Long-term debt, including current maturities | (1 | ) | $ | 1,124,781 | $ | 425,500 | $ | 51,000 | $ | 335,500 | $ | 312,781 | |||||||||||
Notes payable | (2 | ) | 1,063 | 1,063 | — | — | — | ||||||||||||||||
Pension benefit payments | (3) | 49,273 | 101,971 | 106,352 | (3) | ||||||||||||||||||
Postretirement benefit payments | (3) | 1,631 | 2,984 | 2,676 | (3) | ||||||||||||||||||
Operating leases | 65,285 | 17,606 | 22,985 | 9,466 | 15,228 | ||||||||||||||||||
Purchase obligations | (4 | ) | 343,076 | 170,497 | 143,464 | 29,115 | — | ||||||||||||||||
Unrecognized tax benefits | (5 | ) | 7,032 | 3,890 | 1,034 | — | 2,108 | ||||||||||||||||
Total | $ | 669,460 | $ | 323,438 | $ | 483,109 | |||||||||||||||||
(1) | Long-term debt includes interest obligations of $125.9 million and excludes debt issuance costs of $6.8 million. Interest obligations were determined assuming interest rates as of June 30, 2018 remain constant. |
(2) | Notes payable includes interest obligations of $0.1 million. Interest obligations were determined assuming interest rates as of June 30, 2018 remain constant. |
(3) | Annual payments are expected to continue into the foreseeable future at the amounts noted in the table. |
(4) | Purchase obligations consist of purchase commitments for materials, supplies and machinery and equipment as part of the ordinary conduct of business. Purchase obligations with variable price provisions were determined assuming market prices as of June 30, 2018 remain constant. |
(5) | Unrecognized tax benefits are positions taken or expected to be taken on an income tax return that may result in additional payments to tax authorities. These amounts include interest of $1.1 million and penalty of $0.1 million accrued related to such positions as of June 30, 2018. Positions for which we are not able to reasonably estimate the timing of potential future payments are included in the ‘Thereafter’ column. If a tax authority agrees with the tax position taken or expected to be taken or the applicable statute of limitations expires, then additional payments will not be necessary. |
Other Commercial Commitments | Total | 2019 | 2020-2021 | 2022-2023 | Thereafter | |||||||||||||||
Standby letters of credit | $ | 4,190 | $ | 2,608 | $ | 1,582 | $ | — | $ | — | ||||||||||
Guarantees | 10,844 | 5,262 | 1,473 | — | 4,109 | |||||||||||||||
Total | $ | 15,034 | $ | 7,870 | $ | 3,055 | $ | — | $ | 4,109 | ||||||||||
24
The standby letters of credit relate to insurance and other activities. The guarantees are non-debt guarantees with financial institutions, which are required primarily for security deposits, product performance guarantees and advances.
Cash Flow Provided by Operating Activities
During 2018, cash flow provided by operating activities was $277.3 million, compared to $195.3 million in 2017. During 2018, cash flow provided by operating activities consisted of net income and non-cash items amounting to $361.9 million and changes in certain assets and liabilities netting to an outflow of $84.6 million. Contributing to the changes in certain assets and liabilities were an increase inventories of $37.2 million, a decrease in accrued pension and postretirement benefits of $26.8 million, an increase in accounts receivable of $22.2 million and a decrease in accounts payable and accrued liabilities of $5.0 million, partially offset by an increase in accrued income taxes of $11.1 million. The increases in inventories and accounts receivable are due in part to higher demand in our end markets, in addition to the effects of raw material cost inflation on inventories.
During 2017, cash flow provided by operating activities was $195.3 million, compared to $222.5 million in 2016. Cash flow provided by operating activities consisted of net income and non-cash items amounting to $188.9 million and changes in certain assets and liabilities netting to an inflow of $6.5 million. Contributing to the changes in certain assets and liabilities were an increase in accounts payable and accrued liabilities of $54.6 million and an increase in accrued income taxes of $6.9 million. Partially offsetting these inflows were a decrease in accrued pension and postretirement benefits of $27.8 million, an increase in inventories of $24.3 million and an increase in accounts receivable of $7.6 million. The increases in inventories, accounts payable and accounts receivable are due in part to higher demand in most of our end markets.
During 2016, cash flow provided by operating activities was $222.5 million. Cash flow provided by operating activities consisted of net income and non-cash items amounting to $163.8 million and changes in certain assets and liabilities netting to $58.7 million. These changes were primarily driven by a decrease in inventory of $69.6 million due to our continued focus on working capital management and a decrease in accounts receivable of $32.7 million due to lower sales volume. Partially offsetting these inflows were a decrease in accrued income taxes of $25.2 million driven by payment of a capital gains tax related to a prior period tax reorganization.
Cash Flow Used for Investing Activities
Cash flow used for investing activities was $156.9 million for 2018, an increase of $44.1 million, compared to $112.7 million in 2017. During 2018, cash flow used for investing activities included capital expenditures, net of $156.6 million, which consisted primarily of machinery and equipment upgrades and additions related to our modernization initiatives and capacity additions.
Cash flow used for investing activities was $112.7 million for 2017, an increase of $64.8 million, compared to $47.9 million in 2016. During 2017, cash flow used for investing activities included capital expenditures, net of $113.0 million, which consisted primarily of equipment purchases.
Cash flow used for investing activities was $47.9 million for 2016. During 2016, cash flow used for investing activities included capital expenditures, net of $104.7 million, which consisted primarily of equipment purchases. Partially offsetting this outflow was an inflow of $56.1 million of proceeds from the divestiture of non-core businesses.
Cash Flow Provided by (Used for) Financing Activities
Cash flow provided by financing activities was $247.2 million for 2018, compared to cash flow used for financing activities of $53.3 million in 2017. During 2018, cash flow provided by financing activities included a $296.2 million net increase in borrowings due primarily to the issuance of the New Notes and $18.0 million of the effect of employee benefit and stock plans and dividend reinvestment, partially offset by $65.1 million of cash dividends paid to Shareholders.
Cash flow used for financing activities was $53.3 million for 2017, compared to $113.6 million in 2016. During 2017, cash flow used for financing activities included $64.1 million of cash dividends paid to Shareholders, a $6.6 million payment on the remaining contingent consideration related to a prior acquisition and $0.9 million net decrease in borrowings, partially offset by $18.3 million of the effect of employee benefit and stock plans and dividend reinvestment.
Cash flow used for financing activities was $113.6 million in 2016. During 2016, cash flow used for financing activities included $63.7 million of cash dividends paid to Shareholders and $50.8 million net decrease in borrowings, partially offset by $1.3 million of dividend reinvestment and the effect of employee benefit and stock plans.
FINANCIAL CONDITION At June 30, 2018, total assets were $2,925.7 million, an increase of $510.2 million from $2,415.5 million at June 30, 2017. Total liabilities increased $332.6 million from $1,362.8 million at June 30, 2017 to $1,695.4 million at June 30, 2018.
25
Working capital was $659.6 million at June 30, 2018, an increase of $7.2 million from $652.4 million at June 30, 2017. The increase in working capital was primarily driven by an increase in cash and cash equivalents of $365.5 million, an increase in inventory of $37.8 million due primarily to increasing demand and cost inflation and an increase in accounts receivable of $20.9 million due in part to increasing volumes. Partially offsetting these items were an increase in current maturities of long-term debt and capital leases of $399.1 million due to the reclassification of our $400.0 million Notes to current maturities due to our notification of early redemption to bondholders creating an irrevocable commitment to redeem the debt, an increase in accrued income taxes of $12.4 million due primarily to increased taxable income in taxpaying jurisdictions and an increase in accrued payroll of $9.6 million. The currency exchange rate impact to working capital, which is included in the aforementioned changes, lowered working capital by $4.8 million compared to the prior year.
Property, plant and equipment, net increased $79.8 million from $744.4 million at June 30, 2017 to $824.2 million at June 30, 2018, primarily due to capital additions of $180.5 million and favorable currency exchange impacts of $1.5 million. This increase was partially offset by depreciation expense of $94.0 million and disposals of $14.4 million.
At June 30, 2018, other assets were $555.4 million, a decrease of $1.8 million from $557.2 million at June 30, 2017. Pension plan assets increased $25.3 million. Offsetting this increase was a decrease in other intangible assets of $14.1 million which was primarily due to amortization expense of $14.7 million, a decrease in deferred income taxes of $11.3 million due in part to an out of period adjustment related to tax assets recorded on intra-entity inventory transfers, partially offset by release of the valuation allowance on U.S. deferred tax assets, and a decrease in assets held for sale of $7.0 million primarily due to the sale of the Houston closed manufacturing location that was part of our legacy restructuring program.
Long-term debt and capital leases decreased $103.5 million to $591.5 million at June 30, 2018 from $695.0 million at June 30, 2017 primarily due to the aforementioned reclassification of the $400.0 million Notes to current maturities as of June 30, 2018. The redemption of the $400.0 million Notes was completed on July 9, 2018. This decrease was partially offset by the June 2018 issuance of $300.0 million of 4.625 percent Senior Unsecured Notes.
Kennametal Shareholders’ equity was $1,194.3 million at June 30, 2018, an increase of $177.0 million from $1,017.3 million in the prior year. The increase was primarily due to net income attributable to Kennametal of $200.2 million, capital stock issued under employee benefit and stock plans of $38.6 million, the reclassification of net pension and other postretirement benefit loss of $7.3 million and the reclassification of unrealized loss on expired derivatives designated and qualified as cash flow hedges of $3.7 million, partially offset by cash dividends paid to Shareholders of $65.1 million.
ENVIRONMENTAL MATTERS The operation of our business has exposed us to certain liabilities and compliance costs related to environmental matters. We are involved in various environmental cleanup and remediation activities at certain locations in the countries in which we operate.
Superfund Sites Among other environmental laws, we are subject to the Comprehensive Environmental Response, Compensation, and Liability Act of 1980 (CERCLA), under which we have been designated by the United States Environmental Protection Agency (USEPA) as a Potentially Responsible Party (PRP) with respect to environmental remedial costs at certain Superfund sites. We have evaluated our claims and potential liability associated with these Superfund sites based upon the best information currently available to us. We believe our environmental accruals will be adequate to cover our portion of the environmental remedial costs at those Superfund sites where we have been designated a PRP, to the extent these expenses are probable and reasonably estimable.
Other Environmental Issues We establish and maintain reserves for other potential environmental issues. At June 30, 2018 and 2017, the balance of these reserves was $12.5 million and $12.4 million, respectively. These reserves represent anticipated costs associated with the remediation of these environmental issues and are generally not discounted.
The reserves we have established for our potential environmental liabilities represent our best current estimate of the costs of addressing all identified environmental situations, based on our review of currently available evidence, taking into consideration our prior experience in environmental remediation and the experiences of other companies, as well as public information released by the USEPA, other governmental agencies, and by the PRP groups in which we are participating. Although our reserves currently appear to be sufficient to cover our potential environmental liabilities, there are uncertainties associated with environmental remediation matters, and we can give no assurance that our estimate of any environmental liability will not increase or decrease in the future. Our reserved and unreserved liabilities for environmental matters could change substantially due to factors such as the nature and extent of contamination, changes in remedial requirements, technological changes, discovery of new information, the financial strength of other PRPs, the identification of new PRPs and the involvement of and direction taken by the government on these matters.
26
We maintain a Corporate EHS Department to monitor our compliance with environmental regulations and to oversee our remediation activities. In addition, we have designated EHS analysts who are responsible for each of our global manufacturing facilities. Our financial management team periodically meets with members of the Corporate EHS Department and the Corporate Legal Department to review and evaluate the status of environmental projects and contingencies. On a quarterly basis, we review financial provisions and reserves for environmental contingencies and adjust these reserves when appropriate.
EFFECTS OF INFLATION Despite modest inflation in recent years, rising costs, including the cost of certain raw materials, continue to affect our operations throughout the world. We strive to minimize the effects of inflation through cost containment, productivity improvements and price increases.
DISCUSSION OF CRITICAL ACCOUNTING POLICIES In preparing our financial statements in conformity with accounting principles generally accepted in the U.S., we make judgments and estimates about the amounts reflected in our financial statements. As part of our financial reporting process, our management collaborates to determine the necessary information on which to base our judgments and develops estimates used to prepare the financial statements. We use historical experience and available information to make these judgments and estimates. However, different amounts could be reported using different assumptions and in light of different facts and circumstances. Therefore, actual amounts could differ from the estimates reflected in our financial statements. Our significant accounting policies are described in Note 2 of our financial statements, which are included in Item 8 of this Annual Report. We believe that the following discussion addresses our critical accounting policies.
Revenue Recognition We recognize revenue for our products and assembled machines when title and all risks of loss and damages pass to the buyer. Our general conditions of sale explicitly state that the delivery of our products and assembled machines is freight on board shipping point and that title and all risks of loss and damages pass to the buyer upon delivery of the sold products or assembled machines to the common carrier.
We recognize revenue related to the sale of specialized assembled machines upon customer acceptance and installation, as installation is deemed essential to the functionality of a specialized assembled machine. Sales of specialized assembled machines were immaterial for 2018, 2017 and 2016.
Our general conditions of sale explicitly state that acceptance of the conditions of shipment is considered to have occurred unless written notice of objection is received by Kennametal within 10 calendar days of the date specified on the invoice. We do not ship products or assembled machines unless we have documentation authorizing shipment to our customers. The majority of our products are consumed by our customers in the manufacture of their products. Historically, we have experienced very low levels of returned products and assembled machines and do not consider the effect of returned products and assembled machines to be material. We have recorded an estimated returned goods allowance to provide for any potential returns.
We warrant that products and services sold are free from defects in material and workmanship under normal use and service when correctly installed, used and maintained. This warranty terminates 30 days after delivery of the product to the customer and does not apply to products that have been subjected to misuse, abuse, neglect or improper storage, handling or maintenance. Products may be returned to Kennametal only after inspection and approval by Kennametal and upon receipt by the customer of shipping instructions from Kennametal. We have included an estimated allowance for warranty returns in our returned goods allowance discussed above.
Stock-Based Compensation We recognize stock-based compensation expense for all stock options, restricted stock awards and restricted stock units over the period from the date of grant to the date when the award is no longer contingent on the employee providing additional service (substantive vesting period), net of expected forfeitures. We utilize the Black-Scholes valuation method to establish the fair value of all stock option awards. Time vesting stock units are valued at the market value of the stock on the grant date. Performance vesting stock units with a market condition are valued using a Monte Carlo model.
Accounting for Contingencies We accrue for contingencies when it is probable that a liability or loss has been incurred and the amount can be reasonably estimated. Contingencies by their nature relate to uncertainties that require the exercise of judgment in both assessing whether or not a liability or loss has been incurred and estimating the amount of probable loss. The significant contingencies affecting our financial statements include environmental, health and safety matters and litigation.
27
Long-Lived Assets We evaluate the recoverability of property, plant and equipment and intangible assets that are amortized whenever events or changes in circumstances indicate the carrying amount of such assets may not be fully recoverable. Changes in circumstances include technological advances, changes in our business model, capital structure, economic conditions or operating performance. Our evaluation is based upon, among other things, our assumptions about the estimated future undiscounted cash flows these assets are expected to generate. When the sum of the undiscounted cash flows is less than the carrying value, we will recognize an impairment loss to the extent that carrying value exceeds fair value. We apply our best judgment when performing these evaluations to determine if a triggering event has occurred, the undiscounted cash flows used to assess recoverability and the fair value of the asset.
Goodwill and Indefinite-Lived Intangible Assets We evaluate the recoverability of goodwill of each of our reporting units by comparing the fair value of each reporting unit with its carrying value. The fair values of our reporting units are determined using a combination of a discounted cash flow analysis and market multiples based upon historical and projected financial information. We apply our best judgment when assessing the reasonableness of the financial projections used to determine the fair value of each reporting unit. We evaluate the recoverability of indefinite-lived intangible assets using a discounted cash flow analysis based on projected financial information. We perform our annual impairment tests during the June quarter in connection with our annual planning process unless there are impairment indicators based on the results of an ongoing cumulative qualitative assessment that warrant a test prior to that quarter.
The $274.3 million of goodwill allocated to the Industrial reporting unit and the $27.5 million of goodwill allocated to the Widia reporting unit are not at risk of failing Step 1 of the impairment test since fair value substantially exceeded the carrying value as of the date of the last impairment test. Certain factors could negatively affect the estimated fair value, of the Widia reporting unit in particular, including items such as: (i) a decrease in expected future cash flows, specifically, a decrease in sales volume driven by a prolonged weakness in consumer demand or other competitive pressures adversely affecting our long-term volume trends and an inability to successfully achieve our cost savings targets; and (ii) inability to achieve all of the anticipated benefits from simplification and modernization actions assumed. There is no goodwill allocated to the Infrastructure reporting unit. Further, an indefinite-lived trademark intangible asset of $15.0 million in the Widia reporting unit had a fair value that approximated its carrying value as of the date of the last impairment test. The estimated fair value of this asset could be negatively affected by a decrease in expected future cash flows, specifically, a decrease in sales volume driven by a prolonged weakness in consumer demand or other competitive pressures adversely affecting our long-term volume trends.
Pension and Other Postretirement Benefits We sponsor pension and other postretirement benefit plans for certain employees and retirees. Accounting for the cost of these plans requires the estimation of the cost of the benefits to be provided well into the future and attributing that cost over either the expected work life of employees or over average life of participants participating in these plans, depending on plan status and on participant population. This estimation requires our judgment about the discount rate used to determine these obligations, expected return on plan assets, rate of future compensation increases, rate of future health care costs, withdrawal and mortality rates and participant retirement age. Differences between our estimates and actual results may significantly affect the cost of our obligations under these plans.
In the valuation of our pension and other postretirement benefit liabilities, management utilizes various assumptions. Our discount rates are derived by identifying a theoretical settlement portfolio of high quality corporate bonds sufficient to provide for a plan’s projected benefit payments. This rate can fluctuate based on changes in the corporate bond yields. At June 30, 2018, a hypothetical 25 basis point increase in our discount rates would increase our pre-tax income by approximately $0.1 million, and a hypothetical 25 basis point decrease in our discount rates would decrease our pre-tax income by approximately $0.1 million.
The long-term rate of return on plan assets is estimated based on an evaluation of historical returns for each asset category held by the plans, coupled with the current and short-term mix of the investment portfolio. The historical returns are adjusted for expected future market and economic changes. This return will fluctuate based on actual market returns and other economic factors.
The rate of future health care cost increases is based on historical claims and enrollment information projected over the next fiscal year and adjusted for administrative charges. This rate is expected to decrease until 2027. At June 30, 2018, a hypothetical 1 percent increase or decrease in our health care cost trend rates would be immaterial to our pre-tax income.
Future compensation rates, withdrawal rates and participant retirement age are determined based on historical information. These assumptions are not expected to significantly change. Mortality rates are determined based on a review of published mortality tables.
We expect to contribute approximately $8.1 million and $1.6 million to our pension and other postretirement benefit plans, respectively, in 2019.
28
In 2016, substantially all plan participants of the U.S. Retirement Income Plan (RIP) became inactive. As a result, the average remaining life expectancy of the inactive participants was used to amortize the unrecognized net gain or loss instead of the average remaining service period of active plan participants in future periods.
Allowance for Doubtful Accounts We record allowances for estimated losses resulting from the inability of our customers to make required payments. We assess the creditworthiness of our customers based on multiple sources of information and analyze additional factors such as our historical bad debt experience, industry and geographic concentrations of credit risk, current economic trends and changes in customer payment terms. This assessment requires significant judgment. If the financial condition of our customers was to deteriorate, additional allowances may be required, resulting in future operating losses that are not included in the allowance for doubtful accounts at June 30, 2018.
Inventories We use the last-in, first-out method for determining the cost of a significant portion of our U.S. inventories, and they are stated at the lower of cost or market. The cost of the remainder of our inventories is measured using approximate costs determined on the first-in, first-out basis or using the average cost method, and are stated at the lower of cost or net realizable value. When market conditions indicate an excess of carrying costs over market value, a lower of cost or net realizable value provision or a lower of cost or market provision, as applicable, is recorded. Excess and obsolete inventory reserves are established based upon our evaluation of the quantity of inventory on hand relative to demand.
Income Taxes Realization of our deferred tax assets is primarily dependent on future taxable income, the timing and amount of which are uncertain, in part, due to the expected profitability of certain foreign subsidiaries. A valuation allowance is recognized if it is “more likely than not” that some or all of a deferred tax asset will not be realized. As of June 30, 2018, the deferred tax assets net of valuation allowances relate primarily to net operating loss carryforwards, pension benefits, accrued employee benefits and inventory reserves. In the event that we were to determine that we would not be able to realize our deferred tax assets in the future, an increase in the valuation allowance would be required. In the event we were to determine that we are able to use our deferred tax assets for which a valuation allowance is recorded, a decrease in the valuation allowance would be required.
NEW ACCOUNTING STANDARDS
Adopted
In March 2016, the Financial Accounting Standards Board (FASB) issued ASU No. 2016-09, "Improvements to Employee Share-Based Payment Accounting," which is intended to simplify equity-based award accounting and presentation. The guidance impacts income tax accounting related to equity-based awards, the classification of awards as either equity or liabilities, and the classification on the statement of cash flows. We adopted this guidance July 1, 2017. The adoption of this guidance resulted in three changes: (1) the increase to deferred tax assets of $1.4 million related to cumulative excess tax benefits previously unrecognized was offset by a valuation allowance, due to the valuation allowance position of our U.S. entity at the time of adoption of this standard; (2) excess tax benefits, previously reported in the financing activities section of the consolidated statements of cash flow, is now reported in the operating activities section, adopted on a prospective basis; therefore, prior period statements of cash flow were not retrospectively adjusted for this provision; and (3) employee taxes paid when Kennametal withholds shares for tax withholding purposes, previously reported in the operating activities section of the consolidated statement of cash flows, are now reported in the financing activities section, adopted on a retrospective basis; therefore, prior period statements of cash flow were retrospectively adjusted for this provision. Cash flow provided by operating activities and cash flow used for financing activities increased by $3.1 million and $3.2 million in 2017 and 2016, respectively.
In July 2015, the FASB issued ASU No. 2015-11, "Simplifying the Measurement of Inventory," which requires that inventory other than LIFO be subsequently measured at the lower of cost and net realizable value, as opposed to the previous practice of lower of cost or market. Subsequent measurement is unchanged for inventory measured using LIFO. We adopted this guidance July 1, 2017. Adoption of this guidance did not have a material impact on our consolidated financial statements.
Issued
In June 2018, the FASB issued ASU No. 2018-07, “Improvements to Nonemployee Share-Based Payment Accounting" which expands the scope of accounting for stock-based compensation to nonemployees. This guidance is effective for Kennametal July 1, 2019. We are in the process of assessing the impact the adoption of this guidance may have on our consolidated financial statements.
29
In February 2018, the FASB issued ASU No. 2018-02, “Reporting Comprehensive Income (Topic 220): Reclassification of Certain Tax Effects from Accumulated Other Comprehensive Income," which includes amendments related to the reclassification of the income tax effects of the Tax Cuts and Jobs Act of 2017 (TCJA) to improve the usefulness of information reported to financial statement users. The amendments in this update also require certain disclosures about stranded tax effects. This guidance is optional and is effective for Kennametal July 1, 2019, although early adoption is permitted. We are in the process of assessing the impact the adoption of this guidance may have on our consolidated financial statements and determining whether we will adopt this guidance.
In August 2017, the FASB issued ASU No. 2017-12, "Targeted Improvements to Accounting for Hedging Activities," which seeks to improve financial reporting and obtain closer alignment with risk management activities, in addition to simplifying the application of hedge accounting guidance and additional disclosures. This guidance is effective for Kennametal July 1, 2019. We are in the process of assessing the impact the adoption of this guidance may have on our consolidated financial statements.
In May 2017, the FASB issued ASU No. 2017-09, "Compensation—Stock Compensation (Topic 718): Scope of Modification Accounting," which clarifies when to account for a change to the terms or conditions of a share-based payment award as a modification. Under the new guidance, modification accounting is required only if the fair value, the vesting conditions, or the classification of the award (as equity or liability) changes as a result of the change in terms or conditions. This guidance is effective for Kennametal beginning July 1, 2018. We do not expect the adoption of this guidance to have a material effect on our consolidated financial statements.
In March 2017, the FASB issued ASU No. 2017-07, "Improving the Presentation of Net Periodic Pension Cost and Net Periodic Postretirement Benefit Cost," which requires that an employer report the service cost component in the same line item or items as other compensation costs arising from services rendered by the pertinent employees during the period. The other components of net benefit cost are required to be presented in the income statement separately from the service cost component and outside a subtotal of income from operations. This guidance is effective for Kennametal beginning July 1, 2018, with the amendments to be applied retrospectively. We expect to reclassify combined effects of pension income and postretirement benefit cost of approximately $17 million and $18 million out of operating income and into non-operating income for 2018 and 2017, respectively, when comparative financial information is presented going forward.
In October 2016, the FASB issued ASU No. 2016-16, "Intra-Entity Transfers of Assets Other Than Inventory," which clarifies that an entity should recognize the income tax consequences of an intra-entity transfer of an asset other than inventory when the transfer occurs. This guidance is effective for Kennametal beginning July 1, 2018. We do not expect the adoption of this guidance to have a material effect on our consolidated financial statements.
In August 2016, the FASB issued ASU No. 2016-15, "Classification of Certain Cash Receipts and Cash Payments (a consensus of the Emerging Issues Task Force)," which addresses eight specific cash flow issues with the objective of reducing the existing diversity in practice with respect to how these are classified in the statement of cash flows. This guidance is effective for Kennametal beginning July 1, 2018. We do not expect the adoption of this guidance to have a material effect on our consolidated financial statements.
In June 2016, the FASB issued ASU No. 2016-13, "Measurement of Credit Losses on Financial Instruments," which introduces an approach based on expected losses to estimate credit losses on certain types of financial instruments. Beyond other modifications in the update, the scope of this amendment includes valuation of trade receivables. This standard is effective for Kennametal beginning July 1, 2020. We are in the process of assessing the impact the adoption of this guidance will have on our consolidated financial statements.
In February 2016, the FASB issued ASU No. 2016-02, "Leases: Topic 842," which replaces the existing guidance in ASC 840, Leases. The standard establishes a right-of-use (ROU) model that requires a lessee to record a ROU asset and a lease liability on the balance sheet for all leases with terms longer than 12 months. Leases will be classified as either finance or operating, with classification affecting the pattern of expense recognition in the income statement. This standard is effective for Kennametal beginning July 1, 2019. We have a project team in place that will begin inventorying our leasing arrangements. We are in the process of assessing the impact the adoption of this guidance will have on our consolidated financial statements. As of June 30, 2018, our undiscounted future minimum payments outstanding for lease obligations were approximately $65 million.
30
In May 2014, the FASB issued ASU No. 2014-09, “Revenue from Contracts with Customers: Topic 606.” This ASU, along with subsequent complementary updates in ASU Nos. 2015-14, 2016-08, 2016-10 and 2016-12 among others, replaces nearly all existing U.S. GAAP guidance on revenue recognition. The standard prescribes a five-step model for recognizing revenue, the application of which will require significant judgment. It also requires additional disclosures. We adopted this standard on July 1, 2018 using the modified retrospective approach. We have a project team that has performed a detailed review of the terms and provisions in customer contracts, and concluded that the new standard will not affect the timing nor measurement of revenue for these contracts in comparison to the results of historical accounting policies and practices. We do not expect the adoption of this guidance to have a material effect on our consolidated financial statements other than additional disclosures.
RECONCILIATION OF FINANCIAL MEASURES NOT DEFINED BY U.S. GAAP In accordance with the SEC's Regulation G, we are providing descriptions of the non-GAAP financial measures included in this Annual Report and reconciliations to the most closely related GAAP financial measures. We believe that these measures provide useful perspective on underlying business trends and results and a supplemental measure of year-over-year results. The non-GAAP financial measures described below are used by management in making operating decisions, allocating financial resources and for business strategy purposes and may, therefore, also be useful to investors as they are a view of our business results through the eyes of management. These non-GAAP financial measures are not intended to be considered by the user in place of the related GAAP financial measure, but rather as supplemental information to our business results. These non-GAAP financial measures may not be the same as similar measures used by other companies due to possible differences in method and in the items or events being adjusted.
Organic sales growth Organic sales growth is a non-GAAP financial measure of sales growth (decline) (which is the most directly comparable GAAP measure) excluding the impacts of acquisitions, divestitures, business days and foreign currency exchange from year-over-year comparisons. We believe this measure provides investors with a supplemental understanding of underlying sales trends by providing sales growth on a consistent basis. We report organic sales growth at the consolidated and segment levels.
Constant currency end market sales growth (decline) Constant currency end market sales growth (decline) is a non-GAAP financial measure of sales growth (decline) (which is the most directly comparable GAAP measure) by end market excluding the impacts of acquisitions, divestitures and foreign currency exchange from year-over-year comparisons. We note that, unlike organic sales growth, constant currency end market sales growth (decline) does not exclude the impact of business days. We believe this measure provides investors with a supplemental understanding of underlying end market trends by providing end market sales growth (decline) on a consistent basis. We report constant currency end market sales growth (decline) at the consolidated and segment levels. Widia sales are reported only in the general engineering end market. Therefore, we do not provide constant currency end market sales growth (decline) for the Widia segment and, thus, do not include a reconciliation for that metric.
Constant currency regional sales growth (decline) Constant currency regional sales growth (decline) is a non-GAAP financial measure of sales growth (decline) (which is the most directly comparable GAAP measure) by region excluding the impacts of acquisitions, divestitures and foreign currency exchange from year-over-year comparisons. We note that, unlike organic sales growth, constant currency regional sales growth (decline) does not exclude the impact of business days. We believe this measure provides investors with a supplemental understanding of underlying regional trends by providing regional sales growth (decline) on a consistent basis. We report constant currency regional sales growth (decline) at the consolidated and segment levels.
Reconciliations of organic sales growth to sales growth are as follows:
Year ended June 30, 2018 | Industrial | Widia | Infrastructure | Total | ||||
Organic sales growth | 11% | 9% | 15% | 12% | ||||
Foreign currency exchange impact(6) | 5 | 3 | 2 | 4 | ||||
Business days impact(7) | (1) | — | (1) | (1) | ||||
Sales growth | 15% | 12% | 16% | 15% | ||||
Year ended June 30, 2017 | Industrial | Widia | Infrastructure | Total | ||||
Organic sales growth | 5% | 6% | 1% | 4% | ||||
Foreign currency exchange impact(6) | (2) | — | (1) | (2) | ||||
Business days impact(7) | — | (2) | — | — | ||||
Divestiture impact(8) | — | — | (9) | (4) | ||||
Sales growth (decline) | 3% | 4% | (9)% | (2)% | ||||
31
Reconciliations of constant currency end market sales growth (decline) to end market sales growth (decline)(9), are as follows:
Industrial | ||||||||
Year ended June 30, 2018 | General engineering | Transportation | Aerospace and defense | Energy | ||||
Constant currency end market sales growth | 10% | 8% | 11% | 11% | ||||
Foreign currency exchange impact(6) | 5 | 5 | 3 | 4 | ||||
End market sales growth(9) | 15% | 13% | 14% | 15% | ||||
Infrastructure | ||||||
Year ended June 30, 2018 | Energy | Earthworks | General engineering | |||
Constant currency end market sales growth | 19% | 7% | 16% | |||
Foreign currency exchange impact(6) | 1 | 3 | 3 | |||
End market sales growth(9) | 20% | 10% | 19% | |||
Total | ||||||||||
Year ended June 30, 2018 | General engineering | Transportation | Aerospace and defense | Energy | Earthworks | |||||
Constant currency end market sales growth | 11% | 8% | 11% | 17% | 7% | |||||
Foreign currency exchange impact(6) | 4 | 5 | 4 | 2 | 3 | |||||
End market sales growth(9) | 15% | 13% | 15% | 19% | 10% | |||||
Industrial | ||||||||
Year ended June 30, 2017 | General engineering | Transportation | Aerospace and defense | Energy | ||||
Constant currency end market sales growth | 7% | 2% | 6% | 5% | ||||
Foreign currency exchange impact(6) | (2) | (3) | (2) | (3) | ||||
End market sales growth (decline)(9) | 5% | (1)% | 4% | 2% | ||||
Infrastructure | ||||||
Year ended June 30, 2017 | Energy | Earthworks | General engineering | |||
Constant currency end market sales growth (decline) | 11% | (6)% | 6% | |||
Foreign currency exchange impact(6) | (1) | — | (1) | |||
Divestiture impact(8) | (8) | (6) | (12) | |||
End market sales growth (decline)(9) | 2% | (12)% | (7)% | |||
Total | ||||||||||
Year ended June 30, 2017 | General engineering | Transportation | Aerospace and defense | Energy | Earthworks | |||||
Constant currency end market sales growth (decline) | 6% | 2% | 4% | 9% | (4)% | |||||
Foreign currency exchange impact(6) | (1) | (3) | (2) | (1) | — | |||||
Divestiture impact(8) | (3) | — | — | (6) | (6) | |||||
End market sales growth (decline)(9) | 2% | (1)% | 2% | 2% | (10)% | |||||
32
Reconciliations of constant currency regional sales growth (decline) to reported regional sales growth (decline)(10), are as follows:
Industrial | Year Ended June 30, 2018 | Year Ended June 30, 2017 | ||||||||||
Americas | EMEA | Asia Pacific | Americas | EMEA | Asia Pacific | |||||||
Constant currency regional sales growth (decline) | 12% | 8% | 12% | 5% | 2% | 11% | ||||||
Foreign currency exchange impact(6) | — | 9 | 4 | (1) | (3) | (2) | ||||||
Divestiture impact(8) | — | — | — | (1) | — | — | ||||||
Regional sales growth (decline)(10) | 12% | 17% | 16% | 3% | (1)% | 9% | ||||||
Widia | Year Ended June 30, 2018 | Year Ended June 30, 2017 | ||||||||||
Americas | EMEA | Asia Pacific | Americas | EMEA | Asia Pacific | |||||||
Constant currency regional sales growth (decline) | 4% | 14% | 15% | 4% | (2)% | 12% | ||||||
Foreign currency exchange impact(6) | — | 6 | 3 | — | (1) | (1) | ||||||
Regional sales growth (decline)(10) | 4% | 20% | 18% | 4% | (3)% | 11% | ||||||
Infrastructure | Year Ended June 30, 2018 | Year Ended June 30, 2017 | ||||||||||
Americas | EMEA | Asia Pacific | Americas | EMEA | Asia Pacific | |||||||
Constant currency regional sales growth (decline) | 16% | 1% | 20% | 3% | (6)% | 2% | ||||||
Foreign currency exchange impact(6) | — | 9 | 4 | — | — | (4) | ||||||
Divestiture impact(8) | — | — | — | (6) | (24) | (3) | ||||||
Regional sales growth (decline)(10) | 16% | 10% | 24% | (3)% | (30)% | (5)% | ||||||
Total | Year Ended June 30, 2018 | Year Ended June 30, 2017 | ||||||||||
Americas | EMEA | Asia Pacific | Americas | EMEA | Asia Pacific | |||||||
Constant currency regional sales growth (decline) | 13% | 7% | 15% | 4% | —% | 8% | ||||||
Foreign currency exchange impact(6) | — | 9 | 4 | — | (2) | (3) | ||||||
Divestiture impact(8) | — | — | — | (4) | (7) | (1) | ||||||
Regional sales growth (decline)(10) | 13% | 16% | 19% | —% | (9)% | 4% | ||||||
(6) Foreign currency exchange impact is calculated by dividing the difference between current period sales at prior period foreign exchange rates and prior period sales by prior period sales.
(7) Business days impact is calculated by dividing the year-over-year change in weighted average working days (based on mix of sales by country) by prior period weighted average working days.
(8) Divestiture impact is calculated by dividing prior period sales attributable to divested businesses by prior period sales.
(9) Aggregate sales for all end markets sum to the sales amount presented on Kennametal's financial statements.
(10) Aggregate sales for all regions sum to the sales amount presented on Kennametal's financial statements.
33
ITEM 7A - QUANTITATIVE AND QUALITATIVE DISCLOSURES ABOUT MARKET RISK
MARKET RISK We are exposed to certain market risks arising from transactions that are entered into in the normal course of business. As part of our financial risk management program, we use certain derivative financial instruments to manage these risks. We do not enter into derivative transactions for speculative purposes and, therefore, hold no derivative instruments for trading purposes. We use derivative financial instruments to provide predictability to the effects of changes in foreign exchange rates on our consolidated results and to achieve our targeted mix of fixed and floating interest rates on our outstanding debt. Our objective in managing foreign exchange exposures with derivative instruments is to reduce volatility in cash flow, allowing us to focus more of our attention on business operations. With respect to interest rate management, these derivative instruments allow us to achieve our targeted fixed-to-floating interest rate mix as a separate decision from funding arrangements in the bank and public debt markets. We measure hedge effectiveness by assessing the changes in the fair value or expected future cash flows of the hedged item. The ineffective portions are recorded in other expense (income), net. See Notes 2 and 16 of our consolidated financial statements set forth in Item 8 of this Annual Report.
We are exposed to counterparty credit risk for nonperformance of derivative contracts and, in the event of nonperformance, to market risk for changes in interest and currency exchange rates, as well as settlement risk. We manage exposure to counterparty credit risk through credit standards, diversification of counterparties and procedures to monitor concentrations of credit risk. We do not anticipate nonperformance by any of the counterparties.
The following provides additional information on our use of derivative instruments. Included below is a sensitivity analysis that is based upon a hypothetical 10 percent weakening or strengthening in the U.S. dollar and its effects on the June 30, 2018 currency exchange rates and the effective interest rates under our current borrowing arrangements. We compared our contractual derivative and borrowing arrangements in effect at June 30, 2018 to the hypothetical foreign exchange or interest rates in the sensitivity analysis to determine the effect on interest expense, pre-tax income and accumulated other comprehensive loss. Our analysis takes into consideration the different types of derivative instruments and the applicability of hedge accounting.
CASH FLOW HEDGES Currency A portion of our operations consists of investments in foreign subsidiaries. Our exposure to market risk from changes in foreign exchange rates arises from these investments, intercompany loans utilized to finance these subsidiaries, trade receivables and payables and firm commitments arising from international transactions. We manage our foreign exchange transaction risk to reduce the volatility of cash flows caused by currency exchange rate fluctuations through natural offsets where appropriate and through foreign exchange contracts. These contracts are designated as hedges of forecasted transactions that will settle in future periods and that would otherwise expose us to currency risk.
Our foreign exchange hedging program is intended to mitigate our exposure to currency exchange rate movements. This exposure arises largely from anticipated cash flows from cross-border intercompany sales of products and services. This program utilizes range forwards and forward contracts primarily to sell foreign currency. The notional amounts of the contracts translated into U.S. dollars at June 30, 2018 and 2017 were $62.9 million and $75.3 million, respectively. We would have received $0.8 million and would have paid $0.8 million at June 30, 2018 and 2017, respectively, to settle these contracts representing the fair value of these agreements. At June 30, 2018, a hypothetical 10 percent strengthening or weakening of the U.S. dollar would have changed accumulated other comprehensive loss, net of tax, by $1.8 million.
In addition, we may enter into forward contracts to hedge transaction exposures or significant cross-border intercompany loans by either purchasing or selling specified amounts of foreign currency at a specified date. At June 30, 2018 and 2017, we had outstanding forward contracts to purchase and sell foreign currency with notional amounts, translated into U.S. dollars at June 30, 2018 and 2017 rates, of $3.9 million and $13.7 million in a sell position, respectively. At June 30, 2018, a hypothetical 10 percent change in the year-end exchange rates would have resulted in a $0.6 million increase or decrease in pre-tax income and an immaterial increase or decrease in accumulated other comprehensive loss, net of tax, related to these positions.
Interest Rate Our exposure to market risk for changes in interest rates relates primarily to our long-term debt obligations. We seek to manage our interest rate risk in order to balance our exposure between fixed and floating rates, while attempting to minimize our borrowing costs. To achieve these objectives, we primarily use interest rate swap contracts to manage exposure to interest rate changes related to these borrowings. We had no swaps in place as of June 30, 2018 and 2017.
DEBT AND NOTES PAYABLE At June 30, 2018 and 2017, we had $991.7 million and $695.9 million, respectively, of outstanding debt, including capital leases and notes payable. Effective interest rates as of June 30, 2018 and 2017 were 3.6 percent and 3.5 percent, respectively. A hypothetical change of 10 percent in market interest rates from June 30, 2018 levels would have an immaterial impact on our interest expense.
CURRENCY EXCHANGE RATE FLUCTUATIONS Currency exchange rate fluctuations increased diluted earnings per share by $0.05 in 2018, decreased diluted earnings per share by $0.08 in 2017 and increased diluted earnings per share by $0.08 in 2016. Currency exchange rate fluctuations may have a material impact on future earnings in the short term and long term.
34
ITEM 8 - FINANCIAL STATEMENTS AND SUPPLEMENTARY DATA
MANAGEMENT’S REPORT ON INTERNAL CONTROL OVER FINANCIAL REPORTING
Management is responsible for establishing and maintaining adequate internal control over financial reporting. Management has conducted an assessment of the Company’s internal controls over financial reporting as of June 30, 2018 using the criteria in Internal Control – Integrated Framework (2013), issued by the Committee of Sponsoring Organizations of the Treadway Commission (COSO). The Company’s internal control over financial reporting is designed to provide reasonable assurance regarding the reliability of financial reporting and the preparation of financial statements for external purposes in accordance with accounting principles generally accepted in the United States of America. Because of its inherent limitations, internal control over financial reporting may not prevent or detect misstatements. Also, projections of any evaluation of effectiveness to future periods are subject to the risk that controls may become inadequate because of changes in conditions, or that the degree of compliance with the policies or procedures may deteriorate.
Based on its assessment, management has concluded that the Company maintained effective internal control over financial reporting as of June 30, 2018, based on the criteria in Internal Control – Integrated Framework (2013) issued by the COSO. The effectiveness of the Company’s internal control over financial reporting as of June 30, 2018 has been audited by PricewaterhouseCoopers LLP, an independent registered public accounting firm, as stated in their report which is included in this Annual Report on Form 10-K.
35
Report of Independent Registered Public Accounting Firm
To the Board of Directors and Shareholders of Kennametal Inc.
Opinions on the Financial Statements and Internal Control over Financial Reporting
We have audited the accompanying consolidated balance sheets of Kennametal Inc. and its subsidiaries as of June 30, 2018 and 2017, and the related consolidated statements of income, comprehensive income, cash flow and shareholders’ equity for each of the three years in the period ended June 30, 2018, including the related notes and financial statement schedule listed in the index appearing under Item 15(a)(2) (collectively referred to as the “consolidated financial statements”). We also have audited the Company's internal control over financial reporting as of June 30, 2018, based on criteria established in Internal Control - Integrated Framework (2013) issued by the Committee of Sponsoring Organizations of the Treadway Commission (COSO).
In our opinion, the consolidated financial statements referred to above present fairly, in all material respects, the financial position of the Company as of June 30, 2018 and 2017, and the results of their operations and their cash flows for each of the three years in the period ended June 30, 2018 in conformity with accounting principles generally accepted in the United States of America. Also in our opinion, the Company maintained, in all material respects, effective internal control over financial reporting as of June 30, 2018, based on criteria established in Internal Control - Integrated Framework (2013) issued by the COSO.
Basis for Opinions
The Company's management is responsible for these consolidated financial statements, for maintaining effective internal control over financial reporting, and for its assessment of the effectiveness of internal control over financial reporting, included in Management's Report on Internal Control over Financial Reporting appearing under Item 8. Our responsibility is to express opinions on the Company’s consolidated financial statements and on the Company's internal control over financial reporting based on our audits. We are a public accounting firm registered with the Public Company Accounting Oversight Board (United States) ("PCAOB") and are required to be independent with respect to the Company in accordance with the U.S. federal securities laws and the applicable rules and regulations of the Securities and Exchange Commission and the PCAOB.
We conducted our audits in accordance with the standards of the PCAOB. Those standards require that we plan and perform the audits to obtain reasonable assurance about whether the consolidated financial statements are free of material misstatement, whether due to error or fraud, and whether effective internal control over financial reporting was maintained in all material respects.
Our audits of the consolidated financial statements included performing procedures to assess the risks of material misstatement of the consolidated financial statements, whether due to error or fraud, and performing procedures that respond to those risks. Such procedures included examining, on a test basis, evidence regarding the amounts and disclosures in the consolidated financial statements. Our audits also included evaluating the accounting principles used and significant estimates made by management, as well as evaluating the overall presentation of the consolidated financial statements. Our audit of internal control over financial reporting included obtaining an understanding of internal control over financial reporting, assessing the risk that a material weakness exists, and testing and evaluating the design and operating effectiveness of internal control based on the assessed risk. Our audits also included performing such other procedures as we considered necessary in the circumstances. We believe that our audits provide a reasonable basis for our opinions.
Definition and Limitations of Internal Control over Financial Reporting
A company’s internal control over financial reporting is a process designed to provide reasonable assurance regarding the reliability of financial reporting and the preparation of financial statements for external purposes in accordance with generally accepted accounting principles. A company’s internal control over financial reporting includes those policies and procedures that (i) pertain to the maintenance of records that, in reasonable detail, accurately and fairly reflect the transactions and dispositions of the assets of the company; (ii) provide reasonable assurance that transactions are recorded as necessary to permit preparation of financial statements in accordance with generally accepted accounting principles, and that receipts and expenditures of the company are being made only in accordance with authorizations of management and directors of the company; and (iii) provide reasonable assurance regarding prevention or timely detection of unauthorized acquisition, use, or disposition of the company’s assets that could have a material effect on the financial statements.
36
Because of its inherent limitations, internal control over financial reporting may not prevent or detect misstatements. Also, projections of any evaluation of effectiveness to future periods are subject to the risk that controls may become inadequate because of changes in conditions, or that the degree of compliance with the policies or procedures may deteriorate.
/s/ PricewaterhouseCoopers LLP
Pittsburgh, Pennsylvania
August 10, 2018
We have served as the Company’s auditor since 2002.
37
CONSOLIDATED STATEMENTS OF INCOME
Year ended June 30 (in thousands, except per share data) | 2018 | 2017 | 2016 | ||||||||
Sales | $ | 2,367,853 | $ | 2,058,368 | $ | 2,098,436 | |||||
Cost of goods sold | 1,535,561 | 1,400,661 | 1,482,369 | ||||||||
Gross profit | 832,292 | 657,707 | 616,067 | ||||||||
Operating expense | 498,152 | 463,167 | 494,975 | ||||||||
Restructuring and asset impairment charges (Notes 2 and 15) | 11,907 | 65,018 | 143,810 | ||||||||
Loss on divestiture (Note 4) | — | — | 131,463 | ||||||||
Amortization of intangibles | 14,668 | 16,578 | 20,762 | ||||||||
Operating income (loss) | 307,565 | 112,944 | (174,943 | ) | |||||||
Interest expense | 30,081 | 28,842 | 27,752 | ||||||||
Other expense (income), net | 2,443 | 2,227 | (4,124 | ) | |||||||
Income (loss) before income taxes | 275,041 | 81,875 | (198,571 | ) | |||||||
Provision for income taxes (Note 12) | 69,981 | 29,895 | 25,313 | ||||||||
Net income (loss) | 205,060 | 51,980 | (223,884 | ) | |||||||
Less: Net income attributable to noncontrolling interests | 4,880 | 2,842 | 2,084 | ||||||||
Net income (loss) attributable to Kennametal | $ | 200,180 | $ | 49,138 | $ | (225,968 | ) | ||||
PER SHARE DATA ATTRIBUTABLE TO KENNAMETAL SHAREHOLDERS | |||||||||||
Basic earnings (loss) per share | $ | 2.45 | $ | 0.61 | $ | (2.83 | ) | ||||
Diluted earnings (loss) per share | $ | 2.42 | $ | 0.61 | $ | (2.83 | ) | ||||
Dividends per share | $ | 0.80 | $ | 0.80 | $ | 0.80 | |||||
Basic weighted average shares outstanding | 81,544 | 80,351 | 79,835 | ||||||||
Diluted weighted average shares outstanding | 82,754 | 81,169 | 79,835 | ||||||||
CONSOLIDATED STATEMENTS OF COMPREHENSIVE INCOME
Year ended June 30 (in thousands) | 2018 | 2017 | 2016 | |||||||||
Net income (loss) | $ | 205,060 | $ | 51,980 | $ | (223,884 | ) | |||||
Other comprehensive income (loss), net of tax | ||||||||||||
Unrealized loss on derivatives designated and qualified as cash flow hedges | (922 | ) | (471 | ) | (150 | ) | ||||||
Reclassification of unrealized loss (gain) on expired derivatives designated and qualified as cash flow hedges | 3,747 | 1,557 | (1,563 | ) | ||||||||
Unrecognized net pension and other postretirement benefit (loss) gain | (5,991 | ) | 15,559 | (78,295 | ) | |||||||
Reclassification of net pension and other postretirement benefit loss | 7,274 | 7,566 | 4,925 | |||||||||
Foreign currency translation adjustments | (1,490 | ) | 5,888 | (52,695 | ) | |||||||
Reclassification of foreign currency translation adjustment loss realized upon sale | — | — | 15,088 | |||||||||
Total other comprehensive income (loss), net of tax | 2,618 | 30,099 | (112,690 | ) | ||||||||
Total comprehensive income (loss) | 207,678 | 82,079 | (336,574 | ) | ||||||||
Less: comprehensive income attributable to noncontrolling interests | 4,131 | 4,124 | 896 | |||||||||
Comprehensive income (loss) attributable to Kennametal Shareholders | $ | 203,547 | $ | 77,955 | $ | (337,470 | ) | |||||
The accompanying notes are an integral part of these consolidated financial statements.
38
CONSOLIDATED BALANCE SHEETS
As of June 30 (in thousands, except per share data) | 2018 | 2017 | |||||
ASSETS | |||||||
Current assets: | |||||||
Cash and cash equivalents | $ | 556,153 | $ | 190,629 | |||
Accounts receivable, less allowance for doubtful accounts of $11,807 and $13,693 respectively | 401,290 | 380,425 | |||||
Inventories (Note 7) | 525,466 | 487,681 | |||||
Other current assets | 63,257 | 55,166 | |||||
Total current assets | 1,546,166 | 1,113,901 | |||||
Property, plant and equipment: | |||||||
Land and buildings | 351,953 | 350,002 | |||||
Machinery and equipment | 1,702,243 | 1,577,776 | |||||
Less accumulated depreciation | (1,229,983 | ) | (1,183,390 | ) | |||
Property, plant and equipment, net | 824,213 | 744,388 | |||||
Other assets: | |||||||
Assets held for sale (Note 15) | — | 6,980 | |||||
Goodwill (Notes 2 and 8) | 301,802 | 301,367 | |||||
Other intangible assets, less accumulated amortization of $145,334 and $129,981, respectively (Notes 2 and 8) | 176,468 | 190,527 | |||||
Deferred income taxes (Note 12) | 17,015 | 28,349 | |||||
Long-term prepaid pension benefit (Note 13) | 42,543 | 17,208 | |||||
Other | 17,530 | 12,776 | |||||
Total other assets | 555,358 | 557,207 | |||||
Total assets | $ | 2,925,737 | $ | 2,415,496 | |||
LIABILITIES | |||||||
Current liabilities: | |||||||
Current maturities of long-term debt and capital leases (Note 10) | $ | 399,266 | $ | 190 | |||
Notes payable to banks (Note 11) | 934 | 735 | |||||
Accounts payable | 221,903 | 215,722 | |||||
Accrued income taxes | 18,603 | 6,202 | |||||
Accrued vacation pay | 18,078 | 18,108 | |||||
Accrued payroll | 77,161 | 67,574 | |||||
Other current liabilities (Note 9) | 150,586 | 152,947 | |||||
Total current liabilities | 886,531 | 461,478 | |||||
Long-term debt and capital leases, less current maturities (Note 10) | 591,505 | 694,991 | |||||
Deferred income taxes (Note 12) | 26,991 | 14,883 | |||||
Accrued postretirement benefits (Note 13) | 13,725 | 16,906 | |||||
Accrued pension benefits (Note 13) | 145,797 | 143,954 | |||||
Accrued income taxes | 6,249 | 2,636 | |||||
Other liabilities | 24,612 | 27,995 | |||||
Total liabilities | 1,695,410 | 1,362,843 | |||||
Commitments and contingencies (Note 19) | |||||||
EQUITY | |||||||
Kennametal Shareholders’ Equity: | |||||||
Preferred stock, no par value; 5,000 shares authorized; none issued | — | — | |||||
Capital stock, $1.25 par value; 120,000 shares authorized; 81,646 and 80,665 shares issued, respectively | 102,058 | 100,832 | |||||
Additional paid-in capital | 511,909 | 474,547 | |||||
Retained earnings | 900,683 | 765,607 | |||||
Accumulated other comprehensive loss (Note 14) | (320,325 | ) | (323,692 | ) | |||
Total Kennametal Shareholders’ Equity | 1,194,325 | 1,017,294 | |||||
Noncontrolling interests | 36,002 | 35,359 | |||||
Total equity | 1,230,327 | 1,052,653 | |||||
Total liabilities and equity | $ | 2,925,737 | $ | 2,415,496 | |||
The accompanying notes are an integral part of these consolidated financial statements.
39
CONSOLIDATED STATEMENTS OF CASH FLOW
Year ended June 30 (in thousands) | 2018 | 2017 | 2016 | ||||||||
OPERATING ACTIVITIES | |||||||||||
Net income (loss) | $ | 205,060 | $ | 51,980 | $ | (223,884 | ) | ||||
Adjustments for non-cash items: | |||||||||||
Depreciation | 94,012 | 91,078 | 96,704 | ||||||||
Amortization | 14,668 | 16,578 | 20,762 | ||||||||
Stock-based compensation expense | 20,830 | 21,065 | 18,129 | ||||||||
Restructuring and asset impairment charges (Notes 2 and 15) | (248 | ) | 1,802 | 118,779 | |||||||
Loss on divestiture (Note 4) | — | — | 131,124 | ||||||||
Deferred income tax provision | 22,915 | 6,267 | 8,328 | ||||||||
Other | 4,651 | 94 | (6,113 | ) | |||||||
Changes in certain assets and liabilities: | |||||||||||
Accounts receivable | (22,201 | ) | (7,606 | ) | 32,661 | ||||||
Inventories | (37,230 | ) | (24,300 | ) | 69,552 | ||||||
Accounts payable and accrued liabilities | (5,046 | ) | 54,554 | 991 | |||||||
Accrued income taxes | 11,093 | 6,873 | (25,247 | ) | |||||||
Accrued pension and postretirement benefits | (26,759 | ) | (27,818 | ) | (15,013 | ) | |||||
Other | (4,441 | ) | 4,771 | (4,280 | ) | ||||||
Net cash flow provided by operating activities | 277,304 | 195,338 | 222,493 | ||||||||
INVESTING ACTIVITIES | |||||||||||
Purchases of property, plant and equipment | (171,004 | ) | (118,018 | ) | (110,697 | ) | |||||
Disposals of property, plant and equipment | 14,358 | 5,023 | 5,978 | ||||||||
Proceeds from divestiture (Note 4) | — | — | 56,127 | ||||||||
Other | (225 | ) | 247 | 659 | |||||||
Net cash flow used for investing activities | (156,871 | ) | (112,748 | ) | (47,933 | ) | |||||
FINANCING ACTIVITIES | |||||||||||
Net increase (decrease) in notes payable | 495 | (317 | ) | (6,288 | ) | ||||||
Term debt borrowings | 295,863 | 25,298 | 50,070 | ||||||||
Term debt repayments | (190 | ) | (25,899 | ) | (94,577 | ) | |||||
Purchase of capital stock | (217 | ) | (241 | ) | (295 | ) | |||||
The effect of employee benefit and stock plans and dividend reinvestment | 17,975 | 18,319 | 1,348 | ||||||||
Cash dividends paid to Shareholders | (65,104 | ) | (64,128 | ) | (63,717 | ) | |||||
Other | (1,625 | ) | (6,317 | ) | (181 | ) | |||||
Net cash flow provided by (used for) financing activities | 247,197 | (53,285 | ) | (113,640 | ) | ||||||
Effect of exchange rate changes on cash and cash equivalents | (2,106 | ) | (255 | ) | (4,835 | ) | |||||
CASH AND CASH EQUIVALENTS | |||||||||||
Net increase in cash and cash equivalents | 365,524 | 29,050 | 56,085 | ||||||||
Cash and cash equivalents, beginning of year | 190,629 | 161,579 | 105,494 | ||||||||
Cash and cash equivalents, end of year | $ | 556,153 | $ | 190,629 | $ | 161,579 | |||||
The accompanying notes are an integral part of these consolidated financial statements.
40
CONSOLIDATED STATEMENTS OF SHAREHOLDERS' EQUITY
2018 | 2017 | 2016 | ||||||||||||||||||
Year ended June 30 (in thousands) | Shares | Amount | Shares | Amount | Shares | Amount | ||||||||||||||
CAPITAL STOCK | ||||||||||||||||||||
Balance at beginning of year | 80,665 | $ | 100,832 | 79,694 | $ | 99,618 | 79,375 | $ | 99,219 | |||||||||||
Dividend reinvestment | 5 | 7 | 7 | 9 | 12 | 15 | ||||||||||||||
Capital stock issued under employee benefit and stock plans | 981 | 1,226 | 971 | 1,214 | 319 | 399 | ||||||||||||||
Purchase of capital stock | (5 | ) | (7 | ) | (7 | ) | (9 | ) | (12 | ) | (15 | ) | ||||||||
Balance at end of year | 81,646 | 102,058 | 80,665 | 100,832 | 79,694 | 99,618 | ||||||||||||||
ADDITIONAL PAID-IN CAPITAL | ||||||||||||||||||||
Balance at beginning of year | 474,547 | 436,617 | 419,829 | |||||||||||||||||
Dividend reinvestment | 210 | 235 | 279 | |||||||||||||||||
Capital stock issued under employee benefit and stock plans | 37,362 | 37,930 | 14,271 | |||||||||||||||||
Sale of subsidiary stock to noncontrolling interests | — | — | 2,517 | |||||||||||||||||
Purchase of capital stock | (210 | ) | (235 | ) | (279 | ) | ||||||||||||||
Balance at end of year | 511,909 | 474,547 | 436,617 | |||||||||||||||||
RETAINED EARNINGS | ||||||||||||||||||||
Balance at beginning of year | 765,607 | 780,597 | 1,070,282 | |||||||||||||||||
Net income (loss) | 200,180 | 49,138 | (225,968 | ) | ||||||||||||||||
Cash dividends | (65,104 | ) | (64,128 | ) | (63,717 | ) | ||||||||||||||
Balance at end of year | 900,683 | 765,607 | 780,597 | |||||||||||||||||
ACCUMULATED OTHER COMPREHENSIVE LOSS | ||||||||||||||||||||
Balance at beginning of year | (323,692 | ) | (352,509 | ) | (243,523 | ) | ||||||||||||||
Unrealized loss on derivatives designated and qualified as cash flow hedges | (922 | ) | (471 | ) | (150 | ) | ||||||||||||||
Reclassification of unrealized loss (gain) on expired derivatives designated and qualified as cash flow hedges | 3,747 | 1,557 | (1,563 | ) | ||||||||||||||||
Unrecognized net pension and other postretirement benefit (loss) gain | (5,991 | ) | 15,559 | (78,295 | ) | |||||||||||||||
Reclassification of net pension and other postretirement benefit loss | 7,274 | 7,566 | 4,925 | |||||||||||||||||
Foreign currency translation adjustments | (741 | ) | 4,606 | (51,508 | ) | |||||||||||||||
Reclassification of foreign currency translation adjustment loss realized upon sale | — | — | 15,088 | |||||||||||||||||
Other comprehensive income (loss), net of tax | 3,367 | 28,817 | (111,503 | ) | ||||||||||||||||
Sale of subsidiary stock to noncontrolling interests | — | — | 2,517 | |||||||||||||||||
Balance at end of year | (320,325 | ) | (323,692 | ) | (352,509 | ) | ||||||||||||||
NONCONTROLLING INTERESTS | ||||||||||||||||||||
Balance at beginning of year | 35,359 | 31,478 | 29,628 | |||||||||||||||||
Net income | 4,880 | 2,842 | 2,084 | |||||||||||||||||
Other comprehensive (loss) income, net of tax | (749 | ) | 1,282 | (1,188 | ) | |||||||||||||||
Sale of subsidiary stock to noncontrolling interests | — | — | 2,566 | |||||||||||||||||
Additions to noncontrolling interests | 591 | — | — | |||||||||||||||||
Cash dividends | (4,079 | ) | (243 | ) | (1,612 | ) | ||||||||||||||
Balance at end of year | 36,002 | 35,359 | 31,478 | |||||||||||||||||
Total equity, June 30 | $ | 1,230,327 | $ | 1,052,653 | $ | 995,801 | ||||||||||||||
The accompanying notes are an integral part of these consolidated financial statements.
41
NOTES TO CONSOLIDATED FINANCIAL STATEMENTS
NOTE 1 — NATURE OF OPERATIONS
Kennametal Inc. is a global leader in the development and application of tungsten carbides, ceramics, super-hard materials and solutions used in metal cutting and mission-critical wear applications to combat extreme conditions associated with wear fatigue, corrosion and high temperatures. The Company's reputation for material technology, metal cutting application knowledge, as well as expertise and innovation in the development of custom solutions and services, contributes to its leading position in its primary markets.
Our product offering includes a wide selection of standard and customized technologies for metalworking applications, such as turning, milling, hole making, tooling systems and services. End users of the Company's metalworking products include manufacturers engaged in a diverse array of industries including: the manufacturers of transportation vehicles and components, machine tools and light and heavy machinery; airframe and aerospace components; and energy-related components for the oil and gas industry, as well as power generation.
In addition, we produce specialized wear components and metallurgical powders that are used for custom-engineered and challenging applications. End users of these products include producers and suppliers in equipment-intensive operations such as coal mining, road construction, quarrying, oil and gas exploration, refining, production and supply.
Unless otherwise specified, any reference to a “year” is to a fiscal year ended June 30. When used in this Annual Report on Form 10-K, unless the context requires otherwise, the terms “we,” “our” and “us” refer to Kennametal Inc. and its subsidiaries.
NOTE 2 — SUMMARY OF SIGNIFICANT ACCOUNTING POLICIES
The summary of our significant accounting policies is presented below to assist in evaluating our consolidated financial statements.
PRINCIPLES OF CONSOLIDATION The consolidated financial statements include our accounts and those of our majority-owned subsidiaries. All significant intercompany balances and transactions are eliminated. Investments in entities of less than 50 percent of the voting stock over which we have significant influence are accounted for on an equity basis. The factors used to determine significant influence include, but are not limited to, our management involvement in the investee, such as hiring and setting compensation for management of the investee, the ability to make operating and capital decisions of the investee, representation on the investee’s board of directors and purchase and supply agreements with the investee. Investments in entities of less than 50 percent of the voting stock in which we do not have significant influence are accounted for on the cost basis.
USE OF ESTIMATES IN THE PREPARATION OF FINANCIAL STATEMENTS In preparing our consolidated financial statements in conformity with accounting principles generally accepted in the United States of America (U.S. GAAP), we make judgments and estimates about the amounts reflected in our financial statements. As part of our financial reporting process, our management collaborates to determine the necessary information on which to base our judgments and develop estimates used to prepare the financial statements. We use historical experience and available information to make these judgments and estimates. However, different amounts could be reported using different assumptions and in light of different facts and circumstances. Therefore, actual amounts could differ from the estimates reflected in our financial statements.
CASH AND CASH EQUIVALENTS Cash investments having original maturities of three months or less are considered cash equivalents. Cash equivalents principally consist of investments in money market funds and bank deposits at June 30, 2018.
ACCOUNTS RECEIVABLE We market our products to a diverse customer base throughout the world. Trade credit is extended based upon periodically updated evaluations of each customer’s ability to satisfy its obligations. We make judgments as to our ability to collect outstanding receivables and provide allowances for the portion of receivables when collection becomes doubtful. Accounts receivable reserves are determined based upon an aging of accounts and a review of specific accounts.
INVENTORIES We use the last-in, first-out (LIFO) method for determining the cost of a significant portion of our United States ((U.S.) inventories, and they are stated at the lower of cost or market. The cost of the remainder of our inventories is measured using approximate costs determined on the first-in, first-out basis or using the average cost method, and are stated at the lower of cost or net realizable value. When market conditions indicate an excess of carrying costs over market value, a lower of cost or net realizable value provision or a lower of cost or market provision, as applicable, is recorded. Excess and obsolete inventory reserves are established based upon our evaluation of the quantity of inventory on hand relative to demand. The excess and obsolete inventory reserve at June 30, 2018 and 2017 was $31.3 million and $32.1 million, respectively.
42
PROPERTY, PLANT AND EQUIPMENT Property, plant and equipment are carried at cost. Major improvements are capitalized, while maintenance and repairs are expensed as incurred. Retirements and disposals are removed from cost and accumulated depreciation accounts, with the gain or loss reflected in operating income. Interest related to the construction of major facilities is capitalized as part of the construction costs and is depreciated over the facilities' estimated useful lives.
Depreciation for financial reporting purposes is computed using the straight-line method over the following estimated useful lives: building and improvements over 15-40 years; machinery and equipment over 4-15 years; furniture and fixtures over 5-10 years and computer hardware and software over 3-5 years.
Leased property and equipment under capital leases are depreciated using the straight-line method over the terms of the related leases.
LONG-LIVED ASSETS We evaluate the recoverability of property, plant and equipment and intangible assets that are amortized, whenever events or changes in circumstances indicate the carrying amount of any such assets may not be fully recoverable. Changes in circumstances include technological advances, changes in our business model, capital structure, economic conditions or operating performance. Our evaluation is based upon, among other things, our assumptions about the estimated future undiscounted cash flows these assets are expected to generate. When the sum of the undiscounted cash flows is less than the carrying value of the asset or asset group, we will recognize an impairment loss to the extent that carrying value exceeds fair value. We apply our best judgment when performing these evaluations to determine if a triggering event has occurred, the undiscounted cash flows used to assess recoverability and the fair value of the asset.
GOODWILL AND OTHER INTANGIBLE ASSETS Goodwill represents the excess of cost over the fair value of the net assets of acquired companies. Goodwill and other intangible assets with indefinite lives are tested at least annually for impairment. We perform our annual impairment tests during the June quarter in connection with our annual planning process unless there are impairment indicators based on the results of an ongoing cumulative qualitative assessment that warrant a test prior to that quarter. We evaluate the recoverability of goodwill for each of our reporting units by comparing the fair value of each reporting unit with its carrying value. The fair values of our reporting units are determined using a combination of a discounted cash flow analysis and market multiples based upon historical and projected financial information. We apply our best judgment when assessing the reasonableness of the financial projections used to determine the fair value of each reporting unit. We evaluate the recoverability of indefinite-lived intangible assets using a discounted cash flow analysis based on projected financial information. This evaluation is sensitive to changes in market interest rates and other external factors.
The majority of our intangible assets with definite lives are amortized on a straight-line basis, while certain customer-related intangible assets are amortized on an accelerated method. Identifiable assets with finite lives are reviewed for impairment when events or circumstances indicate that the carrying value may not be recoverable.
2016 December Quarter Impairment Charge
As previously disclosed, we recorded a preliminary non-cash pre-tax impairment charge during the three months ended December 31, 2015 of $106.1 million in the Infrastructure segment, of which $105.7 million was for goodwill and $0.4 million was for an indefinite-lived trademark intangible asset. We also recorded a preliminary non-cash pre-tax impairment charge during the three months ended December 31, 2015 of $2.3 million in the Widia segment for an indefinite-lived trademark intangible asset. These impairment charges are recorded in restructuring and asset impairment charges in our consolidated statements of income.
2016 Divestiture Impact on Goodwill
During 2016, we completed the sale of non-core businesses. See Note 4. As a result of this transaction, goodwill decreased by $1.1 million and $6.5 million in our Industrial and Infrastructure segments, respectively. These decreases are recorded in loss on divestiture in our consolidated statements of income.
2016 Divestiture Impact on Other Intangible Assets
The divestiture of non-core businesses completed during 2016 resulted in a reduction of $30.0 million in customer-related, $15.4 million in unpatented technology, $5.0 million in indefinite-lived trademarks, $1.1 million in definite-lived trademarks, $0.8 million in technology-based and other and $0.5 million in contract-based.
43
2017 Reorganization Impact on Goodwill
At the beginning of fiscal 2017, we reorganized our operating structure in a manner that changed the composition of our reporting units. The Industrial and Widia reporting units in fiscal 2017 were formed from the fiscal 2016 Industrial reporting unit. In connection with this reporting unit realignment, during the first quarter of fiscal 2017 we updated our goodwill impairment assessment based on a quantitative analysis. We allocated our goodwill from the former Industrial segment to the current Industrial and Widia segments using a relative fair value approach. We evaluated the goodwill of our reporting units immediately prior to and after the realignment and concluded in both cases that there was no impairment.
We performed our annual goodwill and indefinite-lived intangible assets impairment test during the June quarter of fiscal 2018 and concluded that there was no impairment.
PENSION AND OTHER POSTRETIREMENT BENEFITS We sponsor these types of benefit plans for certain employees and retirees. Accounting for the cost of these plans requires the estimation of the cost of the benefits to be provided well into the future and attributing that cost over either the expected work life of employees or over average life of participants participating in these plans, depending on plan status and on participant population. This estimation requires our judgment about the discount rate used to determine these obligations, expected return on plan assets, rate of future compensation increases, rate of future health care costs, withdrawal and mortality rates and participant retirement age. Differences between our estimates and actual results may significantly affect the cost of our obligations under these plans.
In the valuation of our pension and other postretirement benefit liabilities, management utilizes various assumptions. Discount rates are derived by identifying a theoretical settlement portfolio of high quality corporate bonds sufficient to provide for a plan’s projected benefit payments. This rate can fluctuate based on changes in the corporate bond yields.
The long-term rate of return on plan assets is estimated based on an evaluation of historical returns for each asset category held by the plans, coupled with the current and short-term mix of the investment portfolio. The historical returns are adjusted for expected future market and economic changes. This return will fluctuate based on actual market returns and other economic factors.
The rate of future health care costs is based on historical claims and enrollment information projected over the next year and adjusted for administrative charges. This rate is expected to decrease until 2027.
Future compensation rates, withdrawal rates and participant retirement age are determined based on historical information. These assumptions are not expected to significantly change. Mortality rates are determined based on a review of published mortality tables.
EARNINGS PER SHARE Basic earnings per share is computed using the weighted average number of shares outstanding during the period, while diluted earnings per share is calculated to reflect the potential dilution that would occur related to the issuance of capital stock under stock option grants, performance awards and restricted stock units. The difference between basic and diluted earnings per share relates solely to the effect of capital stock options, performance awards and restricted stock units.
For purposes of determining the number of diluted shares outstanding, weighted average shares outstanding for basic earnings per share calculations were increased due solely to the dilutive effect of unexercised capital stock options, unvested performance awards and unvested restricted stock units by 1.2 million shares and 0.8 million shares for the fiscal year ended June 30, 2018 and 2017, respectively. Unexercised capital stock options, performance awards and restricted stock units of 0.4 million shares and 1.4 million shares for the fiscal year ended June 30, 2018 and 2017, respectively, were not included in the computation of diluted earnings per share because the option exercise price was greater than the average market price, and therefore the inclusion would have been anti-dilutive. In 2016, the effect of unexercised capital stock options, unvested performance awards and unvested restricted stock units was anti-dilutive as a result of a net loss in the periods and therefore has been excluded from diluted shares outstanding as well as from the diluted earnings per share calculation.
REVENUE RECOGNITION We recognize revenue for our products and assembled machines when title and all risks of loss and damages pass to the buyer. Our general conditions of sale explicitly state that the delivery of our products and assembled machines is freight on board shipping point and that title and all risks of loss and damage pass to the buyer upon delivery of the sold products or assembled machines to the common carrier.
We recognize revenue related to the sale of specialized assembled machines upon customer acceptance and installation, as installation is deemed essential to the functionality of a specialized assembled machine. Sales of specialized assembled machines were immaterial for 2018, 2017 and 2016.
44
Our general conditions of sale explicitly state that acceptance of the conditions of shipment are considered to have occurred unless written notice of objection is received by Kennametal within 10 calendar days of the date specified on the invoice. We do not ship products or assembled machines unless we have documentation from our customers authorizing shipment. The majority of our products are consumed by our customers in the manufacture of their products. Historically, we have experienced very low levels of returned products and assembled machines and do not consider the effect of returned products and assembled machines to be material. We have recorded an estimated returned goods allowance to provide for any potential returns.
We warrant that products and services sold are free from defects in material and workmanship under normal use and service when correctly installed, used and maintained. This warranty terminates 30 days after delivery of the product to the customer and does not apply to products that have been subjected to misuse, abuse, neglect or improper storage, handling or maintenance. Products may be returned to Kennametal, only after inspection and approval by Kennametal and upon receipt by the customer of shipping instructions from Kennametal. We have included an estimated allowance for warranty returns in our returned goods allowance.
STOCK-BASED COMPENSATION We recognize stock-based compensation expense for all stock options, restricted stock awards and restricted stock units over the period from the date of grant to the date when the award is no longer contingent on the employee providing additional service (substantive vesting period), net of expected forfeitures. We utilize the Black-Scholes valuation method to establish the fair value of all stock option awards. Time vesting stock units are valued at the market value of the stock on the grant date. Performance vesting stock units with a market condition are valued using a Monte Carlo model.
Capital stock options are granted to eligible employees at fair market value at the date of grant. Capital stock options are exercisable under specified conditions for up to 10 years from the date of grant. The Kennametal Inc. Stock and Incentive Plan of 2010, as Amended and Restated on October 22, 2013, and as further amended January 27, 2015 (A/R 2010 Plan) and the Kennametal Inc. 2016 Stock and Incentive Plan (2016 Plan) authorize the issuance of up to 9,500,000 shares of the Company’s capital stock plus any shares remaining unissued under the Kennametal Inc. Stock and Incentive Plan of 2002, as amended (2002 Plan). Under the provisions of the A/R 2010 Plan and 2016 Plan participants may deliver stock, owned by the holder for at least six months, in payment of the option price and receive credit for the fair market value of the shares on the date of delivery. The fair market value of shares delivered during 2018, 2017 and 2016 was immaterial. In addition to stock option grants, the A/R 2010 Plan and the 2016 Plan permit the award of stock appreciation rights, performance share awards, performance unit awards, restricted stock awards, restricted unit awards and share awards to directors, officers and key employees.
RESEARCH AND DEVELOPMENT COSTS Research and development costs of $38.9 million, $38.0 million and $39.4 million in 2018, 2017 and 2016, respectively, were expensed as incurred. These costs are included in operating expense in the consolidated statements of income.
SHIPPING AND HANDLING FEES AND COSTS All fees billed to customers for shipping and handling are classified as a component of sales. All costs associated with shipping and handling are classified as a component of cost of goods sold.
INCOME TAXES Deferred income taxes are recognized based on the future income tax effects (using enacted tax laws and rates) of differences in the carrying amounts of assets and liabilities for financial reporting and tax purposes. A valuation allowance is recognized if it is “more likely than not” that some or all of a deferred tax asset will not be realized.
DERIVATIVE INSTRUMENTS AND HEDGING ACTIVITIES As part of our financial risk management program, we use certain derivative financial instruments. We do not enter into derivative transactions for speculative purposes and, therefore, hold no derivative instruments for trading purposes. We use derivative financial instruments to provide predictability to the effects of changes in foreign exchange rates on our consolidated results, achieve our targeted mix of fixed and floating interest rates on our outstanding debt. Our objective in managing foreign exchange exposures with derivative instruments is to reduce volatility in cash flow, allowing us to focus more of our attention on business operations. With respect to interest rate management, these derivative instruments allow us to achieve our targeted fixed-to-floating interest rate mix, as a separate decision from funding arrangements, in the bank and public debt markets.
We account for derivative instruments as a hedge of the related asset, liability, firm commitment or anticipated transaction, when the derivative is specifically designated as a hedge of such items. We measure hedge effectiveness by assessing the changes in the fair value or expected future cash flows of the hedged item. The ineffective portions are recorded in other expense (income), net. Certain currency forward contracts hedging significant cross-border intercompany loans are considered other derivatives and, therefore, do not qualify for hedge accounting. These contracts are recorded at fair value in the balance sheet, with the offset to other expense (income), net.
45
CASH FLOW HEDGES Currency Forward contracts and range forward contracts (a transaction where both a put option is purchased and a call option is sold) are designated as cash flow hedges and hedge anticipated cash flows from cross-border intercompany sales of products and services. Gains and losses realized on these contracts are recorded in accumulated other comprehensive (loss) income, and are recognized as a component of other expense (income), net when the underlying sale of products or services is recognized into earnings.
FAIR VALUE HEDGES Interest Rate Fixed-to-floating interest rate swap contracts, designated as fair value hedges, are entered into from time to time to hedge our exposure to fair value fluctuations on a portion of our fixed rate debt. These interest rate swap contracts convert a portion of our fixed rate debt to floating rate debt. When in place, these contracts require periodic settlement, and the difference between amounts to be received and paid under the contracts is recognized in interest expense.
NET INVESTMENT HEDGES We designate financial instruments as net investment hedges from time to time to hedge the foreign exchange exposure of our net investment in foreign currency-based subsidiaries. The remeasurements of these non-derivatives designated as net investment hedges are calculated each period with changes reported in foreign currency translation adjustment within accumulated other comprehensive loss. Such amounts will remain in accumulated other comprehensive loss unless we complete or substantially complete liquidation or disposal of our investment in the underlying foreign operations.
CURRENCY TRANSLATION Assets and liabilities of international operations are translated into U.S. dollars using year-end exchange rates, while revenues and expenses are translated at average exchange rates throughout the year. The resulting net translation adjustments are recorded as a component of accumulated other comprehensive loss. The local currency is the functional currency of most of our locations. Losses of $6.4 million and $6.7 million and a gain of $1.6 million from currency transactions were included in other expense (income), net in 2018, 2017 and 2016, respectively.
NEW ACCOUNTING STANDARDS
Adopted
In March 2016, the Financial Accounting Standards Board (FASB) issued ASU No. 2016-09, "Improvements to Employee Share-Based Payment Accounting," which is intended to simplify equity-based award accounting and presentation. The guidance impacts income tax accounting related to equity-based awards, the classification of awards as either equity or liabilities, and the classification on the statement of cash flows. We adopted this guidance July 1, 2017. The adoption of this guidance resulted in three changes: (1) the increase to deferred tax assets of $1.4 million related to cumulative excess tax benefits previously unrecognized was offset by a valuation allowance, due to the valuation allowance position of our U.S. entity at the time of adoption of this standard; (2) excess tax benefits, previously reported in the financing activities section of the consolidated statements of cash flow, is now reported in the operating activities section, adopted on a prospective basis; therefore, prior period statements of cash flow were not retrospectively adjusted for this provision; and (3) employee taxes paid when Kennametal withholds shares for tax withholding purposes, previously reported in the operating activities section of the consolidated statement of cash flows, are now reported in the financing activities section, adopted on a retrospective basis; therefore, prior period statements of cash flow were retrospectively adjusted for this provision. Cash flow provided by operating activities and cash flow used for financing activities increased by $3.1 million and $3.2 million in 2017 and 2016, respectively.
In July 2015, the FASB issued ASU No. 2015-11, "Simplifying the Measurement of Inventory," which requires that inventory other than LIFO be subsequently measured at the lower of cost and net realizable value, as opposed to the previous practice of lower of cost or market. Subsequent measurement is unchanged for inventory measured using LIFO. We adopted this guidance July 1, 2017. Adoption of this guidance did not have a material impact on our consolidated financial statements.
Issued
In June 2018, the FASB issued ASU No. 2018-07, “Improvements to Nonemployee Share-Based Payment Accounting" which expands the scope of accounting for stock-based compensation to nonemployees. This guidance is effective for Kennametal July 1, 2019. We are in the process of assessing the impact the adoption of this guidance may have on our consolidated financial statements.
In February 2018, the FASB issued ASU No. 2018-02, “Reporting Comprehensive Income (Topic 220): Reclassification of Certain Tax Effects from Accumulated Other Comprehensive Income," which includes amendments related to the reclassification of the income tax effects of the Tax Cuts and Jobs Act of 2017 (TCJA) to improve the usefulness of information reported to financial statement users. The amendments in this update also require certain disclosures about stranded tax effects. This guidance is optional and is effective for Kennametal July 1, 2019, although early adoption is permitted. We are in the process of assessing the impact the adoption of this guidance may have on our consolidated financial statements and determining whether we will adopt this guidance.
46
In August 2017, the FASB issued ASU No. 2017-12, "Targeted Improvements to Accounting for Hedging Activities," which seeks to improve financial reporting and obtain closer alignment with risk management activities, in addition to simplifying the application of hedge accounting guidance and additional disclosures. This guidance is effective for Kennametal July 1, 2019. We are in the process of assessing the impact the adoption of this guidance may have on our consolidated financial statements.
In May 2017, the FASB issued ASU No. 2017-09, "Compensation—Stock Compensation (Topic 718): Scope of Modification Accounting," which clarifies when to account for a change to the terms or conditions of a share-based payment award as a modification. Under the new guidance, modification accounting is required only if the fair value, the vesting conditions, or the classification of the award (as equity or liability) changes as a result of the change in terms or conditions. This guidance is effective for Kennametal beginning July 1, 2018. We do not expect the adoption of this guidance to have a material effect on our consolidated financial statements.
In March 2017, the FASB issued ASU No. 2017-07, "Improving the Presentation of Net Periodic Pension Cost and Net Periodic Postretirement Benefit Cost," which requires that an employer report the service cost component in the same line item or items as other compensation costs arising from services rendered by the pertinent employees during the period. The other components of net benefit cost are required to be presented in the income statement separately from the service cost component and outside a subtotal of income from operations. This guidance is effective for Kennametal beginning July 1, 2018, with the amendments to be applied retrospectively. We expect to reclassify combined effects of pension income and postretirement benefit cost of approximately $17 million and $18 million out of operating income and into non-operating income for 2018 and 2017, respectively, when comparative financial information is presented going forward.
In October 2016, the FASB issued ASU No. 2016-16, "Intra-Entity Transfers of Assets Other Than Inventory," which clarifies that an entity should recognize the income tax consequences of an intra-entity transfer of an asset other than inventory when the transfer occurs. This guidance is effective for Kennametal beginning July 1, 2018. We do not expect the adoption of this guidance to have a material effect on our consolidated financial statements.
In August 2016, the FASB issued ASU No. 2016-15, "Classification of Certain Cash Receipts and Cash Payments (a consensus of the Emerging Issues Task Force)," which addresses eight specific cash flow issues with the objective of reducing the existing diversity in practice with respect to how these are classified in the statement of cash flows. This guidance is effective for Kennametal beginning July 1, 2018. We do not expect the adoption of this guidance to have a material effect on our consolidated financial statements.
In June 2016, the FASB issued ASU No. 2016-13, "Measurement of Credit Losses on Financial Instruments," which introduces an approach based on expected losses to estimate credit losses on certain types of financial instruments. Beyond other modifications in the update, the scope of this amendment includes valuation of trade receivables. This standard is effective for Kennametal beginning July 1, 2020. We are in the process of assessing the impact the adoption of this guidance will have on our consolidated financial statements.
In February 2016, the FASB issued ASU No. 2016-02, "Leases: Topic 842," which replaces the existing guidance in ASC 840, Leases. The standard establishes a right-of-use (ROU) model that requires a lessee to record a ROU asset and a lease liability on the balance sheet for all leases with terms longer than 12 months. Leases will be classified as either finance or operating, with classification affecting the pattern of expense recognition in the income statement. This standard is effective for Kennametal beginning July 1, 2019. We have a project team in place that will begin inventorying our leasing arrangements. We are in the process of assessing the impact the adoption of this guidance will have on our consolidated financial statements. As of June 30, 2018, our undiscounted future minimum payments outstanding for lease obligations were approximately $65 million.
In May 2014, the FASB issued ASU No. 2014-09, “Revenue from Contracts with Customers: Topic 606.” This ASU, along with subsequent complementary updates in ASU Nos. 2015-14, 2016-08, 2016-10 and 2016-12 among others, replaces nearly all existing U.S. GAAP guidance on revenue recognition. The standard prescribes a five-step model for recognizing revenue, the application of which will require significant judgment. It also requires additional disclosures. We adopted this standard on July 1, 2018 using the modified retrospective approach. We have a project team that has performed a detailed review of the terms and provisions in customer contracts, and concluded that the new standard will not affect the timing nor measurement of revenue for these contracts in comparison to the results of historical accounting policies and practices. We do not expect the adoption of this guidance to have a material effect on our consolidated financial statements other than additional disclosures.
47
NOTE 3 — SUPPLEMENTAL CASH FLOW DISCLOSURES
Year ended June 30 (in thousands) | 2018 | 2017 | 2016 | ||||||||
Cash paid during the period for: | |||||||||||
Income taxes | $ | 35,974 | $ | 16,755 | $ | 43,733 | |||||
Interest | 27,887 | 27,529 | 26,250 | ||||||||
Supplemental disclosure of non-cash information: | |||||||||||
Changes in accounts payable related to purchases of property, plant and equipment | 9,500 | (3,900 | ) | 1,000 | |||||||
NOTE 4 — DIVESTITURE
In 2016, we completed the transaction to sell all of the outstanding capital stock of: Kennametal Extrude Hone LLC and its wholly owned subsidiaries, Kennametal Stellite S.r.l. (Bellusco, Italy), Kennametal Stellite S.p.A. (Milan, Italy), Kennametal Stellite GmbH (Koblenz, Germany); and all of the assets of the businesses of: Tricon (manufacturing operations in Birmingham, Alabama; Chicago, Illinois; and Elko, Nevada), Landis (manufacturing operation in Waynesboro, Pennsylvania); and all of the assets located at the Biel, Switzerland manufacturing facility ("non-core businesses") to Madison Industries for an aggregate price of $56.1 million cash, net of cash. A portion of the transaction proceeds were used to pay down revolver debt and the remaining balance is being held as cash on hand.
The net book value of these non-core businesses was $191.9 million. The pre-tax net loss on divestiture recognized in 2016 was $131.5 million, of which $127.9 million and $3.6 million were recorded in the Infrastructure and Industrial segments, respectively. The pre-tax income attributable to the non-core businesses was assessed and determined to be immaterial for disclosure for the periods presented.
NOTE 5 — FAIR VALUE MEASUREMENTS
Fair value is defined as the price that would be received to sell an asset or paid to transfer a liability in an orderly transaction between market participants at the measurement date. The fair value hierarchy consists of three levels to prioritize the inputs used in valuations, as defined below:
Level 1: Unadjusted quoted prices in active markets that are accessible at the measurement date for identical, unrestricted assets or liabilities.
Level 2: Inputs other than quoted prices included within Level 1 that are observable for the asset or liability, either directly or indirectly, including quoted prices for similar assets or liabilities in active markets; quoted prices for identical or similar assets or liabilities in markets that are not active; inputs other than quoted prices that are observable for the asset or liability (e.g., interest rates); and inputs that are derived principally from or corroborated by observable market data by correlation or other means.
Level 3: Inputs that are unobservable.
As of June 30, 2018, the fair values of the Company’s financial assets and financial liabilities measured at fair value on a recurring basis are categorized as follows:
(in thousands) | Level 1 | Level 2 | Level 3 | Total | |||||||||||
Assets: | |||||||||||||||
Derivatives (1) | $ | — | $ | 1,665 | $ | — | $ | 1,665 | |||||||
Total assets at fair value | $ | — | $ | 1,665 | $ | — | $ | 1,665 | |||||||
Liabilities: | |||||||||||||||
Derivatives (1) | $ | — | $ | 207 | $ | — | $ | 207 | |||||||
Total liabilities at fair value | $ | — | $ | 207 | $ | — | $ | 207 | |||||||
48
As of June 30, 2017, the fair value of the Company’s financial assets and financial liabilities measured at fair value on a recurring basis are categorized as follows:
(in thousands) | Level 1 | Level 2 | Level 3 | Total | |||||||||||
Assets: | |||||||||||||||
Derivatives (1) | $ | — | $ | 359 | $ | — | $ | 359 | |||||||
Total assets at fair value | $ | — | $ | 359 | $ | — | $ | 359 | |||||||
Liabilities: | |||||||||||||||
Derivatives (1) | $ | — | $ | 910 | $ | — | $ | 910 | |||||||
Total liabilities at fair value | $ | — | $ | 910 | $ | — | $ | 910 | |||||||
(1) Currency derivatives are valued based on observable market spot and forward rates and are classified within Level 2 of the fair value hierarchy.
There have been no changes in classification and transfers between levels in the fair value hierarchy in the current period.
NOTE 6 — DERIVATIVE INSTRUMENTS AND HEDGING ACTIVITIES
As part of our financial risk management program, we use certain derivative financial instruments. See Note 2 for discussion on our derivative instruments and hedging activities policy.
The fair value of derivatives designated and not designated as hedging instruments in the consolidated balance sheet are as follows:
(in thousands) | 2018 | 2017 | |||||
Derivatives designated as hedging instruments | |||||||
Other current assets - range forward contracts | $ | 799 | $ | 1 | |||
Other current liabilities - range forward contracts | (5 | ) | (671 | ) | |||
Other assets - range forward contracts | 27 | — | |||||
Other liabilities - range forward contracts | — | (101 | ) | ||||
Total derivatives designated as hedging instruments | 821 | (771 | ) | ||||
Derivatives not designated as hedging instruments | |||||||
Other current assets - currency forward contracts | 839 | 358 | |||||
Other current liabilities - currency forward contracts | (202 | ) | (138 | ) | |||
Total derivatives not designated as hedging instruments | 637 | 220 | |||||
Total derivatives | $ | 1,458 | $ | (551 | ) | ||
Certain currency forward contracts that hedge significant cross-border intercompany loans are considered as other derivatives and therefore do not qualify for hedge accounting. These contracts are recorded at fair value in the consolidated balance sheet, with the offset to other expense (income), net. Gains related to derivatives not designated as hedging instruments have been recognized as follows:
(in thousands) | 2018 | 2017 | 2016 | ||||||||
Other expense (income), net - currency forward contracts | $ | (122 | ) | $ | (873 | ) | $ | 719 | |||
FAIR VALUE HEDGES
Fixed-to-floating interest rate swap contracts, designated as fair value hedges, are entered into from time to time to hedge our exposure to fair value fluctuations on a portion of our fixed rate debt. We had no such contracts outstanding at June 30, 2018 and June 30, 2017.
49
CASH FLOW HEDGES
Currency forward contracts and range forward contracts (a transaction where both a put option is purchased and a call option is sold) are designated as cash flow hedges and hedge anticipated cash flows from cross-border intercompany sales of products and services. Gains and losses realized on these contracts are recorded in accumulated other comprehensive loss, and are recognized as a component of other expense (income), net when the underlying sale of products or services is recognized into earnings. The notional amount of the contracts translated into U.S. dollars at June 30, 2018 and 2017 was $62.9 million and $75.3 million, respectively. The time value component of the fair value of range forward contracts is excluded from the assessment of hedge effectiveness. Assuming the market rates remain constant with the rates at June 30, 2018, we expect to recognize into earnings in the next 12 months $0.5 million of income on outstanding derivatives.
The following represents gains and losses related to cash flow hedges:
(in thousands) | 2018 | 2017 | 2016 | ||||||||
Losses recognized in other comprehensive income (loss), net | $ | (922 | ) | $ | (471 | ) | $ | (297 | ) | ||
Losses reclassified from accumulated other comprehensive loss into other expense (income), net | $ | 3,001 | $ | 1,557 | $ | 381 | |||||
No portion of the gains or losses recognized in earnings was due to ineffectiveness and no amounts were excluded from our effectiveness testing for the years ended June 30, 2018, 2017 and 2016.
NET INVESTMENT HEDGES
As of June 30, 2018, we had certain foreign currency-denominated intercompany loans payable with total aggregate principal amounts of €33.0 million designated as net investment hedges to hedge the foreign exchange exposure of our net investment in Euro-based subsidiaries. Losses of $0.7 million and $4.5 million were recorded as a component of foreign currency translation adjustments in other comprehensive income (loss) during 2018 and 2017, respectively. We did not have net investment hedges during 2016.
As of June 30, 2018, the foreign currency-denominated intercompany loans payable designated as net investment hedges consisted of:
Instrument | Notional (EUR in thousands)(2) | Notional (USD in thousands)(2) | Maturity | ||||
Foreign currency-denominated intercompany loan payable | € | 27,325 | $ | 31,819 | June 26, 2022 | ||
Foreign currency-denominated intercompany loan payable | 8,707 | 10,139 | November 20, 2018 | ||||
Foreign currency-denominated intercompany loan payable | 2,014 | 2,345 | October 11, 2019 | ||||
NOTE 7 — INVENTORIES
Inventories consisted of the following at June 30:
(in thousands) | 2018 | 2017 | |||||
Finished goods | $ | 279,240 | $ | 290,817 | |||
Work in process and powder blends | 232,973 | 166,857 | |||||
Raw materials | 96,859 | 87,627 | |||||
Inventories at current cost | 609,072 | 545,301 | |||||
Less: LIFO valuation | (83,606 | ) | (57,620 | ) | |||
Total inventories | $ | 525,466 | $ | 487,681 | |||
We used the LIFO method of valuing inventories for approximately 40 percent and 43 percent of total inventories at June 30, 2018 and 2017, respectively.
50
NOTE 8 — GOODWILL AND OTHER INTANGIBLE ASSETS
A summary of the carrying amount of goodwill attributable to each segment, as well as the changes in such, is as follows:
(in thousands) | Industrial | Widia | Infrastructure | Total | |||||||||||
Gross goodwill | $ | 408,705 | $ | 40,624 | $ | 633,211 | $ | 1,082,540 | |||||||
Accumulated impairment losses | (137,204 | ) | (13,638 | ) | (633,211 | ) | (784,053 | ) | |||||||
Balance as of June 30, 2016 | $ | 271,501 | $ | 26,986 | $ | — | $ | 298,487 | |||||||
Activity for 2017: | |||||||||||||||
Change in gross goodwill due to translation | 1,989 | 891 | — | 2,880 | |||||||||||
Gross goodwill | 410,694 | 41,515 | 633,211 | 1,085,420 | |||||||||||
Accumulated impairment losses | (137,204 | ) | (13,638 | ) | (633,211 | ) | (784,053 | ) | |||||||
Balance as of June 30, 2017 | $ | 273,490 | $ | 27,877 | $ | — | $ | 301,367 | |||||||
Activity for 2018: | |||||||||||||||
Change in gross goodwill due to translation | 764 | (329 | ) | — | 435 | ||||||||||
Gross goodwill | 411,458 | 41,186 | 633,211 | 1,085,855 | |||||||||||
Accumulated impairment losses | (137,204 | ) | (13,638 | ) | (633,211 | ) | (784,053 | ) | |||||||
Balance as of June 30, 2018 | $ | 274,254 | $ | 27,548 | $ | — | $ | 301,802 | |||||||
The components of our other intangible assets were as follows:
Estimated Useful Life (in years) | June 30, 2018 | June 30, 2017 | ||||||||||||||||
(in thousands) | Gross Carrying Amount | Accumulated Amortization | Gross Carrying Amount | Accumulated Amortization | ||||||||||||||
Contract-based | 3 to 15 | $ | 7,061 | $ | (7,036 | ) | $ | 7,064 | $ | (7,014 | ) | |||||||
Technology-based and other | 4 to 20 | 46,666 | (30,923 | ) | 46,461 | (29,061 | ) | |||||||||||
Customer-related | 10 to 21 | 206,162 | (85,301 | ) | 205,502 | (74,669 | ) | |||||||||||
Unpatented technology | 10 to 30 | 31,854 | (13,096 | ) | 31,754 | (10,589 | ) | |||||||||||
Trademarks | 5 to 20 | 12,450 | (8,978 | ) | 12,401 | (8,648 | ) | |||||||||||
Trademarks | Indefinite | 17,609 | — | 17,326 | — | |||||||||||||
Total | $ | 321,802 | $ | (145,334 | ) | $ | 320,508 | $ | (129,981 | ) | ||||||||
Amortization expense for intangible assets was $14.7 million, $16.6 million and $20.8 million for 2018, 2017 and 2016, respectively. Estimated amortization expense for 2019 through 2023 is $14.1 million, $13.9 million, $13.5 million, $13.1 million, and $12.9 million, respectively.
NOTE 9 — OTHER CURRENT LIABILITIES
Other current liabilities consisted of the following at June 30:
(in thousands) | 2018 | 2017 | ||||||
Accrued employee benefits | $ | 48,889 | $ | 39,478 | ||||
Accrued restructuring (Note 15) | 17,469 | 27,294 | ||||||
Payroll, state and local taxes | 10,146 | 9,943 | ||||||
Accrued legal and professional fees | 9,291 | 10,741 | ||||||
Accrued interest | 7,898 | 7,048 | ||||||
Other | 56,893 | 58,443 | ||||||
Total other current liabilities | $ | 150,586 | $ | 152,947 | ||||
51
NOTE 10 — LONG-TERM DEBT AND CAPITAL LEASES
Long-term debt and capital lease obligations consisted of the following at June 30:
(in thousands) | 2018 | 2017 | |||||
2.650% Senior Unsecured Notes due fiscal 2020, net of discount of $0.1 million for 2018 and $0.2 million for 2017 | $ | 399,898 | $ | 399,823 | |||
3.875% Senior Unsecured Notes due fiscal 2022, net of discount of $0.1 million for 2018 and $0.2 million for 2017 | 299,868 | 299,831 | |||||
4.625% Senior Unsecured Notes due fiscal 2028, net of discount of $2.2 million for 2018 | 297,813 | — | |||||
Capital leases with terms expiring through 2018 at 3.9% in 2017 | — | 190 | |||||
Total debt and capital leases | 997,579 | 699,844 | |||||
Less unamortized debt issuance costs | (6,808 | ) | (4,663 | ) | |||
Less current maturities: | |||||||
Long-term debt | (399,266 | ) | — | ||||
Capital leases | — | (190 | ) | ||||
Total long-term debt | $ | 591,505 | $ | 694,991 | |||
Senior Unsecured Notes On June 7, 2018, we issued $300.0 million of 4.625 percent Senior Unsecured Notes with a maturity date of June 15, 2028. Interest will be paid semi-annually on June 15 and December 15 of each year. We used the net proceeds from the offering of the notes, plus cash on hand, for the early extinguishment of our $400.0 million of 2.650 percent Senior Unsecured Notes in July of fiscal 2019. The $400.0 million of 2.650 percent Senior Unsecured Notes, with an original maturity date of November 1, 2019 ($400.0 million Notes), were reclassified to current maturities of long-term debt as of June 30, 2018, since our notification of early redemption to bondholders in June 2018 created an irrevocable commitment to redeem the debt. Interest on the 2019 Note was paid semi-annually on May 1 and November 1 of each year. On February 14, 2012, we issued $300 million of 3.875 percent Senior Unsecured Notes with a maturity date of February 15, 2022. Interest is paid semi-annually on February 15 and August 15 of each year.
Credit Agreement The five-year, multi-currency, revolving credit facility, as amended and restated in June 2018 (Credit Agreement) provides for revolving credit loans of up to $700.0 million for working capital, capital expenditures and general corporate purposes. The Credit Agreement matures in June 2023 and allows for borrowings in U.S. dollars, euros, Canadian dollars, pounds sterling and Japanese yen. Interest payable under the Credit Agreement is based upon the type of borrowing under the facility and may be (1) LIBOR plus an applicable margin, (2) the greater of the prime rate or the Federal Funds effective rate plus an applicable margin, or (3) fixed as negotiated by us.
The Credit Agreement requires us to comply with various restrictive and affirmative covenants, including two financial covenants: a maximum leverage ratio and a minimum consolidated interest coverage ratio (as those terms are defined in the Credit agreement). We were in compliance with all covenants as of June 30, 2018. We had no borrowings outstanding under the Credit Agreement as of June 30, 2018 and 2017. Borrowings under the Credit Agreement are guaranteed by our significant domestic subsidiaries.
Future principal maturities of long-term debt are $300 million in 2022 and $300 million in 2028.
At June 30, 2017, our collateralized debt consisted of capitalized lease obligations of $0.2 million. The underlying assets collateralized these obligations.
NOTE 11 — NOTES PAYABLE AND LINES OF CREDIT
Notes payable to banks of $0.9 million and $0.7 million at June 30, 2018 and 2017, respectively, represents short-term borrowings under credit lines with commercial banks. These credit lines, translated into U.S. dollars at June 30, 2018 exchange rates, totaled $71.9 million at June 30, 2018, of which $71.0 million was unused. The weighted average interest rate for notes payable and lines of credit was 25.0 percent and 13.8 percent at June 30, 2018 and 2017, respectively.
52
NOTE 12 — INCOME TAXES
Income (loss) before income taxes consisted of the following for the years ended June 30:
(in thousands) | 2018 | 2017 | 2016 | ||||||||
Income (loss) before income taxes: | |||||||||||
United States | $ | 57,109 | $ | (23,055 | ) | $ | (228,667 | ) | |||
International | 217,932 | 104,930 | 30,096 | ||||||||
Total income (loss) before income taxes | $ | 275,041 | $ | 81,875 | $ | (198,571 | ) | ||||
Current income taxes: | |||||||||||
Federal | $ | 3,755 | $ | (1,455 | ) | $ | (15,039 | ) | |||
State | (816 | ) | 172 | 454 | |||||||
International | 44,127 | 24,911 | 31,570 | ||||||||
Total current income taxes | 47,066 | 23,628 | 16,985 | ||||||||
Deferred income taxes: | |||||||||||
Federal | $ | 1,121 | $ | 298 | $ | 6,786 | |||||
State | 3,552 | (867 | ) | 8,407 | |||||||
International | 18,242 | 6,836 | (6,865 | ) | |||||||
Total deferred income taxes: | 22,915 | 6,267 | 8,328 | ||||||||
Provision for income taxes | $ | 69,981 | $ | 29,895 | $ | 25,313 | |||||
Effective tax rate | 25.4 | % | 36.5 | % | (12.7 | )% | |||||
On December 22, 2017, the Tax Cuts and Jobs Act of 2017 (TCJA) was signed into law in the U.S. TCJA amends the Internal Revenue Code of 1986 to reduce tax rates and modify policies, credits and deductions for individuals and corporations. For corporations, TCJA reduces the federal tax rate from a maximum of 35.0 percent to a flat 21.0 percent rate and eliminates U.S. federal taxes on most future foreign earnings. TCJA also adds many new provisions including changes to bonus depreciation, the deduction for executive compensation and interest expense, a tax on global intangible low-taxed income (GILTI), the base erosion anti-abuse tax (BEAT) and a deduction for foreign-derived intangible income (FDII). We are assessing the impact of certain provisions, including the tax on GILTI, the BEAT and the deduction for FDII, which do not apply to the Company until fiscal 2019. This assessment includes the evaluation of our accounting election relative to GILTI as either a period cost or an adjustment to deferred tax assets or liabilities of our foreign subsidiaries for the new tax. The two material items that effect the Company for fiscal 2018 are the reduction in the tax rate and a one-time tax that is imposed on our unremitted foreign earnings (toll tax).
On December 22, 2017, the SEC issued Staff Accounting Bulletin 118 (SAB 118) that includes additional guidance allowing companies to use a measurement period, similar to that used in business combinations, to account for the impacts of TCJA in their financial statements. We have accounted for the impacts of TCJA to the extent a reasonable estimate could be made during the year ended June 30, 2018. We will continue to refine our estimates throughout the measurement period, which will not extend beyond 12 months from the enactment of TCJA, or until the accounting is complete.
The U.S. federal tax rate reduction is effective as of January 1, 2018. As a June 30 fiscal year-end taxpayer, our 2018 fiscal year U.S. federal statutory tax rate is a blended rate of 28.1 percent. We expect our U.S. federal statutory tax rate to be 21.0 percent in 2019.
During 2018, we estimated the toll tax charge to be $80.9 million after available foreign tax credits. The toll tax charge consumed our entire U.S. federal net operating loss carryforward and other credit carryforwards, which represent a significant portion of our previously available deferred tax assets, and was offset by the release of the valuation allowance associated with these assets. We estimate a cash payment of $3.5 million associated with the toll charge which will be paid over eight years, of which $3.2 million is classified as long-term accrued income taxes in our consolidated balance sheet as of June 30, 2018. The toll tax charge is preliminary, and subject to finalization of the 2018 U.S. federal income tax return and applying any additional regulatory guidance issued after June 30, 2018.
53
The reconciliation of income taxes computed using the statutory U.S. income tax rate and the provision for income taxes was as follows for the years ended June 30:
(in thousands) | 2018 | 2017 | 2016 | ||||||||
Income taxes at U.S. statutory rate | $ | 77,286 | $ | 28,656 | $ | (69,500 | ) | ||||
State income taxes, net of federal tax benefits | 2,975 | (306 | ) | 859 | |||||||
U.S. income taxes provided on international income | 1,010 | 10,273 | 2,364 | ||||||||
Combined tax effects of international income | (9,333 | ) | (11,530 | ) | (25,469 | ) | |||||
Impact of goodwill impairment charges | — | — | 6,439 | ||||||||
Impact of divestiture | — | — | 27,790 | ||||||||
Change in valuation allowance and other uncertain tax positions | (90,817 | ) | 5,163 | 84,530 | |||||||
Impact of domestic production activities deduction | — | — | (2,072 | ) | |||||||
Research and development credit | (3,141 | ) | (1,895 | ) | (4,351 | ) | |||||
Change in permanent reinvestment assertion | — | — | 3,659 | ||||||||
Combined effects of tax reform | 86,044 | — | — | ||||||||
Adjustment to deferred tax charges on intra-entity transfers | 5,297 | — | — | ||||||||
Other | 660 | (466 | ) | 1,064 | |||||||
Provision for income taxes | $ | 69,981 | $ | 29,895 | $ | 25,313 | |||||
During 2018, we recorded a charge for the combined effects of tax reform of $86.0 million, which includes $80.9 million for the toll tax charge and a net charge in our U.S. provision of $5.1 million for revaluation of U.S. net deferred taxes. The impact of these items is included in the tax reconciliation table under the caption “Combined effects of tax reform.” The revaluation of U.S. net deferred taxes is preliminary and subject to finalization of the 2018 U.S. federal income tax return.
During 2018, we released $91.3 million of the U.S. valuation allowance that was previously recorded against our net deferred tax assets in the U.S., including deferred tax assets related to items of Other Comprehensive Income. The valuation allowance release was triggered by utilization of a significant portion of our deferred tax assets to satisfy the toll tax provision in TCJA.
During 2017, we recorded a valuation allowance against the net deferred tax assets of our Australian subsidiary. The impact of the valuation allowance was approximately $1.3 million and is included in the tax reconciliation table under the caption "change in valuation allowance and other uncertain tax positions."
During 2016, we recorded a valuation allowance against our net domestic deferred tax assets of $105.9 million, as discussed below. Of this amount, $81.2 million impacted the effective tax rate and is included in the income tax reconciliation table under the caption "change in valuation allowance and other uncertain tax positions," and $24.7 million was recorded in other comprehensive income.
During 2016, we recorded goodwill impairment charges related to our Infrastructure segment for which there was no tax benefit for a portion of the charges. The federal effect of these permanent differences is included in the income tax reconciliation table under the caption "impact of goodwill impairment charges."
During 2016, we divested certain non-core businesses as described in Note 4. A portion of the loss from this divestiture was not deductible for tax purposes. The Federal effect of this permanent difference is included in the income tax reconciliation table under the caption "impact of divestiture."
During 2016 we recorded an adjustment of $3.7 million related to a change in assertion of certain foreign subsidiaries' undistributed earnings primarily related to the transaction described in Note 4, which are no longer considered permanently reinvested. The effect of this charge is included in the income tax reconciliation table under the caption "change in permanent reinvestment assertion."
54
The components of net deferred tax assets and (liabilities) were as follows at June 30:
(in thousands) | 2018 | 2017 | |||||
Deferred tax assets: | |||||||
Net operating loss (NOL) carryforwards | $ | 39,884 | $ | 81,920 | |||
Inventory valuation and reserves | 10,023 | 20,428 | |||||
Pension benefits | 15,750 | 24,824 | |||||
Other postretirement benefits | 3,996 | 5,959 | |||||
Accrued employee benefits | 15,697 | 18,409 | |||||
Other accrued liabilities | 9,386 | 8,609 | |||||
Hedging activities | 1,477 | 5,409 | |||||
Tax credits and other carryforwards | 644 | 37,603 | |||||
Intangible assets | — | 14,947 | |||||
Total | 96,857 | 218,108 | |||||
Valuation allowance | (21,629 | ) | (116,770 | ) | |||
Total deferred tax assets | $ | 75,228 | $ | 101,338 | |||
Deferred tax liabilities: | |||||||
Tax depreciation in excess of book | $ | 77,106 | $ | 83,258 | |||
Intangible assets | 537 | — | |||||
Other | 7,561 | 4,614 | |||||
Total deferred tax liabilities | $ | 85,204 | $ | 87,872 | |||
Total net deferred tax assets | $ | (9,976 | ) | $ | 13,466 | ||
As noted previously, TCJA reduced the statutory Federal income tax rate from 35.0 percent to 21.0 percent. The table above reflects deferred taxes calculated using the U.S. Federal rates, which was at the 21.0 percent rate and at 35.0 percent rate as of June 30, 2018 and 2017, respectively.
We revised NOL carryforwards, tax credits and other carryforwards and accrued employee benefits in our components of net deferred tax assets as of June 30, 2017 to correct a prior period classification error. This correction resulted in a decrease to NOL carryforwards and to tax credits and other carryforwards of $3.7 million and $3.4 million, respectively, and an increase to accrued employee benefits of $7.1 million. This misstatement was not material to our current or any prior period financial statements.
During 2018, we identified an error related to the tax rate that had historically been used to calculate the deferred tax charge on intra-entity product transfers. This resulted in an overstatement of deferred tax assets of $8.2 million as of June 30, 2017. During 2018, $2.9 million of this amount was corrected in connection with the release of the U.S. valuation allowance. Therefore, the out of period adjustment recorded resulted in a further increase of $5.3 million to the provision for income taxes during 2018. The remaining balance related to this item was reclassified and included in other current assets. The impact to the effective tax rate was 1.9 percent in 2018. After evaluation, we determined that the impact of the adjustment was not material to the previously issued financial statements, nor are the out of period adjustments material to the 2018 results.
Valuation allowances are recorded to reduce deferred tax assets when it is more likely than not (greater than 50 percent) that a tax benefit will not be realized. In evaluating the need for a valuation allowance, we consider all potential sources of taxable income, including income available in carryback periods, future reversals of taxable temporary differences, projections of taxable income, and income from tax planning strategies, as well as all available positive and negative evidence. Positive evidence includes factors such as a history of profitable operations, and projections of future profitability within the carry forward period, including taxable income from tax planning strategies. Negative evidence includes items such as cumulative losses, projections of future losses, or carryforward periods that are not long enough to allow for the utilization of the deferred tax asset based on existing projections of income. Upon changes in facts and circumstances, we may conclude that deferred tax assets for which no valuation allowance is currently recorded may not be realized, resulting in a future charge to establish a valuation allowance. Existing valuation allowances are re-examined under the same standards of positive and negative evidence. If it is determined that it is more likely than not that a deferred tax asset will be realized, the appropriate amount of the valuation allowance, if any, is released.
55
In 2016, we recorded a valuation allowance of $105.9 million against our net deferred tax assets in the U.S. Of this amount, $81.2 million was recorded in the provision for income taxes and $24.7 million was recorded in other comprehensive income. After weighing all available positive and negative evidence, as previously described, we determined that it was no longer more likely than not that we will realize the tax benefit of these deferred tax assets. This was driven by cumulative pre-tax domestic losses from charges related to asset impairment, restructuring and loss on divestiture, as well as an overall decrease in demand in U.S. operations. During 2018, we released $91.3 million of the valuation allowance, which was triggered by utilization of a significant portion of our deferred tax assets to satisfy the toll tax provision in TCJA. A valuation allowance on certain state NOLs in the amount of $13.4 million remains recorded on our U.S. deferred tax assets.
Included in deferred tax assets at June 30, 2018 is $0.6 million associated with tax credits and other carryforward items primarily in federal and state jurisdictions. Of that amount, $0.3 million expires through 2023 and $0.3 million expires through 2028.
Included in deferred tax assets at June 30, 2018 is $39.9 million associated with NOL carryforwards in state and foreign jurisdictions. Of that amount, $11.0 million expires through 2023, $2.9 million expires through 2028, $2.9 million expires through 2033, $4.6 million expires through 2038, and the remaining $18.5 million does not expire. The realization of these tax benefits is primarily dependent on future taxable income in these jurisdictions.
A valuation allowance of $21.6 million has been placed against deferred tax assets in the U.S., Brazil, the Netherlands, Hong Kong and Australia, all of which would be allocated to income tax expense upon realization of the deferred tax assets. As the respective operations generate sufficient income, the valuation allowances will be partially or fully reversed at such time we believe it will be more likely than not that the deferred tax assets will be realized. In 2018, the valuation allowance related to these deferred tax assets decreased by $95.1 million, due primarily to the release of the valuation allowance against most of our U.S. deferred tax assets.
We consider substantially all of the unremitted earnings of our non-U.S. subsidiaries to be permanently reinvested. As a result of TCJA, which among other provisions allows for a 100 percent dividends received deduction from controlled foreign subsidiaries, we are in the process of re-evaluating our assertion with respect to permanent reinvestment. As part of this evaluation, we are considering our global working capital and capital investment requirements, among other considerations, including the potential tax liabilities that would be incurred if the non-U.S. subsidiaries distribute cash to the U.S. parent. If we determine that an entity should no longer remain subject to the permanent reinvestment assertion, we will accrue additional tax charges, including but not limited to state income taxes, withholding taxes, U.S. tax on foreign currency gains and losses and other relevant foreign taxes in the period the conclusion is determined. As of June 30, 2018, the unremitted earnings and profits of our non-U.S. subsidiaries and affiliates is approximately $1.3 billion. This amount has been subject to U.S. federal income tax, but may remain subject to state and foreign taxes if repatriated. In accordance with SAB 118, we expect to complete our evaluation by December 22, 2018.
A reconciliation of the beginning and ending amount of unrecognized tax benefits (excluding interest) is as follows as of June 30:
(in thousands) | 2018 | 2017 | 2016 | |||||||||
Balance at beginning of year | $ | 2,632 | $ | 3,106 | $ | 14,619 | ||||||
Increases for tax positions of prior years | 3,409 | — | 1,197 | |||||||||
Decreases related to settlement with taxing authority | — | (231 | ) | (11,942 | ) | |||||||
Decreases related to lapse of statute of limitations | (289 | ) | (184 | ) | (667 | ) | ||||||
Foreign currency translation | 23 | (59 | ) | (101 | ) | |||||||
Balance at end of year | $ | 5,775 | $ | 2,632 | $ | 3,106 | ||||||
The total amount of unrecognized tax benefits that, if recognized, would affect the effective tax rate in 2018, 2017 and 2016 is $5.8 million, $2.6 million and $3.1 million, respectively. Our policy is to recognize interest and penalties related to income taxes as a component of the provision for income taxes in the consolidated statement of income. We recognized increases in interest of $0.7 million and $0.2 million in 2018 and 2017, respectively, and a reduction in interest of $0.2 million in 2016. As of June 30, 2018 and 2017 the amount of interest accrued was $1.1 million and $0.5 million, respectively. As of June 30, 2018 and 2017, the amount of penalty accrued was $0.1 million.
In 2016, decreases for tax positions primarily relate to one foreign tax position. We settled this position with the foreign authority. A corresponding deferred tax asset in the amount of $11.9 million was released for the position in the U.S. and in the prior year this amount was included in the components of net deferred tax liabilities and assets table under the caption "other."
56
With few exceptions, we are no longer subject to income tax examinations by tax authorities for years prior to 2011. The Internal Revenue Service has audited all U.S. tax years prior to 2015. Various state and foreign jurisdiction tax authorities are in the process of examining our income tax returns for various tax years ranging from 2011 to 2015. We continue to execute our pan-European business model. As a result of this and other matters, we continuously review our uncertain tax positions and evaluate any potential issues that may lead to an increase or decrease in the total amount of unrecognized tax benefits recorded.
We believe that it is reasonably possible that the amount of unrecognized tax benefits could decrease by approximately $3.1 million within the next twelve months.
NOTE 13 — PENSION AND OTHER POSTRETIREMENT BENEFITS
Defined Benefit Pension Plans
We have defined benefit pension plans that cover certain employees in the U.S., Germany, the UK and Canada. Pension benefits under defined benefit pension plans are based on years of service and, for certain plans, on average compensation for specified years preceding retirement. We fund pension costs in accordance with the funding requirements of the Employee Retirement Income Security Act of 1974 (ERISA), as amended, for U.S. plans and in accordance with local regulations or customs for non-U.S. plans. Beginning in 2017, the accrued benefit for all participants in the Kennametal Inc. Retirement Income Plan is frozen as the result of amendment. The majority of our defined benefit pension plans are closed to future participation.
We have an Executive Retirement Plan for various executives and a Supplemental Executive Retirement Plan both of which have been closed to future participation on June 15, 2017 and July 26, 2006, respectively.
We presently provide varying levels of postretirement health care and life insurance benefits to certain employees and retirees. Postretirement health care benefits are available to employees and their spouses retiring on or after age 55 with 10 or more years of service. Beginning with retirements on or after January 1, 1998, our portion of the costs of postretirement health care benefits is capped at 1996 levels. Beginning with retirements on or after January 1, 2009, we have no obligation to provide a company subsidy for retiree medical costs. Postretirement health and life benefits are closed to future participants as of December 31, 2016.
We use a June 30 measurement date for all of our plans.
57
The funded status of our pension plans and amounts recognized in the consolidated balance sheets as of June 30 were as follows:
(in thousands) | 2018 | 2017 | |||||
Change in benefit obligation: | |||||||
Benefit obligation, beginning of year | $ | 941,094 | $ | 1,005,368 | |||
Service cost | 1,635 | 2,908 | |||||
Interest cost | 30,751 | 31,113 | |||||
Participant contributions | 3 | 8 | |||||
Actuarial gains | (24,501 | ) | (19,660 | ) | |||
Benefits and expenses paid | (47,212 | ) | (70,257 | ) | |||
Currency translation adjustments | 3,876 | (1,045 | ) | ||||
Special termination benefits | — | 98 | |||||
Plan settlements | (2,935 | ) | (7,439 | ) | |||
Benefit obligation, end of year | $ | 902,711 | $ | 941,094 | |||
Change in plans' assets: | |||||||
Fair value of plans' assets, beginning of year | $ | 808,635 | $ | 821,675 | |||
Actual return on plans' assets | 24,931 | 56,818 | |||||
Company contributions | 7,999 | 11,960 | |||||
Participant contributions | 3 | 8 | |||||
Plan settlements | (2,935 | ) | (7,439 | ) | |||
Benefits and expenses paid | (47,212 | ) | (70,257 | ) | |||
Currency translation adjustments | 1,337 | (4,130 | ) | ||||
Fair value of plans' assets, end of year | $ | 792,758 | $ | 808,635 | |||
Funded status of plans | $ | (109,953 | ) | $ | (132,459 | ) | |
Amounts recognized in the balance sheet consist of: | |||||||
Long-term prepaid benefit | $ | 42,543 | $ | 17,208 | |||
Short-term accrued benefit obligation | (6,699 | ) | (5,713 | ) | |||
Accrued pension benefits | (145,797 | ) | (143,954 | ) | |||
Net amount recognized | $ | (109,953 | ) | $ | (132,459 | ) | |
The pre-tax amounts related to our defined benefit pension plans recognized in accumulated other comprehensive loss were as follows at June 30:
(in thousands) | 2018 | 2017 | |||||
Unrecognized net actuarial losses | $ | 247,230 | $ | 246,428 | |||
Unrecognized net prior service credits | 723 | 580 | |||||
Unrecognized transition obligations | 539 | 622 | |||||
Total | $ | 248,492 | $ | 247,630 | |||
Prepaid pension benefits are included in other long-term assets. The assets of our U.S. and international defined benefit pension plans consist principally of capital stocks, corporate bonds and government securities.
To the best of our knowledge and belief, the asset portfolios of our defined benefit pension plans do not contain our capital stock. We do not issue insurance contracts to cover future annual benefits of defined benefit pension plan participants. Transactions between us and our defined benefit pension plans include the reimbursement of plan expenditures incurred by us on behalf of the plans. To the best of our knowledge and belief, the reimbursement of cost is permissible under current ERISA rules or local government law. The accumulated benefit obligation for all defined benefit pension plans was $902.1 million and $940.9 million as of June 30, 2018 and 2017, respectively.
58
Included in the above information are plans with accumulated benefit obligations exceeding the fair value of plan assets as of June 30 as follows:
(in thousands) | 2018 | 2017 | |||||
Projected benefit obligation | $ | 152,485 | $ | 156,816 | |||
Accumulated benefit obligation | 151,871 | 156,590 | |||||
Fair value of plan assets | — | 7,083 | |||||
The components of net periodic pension income include the following as of June 30:
(in thousands) | 2018 | 2017 | 2016 | ||||||||
Service cost | $ | 1,635 | $ | 2,908 | $ | 4,640 | |||||
Interest cost | 30,751 | 31,113 | 37,726 | ||||||||
Expected return on plans' assets | (56,579 | ) | (58,781 | ) | (58,523 | ) | |||||
Amortization of transition obligation | 94 | 89 | 80 | ||||||||
Amortization of prior service cost | 48 | (452 | ) | (417 | ) | ||||||
Special termination benefit charge | — | 98 | 334 | ||||||||
Settlement loss | 626 | 379 | 227 | ||||||||
Recognition of actuarial losses | 6,907 | 8,356 | 7,286 | ||||||||
Net periodic pension income | $ | (16,518 | ) | $ | (16,290 | ) | $ | (8,647 | ) | ||
As of June 30, 2018, the projected benefit payments, including future service accruals for these plans for 2019 through 2023, are $49.3 million, $50.1 million, $51.8 million, $52.3 million and $54.1 million, respectively, and $280.1 million in 2024 through 2028.
The amounts of accumulated other comprehensive loss expected to be recognized in net periodic pension cost during 2019 related to net actuarial losses and transition obligations are $6.8 million and $0.1 million, respectively. The amount of accumulated other comprehensive income expected to be recognized in net periodic pension cost during 2019 related to prior service credit is immaterial.
We expect to contribute approximately $8.1 million to our pension plans in 2019.
Other Postretirement Benefit Plans
The funded status of our other postretirement benefit plans and the related amounts recognized in the consolidated balance sheets were as follows:
(in thousands) | 2018 | 2017 | |||||
Change in benefit obligation: | |||||||
Benefit obligation, beginning of year | $ | 18,160 | $ | 20,542 | |||
Interest cost | 629 | 673 | |||||
Actuarial losses | (323 | ) | (747 | ) | |||
Benefits paid | (2,208 | ) | (2,308 | ) | |||
Plan amendments | (935 | ) | — | ||||
Benefit obligation, end of year | $ | 15,323 | $ | 18,160 | |||
Funded status of plan | $ | (15,323 | ) | $ | (18,160 | ) | |
Amounts recognized in the balance sheet consist of: | |||||||
Short-term accrued benefit obligation | $ | (1,598 | ) | $ | (1,254 | ) | |
Accrued postretirement benefits | (13,725 | ) | (16,906 | ) | |||
Net amount recognized | $ | (15,323 | ) | $ | (18,160 | ) | |
59
The pre-tax amounts related to our other postretirement benefit plans which were recognized in accumulated other comprehensive loss were as follows at June 30:
(in thousands) | 2018 | 2017 | |||||
Unrecognized net actuarial losses | $ | 4,662 | $ | 5,266 | |||
Unrecognized net prior service credits | (1,041 | ) | (128 | ) | |||
Total | $ | 3,621 | $ | 5,138 | |||
The components of net periodic other postretirement benefit cost include the following for the years ended June 30:
(in thousands) | 2018 | 2017 | 2016 | ||||||||
Interest cost | 629 | 673 | 840 | ||||||||
Amortization of prior service credit | (22 | ) | (22 | ) | (22 | ) | |||||
Recognition of actuarial loss | 280 | 355 | 324 | ||||||||
Net periodic other postretirement benefit cost | $ | 887 | $ | 1,006 | $ | 1,142 | |||||
As of June 30, 2018, the projected benefit payments, including future service accruals for our other postretirement benefit plans for 2019 through 2023, are $1.6 million, $1.5 million, $1.4 million, $1.4 million and $1.3 million, respectively, and $5.4 million in 2024 through 2028.
The amounts of accumulated other comprehensive loss expected to be recognized in net periodic pension cost during 2019 related to net actuarial losses are $0.2 million. The amount of accumulated other comprehensive income expected to be recognized in net periodic pension cost during 2019 related to prior service credit is $0.1 million.
We expect to contribute approximately $1.6 million to our postretirement benefit plans in 2019.
Assumptions
The significant actuarial assumptions used to determine the present value of net benefit obligations for our defined benefit pension plans and other postretirement benefit plans were as follows:
2018 | 2017 | 2016 | |||||
Discount Rate: | |||||||
U.S. plans | 4.0-4.3% | 3.3-3.9% | 2.4-3.7% | ||||
International plans | 1.8-3.3% | 2.0-3.3% | 0.9-3.2% | ||||
Rates of future salary increases: | |||||||
U.S. plans | 4.0 | % | 4.0 | % | 3.0-4.0% | ||
International plans | 2.5-3.0% | 2.5-3.0% | 2.5-3.0% | ||||
The significant assumptions used to determine the net periodic (income) cost for our pension and other postretirement benefit plans were as follows:
2018 | 2017 | 2016 | ||||||
Discount Rate: | ||||||||
U.S. plans | 3.3-3.9% | 2.4-3.7% | 3.2-4.5% | |||||
International plans | 2.0-3.3% | 0.9-3.2% | 2.3-3.8% | |||||
Rates of future salary increases: | ||||||||
U.S. plans | 4.0 | % | 3.0-4.0% | 3.0-4.0% | ||||
International plans | 2.5-3.0% | 2.5-3.0% | 2.5-3.0% | |||||
Rate of return on plans assets: | ||||||||
U.S. plans | 7.3 | % | 7.5 | % | 7.5 | % | ||
International plans | 5.3 | % | 5.3-5.5% | 5.3-5.5% | ||||
The rates of return on plan assets are based on historical performance, as well as future expected returns by asset class considering macroeconomic conditions, current portfolio mix, long-term investment strategy and other available relevant information.
60
The annual assumed rate of increase in the per capita cost of covered benefits (the health care cost trend rate) for our postretirement benefit plans was as follows:
2018 | 2017 | 2016 | ||||||
Health care costs trend rate assumed for next year | 7.5 | % | 8.0 | % | 8.5 | % | ||
Rate to which the cost trend rate gradually declines | 5.0 | % | 5.0 | % | 5.0 | % | ||
Year that the rate reaches the rate at which it is assumed to remain | 2027 | 2027 | 2027 | |||||
A change of one percentage point in the assumed health care cost trend rates would have the following effects on the total service and interest cost components of our other postretirement cost and other postretirement benefit obligation at June 30, 2018:
(in thousands) | 1% Increase | 1% Decrease | |||||
Effect on total service and interest cost components | $ | 27 | $ | (24 | ) | ||
Effect on other postretirement obligation | 492 | (437 | ) | ||||
Plan Assets
The primary objective of certain of our pension plans' investment policies is to ensure that sufficient assets are available to provide the benefit obligations at the time the obligations come due. The overall investment strategy for the defined benefit pension plans' assets combine considerations of preservation of principal and moderate risk-taking. The assumption of an acceptable level of risk is warranted in order to achieve satisfactory results consistent with the long-term objectives of the portfolio. Fixed income securities comprise a significant portion of the portfolio due to their plan-liability-matching characteristics and to address the plans' cash flow requirements. Additionally, diversification of investments within each asset class is utilized to further reduce the impact of losses in single investments.
Investment management practices must comply with ERISA and all applicable regulations and rulings thereof. The use of derivative instruments is permitted where appropriate and necessary for achieving overall investment policy objectives. Currently, the use of derivative instruments is not significant when compared to the overall investment portfolio.
The Company utilizes a liability driven investment strategy (LDI) for the assets of its U.S. defined benefit pension plans in order to reduce the volatility of the funded status of these plans and to meet the obligations at an acceptable cost over the long term. This LDI strategy entails modifying the asset allocation and duration of the assets of the plans to more closely match the liability profile of these plans. The asset reallocation involves increasing the fixed income allocation, reducing the equity component and adding alternative investments. Longer duration interest rate swaps have been utilized periodically in order to increase the overall duration of the asset portfolio to more closely match the liabilities.
Our defined benefit pension plans’ asset allocations as of June 30, 2018 and 2017 and target allocations for 2019, by asset class, were as follows:
2018 | 2017 | Target % | ||||||
Equity | 28 | % | 27 | % | 24 | % | ||
Fixed Income | 62 | 63 | 69 | |||||
Other | 11 | 10 | 7 | |||||
The following sections describe the valuation methodologies used by the trustee to measure the fair value of the defined benefit pension plan assets, including an indication of the level in the fair value hierarchy in which each type of asset is generally classified (see Note 5 for the definition of fair value and a description of the fair value hierarchy).
Corporate fixed income securities Investments in corporate fixed income securities consist of corporate debt and asset backed securities. These investments are classified as level two and are valued using independent observable market inputs such as the treasury curve, swap curve and yield curve.
Common stock Common stocks are classified as level one and are valued at their quoted market price.
Government securities Investments in government securities consist of fixed income securities such as U.S. government and agency obligations and foreign government bonds and asset and mortgage backed securities such as obligations issued by government sponsored organizations. These investments are classified as level two and are valued using independent observable market inputs such as the treasury curve, credit spreads and interest rates.
61
Other fixed income securities Investments in other fixed income securities are classified as level two and valued based on observable market data.
Other Other investments consist primarily of a hedge fund, in addition to state and local obligations and short term investments including cash, corporate notes, and various short term debt instruments which can be redeemed within a nominal redemption notice period. These investments are primarily classified as level two and are valued using independent observable market inputs.
The fair value methods described may not be reflective of future fair values. Additionally, while the Company believes the valuation methods used by the plans’ trustee are appropriate and consistent with other market participants, the use of different methodologies or assumptions to determine the fair value of certain financial instruments could result in different fair value measurement at the reporting date.
The following table presents the fair value of the benefit plan assets by asset category as of June 30, 2018:
(in thousands) | Level 1 | Level 2 | Level 3 | NAV(3) | Total | ||||||||||||||
Common / collective trusts (3): | |||||||||||||||||||
Value funds | $ | — | $ | — | $ | — | $ | 74,070 | $ | 74,070 | |||||||||
Growth funds | — | — | — | 49,438 | 49,438 | ||||||||||||||
Balanced funds | — | — | — | 11,854 | 11,854 | ||||||||||||||
Corporate fixed income securities | — | 350,394 | — | — | 350,394 | ||||||||||||||
Common stock | 83,361 | — | — | — | 83,361 | ||||||||||||||
Government securities: | |||||||||||||||||||
U.S. government securities | — | 62,381 | — | — | 62,381 | ||||||||||||||
Foreign government securities | — | 46,286 | — | — | 46,286 | ||||||||||||||
Other fixed income securities | — | 31,630 | — | — | 31,630 | ||||||||||||||
Other | 3,898 | 79,446 | — | — | 83,344 | ||||||||||||||
Total investments | $ | 87,259 | $ | 570,137 | $ | — | $ | 135,362 | $ | 792,758 | |||||||||
The following table presents the fair value of the benefit plan assets by asset category as of June 30, 2017:
(in thousands) | Level 1 | Level 2 | Level 3 | NAV(3) | Total | ||||||||||||||
Common / collective trusts (3): | |||||||||||||||||||
Value funds | $ | — | $ | — | $ | — | $ | 76,186 | $ | 76,186 | |||||||||
Growth funds | — | — | — | 43,880 | 43,880 | ||||||||||||||
Balanced funds | — | — | — | 12,421 | 12,421 | ||||||||||||||
Corporate fixed income securities | — | 365,723 | — | — | 365,723 | ||||||||||||||
Common stock | 85,138 | — | — | — | 85,138 | ||||||||||||||
Government securities: | |||||||||||||||||||
U.S. government securities | — | 72,817 | — | — | 72,817 | ||||||||||||||
Foreign government securities | — | 45,359 | — | — | 45,359 | ||||||||||||||
Other fixed income securities | — | 25,761 | — | — | 25,761 | ||||||||||||||
Other | 3,313 | 78,037 | — | — | 81,350 | ||||||||||||||
Total investments | $ | 88,451 | $ | 587,697 | $ | — | 132,487 | $ | 808,635 | ||||||||||
(3) Investments in common / collective trusts invest primarily in publicly traded securities and are valued using net asset value (NAV) of units of a bank collective trust. Therefore, these amounts have not been classified in the fair value hierarchy and are presented in the tables to reconcile the fair value hierarchy to the total fair value of plan assets.
Defined Contribution Plans
We sponsor several defined contribution retirement plans. Costs for defined contribution plans were $19.6 million, $15.8 million and $17.2 million in 2018, 2017 and 2016, respectively.
62
NOTE 14 — ACCUMULATED OTHER COMPREHENSIVE LOSS
Total accumulated other comprehensive loss (AOCL) consists of net income and other changes in equity from transactions and other events from sources other than shareholders. It includes postretirement benefit plan adjustments, currency translation adjustments and unrealized gains and losses from derivative instruments designated as cash flow hedges.
The components of and changes in AOCL were as follows, net of tax, for the year ended June 30, 2018 (in thousands):
Attributable to Kennametal: | Postretirement benefit plans | Currency translation adjustment | Derivatives | Total | ||||||||
Balance, June 30, 2017 | $ | (189,038 | ) | $ | (126,606 | ) | $ | (8,048 | ) | $ | (323,692 | ) |
Other comprehensive loss before reclassifications | (5,991 | ) | (741 | ) | (922 | ) | (7,654 | ) | ||||
Amounts Reclassified from AOCL | 7,274 | — | 3,747 | 11,021 | ||||||||
Net current period other comprehensive income (loss) | 1,283 | (741 | ) | 2,825 | 3,367 | |||||||
AOCL, June 30, 2018 | $ | (187,755 | ) | $ | (127,347 | ) | $ | (5,223 | ) | $ | (320,325 | ) |
Attributable to noncontrolling interests: | ||||||||||||
Balance, June 30, 2017 | $ | — | $ | (2,164 | ) | $ | — | $ | (2,164 | ) | ||
Other comprehensive loss before reclassifications | — | (749 | ) | — | (749 | ) | ||||||
Net current period other comprehensive loss | — | (749 | ) | — | (749 | ) | ||||||
AOCL, June 30, 2018 | $ | — | $ | (2,913 | ) | $ | — | $ | (2,913 | ) | ||
The components of and changes in AOCL were as follows, net of tax, for the year ended June 30, 2017 (in thousands):
Attributable to Kennametal: | Postretirement benefit plans | Currency translation adjustment | Derivatives | Total | ||||||||
Balance, June 30, 2016 | $ | (212,163 | ) | $ | (131,212 | ) | $ | (9,134 | ) | $ | (352,509 | ) |
Other comprehensive income (loss) before reclassifications | 15,559 | 4,606 | (471 | ) | 19,694 | |||||||
Amounts Reclassified from AOCL | 7,566 | — | 1,557 | 9,123 | ||||||||
Net current period other comprehensive income | 23,125 | 4,606 | 1,086 | 28,817 | ||||||||
AOCL, June 30, 2017 | $ | (189,038 | ) | $ | (126,606 | ) | $ | (8,048 | ) | $ | (323,692 | ) |
Attributable to noncontrolling interests: | ||||||||||||
Balance, June 30, 2016 | $ | — | $ | (3,446 | ) | $ | — | $ | (3,446 | ) | ||
Other comprehensive income before reclassifications | — | 1,282 | — | 1,282 | ||||||||
Net current period other comprehensive income | — | 1,282 | — | 1,282 | ||||||||
AOCL, June 30, 2017 | $ | — | $ | (2,164 | ) | $ | — | $ | (2,164 | ) | ||
63
The components of and changes in AOCL were as follows, net of tax, for the year ended June 30, 2016 (in thousands):
Attributable to Kennametal: | Postretirement benefit plans | Currency translation adjustment | Derivatives | Total | ||||||||
Balance, June 30, 2015 | $ | (138,793 | ) | $ | (97,309 | ) | $ | (7,421 | ) | $ | (243,523 | ) |
Other comprehensive loss before reclassifications | (78,295 | ) | (51,508 | ) | (150 | ) | (129,953 | ) | ||||
Amounts Reclassified from AOCL | 4,925 | 15,088 | (1,563 | ) | 18,450 | |||||||
Net current period other comprehensive loss | (73,370 | ) | (36,420 | ) | (1,713 | ) | (111,503 | ) | ||||
Sale of subsidiary stock to noncontrolling interest | — | 2,517 | — | 2,517 | ||||||||
AOCL, June 30, 2016 | $ | (212,163 | ) | $ | (131,212 | ) | $ | (9,134 | ) | $ | (352,509 | ) |
Attributable to noncontrolling interests: | ||||||||||||
Balance, June 30, 2015 | $ | — | $ | (2,258 | ) | $ | — | $ | (2,258 | ) | ||
Other comprehensive loss before reclassifications | — | (1,188 | ) | — | (1,188 | ) | ||||||
Net current period other comprehensive loss | — | (1,188 | ) | — | (1,188 | ) | ||||||
AOCL, June 30, 2016 | $ | — | $ | (3,446 | ) | $ | — | $ | (3,446 | ) | ||
Reclassifications out of AOCL for the years ended June 30, 2018, 2017 and 2016 consisted of the following:
Year Ended June 30, | ||||||||||
Details about AOCL components (in thousands) | 2018 | 2017 | 2016 | Affected line item in the Income Statement | ||||||
Gains and losses on cash flow hedges: | ||||||||||
Forward starting interest rate swaps | $ | 2,265 | $ | 2,180 | $ | 2,099 | Interest expense | |||
Currency exchange contracts | 2,243 | (623 | ) | (4,645 | ) | Other expense (income), net | ||||
Total before tax | 4,508 | 1,557 | (2,546 | ) | ||||||
Tax impact | (761 | ) | — | 983 | Provision for income taxes | |||||
Net of tax | $ | 3,747 | $ | 1,557 | $ | (1,563 | ) | |||
Postretirement benefit plans: | ||||||||||
Amortization of transition obligations | $ | 94 | $ | 89 | $ | 80 | See Note 13 for further details | |||
Amortization of prior service credit | 26 | (474 | ) | (439 | ) | See Note 13 for further details | ||||
Recognition of actuarial losses | 7,187 | 8,711 | 7,610 | See Note 13 for further details | ||||||
Total before tax | 7,307 | 8,326 | 7,251 | |||||||
Tax impact | (33 | ) | (760 | ) | (2,326 | ) | Provision for income taxes | |||
Net of tax | $ | 7,274 | $ | 7,566 | $ | 4,925 | ||||
Foreign currency translation adjustments: | ||||||||||
Released due to divestiture | $ | — | $ | — | $ | 15,088 | Loss on divestiture | |||
Total before taxes | — | — | 15,088 | |||||||
Tax impact | — | — | — | Provision for income taxes | ||||||
Net of tax | $ | — | $ | — | $ | 15,088 | ||||
64
The amount of income tax allocated to each component of other comprehensive income for the year ended June 30, 2018:
(in thousands) | Pre-tax | Tax impact | Net of tax | ||||||
Unrealized loss on derivatives designated and qualified as cash flow hedges | $ | (928 | ) | $ | 6 | $ | (922 | ) | |
Reclassification of unrealized loss on expired derivatives designated and qualified as cash flow hedges | 4,508 | (761 | ) | 3,747 | |||||
Unrecognized net pension and other postretirement benefit loss | (8,043 | ) | 2,052 | (5,991 | ) | ||||
Reclassification of net pension and other postretirement benefit loss | 7,307 | (33 | ) | 7,274 | |||||
Foreign currency translation adjustments | (1,593 | ) | 103 | (1,490 | ) | ||||
Other comprehensive income | $ | 1,251 | $ | 1,367 | $ | 2,618 | |||
The amount of income tax allocated to each component of other comprehensive loss for the year ended June 30, 2017:
(in thousands) | Pre-tax | Tax impact | Net of tax | ||||||
Unrealized loss on derivatives designated and qualified as cash flow hedges | $ | (471 | ) | $ | — | $ | (471 | ) | |
Reclassification of unrealized loss on expired derivatives designated and qualified as cash flow hedges | 1,557 | — | 1,557 | ||||||
Unrecognized net pension and other postretirement benefit gain | 18,656 | (3,097 | ) | 15,559 | |||||
Reclassification of net pension and other postretirement benefit loss | 8,326 | (760 | ) | 7,566 | |||||
Foreign currency translation adjustments | 6,266 | (378 | ) | 5,888 | |||||
Other comprehensive income | $ | 34,334 | $ | (4,235 | ) | $ | 30,099 | ||
The amount of income tax allocated to each component of other comprehensive loss for the year ended June 30, 2016:
(in thousands) | Pre-tax | Tax impact | Net of tax | ||||||
Unrealized loss on derivatives designated and qualified as cash flow hedges | $ | (244 | ) | $ | 94 | $ | (150 | ) | |
Reclassification of unrealized gain on expired derivatives designated and qualified as cash flow hedges | (2,546 | ) | 983 | (1,563 | ) | ||||
Unrecognized net pension and other postretirement benefit loss | (84,266 | ) | 5,971 | (78,295 | ) | ||||
Reclassification of net pension and other postretirement benefit loss | 7,251 | (2,326 | ) | 4,925 | |||||
Foreign currency translation adjustments | (52,699 | ) | 4 | (52,695 | ) | ||||
Reclassification of foreign currency translation adjustment loss realized upon sale | 15,088 | — | 15,088 | ||||||
Other comprehensive loss | $ | (117,416 | ) | $ | 4,726 | $ | (112,690 | ) | |
NOTE 15 — RESTRUCTURING AND RELATED CHARGES AND ASSET IMPAIRMENT CHARGES
Legacy Restructuring
In prior years, we implemented restructuring actions to streamline the Company's cost structure. The purpose of this restructuring initiative was to improve the alignment of our cost structure with the operating environment through employee reductions and to consolidate certain manufacturing facilities. These restructuring actions were substantially completed in the September quarter of 2018, were mostly cash expenditures and achieved annual run rate ongoing pre-tax savings of approximately $165 million.
Total restructuring and related charges since inception of $152.7 million have been recorded for these programs through June 30, 2018: $85.6 million in Industrial, $13.9 million in Widia, $45.9 million in Infrastructure and $7.3 million in Corporate.
Industrial Simplification
In the June quarter of 2018, we implemented and substantially completed restructuring actions to streamline the Industrial segment's cost structure by directing resources to more profitable business and increasing sales force productivity. These actions are currently anticipated to deliver annual ongoing pre-tax savings of $10 million and are anticipated to be mostly cash expenditures. Total restructuring and related charges since inception of $8.2 million have been recorded for this program in the Industrial segment through June 30, 2018.
65
Combined Restructuring
During 2018, we recorded restructuring and related charges of $15.9 million, net of a $4.7 million gain on sale of the previously closed Houston manufacturing location that was part of our legacy restructuring programs. Of this amount, restructuring charges totaled $16.4 million, of which benefit of $0.2 million was related to inventory and were recorded in cost of goods sold. Restructuring-related charges of $3.7 million were recorded in cost of goods sold and $0.5 million were recorded in operating expense during 2018.
During 2017, we recorded restructuring and related charges of $76.2 million. Of this amount, restructuring charges totaled $65.6 million, of which $0.6 million were charges related to inventory and were recorded in cost of goods sold. Restructuring-related charges of $7.1 million were recorded in cost of goods sold and $3.5 million in operating expense during 2017.
During 2016, we recorded restructuring and related charges of $53.5 million. Of this amount, restructuring charges totaled $30.0 million. Restructuring-related charges of $7.3 million were recorded in cost of goods sold and $16.2 million in operating expense during 2016.
As of June 30, 2017, property, plant, and equipment of $7.0 million for certain closed manufacturing locations that were part of our legacy restructuring programs met held for sale criteria. We expected to sell these assets within one year from the balance sheet date. These assets were recorded at the lower of carrying amount or fair value less cost to sell. We had also ceased depreciating these assets.
As of June 30, 2018 and 2017, $17.5 million and $27.3 million of the restructuring accrual is recorded in other current liabilities, and $0.1 million and $2.5 million is recorded in other liabilities, respectively, in our consolidated balance sheet. The restructuring accrual of $15.7 million as of June 30, 2016 is recorded in other current liabilities. The amount attributable to each segment is as follows:
(in thousands) | June 30, 2017 | Expense | Asset Write-Down | Translation | Cash Expenditures | June 30, 2018 | |||||||||||||||||
Industrial | |||||||||||||||||||||||
Severance | $ | 17,639 | $ | 9,734 | $ | — | $ | 868 | $ | (20,274 | ) | $ | 7,967 | ||||||||||
Facilities | — | 3,084 | (3,084 | ) | — | — | — | ||||||||||||||||
Other | 94 | (85 | ) | — | 1 | (10 | ) | — | |||||||||||||||
Total Industrial | 17,733 | 12,733 | (3,084 | ) | 869 | (20,284 | ) | 7,967 | |||||||||||||||
Widia | |||||||||||||||||||||||
Severance | 2,434 | 475 | — | 42 | (864 | ) | 2,087 | ||||||||||||||||
Facilities | — | 747 | (747 | ) | — | — | — | ||||||||||||||||
Other | — | (4 | ) | — | — | 19 | 15 | ||||||||||||||||
Total Widia | 2,434 | 1,218 | (747 | ) | 42 | (845 | ) | 2,102 | |||||||||||||||
Infrastructure | |||||||||||||||||||||||
Severance | 9,573 | 2,053 | — | 183 | (4,251 | ) | 7,558 | ||||||||||||||||
Facilities | 21 | 433 | (433 | ) | — | (21 | ) | — | |||||||||||||||
Other | 45 | (18 | ) | — | — | (15 | ) | 12 | |||||||||||||||
Total Infrastructure | 9,639 | 2,468 | (433 | ) | 183 | (4,287 | ) | 7,570 | |||||||||||||||
Total | $ | 29,806 | $ | 16,419 | $ | (4,264 | ) | $ | 1,094 | $ | (25,416 | ) | $ | 17,639 | |||||||||
66
(in thousands) | June 30, 2016 | Expense | Asset Write-Down | Translation | Cash Expenditures | June 30, 2017 | |||||||||||||||||
Industrial | |||||||||||||||||||||||
Severance | $ | 8,180 | $ | 39,214 | $ | — | $ | 229 | $ | (29,984 | ) | $ | 17,639 | ||||||||||
Facilities | — | 237 | (237 | ) | — | — | — | ||||||||||||||||
Other | 809 | 162 | — | (8 | ) | (869 | ) | 94 | |||||||||||||||
Total Industrial | 8,989 | 39,613 | (237 | ) | 221 | (30,853 | ) | 17,733 | |||||||||||||||
Widia | |||||||||||||||||||||||
Severance | 909 | 6,325 | — | 37 | (4,837 | ) | 2,434 | ||||||||||||||||
Facilities | — | 10 | (10 | ) | — | — | — | ||||||||||||||||
Other | 90 | 26 | — | (1 | ) | (115 | ) | — | |||||||||||||||
Total Widia | 999 | 6,361 | (10 | ) | 36 | (4,952 | ) | 2,434 | |||||||||||||||
Infrastructure | |||||||||||||||||||||||
Severance | 5,301 | 17,710 | — | 103 | (13,541 | ) | 9,573 | ||||||||||||||||
Facilities | 33 | 1,849 | (1,849 | ) | — | (12 | ) | 21 | |||||||||||||||
Other | 381 | 73 | — | (4 | ) | (405 | ) | 45 | |||||||||||||||
Total Infrastructure | 5,715 | 19,632 | (1,849 | ) | 99 | (13,958 | ) | 9,639 | |||||||||||||||
Total | $ | 15,703 | $ | 65,606 | $ | (2,096 | ) | $ | 356 | $ | (49,763 | ) | $ | 29,806 | |||||||||
Asset impairment Charges
See discussion on goodwill and other intangible asset impairment charges in Note 2.
During 2016, we identified specific machinery and equipment that was no longer being utilized in the manufacturing organization of which we disposed by abandonment. As a result of this review, we recorded property, plant, and equipment impairment charges of $5.4 million during 2016, which has been presented in restructuring and asset impairment charges in our consolidated statement of income.
NOTE 16 — FINANCIAL INSTRUMENTS
The methods used to estimate the fair value of our financial instruments are as follows:
Cash and Equivalents, Current Maturities of Long-Term Debt and Notes Payable to Banks The carrying amounts approximate their fair value because of the short maturity of the instruments.
Long-Term Debt, Including Current Maturities Fixed rate debt had a fair market value of $996.4 million and $704.0 million at June 30, 2018 and 2017, respectively. The fair value is determined based on the quoted market price of this debt as of June 30 and were classified in Level 2 of the fair value hierarchy.
Foreign Exchange Contracts The notional amount of outstanding foreign exchange contracts, translated at current exchange rates, was $62.9 million and $75.3 million at June 30, 2018 and 2017, respectively. We would have received $0.8 million and would have paid $0.8 million at June 30, 2018 and 2017, respectively, to settle these contracts representing the fair value of these agreements. The carrying value equaled the fair value for these contracts at June 30, 2018 and 2017. Fair value was estimated based on quoted market prices of comparable instruments.
Concentrations of Credit Risk Financial instruments that potentially subject us to concentrations of credit risk consist primarily of temporary cash investments and trade receivables. By policy, we make temporary cash investments with high credit quality financial institutions and limit the amount of exposure to any one financial institution. With respect to trade receivables, concentrations of credit risk are significantly reduced because we serve numerous customers in many industries and geographic areas.
We are exposed to counterparty credit risk for nonperformance of derivatives and, in the unlikely event of nonperformance, to market risk for changes in interest and currency exchange rates, as well as settlement risk. We manage exposure to counterparty credit risk through credit standards, diversification of counterparties and procedures to monitor concentrations of credit risk. We do not anticipate nonperformance by any of the counterparties. As of June 30, 2018 and 2017, we had no significant concentrations of credit risk.
67
NOTE 17 — STOCK-BASED COMPENSATION
Stock Options
There were no grants made during 2018 and 2017. The assumptions used in our Black-Scholes valuation related to grants made during 2016 were as follows:
2016 | |||
Risk-free interest rate | 1.4 | % | |
Expected life (years) (4) | 4.5 | ||
Expected volatility (5) | 31.7 | % | |
Expected dividend yield | 2.1 | % | |
(5) Expected volatility is based on the implied historical volatility of our stock.
Changes in our stock options for 2018 were as follows:
Options | Weighted Average Exercise Price | Weighted Average Remaining Life (years) | Aggregate Intrinsic value (in thousands) | |||||||||
Options outstanding, June 30, 2017 | 1,726,791 | $ | 34.08 | |||||||||
Granted | — | — | ||||||||||
Exercised | (625,503 | ) | 35.54 | |||||||||
Lapsed and forfeited | (111,296 | ) | 34.68 | |||||||||
Options outstanding, June 30, 2018 | 989,992 | $ | 33.08 | 5.1 | $ | 5,170 | ||||||
Options vested and expected to vest, June 30, 2018 | 989,992 | $ | 33.08 | 5.1 | $ | 5,170 | ||||||
Options exercisable, June 30, 2018 | 812,159 | $ | 33.97 | 4.6 | $ | 3,851 | ||||||
During 2018, 2017 and 2016, compensation expense related to stock options was $0.7 million, $1.5 million and $3.3 million, respectively. As of June 30, 2018, the total unrecognized compensation cost related to options outstanding was $0.1 million and is expected to be recognized over a weighted average period of 0.3 years.
Weighted average fair value of options granted during 2016 was $6.45 per option. Fair value of options vested during 2018, 2017 and 2016 was $1.9 million, $3.3 million and $2.3 million, respectively.
Tax benefits relating to excess stock-based compensation deductions are presented in the consolidated statements of cash flow as operating cash inflows for 2018 and as financing cash inflows for 2017 and 2016. Tax benefits resulting from stock-based compensation deductions were greater than the amounts reported for financial reporting purposes by an immaterial amount in 2018. No tax benefits were realized resulting from stock-based compensation deductions for 2017 due to the valuation allowance on U.S. deferred tax assets, and tax benefits resulting from stock-based compensation deductions were less than the amounts reported for financial reporting purposes by $1.9 million in 2016.
The amount of cash received from the exercise of capital stock options during 2018, 2017 and 2016 was $22.2 million, $21.3 million and $1.0 million, respectively. The related tax benefit in 2018 was $1.4 million. No related tax benefit was realized in 2017 due to the valuation allowance on U.S. deferred tax assets, and the related tax benefit was immaterial in 2016. The total intrinsic value of options exercised in 2018 and 2017 was $6.6 million and $3.1 million, respectively, and was immaterial in 2016.
Under the provisions of the A/R 2010 Plan and the 2016 Plan, participants may deliver stock, owned by the holder for at least six months, in payment of the option price and receive credit for the fair market value of the shares on the date of delivery. The fair market value of shares delivered during 2018, 2017 and 2016 were immaterial.
68
Restricted Stock Units – Time Vesting and Performance Vesting
Performance vesting restricted stock units are earned pro rata each year if certain performance goals are met over a three-year period, and are also subject to a service condition that requires the individual to be employed by the Company at the payment date after the three-year performance period, with the exception of retirement eligible grantees, who upon retirement are entitled to receive payment for any units that have been earned, including a prorated portion in the partially completed fiscal year in which the retirement occurs. Time vesting stock units are valued at the market value of the stock on the grant date. Performance vesting stock units with a market condition are valued using a Monte Carlo model.
Changes in our time vesting and performance vesting restricted stock units for 2018 were as follows:
Performance Vesting Stock Units | Performance Vesting Weighted Average Fair Value | Time Vesting Stock Units | Time Vesting Weighted Average Fair Value | ||||||||||
Unvested, June 30, 2017 | 280,250 | $ | 27.62 | 1,153,444 | $ | 27.66 | |||||||
Granted | 158,397 | 38.81 | 434,391 | 37.87 | |||||||||
Vested | (10,031 | ) | 42.83 | (421,625 | ) | 30.29 | |||||||
Performance metric adjustments, net | 16,766 | 25.88 | — | — | |||||||||
Forfeited | (36,085 | ) | 30.91 | (82,535 | ) | 30.81 | |||||||
Unvested, June 30, 2018 | 409,297 | $ | 31.22 | 1,083,675 | $ | 30.47 | |||||||
During 2018, 2017 and 2016, compensation expense related to time vesting and performance vesting restricted stock units was $19.4 million, $19.3 million and $14.6 million, respectively. As of June 30, 2018, the total unrecognized compensation cost related to unvested time vesting and performance vesting restricted stock units was $13.9 million and is expected to be recognized over a weighted average period of 1.9 years.
NOTE 18— ENVIRONMENTAL MATTERS
The operation of our business has exposed us to certain liabilities and compliance costs related to environmental matters. We are involved in various environmental cleanup and remediation activities at certain locations in the countries in which we operate.
Superfund Sites Among other environmental laws, we are subject to the Comprehensive Environmental Response, Compensation, and Liability Act of 1980 (CERCLA), under which we have been designated by the United States Environmental Protection Agency (USEPA) as a Potentially Responsible Party (PRP) with respect to environmental remedial costs at certain Superfund sites. We have evaluated our claims and potential liability associated with these Superfund sites based upon the best information currently available to us. We believe our environmental accruals will be adequate to cover our portion of the environmental remedial costs at those Superfund sites where we have been designated a PRP, to the extent these expenses are probable and reasonably estimable.
Other Environmental Matters We establish and maintain reserves for other potential environmental issues. At June 30, 2018 and 2017, the balance of these reserves was $12.5 million and $12.4 million, respectively. These reserves represent anticipated costs associated with the remediation of these environmental issues and are generally not discounted.
The reserves we have established for our potential environmental liabilities represent our best current estimate of the costs of addressing all identified environmental situations, based on our review of currently available evidence, taking into consideration our prior experience in environmental remediation and the experiences of other companies, as well as public information released by the USEPA, other governmental agencies, and by the PRP groups in which we are participating. Although our reserves currently appear to be sufficient to cover our potential environmental liabilities, there are uncertainties associated with environmental remediation matters, and we can give no assurance that our estimate of any environmental liability will not increase or decrease in the future. Our reserved and unreserved liabilities for environmental matters could change substantially due to factors such as the nature and extent of contamination, changes in remedial requirements, technological changes, discovery of new information, the financial strength of other PRPs, the identification of new PRPs and the involvement of and direction taken by the government on these matters.
69
We maintain a Corporate EHS Department to monitor our compliance with environmental regulations and to oversee our remediation activities. In addition, we have designated EHS analysts who are responsible for each of our global manufacturing facilities. Our financial management team periodically meets with members of the Corporate EHS Department and the Corporate Legal Department to review and evaluate the status of environmental projects and contingencies. On a quarterly basis, we review financial provisions and reserves for environmental contingencies and adjust these reserves when appropriate.
NOTE 19 — COMMITMENTS AND CONTINGENCIES
Legal Matters Various lawsuits arising during the normal course of business are pending against us. In our opinion, the ultimate liability, if any, resulting from these matters will have no significant effect on our consolidated financial positions or results of operations.
Lease Commitments We lease a wide variety of facilities and equipment under operating leases, primarily for warehouses, production and office facilities and equipment. Lease expense under these rentals amounted to $26.6 million, $26.3 million and $28.6 million in 2018, 2017 and 2016, respectively. Future minimum lease payments for non-cancelable operating leases are $17.6 million, $13.7 million, $9.3 million, $5.4 million and $4.1 million for the years 2019 through 2023 and $15.2 million thereafter.
Purchase Commitments We have purchase commitments for materials, supplies and machinery and equipment as part of the ordinary conduct of business. Some of these commitments extend beyond one year and are based on minimum purchase requirements. We believe these commitments are not at prices in excess of current market.
Other Contractual Obligations We do not have material financial guarantees or other contractual commitments that are reasonably likely to adversely affect our liquidity.
Related Party Transactions Sales to affiliated companies were immaterial in 2018, 2017 and 2016. We do not have any other related party transactions that affect our operations, results of operations, cash flow or financial condition.
NOTE 20 — SEGMENT DATA
The Company manages and reports its business in the following three segments: Industrial, Widia and Infrastructure. The Company's reportable operating segments have been determined in accordance with the Company's internal management structure, which is organized based on operating activities, the manner in which we organize segments for making operating decisions and assessing performance and the availability of separate financial results. We do not allocate certain corporate expenses related to executive retirement plans, the Company’s Board of Directors and strategic initiatives, as well as certain other costs and report them in Corporate. None of our reportable operating segments represent the aggregation of two or more operating segments.
Sales to a single customer did not aggregate 4 percent or more of total sales in 2018, 2017 and 2016. Export sales from U.S. operations to unaffiliated customers were $72.4 million, $58.6 million and $65.3 million in 2018, 2017 and 2016, respectively.
INDUSTRIAL The Industrial segment generally serves customers that operate in industrial end markets such as transportation, general engineering, aerospace and defense market sectors, delivering high performance metalworking tools for specified purposes. Our customers in these end markets use our products and services in the manufacture of engines, airframes, automobiles, trucks, ships and other various types of industrial equipment. The technology and customization requirements we provide vary by customer, application and industry. Industrial goes to market under the Kennametal® brand through its direct sales force, a network of independent and national chain distributors, integrated supplier channels and via the Internet. Application engineers and technicians are critical to the sales process and directly assist our customers with specified product design, selection, application and support.
WIDIA The Widia segment offers a focused assortment of standard custom metal cutting solutions to general engineering, aerospace, energy and transportation customers. We serve our customers primarily through a network of value added resellers, integrated supplier channels and via the Internet. Widia markets its products under the WIDIA®, WIDIA Hanita® and WIDIA GTD® brands.
INFRASTRUCTURE The Infrastructure segment generally serves customers that operate in the energy and earthworks market sectors that support primary industries such as oil and gas, power generation and chemicals; underground, surface and hard-rock mining; highway construction and road maintenance; and process industries such as food and feed. Our success is determined by our ability to gain an in-depth understanding of our customers’ engineering and development needs, to provide complete system solutions and high-performance capabilities to optimize and add value to their operations. Infrastructure markets its products primarily under the Kennametal® brand and sells through a direct sales force as well as distributors.
70
Segment data is summarized as follows:
(in thousands) | 2018 | 2017 | 2016 | ||||||||
Sales: | |||||||||||
Industrial | $ | 1,292,098 | $ | 1,126,309 | $ | 1,098,439 | |||||
Widia | 198,568 | 177,662 | 170,723 | ||||||||
Infrastructure | 877,187 | 754,397 | 829,274 | ||||||||
Total sales | $ | 2,367,853 | $ | 2,058,368 | $ | 2,098,436 | |||||
Operating income (loss): | |||||||||||
Industrial | $ | 187,495 | $ | 82,842 | $ | 90,324 | |||||
Widia | 4,441 | (9,606 | ) | (9,081 | ) | ||||||
Infrastructure | 119,701 | 40,011 | (246,306 | ) | |||||||
Corporate | (4,072 | ) | (303 | ) | (9,880 | ) | |||||
Total operating income (loss) | $ | 307,565 | $ | 112,944 | $ | (174,943 | ) | ||||
Interest expense | $ | 30,081 | $ | 28,842 | $ | 27,752 | |||||
Other expense (income), net | 2,443 | 2,227 | (4,124 | ) | |||||||
Income (loss) before income taxes | $ | 275,041 | $ | 81,875 | $ | (198,571 | ) | ||||
Depreciation and amortization: | |||||||||||
Industrial | $ | 57,261 | $ | 54,269 | $ | 52,523 | |||||
Widia | 9,483 | 10,728 | 10,419 | ||||||||
Infrastructure | 41,916 | 42,596 | 54,459 | ||||||||
Corporate | 20 | 63 | 65 | ||||||||
Total depreciation and amortization | $ | 108,680 | $ | 107,656 | $ | 117,466 | |||||
Total assets: | |||||||||||
Industrial | $ | 1,169,610 | $ | 1,103,686 | $ | 1,019,887 | |||||
Widia | 193,971 | 191,626 | 195,339 | ||||||||
Infrastructure | 864,402 | 813,747 | 849,447 | ||||||||
Corporate | 697,754 | 306,437 | 298,110 | ||||||||
Total assets | $ | 2,925,737 | $ | 2,415,496 | $ | 2,362,783 | |||||
Capital expenditures: | |||||||||||
Industrial | $ | 112,124 | $ | 70,281 | $ | 66,467 | |||||
Widia | 17,445 | 17,853 | 14,093 | ||||||||
Infrastructure | 41,435 | 29,884 | 30,137 | ||||||||
Total capital expenditures | $ | 171,004 | $ | 118,018 | $ | 110,697 | |||||
71
Geographic information for sales, based on country where the sale originated, and long-lived assets is as follows:
(in thousands) | 2018 | 2017 | 2016 | ||||||||
Sales: | |||||||||||
United States(6) | $ | 970,003 | $ | 868,466 | $ | 866,197 | |||||
Germany | 331,893 | 282,347 | 334,366 | ||||||||
China | 271,343 | 220,561 | 210,124 | ||||||||
Canada(6) | 102,139 | 85,488 | 87,014 | ||||||||
India | 102,120 | 84,769 | 77,934 | ||||||||
Italy | 69,049 | 59,967 | 69,821 | ||||||||
France | 62,982 | 56,231 | 56,264 | ||||||||
United Kingdom | 45,714 | 39,731 | 50,723 | ||||||||
Other(7) | 412,610 | 360,808 | 345,993 | ||||||||
Total sales | $ | 2,367,853 | $ | 2,058,368 | $ | 2,098,436 | |||||
Total long-lived assets: | |||||||||||
United States | $ | 456,678 | $ | 423,543 | $ | 424,970 | |||||
Germany | 188,673 | 157,323 | 143,855 | ||||||||
China | 67,462 | 60,908 | 62,614 | ||||||||
India | 31,984 | 28,569 | 23,797 | ||||||||
Israel | 25,831 | 26,627 | 23,083 | ||||||||
Canada | 19,396 | 19,576 | 18,587 | ||||||||
Other | 34,189 | 34,822 | 33,734 | ||||||||
Total long-lived assets(8): | $ | 824,213 | $ | 751,368 | $ | 730,640 | |||||
(6) Sales of $28.9 million and $31.2 million have been reclassified out of United States and into Canada for 2017 and 2016, respectively, to revise a single legal entity's sales attribution by country from the basis of location to which the product is shipped to the intended basis of location where the sale originated. These misstatements were not material to our current or any prior period financial statements.
(7) Other consists of sales from 26 countries, none of which individually exceed 2 percent of total sales.
(8) Total long-lived assets as of June 30, 2018 and 2016 include property, plant and equipment, net of $824.2 million and $730.6 million, respectively. Total long-lived assets as of June 30, 2017 include property, plant and equipment, net of $744.4 million and assets held for sale of $7.0 million.
Approximate sales by end markets as a percentage of consolidated sales are as follows:
2018 | 2017 | 2016 | ||||||
End markets: | ||||||||
General engineering | 41 | % | 39 | % | 38 | % | ||
Transportation | 20 | 20 | 21 | |||||
Energy | 17 | 18 | 17 | |||||
Earthworks | 14 | 15 | 16 | |||||
Aerospace and defense | 8 | 8 | 8 | |||||
Total | 100 | % | 100 | % | 100 | % | ||
72
NOTE 21 — SELECTED QUARTERLY FINANCIAL DATA (UNAUDITED)
For the quarter ended (in thousands, except per share data) | September 30 | December 31 | March 31 | June 30 | |||||||||||
2018 | |||||||||||||||
Sales | $ | 542,454 | $ | 571,345 | $ | 607,936 | $ | 646,119 | |||||||
Gross profit | 184,993 | 192,545 | 219,461 | 235,294 | |||||||||||
Net income attributable to Kennametal | 39,183 | 41,601 | 50,866 | 68,528 | |||||||||||
Basic earnings per share attributable to Kennametal (9) | |||||||||||||||
Net income | 0.48 | 0.51 | 0.62 | 0.84 | |||||||||||
Diluted earnings per share attributable to Kennametal (9) | |||||||||||||||
Net income | 0.48 | 0.50 | 0.61 | 0.83 | |||||||||||
2017 | |||||||||||||||
Sales | $ | 477,140 | $ | 487,573 | $ | 528,630 | $ | 565,025 | |||||||
Gross profit | 143,530 | 147,623 | 186,265 | 180,289 | |||||||||||
Net (loss) income attributable to Kennametal | (21,656 | ) | 7,262 | 38,890 | 24,643 | ||||||||||
Basic (loss) earnings per share attributable to Kennametal (9) | |||||||||||||||
Net income | (0.27 | ) | 0.09 | 0.48 | 0.31 | ||||||||||
Diluted (loss) earnings per share attributable to Kennametal (9) | |||||||||||||||
Net income | (0.27 | ) | 0.09 | 0.48 | 0.30 | ||||||||||
(9) Earnings per share amounts attributable to Kennametal for each quarter are computed using the weighted average number of shares outstanding during the quarter. Earnings per share amounts attributable to Kennametal for the full year are computed using the weighted average number of shares outstanding during the year. Thus, the sum of the four quarters’ earnings per share attributable to Kennametal does not always equal the full-year earnings per share attributable to Kennametal.
NOTE 22 — SUBSEQUENT EVENTS
On July 9, 2018, we completed the early extinguishment of our $400.0 million Notes. We expect an immaterial effect to the statement of income in the September quarter of fiscal 2019 from the early extinguishment of debt.
73
ITEM 9 — CHANGES IN AND DISAGREEMENTS WITH ACCOUNTANTS ON ACCOUNTING AND FINANCIAL DISCLOSURE
None.
ITEM 9A — CONTROLS AND PROCEDURES
(a) | Evaluation of Disclosure Controls and Procedures |
The Company’s management evaluated, with the participation of the Company’s Chief Executive Officer and Chief Financial Officer, the effectiveness of the Company’s disclosure controls and procedures (as defined in Exchange Act Rules 13a-15(e) and 15d-15(e)) as of June 30, 2018. The Company’s disclosure controls were designed to provide a reasonable assurance that information required to be disclosed in reports that we file or submit under the Exchange Act of 1934, as amended, is recorded, processed, summarized and reported within the time periods specified in the rules and forms of the Securities and Exchange Commission. It should be noted that the design of any system of controls is based in part upon certain assumptions about the likelihood of future events, and there can be no assurance that any design will succeed in achieving its stated goals under all potential future conditions, regardless of how remote. However, the controls have been designed to provide reasonable assurance of achieving the controls’ stated goals. Based on that evaluation, the Company’s Chief Executive Officer and Chief Financial Officer have concluded that the Company’s disclosure controls and procedures are effective to provide reasonable assurance at June 30, 2018 to ensure that information required to be disclosed in the reports that we file or submit under the Exchange Act is (i) accumulated and communicated to management, including the Company’s Chief Executive Officer and Chief Financial Officer, to allow timely decisions regarding required disclosure and (ii) recorded, processed, summarized and reported within the time periods specified in the rules and forms of the Securities and Exchange Commission.
(b) | Management’s Report on Internal Control over Financial Reporting |
Management’s Report on Internal Control over Financial Reporting is included in Item 8 of this Annual Report and incorporated herein by reference.
(c) | Attestation Report of the Independent Registered Public Accounting Firm |
The effectiveness of Kennametal’s internal control over financial reporting as of June 30, 2018 has been audited by PricewaterhouseCoopers LLP, an independent registered public accounting firm, as stated in their report included in Item 8 of this Annual Report, which is incorporated herein by reference.
(d) | Changes in Internal Control over Financial Reporting |
There have been no changes in internal control over financial reporting that occurred during the fourth quarter of 2018 that have materially affected, or are reasonably likely to materially affect, the Company’s internal control over financial reporting.
ITEM 9B — OTHER INFORMATION
None.
74
PART III
ITEM 10 — DIRECTORS, EXECUTIVE OFFICERS AND CORPORATE GOVERNANCE
EXECUTIVE OFFICERS OF THE REGISTRANT
Information regarding the executive officers of Kennametal Inc. is as follows: Name, Age, Position, and Experience During the Past Five Years (1).
Christopher Rossi, 54
President and Chief Executive Officer
President and Chief Executive Officer since August 2017; Formerly, Chief Executive Officer of Dresser-Rand at Siemens Aktiengesellschaft (provides custom-engineered rotating equipment for applications in the oil, gas, process, power, and other industries), from September 2015 to May 2017; Executive Vice President of Global Operations at Dresser-Rand Group Inc. from September 2012 to September 2015.
Judith L. Bacchus, 56
Vice President and Chief Human Resources and Corporate Relations Officer
Vice President and Chief Human Resources and Corporate Relations Officer since December 2015; Vice President and Chief Human Resources Officer from June 2011 to November 2015.
Robert J. Clemens, 61
Vice President and Chief Technology Officer
Vice President and Chief Technology Officer since March 2013; Formerly, Vice President, Corporate Technology at Eastman Chemical Company (specialty chemical company) from January 2008 to February 2013.
Peter A. Dragich, 55
Vice President, Kennametal Inc. and President, Industrial Business Segment
Vice President, Kennametal Inc. and President, Industrial Business Segment since January 2017; Vice President, Kennametal Inc. and President, Infrastructure Business Segment from May 2016 to January 2017; Vice President and Executive Vice President, Infrastructure Business Segment from October 2015 to May 2016; Vice President Integrated Supply Chain and Logistics from October 2012 to October 2015.
Jan Kees van Gaalen, 61
Vice President and Chief Financial Officer
Vice President and Chief Financial Officer since September 2015; Formerly, Executive Vice President and Chief Financial Officer of Dresser-Rand Group Inc. (provides custom-engineered rotating equipment for applications in the oil, gas, process, power, and other industries) from April 2013 to June 2015.
Michelle Keating, 42
Vice President, Secretary and General Counsel, Kennametal Inc.
Vice President, Secretary and General Counsel, Kennametal Inc. since December 2016; Vice President, Secretary and Interim General Counsel from July 2016 to December 2016; Vice President, Associate General Counsel & Assistant Secretary from March 2016 to July 2016; Assistant General Counsel & Assistant Secretary from August 2011 to February 2016.
Ronald L. Port, 53
Vice President, Kennametal Inc. and President, Infrastructure Business Segment
Vice President, Kennametal Inc. and President, Infrastructure Business Segment since January 2018; Vice President & General Manager, Engineered Components from April 2015 to January 2018; Formerly, Vice President Marketing & Business Development, Flow Technology segment at SPX Corporation (provided highly-engineered process equipment into industrial flow markets) from September 2013 to April 2015; Vice President & Director, Treatment Business Unit & Xylem China/India at Xylem Inc. (water technology company) from January 2011 to September 2013.
Patrick S. Watson, 45
Vice President Finance and Corporate Controller, Kennametal Inc.
Vice President Finance and Corporate Controller, Kennametal Inc. since March 2017; Vice President Finance - Industrial Business from March 2014 to February 2017; Director Finance, Kennametal EMEA from August 2011 to August 2014.
(1) Each executive officer has been elected by the Board of Directors to serve until removed or until a successor is elected and qualified. Unless otherwise noted, none of the executive officers (i) has an arrangement or understanding with any other person(s) pursuant to which he or she was selected as an officer, (ii) has any family relationship with any director or executive officer of the Company, or (iii) is involved in any legal proceeding which would require disclosure under this item.
75
Incorporated herein by reference is the information to be provided under the captions “Proposal I. Election of Directors” and “Section 16(a) Beneficial Ownership Reporting Compliance” in our definitive proxy statement to be filed with the Securities and Exchange Commission within 120 days after June 30, 2018 (2018 Proxy Statement). Also incorporated herein by reference is the information to be set forth under the caption “Ethics and Corporate Governance-Code of Conduct” and "Ethics and Corporate Governance-Corporate Governance" in the 2018 Proxy Statement.
The Company has a separately designated standing Audit Committee established in accordance with Section 3(a) (58) (A) of the Exchange Act. The members of the Audit Committee are: Timothy R. McLevish (Chair); Joseph Alvarado; Cindy L. Davis; William M. Lambert; Lorraine M. Martin and Sagar A. Patel. Incorporated herein by reference is the information provided under the caption “Board of Directors and Board Committees-Committee Functions-Audit Committee” in the 2018 Proxy Statement.
ITEM 11 — EXECUTIVE COMPENSATION
Incorporated herein by reference from our 2018 Proxy Statement is the information to be set forth under the captions “Executive Compensation, Compensation Discussion and Analysis,” "Compensation Committee Report," "Analysis of Risk Inherent in our Compensation Policies and Practices," "Executive Compensation Tables," "2018 Nonqualified Deferred Compensation," "Retirement Programs" and "Potential Payments Upon Termination or Change in Control." Also incorporated herein by reference from our 2018 Proxy Statement is the information to be set forth under the captions “Board of Directors Compensation and Benefits” and “Board of Directors and Board Committees - Committee Functions - Compensation Committee Interlocks and Insider Participation."
ITEM 12 — SECURITY OWNERSHIP OF CERTAIN BENEFICIAL OWNERS AND MANAGEMENT AND RELATED STOCKHOLDER MATTERS
Incorporated herein by reference from our 2018 Proxy Statement are: (i) the information to be set forth under the caption “Equity Compensation Plans,” (ii) the information to be set forth under the caption “Ownership of Capital Stock by Directors, Nominees and Executive Officers” with respect to the directors’ and officers’ shareholdings; and (iii) the information to be set forth under the caption “Principal Holders of Voting Securities” with respect to other beneficial owners.
ITEM 13 — CERTAIN RELATIONSHIPS AND RELATED TRANSACTIONS, AND DIRECTOR INDEPENDENCE
Incorporated herein by reference is the information to be set forth under the captions “Ethics and Corporate Governance-Corporate Governance-Board of Director Review and Approval of Related Person Transactions,” “Executive Compensation,” “Executive Compensation Tables” and “Ethics and Corporate Governance-Corporate Governance-Board Composition and Independence” in the 2018 Proxy Statement.
ITEM 14 — PRINCIPAL ACCOUNTING FEES AND SERVICES
Incorporated herein by reference is the information with respect to pre-approval policies set forth under the caption “Proposal II. Ratification of PricewaterhouseCoopers LLP as our Independent Registered Public Accounting Firm for the Fiscal Year ending June 30, 2019-Audit Committee Pre-Approval Policy” and the information with respect to principal accountant fees and services set forth under “Proposal II. Ratification of PricewaterhouseCoopers LLP as our Independent Registered Public Accounting Firm for the Fiscal Year ending June 30, 2019-Fees and Services” to be set forth in the 2018 Proxy Statement.
76
SIGNATURES
Pursuant to the requirements of Section 13 or 15(d) of the Securities Exchange Act of 1934, the registrant has duly caused this report to be signed on its behalf by the undersigned, thereunto duly authorized.
KENNAMETAL INC. | ||||||
Date: August 10, 2018 | By: | /s/ Patrick S. Watson | ||||
Patrick S. Watson | ||||||
Vice President Finance and Corporate Controller | ||||||
Pursuant to the requirements of the Securities Exchange Act of 1934, this report has been signed below by the following persons on behalf of the registrant and in the capacities and on the dates indicated.
SIGNATURE | TITLE | DATE | ||
/s/ CHRISTOPHER ROSSI Christopher Rossi | President and Chief Executive Officer | August 10, 2018 | ||
/s/ JAN KEES VAN GAALEN Jan Kees van Gaalen | Vice President and Chief Financial Officer | August 10, 2018 | ||
/s/ PATRICK S. WATSON Patrick S. Watson | Vice President Finance and Corporate Controller | August 10, 2018 | ||
/s/ LAWRENCE W. STRANGHOENER Lawrence W. Stranghoener | Chairman of the Board | August 10, 2018 | ||
/s/ JOSEPH ALVARADO Joseph Alvarado | Director | August 10, 2018 | ||
/s/ CINDY L. DAVIS Cindy L. Davis | Director | August 10, 2018 | ||
/s/ RONALD M. DE FEO Ronald M. De Feo | Director | August 10, 2018 | ||
/s/ WILLIAM J. HARVEY William J. Harvey | Director | August 10, 2018 | ||
/s/ WILLIAM M. LAMBERT William M. Lambert | Director | August 10, 2018 | ||
/s/ LORRAINE MARTIN Lorraine Martin | Director | August 10, 2018 | ||
/s/ TIMOTHY R. MCLEVISH Timothy R. McLevish | Director | August 10, 2018 | ||
/s/ SAGAR A. PATEL Sagar A. Patel | Director | August 10, 2018 | ||
/s/ STEVEN H. WUNNING Steven H. Wunning | Director | August 10, 2018 | ||
77
PART IV
ITEM 15 — EXHIBITS, FINANCIAL STATEMENT SCHEDULES
(a) Documents filed as part of this Form 10-K report.
1. Financial Statements included in Part II, Item 8
2. Financial Statement Schedule
The financial statement schedule required by Part II, Item 8 of this document is filed as part of this report. All of the other schedules are omitted as the required information is inapplicable or the information is presented in our consolidated financial statements or related notes.
FINANCIAL STATEMENT SCHEDULE | Page | |
Schedule II—Valuation and Qualifying Accounts and Reserves for the Years Ended June 30, 2018, 2017 and 2016
3. Exhibits
3 | Articles of Incorporation and Bylaws | ||||
3.1 | Exhibit 3.(i) of the Form 8-K filed October 30, 2014 (File No. 001-05318) is incorporated herein by reference. | ||||
3.2 | Exhibit 10.1 of the Form 8-K filed July 28, 2016 (File No. 001-05318) is incorporated herein by reference. | ||||
4 | Instruments Defining the Rights of Security Holders, Including Indentures | ||||
4.1 | Exhibit 4.1 of the Form 8-K filed June 20, 2002 (File No. 001-05318) is incorporated herein by reference. | ||||
4.2 | Exhibit 4.2 of the Form 8-K filed June 20, 2002 (File No. 001-05318) is incorporated herein by reference. | ||||
4.3 | Exhibit 4.1 of the Form 8-K filed February 14, 2012 (File No. 001-05318) is incorporated herein by reference. | ||||
4.4 | Exhibit 4.2 of the Form 8-K filed February 14, 2012 (File No. 001-05318) is incorporated herein by reference. | ||||
4.5 | Exhibit 4.4 of the Form 8-K filed November 7, 2012 (File No. 001-05318) is incorporated herein by reference. | ||||
4.6 | Exhibit 4.1 of the Form 8-K filed June 7, 2018 (File No. 001-05318) is incorporated herein by reference. | ||||
10 | Material Contracts | ||||
10.1* | Exhibit 10.1 of the December 31, 2008 Form 10-Q filed February 4, 2009 (File No. 001-05318) is incorporated herein by reference. | ||||
10.2* | Exhibit 10.2 of the December 31, 2008 Form 10-Q filed February 4, 2009 (File No. 001-05318) is incorporated herein by reference. | ||||
10.3* | Exhibit 10.3 of the December 31, 2008 Form 10-Q filed February 4, 2009 (File No. 001-05318) is incorporated herein by reference. | ||||
10.4* | Appendix A to the 2008 Proxy Statement filed September 8, 2008 (File No. 001-05318) is incorporated herein by reference. | ||||
10.5* | Exhibit 10.2 of the Form 8-K filed March 22, 2005 (File No. 001-05318) is incorporated herein by reference. | ||||
10.6* | Filed herewith. | ||||
10.7* | Exhibit 10.8 of the December 31, 2008 Form 10-Q filed February 4, 2009 (File No. 001-05318) is incorporated herein by reference. | ||||
10.8* | Exhibit 10.2 to the Form 8-K dated February 2, 2015 (File No. 001-05318) is incorporated herein by reference. | ||||
78
10.9* | Exhibit 10.1 of the Form 8-K filed June 23, 2015 (File No. 001-05318) is incorporated herein by reference. | ||||
10.10* | Exhibit 10.9 of the December 31, 2008 Form 10-Q filed February 4, 2009 (File No. 001-05318) is incorporated herein by reference. | ||||
10.11* | Exhibit 10.2 of the Form 8-K filed June 23, 2015 (File No. 001-05318) is incorporated herein by reference. | ||||
10.12* | Filed herewith. | ||||
10.13* | Exhibit 10.5 of Form 10-Q filed February 8, 2011 (File No. 001-05318) is incorporated herein by reference. | ||||
10.14* | Exhibit 10.6 of Form 10-Q filed February 8, 2011 (File No. 001-05318) is incorporated herein by reference | ||||
10.15* | Exhibit 10.1 of Form 8-K filed May 13, 2011 (File No. 001-05318) is incorporated herein by reference. | ||||
10.16* | Filed herewith. | ||||
10.17* | Exhibit 10.3 to Form 8-K filed February 5, 2016 (File No. 001-05318) is incorporated herein by reference | ||||
10.18* | Exhibit 10.2 to Form 8-K filed February 5, 2016 (File No. 001-05318) is incorporated herein by reference | ||||
10.19* | Exhibit 10.40 of the Form 10-K filed August 11, 2016 (File No. 001-05318) is incorporated herein by reference. | ||||
10.20* | Exhibit 10.41 of the Form 10-K filed August 11, 2016 (File No. 001-05318) is incorporated herein by reference. | ||||
10.21* | Appendix A of the 2013 Proxy Statement filed September 17, 2013 (File No. 001-05318) is incorporated herein by reference. | ||||
10.22* | Exhibit 10.39 of Form 10-K filed August 13, 2014 (File No. 001-05318) is incorporated herein by reference. | ||||
10.23* | Exhibit 10.41 of Form 10-K filed August 13, 2014 (File No. 001-05318) is incorporated herein by reference. | ||||
10.24* | Exhibit 10.42 of Form 10-K filed August 13, 2014 (File No. 001-05318) is incorporated herein by reference. | ||||
10.25* | Exhibit 10.43 of Form 10-K filed August 13, 2014 (File No. 001-05318) is incorporated herein by reference. | ||||
10.26* | Exhibit 10.45 of Form 10-K filed August 13, 2014 (File No. 001-05318) is incorporated herein by reference. | ||||
10.27* | Exhibit 10.46 of Form 10-K filed August 13, 2014 (File No. 001-05318) is incorporated herein by reference. | ||||
10.28* | Exhibit 10.1 to the Form 8-K dated February 2, 2015 (File No. 001-05318) is incorporated herein by reference. | ||||
10.29* | Exhibit 10.3 to the Form 8-K dated February 2, 2015 (File No. 001-05318) is incorporated herein by reference. | ||||
10.30* | Exhibit 10.4 to the Form 8-K dated February 2, 2015 (File No. 001-05318) is incorporated herein by reference. | ||||
79
10.31* | Exhibit 10.5 to the Form 8-K dated February 2, 2015 (File No. 001-05318) is incorporated herein by reference. | ||||
10.32* | Exhibit 10.6 to the Form 8-K dated February 2, 2015 (File No. 001-05318) is incorporated herein by reference. | ||||
10.33* | Exhibit 10.8 to the Form 8-K dated February 2, 2015 (File No. 001-05318) is incorporated herein by reference. | ||||
10.34* | Exhibit 10.9 to the Form 8-K dated February 2, 2015 (File No. 001-05318) is incorporated herein by reference. | ||||
10.35* | Exhibit 10.10 to the Form 8-K dated February 2, 2015 (File No. 001-05318) is incorporated herein by reference. | ||||
10.36* | Exhibit 10.12 to the Form 8-K dated February 2, 2015 (File No. 001-05318) is incorporated herein by reference. | ||||
10.37* | Exhibit 10.1 to the Form 8-K dated July 30, 2015, (File No. 001-05318) is incorporated herein by reference. | ||||
10.38* | Exhibit 10.3 to the Form 8-K dated July 30, 2015, (File No. 001-05318) is incorporated herein by reference. | ||||
10.39* | Exhibit 10.5 to the Form 8-K dated July 30, 2015, (File No. 001-05318) is incorporated herein by reference. | ||||
10.40* | Exhibit 10.6 to the Form 8-K dated July 30, 2015, (File No. 001-05318) is incorporated herein by reference. | ||||
10.41* | Exhibit 10.7 to the Form 8-K dated July 30, 2015, (File No. 001-05318) is incorporated herein by reference. | ||||
10.42* | Exhibit 10.9 to the Form 8-K dated July 30, 2015, (File No. 001-05318) is incorporated herein by reference. | ||||
10.43* | Appendix C of 2016 Proxy Statement filed September 13, 2016 (File No. 001-05318) is incorporated by reference herein. | ||||
10.44* | Exhibit 10.1 of the Form 10-Q filed November 7, 2016 (File No. 001-05318) is incorporated by reference herein. | ||||
10.45* | Exhibit 10.2 of the Form 10-Q filed November 7, 2016 (File No. 001-05318) is incorporated by reference herein. | ||||
10.46* | Exhibit 10.4 of the Form 10-Q filed November 7, 2016 (File No. 001-05318) is incorporated by reference herein. | ||||
10.47* | Exhibit 10.5 of the Form 10-Q filed November 7, 2016 (File No. 001-05318) is incorporated by reference herein. | ||||
10.48* | Exhibit 10.1 of the Form 10-Q filed February 8, 2017 (File No. 001-05318) is incorporated by reference herein. | ||||
10.49* | Exhibit 10.74 to Form 10-K filed August 14, 2017 (File No. 001-05318) is incorporated by reference herein. | ||||
80
10.50* | Exhibit 10.75 to Form 10-K filed August 14, 2017 (File No. 001-05318) is incorporated by reference herein. | ||||
10.51* | Exhibit 10.76 to Form 10-K filed August 14, 2017 (File No. 001-05318) is incorporated by reference herein. | ||||
10.52* | Exhibit 10.77 to Form 10-K filed August 14, 2017 (File No. 001-05318) is incorporated by reference herein. | ||||
10.53* | Filed herewith. | ||||
10.54* | Exhibit 10.78 to Form 10-K filed August 14, 2017 (File No. 001-05318) is incorporated by reference herein. | ||||
10.55* | Exhibit 10.79 to Form 10-K filed August 14, 2017 (File No. 001-05318) is incorporated by reference herein. | ||||
10.56* | Exhibit 10.1 of the Form 8-K filed June 29, 2017 (File No. 001-05318) is incorporated herein by reference. | ||||
10.57* | Exhibit 10.1 of the Form 8-K filed November 3, 2017 (File No. 001-05318) is incorporated herein by reference. | ||||
10.58* | Exhibit 10.2 of the Form 8-K filed November 3, 2017 (File No. 001-05318) is incorporated herein by reference. | ||||
10.59* | Exhibit 10.1 of the Form 8-K filed January 31, 2018 (File No. 001-05318) is incorporated herein by reference. | ||||
10.60* | Filed herewith. | ||||
10.61* | Filed herewith. | ||||
10.62 | Exhibit 10.1 of the Form 8-K filed June 22, 2018 (File No. 001-05318) is incorporated herein by reference. | ||||
21 | Filed herewith. | ||||
23 | Filed herewith. | ||||
31 | Certifications | ||||
31.1 | Filed herewith. | ||||
31.2 | Filed herewith. | ||||
32 | Section 1350 Certifications | ||||
32.1 | Filed herewith. | ||||
*Denotes management contract or compensatory plan or arrangement. | |||||
101 | XBRL | ||||
101.INS | XBRL Instance Document. | Filed herewith. | |||
101.SCH | XBRL Taxonomy Extension Schema Document. | Filed herewith. | |||
101.CAL | XBRL Taxonomy Extension Calculation Linkbase Document. | Filed herewith. | |||
101.DEF | XBRL Taxonomy Definition Linkbase | Filed herewith. | |||
101.LAB | XBRL Taxonomy Extension Label Linkbase Document. | Filed herewith. | |||
101.PRE | XBRL Taxonomy Extension Presentation Linkbase Document. | Filed herewith. | |||
81
SCHEDULE II — VALUATION AND QUALIFYING ACCOUNTS AND RESERVES
(In thousands) For the year ended June 30 | Balance at Beginning of Year | Charges to Costs and Expenses | Charged to Other Comprehensive Income (Loss) | Recoveries | Other Adjustments | Deductions from Reserves | Balance at End of Year | ||||||||||||||||||||||||
2018 | |||||||||||||||||||||||||||||||
Allowance for doubtful accounts | $ | 13,693 | $ | 1,831 | $ | — | $ | 559 | $ | (135 | ) | (1) | $ | (4,141 | ) | (2) | $ | 11,807 | |||||||||||||
Reserve for excess and obsolete inventory | 32,114 | 9,067 | — | — | 108 | (1) | (10,032 | ) | (3) | 31,257 | |||||||||||||||||||||
Deferred tax asset valuation allowance | 116,770 | (94,641 | ) | (7) | 511 | — | (1,011 | ) | (1) | — | 21,629 | ||||||||||||||||||||
2017 | |||||||||||||||||||||||||||||||
Allowance for doubtful accounts | $ | 12,724 | $ | 3,589 | $ | — | $ | 45 | $ | (24 | ) | (1) | $ | (2,641 | ) | (2) | $ | 13,693 | |||||||||||||
Reserve for excess and obsolete inventory | 36,713 | 9,603 | — | — | 328 | (1) | (14,530 | ) | (3) | 32,114 | |||||||||||||||||||||
Deferred tax asset valuation allowance | 122,699 | 2,361 | (5,805 | ) | — | (2,485 | ) | (6) | — | 116,770 | |||||||||||||||||||||
2016 | |||||||||||||||||||||||||||||||
Allowance for doubtful accounts | $ | 13,560 | $ | 4,827 | $ | — | $ | 31 | $ | (601 | ) | (4) | $ | (5,093 | ) | (2) | $ | 12,724 | |||||||||||||
Reserve for excess and obsolete inventory | 45,020 | 5,393 | — | — | (3,372 | ) | (4) | (10,328 | ) | (3) | 36,713 | ||||||||||||||||||||
Deferred tax asset valuation allowance | 16,771 | 85,361 | (5) | 24,666 | (5) | — | (4,099 | ) | (4) | — | 122,699 | ||||||||||||||||||||
(1)Represents foreign currency translation adjustment.
(2)Represents uncollected accounts charged against the allowance.
(3)Represents scrapped inventory and other charges against the reserve.
(4)Represents foreign currency translation adjustment and reserves divested through business combinations.
(5)Represents primarily effects from the recording of a valuation allowance against our net deferred tax assets in the U.S.
(6)Represents the shortfall on restricted stock units and non-qualified stock options which resulted in a reduction of our deferred tax asset and
subsequently the valuation allowance, in addition to foreign currency translation adjustment.
(7)Represents primarily the effects from the release of the valuation allowance against our net deferred tax assets in the U.S.
ITEM 16 — FORM 10-K SUMMARY
None.
82