Attached files
| file | filename |
|---|---|
| EX-31.2 - CERTIFICATION - IT TECH PACKAGING, INC. | f10q0618ex31-2_ittechpack.htm |
| EX-32.2 - CERTIFICATION - IT TECH PACKAGING, INC. | f10q0618ex32-2_ittechpack.htm |
| EX-32.1 - CERTIFICATION - IT TECH PACKAGING, INC. | f10q0618ex32-1_ittechpack.htm |
| EX-31.1 - CERTIFICATION - IT TECH PACKAGING, INC. | f10q0618ex31-1_ittechpack.htm |
UNITED STATES
SECURITIES AND EXCHANGE COMMISSION
Washington, D.C. 20549
FORM 10-Q
(Mark One)
☒ QUARTERLY REPORT UNDER SECTION 13 OR 15(d) OF THE SECURITIES EXCHANGE ACT OF 1934
For the quarterly period ended June 30, 2018
or
☐ TRANSITION REPORT UNDER SECTION 13 OR 15(d) OF THE SECURITIES EXCHANGE ACT OF 1934
For the transition period from _______ to _______
Commission file number: 001-34577
| IT TECH PACKAGING, INC. |
| (Exact name of registrant as specified in its charter) |
| Nevada | 20-4158835 | |
(State or other jurisdiction of incorporation or organization) |
(IRS Employer identification No.) |
Science Park, Juli Rd, Xushui District, Baoding City Hebei Province, The People’s Republic of China 072550 |
| (Address of principal executive offices and Zip Code) |
| 011 - (86) 312-8698215 |
| (Registrant’s telephone number, including area code) |
| [Orient Paper, Inc.] |
| (Former name, former address and former fiscal year, if changed since last report) |
Indicate by check mark whether the registrant (1) has filed all reports required to be filed by Section 13 or 15(d) of the Securities Exchange Act of 1934 during the preceding 12 months (or for such shorter period that the registrant was required to file such reports), and (2) has been subject to such filing requirements for the past 90 days. Yes ☒ No ☐
Indicate by check mark whether the registrant has submitted electronically and posted on its corporate Web site, if any, every Interactive Data File required to be submitted and posted pursuant to Rule 405 of Regulation S-T (§232.405 of this chapter) during the preceding 12 months (or for such shorter period that the registrant was required to submit and post such files). Yes ☒ No ☐
Indicate by check mark whether the registrant is a large accelerated filer, an accelerated filer, a non-accelerated filer, smaller reporting company, or an emerging growth company. See the definitions of “large accelerated filer,” “accelerated filer,” “smaller reporting company,” and “emerging growth company” in Rule 12b-2 of the Exchange Act.
| Large accelerated filer | ☐ | Accelerated filer | ☐ |
| Non-accelerated filer | ☐ (Do not check if a smaller reporting company) | Smaller reporting company | ☒ |
| Emerging growth company | ☐ | ||
If an emerging growth company, indicate by check mark if the registrant has elected not to use the extended transition period for complying with any new or revised financial accounting standards provided pursuant to Section 13(a) of the Exchange Act. ☐
Indicate by check mark whether the registrant is a shell company (as defined in Rule 12b-2 of the Exchange Act.): Yes ☐ No ☒
As of August 9, 2018, there were 21,450,316 shares of the registrant’s common stock, par value $0.001, outstanding.
TABLE OF CONTENTS
| Part I. - FINANCIAL INFORMATION | 1 |
| Item 1. Financial Statements | 1 |
| Item 2. Management’s Discussion and Analysis of Financial Condition and Results of Operations | 24 |
| Item 3. Quantitative and Qualitative Disclosures About Market Risk | 40 |
| Item 4. Controls and Procedures | 40 |
| Part II. - OTHER INFORMATION | 41 |
| Item 1. Legal Proceedings | 41 |
| Item 1A. Risk Factors | 41 |
| Item 2. Unregistered Sales of Equity Securities and Use of Proceeds | 41 |
| Item 3. Defaults Upon Senior Securities | 41 |
| Item 4. Mine Safety Disclosures | 41 |
| Item 5. Other Information | 41 |
| Item 6. Exhibits | 41 |
| SIGNATURES | 42 |
i
PART I - FINANCIAL INFORMATION
| Item 1. | Financial Statements |
IT TECH PACKAGING, INC.
CONDENSED CONSOLIDATED BALANCE SHEETS
AS OF JUNE 30, 2018 AND DECEMBER 31, 2017
(Unaudited)
| June 30, | December 31, | |||||||
| 2018 | 2017 | |||||||
| ASSETS | ||||||||
| Current Assets | ||||||||
| Cash and bank balances | $ | 5,745,284 | $ | 2,895,790 | ||||
| Restricted cash | 3,778,376 | 6,121,637 | ||||||
| Accounts receivable (net of allowance for doubtful accounts of $55,570 and $37,626 as of June 30, 2018 and December 2017, respectively) | 2,722,949 | 1,843,682 | ||||||
| Inventories | 4,055,222 | 8,474,165 | ||||||
| Prepayments and other current assets | 2,927,813 | 651,523 | ||||||
| Total current assets | 19,229,644 | 19,986,797 | ||||||
| Property, plant, and equipment, net | 181,057,430 | 189,388,709 | ||||||
| Value-added tax recoverable | 2,957,782 | 3,041,416 | ||||||
| Deferred tax asset non-current | 7,544,387 | 6,572,559 | ||||||
| Total Assets | $ | 210,789,243 | $ | 218,989,481 | ||||
| LIABILITIES AND STOCKHOLDERS' EQUITY | ||||||||
| Current Liabilities | ||||||||
| Short-term bank loans | $ | 12,393,072 | $ | 7,192,923 | ||||
| Current portion of long-term loans from credit union | 7,466,070 | 6,366,502 | ||||||
| Accounts payable | 135,853 | 422,705 | ||||||
| Notes payable | 3,778,376 | 6,121,637 | ||||||
| Due to related parties | 238,428 | 60,378 | ||||||
| Accrued payroll and employee benefits | 223,609 | 231,247 | ||||||
| Other payables and accrued liabilities | 1,387,368 | 836,337 | ||||||
| Income taxes payable | - | 525,804 | ||||||
| Total current liabilities | 25,622,776 | 21,757,533 | ||||||
| Loans from credit union | - | 1,193,719 | ||||||
| Loans from a related party | 6,045,401 | 10,712,865 | ||||||
| Total liabilities (including amounts of the consolidated VIE without recourse to the Company of $29,172,590 and $31,235,520 as of June 30, 2018 and 2017, respectively) | 31,668,177 | 33,664,117 | ||||||
| Commitments and Contingencies | ||||||||
| Stockholders' Equity | ||||||||
| Common stock, 500,000,000 shares authorized, $0.001 par value per share, 21,450,316 shares issued and outstanding as of June 30, 2018 and 2017, respectively | 21,450 | 21,450 | ||||||
| Additional paid-in capital | 50,635,243 | 50,635,243 | ||||||
| Statutory earnings reserve | 6,080,574 | 6,080,574 | ||||||
| Accumulated other comprehensive income | 3,240,783 | 5,468,799 | ||||||
| Retained earnings | 119,143,016 | 123,119,298 | ||||||
| Total stockholders' equity | 179,121,066 | 185,325,364 | ||||||
| Total Liabilities and Stockholders' Equity | $ | 210,789,243 | $ | 218,989,481 | ||||
See accompanying notes to condensed consolidated financial statements.
| 1 |
IT TECH PACKAGING, INC.
CONDENSED CONSOLIDATED STATEMENTS OF INCOME AND COMPREHENSIVE INCOME
FOR THE THREE AND SIX MONTHS ENDED JUNE 30, 2018 AND 2017
(Unaudited)
| Three Months Ended | Six Months Ended | |||||||||||||||
| June 30, | June 30, | |||||||||||||||
| 2018 | 2017 | 2018 | 2017 | |||||||||||||
| Revenues | $ | 33,149,190 | $ | 22,787,683 | $ | 35,037,384 | $ | 48,077,342 | ||||||||
| Cost of sales | (30,133,768 | ) | (19,323,017 | ) | (32,717,270 | ) | (38,958,756 | ) | ||||||||
| Gross Profit | 3,015,422 | 3,464,666 | 2,320,114 | 9,118,586 | ||||||||||||
| Selling, general and administrative expenses | (3,027,265 | ) | (2,688,549 | ) | (6,841,059 | ) | (5,470,891 | ) | ||||||||
| Gain (Loss) from disposal of property, plant and equipment | 113 | (12,101 | ) | (10,263 | ) | (12,101 | ) | |||||||||
| (Loss) Income from Operations | (11,730 | ) | 764,016 | (4,531,208 | ) | 3,635,594 | ||||||||||
| Other Income (Expense): | ||||||||||||||||
| Interest income | (17,344 | ) | 5,811 | 27,419 | 23,756 | |||||||||||
| Subsidy income | (2,772 | ) | 101 | 250,509 | 40,813 | |||||||||||
| Interest expense | (407,182 | ) | (696,530 | ) | (810,993 | ) | (1,375,614 | ) | ||||||||
| (Loss) Income before Income Taxes | (439,028 | ) | 73,398 | (5,064,273 | ) | 2,324,549 | ||||||||||
| Provision for Income Taxes | 549,022 | (57,481 | ) | 1,087,991 | (600,763 | ) | ||||||||||
| Net Income (Loss) | 109,994 | 15,917 | (3,976,282 | ) | 1,723,786 | |||||||||||
| Other Comprehensive (Loss) Income | ||||||||||||||||
| Foreign currency translation adjustment | (9,603,574 | ) | 3,288,469 | (2,228,016 | ) | 4,244,761 | ||||||||||
| Total Comprehensive (Loss) Income | $ | (9,493,580 | ) | $ | 3,304,386 | $ | (6,204,298 | ) | $ | 5,968,547 | ||||||
| Earnings (Losses) Per Share: | ||||||||||||||||
| Basic and Diluted Earnings (Losses) per Share | $ | 0.01 | $ | 0.00 | $ | (0.19 | ) | $ | 0.08 | |||||||
| Outstanding – Basic and Diluted | 21,450,316 | 21,450,316 | 21,450,316 | 21,450,316 | ||||||||||||
See accompanying notes to condensed consolidated financial statements.
| 2 |
IT TECH PACKAGING, INC.
CONDENSED CONSOLIDATED STATEMENTS OF CASH FLOWS
FOR THE SIX MONTHS ENDED JUNE 30, 2018 AND 2017
(Unaudited)
| Six Months Ended | ||||||||
| June 30, | ||||||||
| 2018 | 2017 | |||||||
| Cash Flows from Operating Activities: | ||||||||
| Net income | $ | (3,976,282 | ) | $ | 1,723,786 | |||
| Adjustments to reconcile net income to net cash provided by operating activities: | ||||||||
| Depreciation and amortization | 7,410,833 | 7,199,500 | ||||||
| Loss from disposal of property, plant and equipment | 10,263 | 12,101 | ||||||
| (Recovery from) Allowance for bad debts | 19,075 | (34,779 | ) | |||||
| Share-based compensation expenses | - | - | ||||||
| Deferred tax | (1,091,557 | ) | (1,288,588 | ) | ||||
| Changes in operating assets and liabilities: | ||||||||
| Accounts receivable | (953,735 | ) | 1,738,942 | |||||
| Prepayments and other current assets | (2,319,121 | ) | (2,362,865 | ) | ||||
| Inventories | 4,468,468 | (4,609,040 | ) | |||||
| Accounts payable | (291,710 | ) | (224,074 | ) | ||||
| Advance from customers | - | (29,152 | ) | |||||
| Notes payable | (2,348,520 | ) | 3,643,943 | |||||
| Due to related parties | 78,284 | 72,879 | ||||||
| Accrued payroll and employee benefits | (4,929 | ) | 12,772 | |||||
| Other payables and accrued liabilities | 684,864 | (1,383,446 | ) | |||||
| Income taxes payable | (537,772 | ) | (732,440 | ) | ||||
| Net Cash Provided by Operating Activities | 1,148,161 | 3,739,539 | ||||||
| Cash Flows from Investing Activities: | ||||||||
| Purchases of property, plant and equipment | (1,233,667 | ) | (5,900,335 | ) | ||||
| Proceeds from sale of property, plant and equipment | - | 24,522 | ||||||
| Net Cash Used in Investing Activities | (1,233,667 | ) | (5,875,813 | ) | ||||
| Cash Flows from Financing Activities: | ||||||||
| Proceeds from related party loans | 4,697,041 | - | ||||||
| Repayments of related party loans | (9,394,082 | ) | - | |||||
| Proceeds from short term bank loans | 9,863,786 | 9,911,525 | ||||||
| Repayment of bank loans | (4,383,905 | ) | - | |||||
| Proceeds from credit union loans | 2,332,124 | |||||||
| Payment of capital lease obligation | - | (2,030,900 | ) | |||||
| Net Cash Provided by Financing Activities | 782,840 | 10,212,749 | ||||||
| Effect of Exchange Rate Changes on Cash and Cash Equivalents | (191,101 | ) | 287,083 | |||||
| Net Increase in Cash and Cash Equivalents | 506,233 | 8,363,558 | ||||||
| Cash, Cash Equivalents and Restricted Cash - Beginning of Period | 9,017,427 | 4,494,964 | ||||||
| Cash, Cash Equivalents and Restricted Cash - End of Period | $ | 9,523,660 | $ | 12,858,522 | ||||
| Supplemental Disclosure of Cash Flow Information: | ||||||||
| Cash paid for interest, net of capitalized interest cost | $ | 1,110,879 | $ | 1,034,757 | ||||
| Cash paid for income taxes | $ | 534,901 | $ | 2,621,791 | ||||
| Cash and bank balances | 5,745,284 | 6,953,940 | ||||||
| Restricted cash | 3,778,376 | 5,904,582 | ||||||
| Total cash, cash equivalents and restricted cash shown in the statement of cash flows | 9,523,660 | 12,858,522 | ||||||
See accompanying notes to condensed consolidated financial statements.
| 3 |
IT TECH PACKAGING, INC.
NOTES TO CONDENSED CONSOLIDATED FINANCIAL STATEMENTS
(Unaudited)
(1) Organization and Business Background
IT Tech Packaging, Inc. (the Company) was incorporated in the State of Nevada on December 9, 2005, under the name “Carlateral, Inc.” Through the steps described immediately below, we became the holding company for Hebei Baoding Dongfang Paper Milling Company Limited (“Dongfang Paper”), a producer and distributor of paper products in China, on October 29, 2007, and effective December 21, 2007, we changed our name to “Orient Paper, Inc.”.
Effective on August 1, 2018, we changed our corporate name to IT Tech Packaging, Inc.. The name change was effected through a parent/subsidiary short-form merger of IT Tech Packaging, Inc., our wholly-owned Nevada subsidiary formed solely for the purpose of the name change, with and into us. We were the surviving entity. In connection with the name change, our common stock began being traded under a new NYSE symbol, “ITP,” and a new CUSIP number, 46527C100, at such time.
On October 29, 2007, pursuant to an agreement and plan of merger (the “Merger Agreement”), the Company acquired Dongfang Zhiye Holding Limited (“Dongfang Holding”), a corporation formed on November 13, 2006 under the laws of the British Virgin Islands, and issued the shareholders of Dongfang Holding an aggregate of 7,450,497 (as adjusted for a four-for-one reverse stock split effected in November 2009) shares of our common stock, which shares were distributed pro-rata to the shareholders of Dongfang Holding in accordance with their respective ownership interests in Dongfang Holding. At the time of the Merger Agreement, Dongfang Holding owned all of the issued and outstanding stock and ownership of Dongfang Paper and such shares of Dongfang Paper were held in trust with Zhenyong Liu, Xiaodong Liu and Shuangxi Zhao, for Mr. Liu, Mr. Liu and Mr. Zhao (the original shareholders of Dongfang Paper) to exercise control over the disposition of Dongfang Holding’s shares in Dongfang Paper on Dongfang Holding’s behalf until Dongfang Holding successfully completed the change in registration of Dongfang Paper’s capital with the relevant PRC Administration of Industry and Commerce as the 100% owner of Dongfang Paper’s shares. As a result of the merger transaction, Dongfang Holding became a wholly owned subsidiary of the Company, and Dongfang Holding’s wholly owned subsidiary, Dongfang Paper, became an indirectly owned subsidiary of the Company.
Dongfang Holding, as the 100% owner of Dongfang Paper, was unable to complete the registration of Dongfang Paper’s capital under its name within the proper time limits set forth under PRC law. In connection with the consummation of the restructuring transactions described below, Dongfang Holding directed the trustees to return the shares of Dongfang Paper to their original shareholders, and the original Dongfang Paper shareholders entered into certain agreements with Baoding Shengde Paper Co., Ltd. (“Baoding Shengde”) to transfer the control of Dongfang Paper over to Baoding Shengde.
On June 24, 2009, the Company consummated a number of restructuring transactions pursuant to which it acquired all of the issued and outstanding shares of Shengde Holdings Inc, a Nevada corporation. Shengde Holdings Inc was incorporated in the State of Nevada on February 25, 2009. On June 1, 2009, Shengde Holdings Inc incorporated Baoding Shengde, a limited liability company organized under the laws of the PRC. Because Baoding Shengde is a wholly-owned subsidiary of Shengde Holdings Inc, it is regarded as a wholly foreign-owned entity under PRC law.
| 4 |
IT TECH PACKAGING, INC.
NOTES TO CONDENSED CONSOLIDATED FINANCIAL STATEMENTS
(Unaudited)
To ensure proper compliance of the Company’s control over the ownership and operations of Dongfang Paper with certain PRC regulations, on June 24, 2009, the Company entered into a series of contractual agreements (the “Contractual Agreements”) with Dongfang Paper and Dongfang Paper Equity Owners via the Company’s wholly owned subsidiary Shengde Holdings Inc (“Shengde Holdings”) a Nevada corporation and Baoding Shengde Paper Co., Ltd. (“Baoding Shengde”), a wholly foreign-owned enterprise in the PRC with an original registered capital of $10,000,000 (subsequently increased to $60,000,000 in June 2010). Baoding Shengde is mainly engaged in production and distribution of digital photo paper and is 100% owned by Shengde Holdings. Prior to February 10, 2010, the Contractual Agreements included (i) Exclusive Technical Service and Business Consulting Agreement, which generally provides that Baoding Shengde shall provide exclusive technical, business and management consulting services to Dongfang Paper, in exchange for service fees including a fee equivalent to 80% of Dongfang Paper’s total annual net profits; (ii) Loan Agreement, which provides that Baoding Shengde will make a loan in the aggregate principal amount of $10,000,000 to Dongfang Paper Equity Owners in exchange for each such shareholder agreeing to contribute all of its proceeds from the loan to the registered capital of Dongfang Paper; (iii) Call Option Agreement, which generally provides, among other things, that Dongfang Paper Equity Owners irrevocably grant to Baoding Shengde an option to purchase all or part of each owner’s equity interest in Dongfang Paper. The exercise price for the options shall be RMB1 which Baoding Shengde should pay to each of Dongfang Paper Equity Owner for all their equity interests in Dongfang Paper; (iv) Share Pledge Agreement, which provides that Dongfang Paper Equity Owners will pledge all of their equity interests in Dongfang Paper to Baoding Shengde as security for their obligations under the other agreements described in this section. Specifically, Baoding Shengde is entitled to dispose of the pledged equity interests in the event that Dongfang Paper Equity Owners breach their obligations under the Loan Agreement or Dongfang Paper fails to pay the service fees to Baoding Shengde pursuant to the Exclusive Technical Service and Business Consulting Agreement; and (v) Proxy Agreement, which provides that Dongfang Paper Equity Owners shall irrevocably entrust a designee of Baoding Shengde with such shareholder’s voting rights and the right to represent such shareholder to exercise such owner’s rights at any equity owners’ meeting of Dongfang Paper or with respect to any equity owner action to be taken in accordance with the laws and Dongfang Paper’s Articles of Association. The terms of the agreement are binding on the parties for as long as Dongfang Paper Equity Owners continue to hold any equity interest in Dongfang Paper. An Dongfang Paper Equity Owner will cease to be a party to the agreement once it transfers its equity interests with the prior approval of Baoding Shengde. As the Company had controlled Dongfang Paper since July 16, 2007 through Dongfang Holding and the trust until June 24, 2009, and continues to control Dongfang Paper through Baoding Shengde and the Contractual Agreements, the execution of the Contractual Agreements is considered as a business combination under common control.
On February 10, 2010, Baoding Shengde and the Dongfang Paper Equity Owners entered into a Termination of Loan Agreement to terminate the above-mentioned $10,000,000 Loan Agreement. Because of the Company’s decision to fund future business expansions through Baoding Shengde instead of Dongfang Paper, the $10,000,000 loan contemplated was never made prior to the point of termination. The parties believe the termination of the Loan Agreement does not in itself compromise the effective control of the Company over Dongfang Paper and its businesses in the PRC.
An agreement was also entered into among Baoding Shengde, Dongfang Paper and the Dongfang Paper Equity Owners on December 31, 2010, reiterating that Baoding Shengde is entitled to 100% of the distributable profit of Dongfang Paper, pursuant to the above mentioned Contractual Agreements. In addition, Dongfang Paper and the Dongfang Paper Equity Owners shall not declare any of Dongfang Paper’s unappropriated earnings as dividend, including the unappropriated earnings of Dongfang Paper from its establishment to 2010 and thereafter.
The Company has no direct equity interest in Dongfang Paper. However, through the Contractual Agreements described above, the Company is found to be the primary beneficiary (the “Primary Beneficiary”) of Dongfang Paper and is deemed to have the effective control over Dongfang Paper’s activities that most significantly affect its economic performance, resulting in Dongfang Paper being treated as a controlled variable interest entity of the Company in accordance with Topic 810 - Consolidation of the Accounting Standards Codification (the “ASC”) issued by the Financial Accounting Standard Board (the “FASB”). The revenue generated from Dongfang Paper for the three months and six months ended June 30, 2018 and 2017 was accounted for 100%, of the Company’s total revenue for the same periods. Dongfang Paper also accounted for 88.24% and 87.96% of the total assets of the Company as of June 30, 2018 and December 31, 2017, respectively.
| 5 |
IT TECH PACKAGING, INC.
NOTES TO CONDENSED CONSOLIDATED FINANCIAL STATEMENTS
(Unaudited)
As of June 30, 2018 and December 31, 2017, details of the Company’s subsidiaries and variable interest entities are as follows:
| Date of Incorporation |
Place of Incorporation or |
|
Percentage of | |||||||
| Name | or Establishment | Establishment | Ownership | Principal Activity | ||||||
| Subsidiary: | ||||||||||
| Dongfang Holding | November 13, 2006 | BVI | 100 | % | Inactive investment holding | |||||
| Shengde Holdings | February 25, 2009 | State of Nevada | 100 | % | Investment holding | |||||
| Baoding Shengde | June 1, 2009 | PRC | 100 | % | Paper production and distribution | |||||
| Variable interest entity (“VIE”): | ||||||||||
| Dongfang Paper | March 10, 1996 | PRC | Control | * | Paper production and distribution | |||||
| * | Dongfang Paper is treated as a 100% controlled variable interest entity of the Company. |
However, uncertainties in the PRC legal system could cause the Company’s current ownership structure to be found to be in violation of any existing and/or future PRC laws or regulations and could limit the Company’s ability, through its subsidiary, to enforce its rights under these contractual arrangements. Furthermore, shareholders of the VIE may have interests that are different than those of the Company, which could potentially increase the risk that they would seek to act contrary to the terms of the aforementioned agreements.
In addition, if the current structure or any of the contractual arrangements were found to be in violation of any existing or future PRC law, the Company may be subject to penalties, which may include, but not be limited to, the cancellation or revocation of the Company’s business and operating licenses, being required to restructure the Company’s operations or being required to discontinue the Company’s operating activities. The imposition of any of these or other penalties may result in a material and adverse effect on the Company’s ability to conduct its operations. In such case, the Company may not be able to operate or control the VIE, which may result in deconsolidation of the VIE. The Company believes the possibility that it will no longer be able to control and consolidate its VIE will occur as a result of the aforementioned risks and uncertainties is remote.
| 6 |
IT TECH PACKAGING, INC.
NOTES TO CONDENSED CONSOLIDATED FINANCIAL STATEMENTS
(Unaudited)
The Company has aggregated the financial information of Dongfang Paper in the table below. The aggregate carrying value of Dongfang Paper’s assets and liabilities (after elimination of intercompany transactions and balances) in the Company’s condensed consolidated balance sheets as of June 30, 2018 and December 31, 2017 are as follows:
| June 30, | December 31, | |||||||
| 2018 | 2017 | |||||||
| ASSETS | ||||||||
| Current Assets | ||||||||
| Cash and bank balances | $ | 5,624,784 | $ | 2,681,942 | ||||
| Restricted cash | 3,778,376 | 6,121,637 | ||||||
| Accounts receivable | 2,722,949 | 1,843,682 | ||||||
| Inventories | 4,034,716 | 8,431,972 | ||||||
| Prepayments and other current assets | 2,923,146 | 646,598 | ||||||
| Total current assets | 19,083,971 | 19,725,831 | ||||||
| Property, plant, and equipment, net | 160,874,995 | 167,727,768 | ||||||
| Deferred tax asset non-current | 6,037,197 | 5,167,288 | ||||||
| Total Assets | $ | 185,996,163 | $ | 192,620,887 | ||||
| LIABILITIES | ||||||||
| Current Liabilities | ||||||||
| Short-term bank loans | $ | 12,393,072 | $ | 7,192,923 | ||||
| Current portion of long-term loans from credit union | 5,078,137 | 5,142,175 | ||||||
| Accounts payable | 135,853 | 422,705 | ||||||
| Notes payable | 3,778,376 | 6,121,637 | ||||||
| Due to related parties | 135,193 | 60,378 | ||||||
| Accrued payroll and employee benefits | 219,231 | 227,163 | ||||||
| Other payables and accrued liabilities | 1,387,327 | 836,309 | ||||||
| Income taxes payable | - | 519,365 | ||||||
| Total current liabilities | 23,127,189 | 20,522,655 | ||||||
| Loans from a related party | 6,045,401 | 10,712,865 | ||||||
| Total liabilities | $ | 29,172,590 | $ | 31,235,520 | ||||
The Company and its consolidated subsidiaries are not required to provide financial support to the VIE, and no creditor (or beneficial interest holders) of the VIE have recourse to the assets of Company unless the Company separately agrees to be subject to such claims. There are no terms in any agreements or arrangements, implicit or explicit, which require the Company or its subsidiaries to provide financial support to the VIE. However, if the VIE does require financial support, the Company or its subsidiaries may, at its option and subject to statutory limits and restrictions, provide financial support to the VIE.
| 7 |
IT TECH PACKAGING, INC.
NOTES TO CONDENSED CONSOLIDATED FINANCIAL STATEMENTS
(Unaudited)
(2) Basis of Presentation and Significant Accounting Policies
The accompanying unaudited condensed consolidated financial statements have been prepared in accordance with the rules and regulations of the Securities and Exchange Commission (“SEC”) for reporting on Form 10-Q. Accordingly, certain information and notes required by the United States of America generally accepted accounting principles (“GAAP”) for annual financial statements are not included herein. These interim statements should be read in conjunction with the consolidated financial statements and notes thereto included in the Annual Report on Form 10-K for the year ended December 31, 2017 of the Company, and its subsidiaries and variable interest entity (which we sometimes refer to collectively as “the Company”, “we”, “us” or “our”).
Principles of Consolidation
Our unaudited condensed consolidated financial statements reflect all adjustments, which are, in the opinion of management, necessary for a fair presentation of our financial position and results of operations. Such adjustments are of a normal recurring nature, unless otherwise noted. The balance sheet as of June 30, 2018 and the results of operations for the three and six months ended June 30, 2018 are not necessarily indicative of the results to be expected for any future period.
Our unaudited condensed consolidated financial statements are prepared in accordance with GAAP. These accounting principles require us to make certain estimates, judgments and assumptions that affect the reported amounts of assets and liabilities and disclosure of contingent assets and liabilities at the date of the financial statements and the reported amounts of revenues and expenses during the reporting period. We believe that the estimates, judgments and assumptions are reasonable, based on information available at the time they are made. Actual results could differ materially from those estimates.
Valuation of long-lived asset
The Company reviews the carrying value of long-lived assets to be held and used when events and circumstances warrants such a review. The carrying value of a long-lived asset is considered impaired when the anticipated undiscounted cash flow from such asset is separately identifiable and is less than its carrying value. In that event, a loss is recognized based on the amount by which the carrying value exceeds the fair market value of the long-lived asset and intangible assets. Fair market value is determined primarily using the anticipated cash flows discounted at a rate commensurate with the risk involved. Losses on long-lived assets and intangible assets to be disposed are determined in a similar manner, except that fair market values are reduced for the cost to dispose.
Fair Value Measurements
The Company has adopted ASC Topic 820, Fair Value Measurements and Disclosures, which defines fair value, establishes a framework for measuring fair value in GAAP, and expands disclosures about fair value measurements. It does not require any new fair value measurements, but provides guidance on how to measure fair value by providing a fair value hierarchy used to classify the source of the information. It establishes a three-level valuation hierarchy of valuation techniques based on observable and unobservable inputs, which may be used to measure fair value and include the following:
Level 1 - Quoted prices in active markets for identical assets or liabilities.
Level 2 - Inputs other than Level 1 that are observable, either directly or indirectly, such as quoted prices for similar assets or liabilities; quoted prices in markets that are not active; or other inputs that are observable or can be corroborated by observable market data for substantially the full term of the assets or liabilities.
Level 3 - Unobservable inputs that are supported by little or no market activity and that are significant to the fair value of the assets or liabilities.
| 8 |
IT TECH PACKAGING, INC.
NOTES TO CONDENSED CONSOLIDATED FINANCIAL STATEMENTS
(Unaudited)
Classification within the hierarchy is determined based on the lowest level of input that is significant to the fair value measurement.
The Company estimates the fair value of financial instruments using the available market information and valuation methods. Considerable judgment is required in estimating fair value. Accordingly, the estimates of fair value may not be indicative of the amounts that the Company could realize in a current market exchange. As of June 30, 2018 and December 31, 2017, the carrying value of the Company’s short term financial instruments, such as cash and cash equivalents, accounts receivable, accounts and notes payable, short-term bank loans, balance due to a related party and obligation under capital lease, approximate at their fair values because of the short maturity of these instruments; while loans from credit union and loans from a related party approximate at their fair value as the interest rates thereon are close to the market rates of interest published by the People’s Bank of China.
The Company does not have any assets and liabilities measured at fair value on a recurring basis as of June 30, 2018 and December 31, 2017.
Non-Recurring Fair Value Measurements
The Company reviews long-lived assets for impairment annually or more frequently if events or changes in circumstances indicate the possibility of impairment. For the continuing operations, long-lived assets are measured at fair value on a nonrecurring basis when there is an indicator of impairment, and they are recorded at fair value only when impairment is recognized. For discontinued operations, long-lived assets are measured at the lower of carrying amount or fair value less cost to sell. The fair value of these assets were determined using models with significant unobservable inputs which were classified as Level 3 inputs, primarily the discounted future cash flow.
Share-Based Compensation
The Company uses the fair value recognition provision of ASC Topic 718, Compensation-Stock Compensation, which requires the Company to expense the cost of employee services received in exchange for an award of equity instruments based on the grant date fair value of such instruments over the vesting period.
The Company also applies the provisions of ASC Topic 505-50, Equity Based Payments to Non-Employees to account for stock-based compensation awards issued to non-employees for services. Such awards for services are recorded at either the fair value of the consideration received or the fair value of the instruments issued in exchange for such services, whichever is more reliably measurable.
Liquidity and Going Concern
As of June 30, 2018 the Company had current assets of $19,229,644 and current liabilities of $25,622,776 (including amounts due to related parties of $964,361), resulting in a working capital deficit of approximately $6,393,132; as of December 31, 2017, the Company had current assets of $19,986,797 and current liabilities of $21,757,533 (including amounts due to related parties of $609,062), resulting in a working capital deficit of approximately $1,770,736. In late January, 2018, the Company temporarily suspended its production due to a government-mandated restriction on the natural gas supply. The company resumed production on March 14, 2018. As a result, the company incurred a net loss in the first quarter of 2018. As the production resumed, the net cash generated from operations for the three months ended June 30, 2018 was $6.0 million as compared to the net cash-out of $4.8 million in the first quarter of 2018. The management expects that there will be sufficient and continuous cash-in from sales in coming months and the working capital condition as of September 30, 2018 will be substantially improved.
(3) Restricted Cash
Restricted cash of $3,778,376 as of June 30, 2018 was presented for the cash deposited at the Bank of Cangzhou for purpose of securing the bank acceptance notes from the bank (see Note (9)). The restriction will be lifted upon the maturity of the notes payable on January 10, 2019.
Restricted cash of $6,121,637 as of December 31, 2017 was presented for the cash deposited at the Bank of Cangzhou for purpose of securing the bank acceptance notes from the bank (see Note (9)). The restriction was lifted upon the maturity of the notes payable on January 5, 2018.
| 9 |
IT TECH PACKAGING, INC.
NOTES TO CONDENSED CONSOLIDATED FINANCIAL STATEMENTS
(Unaudited)
(4) Inventories
Raw materials inventory includes mainly recycled paper board and recycled white scrap paper. Finished goods include mainly products of corrugating medium paper, offset printing paper and tissue paper products. Inventories consisted of the following as of June 30, 2018 and December 31, 2017:
| June 30, | December 31, | ||||||||
| 2018 | 2017 | ||||||||
| Raw Materials | |||||||||
| Recycled paper board | $ | 2,028,145 | $ | 6,337,374 | |||||
| Recycled white scrap paper | 578,396 | 862,734 | |||||||
| Coal & gas | 57,407 | 71,674 | |||||||
| Base paper and other raw materials | 177,112 | 216,655 | |||||||
| 2,841,060 | 7,488,437 | ||||||||
| Finished Goods | 1,214,162 | 985,728 | |||||||
| Totals | $ | 4,055,222 | $ | 8,474,165 | |||||
(5) Prepayments and other current assets
Prepayments and other current assets consisted of the following as of June 30, 2018 and December 31, 2017:
| June 30, | December 31, | |||||||
| 2018 | 2017 | |||||||
| Prepaid land lease | $ | 190,430 | $ | 459,123 | ||||
| Prepayment for purchase of materials | 2,727,355 | 183,649 | ||||||
| Others | 10,028 | 8,751 | ||||||
| $ | 2,927,813 | $ | 651,523 | |||||
(6) Property, plant and equipment, net
As of June 30, 2018 and December 31, 2017, property, plant and equipment consisted of the following:
| June 30, | December 31, | |||||||
| 2018 | 2017 | |||||||
| Property, Plant, and Equipment: | ||||||||
| Land use rights | $ | 12,324,396 | $ | 12,479,814 | ||||
| Building and improvements | 97,635,464 | 98,866,703 | ||||||
| Machinery and equipment | 117,344,995 | 118,670,578 | ||||||
| Vehicles | 619,752 | 593,265 | ||||||
| Construction in progress | 36,617,247 | 36,077,498 | ||||||
| Totals | 264,541,854 | 266,687,858 | ||||||
| Less: accumulated depreciation and amortization | (83,484,424 | ) | (77,299,149 | ) | ||||
| Property, Plant and Equipment, net | $ | 181,057,430 | $ | 189,388,709 | ||||
As of June 30, 2018 and December 31, 2017, land use rights represented two parcel of state-owned lands located in Xushui County of Hebei Province in China, with lease terms of 50 years expiring from 2061 to 2066.
| 10 |
IT TECH PACKAGING, INC.
NOTES TO CONDENSED CONSOLIDATED FINANCIAL STATEMENTS
(Unaudited)
Construction in progress mainly represents payments for the new 15,000 tonnes per year tissue paper manufacturing equipment PM8, the tissue paper workshops and general infrastructure and administrative facilities in the Wei County Industrial Park. The tissue paper development project at the Wei County Industrial Park is expected to be completed in 2018. For the three months ended June 30, 2018 and 2017, the amount of interest capitalized is $nil and $4,499, respectively. For the six months ended June 30, 2018 and 2017, the amount of interest capitalized is $nil and $9,663, respectively.
As of June 30, 2018 and December 31, 2017, certain property, plant and equipment of Dongfang Paper with net values of $6,927,618 and $7,963,285, respectively, have been pledged pursuant to a long-term loan from credit union of Dongfang Paper. Land use right of Dongfang Paper with net values of $6,285,552 and $6,437,419 as of June 30, 2018 and December 31, 2017 were pledged for the bank loan from Bank of Industrial & Commercial Bank of China. In addition, plant and equipment of Baoding Shengde with net values of $15,001,701 and $nil as of June 30, 2018 and December 31, 2017, respectively, and another land use right with net value of $4,991,336 and $nil as of June 30, 2018 and December 31, 2017 were pledged for the bank loan from Bank of Cangzhou. See “ Short-term bank loans ” under Note (7), Loans Payable, for details of the transaction and asset collaterals.
Depreciation and amortization of property, plant and equipment was $3,680,248 and $3,584,141 for the three months ended June 30, 2018 and 2017, respectively. Depreciation and amortization of property, plant and equipment was $7,410,833 and $7,199,500 for the six months ended June 30, 2018 and 2017, respectively.
(7) Loans Payable
Short-term bank loans
| June 30, | December 31, | |||||||||
| 2018 | 2017 | |||||||||
| Industrial and Commercial Bank of China (“ICBC”) Loan 1 | (a) | $ | - | $ | 4,285,145 | |||||
| ICBC Loan 2 | (b) | 2,871,565 | 2,907,778 | |||||||
| Bank of Cangzhou | (c) | 5,289,726 | - | |||||||
| ICBC Loan 3 | (d) | 4,231,781 | - | |||||||
| Total short-term bank loans | $ | 12,393,072 | $ | 7,192,923 | ||||||
| (a) | On January 10, 2017, the Company entered into a working capital loan agreement with the ICBC, with a balance of $4,285,145 as of December 31, 2017. The working capital loan was guaranteed by Hebei Tengsheng with its land use right pledged as collateral for the benefit of the bank. The loan bears a fixed interest rate of 4.5675% per annum. The loan was due and repaid on January 8, 2018. |
| (b) | On October 18, 2017, the Company entered into a working capital loan agreement with the ICBC, with a balance of $2,871,565 and $2,907,778 as of June 30, 2018 and December 31, 2017, respectively. The working capital loan is secured by the Company’s land use right as collateral for the benefit of the bank. The loan bears a fixed interest rate of 4.945% per annum. The loan will be due on October 12, 2018. |
| (c) | On January 2, 2018, the Company entered into a working capital loan agreement with the Bank of Cangzhou. The loan was withdrawn on January 4, 2018, with a balance of $5,289,726 as of June 30, 2018. The loan bears a fixed interest rate of 6.09% per annum. The working capital loan is secured by the Company’s land use right and guaranteed by the Company’s CEO and Baoding Shengde with its production equipment as collateral for the benefit of the bank. The loan will be due on January 3, 2019. |
| (d) | On February 6, 2018, the Company entered into a working capital loan agreement with the ICBC, with a balance of $4,231,781 as of June 30, 2018. The working capital loan was guaranteed by Hebei Tengsheng with its land use right pledged as collateral for the benefit of the bank. The loan bears a fixed interest rate of 5.4% per annum. The loan will be due on February 9, 2019. |
| 11 |
IT TECH PACKAGING, INC.
NOTES TO CONDENSED CONSOLIDATED FINANCIAL STATEMENTS
(Unaudited)
As of June 30, 2018, there were guaranteed short-term borrowings of $12,393,072 and unsecured bank loans of $nil. As of December 31, 2017, there were guaranteed short-term borrowings of $7,192,923 and unsecured bank loans of $nil.
The average short-term borrowing rates for the three months ended June 30, 2018 and 2017 were approximately 5.59% and 5.25%, respectively. The average short-term borrowing rates for the six months ended June 30, 2018 and 2017 were approximately 5.58% and 5.27%, respectively.
Long-term loans from credit union
As of June 30, 2018 and December 31, 2017, loans payable to Rural Credit Union of Xushui County, amounted to $7,466,070 and $7,560,221, respectively.
| June 30, | December 31, | |||||||
| 2018 | 2017 | |||||||
| Rural Credit Union of Xushui County Loan 1 | $ | 1,299,761 | $ | 1,316,152 | ||||
| Rural Credit Union of Xushui County Loan 2 | 3,778,376 | 3,826,022 | ||||||
| Rural Credit Union of Xushui County Loan 3 | 2,387,933 | 2,418,047 | ||||||
| Total | 7,466,070 | 7,560,221 | ||||||
| Less: Current portion of long-term loans from credit union | (7,466,070 | ) | (6,366,502 | ) | ||||
| Long-term loans from credit union | $ | - | $ | 1,193,719 | ||||
As of June 30, 2018, the Company’s long-term debt repayments for the next five years were as follows:
| Amount | ||||
| Fiscal year | ||||
| Remainder of 2018 | $ | 6,287,217 | ||
| 2019 | 1,178,853 | |||
| 2020 | - | |||
| 2021 | - | |||
| 2022 | - | |||
| 2023 | - | |||
| Total | 7,466,070 | |||
On April 16, 2014, the Company entered into a loan agreement with the Rural Credit Union of Xushui County for a term of 5 years, which is payable in various installments from June 21, 2014 to November 18, 2018. The loan is guaranteed by an independent third party. Interest payment is due quarterly and bears the rate of 0.72% per month. In August 2015, after giving the required notice to the Rural Credit Union of Xushui County in accordance with the terms on the agreement, the Company prepaid a portion of the loan in an amount of $188,919, of which $52,897 was paid ahead of its original repayment schedule. As of June 30, 2018 and December 31, 2017, total outstanding loan balance was $1,299,761 and $1,316,152, respectively, which is presented as current liabilities in the consolidated balance sheet.
On July 15, 2013, the Company entered into a loan agreement with the Rural Credit Union of Xushui County for a term of 5 years, which is due and payable in various installments from December 21, 2013 to July 26, 2018. The loan is secured by certain of the Company’s manufacturing equipment with net book value of $6,927,618 and $7,963,285 as of June 30, 2018 and December 31, 2017, respectively. Interest payment is due quarterly and bears a fixed rate of 0.72% per month. In August 2015, after giving the required notice to the Rural Credit Union of Xushui County in accordance with the terms on the agreement, the Company prepaid a portion of the loan in an amount of $196,476, of which $45,341 was paid ahead of its original repayment schedule. As of June 30, 2018 and December 31, 2017, the total outstanding loan balance was $3,778,376 and $3,826,022, respectively, which is presented as current liabilities in the consolidated balance sheet.
On April 20, 2017, the Company entered into a loan agreement with the Rural Credit Union of Xushui County for a term of 2 years, which is due and payable in various installments from August 26, 2017 to April 19, 2019. The loan is guaranteed by Hebei Tengsheng with its land use right pledged as collateral for the benefit of the bank. Interest payment is due quarterly and bears a fixed rate of 0.6% per month. As of June 30, 2018 and December 31, 2017, the total outstanding loan balance was $2,387,933 and $2,418,047, respectively. Out of the total outstanding loan balance, current portion amounted were $2,387,933 and $1,224,328 as of June 30, 2018 and December 31, 2017, respectively, which are presented as current liabilities in the consolidated balance sheet and the remaining balance of $nil and $1,193,719 are presented as non-current liabilities in the consolidated balance sheet as of June 30, 2018 and December 31, 2017, respectively.
Total interest expenses for the short-term bank loans and long-term loans for the three months ended June 30, 2018 and 2017 were $328,955 and $324,929, respectively. Total interest expenses for the short-term bank loans and long-term loans for the six months ended June 30, 2018 and 2017 were $620,294 and $587,708, respectively.
| 12 |
IT TECH PACKAGING, INC.
NOTES TO CONDENSED CONSOLIDATED FINANCIAL STATEMENTS
(Unaudited)
(8) Related Party Transactions
The Company’s CEO has loaned money to Dongfang Paper for working capital purposes over a period of time. On January 1, 2013, Dongfang Paper and Mr. Zhenyong Liu renewed the three-year term loan previously entered on January 1, 2010, and extended the maturity date further to December 31, 2015. On December 31, 2015, the Company paid off the loan of $2,249,279, together with interest of $391,374 for the period from 2013 to 2015. Approximately $387,410 and $392,296 of interest were outstanding to Mr. Zhenyong Liu, which were recorded in other payables and accrued liabilities as part of the current liabilities in the consolidated balance sheet as of June 30, 2018 and December 31, 2017, respectively.
On December 10, 2014, Mr. Zhenyong Liu provided a loan to the Company, amounted to $9,541,833 to Dongfang Paper for working capital purpose with an interest rate of 4.35% per annum, which was based on the primary lending rate of People’s Bank of China. The unsecured loan was provided on December 10, 2014, and would be originally due on December 10, 2017. During the year of 2016, the Company repaid $6,012,416 to Mr. Zhenyong Liu, together with interest of $288,596. In February 2018, the company repaid $3,131,361 to Mr. Zhenyong Liu. As of June 30, 2018 and December 31, 2017, the outstanding loan balance was $nil and $3,060,818, respectively and the accrued interest was $77,117 and $45,912, respectively, which was recorded in other payables and accrued liabilities as part of the current liabilities in the consolidated balance sheet.
On March 1, 2015, the Company entered an agreement with Mr. Zhenyong Liu which allows Dongfang Paper to borrow from the CEO an amount up to $18,136,203 (RMB120,000,000) for working capital purposes. The advances or funding under the agreement are due three years from the date each amount is funded. The loan is unsecured and carries an annual interest rate set on the basis of the primary lending rate of the People’s Bank of China at the time of the borrowing. On July 13, 2015, an unsecured amount of $4,324,636 was drawn from the facility. On October 14, 2016 an unsecured amount of $2,883,091 was drawn from the facility. In February 2018, the company repaid $1,565,680 to Mr. Zhenyong Liu. The loan would be originally due on July 12, 2018. Mr. Zhenyong Liu agreed to extend the loan for additional 3 years and the remaining balance will be due on July 12, 2021. As of June 30, 2018 and December 31, 2017, the outstanding loan balance were $6,045,401 and $7,652,047, respectively, and the accrued interest was $261,407 and $110,476, respectively, which was recorded in other payables and accrued liabilities as part of the current liabilities in the consolidated balance sheet.
As of June 30, 2018 and December 31, 2017, total amount of loans due to Mr. Zhenyong Liu were $6,045,401 and $10,712,865, respectively. The interest expense incurred for such related party loans are $78,227 and $111,232 for the three months ended June 30, 2018 and 2017, respectively. The interest expenses incurred for such related party loans are $190,699 and $221,916 for the six months ended June 30, 2018 and 2017, respectively. The accrued interest owe to the CEO was approximately $725,934 and $548,684, as of June 30, 2018 and December 31, 2017, respectively, which was recorded in other payables and accrued liabilities.
As of June 30, 2018 and 2017, amount due to shareholder are $103,235 and $nil, respectively, which represents funds from shareholders to pay for various expenses incurred in the U.S. The amount is due on demand with interest free.
Lease of Headquarters Compound Real Properties from a Related Party
On August 7, 2013, the Company’s Audit Committee and the Board of Directors approved the sale of the land use right of the Headquarters Compound (the “LUR”), the office building and essentially all industrial-use buildings in the Headquarters Compound (the “Industrial Buildings”), and three employee dormitory buildings located within the Headquarters Compound (the “Dormitories”) to Hebei Fangsheng for cash prices of approximately $2.77 million, $1.15 million, and $4.31 million, respectively. Sales of the LUR and the Industrial Buildings were completed in year 2013.
In connection with the sale of the Industrial Buildings, Hebei Fangsheng agreed to lease the Industrial Buildings back to the Company for its original use for a term of up to three years, with an annual rental payment of approximately $156,568 (RMB1,000,000). The lease agreement expired in August 2016. On August 9, 2016, the Company paid off the rental for the first lease agreement and entered into a supplementary agreement with Hebei Fangsheng, who agreed to extend the lease term for another two years, with the same rental payment as original lease agreement.
| 13 |
IT TECH PACKAGING, INC.
NOTES TO CONDENSED CONSOLIDATED FINANCIAL STATEMENTS
(Unaudited)
(9) Notes payable
As of June 30, 2018, the Company had bank acceptance notes of $3,778,376 from the Bank of Cangzhou to one of its major suppliers for settling purchase of raw materials. The acceptance notes are used to essentially extend the payment of accounts payable and are issued under the banking facilities obtained from the bank as well as the restricted bank deposit of $3,778,376 in the bank as mentioned in Note (3). The bank acceptance notes from the bank bore interest rate at nil% per annum and 0.05% of notes amount as handling charge. The acceptance notes will become due and payable on January 10, 2019.
As of December 31, 2017, the Company had bank acceptance notes of $6,121,637 from the Bank of Cangzhou to one of its major suppliers for settling purchase of raw materials. The acceptance notes are used to essentially extend the payment of accounts payable and are issued under the banking facilities obtained from bank as well as the restricted bank deposit of $6,121,637 in the bank as mentioned in Note (3). The bank acceptance notes from the bank bore interest rate at nil% per annum and 0.05% of notes amount as handling charge. The acceptance notes were due and paid off in January 2018.
(10) Other payables and accrued liabilities
Other payables and accrued liabilities consist of the following:
| June 30, | December 31, | |||||||
| 2018 | 2017 | |||||||
| Accrued electricity | $ | 141,378 | $ | 2,862 | ||||
| Value-added tax payable | 414,852 | 196,395 | ||||||
| Accrued interest to a related party | 725,934 | 548,684 | ||||||
| Payable for purchase of equipment | 48,968 | 49,585 | ||||||
| Accrued commission to salesmen | 12,060 | 16,992 | ||||||
| Others | 44,176 | 21,819 | ||||||
| Totals | $ | 1,387,368 | $ | 836,337 | ||||
(11) Common Stock
Issuance of common stock to investors
On August 27, 2014, the Company issued 1,562,500 shares of our common stock and warrants to purchase up to 781,250 shares of our common stock (the “Offering”). Each share of common stock and accompanying warrant was sold at a price of $1.60. Please refer to Note (12), Stock Warrants, for details.
Issuance of common stock pursuant to the 2012 Incentive Stock Plan and 2015 Omnibus Equity Incentive
On January 12, 2016, the Company granted an aggregate of 1,133,916 shares of common stock under its compensatory incentive plans to nine officers, directors and employees of and a consultant when the stock was at $1.25 per share, as compensation for their services in the past years, of which 168,416 shares of common stock were granted under the 2012 Incentive Stock Plan and 965,500 shares were granted under the 2015 Omnibus Equity Incentive. Please see Note (15), Stock Incentive Plans for more details. Total fair value of the stock was calculated at $1,417,395 as of the date of grant.
| 14 |
IT TECH PACKAGING, INC.
NOTES TO CONDENSED CONSOLIDATED FINANCIAL STATEMENTS
(Unaudited)
(12) Stock warrants
On August 27, 2014, the Company issued 1,562,500 shares of our common stock and warrants to purchase up to 781,250 shares of our common stock. The warrants have an exercise price of $1.70 per share. These warrants are exercisable immediately upon issuance on September 3, 2014 and have a term of exercise equal to five years from the date of issuance till September 2, 2019. The fair value of these shares amounted to $780,000, is classified as equity at the date of issuance.
The fair value of the warrants issued was estimated by using the Binominal pricing model with the following assumptions:
| Terms of warrants | 5 years | |||
| Expected volatility | 72.0 | |||
| Risk-free interest rate | 1.69 | |||
| Expected dividend yield | 0.81 |
In connection with the Offering, the Company issued warrants to its placement agent of this Offering, which can purchase an aggregate of up to 2.50% of the aggregate number of shares of common stock sold in the Offering, i.e. 39,062 shares. These warrants have substantially the same terms as the warrants issued to purchaser in the Offering, except that the exercise price is $2.00 per share and the expiration date is from September 3, 2014 to June 26, 2019. The fair value of these shares amounted to $35,191, is classified in the equity at the date of issuance to net off the proceeds from the issuance of the shares and warrants.
The fair value of the warrants issued was estimated by using the Binominal pricing model with the following assumptions:
| Terms of warrants | 4.81 years | |||
| Expected volatility | 69.8 | |||
| Risk-free interest rate | 1.62 | |||
| Expected dividend yield | 0.81 |
The Company applied judgment in estimating key assumptions in determining the fair value of the warrants on the date of issuance. The Company used historical data to estimate stock volatilities and expected dividend yield. The risk-free rates are consistent with the terms of the warrants and are based on the United States Treasury yield curve in effect at the time of issuance.
A summary of stock warrant activities is as below:
Three Months Ended June 30, 2018 | ||||||||
| Number | Weight average exercise price | |||||||
| Outstanding and exercisable at beginning of the period | 820,312 | $ | 1.71 | |||||
| Issued during the period | - | - | ||||||
| Exercised during the period | - | - | ||||||
| Cancelled or expired during the period | - | - | ||||||
| Outstanding and exercisable at end of the period | 820,312 | $ | 1.71 | |||||
| Range of exercise price | $1.70 to $2.00 | |||||||
| 15 |
IT TECH PACKAGING, INC.
NOTES TO CONDENSED CONSOLIDATED FINANCIAL STATEMENTS
(Unaudited)
No warrants were issued, exercised, cancelled or expired during the six months ended June 30, 2018. As of June 30, 2018, the aggregated intrinsic value of warrants outstanding and exercisable was $nil.
No warrants were issued, exercised, cancelled or expired during the six months ended June 30, 2017. As of December 31, 2017, the aggregated intrinsic value of warrants outstanding and exercisable was $nil.
(13) Earnings Per Share
For the three months ended June 30, 2018 and 2017, basic and diluted net income per share are calculated as follows:
| Three Months Ended June 30, | ||||||||
| 2018 | 2017 | |||||||
| Basic income per share | ||||||||
| Net income for the period - numerator | $ | 109,994 | $ | 15,917 | ||||
| Weighted average common stock outstanding - denominator | 21,450,316 | 21,450,316 | ||||||
| Net income per share | $ | 0.01 | $ | 0.00 | ||||
| Diluted income per share | ||||||||
| Net income for the period- numerator | $ | 109,994 | $ | 15,917 | ||||
| Weighted average common stock outstanding - denominator | 21,450,316 | 21,450,316 | ||||||
| Effect of dilution | - | - | ||||||
| Weighted average common stock outstanding - denominator | 21,450,316 | 21,450,316 | ||||||
| Diluted income per share | $ | 0.01 | $ | 0.00 | ||||
For the six months ended June 30, 2018 and 2017, basic and diluted net income per share are calculated as follows:
| Six Months Ended June 30, | ||||||||
| 2018 | 2017 | |||||||
| Basic (loss) income per share | ||||||||
| Net (loss) income for the period - numerator | $ | (3,976,282 | ) | $ | 1,723,786 | |||
| Weighted average common stock outstanding - denominator | 21,450,316 | 21,450,316 | ||||||
| Net (loss) income per share | $ | (0.19 | ) | $ | 0.08 | |||
| Diluted (loss) income per share | ||||||||
| Net (loss) income for the period- numerator | $ | (3,976,282 | ) | $ | 1,723,786 | |||
| Weighted average common stock outstanding - denominator | 21,450,316 | 21,450,316 | ||||||
| Effect of dilution | - | - | ||||||
| Weighted average common stock outstanding - denominator | 21,450,316 | 21,450,316 | ||||||
| Diluted (loss) income per share | $ | (0.19 | ) | $ | 0.08 | |||
For the three and six months ended June 30, 2018 and 2017, 820,312 warrants shares were excluded from the calculations of dilutive net income per share as their effects would have been anti-dilutive since the average share price was lower than the warrants exercise price. For the three and six months ended June 30, 2018, there were no securities with dilutive effect issued and outstanding.
| 16 |
IT TECH PACKAGING, INC.
NOTES TO CONDENSED CONSOLIDATED FINANCIAL STATEMENTS
(Unaudited)
(14) Income Taxes
United States
The Company and Shengde Holdings are incorporated in the State of Nevada and are subject to the U.S. federal tax and state statutory tax rates up to 34% and 0%, respectively. On December 22, 2017, the U.S. enacted the Tax Cuts and Jobs Act (the “2017 TCJAAct”), which significantly changed U.S. tax law. The Act 2017 TCJA lowered the Company’s U.S. statutory federal income tax rate from the highest rate of 35% to 21% effective January 1, 2018, while also imposing a deemed repatriation tax on deferred foreign income which requires companies to pay a one-time transition tax on previously unremitted earnings of non-U.S. subsidiaries that were previously tax deferred and creates new taxes on certain foreign sourced earnings. The SEC staff issued Staff Accounting Bulletin (SAB) 118, which provides guidance on accounting for enactment effects of the 2017 TCJA. SAB 118 provides a measurement period of up to one year from the 2017 TCJA’s enactment date for companies to complete their accounting under ASC 740. In accordance with SAB 118, to the extent that a company’s accounting for certain income tax effects of the 2017 TCJA is incomplete but it is able to determine a reasonable estimate, it must record a provisional estimate in its financial statements. If a company cannot determine a provisional estimate to be included in its financial statements, it should continue to apply ASC 740 on the basis of the provisions of the tax laws that were in effect immediately before the enactment of the 2017 TCJA.
In connection with the Company’s initial analysis of the impact of the enactment of the 2017 TCJA, the Company recorded a net tax expense of approximately $80,000 in the fourth quarter of 2017. For various reasons that are discussed more fully below, including the issuance of additional technical and interpretive guidance, the Company has not completed its accounting for the income tax effects of certain elements of the 2017 TCJA. However, with respect to the following, the Company was able to make reasonable estimates of the 2017 TCJA’s effects and, as such, recorded provisional amounts:
Transition tax: The transition tax is a tax on previously untaxed accumulated and current earnings and profits (E&P) of certain of the Company’s non-U.S. subsidiaries. To determine the amount of the transition tax, the Company must determine, in addition to other factors, the amount of post-1986 E&P of the relevant subsidiaries, as well as the amount of non-U.S. income taxes paid on such earnings. Further, the transition tax is based in part on the amount of those earnings held in cash and other specified assets. The Company was able to make a reasonable estimate of the transition tax and recorded a provisional obligation and additional income tax expense of approximately $80,000 in the fourth quarter of 2017. However, the Company is continuing to gather additional information and will consider additional technical guidance to more precisely compute and account for the amount of the transition tax. This amount may change when the Company finalizes the calculation of post-1986 foreign E&P previously deferred from U.S. federal taxation and finalizes the amounts held in cash or other specified assets. The 2017 TCJA’s transition tax is payable over eight years beginning in 2018. Hence, the Company only provided $6,528 for the year ended 31 December 2017.
PRC
Dongfang Paper and Baoding Shengde are PRC operating companies and are subject to PRC Enterprise Income Tax. Pursuant to the PRC New Enterprise Income Tax Law, Enterprise Income Tax is generally imposed at a statutory rate of 25%.
The provisions for income taxes for three months ended June 30, 2018 and 2017 were as follows:
| Three Months Ended | ||||||||
| June 30, | ||||||||
| 2018 | 2017 | |||||||
| Provision for Income Taxes | ||||||||
| Current Tax Provision PRC | $ | 3,566 | $ | 563,588 | ||||
| Deferred Tax Provision PRC | (552,588 | ) | (506,107 | ) | ||||
| Total Provision for Income Taxes | $ | (549,022 | ) | $ | 57,481 | |||
The provisions for income taxes for the six months ended June 30, 2018 and 2017 were as follows:
| Six Months Ended | ||||||||
| June 30, | ||||||||
| 2018 | 2017 | |||||||
| Provision for Income Taxes | ||||||||
| Current Tax Provision PRC | $ | 3,566 | $ | 1,744,332 | ||||
| Deferred Tax Provision PRC | (1,091,557 | ) | (1,143,569 | ) | ||||
| Total Provision for Income Taxes | $ | (1,087,991 | ) | $ | 600,763 | |||
| 17 |
IT TECH PACKAGING, INC.
NOTES TO CONDENSED CONSOLIDATED FINANCIAL STATEMENTS
(Unaudited)
In addition to the reversible future PRC income tax benefits stemming from the timing differences of items such as recognition of asset disposal gain or loss and asset depreciation, the Company was incorporated in the United States and incurred aggregate net operating losses of approximately $nil and $6,710,939 for U.S. income tax purposes for the years ended December 31, 2017 and 2016, respectively. The net operating loss carried forward may be available to reduce future years’ taxable income. These carry forwards would expire, if not utilized, during the period of 2030 through 2035. As of December 31, 2016, management believed that the realization of all the U.S. income tax benefits from these losses, which generally would generate a deferred tax asset if it can be expected to be utilized in the future, appears not more than likely due to the Company’s limited operating history and continuing losses for United States income tax purposes. Accordingly, As of December 31, 2016, the Company provided a 100% valuation allowance on the U.S. deferred tax asset benefit to reduce the total deferred tax asset to the amount realizable for the PRC income tax purposes. Management reviews this valuation allowance periodically and will make adjustments as warranted. A summary of the otherwise deductible (or taxable) deferred tax items is as follows:
June 30, | December 31, 2017 | |||||||
| Deferred tax assets (liabilities) | ||||||||
| Depreciation and amortization of property, plant and equipment | $ | 5,778,340 | $ | 5,123,762 | ||||
| Impairment of property, plant and equipment | 440,080 | 440,080 | ||||||
| Miscellaneous | 702,113 | 712,517 | ||||||
| Net operating loss carryover of PRC company | 623,854 | 1,094,887 | ||||||
| Net operating loss carryover for U.S. income tax purposes | - | - | ||||||
| Total deferred tax assets | 7,544,387 | 7,371,246 | ||||||
| Less: Valuation allowance | - | - | ||||||
| Total deferred tax assets, net | $ | 7,544,387 | $ | 7,371,246 | ||||
The following table reconciles the statutory rates to the Company’s effective tax rate for:
| Three Months Ended June 30, | ||||||||
| 2018 | 2017 | |||||||
| PRC Statutory rate | 25.0 | % | 25.0 | % | ||||
| Effect of different tax jurisdiction | 0.0 | (19.3 | ) | |||||
| Effect of expenses not deductible for PRC tax purposes | 100.1 | % | (0.2 | ) | ||||
| Change in valuation allowance | 0.0 | 72.8 | ||||||
| Effective income tax rate | 125.1 | % | 78.3 | % | ||||
| Six Months Ended June 30, | ||||||||
| 2018 | 2017 | |||||||
| PRC Statutory rate | 25.0 | % | 25.0 | % | ||||
| Effect of different tax jurisdiction | 0.0 | (0.2 | ) | |||||
| Effect of expenses not deductible for PRC tax purposes | 3.5 | % | 0.5 | |||||
| Change in valuation allowance | 0.0 | 0.5 | ||||||
| Effective income tax rate | 21.5 | % | 25.8 | % | ||||
During the three months ended June 30, 2018 and 2017, the effective income tax rate was estimated by the Company to be 11.7% and 78.3%, respectively. During the six months ended June 30, 2018 and 2017, the effective income tax rate was estimated by the Company to be 25.8% and 25.8%, respectively.
As of December 31, 2017, except for the one-time transition tax under the 2017 TCJA which imposes a U.S. tax liability on all unrepatriated foreign E&Ps, the Company does not believe that its future dividend policy and the available U.S. tax deductions and net operating losses will cause the Company to recognize any other substantial current U.S. federal or state corporate income tax liability in the near future. Nor does it believes that the amount of the repatriation of the VIE’s earnings and profits for purposes of paying dividends will change the Company’s position that its PRC subsidiary Baoding Shengde and the VIE, Dongfang Paper are considered or are expected to be indefinitely reinvested offshore to support our future capacity expansion. If these earnings are repatriated to the U.S. resulting in U.S. taxable income in the future, or if it is determined that such earnings are to be remitted in the foreseeable future, additional tax provisions would be required.
| 18 |
IT TECH PACKAGING, INC.
NOTES TO CONDENSED CONSOLIDATED FINANCIAL STATEMENTS
(Unaudited)
The Company has adopted ASC Topic 740-10-05, Income Taxes. To date, the adoption of this interpretation has not impacted the Company’s financial position, results of operations, or cash flows. The Company performed self-assessment and the Company’s liability for income taxes includes the liability for unrecognized tax benefits, interest and penalties which relate to tax years still subject to review by taxing authorities. Audit periods remain open for review until the statute of limitations has passed, which in the PRC is usually 5 years. The completion of review or the expiration of the statute of limitations for a given audit period could result in an adjustment to the Company’s liability for income taxes. Any such adjustment could be material to the Company’s results of operations for any given quarterly or annual period based, in part, upon the results of operations for the given period. As of December 31, 2017 and 2016, management considered that the Company had no uncertain tax positions affecting its consolidated financial position and results of operations or cash flows, and will continue to evaluate for any uncertain position in future. There are no estimated interest costs and penalties provided in the Company’s consolidated financial statements for the years ended December 31, 2017 and 2016, respectively. The Company’s tax positions related to open tax years are subject to examination by the relevant tax authorities and the major one is the China Tax Authority.
(15) Stock Incentive Plans
Issuance of common stock pursuant to the 2011 Incentive Stock Plan and 2012 Incentive Stock Plan
On August 28, 2011, the Company’s Annual General Meeting approved the 2011 Incentive Stock Plan of Orient Paper, Inc. (the “2011 ISP”) as previously adopted by the Board of Directors on July 5, 2011. Under the 2011 ISP, the Company may grant an aggregate of 375,000 shares of the Company’s common stock to the Company’s directors, officers, employees or consultants. No stock or option was issued under the 2011 ISP until January 2, 2012, when the Compensation Committee granted 109,584 shares of restricted common stock to certain officers and directors of the Company when the stock was at $3.45 per share, as compensation for their services in the past years. Total fair value of the stock was calculated at $378,065 as of the date of issuance.
On September 10, 2012, the Company’s Annual General Meeting approved the 2012 Incentive Stock Plan of Orient Paper, Inc. (the “2012 ISP”) as previously adopted by the Board of Directors on July 4, 2012. Under the 2012 ISP, the Company may grant an aggregate of 200,000 shares of the Company’s common stock to the Company’s directors, officers, employees or consultants. Specifically, the Board and/or the Compensation Committee have authority to (a) grant, in its discretion, Incentive Stock Options or Non-statutory Options, Stock Awards or Restricted Stock Purchase Offers; (b) determine in good faith the fair market value of the stock covered by any grant; (c) determine which eligible persons shall receive grants and the number of shares, restrictions, terms and conditions to be included in such grants; and (d) make all other determinations necessary or advisable for the 2012 ISP’s administration. On December 31, 2013, the Compensation Committee granted restricted common shares of 297,000, out of which 265,416 shares were granted under the 2011 ISP and 31,584 shares under the 2012 ISP, to certain officers, directors and employees of the Company when the stock was at $2.66 per share, as compensation for their services in the past years. Total fair value of the stock was calculated at $790,020 as of the date of grant.
2015 Incentive Plan
On August 29, 2015, the Company’s Annual General Meeting approved the 2015 Omnibus Equity Incentive Plan of Orient Paper, Inc. (the “2015 ISP”) as previously adopted by the Board of Directors on July 10, 2015. Under the 2015 ISP, the Company may grant an aggregate of 1,500,000 shares of the Company’s common stock to the directors, officers, employees and/or consultants of the Company and its subsidiaries. On January 12, 2016, the Compensation Committee granted un-restricted common shares of 1,133,916, of which 168,416 shares were granted under the 2012 ISP and 965,500 shares under the 2015 ISP, to certain officers, directors, employees and a consultant of the Company as compensation for their services in the past years. Total fair value of the stock was calculated at $1,417,395 as of the date of issuance at $1.25 per share.
(16) Commitments and Contingencies
Operating Lease
The Company leases 32.95 acres of land from a local government in Xushui County, Baoding City, Hebei, China through a real estate lease with a 30-year term, which expires on December 31, 2031. The lease requires an annual rental payment of approximately $18,788 (RMB 120,000). This operating lease is renewable at the end of the 30-year term.
On November 27, 2012, the company entered into a 49.4 acres land lease with an investment company in the Economic Development Zone in Wei County, Hebei Province, China. The lease term of the Wei County land lease commences on the date of the lease and lasts for 15 years. The lease requires an annual rental payment of $563,645 (RMB 3,600,000). The Company is currently building two new tissue paper production lines and future production facilities in the leased Wei County land.
As mentioned in Note (8) Related Party Transactions, in connection with the sale of Industrial Buildings to Hebei Fangsheng, Hebei Fangsheng agrees to lease the Industrial Buildings back to the Company at an annual rental of $156,568 (RMB 1,000,000), for a total term of up to five years.
| 19 |
IT TECH PACKAGING, INC.
NOTES TO CONDENSED CONSOLIDATED FINANCIAL STATEMENTS
(Unaudited)
Future minimum lease payments of all operating leases are as follows:
| June 30, | Amount | |||
| 2019 | 574,817 | |||
| 2020 | 562,222 | |||
| 2021 | 562,222 | |||
| 2022 | 562,222 | |||
| 2023 | 562,222 | |||
| Thereafter | 2,375,843 | |||
| Total operating lease payments | $ | 5,199,548 | ||
Capital commitment
As of June 30, 2018, the Company has signed several contracts for construction of equipment and facilities, including a new tissue paper production line PM8. Total outstanding commitments under these contracts were $10,528,048 and $11,227,896 as of June 30, 2018 and December 31, 2017, respectively. The Company expected to pay off all the balances within 1 year.
Guarantees and Indemnities
The Company agreed with Baoding Huanrun Trading Co., a major supplier of raw materials, to guarantee certain obligations of this third party, and as of June 30, 2018 and December 31, 2017, the Company guaranteed its long-term loan from financial institutions amounting to $8,463,561 (RMB56,000,000) and $8,570,292 (RMB56,000,000) that matured at various times in 2018. If Huanrun Trading Co., were to become insolvent, the Company could be materially adversely affected.
(17) Segment Reporting
Since March 10, 2010, Baoding Shengde started its operations and thereafter the Company manages its operations through two business operating segments: Dongfang Paper, which produces offset printing paper and corrugating medium paper, and Baoding Shengde, which produces digital photo paper. They are managed separately because each business requires different technology and marketing strategies.
The Company evaluates performance of its operating segments based on net income. Administrative functions such as finance, treasury, and information systems are centralized. However, where applicable, portions of the administrative function expenses are allocated between the operating segments based on gross revenue generated. The operating segments do share facilities in Xushui County, Baoding City, Hebei Province, China. All sales were sold to customers located in the PRC.
Summarized financial information for the two reportable segments is as follows:
| Three Months Ended | ||||||||||||||||||||
| June 30, 2018 | ||||||||||||||||||||
| Dongfang Paper | Baoding Shengde | Not Attributable to Segments | Elimination of Inter-segment | Enterprise-wide, consolidated | ||||||||||||||||
| Revenues | $ | 33,135,162 | $ | 14,028 | $ | - | $ | - | $ | 33,149,190 | ||||||||||
| Gross profit | 3,018,995 | (3,573 | ) | - | - | 3,015,422 | ||||||||||||||
| Depreciation and amortization | 3,492,033 | 188,215 | - | - | 3,680,248 | |||||||||||||||
| Loss from disposal of property, plant and equipment | (113 | ) | - | - | - | (113 | ) | |||||||||||||
| Interest income | (17,447 | ) | 103 | - | - | (17,344 | ) | |||||||||||||
| Interest expense | 362,158 | 45,024 | - | - | 407,182 | |||||||||||||||
| Income tax expense(benefit) | (491,642 | ) | (57,380 | ) | - | - | (549,022 | ) | ||||||||||||
| Net income (loss) | 340,468 | (175,962 | ) | (54,512 | ) | - | 109,994 | |||||||||||||
| Total Assets | 185,996,162 | 24,786,027 | 7,054 | - | 210,789,243 | |||||||||||||||
| 20 |
IT TECH PACKAGING, INC.
NOTES TO CONDENSED CONSOLIDATED FINANCIAL STATEMENTS
(Unaudited)
| Three Months Ended | ||||||||||||||||||||
| June 30, 2017 | ||||||||||||||||||||
| Dongfang Paper | Baoding Shengde | Not Attributable to Segments | Elimination of Inter-segment | Enterprise-wide, consolidated | ||||||||||||||||
| Revenues | $ | 22,787,683 | $ | - | $ | - | $ | - | $ | 22,787,683 | ||||||||||
| Gross profit | 3,464,666 | - | - | - | 3,464,666 | |||||||||||||||
| Depreciation and amortization | 3,359,013 | 225,128 | - | - | 3,584,141 | |||||||||||||||
| Interest income | 4,510 | 1,301 | - | - | 5,811 | |||||||||||||||
| Interest expense | 669,944 | 26,586 | - | - | 696,530 | |||||||||||||||
| Income tax expense(benefit) | 135,756 | (78,275 | ) | - | - | 57,481 | ||||||||||||||
| Net income (loss) | 411,396 | (193,304 | ) | (202,175 | ) | - | 15,917 | |||||||||||||
| Six Months Ended | ||||||||||||||||||||
| June 30, 2018 | ||||||||||||||||||||
| Dongfang Paper |
Baoding Shengde |
Not Attributable to Segments |
Elimination of Inter-segment |
Enterprise-wide, consolidated |
||||||||||||||||
| Revenues | $ | 35,023,356 | $ | 14,028 | $ | - | $ | - | $ | 35,037,384 | ||||||||||
| Gross profit | 2,323,687 | (3,573 | ) | - | - | 2,320,114 | ||||||||||||||
| Depreciation and amortization | 7,030,192 | 380,641 | - | - | 7,410,833 | |||||||||||||||
| Loss from disposal of property, plant and equipment | 10,263 | - | - | - | 10,263 | |||||||||||||||
| Interest income | 27,168 | 251 | - | - | 27,419 | |||||||||||||||
| Interest expense | 720,948 | 90,045 | - | - | 810,993 | |||||||||||||||
| Income tax expense(benefit) | (964,278 | ) | (123,713 | ) | - | - | (1,087,991 | ) | ||||||||||||
| Net income (loss) | (3,209,922 | ) | (374,686 | ) | (391,674 | ) | - | (3,976,282 | ) | |||||||||||
| As of June 30, 2018 | ||||||||||||||||||||
| Dongfang Paper |
Baoding Shengde |
Not Attributable to Segments |
Elimination of Inter-segment |
Enterprise-wide, consolidated |
||||||||||||||||
| Total assets | $ | 185,996,162 | 24,786,027 | 7,054 | - | 210,789,243 | ||||||||||||||
| 21 |
IT TECH PACKAGING, INC.
NOTES TO CONDENSED CONSOLIDATED FINANCIAL STATEMENTS
(Unaudited)
| Six Months Ended | ||||||||||||||||||||
| June 30, 2017 | ||||||||||||||||||||
| Dongfang Paper | Baoding Shengde | Not Attributable to Segments | Elimination of Inter-segment | Enterprise-wide, consolidated | ||||||||||||||||
| Revenues | $ | 48,077,342 | $ | - | $ | - | $ | - | $ | 48,077,342 | ||||||||||
| Gross profit | 9,118,586 | - | - | - | 9,118,586 | |||||||||||||||
| Depreciation and amortization | 6,750,301 | 449,199 | - | - | 7,199,500 | |||||||||||||||
| Interest income | 22,219 | 1,537 | - | - | 23,756 | |||||||||||||||
| Interest expense | 1,349,028 | 26,586 | - | - | 1,375,614 | |||||||||||||||
| Income tax expense(benefit) | 823,326 | (222,563 | ) | - | - | 600,763 | ||||||||||||||
| Net income (loss) | 2,434,010 | (290,927 | ) | (419,297 | ) | - | 1,723,786 | |||||||||||||
| As of December 31, 2017 | ||||||||||||||||||||
| Dongfang Paper |
Baoding Shengde |
Not Attributable to Segments |
Elimination of Inter-segment |
Enterprise-wide, consolidated |
||||||||||||||||
| Total assets | $ | 192,620,887 | 26,363,435 | 5,159 | - | 218,989,481 | ||||||||||||||
(18) Concentration and Major Customers and Suppliers
For the three and six months ended June 30, 2018, the Company had no single customer contributed over 10% of total sales.
For the three and six months ended March 31, 2017, the Company had no single customer contributed over 10% of total sales.
For the three months ended June 30, 2018, the Company had one major supplier accounted for 86% of total purchases. For the three months ended June 30, 2017, the Company had three major suppliers accounted for 60%, 20% and 7% of total purchases.
For the six months ended June 30, 2018, the Company had one major supplier which primarily accounted for 84% of the total purchases. For the six months ended June 30, 2017, the Company had three major suppliers which primarily accounted for 56%, 18% and 7% of the total purchases.
| 22 |
IT TECH PACKAGING, INC.
NOTES TO CONDENSED CONSOLIDATED FINANCIAL STATEMENTS
(Unaudited)
(19) Concentration of Credit Risk
Financial instruments for which the Company is potentially subject to concentration of credit risk consist principally of cash. The Company places its cash in reputable financial institutions in the PRC and the United States. Although it is generally understood that the PRC central government stands behind all of the banks in China in the event of bank failure, there is no deposit insurance system in China that is similar to the protection provided by the Federal Deposit Insurance Corporation (“FDIC”) of the United States as of June 30, 2018 and December 31, 2017. On May 1, 2015, the new “Deposit Insurance Regulations” was effective in the PRC that the maximum protection would be up to RMB500,000 (US$75,568) per depositor per insured financial intuition, including both principal and interest. For the cash placed in financial institutions in the United States, the Company’s U.S. bank accounts are all fully covered by the FDIC insurance as of June 30, 2018 and December 31, 2017, respectively, while for the cash placed in financial institutions in the PRC, the balances exceeding the maximum coverage of RMB500,000 amounted to RMB61,177,491 (US$9,246,062) as of June 30, 2018.
(20) Risks and Uncertainties
The Company is subject to substantial risks from, among other things, intense competition associated with the industry in general, other risks associated with financing, liquidity requirements, rapidly changing customer requirements, foreign currency exchange rates, and operating in the PRC under its various laws and restrictions.
(21) Recent Accounting Pronouncements
In January 2016, the FASB issued ASU No. 2016-01, “Financial Instruments - Overall (Subtopic 825-10): Recognition and Measurement of Financial Assets and Financial Liabilities” (“ASU 2016-01”). The amendments in this update require all equity investments to be measured at fair value with changes in the fair value recognized through net income (other than those accounted for under equity method of accounting or those that result in consolidation of the investee). The amendments in this update also require an entity to present separately in other comprehensive income the portion of the total change in the fair value of a liability resulting from a change in the instrument-specific credit risk when the entity has elected to measure the liability at fair value in accordance with the fair value option for financial instruments. In addition the amendments in this update eliminate the requirement to disclose the method(s) and significant assumptions used to estimate the fair value that are required to be disclosed for financial instruments measured at amortized cost on the balance sheet for public entities. For public business entities, the amendments in ASU 2016-01 are effective for fiscal years beginning after December 15, 2017, including interim periods within those fiscal years. Except for the early application guidance discussed in ASU 2016-01, early adoption of the amendments in this update is not permitted. We do not expect the adoption of ASU 2016-01 to have a material impact on our consolidated financial statements.
In February 2016, the FASB issued ASU No. 2016-02, “Leases (Topic 842)” (“ASU 2016-02”). The amendments in this update create Topic 842, Leases, and supersede the leases requirements in Topic 840, Leases. Topic 842 specifies the accounting for leases. The objective of Topic 842 is to establish the principles that lessees and lessors shall apply to report useful information to users of financial statements about the amount, timing, and uncertainty of cash flows arising from a lease. The main difference between Topic 842 and Topic 840 is the recognition of lease assets and lease liabilities for those leases classified as operating leases under Topic 840. Topic 842 retains a distinction between finance leases and operating leases. The classification criteria for distinguishing between finance leases and operating leases are substantially similar to the classification criteria for distinguishing between capital leases and operating leases in the previous leases guidance. The result of retaining a distinction between finance leases and operating leases is that under the lessee accounting model in Topic 842, the effect of leases in the statement of comprehensive income and the statement of cash flows is largely unchanged from previous GAAP. The amendments in ASU 2016-02 are effective for fiscal years beginning after December 15, 2018, including interim periods within those fiscal years for public business entities. Early application of the amendments in ASU 2016-02 is permitted. We are currently in the process of evaluating the impact of the adoption of ASU 2016-02 on our consolidated financial statements.
In June 2016, the FASB issued ASU No. 2016-13, “Financial Instruments-Credit Losses (Topic 326): Measurement of Credit Losses on Financial Instruments” (“ASU 2016-13”). Financial Instruments-Credit Losses (Topic 326) amends guidelines on reporting credit losses for assets held at amortized cost basis and available-for-sale debt securities. For assets held at amortized cost basis, Topic 326 eliminates the probable initial recognition threshold in current GAAP and, instead, requires an entity to reflect its current estimate of all expected credit losses. The allowance for credit losses is a valuation account that is deducted from the amortized cost basis of the financial assets to present the net amount expected to be collected. For available-for-sale debt securities, credit losses should be measured in a manner similar to current GAAP, however Topic 326 will require that credit losses be presented as an allowance rather than as a write-down. ASU 2016-13 affects entities holding financial assets and net investment in leases that are not accounted for at fair value through net income. The amendments affect loans, debt securities, trade receivables, net investments in leases, off balance sheet credit exposures, reinsurance receivables, and any other financial assets not excluded from the scope that have the contractual right to receive cash. The amendments in this ASU will be effective for fiscal years beginning after December 15, 2019, including interim periods within those fiscal years. We are currently evaluating the impact of the adoption of ASU 2016-13 on our consolidated financial statements.
| 23 |
| Item 2. | Management’s Discussion and Analysis of Financial Condition and Results of Operations |
Cautionary Notice Regarding Forward-Looking Statements
The following discussion of the financial condition and results of operations of the Company for the periods ended June 30, 2018 and 2017 should be read in conjunction with the financial statements and the notes to the financial statements that are included elsewhere in this quarterly report.
In this quarterly report, references to “the Company,” “we,” “our” and “us” refer to IT Tech Packaging, Inc. and its PRC subsidiary and variable interest entity unless the context requires otherwise.
We make certain forward-looking statements in this report. Statements concerning our future operations, prospects, strategies, financial condition, future economic performance (including growth and earnings), demand for our services, and other statements of our plans, beliefs, or expectations, including the statements contained under the captions “Management’s Discussion and Analysis of Financial Condition and Results of Operations” as well as captions elsewhere in this document, are forward-looking statements. In some cases these statements are identifiable through the use of words such as “anticipate”, “believe”, “estimate”, “expect”, “intend”, “plan”, “project”, “target”, “can”, “could”, “may”, “should”, “will”, “would”, and similar expressions. We intend such forward-looking statements to be covered by the safe harbor provisions contained in Section 27A of the Securities Act of 1933, as amended (the “Securities Act”) and in Section 21E of the Securities Exchange Act of 1934, as amended (the “Exchange Act”). The forward-looking statements we make are not guarantees of future performance and are subject to various assumptions, risks, and other factors that could cause actual results to differ materially from those suggested by these forward-looking statements. Because such statements are subject to risks and uncertainties, actual results may differ materially from those expressed or implied by the forward-looking statements. Indeed, it is likely that some of our assumptions may prove to be incorrect. Our actual results and financial position may vary from those projected or implied in the forward-looking statements and the variances may be material. You are cautioned not to place undue reliance on such forward-looking statements. These risks and uncertainties, together with the other risks described from time to time in reports and documents that we file with the Securities and Exchange Commission (the “SEC”) should be considered in evaluating forward-looking statements. In evaluating the forward-looking statements contained in this report, you should consider various factors, including, without limitation, the following: (a) those risks and uncertainties related to general economic conditions, (b) whether we are able to manage our planned growth efficiently and operate profitably, (c) whether we are able to generate sufficient revenues or obtain financing to sustain and grow our operations, and (d) whether we are able to successfully fulfill our primary requirements for cash. We assume no obligation to update forward-looking statements, except as otherwise required under federal securities laws.
Effective on August 1, 2018, we changed our corporate name to IT Tech Packaging, Inc.. The name change was effected through a parent/subsidiary short-form merger of IT Tech Packaging, Inc., our wholly-owned Nevada subsidiary formed solely for the purpose of the name change, with and into us. We were the surviving entity. In connection with the name change, our common stock began being traded under a new NYSE symbol, “ITP,” and a new CUSIP number, 46527C100, at such time.
Results of Operations
Comparison of the Three Months Ended June 30, 2018 and 2017
Revenue for the three months ended June 30, 2018 was $33,149,190, an increase of $10,361,507, or 45.47%, from $22,787,683 for the same period in the previous year. This was mainly due to the increase in average selling price(ASP) of CMP and offset printing paper, partially offset by the decrease in sales volume of offset printing paper.
Revenue of Offset Printing Paper, Corrugating Medium Paper and Tissue Paper Products
Revenue from sales of offset printing paper, corrugating medium paper (“CMP”) and tissue paper products for the three months ended June 30, 2018 was $33,135,162, an increase of $10,347,479, or 45.41%, from $22,787,683 for the second quarter of 2017. Total offset printing paper, CMP and tissue paper products sold during the three months ended June 30, 2018 amounted to 52,995 tonnes, a decrease of 2,074 tonnes, or 3.77%, compared to 55,069 tonnes sold in the comparable period in the previous year. This was mainly due to the decrease in quantity of offset printing paper sold resulted from demand slump. The changes in revenue dollar amount and in quantity sold for the three months ended June 30, 2018 and 2017 are summarized as follows:
| Three Months Ended | Three Months Ended | |||||||||||||||||||||||||||||||
| June 30,
2018 | June 30,
2017 | Change in | Percentage Change | |||||||||||||||||||||||||||||
| Sales Revenue | Quantity (Tonne) | Amount | Quantity (Tonne) | Amount | Quantity (Tonne) | Amount | Quantity | Amount | ||||||||||||||||||||||||
| Regular CMP | 38,541 | $ | 23,307,297 | 37,994 | $ | 13,891,973 | 547 | $ | 9,415,324 | 1.44 | % | 67.78 | % | |||||||||||||||||||
| Light-Weight CMP | 9,543 | $ | 5,599,914 | 9,200 | $ | 3,243,767 | 343 | $ | 2,356,147 | 3.73 | % | 72.64 | % | |||||||||||||||||||
| Total CMP | 48,084 | $ | 28,907,211 | 47,194 | $ | 17,135,740 | 890 | $ | 11,771,471 | 1.89 | % | 68.70 | % | |||||||||||||||||||
| Offset Printing Paper | 4,911 | $ | 4,227,951 | 7,307 | $ | 4,927,679 | (2,396 | ) | $ | (699,728 | ) | -32.79 | % | -14.20 | % | |||||||||||||||||
| Tissue Paper Products | - | $ | - | 568 | $ | 724,264 | (568 | ) | $ | (724,264 | ) | -100.00 | % | -100.00 | % | |||||||||||||||||
| Total CMP, Offset Printing Paper and Tissue Paper Revenue | 52,995 | $ | 33,135,162 | 55,069 | $ | 22,787,683 | (2,074 | ) | $ | 10,347,479 | -3.77 | % | 45.41 | % | ||||||||||||||||||
| 24 |
Monthly sales revenue (excluding revenue from digital photo paper and tissue paper products) for the 24 months ended June 30, 2018, are summarized below:
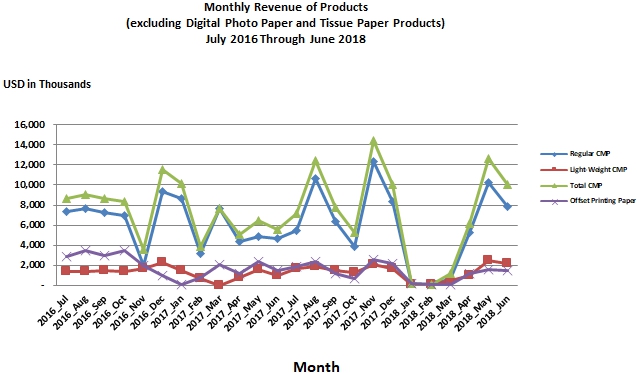
The Average Selling Prices (ASPs) for our main products in the three months ended June 30, 2018 and 2017 are summarized as follows:
| Offset Printing Paper ASP | Regular CMP ASP | Light-Weight CMP ASP | Tissue Paper Products ASP | |||||||||||||
| Three Months ended June 30, 2017 | $ | 674 | $ | 366 | $ | 353 | $ | 1275 | ||||||||
| Three Months ended June 30, 2018 | $ | 861 | $ | 605 | $ | 587 | $ | - | ||||||||
| Increase (Decrease) from comparable period in the previous year | $ | 187 | $ | 239 | $ | 234 | $ | -1275 | ||||||||
| Increase (Decrease) by percentage | 27.74 | % | 65.30 | % | 66.29 | % | -100.00 | % | ||||||||
| 25 |
The following chart shows the month-by-month ASPs (excluding the ASPs of the digital photo paper and tissue paper products) for the 24 month period ended June 30, 2018:
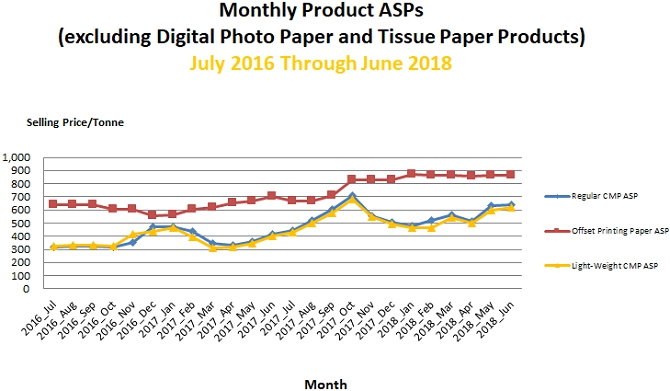
Corrugating Medium Paper
Revenue from CMP amounted to $28,907,211 (87.24% of the total offset printing paper, CMP and tissue paper products revenues) for the three months ended June 30, 2018, representing an increase of $11,771,471, or 68.70%, from $17,135,740 for the comparable period in 2017.
We sold 48,084 tonnes of CMP in the three months ended June 30, 2018 as compared to 47,194 tonnes for the same period in 2017, representing a 1.89% increase in quantity sold.
ASP for regular CMP increased from $366/tonne for the three months ended June 30, 2017 to $605/tonne for the three months ended June 30, 2018, representing a 65.30% increase. ASP in RMB for regular CMP for the second quarter of 2017 and 2018 was RMB2,500 and RMB3,864, respectively, representing a 54.56% increase. The quantity of regular CMP sold increased by 547 tonnes, from 37,994 tonnes in the second quarter of 2017 to 38,541 tonnes in the second quarter of 2018.
ASP for light-weight CMP increased from $353/tonne for the three months ended June 30, 2017 to $587/tonne for the three months ended June 30, 2018, representing a 66.29% increase. ASP in RMB for light-weight CMP for the second quarter of 2017 and 2018 was RMB2,415 and RMB3,753, respectively, representing a 55.40% increase. The quantity of light-weight CMP sold increased by 343 tonnes, from 9,200 tonnes in the second quarter of 2017, to 9,543 tonnes in the second quarter of 2018.
Our production volume was restricted temporarily by the government due to environmental concerns. The government has been requiring outdated paper facilities to close since 2010 and is expected to continue to force the closure of outdated facilities in the next few years. We estimate that the market demand and ASPs for CMP will remain stable in the second half of 2018.
Our PM6 production line, which produces regular CMP, has a designated capacity of 360,000 tonnes /year. The utilization rates for the second quarter of 2018 and 2017 were 41.22% and 42.51%, respectively, representing a decrease of 1.29%.
| 26 |
Quantities sold for regular CMP that was produced by the PM6 production line from July 2016 to June 2018 are as follows:

Offset Printing Paper
Revenue from offset printing paper was $4,227,951 (12.76% of the total offset printing paper, CMP and tissue paper products revenues) for the three months ended June 30, 2018, representing a decrease of $699,728, or 14.20%, from $4,927,679 for the three months ended June 30, 2017. We sold 4,911 tonnes of offset printing paper in the second quarter of 2018, as compared to 7,307 tonnes n the comparable period of 2017, a decrease of 2,396 tonnes, or 32.79%. The decrease was mainly due to the slump of demands in the second quarter of 2018. ASPs for offset printing paper for the second quarter of 2017 and 2018 were $674 and $861, respectively, representing a 27.74% increase. ASP in RMB for offset printing paper for the second quarter of 2017 and 2018 was RMB4,620 and RMB5,504, respectively, representing a 19.13% increase. We estimate that the market demand and ASP of offset printing paper will remain stable in the second half of 2018.
Tissue Paper Products
We began the commercial production of tissue paper products in Wei County Industry Park in June 2015. We process base tissue paper purchased from a long-term supplier and produce finished tissue paper products, including toilet paper, boxed and soft-packed tissues, handkerchief tissues and paper napkins, as well as bathroom and kitchen paper towels, that are marketed and sold under the Orient Paper brand.
Revenue from tissue paper products was $nil for the three months ended June 30, 2018, representing a decrease of $724,264, or 100.00%, from $724,264 for the three months ended June 30, 2017. We sold nil tonnes of tissue paper in the second quarter of 2018, as compared to 568 tonnes in the comparable period of 2017, a decrease of 568 tonnes, or 100.00%. Taking into account the volatility of the market price, production of tissue paper was temporarily suspended during the time when the gas boilers were installed in replacing the coal boilers. We expect to resume and increase production of tissue paper products in the near future.
Revenue of Digital Photo Paper
Revenue generated from selling digital photo paper were $14,028 and $nil for the three months ended June 30, 2018 and 2017. In June 2016, we suspended the production of digital photo paper due to low market demand for our products and now are considering renovating the line to produce more competitive products. We expect that our digital photo paper production will remain suspended for the near future.
| 27 |
Cost of Sales
Total cost of sales for CMP, offset printing paper and tissue paper products for the quarter ended June 30, 2018 was $30,116,169, an increase of $10,793,151, or 55.86%, from $19,323,017 for the comparable period in 2017. This was mainly due to increase in material costs.
Cost of sales for CMP was $26,076,384 for the quarter ended June 30, 2018, as compared to $14,462,603 for the comparable period in 2017. The increase in the cost of sales of $11,613,781 for CMP was mainly due to the increase in cost of recycled paper board. Average cost of sales per tonne for CMP increased by 77.12%, from $306 in the second quarter of 2017 to $542 in the second quarter of 2018. The increase in average cost of sales was mainly attributable to the higher average unit purchase costs (net of applicable value added tax) of recycled paper board. Cost of sales for offset printing paper was $4,039,785 for the quarter ended June 30, 2018, as compared to $4,172,915 for the comparable period in 2017. Average cost of sales per tonne of offset printing paper increased by 44.13%, from $571 in the three months ended June 30, 2017, to $823 during the comparable period in 2018. The increase in average cost of sales of offset printing paper was mainly due to the increase in cost of recycled white scrap paper.
Changes in cost of sales and cost per tonne by product for the quarters ended June 30, 2018 and 2017 are summarized below:
| Three Months Ended | Three Months Ended | |||||||||||||||||||||||||||||||
| June 30, 2018 | June 30, 2017 | Change in | Change in percentage | |||||||||||||||||||||||||||||
| Cost of Sales | Cost per Tonne | Cost of Sales | Cost per Tonne | Cost of Sales | Cost per Tonne | Cost of Sales | Cost per Tone | |||||||||||||||||||||||||
| Regular CMP | $ | 21,183,541 | $ | 550 | $ | 11,851,287 | $ | 312 | $ | 9,332,254 | $ | 238 | 78.74 | % | 76.28 | % | ||||||||||||||||
| Light-Weight CMP | $ | 4,892,843 | $ | 513 | $ | 2,611,316 | $ | 284 | $ | 2,281,526 | $ | 229 | 87.37 | % | 80.63 | % | ||||||||||||||||
| Total CMP | $ | 26,076,384 | $ | 542 | $ | 14,462,603 | $ | 306 | $ | 11,613,781 | $ | 236 | 80.30 | % | 77.12 | % | ||||||||||||||||
| Offset Printing Paper | $ | 4,039,785 | $ | 823 | $ | 4,172,915 | $ | 571 | $ | (133,131 | ) | $ | 252 | -3.19 | % | 44.13 | % | |||||||||||||||
| Tissue Paper Products | $ | - | $ | - | 687,499 | $ | 1,210 | $ | (687,499 | ) | $ | (1,210 | ) | -100 | % | -100.00 | % | |||||||||||||||
| Total CMP, Offset Printing Paper and Tissue Paper | $ | 30,116,169 | $ | n/a | $ | 19,323,017 | $ | n/a | $ | 10,793,151 | $ | n/a | 55.86 | % | n/a | |||||||||||||||||
Our average unit purchase costs (net of applicable value added tax) of recycled paper board and recycled white scrap paper in the three months ended June 30, 2018 were RMB 2,329/tonne (approximately $365/tonne) and RMB 3,012/tonne (approximately $472/tonne), as compared to RMB 1,364/tonne (approximately $199/tonne) and RMB 2,272/tonne (approximately $397/tonne) for the three months ended June 30, 2017. These changes (in US dollars) represent a year-over-year increase of 83.42% for the recycled paper board. We use domestic recycled paper (sourced mainly from the Beijing-Tianjin metropolitan area) exclusively. Although we do not rely on imported recycled paper, the pricing of which tends to be more volatile than domestic recycled paper, our experience suggests that the pricing of domestic recycled paper bears some correlation to the pricing of imported recycled paper.
The pricing trends of our major raw materials for the 24-month period from July 2016 to June 2018 are shown below:

| 28 |
Electricity and gas are our two main energy sources. In order to reduce carbon emissions, we had been required to reduce coal consumption by the local government. After replacing all of the coal burning boilers with gas boilers, we stopped using coal in the fourth quarter of 2017, which accounted for approximately 3% of total sales in 2017. Electricity and gas accounted for approximately 5.7% and 8% of total sales in second quarter of 2018, respectively, compared to 7% and 0.8% of total sales in the same period of 2017. The monthly energy cost (electricity, coal and gas) as a percentage of total monthly sales of our main paper products for the 24 months ended June 30, 2018 are summarized as follows:
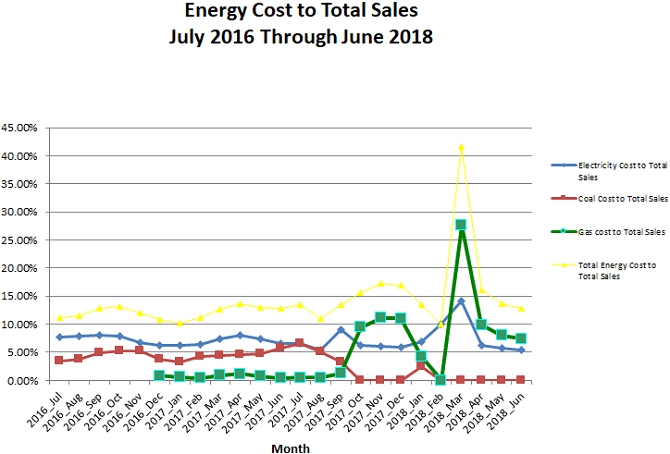
Gross Profit
Gross profit for the three months ended June 30, 2018 was $3,015,422 (9.10% of the total revenue), representing a decrease of $449,244, or 12.97%, from the gross profit of $3,464,666 (15.20% of the total revenue) for the three months ended June 30, 2017. The decrease was mainly due to the increase in unit cost of recycled paper board and recycled white scrap paper and decrease in sales volume of offset printing paper, partially offset by the increase in average selling prices as further described above.
Offset Printing Paper, CMP and Tissue Paper Products
Gross profit for offset printing paper, CMP and tissue paper products for the three months ended June 30, 2018 was $3,018,994, a decrease of $445,672, or 12.86%, from the gross profit of $3,464,666 for the three months ended June 30, 2017. The decrease was mainly the result of the factors discussed above.
The overall gross profit margin for offset printing paper, CMP and tissue paper products decreased by 6.10 percentage points, from 15.20% for the three months ended June 30, 2017, to 9.10% for the three months ended June 30, 2018.
| 29 |
Gross profit margin for regular CMP for the three months ended June 30, 2018 was 9.11%, or 5.58 percentage points lower, as compared to gross profit margin of 14.69% for the three months ended June 30, 2017. Such decrease was mainly due to the increase in cost of recycled paper board, partially offset by the increase in ASP of regular CMP in the second quarter of 2018.
Gross profit margin for light-weight CMP for the three months ended June 30, 2018 was 12.63%, or 6.87 percentage points lower, as compared to gross profit margin of 19.50% for the three months ended June 30, 2017. The decrease was mainly due to increase in cost of recycled paper board, partially offset by the increase in ASP of light-weight CMP in the second quarter of 2018.
Gross profit margin for offset printing paper was 4.45% for the three months ended June 30, 2018, a decrease of 10.87 percentage points, as compared to 15.32% for the three months ended June 30, 2017. The decrease was mainly due to the increase in cost of recycled white scrap paper, partially offset by the increase in ASP in offset printing paper in the second quarter of 2018.
Gross profit margin for tissue paper products for the three months ended June 30, 2018 was 0%, or 5.08 percentage points lower, as compared to gross profit margin of 5.08% for the three months ended June 30, 2017.
Monthly gross profit margins on the sales of our CMP and offset printing paper for the 24-month period ended June 30, 2018 are as follows:
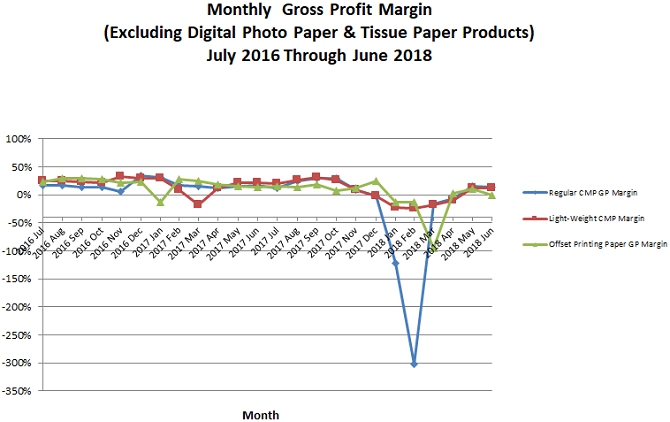
Digital Photo Paper
Loss for digital photo paper for the three months ended June 30, 2018 was $3,573, representing a gross margin of -25.47%. In June 2016, we suspended the production of digital photo paper due to low market demand for our products and now are upgrading the production line to produce more competitive photo paper products.
Selling, General and Administrative Expenses
Selling, general and administrative expenses for the three months ended June 30, 2018 were $3,027,265, an increase of $338,716, or 12.60% from $2,688,549 for the three months ended June 30, 2017. The increase was mainly due to the depreciation of Renminbi against US Dollor in the second quarter of 2018 compared to the same period of 2017.
(Loss) Income from Operations
Operating loss for the quarter ended June 30, 2018 was $11,730, a decrease of $775,746, or 101.54%, from operating income of $764,016 for the quarter ended June 30, 2017. The decrease in operating income was primarily due to the decrease in gross profit and increase in selling, general and administrative expenses as discussed above.
| 30 |
Other Income and Expenses
Interest expense for the three months ended June 30, 2018 decreased by $289,348, from $696,530 in the three months ended June 30, 2017, to $407,182. The Company had short-term and long-term interest-bearing loans, related party loans and leasing obligations that aggregated $25,904,543 as of June 30, 2018, as compared to $39,799,651 as of June 30, 2017. The interest incurred during the three months ended June 30, 2018 and 2017, were $nil and $4,499, respectively, and were capitalized as soft-cost of construction-in-progress. The interest expense capitalized in second quarter of 2017 was related to the sale-leaseback obligation with China National Foreign Trade Financial & Leasing Co., Ltd (“CNFTFL”).
Net Income
$552,588 of deferred tax was provided for the reversible future PRC income tax benefits in the three month ended June 30, 2018. As a result and the factors discussed above, net income was $109,994 for the quarter ended June 30, 2018, representing an increase of $94,077, or 591.05%, from $15,917 for the quarter ended June 30, 2017.
Comparison of the six months ended June 30, 2018 and 2017
Revenue for the six months ended June 30, 2018 was $35,037,384, a decrease of $13,039,958, or 27.12%, from $48,077,342 for the same period in the previous year.
Revenue of Offset Printing Paper, Corrugating Medium Paper and Tissue Paper Products
Revenue from sales of offset printing paper, CMP and tissue paper products for the six months ended June 30, 2018 was $35,023,357, a decrease of $13,053,985, or 27.15%, from $48,077,342 for the six months ended June 30, 2017. This was mainly due to the decrease in sales volume of CMP and offset printing paper, which was partially offset by the increase in ASP of these products. Total quantities of offset printing paper, CMP and tissue paper products sold during the six months ended June 30, 2018 amounted to 56,297 tonnes, a decrease of 56,901 tonnes, or 50.27%, compared to 113,198 tonnes sold during the six months ended June 30, 2017. Total quantities of CMP and offset printing paper sold decrease by 55,775 tonnes in the six months of 2018 as compared to the same period of 2017. We sold nil tonnes of tissue paper products in the six months of 2018 as opposed to 1,126 tonnes in the same period of 2017. Production was suspended from late January 2018 to March 13, 2018 due to a government-mandated restriction on the natural gas supply. Production of tissue paper was suspended due to volatility of tissue paper price. As a result, the production and sales volume of CMP and tissue paper products decreased in the six months ended June 30, 2018 as compared to the same period of 2017. The changes in revenue and quantity sold for the six months ended June 30, 2018 and 2017 are summarized as follows:
A summary of the above changes and further analyses of the changes in our sales revenue are as follows:
| Six Months Ended | Six Months Ended | |||||||||||||||||||||||||||||||
| June 30, 2018 | June 30, 2017 | Change in | Percentage Change | |||||||||||||||||||||||||||||
| Sales Revenue | Quantity (Tonne) | Amount | Quantity (Tonne) | Amount | Quantity (Tonne) | Amount | Quantity | Amount | ||||||||||||||||||||||||
| Regular CMP | 40,213 | $ | 24,215,016 | 85,786 | $ | 33,343,655 | (45,573 | ) | $ | (9,128,638 | ) | -53.12 | % | -27.38 | % | |||||||||||||||||
| Light-Weight CMP | 10,794 | $ | 6,251,761 | 14,223 | $ | 5,453,638 | (3,429 | ) | $ | 798,123 | -24.11 | % | 14.63 | % | ||||||||||||||||||
| Total CMP | 51,007 | $ | 30,466,777 | 100,009 | $ | 38,797,293 | (49,002 | ) | $ | (8,330,515 | ) | -49.00 | % | -21.47 | % | |||||||||||||||||
| Offset Printing Paper | 5,290 | $ | 4,556,580 | 12,063 | $ | 7,852,662 | (6,773 | ) | $ | (3,296,082 | ) | -56.15 | % | -41.97 | % | |||||||||||||||||
| Tissue Paper Products | - | $ | - | 1,126 | 1,427,387 | (1,126 | ) | $ | (1,427,387 | ) | -100.00 | % | -100.00 | % | ||||||||||||||||||
| Total CMP, Offset Printing Paper and Tissue Paper Revenue | 56,297 | $ | 35,023,357 | 113,198 | $ | 48,077,342 | (56,901 | ) | $ | (13,053,985 | ) | -50.27 | % | -27.15 | % | |||||||||||||||||
ASPs for our main products in the six-month period ended June 30, 2017 and 2016 are summarized as follows:
| Offset Printing Paper ASP | Regular CMP ASP | Light-Weight CMP ASP | Tissue Paper Products ASP | |||||||||||||
| Six Months Ended June 30, 2017 | $ | 651 | $ | 389 | $ | 383 | $ | 1268 | ||||||||
| Six Months Ended June 30, 2018 | $ | 861 | $ | 602 | $ | 579 | $ | |||||||||
| Increase (Decrease) from comparable period in the previous year | $ | 210 | $ | 213 | $ | 196 | $ | -1268 | ||||||||
| Increase (Decrease) by percentage | 32.26 | % | 54.76 | % | 51.17 | % | -100.00 | % | ||||||||
| 31 |
Revenue of Digital Photo Paper
Revenue generated from selling digital photo paper were $14,028 for the six months ended June 30, 2018. In June 2016, we suspended the production of digital photo paper due to low market demand for our products and now are upgrading the production line to produce more competitive photo paper products.
Cost of Sales
Total cost of sales for CMP, offset printing paper and tissue paper products in the six months ended June 30, 2018 was $32,699,671, a decrease of $6,259,086, or 16.07%, from $38,958,756 for the six months ended June 30, 2017. This was mainly a result of the decrease in volume sold, partially offset by increase in cost of recycled paper board and recycled white scrap paper. Cost of sales for CMP was $28,207,207 for the six months ended June 30, 2018, as compared to $31,270,258 in the same period of 2017. The decrease in the cost of sales of $3,063,051 for CMP was mainly due to the decrease in the quantities of regular CMP and light-weight CMP sold, partially offset by the increase in cost of recycled paper board in the six months of 2018. Average cost of sales per tonne for CMP increased by 76.68%, from $313 for the six months ended June 30, 2017, to $553 in the same period of 2018. The increase was mainly attributable to the higher average unit purchase costs (net of applicable value added tax) of recycled paper board in the first half of 2018 compared to 2017. Cost of sales for offset printing paper was $4,492,463 for the six months ended June 30, 2018, as compared to $6,353,173 in the same period of 2017. Average cost of sales per tonne of offset printing paper increased by 61.10%, from $527 in the six months ended June 30, 2017, to $849 in the same period of 2018.
Changes in cost of sales and cost per tonne by product for the six months ended June 30, 2018 and 2017 are summarized below:
| Six Months Ended | Six Months Ended | |||||||||||||||||||||||||||||||
| June 30, 2018 | June 30, 2017 | Change in | Change in percentage | |||||||||||||||||||||||||||||
| Cost of Sales | Cost per Tonne | Cost of Sales | Cost per tonne | Cost of Sales | Cost per Tonne | Cost of Sales | Cost per Tone | |||||||||||||||||||||||||
| Regular CMP | $ | 22,274,927 | $ | 554 | $ | 26,964,394 | $ | 314 | $ | (4,689,467 | ) | $ | 240 | -17.39 | % | 76.43 | % | |||||||||||||||
| Light-Weight CMP | $ | 5,932,280 | $ | 550 | $ | 4,305,864 | $ | 303 | $ | 1,626,416 | $ | 247 | 37.77 | % | 81.52 | % | ||||||||||||||||
| Total CMP | $ | 28,207,207 | $ | 553 | $ | 31,270,258 | $ | 313 | $ | (3,063,051 | ) | $ | 240 | -9.80 | % | 76.68 | % | |||||||||||||||
| Offset Printing Paper | $ | 4,492,463 | $ | 849 | $ | 6,353,173 | $ | 527 | $ | (1,860,710 | ) | $ | 322 | -29.29 | % | 61.10 | % | |||||||||||||||
| Tissue Paper Products | $ | - | $ | - | $ | 1,335,325 | $ | 1,186 | (1,335,325 | ) | $ | (1,186 | ) | -100.00 | % | -100.00 | % | |||||||||||||||
| Total CMP, Offset Printing Paper and Tissue Paper Revenue | $ | 32,699,671 | $ | n/a | $ | 38,958,756 | $ | n/a | $ | (6,259,086 | ) | $ | n/a | -16.07 | % | n/a | % | |||||||||||||||
For the six months ended June 30, 2017, cost of sales for digital photo paper was $nil, as compared to $17,601 in the same period of 2018.
| 32 |
Gross Profit
Gross profit for the six months ended June 30, 2018 was $2,320,114 (6.62% of the total revenue), representing a decrease of $6,798,472, or 74.56%, from the gross profit of $9,118,586 (18.97% of the total revenue) for the six months ended June 30, 2017. The decrease was mainly due to (i) the decrease in quantities sold due to production suspension and (ii) the increase of material purchase price of CMP and offset printing paper, partially offset by the increase of ASP of these products.
Offset Printing Paper, CMP and Tissue Paper Products
Gross profit for offset printing paper, CMP and tissue paper products for the six months ended June 30, 2018 was $2,323,686, a decrease of $6,794,900, or 74.52%, from the gross profit of $9,118,586 for the six months ended June 30, 2017. The decrease was mainly the result of the factors discussed above.
The overall gross profit margin for offset printing paper, CMP and tissue paper products decreased by 12.35 percentage points, from 18.97% for the six months ended June 30, 2017, to 6.62% for the six months ended June 30, 2018.
Gross profit margin for regular CMP for the six months ended June 30, 2018 was 8.01%, or 11.12 percentage points lower, as compared to gross profit margin of 19.13% for the six months ended June 30, 2017. Such decrease was primarily due to the increase of material purchase price, partially offset by the increase in ASP of regular CMP.
Gross profit margin for light-weight CMP for the six months ended June 30, 2018 was 5.11%, or 15.94 percentage points lower, as compared to gross profit margin of 21.05% for the six months ended June 30, 2017.
Gross profit margin for offset printing paper was 1.41% for the six months ended June 30, 2018, a decrease of 17.69 percentage points, as compared to 19.10% for the six months ended June 30, 2017.
Gross profit margin for tissue paper products for the six months ended June 30, 2018 was 0%, a decrease of 6.45 percentage points, as compared to 6.45% for the six months ended June 30, 2017.
Digital Photo Paper
Loss for digital photo paper for the six months ended June 30, 2018 was $3,573, representing a gross margin of -25.47% compared with a loss of $nil for the six months ended June 30, 2017. In June 2016, we suspended the production of digital photo paper due to low market demand for our products and now are upgrading the production line to produce more competitive photo paper products.
Selling, General and Administrative Expenses
Selling, general and administrative expenses for the six months ended June 30, 2018 were $6,841,059, an increase of $1,370,168, or 25.04% from $5,470,891 for the six months ended June 30, 2017. The increase was mainly due to the depreciation of idle equipment during the suspension of production in the first quarter of 2018.
(Loss) Income from Operations
Operating loss for the six months ended June 30, 2018 was $4,531,208, a decrease of $8,166,802, or 224.63%, from operating income of $3,635,594 for the six months ended June 30, 2017. The decrease in operating income was primarily due to the decrease in gross profit and increase in selling, general and administrative expenses.
Other Income and Expenses
Interest expense for the six months ended June 30, 2018 decreased by $564,621, from $1,375,614 in the six months ended June 30, 2017, to $810,993. The Company had short-term and long-term interest-bearing loans and related party loans that aggregated $25,904,543 as of June 30, 2018, as compared to $39,799,651 as of June 30, 2017. The interest incurred during the six months ended June 30, 2018 and 2017, were $nil and $9,663, respectively, and were capitalized as soft-cost of construction-in-progress.
Net Income (Loss)
As a result of the above, net loss was $3,976,282 for the six months ended June 30, 2018, representing a decrease of $5,700,068, or 330.67%, from net income of $1,723,786 for six months ended June 30, 2017.
Accounts Receivable
Net accounts receivable increased by $879,267, or 47.69%, to $2,722,949 as of June 30, 2018, as compared with $1,843,682 as of December 31, 2017. We usually collect accounts receivable within 30 days of delivery and completion of sales.
| 33 |
Inventories
Inventories consist of raw materials (accounting for 70.06% of total value of inventory as of June 30, 2018) and finished goods. As of June 30, 2018, the recorded value of inventory decreased by 52.15% to $4,055,222 from $8,474,165 as of December 31, 2017. As of June 30, 2018, the inventory of recycled paper board, which is the main raw material for the production of CMP, was $2,028,145, approximately $4,309,229, or 68.00%, lower than the balance as of December 31, 2017. The higher balance in December 2017 was due to the additional purchases of paper board as a hedge against further increases in cost at end of 2017.
A summary of changes in major inventory items is as follows:
| June 30, | December 31, | |||||||||||||||
| 2018 | 2017 | $ Change | % Change | |||||||||||||
| Raw Materials | ||||||||||||||||
| Recycled paper board | $ | 2,028,145 | $ | 6,337,374 | -4,309,229 | -68.00 | % | |||||||||
| Recycled white scrap paper | 578,396 | 862,734 | -284,338 | -32.96 | % | |||||||||||
| Recycled scrap binding margin | - | - | - | |||||||||||||
| Tissue base paper | 24,922 | 25,236 | -314 | -1.24 | % | |||||||||||
| Coal & gas | 57,407 | 71,674 | -14,267 | -19.91 | % | |||||||||||
| Digital photo base paper and other raw materials | 152,190 | 191,419 | -39,229 | -20.49 | % | |||||||||||
| Total Raw Materials | 2,841,060 | 7,488,437 | -4,647,377 | -62.06 | % | |||||||||||
| Finished Goods | 1,214,162 | 985,728 | 228,434 | 23.17 | % | |||||||||||
| Totals | $ | 4,055,222 | $ | 8,474,165 | -4,418,943 | -52.15 | % | |||||||||
Accounts Payable and Notes Payable
Accounts payable and notes payable was $3,914,229 as of June 30, 2018, a decrease of 2,630,113, or 40.19%, from $6,544,342 as of December 31, 2017. Accounts payable was $135,853 and $422,705 as of June 30, 2018 and December 31, 2017, respectively. We have been relying on the bank acceptance notes issued under our credit facilities with Bank of Cangzhou to make the majority of our raw materials payments to our vendors. Our notes payable to Bank of Cangzhou were $3,778,376 and $6,121,637 as of June 30, 2018 and December 31, 2017, respectively. We repaid the balance owed on the bank acceptance notes of $6,045,401 in January 2018. In January 2018, Bank of Cangzhou issued bank acceptance notes on our behalf for $3,778,376 which become due in January of 2019.
| 34 |
Liquidity and Capital Resources
Overview
As of June 30, 2018, we had a net working capital deficit of $6,393,132, an increase of $4,622,396, from the net working capital deficit of $1,770,736 at December 31, 2017. Total current assets as of June 30, 2018 amounted to $19,229,644. Substantially all cash and cash equivalents are cash deposits in bank accounts. Restricted cash of $3,778,376 was included in our current assets as of June 30, 2018. Restricted cash is deposited at the Bank of Cangzhou for purpose of securing the bank acceptance notes from the bank. The acceptance notes will be due in January 2019.
Current liabilities as of June 30, 2018 totaled $25,622,776, an increase of $3,865,243, from the December 31, 2017 balance of $21,757,533. We use bank acceptance notes, which are typically 6-to-12 month notes, to guarantee the payments to our vendors. Notes payable was $3,778,376 as of June 30, 2018, representing a decrease of $2,343,261, or 38.28%, from $6,121,637 as of December 31, 2017. Most of our current short-term bank loans are either revolving or term loans. We expect to renew these loans with the banks on similar terms at or before maturity. All of our short-term loans (with the exception of the notes payable, which carry no interest but require a deposit equal to a portion of the credit facilities at the issuing banks) have interest-only monthly payments, with a balloon payment for the entire principal amount upon maturity of the loan. The long term loans from the credit union require monthly and quarterly interest payments, with one large balloon payment upon maturity.
In late January, 2018, the Company temporarily suspended its production due to a government-mandated restriction on the natural gas supply. The company resumed production on March 14, 2018. As a result, the company incurred a net loss in the first quarter of 2018. As the production resumed, the net cash generated from operations for the three months ended June 30, 2018 was $6 million compared to the net cash-out of $4.8 million in the first quarter of 2018. The management expects that there will be sufficient and continuous cash-in from sales in coming months and the working capital condition as of September 30, 2018 will be substantially improved.
Our loan-to-equity ratio was 14.46% as of June 30, 2018. Our debt-asset ratio was 15.02% as of June 30, 2018. The industry average of debt-asset ratios in China for 2016 was 56.9%, according to the latest industry report in 2016 provided by China Industry Intelligence Center at wenku.baidu.com. As long as we are able to manage our short-term liquidity, we believe that our overall financial condition, compared to our Chinese peers, is reasonably healthy and should allow us to further leverage our assets to obtain capital for future growth.
Renewal of operating lease
On August 7, 2013, the Company’s Audit Committee and the Board of Directors approved the sale of the land use right of the Headquarters Compound (the “LUR”), the office building and essentially all industrial-use buildings in the Headquarters Compound (the “Industrial Buildings”), and three employee dormitory buildings located within the Headquarters Compound (the “Dormitories”) to Hebei Fangsheng for cash prices of approximately $2.77 million, $1.15 million, and $4.31 million respectively. In connection with the sale of the Industrial Buildings, Hebei Fangsheng agreed to lease the Industrial Buildings back to the Company for its original use for a term of up to three years, with an annual rental payment of approximately $156,568 (RMB1,000,000). The lease agreement expired in August 2016. On August 9, 2016, the Company paid off the rental for the first lease agreement and entered into a supplementary agreement with Hebei Fangsheng, who agreed to extend the lease term for another two years, with the same rental payment as original lease agreement. The accrued rental owed to Hebei Fangsheng was approximately $135,193 and $60,378 which was recorded as part of the current liabilities as of June 30, 2018 and December 31, 2017, respectively.
Capital Expenditure Commitment as of June 30, 2018
We finance our daily operations mainly by cash flows generated from our business operations and loans from banking institutions and our major shareholders. Major capital expenditures in the six months ended June 30, 2018 were primarily financed by cash from operations. As of June 30, 2018, we had approximately $11 million in capital expenditure commitments that were mainly related to the construction costs of building equipment and other facilities in a new industrial park in Wei County of Hebei, China, where we expect to build two tissue paper production lines (PM8 and PM9), and install other paper production machinery. These commitments are expected to be financed by bank loans and cash flows generated from our business operations.
| 35 |
Capital Expenditures
Our committed capital expenditures for the next 12 months are approximately $11 million, which mainly includes budgeted costs for the projects described below.
New Production Lines at the Wei County Industrial Park
In November 2012, we entered into a 15-year land lease with a land investment company in Wei County for the purpose of developing the 49.4 acres of land into the base of our next capacity expansion. In December 2012, we signed a contract with an equipment contractor in Shanghai to build the first of our two tissue paper production lines in Wei County. The two production lines, each having production capacity of 15,000 tonnes/year, will be designated as PM8 and PM9 upon completion. Total estimated cost of the Wei County tissue paper project is up to approximately $131 million (of which $123 million has been incurred thus far), including the estimated costs of general infrastructure and administrative facilities such as warehouses, offices, dorms and landscaping, of up to $108 million (of which $100 million has been incurred thus far) and the estimated costs for the two paper machines and related packaging equipment of up to $23 million (of which $23 million has been incurred thus far). The installation of PM8 with gas boilers was completed. We are applying for the sewage discharge permit and completion acceptance of environmental protection by relevant government authorities before launching mass production of tissue paper products.
We plan to build a second 15,000 tonnes/year tissue paper production line (designated as PM9) at an estimated cost of $7.8 million after the PM8 production line is put into production.
Relocation of Digital Photo Paper PM4 and PM5 Production Lines
In August 2015, we completed the relocation of our digital photo paper production lines (PM4 and PM5), as well as related chemical and packaging equipment, from the workshops located in our Headquarters Compound to a new location that is across the street from our Xushui Paper Mill, the Xushui Mill Annex. Total cost of the relocation of the PM4 and PM5 production lines and building construction costs incurred was approximately $4.5 million.
We purchased the land use rights of the 58,566 square meters at Xushui Mill Annex for approximately $7.7 million in April 2012 and constructed three industrial buildings for the digital photo paper operations, a dormitory for factory workers and offices to hold our consolidated Xushui County operations. We completed the relocation and resumed commercial production of digital photo paper in August 2015. In June 2016, we suspended the production of digital photo paper due to low market demand for our products. We are upgrading the facilities to produce more competitive photo paper products.
Cash and Cash Equivalents
Our cash, cash equivalents and restricted cash as of June 30, 2018 was $9,523,660, an increase of $506,233, from $9,017,427 as of December 31, 2017. The increase of cash and cash equivalents for the six months ended June 30, 2018 was attributable to a number of factors:
i. Net cash provided by operating activities
Net cash provided by operating activities was $1,148,161 for the six months ended June 30, 2018. The balance represented a decrease of cash of $2,591,378, or 69.30%, from $3,739,539 provided for the six months ended June 30, 2017. Net loss for the six months ended June 30, 2018 was $3,976,282, representing a decrease of $5,700,068, or 330.67%, from a net income of $1,723,786 for the six months ended June 30, 2017. Changes in various asset and liability account balances throughout the six months ended June 30, 2018 also contributed to the net change in cash from operating activities in six months ended June 30, 2018. Chief among such changes is the increase of accounts receivable in the amount of $953,735 during the six months of 2018 and the decrease of notes payable in the amount of $2,348,520. There was also a decrease of $4,468,468 in the ending inventory balance as of June 30, 2018 (an increase to net cash for the six months ended June 30, 2018 cash flow purposes). In addition, the Company had non-cash expenses relating to depreciation and amortization in the amount of $7,410,833. The Company also had a net increase of $2,319,121 in prepayment and other current assets (a decrease to net cash) and a net increase of $758,219 in other payables and accrued liabilities and due to related parties (an increase to net cash), as well as a decrease in income tax payable of $537,772 (a decrease to net cash) during the six months ended June 30, 2018.
ii. Net cash used in investing activities
We incurred $1,233,667in net cash expenditures for investing activities during the six months of 2018, as compared to $5,875,813 for the same period of 2017. Expenditures in the six months ended June 30, 2018 were mainly for the progress payments for the construction of our first tissue paper production line (PM8) and related facilities, including three paper mill workshops and maintenance workshops and four warehouses at the Wei County industrial park in Wei County, Hebei province.
| 36 |
iii. Net cash provided by financing activities
Net cash provided by financing activities was $782,840 for the six months ended June 30, 2018, as compared to net cash provided by financing activities in the amount of $10,212,749 for the six months ended June 30, 2017. The decrease was mainly attributable to repayment of related party loans and short term bank loans.
Short-term bank loans
| June 30, | December 31, | |||||||||
| 2018 | 2017 | |||||||||
| Industrial and Commercial Bank of China (“ICBC”) Loan 1 | (a) | $ | - | $ | 4,285,145 | |||||
| ICBC Loan 2 | (b) | 2,871,565 | 2,907,778 | |||||||
| Bank of Cangzhou | (c) | 5,289,726 | - | |||||||
| ICBC Loan 3 | (d) | 4,231,781 | - | |||||||
| Total short-term bank loans | $ | 12,393,072 | $ | 7,192,923 | ||||||
| (a) | On January 10, 2017, the Company entered into a working capital loan agreement with the ICBC, with a balance of $4,285,145 as of December 31, 2017. The working capital loan was guaranteed by Hebei Tengsheng with its land use right pledged as collateral for the benefit of the bank. The loan bears a fixed interest rate of 4.5675% per annum. The loan was due and repaid on January 8, 2018. |
| (b) | On October 18, 2017, the Company entered into a working capital loan agreement with the ICBC, with a balance of $2,871,565 and $2,907,778 as of June 30, 2018 and December 31, 2017, respectively. The working capital loan is secured by the Company’s land use right as collateral for the benefit of the bank. The loan bears a fixed interest rate of 4.945% per annum. The loan will be due on October 12, 2018. |
| (c) | On January 2, 2018, the Company entered into a working capital loan agreement with the Bank of Cangzhou. The loan was withdrawn on January 4, 2018, with a balance of $5,289,726 as of June 30, 2018. The loan bears a fixed interest rate of 6.09% per annum. The working capital loan is secured by the Company’s land use right and guaranteed by the Company’s CEO and Baoding Shengde with its production equipment as collateral for the benefit of the bank. The loan will be due on January 3, 2019. |
| (d) | On February 6, 2018, the Company entered into a working capital loan agreement with the ICBC, with a balance of $4,231,781 as of June 30, 2018. The working capital loan was guaranteed by Hebei Tengsheng with its land use right pledged as collateral for the benefit of the bank. The loan bears a fixed interest rate of 5.4% per annum. The loan will be due on February 9, 2019. |
As of June 30, 2018, there were guaranteed short-term borrowings of $12,393,072 and unsecured bank loans of $nil. As of December 31, 2017, there were guaranteed short-term borrowings of $7,192,923 and unsecured bank loans of $nil.
The average short-term borrowing rates for the three months ended June 30, 2018 and 2017 were approximately 5.59% and 5.25%, respectively. The average short-term borrowing rates for the six months ended June 30, 2018 and 2017 were approximately 5.58% and 5.27%, respectively.
Long-term loans from credit union
As of June 30, 2018 and December 31, 2017, loans payable to Rural Credit Union of Xushui County, amounted to $7,466,070 and $7,560,221, respectively.
| 37 |
On April 16, 2014, the Company entered into a loan agreement with the Rural Credit Union of Xushui County for a term of 5 years, which is payable in various installments from June 21, 2014 to November 18, 2018. The loan is guaranteed by an independent third party. Interest payment is due quarterly and bears the rate of 0.72% per month. In August 2015, after giving the required notice to the Rural Credit Union of Xushui County in accordance with the terms on the agreement, the Company prepaid a portion of the loan in an amount of $188,919, of which $52,897 was paid ahead of its original repayment schedule. As of June 30, 2018 and December 31, 2017, total outstanding loan balance was $1,299,761 and $1,316,152, respectively, which is presented as current liabilities in the consolidated balance sheet.
On July 15, 2013, the Company entered into a loan agreement with the Rural Credit Union of Xushui County for a term of 5 years, which is due and payable in various installments from December 21, 2013 to July 26, 2018. The loan is secured by certain of the Company’s manufacturing equipment with net book value of $6,927,618 and $7,963,285 as of June 30, 2018 and December 31, 2017, respectively. Interest payment is due quarterly and bears a fixed rate of 0.72% per month. In August 2015, after giving the required notice to the Rural Credit Union of Xushui County in accordance with the terms on the agreement, the Company prepaid a portion of the loan in an amount of $196,476, of which $45,341 was paid ahead of its original repayment schedule. As of June 30, 2018 and December 31, 2017, the total outstanding loan balance was $3,778,376 and $3,826,022, respectively, which is presented as current liabilities in the consolidated balance sheet.
On April 20, 2017, the Company entered into a loan agreement with the Rural Credit Union of Xushui County for a term of 2 years, which is due and payable in various installments from August 26, 2017 to April 19, 2019. The loan is guaranteed by Hebei Tengsheng with its land use right pledged as collateral for the benefit of the bank. Interest payment is due quarterly and bears a fixed rate of 0.6% per month. As of June 30, 2018 and December 31, 2017, the total outstanding loan balance was $2,387,933 and $2,418,047, respectively. Out of the total outstanding loan balance, current portion amounted were $2,387,933 and $1,224,328 as of June 30, 2018 and December 31, 2017, respectively, which are presented as current liabilities in the consolidated balance sheet and the remaining balance of $nil and $1,193,719 are presented as non-current liabilities in the consolidated balance sheet as of June 30, 2018 and December 31, 2017, respectively.
Total interest expenses for the short-term bank loans and long-term loans for the three months ended June 30, 2018 and 2017 were $328,955 and $324,929, respectively. Total interest expenses for the short-term bank loans and long-term loans for the six months ended June 30, 2018 and 2017 were $620,294 and $587,708, respectively.
Shareholder Loans
The Company’s CEO has loaned money to Dongfang Paper for working capital purposes over a period of time. On January 1, 2013, Dongfang Paper and Mr. Zhenyong Liu renewed the three-year term loan previously entered on January 1, 2010, and extended the maturity date further to December 31, 2015. On December 31, 2015, the Company paid off the loan of $2,249,279, together with interest of $391,374 for the period from 2013 to 2015. Approximately $387,410 and $392,296 of interest were outstanding to Mr. Zhenyong Liu, which were recorded in other payables and accrued liabilities as part of the current liabilities in the consolidated balance sheet as of June 30, 2018 and December 31, 2017, respectively.
On December 10, 2014, Mr. Zhenyong Liu provided a loan to the Company, amounted to $9,541,833 to Dongfang Paper for working capital purpose with an interest rate of 4.35% per annum, which was based on the primary lending rate of People’s Bank of China. The unsecured loan was provided on December 10, 2014, and would be originally due on December 10, 2017. During the year of 2016, the Company repaid $6,012,416 to Mr. Zhenyong Liu, together with interest of $288,596. In February 2018, the company repaid $3,131,361 to Mr. Zhenyong Liu. As of June 30, 2018 and December 31, 2017, the outstanding loan balance was $nil and $3,060,818, respectively and the accrued interest was $77,117 and $45,912, respectively, which was recorded in other payables and accrued liabilities as part of the current liabilities in the consolidated balance sheet.
On March 1, 2015, the Company entered an agreement with Mr. Zhenyong Liu which allows Dongfang Paper to borrow from the CEO an amount up to $18,136,203 (RMB120,000,000) for working capital purposes. The advances or funding under the agreement are due three years from the date each amount is funded. The loan is unsecured and carries an annual interest rate set on the basis of the primary lending rate of the People’s Bank of China at the time of the borrowing. On July 13, 2015, an unsecured amount of $4,324,636 was drawn from the facility. On October 14, 2016 an unsecured amount of $2,883,091 was drawn from the facility. In February 2018, the company repaid $1,565,680 to Mr. Zhenyong Liu. The loan would be originally due on July 12, 2018. Mr. Zhenyong Liu agreed to extend the loan for additional 3 years and the remaining balance will be due on July 12, 2021. As of June 30, 2018 and December 31, 2017, the outstanding loan balance were $6,045,401 and $7,652,047, respectively, and the accrued interest was $261,407 and $110,476, respectively, which was recorded in other payables and accrued liabilities as part of the current liabilities in the consolidated balance sheet.
As of June 30, 2018 and December 31, 2017, total amount of loans due to Mr. Zhenyong Liu were $6,045,401 and $10,712,865, respectively. The interest expense incurred for such related party loans are $78,227 and $111,232 for the three months ended June 30, 2018 and 2017, respectively. The interest expenses incurred for such related party loans are $190,699 and $221,916 for the six months ended June 30, 2018 and 2017, respectively. The accrued interest owe to the CEO was approximately $725,934 and $548,684, as of June 30, 2018 and December 31, 2017, respectively, which was recorded in other payables and accrued liabilities.
As of June 30, 2018 and 2017, amount due to shareholder are $103,235 and $nil, respectively, which represents funds from shareholders to pay for various expenses incurred in the U.S. The amount is due on demand with interest free.
| 38 |
Critical Accounting Policies and Estimates
The Company’s financial statements are prepared in accordance with accounting principles generally accepted in the United States, which require us to make estimates and assumptions that affect the reported amounts of assets and liabilities and disclosure of contingent assets and liabilities at the date of the financial statements and the reported amounts of revenues and expenses during the reporting periods. Management makes these estimates using the best information available at the time the estimates are made. However, actual results could differ materially from those estimates. The most critical accounting policies are listed below:
Revenue Recognition Policy
The Company recognizes revenue when goods are delivered and a formal arrangement exists, the price is fixed or determinable, the delivery is completed, no other significant obligations of the Company exist, and collectability is reasonably assured. Goods are considered delivered when the customer’s truck picks up goods at our finished goods inventory warehouse.
Long-Lived Assets
The Company evaluates the recoverability of long-lived assets and the related estimated remaining useful lives when events or circumstances lead management to believe that the carrying value of an asset may not be recoverable and the undiscounted cash flows estimated to be generated by those assets are less than the assets’ carrying amount. In such circumstances, those assets are written down to estimated fair value. Our judgments regarding the existence of impairment indicators are based on market conditions, assumptions for operational performance of our businesses, and possible government policy toward operating efficiency of the Chinese paper manufacturing industry. For the six months ended June 30, 2018 and 2017, no events or circumstances occurred for which an evaluation of the recoverability of long-lived assets was required. We are currently not aware of any events or circumstances that may indicate any need to record such impairment in the future.
Foreign Currency Translation
The functional currency of Dongfang Paper and Baoding Shengde is the Chinese Yuan Renminbi (“RMB”). Under ASC Topic 830-30, all assets and liabilities are translated into United States dollars using the current exchange rate at the end of each fiscal period. The current exchange rates used by the Company as of June 30, 2018 and December 31, 2017 to translate the Chinese RMB to the U.S. Dollars are 6.6166:1 and 6.5342:1, respectively. Revenues and expenses are translated using the prevailing average exchange rates at 6.3870:1, and 6.8607:1 for the six months ended June 30, 2018 and 2017, respectively. Translation adjustments are included in other comprehensive income (loss).
Off-Balance Sheet Arrangements
We were the guarantor for Baoding Huanrun Trading Co., for its long-term bank loans in an amount of $8,463,561 (RMB56,000,000), which matures at various times in 2018. Baoding Huanrun Trading Co. is one of our major suppliers of raw materials. This helps us to maintain a good relationship with the supplier and negotiate for better terms in payment for materials. If Huanrun Trading Co. were to become insolvent, the Company could be materially adversely affected. Except as aforesaid, we have no material off-balance sheet transactions.
Recent Accounting Pronouncements
In January 2016, the FASB issued ASU No. 2016-01, “Financial Instruments - Overall (Subtopic 825-10): Recognition and Measurement of Financial Assets and Financial Liabilities” (“ASU 2016-01”). The amendments in this update require all equity investments to be measured at fair value with changes in the fair value recognized through net income (other than those accounted for under equity method of accounting or those that result in consolidation of the investee). The amendments in this update also require an entity to present separately in other comprehensive income the portion of the total change in the fair value of a liability resulting from a change in the instrument-specific credit risk when the entity has elected to measure the liability at fair value in accordance with the fair value option for financial instruments. In addition, the amendments in this update eliminate the requirement to disclose the method(s) and significant assumptions used to estimate the fair value that are required to be disclosed for financial instruments measured at amortized cost on the balance sheet for public entities. For public business entities, the amendments in ASU 2016-01 are effective for fiscal years beginning after December 15, 2017, including interim periods within those fiscal years. Except for the early application guidance discussed in ASU 2016-01, early adoption of the amendments in this update is not permitted. We do not expect the adoption of ASU 2016-01 to have a material impact on our condensed consolidated financial statements.
| 39 |
In February 2016, the FASB issued ASU No. 2016-02, “Leases (Topic 842)” (“ASU 2016-02”). The amendments in this update create Topic 842, Leases, and supersede the leases requirements in Topic 840, Leases. Topic 842 specifies the accounting for leases. The objective of Topic 842 is to establish the principles that lessees and lessors shall apply to report useful information to users of financial statements about the amount, timing, and uncertainty of cash flows arising from a lease. The main difference between Topic 842 and Topic 840 is the recognition of lease assets and lease liabilities for those leases classified as operating leases under Topic 840. Topic 842 retains a distinction between finance leases and operating leases. The classification criteria for distinguishing between finance leases and operating leases are substantially similar to the classification criteria for distinguishing between capital leases and operating leases in the previous leases guidance. The result of retaining a distinction between finance leases and operating leases is that under the lessee accounting model in Topic 842, the effect of leases in the statement of comprehensive income and the statement of cash flows is largely unchanged from previous GAAP. The amendments in ASU 2016-02 are effective for fiscal years beginning after December 15, 2018, including interim periods within those fiscal years for public business entities. Early application of the amendments in ASU 2016-02 is permitted. We are currently in the process of evaluating the impact of the adoption of ASU 2016-02 on our condensed consolidated financial statements.
In June 2016, the FASB issued ASU No. 2016-13, “Financial Instruments-Credit Losses (Topic 326): Measurement of Credit Losses on Financial Instruments” (“ASU 2016-13”). Financial Instruments-Credit Losses (Topic 326) amends guidelines on reporting credit losses for assets held at amortized cost basis and available-for-sale debt securities. For assets held at amortized cost basis, Topic 326 eliminates the probable initial recognition threshold in current GAAP and, instead, requires an entity to reflect its current estimate of all expected credit losses. The allowance for credit losses is a valuation account that is deducted from the amortized cost basis of the financial assets to present the net amount expected to be collected. For available-for-sale debt securities, credit losses should be measured in a manner similar to current GAAP, however Topic 326 will require that credit losses be presented as an allowance rather than as a write-down. ASU 2016-13 affects entities holding financial assets and net investment in leases that are not accounted for at fair value through net income. The amendments affect loans, debt securities, trade receivables, net investments in leases, off balance sheet credit exposures, reinsurance receivables, and any other financial assets not excluded from the scope that have the contractual right to receive cash. The amendments in this ASU will be effective for fiscal years beginning after December 15, 2019, including interim periods within those fiscal years. We are currently evaluating the impact of the adoption of ASU 2016-13 on our condensed consolidated financial statements.
| Item 3. | Quantitative and Qualitative Disclosures about Market Risk. |
Foreign Exchange Risk
While our reporting currency is the US dollar, almost all of our consolidated revenues and consolidated costs and expenses are denominated in RMB. All of our assets are denominated in RMB except for some cash and cash equivalents and accounts receivables. As a result, we are exposed to foreign exchange risks as our revenues and results of operations may be affected by fluctuations in the exchange rate between US dollar and RMB. If the RMB depreciates against the US dollar, the value of our RMB revenues, earnings and assets as expressed in our US dollar financial statements will decline. We have not entered into any hedging transactions in an effort to reduce our exposure to foreign exchange risk.
Inflation
Although we are generally able to pass along minor incremental cost inflation to our customers, inflation such as increases in the costs of our products and overhead costs may adversely affect our operating results. We do not believe that inflation in China has had a material impact on our financial position or results of operations to date, however, a high rate of inflation in the future may have an adverse effect on our ability to maintain current levels of gross margin and selling and distribution, general and administrative expenses as a percentage of net revenues if the selling prices of our products do not increase in line with the increased costs.
| Item 4. | Controls and Procedures. |
As required by Rule 13a-15 of the Securities Exchange Act, as amended (the “Securities Act”), we have evaluated the effectiveness of the design and operation of our disclosure controls and procedures, which were designed to provide reasonable assurance of achieving their objectives. This evaluation was carried out under the supervision and with the participation of our management, including our principal executive officer and principal financial officer. Based on this evaluation, our principal executive officer and principal financial officer have concluded that, as of June 30, 2018, our disclosure controls and procedures were effective at the reasonable assurance level to ensure (1) that information required to be disclosed by us in the reports we file or submit under the Exchange Act is recorded, processed, summarized and reported, within the time periods specified in the SEC’s rules and forms, and (2) information required to be disclosed by us in our reports that we file or submit under the Exchange Act is accumulated and communicated to our management, including our principal executive officer and principal financial officer, or persons performing similar functions, as appropriate to allow timely decisions regarding required disclosure.
Changes in Internal Control over Financial Reporting
There were no changes with respect to our internal control over financial reporting that materially affected, or are reasonably likely to materially affect, our internal control over financial reporting in the quarterly period ended June 30, 2018.
| 40 |
PART II - OTHER INFORMATION
| Item 1. | Legal Proceedings. |
None.
| Item 1A. | Risk Factors. |
Information about risk factors for the three months ended June 30, 2018, does not differ materially from that set forth in Part I, Item 1A of the Company’s 2017 Annual Report on Form 10-K.
| Item 2. | Unregistered Sales of Equity Securities and Use of Proceeds. |
None.
| Item 3. | Defaults Upon Senior Securities. |
None.
| Item 4. | Mine Safety Disclosures. |
Not applicable.
| Item 5. | Other Information. |
None.
| Item 6. | Exhibits. |
(a) Exhibits
| 31.1 | Certification of Principal Executive Officer pursuant to Rule 13a-14 and Rule 15d-14(a), promulgated under the Securities and Exchange Act of 1934, as amended. | |
| 31.2 | Certification of Principal Financial Officer pursuant to Rule 13a-14 and Rule 15d-14(a), promulgated under the Securities and Exchange Act of 1934, as amended. | |
| 32.1 | Certification pursuant to 18 U.S.C. Section 1350, as adopted pursuant to Section 906 of the Sarbanes-Oxley Act of 2002. | |
| 32.2 | Certification pursuant to 18 U.S.C. Section 1350, as adopted pursuant to Section 906 of the Sarbanes-Oxley Act of 2002. | |
| 101.INS | XBRL Instance Document | |
| 101.SCH | XBRL Schema Document | |
| 101.CAL | XBRL Calculation Linkbase Document | |
| 101.LAB | XBRL Label Linkbase Document | |
| 101.PRE | XBRL Presentation Linkbase Document | |
| 101.DEF | XBRL Definition Linkbase Document |
| 41 |
SIGNATURES
Pursuant to the requirements of the Securities Exchange Act of 1934, the registrant has duly caused this report to be signed on its behalf by the undersigned, thereunto duly authorized.
| IT TECH PACKAGING, INC. | ||
| Date: August 9, 2018 | /s/ Zhenyong Liu | |
| Name: | Zhenyong Liu | |
| Title: | Chief Executive Officer | |
| (Principal Executive Officer) | ||
| Date: August 9, 2018 | /s/ Jing Hao | |
| Name: | Jing Hao | |
| Title: | Chief Financial Officer | |
| (Principal Financial Officer) | ||
| 42 |