Attached files
| file | filename |
|---|---|
| EX-99.1 - EX-99.1 - Global Eagle Entertainment Inc. | d583441dex991.htm |
| 8-K - 8-K - Global Eagle Entertainment Inc. | d583441d8k.htm |
Exhibit 99.2

2Q 2018 Results Global Eagle Entertainment Inc. August 9, 2018 © 2018 Global Eagle
Forward-Looking Statements We may make forward-looking statements in this presentation within the meaning of the Securities Litigation Reform Act of 1995. These forward-looking statements include, without limitation, statements with respect to our expected Adjusted EBITDA, revenue and margin growth in future periods, our aviation-connectivity installations in future periods, our business and financial-performance outlook, industry, business strategy, plans, business and M&A integration activities, capital expenditures, operating-expense and cost-structure improvements and reductions, future operations, margins, profitability, future efficiencies and other financial and operating information. These statements may be preceded by, followed by or include the words “may,” “might,” “will,” “will likely result,” “should,” “estimate,” “plan,” “project,” “forecast,” “intend,” “expect,” “anticipate,” “believe,” “seek,” “continue,” “target” or similar expressions. These forward-looking statements are based on information available to us as of the date they were made, and should not be relied upon as representing our views as of any subsequent date. These forward-looking statements are subject to a number of risks and uncertainties, including without limitation those risks and uncertainties described in our most recent annual report on Form 10-K and subsequently filed reports on Form 10-Q. As a result, our actual results or performance may be materially different from those expressed or implied by these forward-looking statements. We do not undertake any obligation to update forward-looking statements to reflect events or circumstances after the date they were made, whether as a result of new information, future events or otherwise, except as may be required under applicable securities laws. 1 2Q 2018 Webcast © 2018 Global Eagle

Participants Prepared remarks: Additional Q&A participants: Josh Marks Jeff Leddy Chief Executive Officer Executive Chairman Paul Rainey Per Norén Chief Financial Officer Chief Commercial Officer Peter Lopez Walé Adepoju VP Investor Relations Chief Strategy Officer 2 2Q 2018 Webcast © 2018 Global Eagle

Solutions that connect, entertain and inform passengers and remote workers, enriching time with fast Internet, live TV, games and applications 3 2Q 2018 Webcast
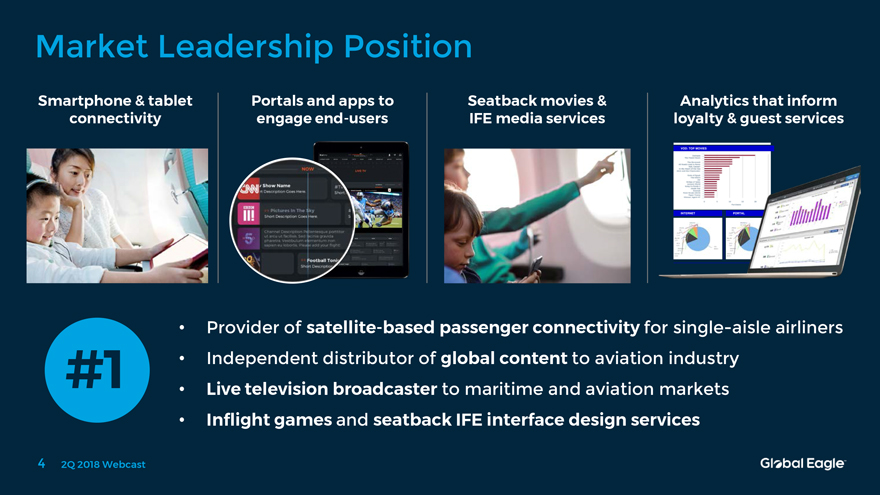
Market Leadership Position Smartphone & tablet Portals and apps to Seatback movies & Analytics that inform connectivity engage end-users IFE media services loyalty & guest services • Provider of satellite-based passenger connectivity for single-aisle airliners #1 • Independent distributor of global content to aviation industry • Live television broadcaster to maritime and aviation markets • Inflight games and seatback IFE interface design services 4 2Q 2018 Webcast
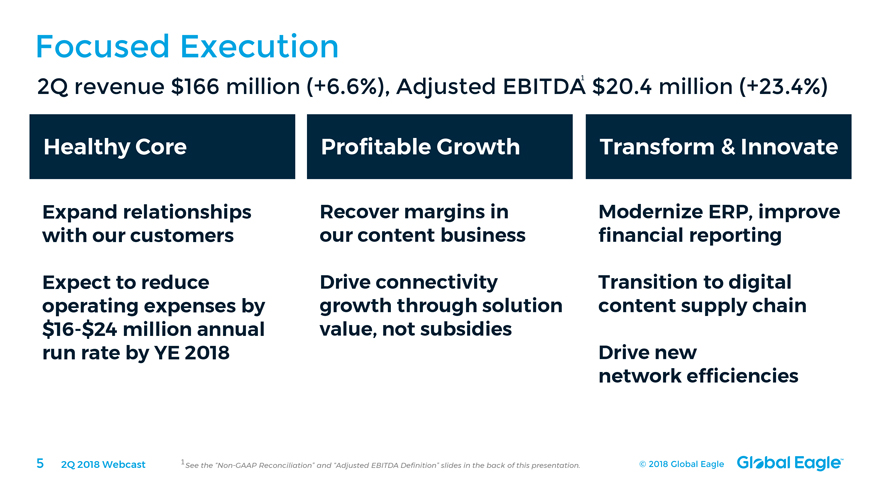
Focused Execution 2Q revenue $166 million (+6.6%), Adjusted EBITDA1 $20.4 million (+23.4%) Healthy Core Profitable Growth Transform & Innovate Expand relationships Recover margins in Modernize ERP, improve with our customers our content business financial reporting Expect to reduce Drive connectivity Transition to digital operating expenses by growth through solution content supply chain $16-$24 million annual value, not subsidies run rate by YE 2018 Drive new network efficiencies 5 2Q 2018 Webcast 1See the “Non-GAAP Reconciliation” and “Adjusted EBITDA Definition” slides in the back of this presentation. © 2018 Global Eagle
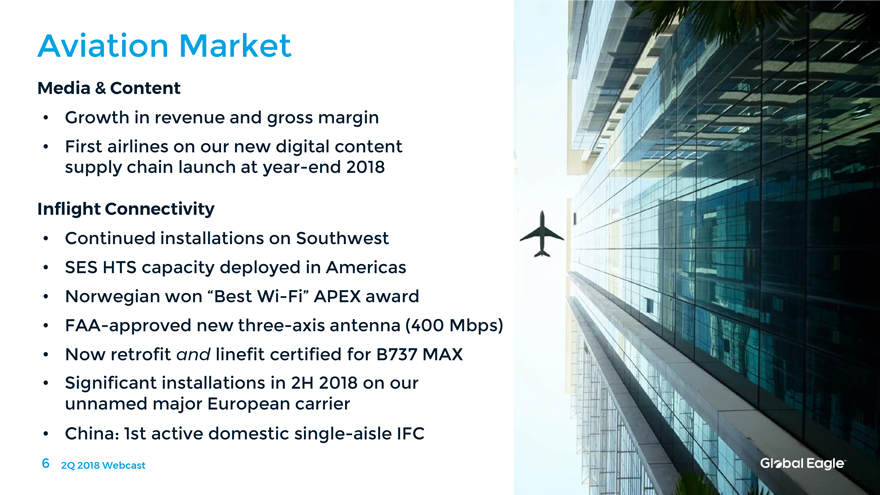
Aviation Market Media & Content • Growth in revenue and gross margin • First airlines on our new digital content supply chain launch at year-end 2018 Inflight Connectivity • Continued installations on Southwest • SES HTS capacity deployed in Americas • Norwegian won “Best Wi-Fi” APEX award • FAA-approved new three-axis antenna (400 Mbps) • Now retrofit and linefit certified for B737 MAX • Significant installations in 2H 2018 on our unnamed major European carrier • China: 1st active domestic single-aisle IFC 6 2Q 2018 Webcast

Maritime & Land Market Cruise & Ferry • Revenue growth 8% vs 2Q 2017 • 212 vessels connected as of June 30 • TV vessel count 20% and cabins 50% vs 2Q 2017 • LEO testing (with Telesat) expected in 4Q 2018 Other Maritime & Land Segments • Shifting resources to support growth in more profitable maritime & land segments • Brazil, yachts, and government activity all driving top-line and margin growth • Brazil backlog drives 2x revenue growth in Brazil • Winding down cellular backhaul business • Expanding US military business 7 2Q 2018 Webcast
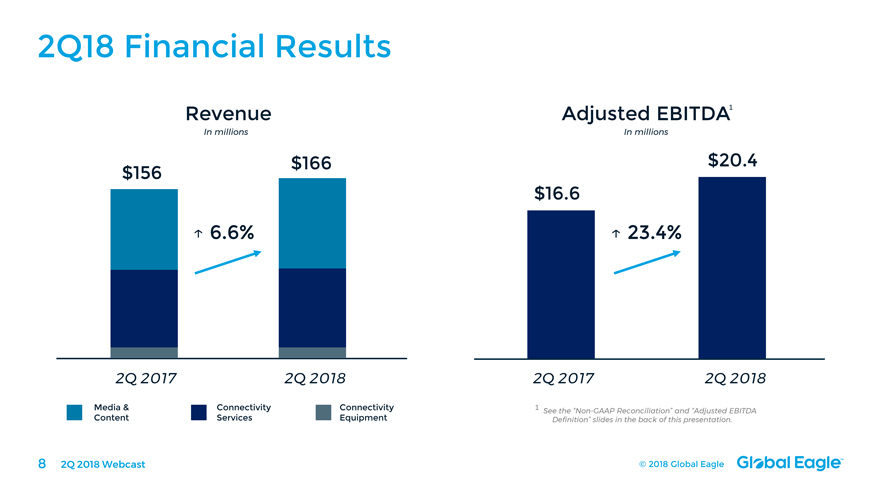
2Q18 Financial Results Revenue Adjusted EBITDA1 In millions In millions $166 $20.4 $156 $16.6 6.6% 23.4% $260 $388 $426 $530 $619 7 $50.0 $57. $ 2Q 2017 2Q 2018 2Q 2017 2Q 2018 Media & Connectivity Connectivity 1 See the “Non-GAAP Reconciliation” and “Adjusted EBITDA Content Services Equipment Definition” slides in the back of this presentation. 8 2Q 2018 Webcast © 2018 Global Eagle
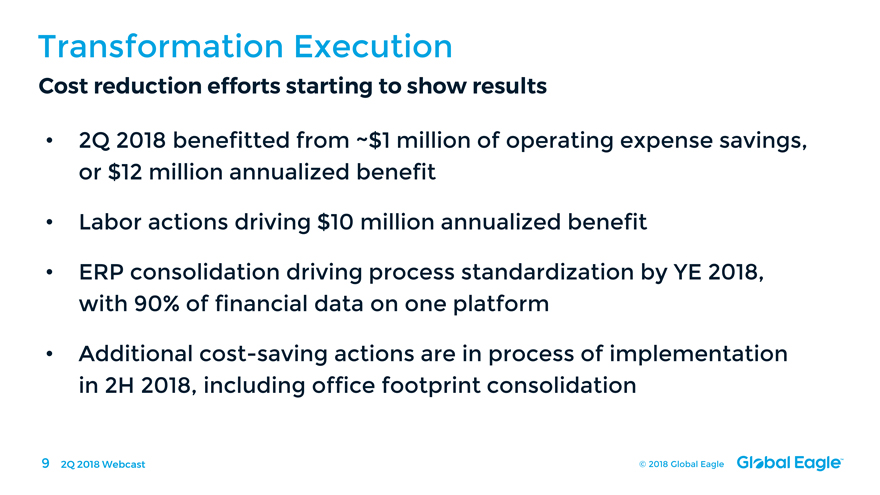
Transformation Execution Cost reduction efforts starting to show results • 2Q 2018 benefitted from ~$1 million of operating expense savings, or $12 million annualized benefit • Labor actions driving $10 million annualized benefit • ERP consolidation driving process standardization by YE 2018, with 90% of financial data on one platform • Additional cost-saving actions are in process of implementation in 2H 2018, including office footprint consolidation 9 2Q 2018 Webcast © 2018 Global Eagle
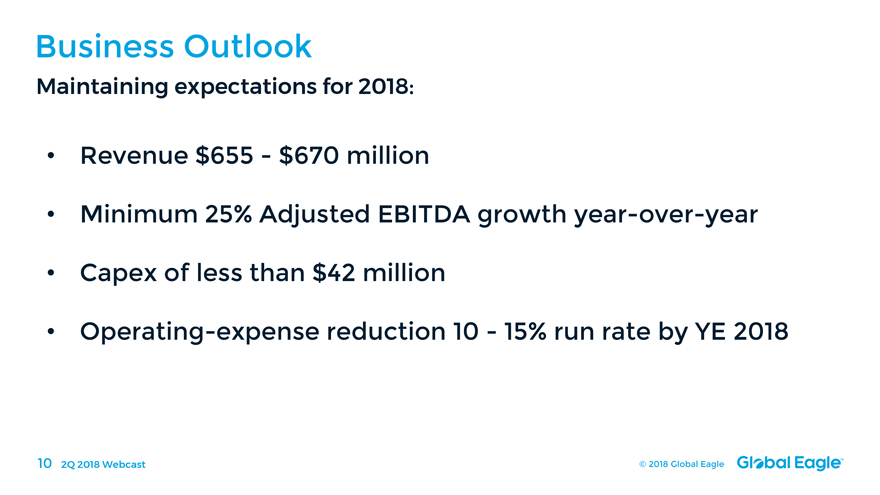
Business Outlook Maintaining expectations for 2018: • Revenue $655—$670 million • Minimum 25% Adjusted EBITDA growth year-over-year • Capex of less than $42 million • Operating-expense reduction 10—15% run rate by YE 2018 10 2Q 2018 Webcast © 2018 Global Eagle

Questions & Answers © 2018 Global Eagle
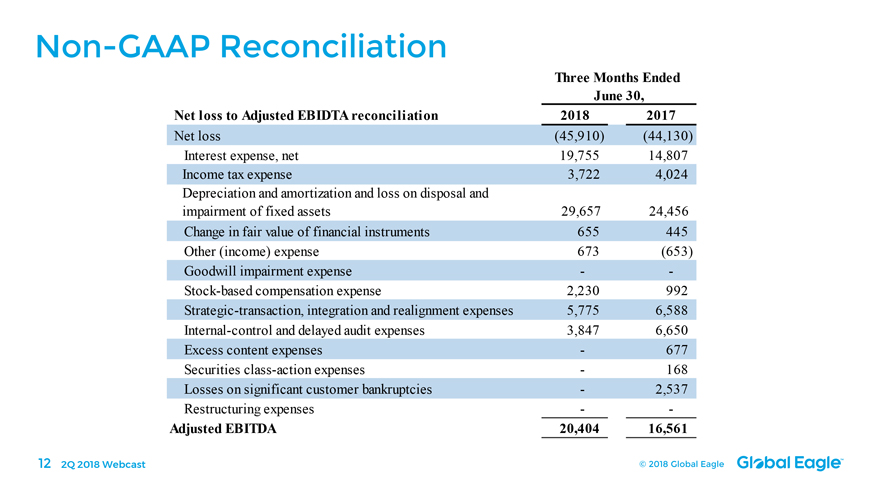
Non-GAAP Reconciliation Three Months Ended June 30, Net loss to Adjusted EBIDTA reconciliation 2018 2017 Net loss (45,910) (44,130) Interest expense, net 19,755 14,807 Income tax expense 3,722 4,024 Depreciation and amortization and loss on disposal and impairment of fixed assets 29,657 24,456 Change in fair value of financial instruments 655 445 Other (income) expense 673 (653) Goodwill impairment expense — -Stock-based compensation expense 2,230 992 Strategic-transaction, integration and realignment expenses 5,775 6,588 Internal-control and delayed audit expenses 3,847 6,650 Excess content expenses — 677 Securities class-action expenses — 168 Losses on significant customer bankruptcies — 2,537 Restructuring expenses — —Adjusted EBITDA 20,404 16,561 12 2Q 2018 Webcast © 2018 Global Eagle
Adjusted EBITDA Definition To supplement our consolidated financial statements, which are prepared and
presented in accordance with accounting principles generally accepted in the United States, or GAAP, we present Adjusted EBITDA, which is a non-GAAP financial measure, as a measure of our performance. The
presentation of Adjusted EBITDA is not intended to be considered in isolation from, or as a substitute for, or superior to, net income (loss) or any other performance measures derived in accordance with GAAP or as an alternative to net cash provided
by operating activities or any other measures of our cash flows or liquidity. Further, we note that Adjusted EBITDA as presented herein is defined and calculated differently than the “Consolidated EBITDA” definition in our senior secured
credit agreement and in our second lien notes, which Consolidated EBITDA definition we use for financial-covenant-compliance purposes and as a measure of our liquidity. For a reconciliation of Adjusted EBITDA to its most comparable measure under
GAAP, please see the slide entitled “Non-GAAP Reconciliation” in this presentation. Adjusted EBITDA is one of the primary measures used by our management and Board of Directors to understand and
evaluate our financial performance and operating trends, including period to period comparisons, to prepare and approve our annual budget and to develop short and long term operational plans. Additionally, Adjusted EBITDA is one of the primary
measures used by the Compensation Committee of our Board of Directors to establish the funding targets for (and subsequent funding of) our Annual Incentive Plan bonuses for our employees. We believe our presentation of Adjusted EBITDA is useful to
investors both because it allows for greater transparency with respect to key metrics used by our management in their financial and operational decision-making and because our management frequently uses it in discussions with investors, commercial
bankers, securities analysts and other users of our financial statements. We define Adjusted EBITDA as net income (loss) before (a) interest expense (income), (b) income tax expense (benefit) and (c) depreciation and amortization
(including relating to equity-method investments) and (gain) loss on disposal and impairment of fixed assets, and we then further adjust that result to exclude (when applicable in the period) (1) change in fair value of financial instruments,
(2) other (income) expense, including primarily, (gains) losses from investments and foreign-currency-transaction (gains) losses, (3) goodwill impairment expense, (4) stock-based compensation expense, (5) strategic-transaction,
integration and realignment expenses (as described below), (6) auditor and third-party professional fees and expenses related to our internal-control deficiencies (and the remediation thereof) and complications in our audit process relating to our
control environment, (7) excess content expenses (as described below), (8) securities class-action expenses (as described below), (9) losses on significant customer bankruptcies (as described below) and (10) restructuring expenses pursuant
to our September 2014
integration plan. Management does not consider these items to be indicative of our core operating results. 13 2Q 2018 Webcast © 2018
Global Eagle
Adjusted EBITDA Definition (continued) “Excess content expenses” includes the additional purchasing costs that we incurred in 2017 to procure movie content for our customers, notwithstanding that we could have procured equivalent content under our (preferential-pricing) output arrangements with major studios. We incurred these additional costs because we could not timely identify and measure our movie-content expenditures and procurement during the period due to weaknesses in our control environment. “Losses on significant customer bankruptcies” includes (1) our provision for bad debt associated with the bankruptcies of Air Berlin and Alitalia (two of our Media & Content customers) in 2017, together with (2) the costs (e.g., content acquisition fees) that we incurred to maintain service to those customers during their bankruptcy proceedings in order to preserve the customer relationship. “Securities class-action expenses” includes third-party professional fees and expenses associated with the securities class-action lawsuits filed against us in 2017. “Strategic-transaction, integration and realignment expenses” includes (1) transaction-related expenses and costs (including third-party professional fees) attributable to acquisition, financing, investment and other strategic-transaction activities, (2) integration and realignment expenses and allowances, (3) employee-severance, -retention and -relocation expenses, (4) purchase-accounting adjustments for deferred revenue, costs and credits associated with companies and businesses that we have acquired through our M&A activities, (5) service-level-agreement penalties incurred during our Eagle-1 migration and setup in its new orbital slot in 2017, and (6) claims at companies or businesses that we acquired through our M&A activities for underlying liabilities that predated our acquisition of those companies or businesses. In respect of clause (6) in this definition, we include (i.e., exclude from net income (loss)) any estimated loss contingencies and provisions for legal settlements relating to those liabilities. 14 2Q 2018 Webcast © 2018 Global Eagle