Attached files
| file | filename |
|---|---|
| 8-K - 8-K - BLUEGREEN VACATIONS CORP | bxg-20180808x8k.htm |
BLUEGREEN VACATIONS AUGUST 2018 INVESTOR PRESENTATION The Fountains Orlando, Florida bluegreenvacations
1 Forward-Looking Statements This presentation contains forward-looking statements based largely on current expectations of Bluegreen Vacations (“Bluegreen” or “The Company”), that involve a number of risks and uncertainties . All opinions, forecasts, projections, future plans or other statements, other than statements of historical fact, are forward-looking statements and can be identified by the use of words or phrases such as "plans," "believes," "will," "expects," "anticipates," "intends," "estimates," "our view," "we see," "would" and words and phrases of similar meaning . The forward-looking statements in presentation are also forward-looking statements within the meaning of Section 27 A of the Securities Act of 1933 , as amended, and Section 21 E of the Securities Exchange Act of 1934 , as amended, and involve substantial risks and uncertainties that are subject to change based on factors which are, in many instances, beyond our control . We can give no assurance that such expectations will prove to have been correct . Actual results, performance, or achievements could differ materially from those contemplated, expressed, or implied by the forward-looking statements contained herein . This presentation also contains information regarding the past performance of the Bluegreen Vacations, and you should note that prior or current performance is not a guarantee or indication of future performance . Some factors which may affect the accuracy of the forward-looking statements apply generally to the resort development and vacation ownership industries in which Bluegreen operates . Risks and uncertainties include, without limitation, risks associated with the ability to successfully implement currently anticipated plans and generate earnings, long term growth, and increased shareholder value ; risks inherent in the vacation ownership industry, including the risk that Bluegreen's marketing expenses will increase ; and the risk that Bluegreen’s capital-light business activities or other operations may not be successful because of changes in economic conditions or otherwise ; the risk that Bluegreen may not achieve EBITDA growth or increased margins ; the risk that revenue streams will not be recurring, long-term, or sustainable ; risks relating to the economic conditions generally or in the vacations ownership, rental, and travel industries ; risks related to adverse changes in its management contacts, marketing agreements and other strategic alliances and relationships ; risks of decreased demand from purchasers or the ability to maintain an optimal inventory of VOI’s for sale ; risks associate with changes in senior management ; the risk that dividends on our common stock will not be declared at current levels or at all ; the risk that acquisitions will not be successful ; risk related to the timing and success of sales office expansions ; and the risk that the Bluegreen's strategy and initiatives to grow profitability and increase long-term value may not be realized as anticipated, if at all . Additional risks and uncertainties are described in Bluegreen’s filings with the Securities and Exchange Commission available to view on the SEC's website, www . sec . gov , and on Bluegreen Vacation's website, ir . bluegreenvacations . com/ . You should not place undue reliance on any forward-looking statement, which speaks only as of the date made . Bluegreen Vacations cautions that the foregoing factors are not exclusive, and we do not undertake, and specifically disclaim any obligation, to update or supplement any forward-looking statements whether as a result of changes in circumstances, new information, subsequent events or otherwise .
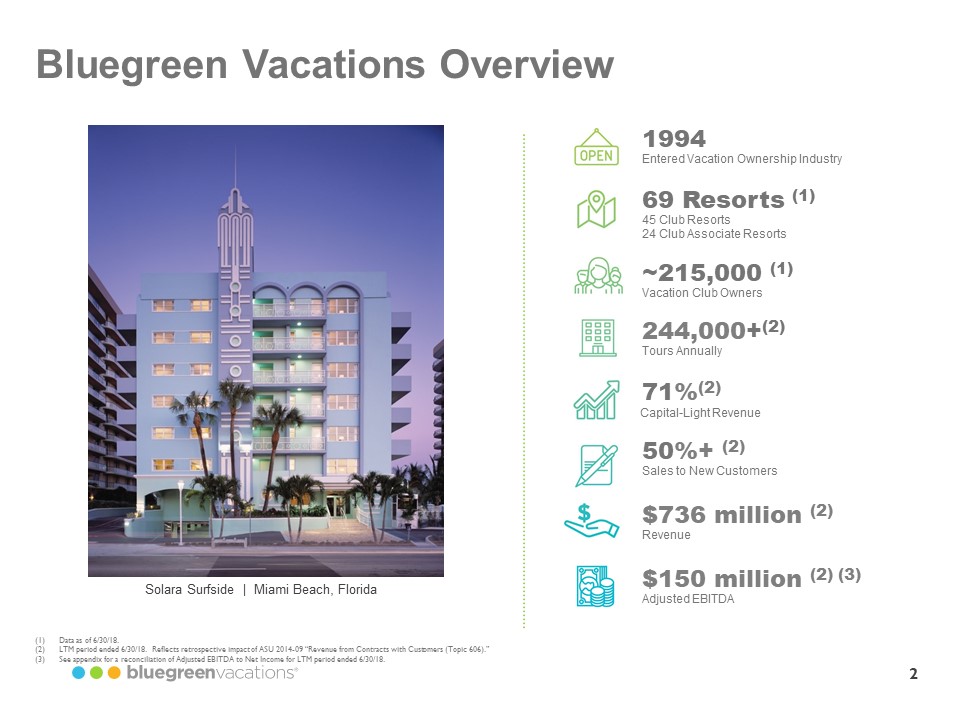
2 Bluegreen Vacations Overview 1994 Entered Vacation Ownership Industry 69 Resorts (1) 45 Club Resorts 24 Club Associate Resorts ~215,000 (1) Vacation Club Owners 244,000 + (2) Tours Annually 71 % (2) Capital-Light Revenue 50 %+ (2) Sales to New Customers $736 million (2) Revenue $150 million (2) (3) Adjusted EBITDA Solara Surfside | Miami Beach, Florida (1) Data as of 6/30/18. (2) LTM period ended 6/30/18. Reflects retrospective impact of ASU 2014-09 “Revenue from Contracts with Customers (Topic 606).” (3) See appendix for a reconciliation of Adjusted EBITDA to Net Income for LTM period ended 6/30/18. bluegreenvacations
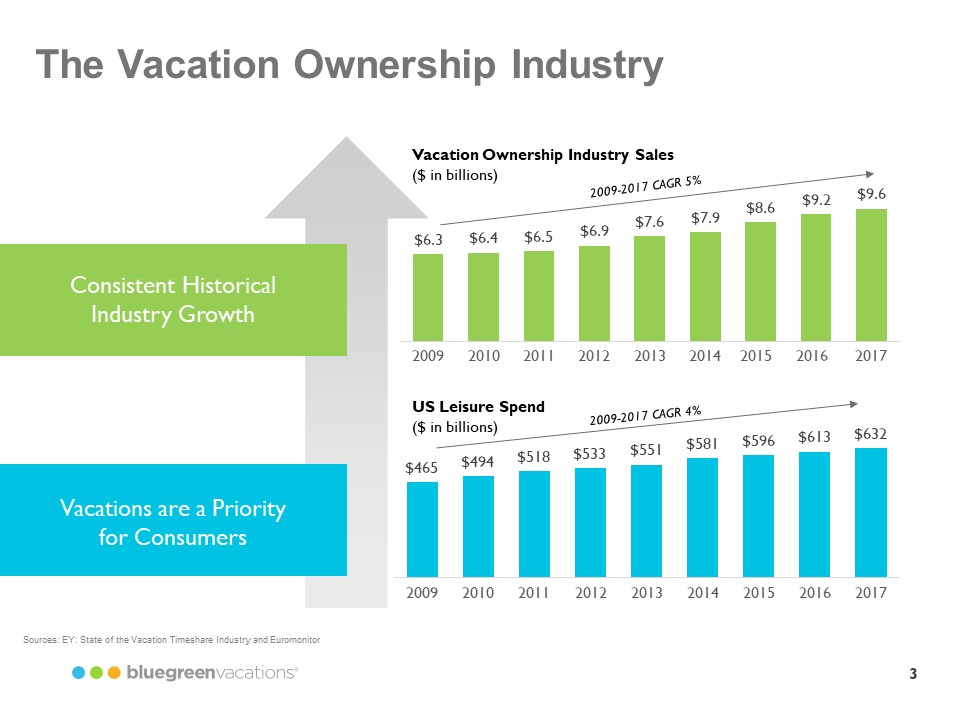
3 The Vacation Ownership Industry Consistent Historical Industry Growth Vacation Ownership Industry Sales ($ in billions) 2009-2017 CAGR 5% $6.3 $6.4 $6.5 $6.9 $7.6 $7.9 $8.6 $9.2 $9.6 2009 2010 2011 2012 2013 2014 2015 2016 2017 Vacations are a Priority for Consumers US Leisure Spend ($ in billions) 2009-2017 CAGR 4% $465 $494 $518 $533 $551 $581 $596 $613 $632 2009 2010 2011 2012 2013 2014 2015 2016 2017 Sources: EY: State of the Vacation Timeshare Industry and Euromonitor bluegreenvacations
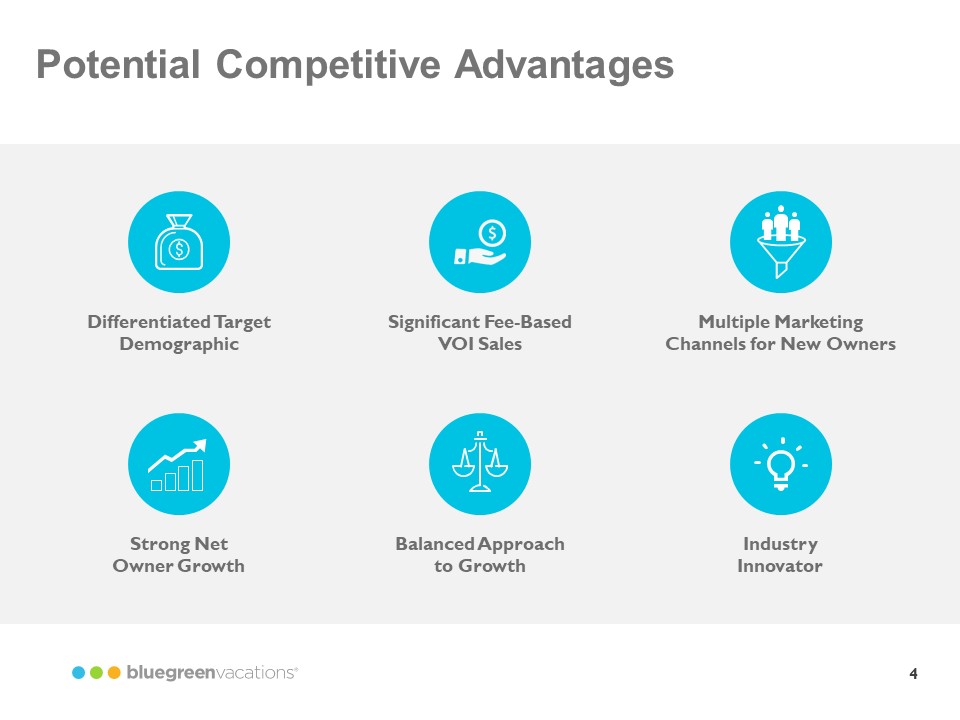
4 Potential Competitive Advantages Significant Fee-Based VOI Sales Strong Net Owner Growth Balanced Approach to Growth Differentiated Target Demographic Multiple Marketing Channels for New Owners Industry Innovator bluegreenvacations
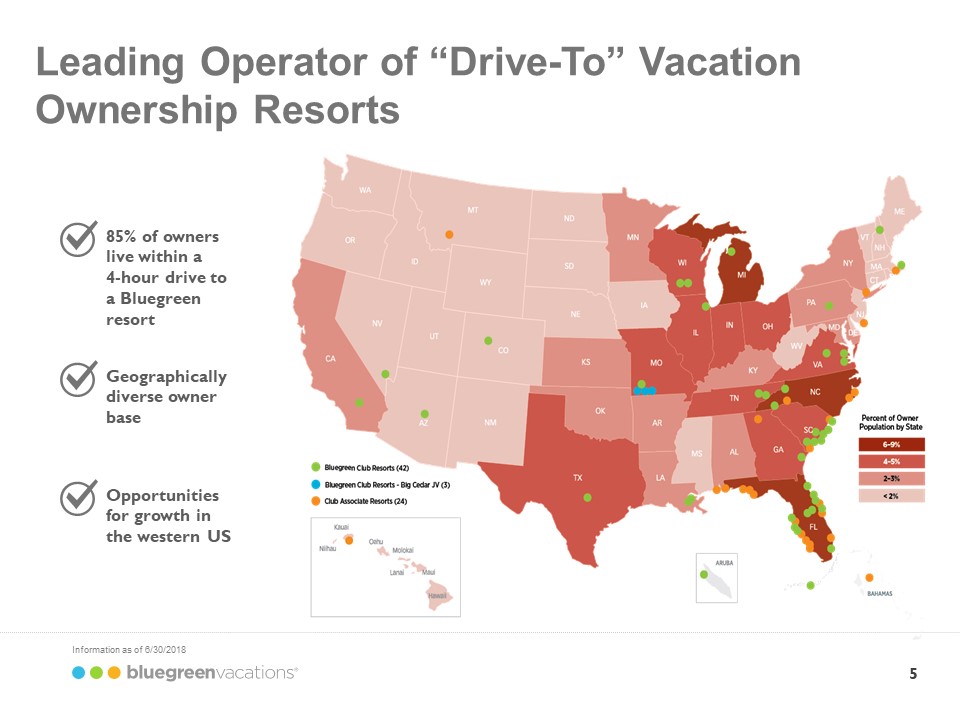
5 Leading Operator of “Drive-To” Vacation Ownership Resorts 85% of owners live within a 4- hour drive to a Bluegreen resort Geographically diverse owner base Opportunities for growth in the western US Bluegreen Club Resorts (42) Bluegreen Club Resorts – Big Cedar JV (3) Club Associate Resorts (24) Percent of Owner Population by State 6-9% 4-6% 2-3% < 2 % Information as of 6/30/2018 bluegreenvacations
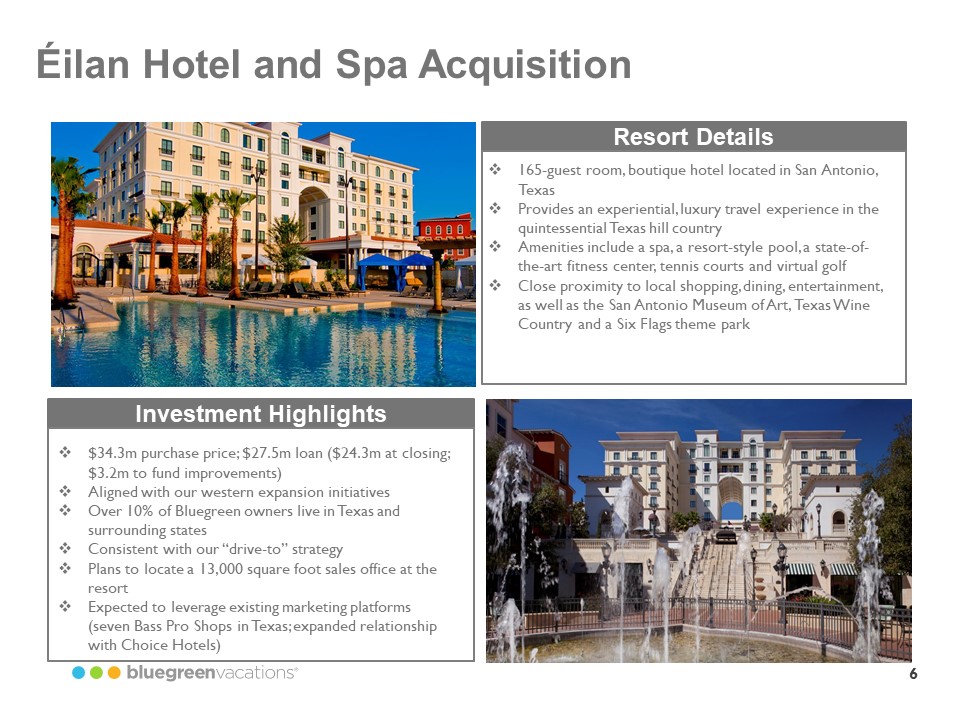
6 Éilan Hotel and Spa Acquisition Resort Details . 165-guest room, boutique hotel located in San Antonio, Texas . Provides an experiential, luxury travel experience in the quintessential Texas hill country . Amenities include a spa, a resort-style pool, a state-of-the-art fitness center, tennis courts and virtual golf . Close proximity to local shopping, dining, entertainment, as well as the San Antonio Museum of Art, Texas Wine Country and a Six Flags theme park . Investment Highlights $34.3m purchase price; $27.5m loan ($24.3m at closing; $3.2m to fund improvements) . Aligned with our western expansion initiatives . Over 10% of Bluegreen owners live in Texas and surrounding states . Consistent with our “drive-to” strategy . Plans to locate a 13,000 square foot sales office at the resort . Expected to leverage existing marketing platforms (seven Bass Pro Shops in Texas; expanded relationship with Choice Hotels) bluegreenvacations
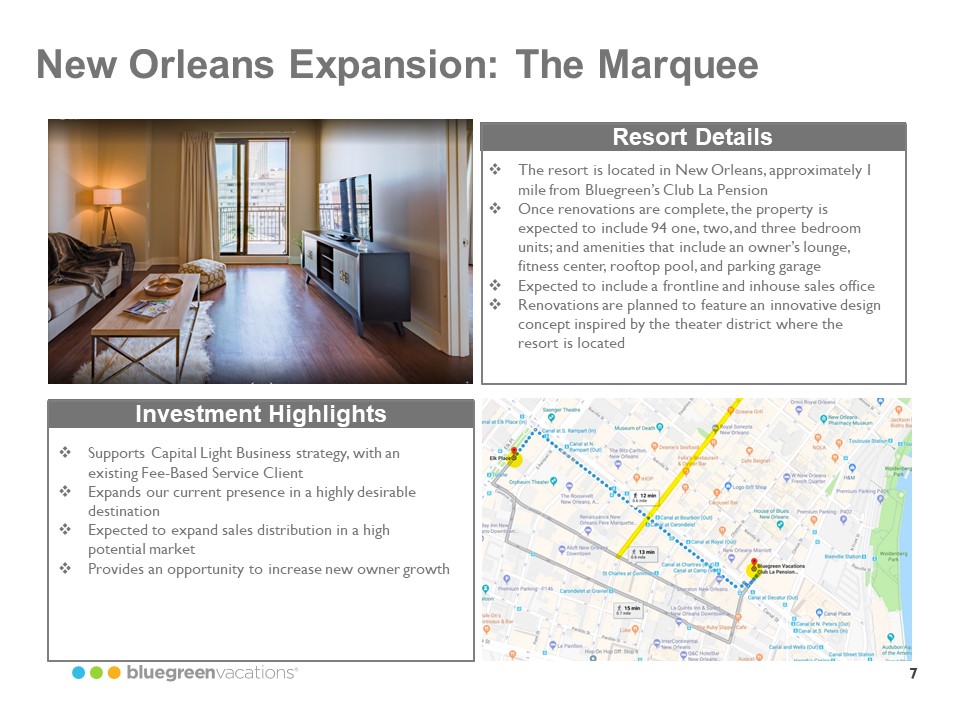
7 New Orleans Expansion: The Marquee . Resort Details The resort is located in New Orleans, approximately 1 mile from Bluegreen’s Club La Pension . Once renovations are complete, the property is expected to include 94 one, two, and three bedroom units; and amenities that include an owner’s lounge, fitness center, rooftop pool, and parking garage . Expected to include a frontline and inhouse sales office . Renovations are planned to feature an innovative design concept inspired by the theater district where the resort is located . Investment Highlights Supports Capital Light Business strategy, with an existing Fee-Based Service Client . Expands our current presence in a highly desirable destination . Expected to expand sales distribution in a high potential market . Provides an opportunity to increase new owner growth bluegreenvacations
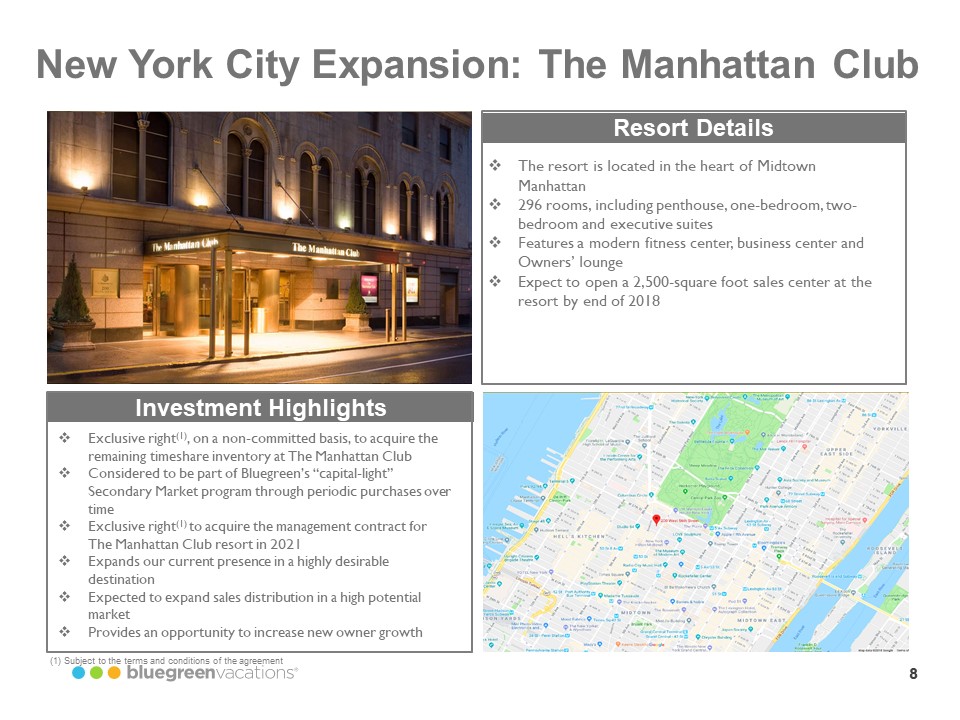
8 New York City Expansion: The Manhattan Club . Resort Details The resort is located in the heart of Midtown Manhattan . 296 rooms, including penthouse, one-bedroom, two-bedroom and executive suites . Features a modern fitness center, business center and Owners’ lounge . Expect to open a 2,500-square foot sales center at the resort by end of 2018 . Exclusive right (1) , on a non-committed basis, to acquire the remaining timeshare inventory at The Manhattan Club . Considered to be part of Bluegreen’s “capital-light” Secondary Market program through periodic purchases over time . Investment Highlights Exclusive right (1) to acquire the management contract for The Manhattan Club resort in 2021 . Expands our current presence in a highly desirable destination . Expected to expand sales distribution in a high potential market . Provides an opportunity to increase new owner growth (1) Subject to the terms and conditions of the agreement bluegreenvacations
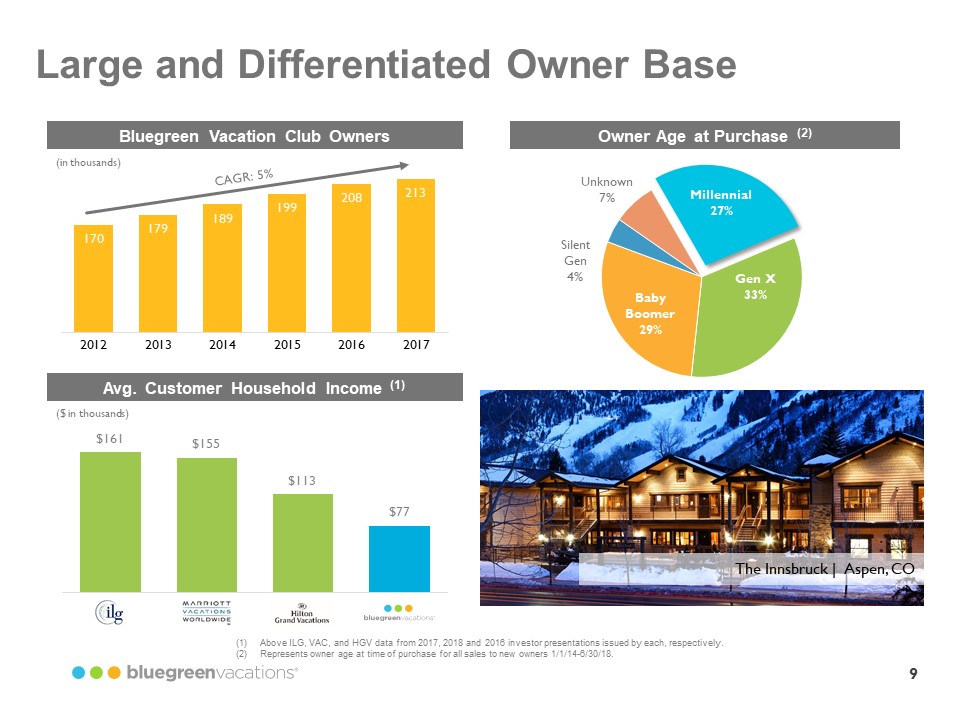
9 Large and Differentiated Owner Base Bluegreen Vacation Club Owners (in thousands) CAGR: 5% 2012 170 2013 179 2014 189 2015 199 2016 208 2017 213 Owner Age at Purchase (2) Millennial 27% Gen X 33% Baby Boomer 29% Silent Gen 4% Unknown 7% Avg. Customer Household Income (1) ($ in thousands) ilg $161 Marriott Vacations Worldwide $155 Hilton Grand Vacations $113 bluegreenvacations $77 (1) Above ILG, VAC, and HGV data from 2017, 2018 and 2016 investor presentations issued by each, respectively. (2) Represents owner age at time of purchase for all sales to new owners 1/1/14 - 6/30/18. bluegreenvacations The Innsbruck Aspen, CO
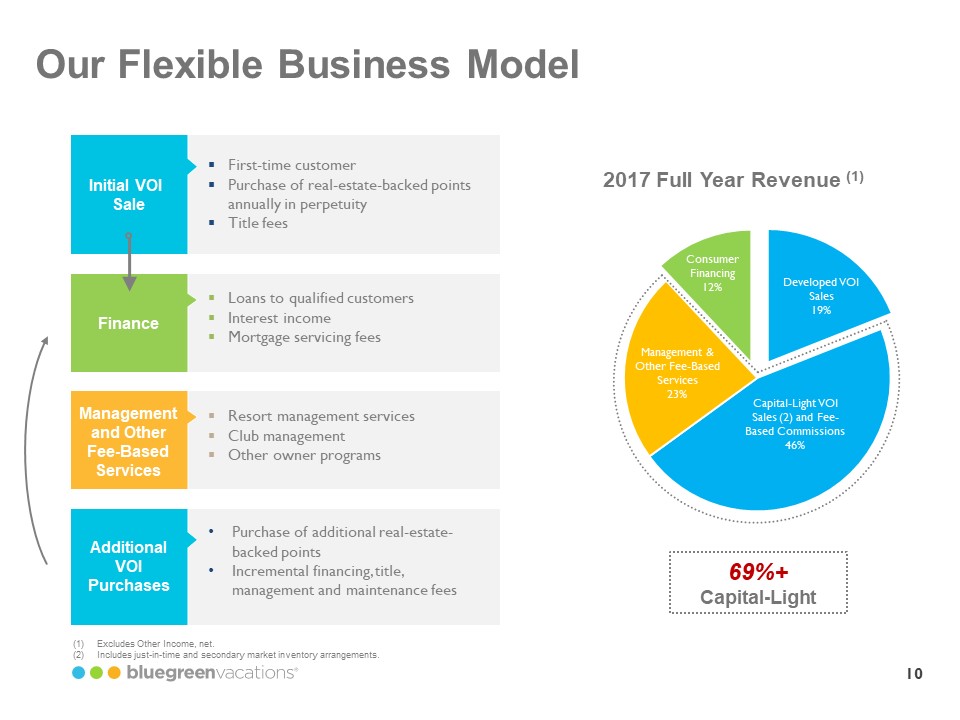
10 Our Flexible Business Model Initial VOI Sale First-time customer Purchase of real-estate backed points annually in perpetuity Title fees Finance Loans to qualified customers Interest income Mortgage servicing fees Management and Other Fee-Based Services Resort management services Club management Other owner programs Additional VOI purchases Purchase of additional real-estate backed points Incremental financing, title, management and maintenance fees 2017 Full Year Revenue (1) Consumer Financing 12% Developed VOI Sales 19% Capital-Light VOI Sales (2) and Fee-Based Commissions 46% Management and Other Fee-Based Services 23% 69%+ Capital-Light (1) Excludes Other Income, net (2) Includes just-in-time and secondary market inventory arrangements bluegreenvacations
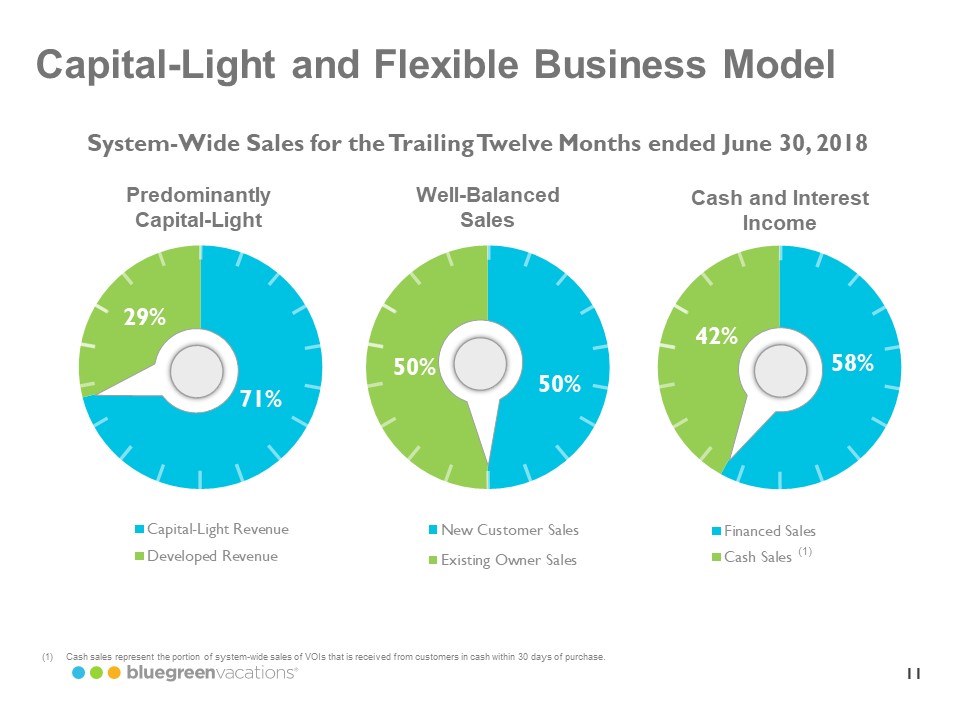
11 Capital-Light and Flexible Business Model System-Wide Sales for the Trailing Twelve Months ended June 30, 2018 Predominantly Capital-Light 71% 29% Capital-Light Revenue Developed Revenue Well-Balanced Sales 50% 50% New Customer Sales Existing Owner Sales Cash and Interest Income 58% 42% Financed Sales Cash Sales (1) (1) Cash sales represent the portion of system-wide sales of VOIs that is received from customers in cash within 30 days of purchase. bluegreenvacations
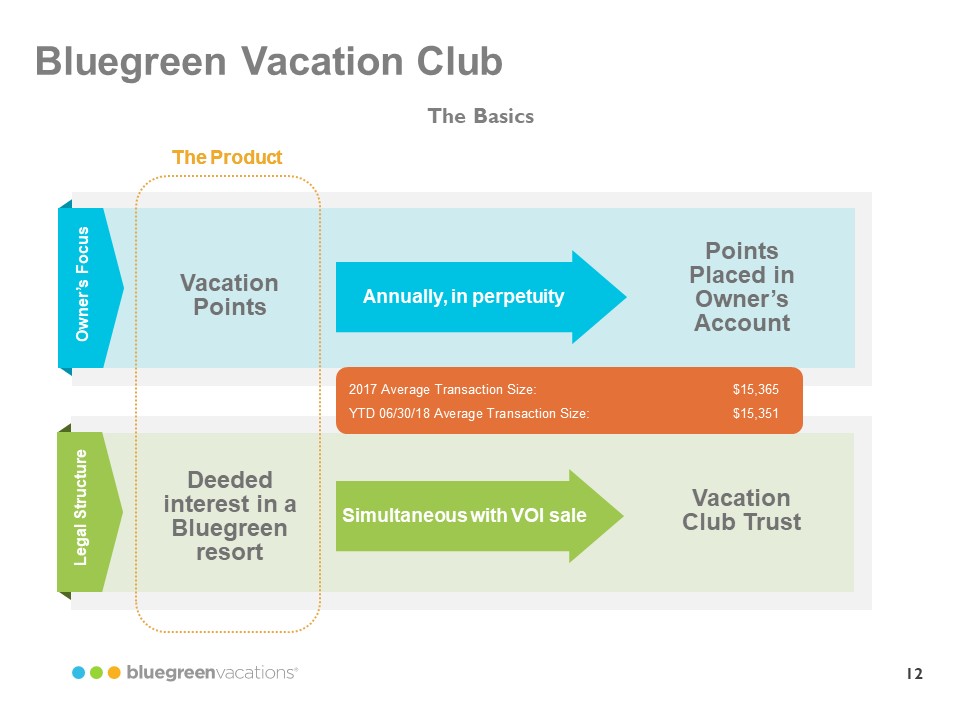
12 Bluegreen Vacation Club The Basics Owner’s Focus The Product Vacation Points Annually, in perpetuity Points Placed in Owner’s Account 2017 Average Transaction Size: $15,365 YTD 06/30/18 Average Transaction Size: $15,351 Legal Structure The Product Deeded interest in a Bluegreen resort Simultaneous with VOI sale Vacation Club Trust bluegreenvacations
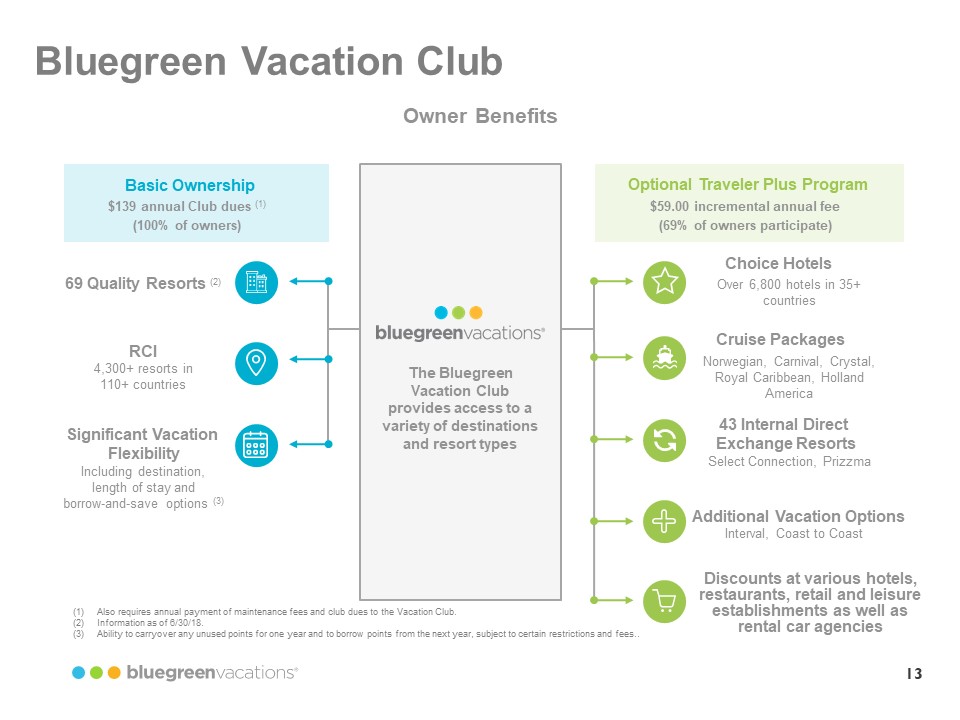
13 Bluegreen Vacation Club Owner Benefits Basic Ownership $139 annual Club dues (1) (100% of owners) 69 Quality Resorts (2) RCI 4,300+ resorts in 110+ countries Significant Vacation Flexibility Including destination, length of stay and borrow-and-save options (3) The Bluegreen Vacation Club provides access to a variety of destinations and resort types Optional Traveler Plus Program $59.00 incremental annual fee (69% of owners participate) Choice Hotels Over 6,800 hotels in 35+ countries Cruise Packages Norwegian, Carnival, Crystal, Royal Caribbean, Holland America 43 Internal Direct Exchange Resorts Select Connection, Prizzma Additional Vacation Options Interval, Coast to Coast Discounts at various hotels, restaurants, retail and leisure establishments as well as rental car agencies (1) Also requires annual payment of maintenance fees and club dues to the Vacation Club. (2) Information as of 6/30/18. (3) Ability to carryover any unused points for one year and to borrow points from the next year, subject to certain restrictions and fees. bluegreenvacations
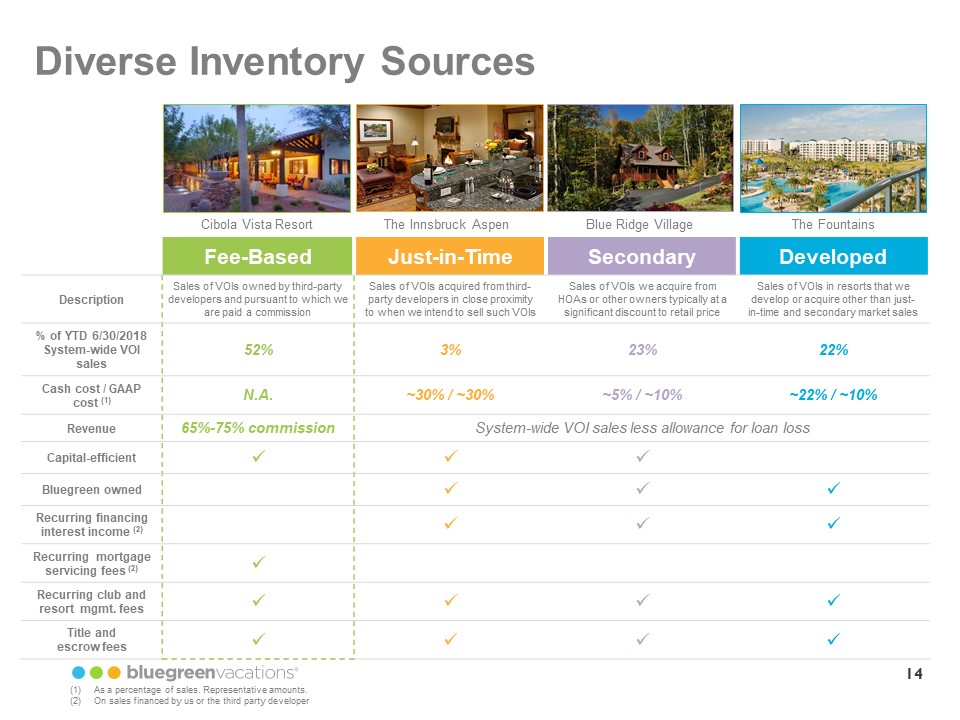
14 Diverse Inventory Sources Cibola Vista Resort The Innsbruck Aspen Blue Ridge Village The Fountains Fee-Based Just-in-Time Secondary Developed Description Sales of VOIs owned by third-party developers and pursuant to which we are paid a commission Sales of VOIs acquired from third-party developers in close proximity to when we intend to sell such VOIs Sales of VOIs we acquire from HOAs or other owners typically at a significant discount to retail price Sales of VOIs in resorts that we develop or acquire other than just-in-time and secondary market sales % of YTD 6/30/2018 System-wide VOI sales 52% 3% 23% 22% Cash cost / GAAP cost (1) N.A. ~30% / ~30% ~5% / ~10% ~22% / ~10% Revenue 65%-75% commission System-wide VOI sales less allowance for loan loss Capital-efficient Bluegreen owned Recurring financing interest income (2) Recurring mortgage servicing fees (2) . Recurring club and resort mgmt. fees Title and escrow fees (1) As a percentage of sales. Representative amounts. (2) On sales financed by us or the third party developer bluegreenvacations
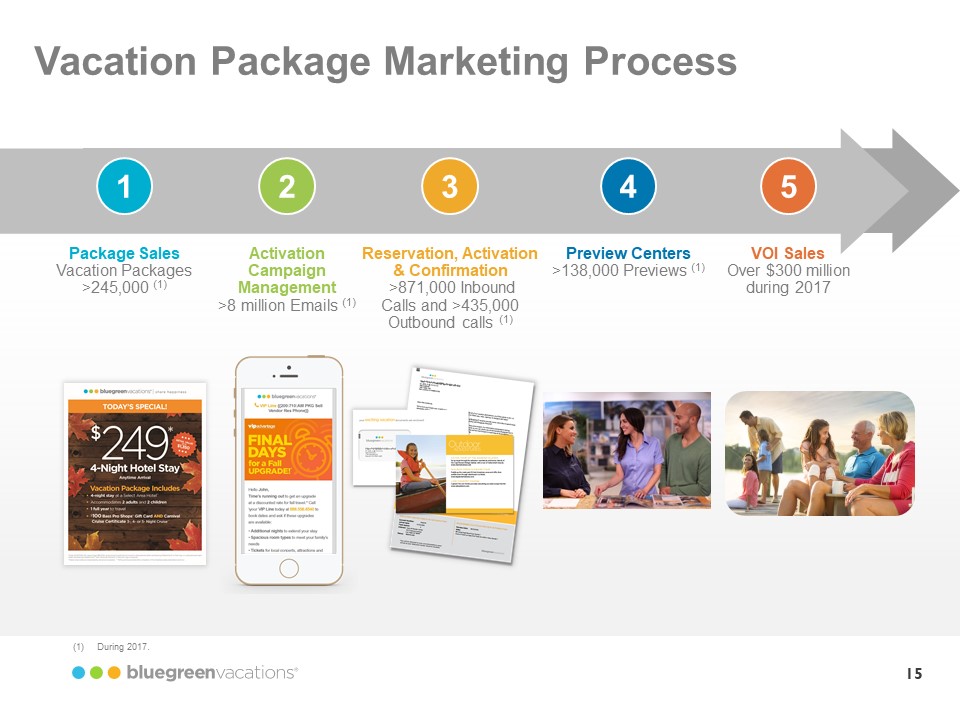
15 Vacation Package Marketing Process 1 Package Sales Vacation Packages >245,000 (1) 2 Activation Campaign Management >8 million Emails (1) 3 Reservation, Activation & Confirmation > 871,000 Inbound Calls and >435,000 Outbound calls (1) 4 Preview Centers >138,000 Previews (1) 5 VOI Sales Over $300 million during 2017 (1) During 2017. bluegreenvacations
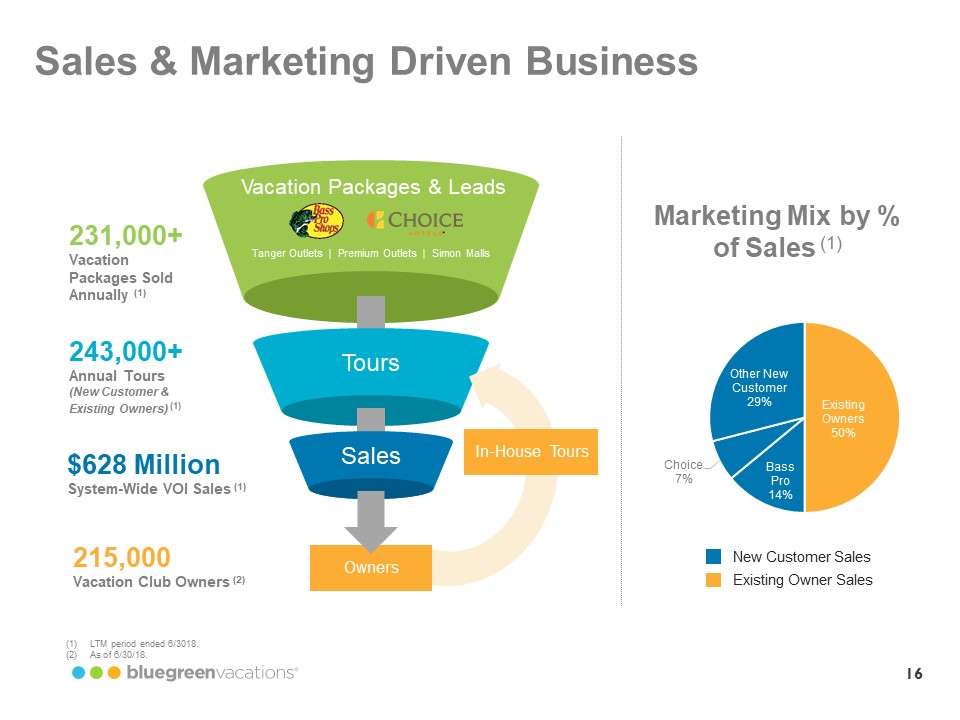
16 Sales & Marketing Driven Business Vacation Packages & Leads Tanger Outlets | Premium Outlets | Simon Malls 231,000+ Vacation Packages Sold Annually (1)Tours 243,000+ Annual Tours (New Customer & Existing Owners) (1) Sales $628 Million System-Wide VOI Sales (1) In-House Tours Owners 215,000 Vacation Club Owners (2) Marketing Mix by % of Sales (1) Other New Customer 29 % Existing Owners 50% Bass Pro 14% Choice 7% New Customer Sales Existing Owner Sales (1) LTM period ended 6/3018. (2) As of 6/30/18. bluegreenvacations
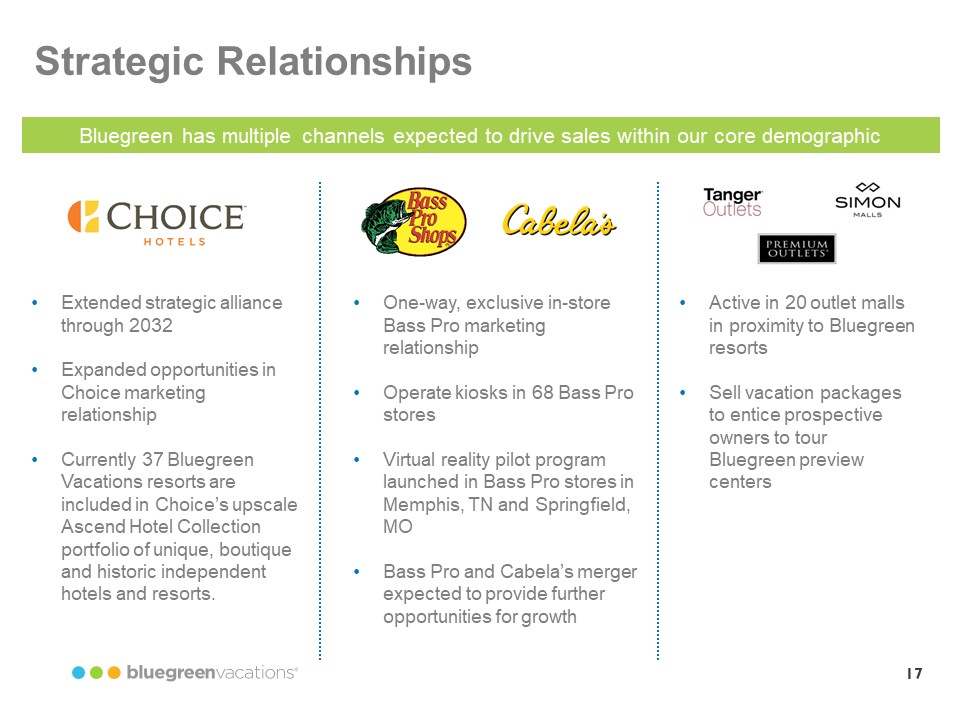
17 Strategic Relationships Bluegreen has multiple channels expected to drive sales within our core demographic • Choice Hotels Extended strategic alliance through 2032 • Expanded opportunities in Choice marketing relationship • Currently 37 Bluegreen Vacations resorts are included in Choice’s upscale Ascend Hotel Collection portfolio of unique, boutique and historic independent hotels and resorts. Bass Pro Shops Cabela’s One-way, exclusive in-store Bass Pro marketing relationship • Operate kiosks in 68 Bass Pro stores • Virtual reality pilot program launched in Bass Pro stores in Memphis, TN and Springfield, MO • Bass Pro and Cabela’s merger expected to provide further opportunities for growth Tanger Outlets Premium Outlets Simon Malls Active in 20 outlet malls in proximity to Bluegreen resorts • Sell vacation packages to entice prospective owners to tour Bluegreen preview centers bluegreenvacations
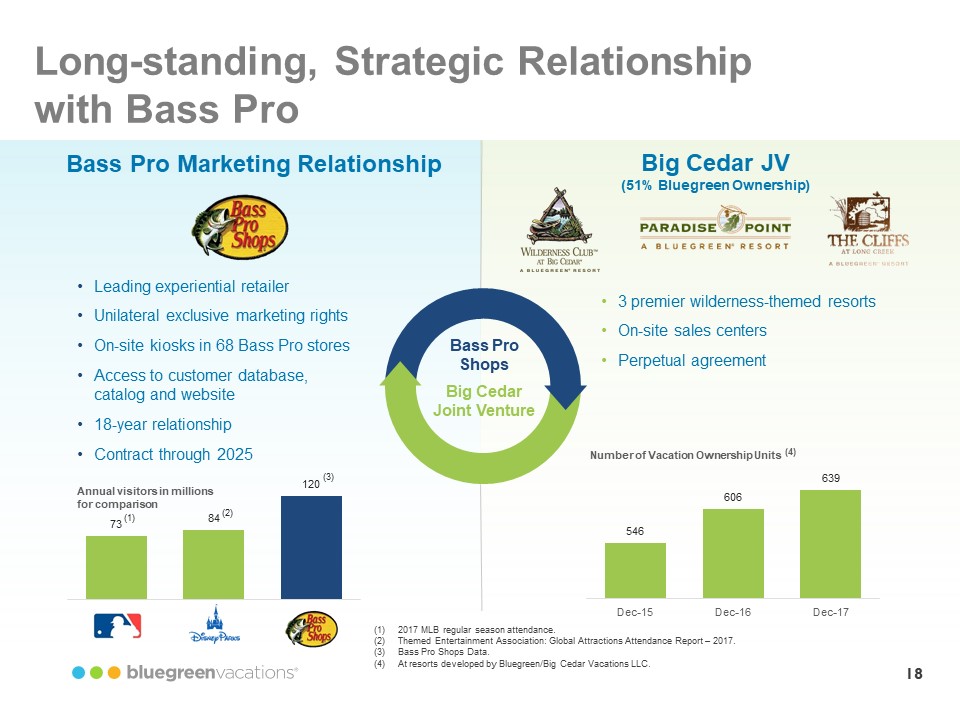
18 Long-standing, Strategic Relationship with Bass Pro Bass Pro Marketing Relationship • Leading experiential retailer • Unilateral exclusive marketing rights • On-site kiosks in 68 Bass Pro stores • Access to customer database, catalog and website • 18-year relationship • Contract through 2025 Annual visitors in millions for comparison 73 (1) 84 (2) 120 (3) Bass Pro Shops Big Cedar Joint Venture Big Cedar JV (51% Bluegreen Ownership) 3 premier wilderness-themed resorts • On-site sales centers • Perpetual agreement Number of Vacation Ownership Units (4) 546 Dec-15 606 Dec-16 639 Dec-17 (1) 2017 MLB regular season attendance. (2) Themed Entertainment Association: Global Attractions Attendance Report – 2017. (3) Bass Pro Shops Data. (4) At resorts developed by Bluegreen/Big Cedar Vacations LLC. bluegreenvacations
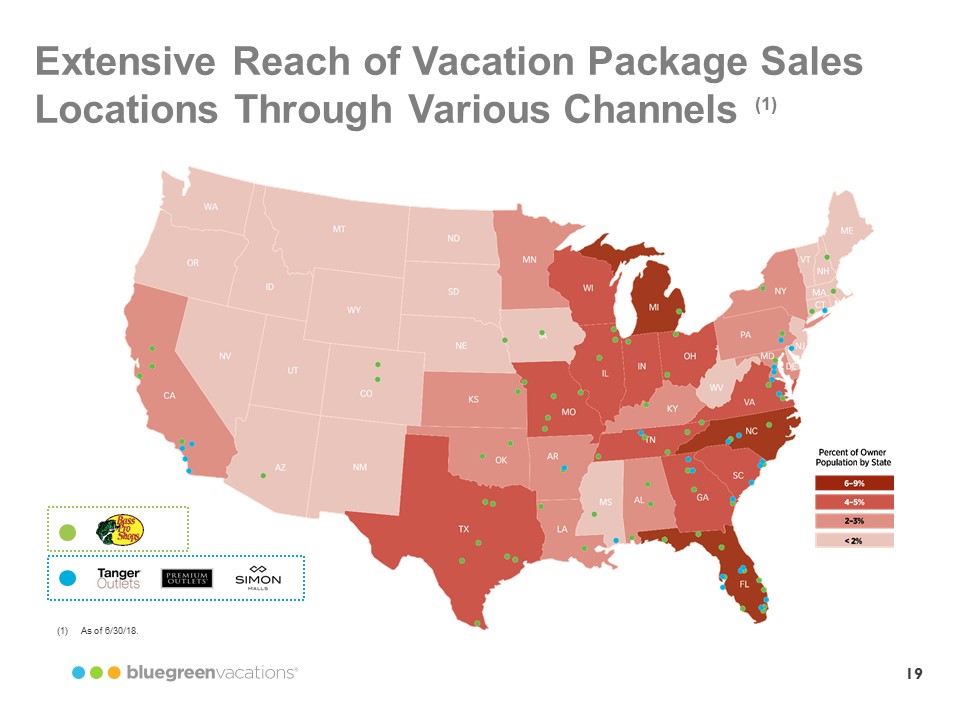
19 Extensive Reach of Vacation Package Sales Locations Through Various Channels (1) Bass Pro Shops Tanger Outlets Premium Outlets Simon Malls (1) As of 6/30/18. Percent of Owner Population by State 6-9% 4-9% bluegreenvacations
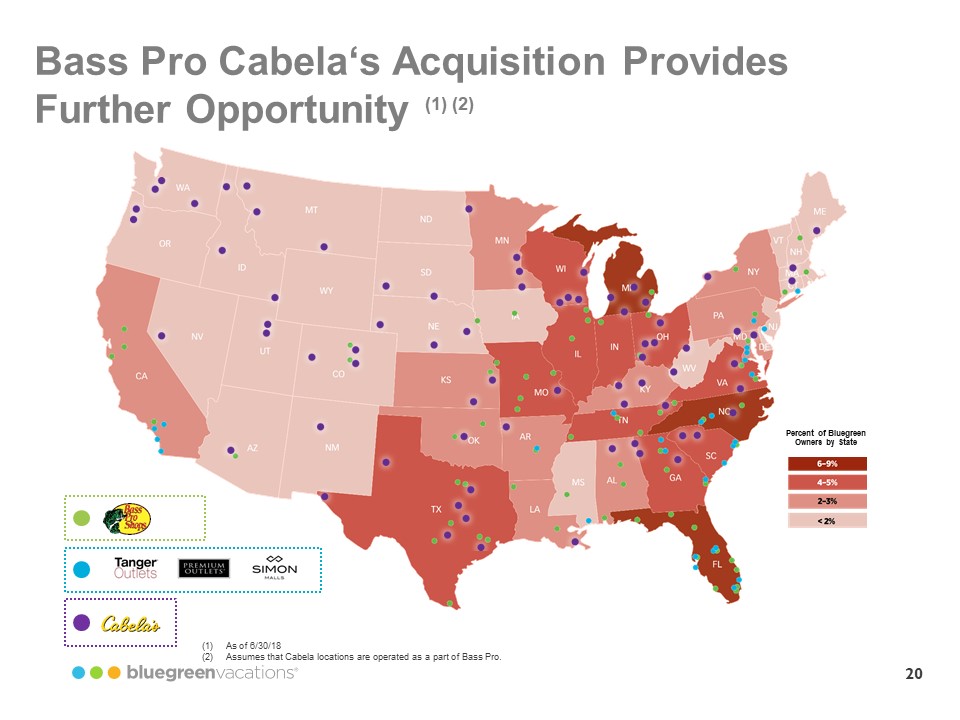
20 Bass Pro Cabela‘s Acquisition Provides Further Opportunity (1) (2) Percent of Bluegreen Owners by State Percent of Owner Population by State 6-9% 4-6% 2-3% < 2 % Bass Pro Shops Tanger Outlets Premium Outlets Simon Malls Cabela’s (1) As of 6/30/18 (2) Assumes that Cabela locations are operated as a part of Bass Pro. bluegreenvacations
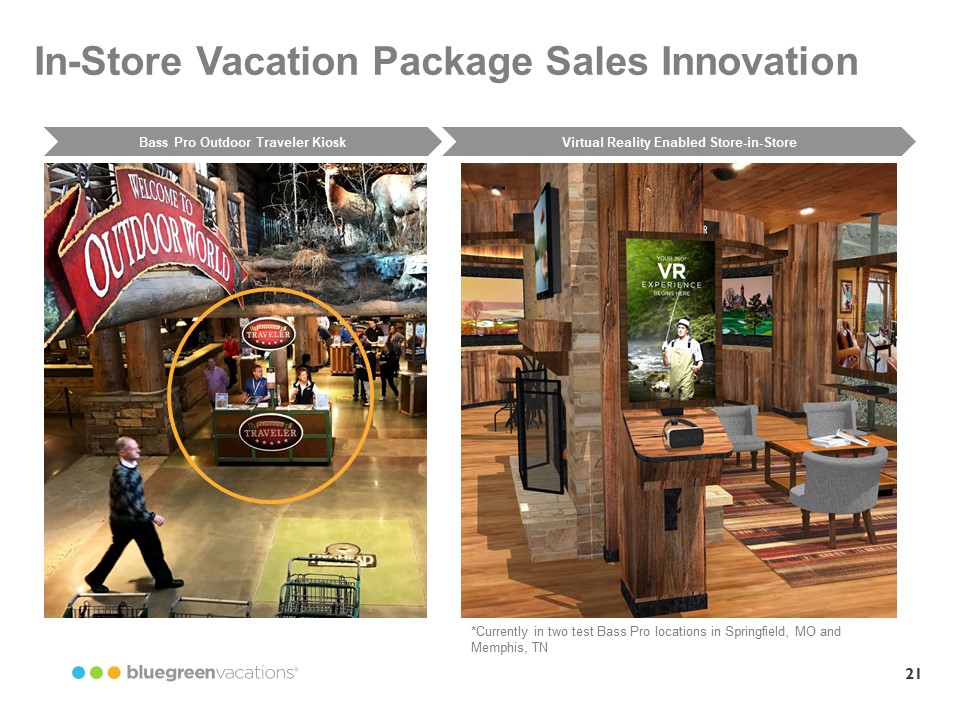
21 In-Store Vacation Package Sales Innovation Bass Pro Outdoor Traveler Kiosk Virtual Reality Enabled Store-in-Store *Currently in two test Bass Pro locations in Springfield, MO and Memphis, TN bluegreenvacations
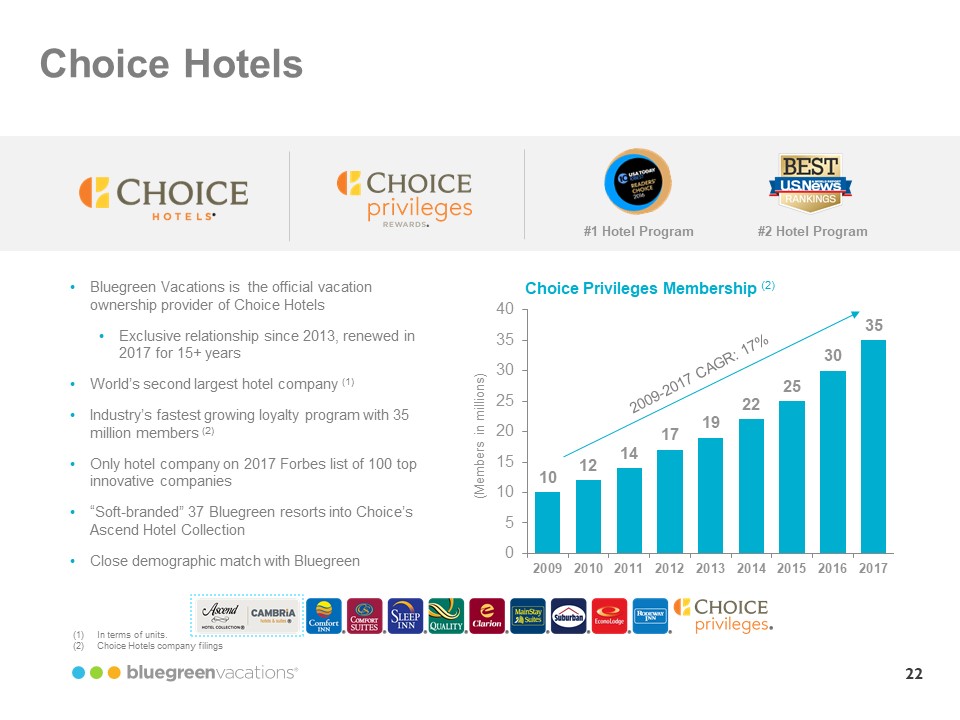
22 Choice Hotels • Choice Hotels Choice privileges rewards #1 Hotel Program #2 Hotel Program Bluegreen Vacations is the official vacation ownership provider of Choice Hotels • Exclusive relationship since 2013, renewed in 2017 for 15+ years • World’s second largest hotel company (1) • Industry’s fastest growing loyalty program with 35 million members (2) • Only hotel company on 2017 Forbes list of 100 top innovative companies • “Soft-branded” 37 Bluegreen resorts into Choice’s Ascend Hotel Collection • Close demographic match with Bluegreen 10 12 14 17 19 22 25 30 35 0 5 10 15 20 25 30 35 40 2009 2010 2011 2012 2013 2014 2015 2016 2017 (Members in millions) 2009-2017 CAGR: 17% Choice Privileges Membership (1) In terms of units. (2) Choice Hotels company filings bluegreenvacations
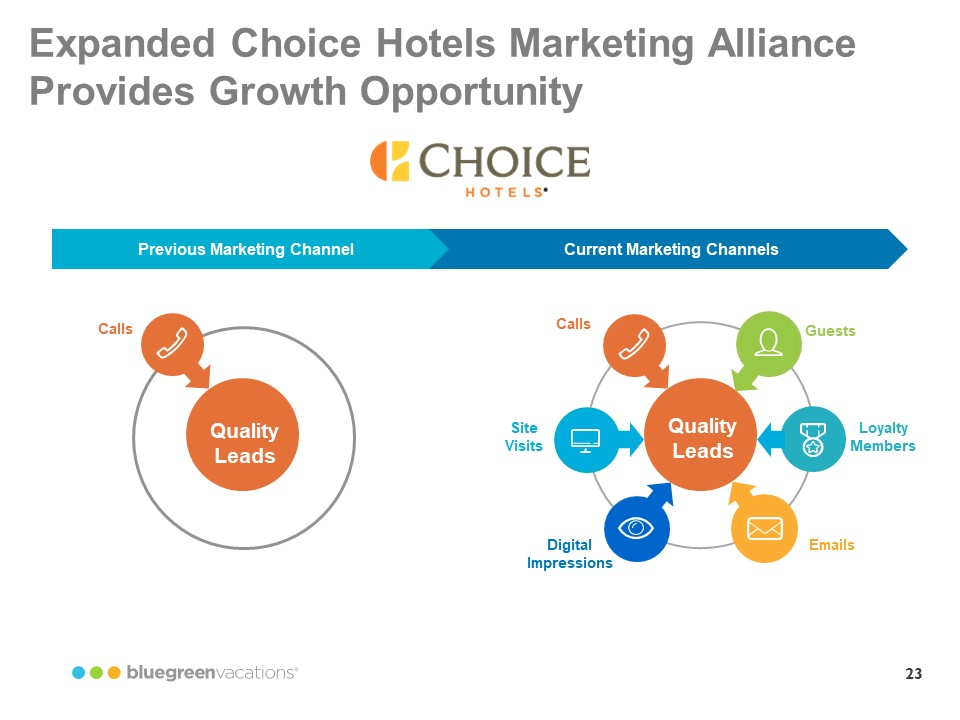
23 Expanded Choice Hotels Marketing Alliance Provides Growth Opportunity Choice Hotels Previous Marketing Channel Calls Quality Leads Current Marketing Channels Quality Leads Calls Site Visits Digital Impressions Guests Loyalty Members Emails bluegreenvacations
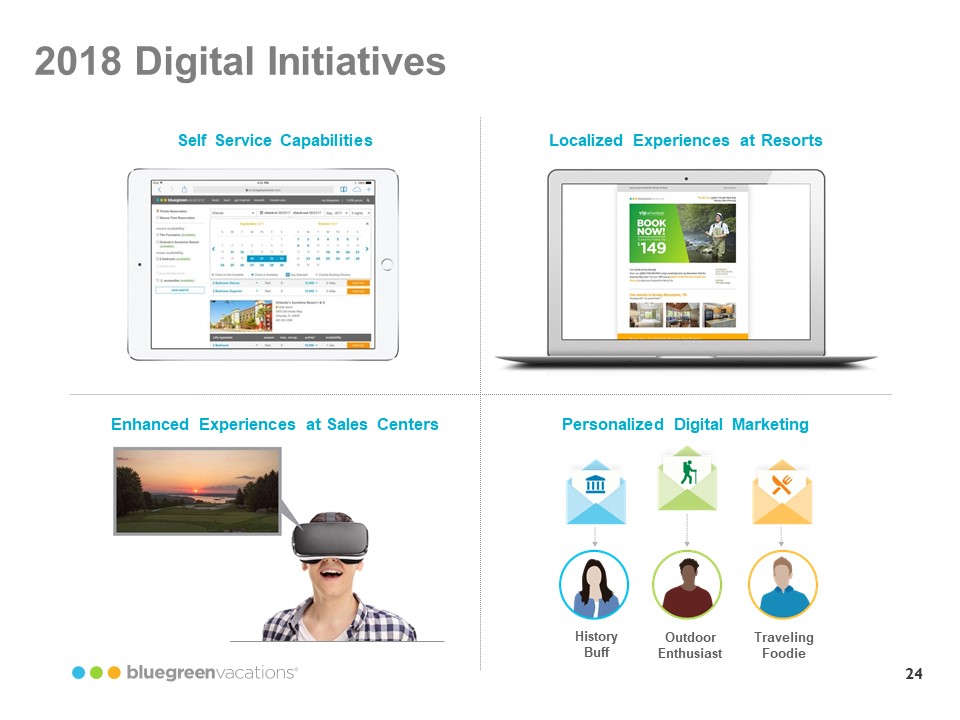
24 2018 Digital Initiatives Self Service Capabilities Localized Experiences at Resorts Enhanced Experiences at Sales Centers Personalized Digital Marketing History Buff Outdoor Enthusiast Traveling Foodie bluegreenvacations
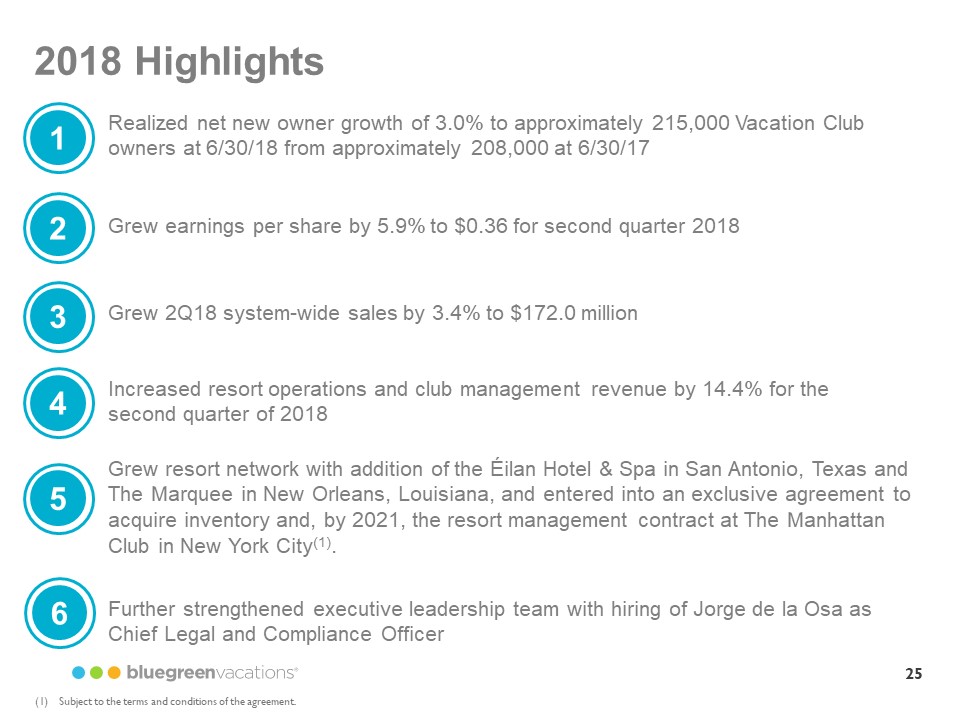
25 2018 Highlights 1 Realized net new owner growth of 3.0% to approximately 215,000 Vacation Club owners at 6/30/18 from approximately 208,000 at 6/30/17 2 Grew earnings per share by 5.9% to $0.36 for second quarter 2018 3 Grew 2Q18 system-wide sales by 3.4% to $172.0 million 4 Increased resort operations and club management revenue by 14.4% for the second quarter of 2018 5 Grew resort network with addition of the Éilan Hotel & Spa in San Antonio, Texas and The Marquee in New Orleans, Louisiana, and entered into an exclusive agreement to acquire inventory and, by 2021, the resort management contract at The Manhattan Club in New York City (1) 6 Further strengthened executive leadership team with hiring of Jorge de la Osa as Chief Legal and Compliance Officer (1) Subject to the terms and conditions of the agreement. bluegreenvacations
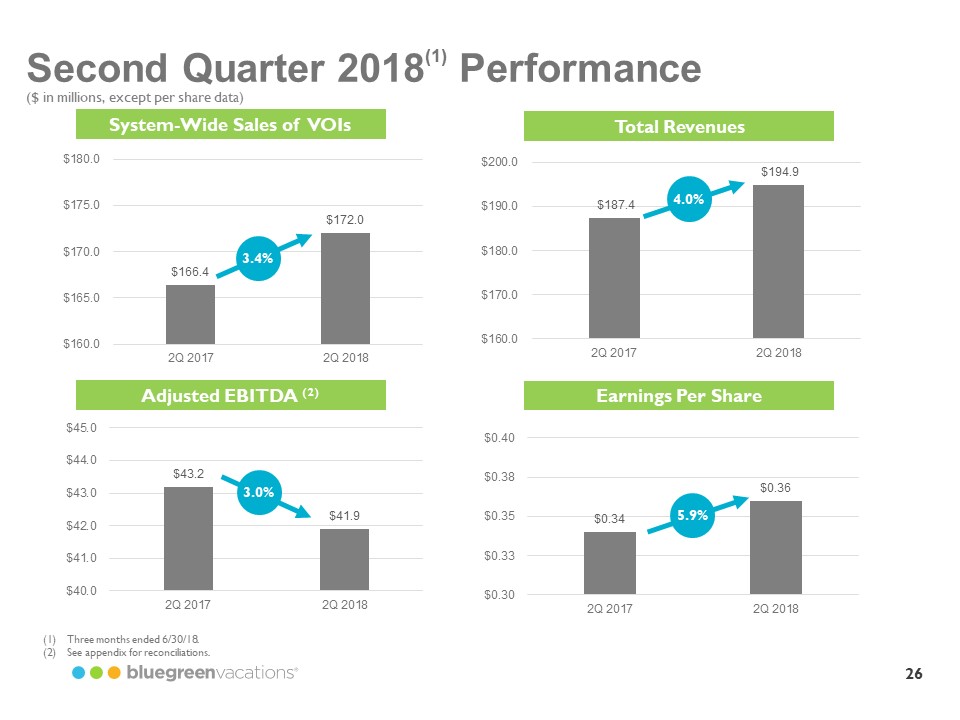
26 Second Quarter 2018 (1) Performance ($ in millions, except per share data) System-Wide Sales of VOIs $166.4 2Q 2017 3.4% $172.0 2Q 2018 $160.0 $165.0 $170.0 $175.0 $180.0 Total Revenues $187.4 $194.9 $160.0 $170.0 $180.0 $190.0 $200.0 2Q 2017 2Q 2018 Adjusted EBITDA (2) $43.2 $41.9 $40.0 $41.0 $42.0 $43.0 $44.0 $45.0 2Q 2017 2Q 2018 Earnings Per Share $0.34 $0.36 $0.30 $0.33 $0.35 $0.38 $0.40 2Q 2017 2Q 2018 3.4% 4.0% 3.0% 5.9% (1) Three months ended 6/30/18. (2) See appendix for reconciliations. bluegreenvacations
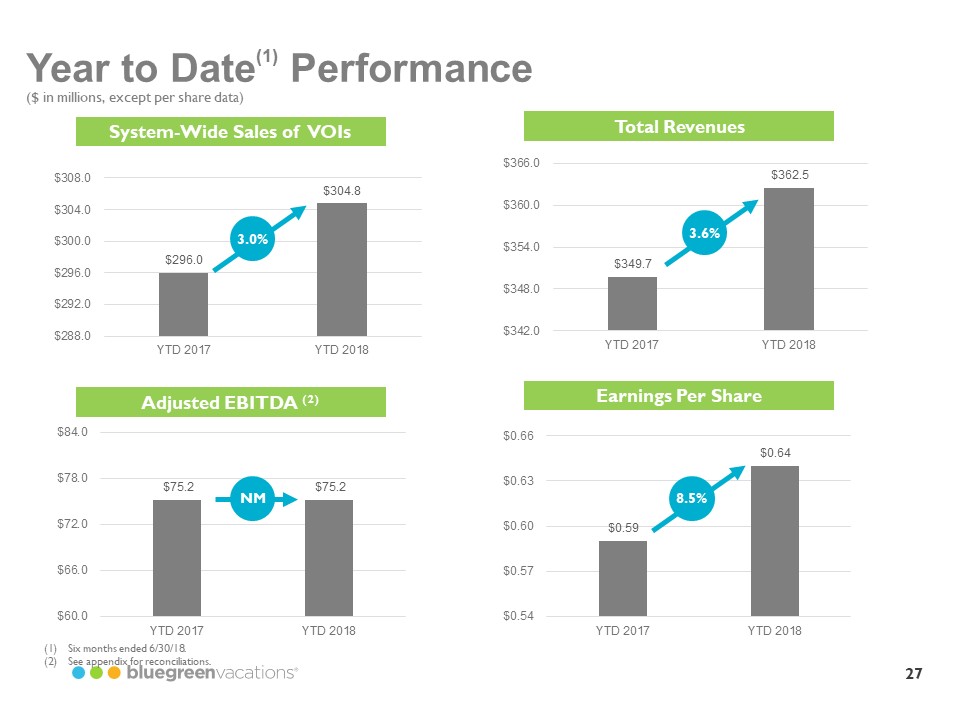
27 Year to Date (1) Performance ($ in millions, except per share data) (Total Revenues System-Wide Sales of VOIs Adjusted EBITDA (2) Earnings Per Share $296.0 $304.8 $288.0 $292.0 $296.0 $300.0 $304.0 $308.0 YTD 2017 YTD 2018 $349.7 $362.5 $342.0 $348.0 $354.0 $360.0 $366.0 YTD 2017 YTD 2018 $75.2 $75.2 $60.0 $66.0 $72.0 $78.0 $84.0 YTD 2017 YTD 2018 $0.59 $0.64 $0.54 $0.57 $0.60 $0.63 $0.66 YTD 2017 YTD 2018 3.0% 3.6% 8.5% NM 1) Six months ended 6/30/18. (2) See appendix for reconciliations. bluegreenvacations
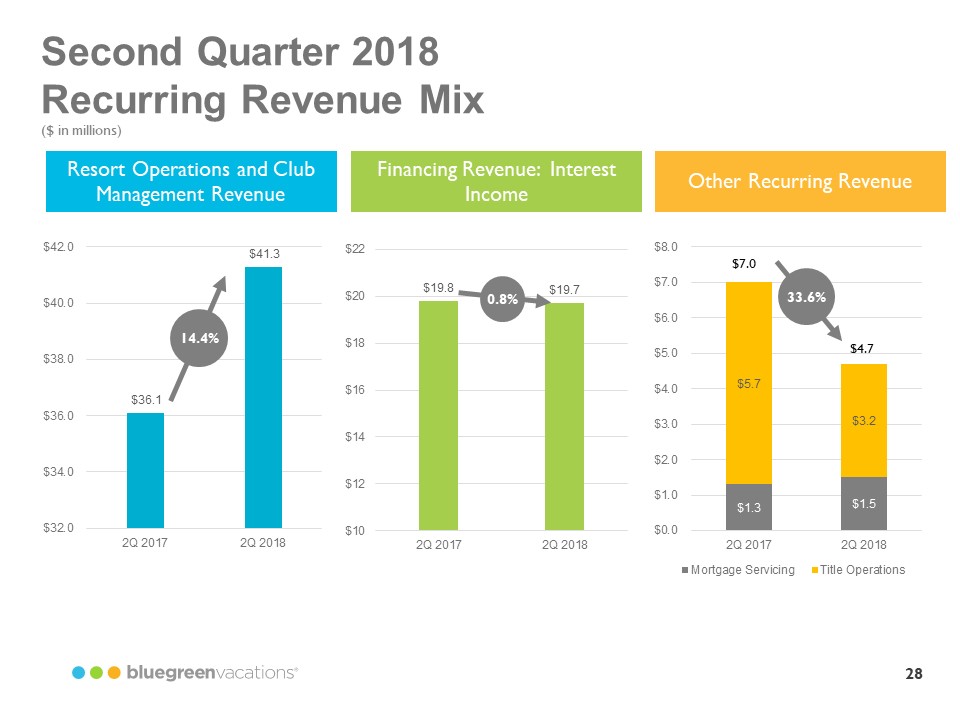
28 Second Quarter 2018 Recurring Revenue Mix ($ in millions) Resort Operations and Club Management Revenue Financing Revenue: Interest Income Other Recurring Revenue $19.8 $19.7 $10 $12 $14 $16 $18 $20 $22 2Q 2017 2Q 2018 $7.0 $4.7 $36.1 $41.3 $32.0 $34.0 $36.0 $38.0 $40.0 $42.0 2Q 2017 2Q 2018 $1.3 $1.5 $5.7 $3.2 $0.0 $1.0 $2.0 $3.0 $4.0 $5.0 $6.0 $7.0 $8.0 2Q 2017 2Q 2018 Mortgage Servicing Title Operations 14.4% 0.8% 33.6% bluegreenvacations
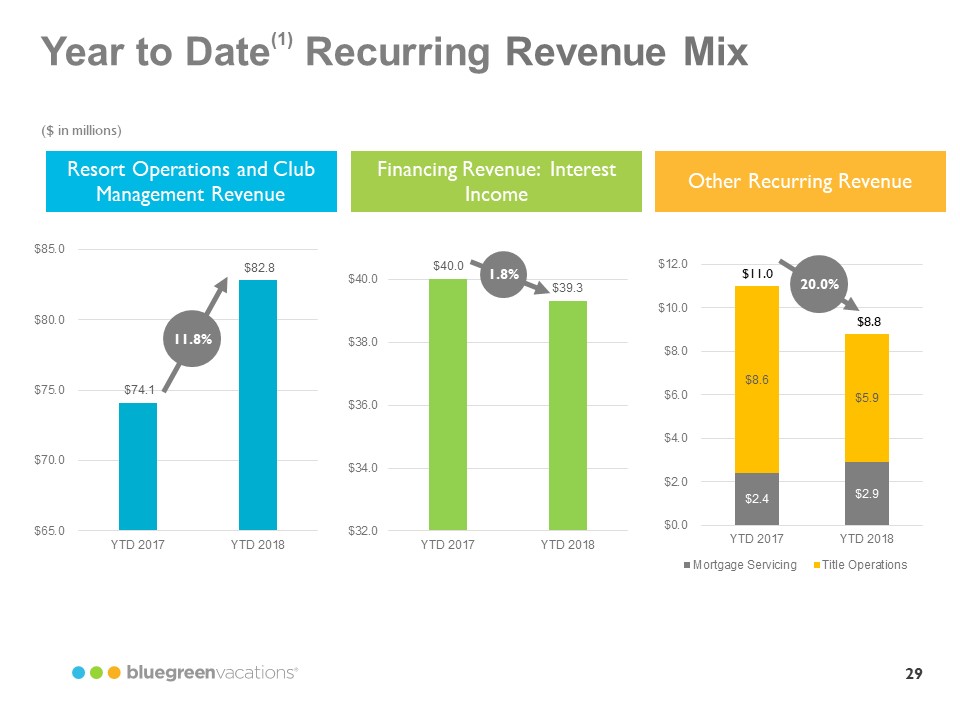
29 Year to Date (1) Recurring Revenue Mix ($ in millions) Resort Operations and Club Management Revenue Financing Revenue: Interest Income Other Recurring Revenue $11.0 $8.8 $74.1 $82.8 $65.0 $70.0 $75.0 $80.0 $85.0 YTD 2017 YTD 2018 $40.0 $39.3 $32.0 $34.0 $36.0 $38.0 $40.0 YTD 2017 YTD 2018 $2.4 $2.9 $8.6 $5.9 $0.0 $2.0 $4.0 $6.0 $8.0 $10.0 $12.0 YTD 2017 YTD 2018 Mortgage Servicing Title Operations 11.8% 1.8% 20.0% bluegreenvacations
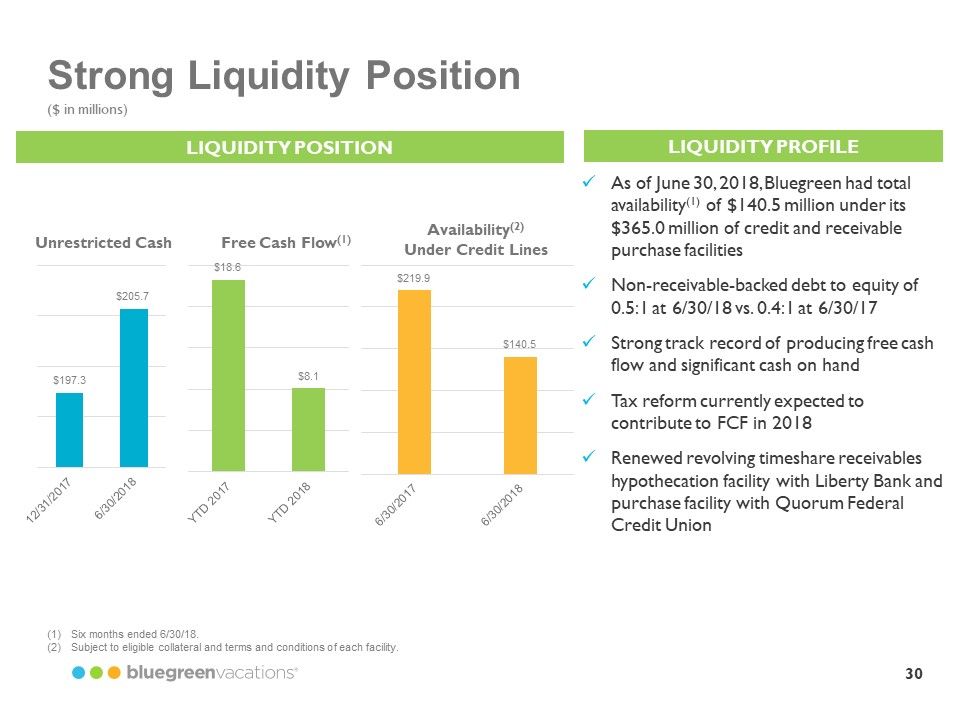
30 Strong Liquidity Position As of June 30, 2018, Bluegreen had total availability (1) of $140.5 million under its $365.0 million of credit and receivable purchase facilities . Non-receivable-backed debt to equity of 0.5:1 at 6/30/18 vs. 0.4:1 at 6/30/17 . Strong track record of producing free cash flow and significant cash on hand . Tax reform currently expected to contribute to FCF in 2018 . Renewed revolving timeshare receivables hypothecation facility with Liberty Bank and purchase facility with Quorum Federal Credit Union LIQUIDITY POSITION LIQUIDITY PROFILE ($ in millions) $197.3 $205.7 12/31/2017 6/30/2018 Unrestricted Cash $18.6 $8.1 YTD 2017 YTD 2018 Free Cash Flow (1) $219.9 $140.5 6/30/2017 6/30/2018 Availability (2) Under Credit Lines (1) Six months ended 6/30/18. (2) Subject to eligible collateral and terms and conditions of each facility. bluegreenvacations
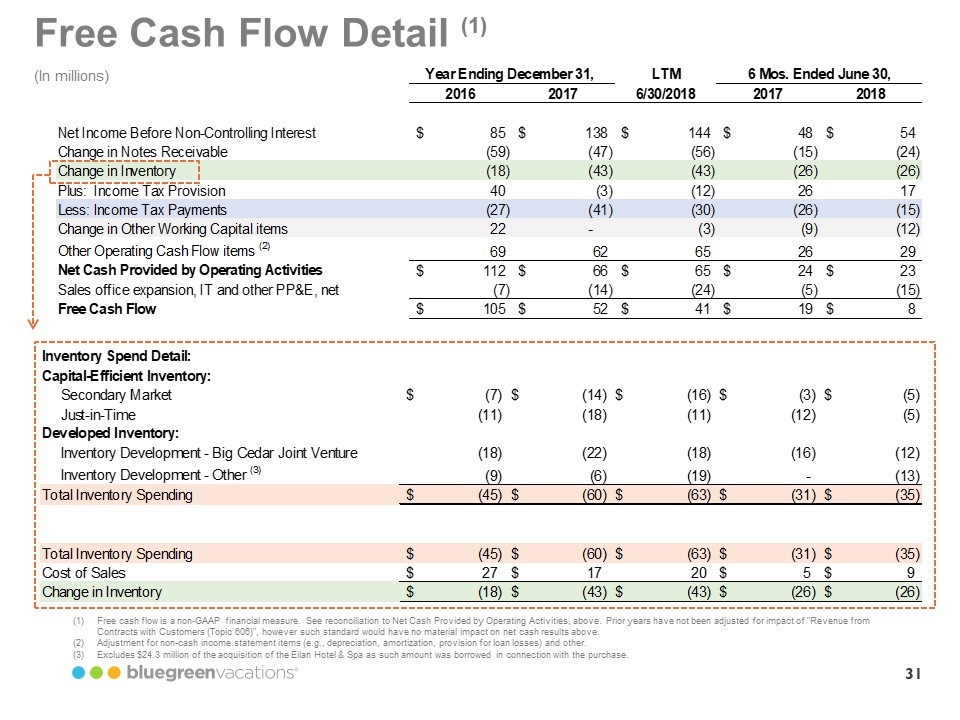
31 LTM201620176/30/201820172018Net Income Before Non-Controlling Interest85$ 138$ 144$ 48$ 54$ Change in Notes Receivable(59) (47) (56) (15) (24) Change in Inventory(18) (43) (43) (26) (26) Plus: Income Tax Provision40 (3) (12) 26 17 Less: Income Tax Payments(27) (41) (30) (26) (15) Change in Other Working Capital items22-(3) (9) (12) Other Operating Cash Flow items (2)69 62 65 26 29 Net Cash Provided by Operating Activities112$ 66$ 65$ 24$ 23$ Sales office expansion, IT and other PP&E, net(7) (14) (24) (5) (15) Free Cash Flow105$ 52$ 41$ 19$ 8$ Year Ending December 31, 6 Mos. Ended June 30, (1) Free cash flow is a non-GAAP financial measure. See reconciliation to Net Cash Provided by Operating Activities, above. Prior years have not been adjusted for impact of "Revenue from Contracts with Customers (Topic 606)", however such standard would have no material impact on net cash results above. (2) Adjustment for non-cash income statement items (e.g., depreciation, amortization, provision for loan losses) and other. (3) Excludes $24.3 million of the acquisition of the É ilan Hot el & Spa as such amount was borrowed in connection with the purchase. (In millions) Free Cash Flow Detail (1) Inventory Spend Detail: Capital-Efficient Inventory: Secondary Market(7)$ (14)$ (16)$ (3)$ (5)$ Just-in-Time(11) (18) (11) (12) (5) Developed Inventory: Inventory Development-Big Cedar Joint Venture(18) (22) (18) (16) (12) Inventory Development-Other (3) (9) (6) (19) -(13) Total Inventory Spending (45)$ (60)$ (63)$ (31)$ (35)$ Total Inventory Spending (45)$ (60)$ (63)$ (31)$ (35)$ Cost of Sales27$ 17$ 20 5$ 9$ Change in Inventory (18)$ (43)$ (43)$ (26)$ (26)$ bluegreevacations
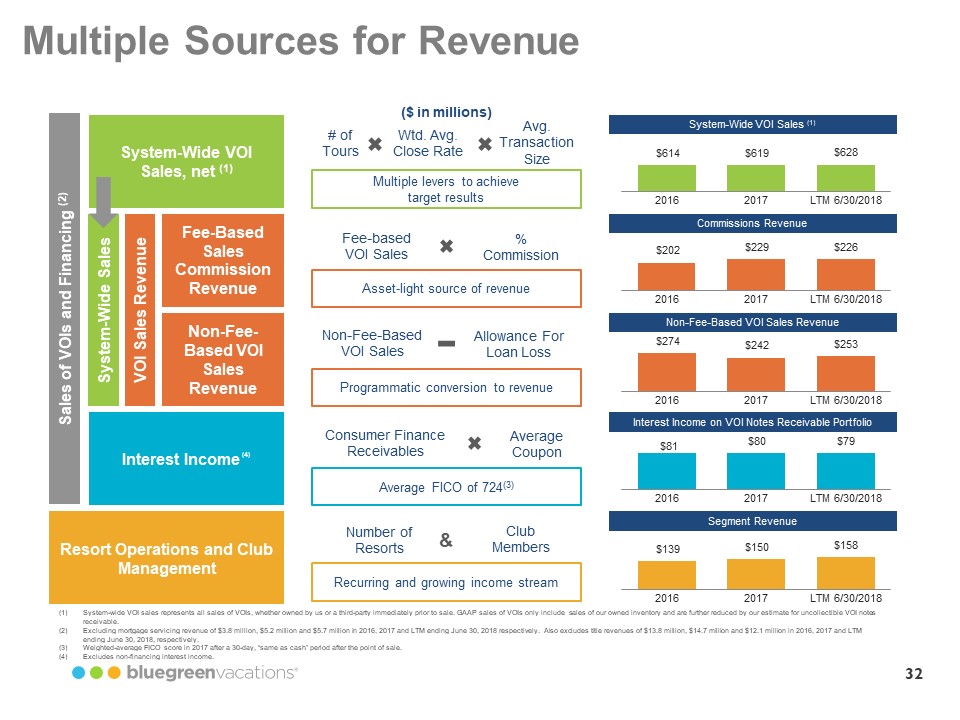
32 Multiple Sources for Revenue Avg. Transaction Size Interest Income (4) Resort Operations and Club Management System-Wide Sales VOI Sales Revenue # of Tours Wtd. Avg. Close Multiple levers to achieve target System-Wide VOI Sales (1) Interest Income on VOI Notes Receivable Portfolio Segment Revenue Consumer Finance Receivables Average Average FICO of 724 (3) Number of Resorts Club Members Recurring and growing income stream (1) System-wide VOI sales represents all sales of VOIs, whether owned by us or a third-party immediately prior to sale. GAAP sales o f VOIs only include sales of our owned inventory and are further reduced by our estimate for uncollectible VOI notes receivable. (2) Excluding mortgage servicing revenue of $3.8 million, $5.2 million and $5.7 million in 2016, 2017 and LTM ending June 30, 201 8 r espectively. Also excludes title revenues of $13.8 million, $14.7 million and $12.1 million in 2016, 2017 and LTM ending June 30, 2018, respectively. (3) Weighted-average FICO score in 2017 after a 30-day, “same as cash” period after the point of sale. (4) Excludes non-financing interest income. & System-Wide VOI Sales, net (1) Fee-Based Sales Commission Revenue Commissions Revenue Fee-based VOI Sales % Commission Asset-light source of revenue ($ in millions) Non-Fee-Based VOI Sales Revenue Programmatic conversion to revenue Non-Fee-Based VOI Sales Revenue Non-Fee-Based VOI Sales Allowance For Loan Loss Sales of VOIs and Financing (2)
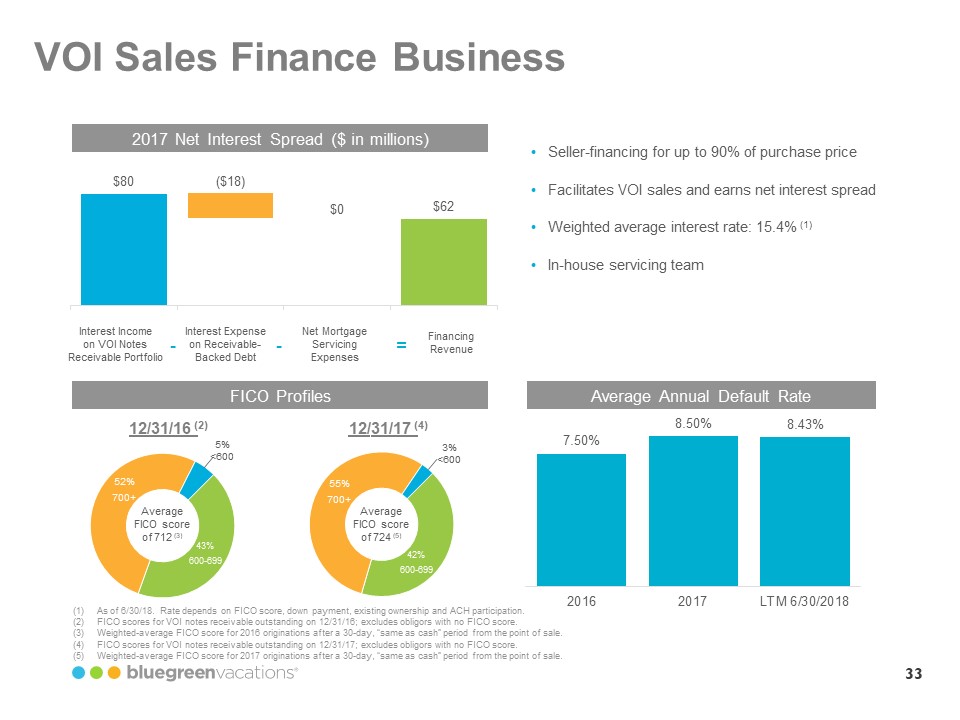
33 VOI Sales Finance Business 2017 Net Interest Spread ($ in millions) FICO Profiles Average Annual Default Rate 7.50% 8.50% 8.43% 2016 2017 LTM 6/30/2018 $80 $0 $62 ($18) Interest Income on VOI Notes Receivable Portfolio Interest Expense on Receivable-Backed Debt Financing Revenue Net Mortgage Servicing Expenses-- = • Seller-financing for up to 90% of purchase price • Facilitates VOI sales and earns net interest spread • Weighted average interest rate: 15.4% (1) • In-house servicing team (1) As of 6 /30 /18. Rate depends on FICO score, down payment, existing ownership and ACH participation. (2) FICO scores for VOI notes receivable outstanding on 12/31/16; excludes obligors with no FICO score. (3) Weighted-average FICO score for 2016 originations after a 30-day, “same as cash” period from the point of sale. (4) FICO scores for VOI notes receivable outstanding on 12/31 /17; excludes obligors with no FICO score. (5) Weighted-average FICO score for 2017 originations after a 30-day, “same as cash” period from the point of sale. 43% 600-699 52% 700+ 5% <600 Average FICO score of 712 (3) Average FICO score of 724 (5) 55% 700+ 42% 600-699 3% <600 12/31/16 ( 2) 12/ 31/17 ( 4)
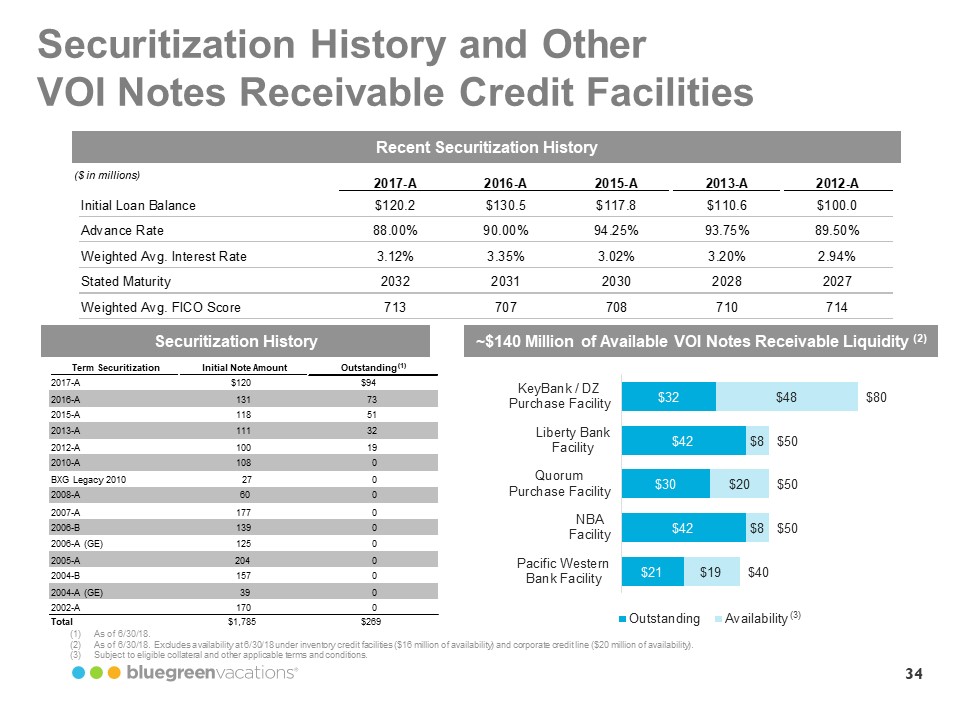
Securitization History and Other VOI Notes Receivable Credit Facilities Recent Securitization History Securitization History ($ in millions) 2017-A 2016-A 2015-A 2013-A 2012-AInitial Loan Balance $120.2 $130.5 $117.8 $110.6 $100.0 Advance Rate 88.00% 90.00% 94.25% 93.75% 89.50% Weighted Avg. Interest Rate 3.12% 3.35% 3.02% 3.20% 2.94% Stated Maturity 2032 2031 2030 2028 2027 Weighted Avg. FICO Score 713 707 708 710 714 Securitization History Term Securitization Initial Note Amount Outstanding (1) 2017-A $120 $94 2016-A 131 73 2015-A 118 51 2013-A 111 32 2012-A 100 19 2010-A 108 0 BXG Legacy 2010 27 0 2008-A 60 0 2007-A 177 0 2006-B 139 0 2006-A (GE) 125 0 2005-A 204 0 2004-B 157 0 2004-A (GE) 39 0 2002-A 170 0 Total $1,785 $269 ~$140 Million of Available VOI Notes Receivable Liquidity $21 $42 $30 $42 $32 $19 $8 $20 $8 $48 $40 $50 $50 $50 $80 Pacific Western Bank Facility NBA Facility Quorum Purchase Facility Liberty Bank Facility KeyBank / DZ Purchase Facility Outstanding Availability (2) (1) As of 6/30/18. (2) As of 6/30/18. Excludes availability at 6/30/18 under inventory credit facilities ($16 million of availability) and corporate credit line ($20 million of availability). (3) Subject to eligible collateral and other applicable terms and conditions. (3) 34
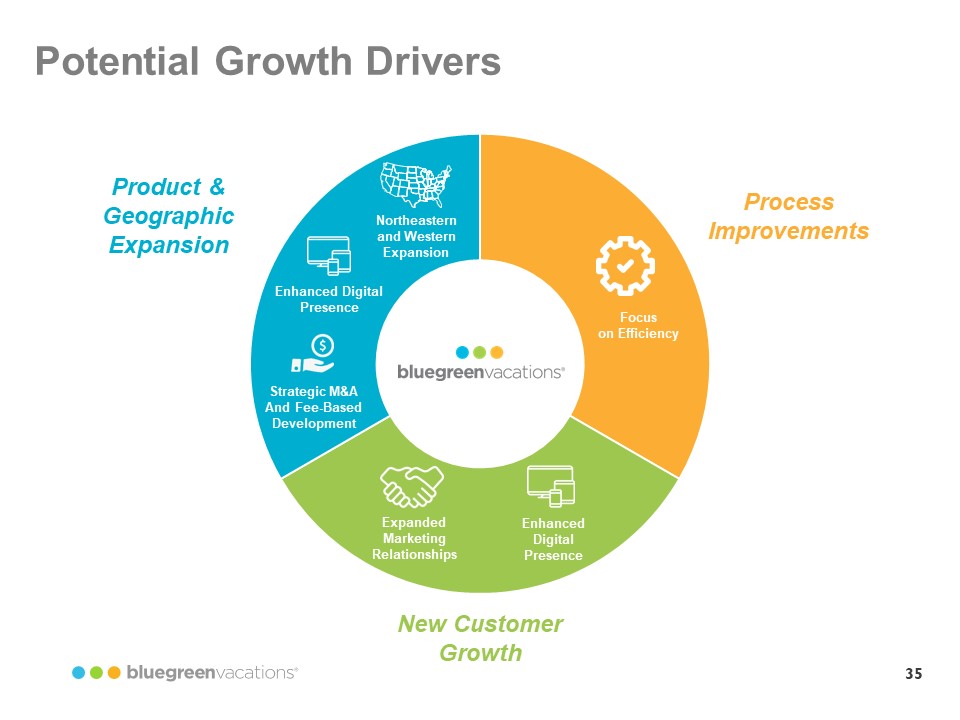
35 Process Improvements New Customer Growth Product & Geographic Expansion Expanded Marketing Relationships Enhanced Digital Presence Northeastern and Western Expansion Strategic M&A And Fee-Based Development Focus on Efficiency Enhanced Digital Presence Potential Growth Drivers
APPENDIX The Club at Big Bear Village BIG BEAR LAKE, CALIFORNIA
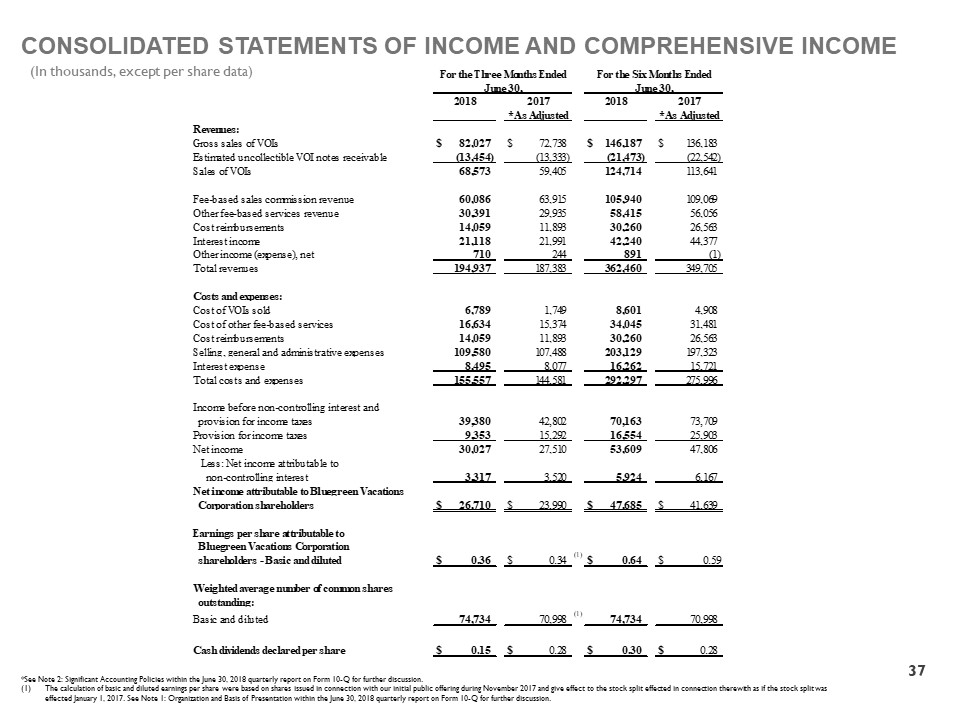
CONSOLIDATED STATEMENTS OF INCOME AND COMPREHENSIVE INCOME (In thousands, except per share data) *See Note 2: Significant Accounting Policies within the June 30, 2018 quarterly report on Form 10-Q for further discussion. (1) The calculation of basic and diluted earnings per share were based on shares issued in connection with our initial public off eri ng during November 2017 and give effect to the stock split effected in connection therewith as if the stock split was effected January 1, 2017. See Note 1: Organization and Basis of Presentation within the June 30, 2018 quarterly report on For m 1 0-Q for further discussion. Revenues: Gross sales of VOIs$82,027 $72,738 $146,187 $136,183 Estimated uncollectible VOI notes receivable(13,454) (13,333) (21,473) (22,542) Sales of VOIs68,573 59,405 124,714 113,641 Fee-based sales commission revenue 60,086 63,915 105,940 109,069 Other fee-based services revenue30,391 29,935 58,415 56,056 Cost reimbursements14,059 11,893 30,260 26,563 Interest income 21,118 21,991 42,240 44,377 Other income (expense), net710 244 891 (1) Total revenues194,937 187,383 362,460 349,705 Costs and expenses: Cost of VOIs sold6,789 1,749 8,601 4,908 Cost of other fee-based services16,634 15,374 34,045 31,481 Cost reimbursements14,059 11,893 30,260 26,563 Selling, general and administrative expenses 109,580 107,488 203,129 197,323 Interest expense 8,495 8,077 16,262 15,721 Total costs and expenses155,557 144,581 292,297 275,996 Income before non-controlling interest and provision for income taxes39,380 42,802 70,163 73,709 Provision for income taxes9,353 15,292 16,554 25,903 Net income30,027 27,510 53,609 47,806 Less: Net income attributable to non-controlling interest3,317 3,520 5,924 6,167 Net income attributable to Bluegreen Vacations Corporation shareholders$26,710 $23,990 $47,685 $41,639 Earnings per share attributable to Bluegreen Vacations Corporation shareholders-Basic and diluted $0.36 $0.34 (1)$0.64 $0.59Weighted average number of common shares outstanding: Basic and diluted74,734 70,998 (1)74,734 70,998 Cash dividends declared per share$0.15 $0.28 $0.30 $0.28 2017For the Six Months Ended 2018 June 30, *As AdjustedFor the Three Months Ended June 30,2018 2017*As Adjusted 37
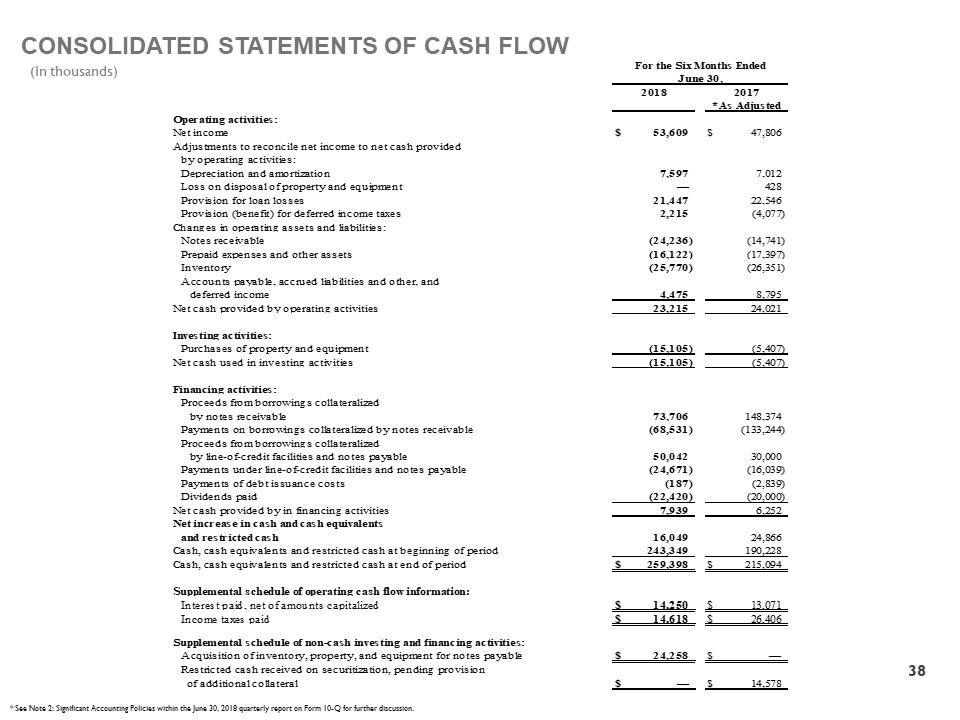
CONSOLIDATED STATEMENTS OF CASH FLOW (In thousands) * See Note 2: Significant Accounting Policies within the June 30, 2018 quarterly report on Form 10-Q for further discussion. Operating activities: Net income$53,609 $47,806 Adjustments to reconcile net income to net cash provided by operating activities: Depreciation and amortization 7,597 7,012 Loss on disposal of property and equipment — 428 Provision for loan losses 21,447 22,546 Provision (benefit) for deferred income taxes 2,215 (4,077) Changes in operating assets and liabilities: Notes receivable (24,236) (14,741) Prepaid expenses and other assets (16,122) (17,397) Inventory (25,770) (26,351) Accounts payable, accrued liabilities and other, and deferred income 4,475 8,795 Net cash provided by operating activities 23,215 24,021 Investing activities: Purchases of property and equipment (15,105) (5,407) Net cash used in investing activities (15,105) (5,407) Financing activities: Proceeds from borrowings collateralizedby notes receivable 73,706 148,374 Payments on borrowings collateralized by notes receivable (68,531) (133,244) Proceeds from borrowings collateralizedby line-of-credit facilities and notes payable50,042 30,000 Payments under line-of-credit facilities and notes payable(24,671) (16,039) Payments of debt issuance costs (187) (2,839) Dividends paid(22,420) (20,000) Net cash provided by in financing activities 7,939 6,252 Net increase in cash and cash equivalentsand restricted cash16,049 24,866 Cash, cash equivalents and restricted cash at beginning of period243,349 190,228 Cash, cash equivalents and restricted cash at end of period$259,398 $215,094 For the Six Months Ended20182017June 30, *As Adjusted Supplemental schedule of operating cash flow information: Interest paid, net of amounts capitalized$14,250 $13,071 Income taxes paid $14,618 $26,406 Supplemental schedule of non-cash investing and financing activities: Acquisition of inventory, property, and equipment for notes payable$24,258 $— Restricted cash received on securitization, pending provision of additional collateral$— $14,578 38
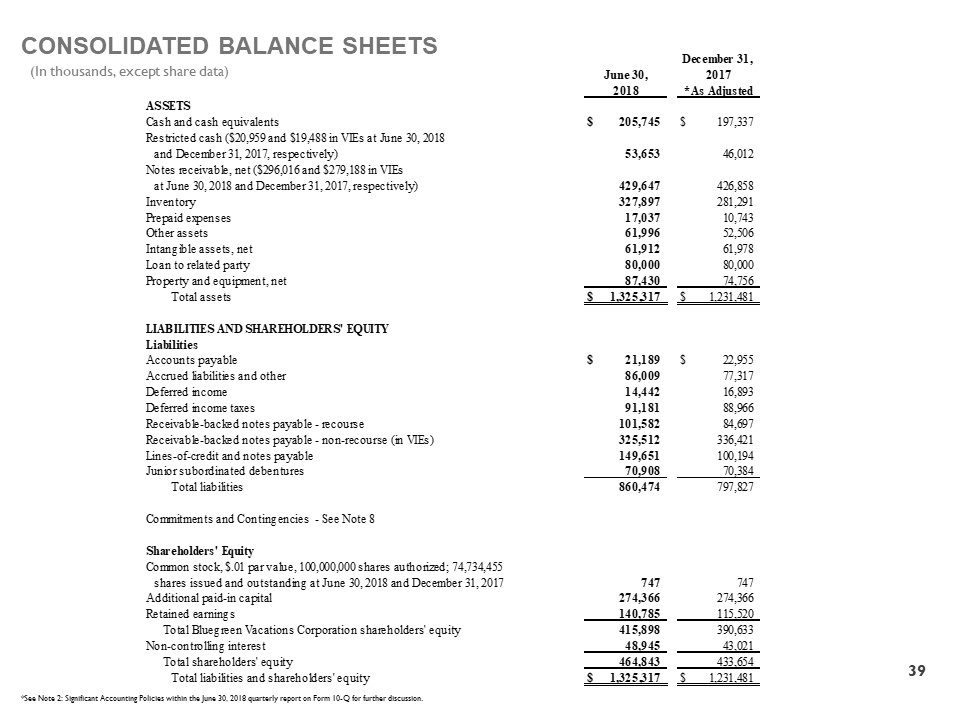
CONSOLIDATED BALANCE SHEETS (In thousands, except share data) *See Note 2: Significant Accounting Policies within the June 30, 2018 quarterly report on Form 10-Q for further discussion. ASSETS Cash and cash equivalents$205,745 $197,337 Restricted cash ($20,959 and $19,488 in VIEs at June 30, 2018and December 31, 2017, respectively)53,653 46,012 Notes receivable, net ($296,016 and $279,188 in VIEsat June 30, 2018 and December 31, 2017, respectively)429,647 426,858 Inventory 327,897 281,291 Prepaid expenses 17,037 10,743 Other assets 61,996 52,506 Intangible assets, net61,912 61,978 Loan to related party80,000 80,000 Property and equipment, net 87,430 74,756 Total assets $1,325,317 $1,231,481 LIABILITIES AND SHAREHOLDERS' EQUITYLiabilitiesAccounts payable $21,189 $22,955 Accrued liabilities and other 86,009 77,317 Deferred income 14,442 16,893 Deferred income taxes 91,181 88,966 Receivable-backed notes payable-recourse 101,582 84,697 Receivable-backed notes payable-non-recourse (in VIEs)325,512 336,421 Lines-of-credit and notes payable 149,651 100,194 Junior subordinated debentures 70,908 70,384 Total liabilities 860,474 797,827 Commitments and Contingencies-See Note 8Shareholders' EquityCommon stock, $.01 par value, 100,000,000 shares authorized; 74,734,455shares issued and outstanding at June 30, 2018 and December 31, 2017747 747 Additional paid-in capital 274,366 274,366 Retained earnings 140,785 115,520 Total Bluegreen Vacations Corporation shareholders' equity 415,898 390,633 Non-controlling interest 48,945 43,021 Total shareholders' equity 464,843 433,654 Total liabilities and shareholders' equity $1,325,317 $1,231,481 2018*As AdjustedJune 30, December 31, 201739
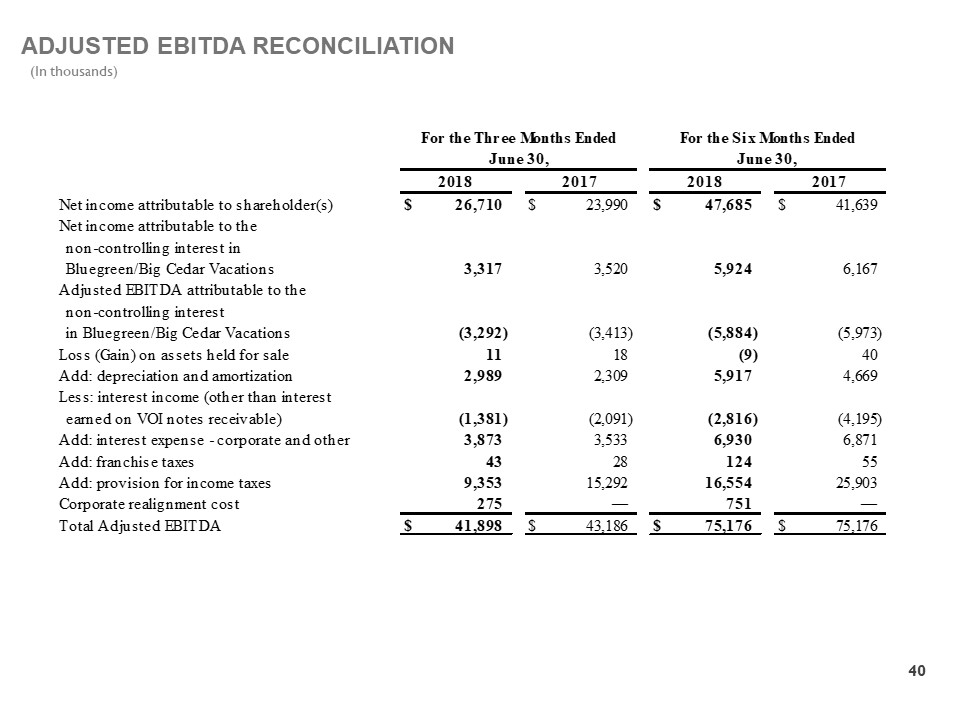
ADJUSTED EBITDA RECONCILIATION (In thousands) (in thousands) Net income attributable to shareholder(s)$26,710 $23,990 $47,685 $41,639 Net income attributable to the non-controlling interest in Bluegreen/Big Cedar Vacations3,317 3,520 5,924 6,167 Adjusted EBITDA attributable to the non-controlling interest in Bluegreen/Big Cedar Vacations(3,292) (3,413) (5,884) (5,973) Loss (Gain) on assets held for sale11 18 (9) 40 Add: depreciation and amortization2,989 2,309 5,917 4,669 Less: interest income (other than interest earned on VOI notes receivable)(1,381) (2,091) (2,816) (4,195) Add: interest expense-corporate and other3,873 3,533 6,930 6,871 Add: franchise taxes43 28 124 55 Add: provision for income taxes9,353 15,292 16,554 25,903 Corporate realignment cost275 — 751 — Total Adjusted EBITDA$41,898 $43,186 $75,176 $75,176 20182017For the Three Months Ended June 30,20182017For the Six Months Ended June 30, 40
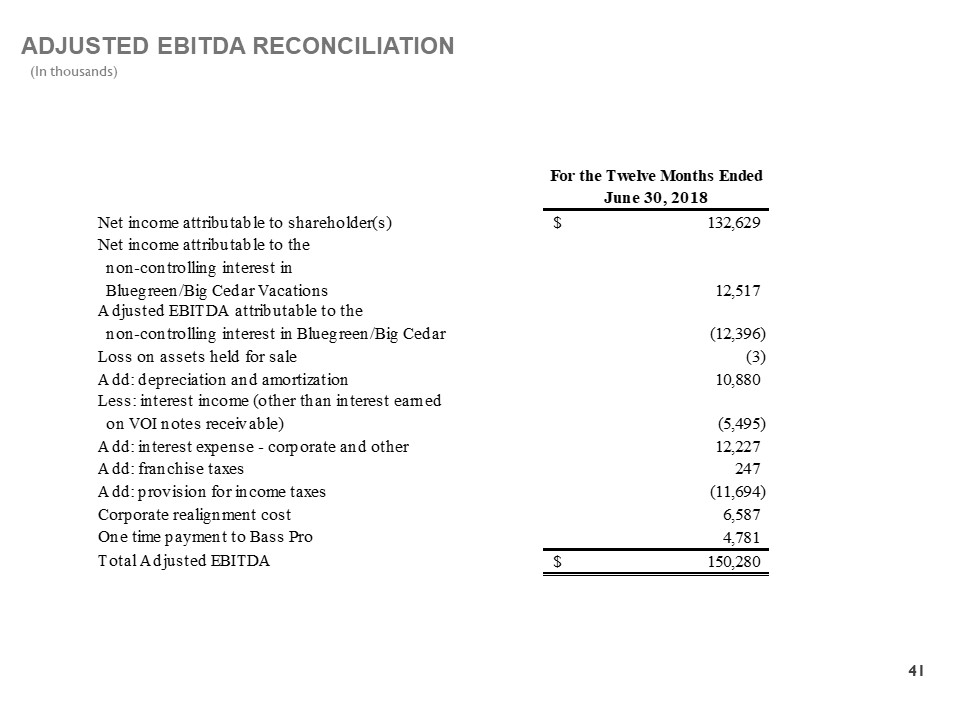
ADJUSTED EBITDA RECONCILIATION (In thousands) For the Twelve Months Ended June 30, 2018Net income attributable to shareholder(s)132,629$ Net income attributable to the non-controlling interest in Bluegreen/Big Cedar Vacations12,517 Adjusted EBITDA attributable to the non-controlling interest in Bluegreen/Big Cedar (12,396) Loss on assets held for sale(3) Add: depreciation and amortization10,880 Less: interest income (other than interest earned on VOI notes receivable)(5,495) Add: interest expense-corporate and other12,227 Add: franchise taxes247 Add: provision for income taxes(11,694) Corporate realignment cost6,587 One time payment to Bass Pro4,781 Total Adjusted EBITDA150,280$ 41
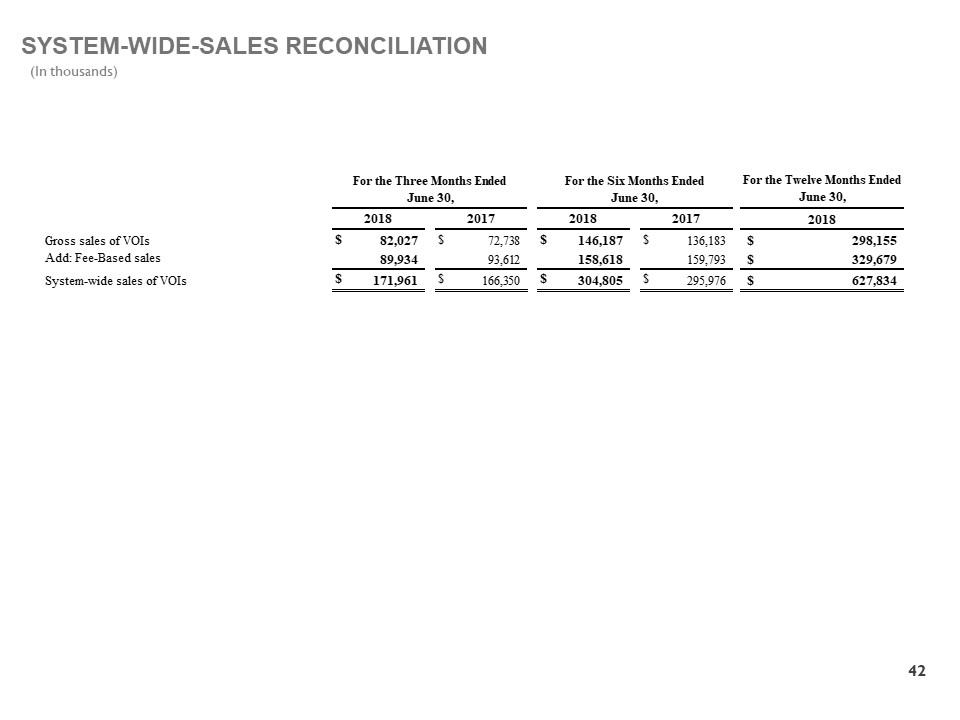
SYSTEM-WIDE-SALES RECONCILIATION (In thousands) For the Twelve Months Ended June 30, 2018 Gross sales of VOIs $82,027 $72,738 $146,187 $136,183 298,155$ Add: Fee-Based sales 89,934 93,612 158,618 159,793 329,679 $ System-wide sales of VOIs $171,961 $166,350 $304,805 $295,976 627,834 $ For the Three Months Ended June 30, For the Six Months Ended June 30,2018 2017 2018 2017 42
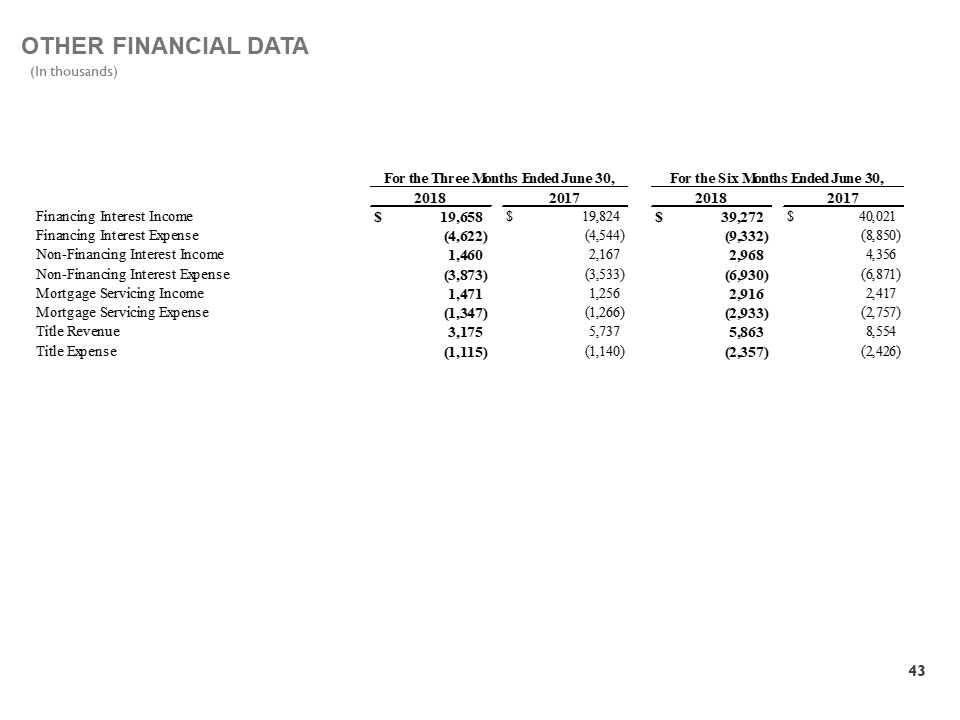
OTHER FINANCIAL DATA (In thousands) Financing Interest Income $19,658 $19,824 $39,272 $40,021 Financing Interest Expense (4,622) (4,544) (9,332) (8,850) Non-Financing Interest Income1,460 2,167 2,968 4,356 Non-Financing Interest Expense(3,873) (3,533) (6,930) (6,871) Mortgage Servicing Income1,471 1,256 2,916 2,417 Mortgage Servicing Expense(1,347) (1,266) (2,933) (2,757) Title Revenue3,175 5,737 5,863 8,554 Title Expense(1,115) (1,140) (2,357) (2,426) For the Six Months Ended June 30,2018 2017 2018 2017 For the Three Months Ended June 30, 43