Attached files
| file | filename |
|---|---|
| 8-K - 8-K - Garrison Capital Inc. | gars-8k_20180807.htm |
Earnings Presentation Second Quarter ended June 30, 2018 EXHIBIT 99.1
DISCLAIMER Some of the statements in this presentation constitute forward-looking statements, which relate to future events or our future performance or financial condition. The forward-looking statements contained in this presentation involve risks and uncertainties, including statements as to: our future operating results; changes in political, economic or industry conditions, the interest rate environment or conditions affecting the financial and capital markets, which could result in changes to the value of our assets; our business prospects and the prospects of our current and prospective portfolio companies; the impact of investments that we expect to make; the impact of increased competition; our contractual arrangements and relationships with third parties; the dependence of our future success on the general economy, including general economic trends, and its impact on the industries in which we invest; the ability of our prospective portfolio companies to achieve their objectives; the relative and absolute performance of our investment adviser, including in identifying suitable investments for us; our expected financings and investments; the adequacy of our cash resources and working capital; our ability to make distributions to our stockholders; the effects of legislation and regulations and changes thereto; the timing of cash flows, if any, from the operations of our prospective portfolio companies; and the impact of future acquisitions and divestitures. We use words such as “anticipates,” “believes,” “expects,” “intends” and similar expressions to identify forward-looking statements. Actual results could differ materially from those implied or expressed in our forward-looking statements for any reason, and future results could differ materially from historical performance. We have based the forward-looking statements included in this presentation on information available to us on the date of this presentation, and we assume no obligation to update any such forward-looking statements. Although we undertake no obligation to revise or update any forward-looking statements, whether as a result of new information, future events or otherwise, you are advised to consult any additional disclosures that we may make directly to you or through reports that we have filed or in the future may file with the U.S. Securities and Exchange Commission, including annual reports on Form 10-K, quarterly reports on Form 10-Q and current reports on Form 8-K.
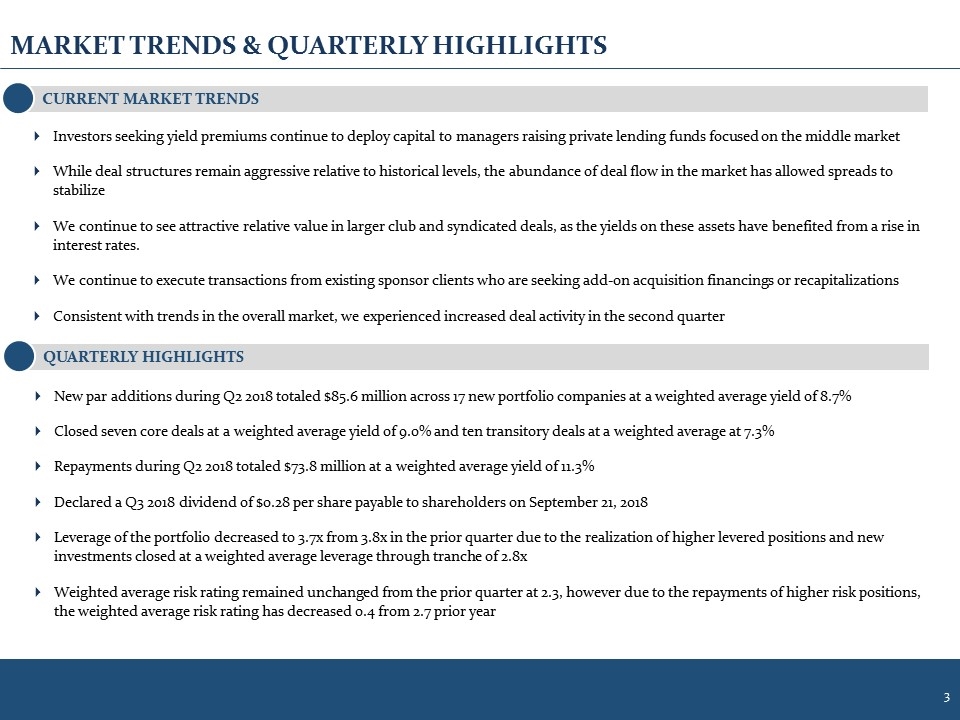
MARKET TRENDS & QUARTERLY HIGHLIGHTS Investors seeking yield premiums continue to deploy capital to managers raising private lending funds focused on the middle market While deal structures remain aggressive relative to historical levels, the abundance of deal flow in the market has allowed spreads to stabilize We continue to see attractive relative value in larger club and syndicated deals, as the yields on these assets have benefited from a rise in interest rates. We continue to execute transactions from existing sponsor clients who are seeking add-on acquisition financings or recapitalizations Consistent with trends in the overall market, we experienced increased deal activity in the second quarter CURRENT MARKET TRENDS QUARTERLY HIGHLIGHTS New par additions during Q2 2018 totaled $85.6 million across 17 new portfolio companies at a weighted average yield of 8.7% Closed seven core deals at a weighted average yield of 9.0% and ten transitory deals at a weighted average at 7.3% Repayments during Q2 2018 totaled $73.8 million at a weighted average yield of 11.3% Declared a Q3 2018 dividend of $0.28 per share payable to shareholders on September 21, 2018 Leverage of the portfolio decreased to 3.7x from 3.8x in the prior quarter due to the realization of higher levered positions and new investments closed at a weighted average leverage through tranche of 2.8x Weighted average risk rating remained unchanged from the prior quarter at 2.3, however due to the repayments of higher risk positions, the weighted average risk rating has decreased 0.4 from 2.7 prior year
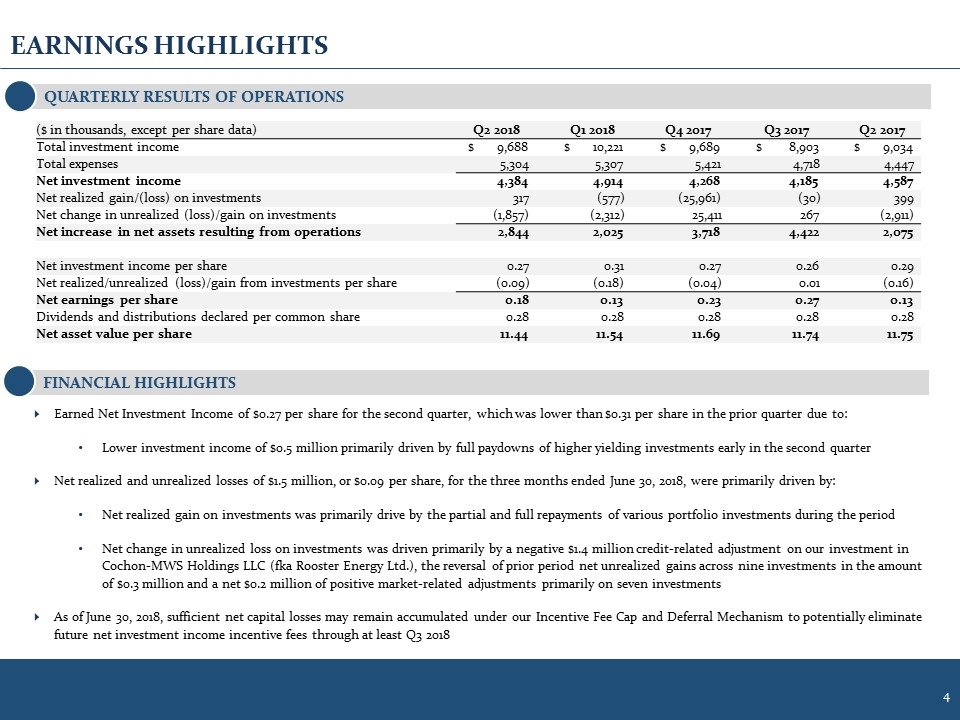
EARNINGS HIGHLIGHTS FINANCIAL HIGHLIGHTS Earned Net Investment Income of $0.27 per share for the second quarter, which was lower than $0.31 per share in the prior quarter due to: Lower investment income of $0.5 million primarily driven by full paydowns of higher yielding investments early in the second quarter Net realized and unrealized losses of $1.5 million, or $0.09 per share, for the three months ended June 30, 2018, were primarily driven by: Net realized gain on investments was primarily drive by the partial and full repayments of various portfolio investments during the period Net change in unrealized loss on investments was driven primarily by a negative $1.4 million credit-related adjustment on our investment in Cochon-MWS Holdings LLC (fka Rooster Energy Ltd.), the reversal of prior period net unrealized gains across nine investments in the amount of $0.3 million and a net $0.2 million of positive market-related adjustments primarily on seven investments As of June 30, 2018, sufficient net capital losses may remain accumulated under our Incentive Fee Cap and Deferral Mechanism to potentially eliminate future net investment income incentive fees through at least Q3 2018 QUARTERLY RESULTS OF OPERATIONS ($ in thousands, except per share data) Q2 2018 Q1 2018 Q4 2017 Q3 2017 Q2 2017 Total investment income $ 9,688 $ 10,221 $ 9,689 $ 8,903 $ 9,034 Total expenses 5,304 5,307 5,421 4,718 4,447 Net investment income 4,384 4,914 4,268 4,185 4,587 Net realized gain/(loss) on investments 317 (577) (25,961) (30) 399 Net change in unrealized (loss)/gain on investments (1,857) (2,312) 25,411 267 (2,911) Net increase in net assets resulting from operations 2,844 2,025 3,718 4,422 2,075 Net investment income per share 0.27 0.31 0.27 0.26 0.29 Net realized/unrealized (loss)/gain from investments per share (0.09) (0.18) (0.04) 0.01 (0.16) Net earnings per share 0.18 0.13 0.23 0.27 0.13 Dividends and distributions declared per common share 0.28 0.28 0.28 0.28 0.28 Net asset value per share 11.44 11.54 11.69 11.74 11.75
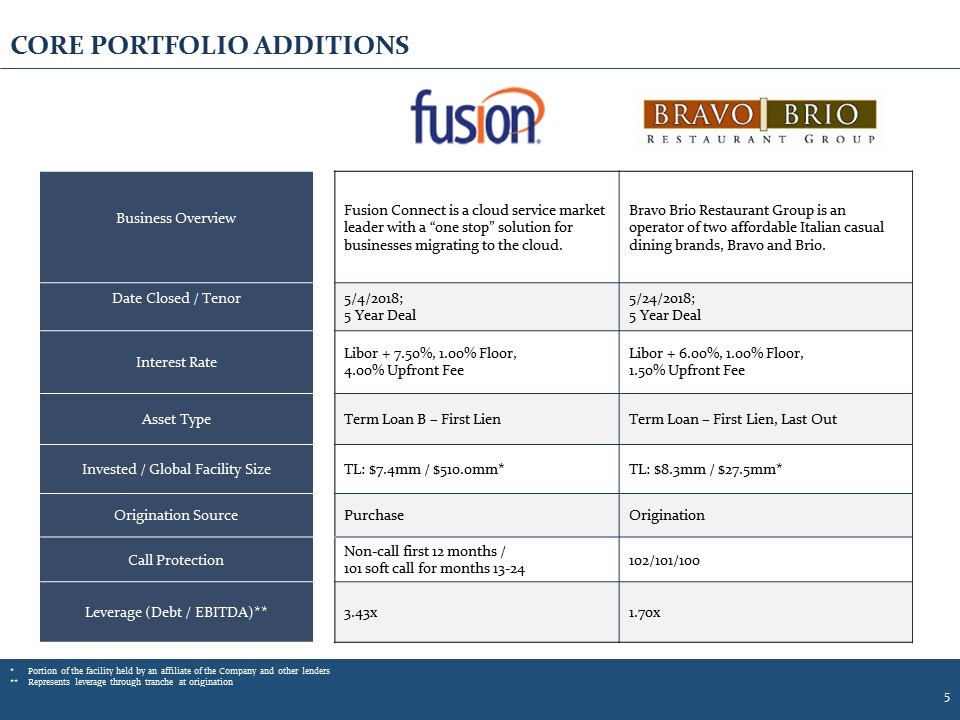
CORE PORTFOLIO ADDITIONS Business Overview Fusion Connect is a cloud service market leader with a “one stop” solution for businesses migrating to the cloud. Bravo Brio Restaurant Group is an operator of two affordable Italian casual dining brands, Bravo and Brio. Date Closed / Tenor 5/4/2018; 5 Year Deal 5/24/2018; 5 Year Deal Interest Rate Libor + 7.50%, 1.00% Floor, 4.00% Upfront Fee Libor + 6.00%, 1.00% Floor, 1.50% Upfront Fee Asset Type Term Loan B – First Lien Term Loan – First Lien, Last Out Invested / Global Facility Size TL: $7.4mm / $510.0mm* TL: $8.3mm / $27.5mm* Origination Source Purchase Origination Call Protection Non-call first 12 months / 101 soft call for months 13-24 102/101/100 Leverage (Debt / EBITDA)** 3.43x 1.70x *Portion of the facility held by an affiliate of the Company and other lenders ** Represents leverage through tranche at origination
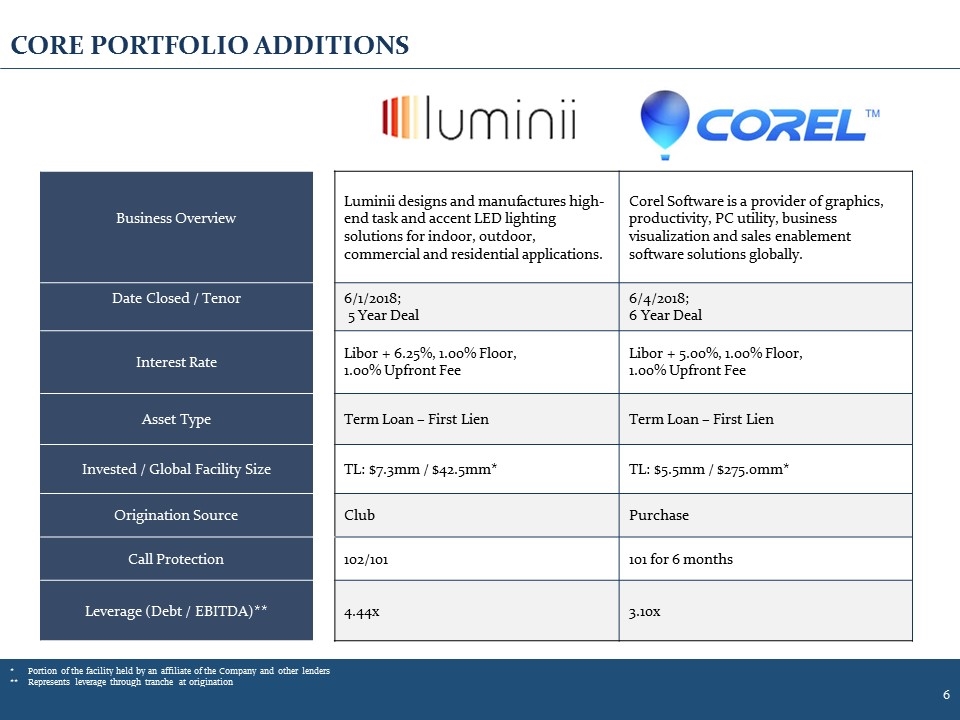
CORE PORTFOLIO ADDITIONS Business Overview Luminii designs and manufactures high-end task and accent LED lighting solutions for indoor, outdoor, commercial and residential applications. Corel Software is a provider of graphics, productivity, PC utility, business visualization and sales enablement software solutions globally. Date Closed / Tenor 6/1/2018; 5 Year Deal 6/4/2018; 6 Year Deal Interest Rate Libor + 6.25%, 1.00% Floor, 1.00% Upfront Fee Libor + 5.00%, 1.00% Floor, 1.00% Upfront Fee Asset Type Term Loan – First Lien Term Loan – First Lien Invested / Global Facility Size TL: $7.3mm / $42.5mm* TL: $5.5mm / $275.0mm* Origination Source Club Purchase Call Protection 102/101 101 for 6 months Leverage (Debt / EBITDA)** 4.44x 3.10x *Portion of the facility held by an affiliate of the Company and other lenders ** Represents leverage through tranche at origination
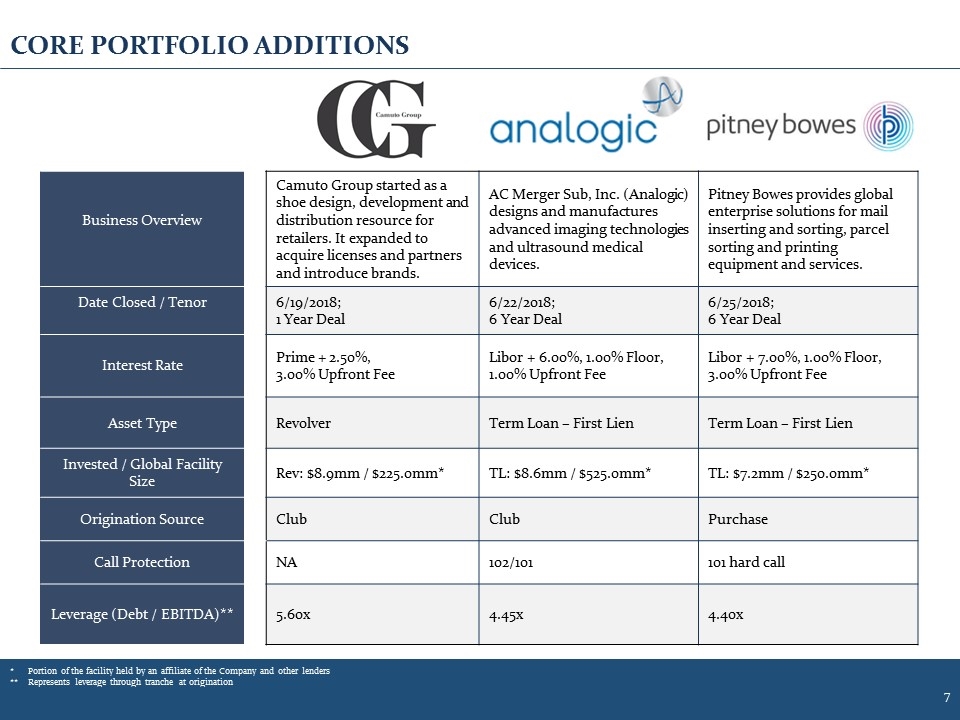
CORE PORTFOLIO ADDITIONS Business Overview Camuto Group started as a shoe design, development and distribution resource for retailers. It expanded to acquire licenses and partners and introduce brands. AC Merger Sub, Inc. (Analogic) designs and manufactures advanced imaging technologies and ultrasound medical devices. Pitney Bowes provides global enterprise solutions for mail inserting and sorting, parcel sorting and printing equipment and services. Date Closed / Tenor 6/19/2018; 1 Year Deal 6/22/2018; 6 Year Deal 6/25/2018; 6 Year Deal Interest Rate Prime + 2.50%, 3.00% Upfront Fee Libor + 6.00%, 1.00% Floor, 1.00% Upfront Fee Libor + 7.00%, 1.00% Floor, 3.00% Upfront Fee Asset Type Revolver Term Loan – First Lien Term Loan – First Lien Invested / Global Facility Size Rev: $8.9mm / $225.0mm* TL: $8.6mm / $525.0mm* TL: $7.2mm / $250.0mm* Origination Source Club Club Purchase Call Protection NA 102/101 101 hard call Leverage (Debt / EBITDA)** 5.60x 4.45x 4.40x *Portion of the facility held by an affiliate of the Company and other lenders ** Represents leverage through tranche at origination
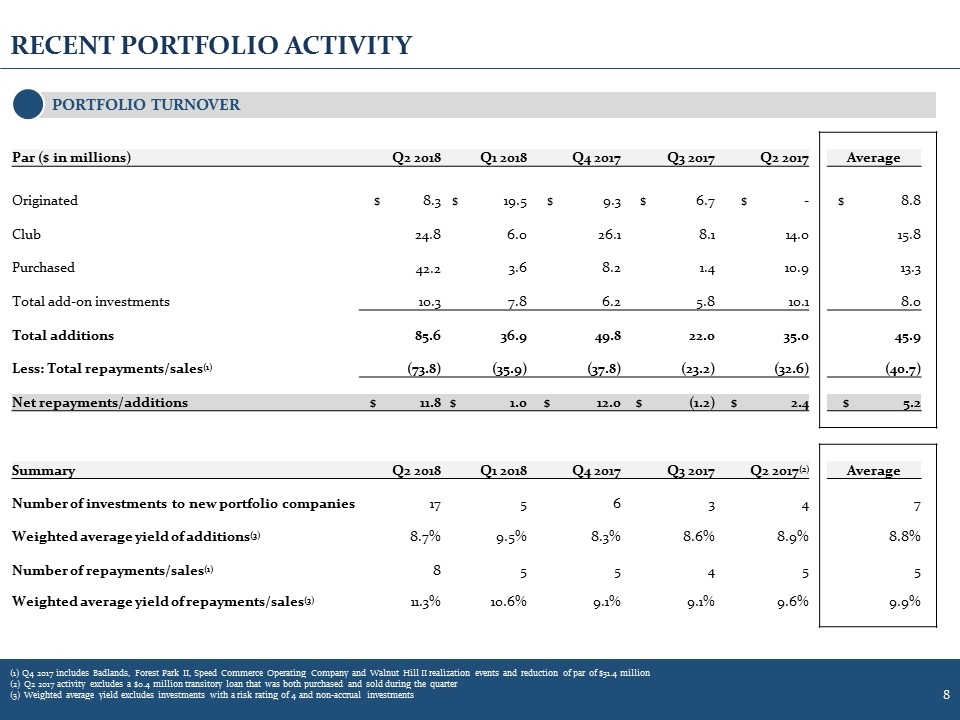
RECENT PORTFOLIO ACTIVITY (1) Q4 2017 includes Badlands, Forest Park II, Speed Commerce Operating Company and Walnut Hill II realization events and reduction of par of $31.4 million (2) Q2 2017 activity excludes a $0.4 million transitory loan that was both purchased and sold during the quarter (3) Weighted average yield excludes investments with a risk rating of 4 and non-accrual investments PORTFOLIO TURNOVER Par ($ in millions) Q2 2018 Q1 2018 Q4 2017 Q3 2017 Q2 2017 Average Originated $ 8.3 $ 19.5 $ 9.3 $ 6.7 $ - $ 8.8 Club 24.8 6.0 26.1 8.1 14.0 15.8 Purchased 42.2 3.6 8.2 1.4 10.9 13.3 Total add-on investments 10.3 7.8 6.2 5.8 10.1 8.0 Total additions 85.6 36.9 49.8 22.0 35.0 45.9 Less: Total repayments/sales(1) (73.8) (35.9) (37.8) (23.2) (32.6) (40.7) Net repayments/additions $ 11.8 $ 1.0 $ 12.0 $ (1.2) $ 2.4 $ 5.2 Summary Q2 2018 Q1 2018 Q4 2017 Q3 2017 Q2 2017(2) Average Number of investments to new portfolio companies 17 5 6 3 4 7 Weighted average yield of additions(3) 8.7% 9.5% 8.3% 8.6% 8.9% 8.8% Number of repayments/sales(1) 8 5 5 4 5 5 Weighted average yield of repayments/sales(3) 11.3% 10.6% 9.1% 9.1% 9.6% 9.9%
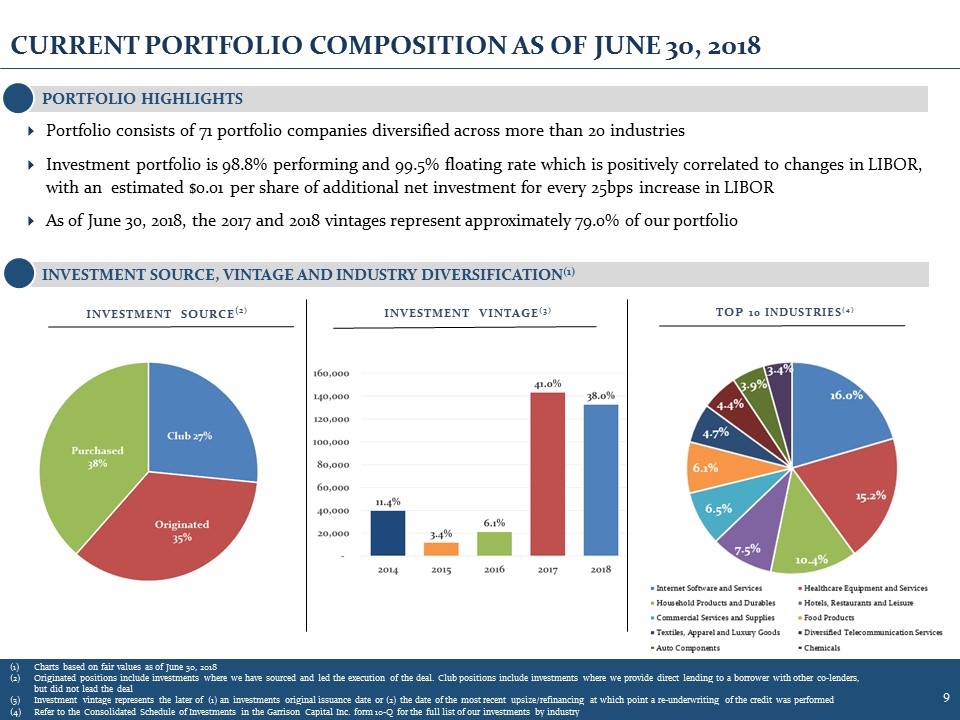
CURRENT PORTFOLIO COMPOSITION AS OF JUNE 30, 2018 Portfolio consists of 71 portfolio companies diversified across more than 20 industries Investment portfolio is 98.8% performing and 99.5% floating rate which is positively correlated to changes in LIBOR, with an estimated $0.01 per share of additional net investment for every 25bps increase in LIBOR As of June 30, 2018, the 2017 and 2018 vintages represent approximately 79.0% of our portfolio INVESTMENT VINTAGE(3) PORTFOLIO HIGHLIGHTS INVESTMENT SOURCE, VINTAGE AND INDUSTRY DIVERSIFICATION(1) TOP 10 INDUSTRIES(4) Charts based on fair values as of June 30, 2018 Originated positions include investments where we have sourced and led the execution of the deal. Club positions include investments where we provide direct lending to a borrower with other co-lenders, but did not lead the deal Investment vintage represents the later of (1) an investments original issuance date or (2) the date of the most recent upsize/refinancing at which point a re-underwriting of the credit was performed Refer to the Consolidated Schedule of Investments in the Garrison Capital Inc. form 10-Q for the full list of our investments by industry INVESTMENT SOURCE(2)
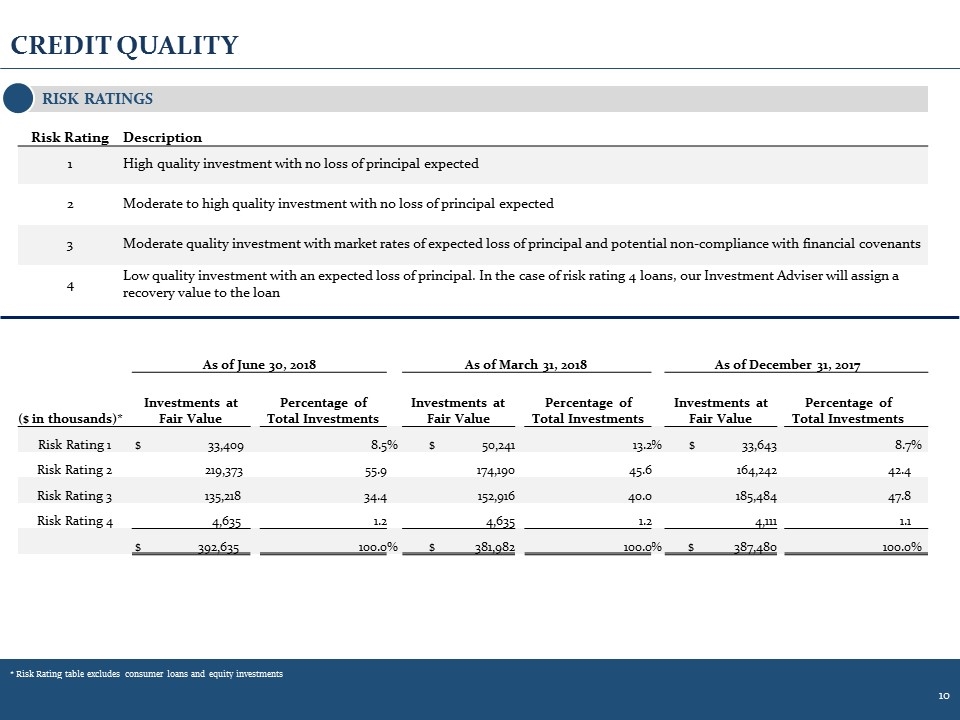
CREDIT QUALITY RISK RATINGS * Risk Rating table excludes consumer loans and equity investments As of June 30, 2018 As of March 31, 2018 As of December 31, 2017 ($ in thousands)* Investments at Fair Value Percentage of Total Investments Investments at Fair Value Percentage of Total Investments Investments at Fair Value Percentage of Total Investments Risk Rating 1 $ 33,409 8.5 % $ 50,241 13.2 % $ 33,643 8.7 % Risk Rating 2 219,373 55.9 174,190 45.6 164,242 42.4 Risk Rating 3 135,218 34.4 152,916 40.0 185,484 47.8 Risk Rating 4 4,635 1.2 4,635 1.2 4,111 1.1 $ 392,635 100.0 % $ 381,982 100.0 % $ 387,480 100.0 % Risk Rating Description 1 High quality investment with no loss of principal expected 2 Moderate to high quality investment with no loss of principal expected 3 Moderate quality investment with market rates of expected loss of principal and potential non-compliance with financial covenants 4 Low quality investment with an expected loss of principal. In the case of risk rating 4 loans, our Investment Adviser will assign a recovery value to the loan
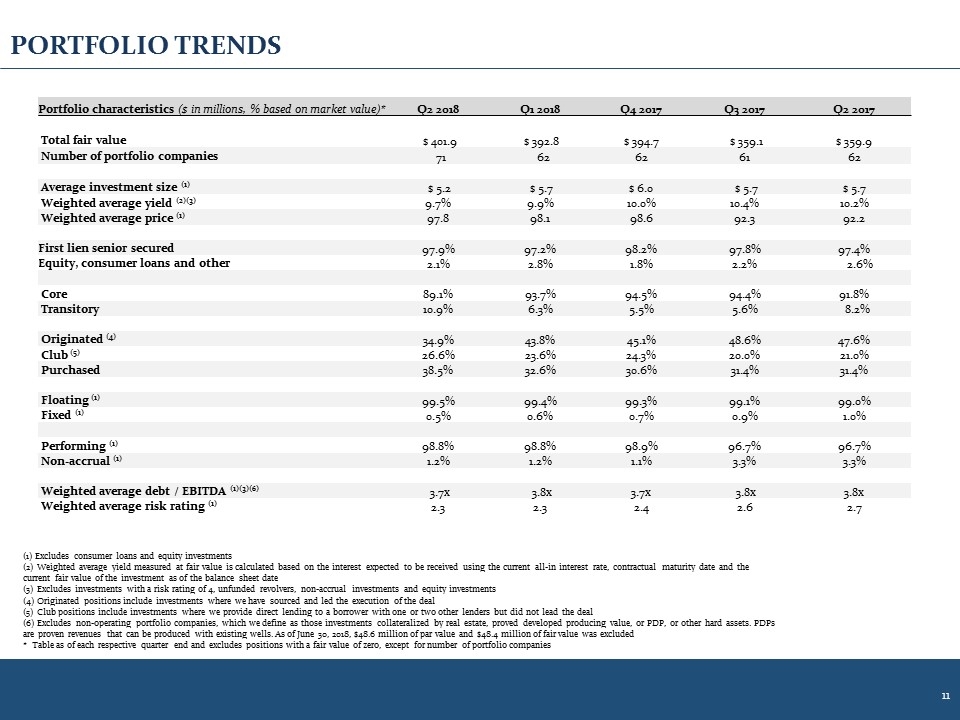
PORTFOLIO TRENDS Portfolio characteristics ($ in millions, % based on market value)* Q2 2018 Q1 2018 Q4 2017 Q3 2017 Q2 2017 Total fair value $ 401.9 $ 392.8 $ 394.7 $ 359.1 $ 359.9 Number of portfolio companies 71 62 62 61 62 Average investment size (1) $ 5.2 $ 5.7 $ 6.0 $ 5.7 $ 5.7 Weighted average yield (2)(3) 9.7% 9.9% 10.0% 10.4% 10.2% Weighted average price (1) 97.8 98.1 98.6 92.3 92.2 First lien senior secured 97.9% 97.2% 98.2% 97.8% 97.4% Equity, consumer loans and other 2.1% 2.8% 1.8% 2.2% 2.6% Core 89.1% 93.7% 94.5% 94.4% 91.8% Transitory 10.9% 6.3% 5.5% 5.6% 8.2% Originated (4) 34.9% 43.8% 45.1% 48.6% 47.6% Club (5) 26.6% 23.6% 24.3% 20.0% 21.0% Purchased 38.5% 32.6% 30.6% 31.4% 31.4% Floating (1) 99.5% 99.4% 99.3% 99.1% 99.0% Fixed (1) 0.5% 0.6% 0.7% 0.9% 1.0% Performing (1) 98.8% 98.8% 98.9% 96.7% 96.7% Non-accrual (1) 1.2% 1.2% 1.1% 3.3% 3.3% Weighted average debt / EBITDA (1)(3)(6) 3.7x 3.8x 3.7x 3.8x 3.8x Weighted average risk rating (1) 2.3 2.3 2.4 2.6 2.7 (1) Excludes consumer loans and equity investments (2) Weighted average yield measured at fair value is calculated based on the interest expected to be received using the current all-in interest rate, contractual maturity date and the current fair value of the investment as of the balance sheet date (3) Excludes investments with a risk rating of 4, unfunded revolvers, non-accrual investments and equity investments (4) Originated positions include investments where we have sourced and led the execution of the deal (5) Club positions include investments where we provide direct lending to a borrower with one or two other lenders but did not lead the deal (6) Excludes non-operating portfolio companies, which we define as those investments collateralized by real estate, proved developed producing value, or PDP, or other hard assets. PDPs are proven revenues that can be produced with existing wells. As of June 30, 2018, $48.6 million of par value and $48.4 million of fair value was excluded * Table as of each respective quarter end and excludes positions with a fair value of zero, except for number of portfolio companies
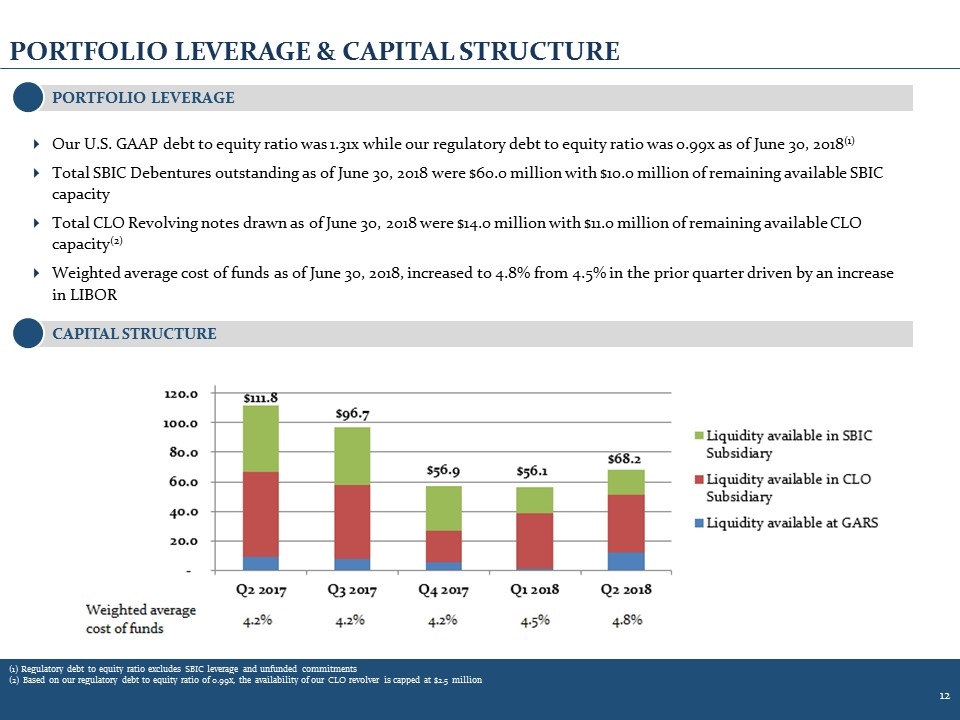
Our U.S. GAAP debt to equity ratio was 1.31x while our regulatory debt to equity ratio was 0.99x as of June 30, 2018(1) Total SBIC Debentures outstanding as of June 30, 2018 were $60.0 million with $10.0 million of remaining available SBIC capacity Total CLO Revolving notes drawn as of June 30, 2018 were $14.0 million with $11.0 million of remaining available CLO capacity(2) Weighted average cost of funds as of June 30, 2018, increased to 4.8% from 4.5% in the prior quarter driven by an increase in LIBOR PORTFOLIO LEVERAGE & CAPITAL STRUCTURE CAPITAL STRUCTURE PORTFOLIO LEVERAGE (1) Regulatory debt to equity ratio excludes SBIC leverage and unfunded commitments (2) Based on our regulatory debt to equity ratio of 0.99x, the availability of our CLO revolver is capped at $2.5 million
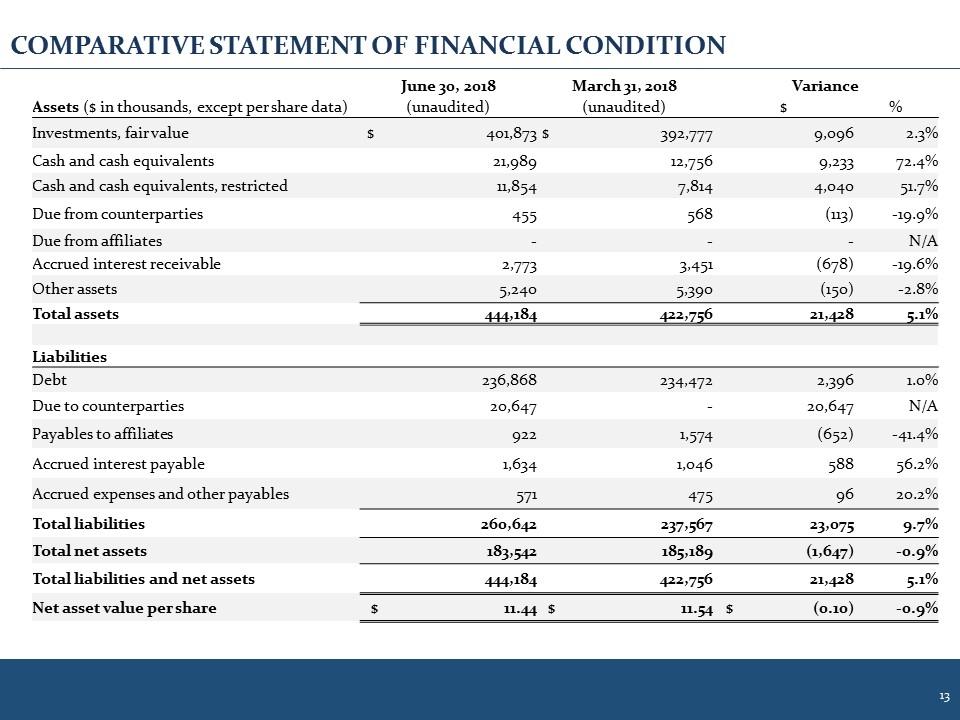
COMPARATIVE STATEMENT OF FINANCIAL CONDITION June 30, 2018 March 31, 2018 Variance Assets ($ in thousands, except per share data) (unaudited) (unaudited) $ % Investments, fair value $ 401,873 $ 392,777 9,096 2.3% Cash and cash equivalents 21,989 12,756 9,233 72.4% Cash and cash equivalents, restricted 11,854 7,814 4,040 51.7% Due from counterparties 455 568 (113) -19.9% Due from affiliates - - - N/A Accrued interest receivable 2,773 3,451 (678) -19.6% Other assets 5,240 5,390 (150) -2.8% Total assets 444,184 422,756 21,428 5.1% Liabilities Debt 236,868 234,472 2,396 1.0% Due to counterparties 20,647 - 20,647 N/A Payables to affiliates 922 1,574 (652) -41.4% Accrued interest payable 1,634 1,046 588 56.2% Accrued expenses and other payables 571 475 96 20.2% Total liabilities 260,642 237,567 23,075 9.7% Total net assets 183,542 185,189 (1,647) -0.9% Total liabilities and net assets 444,184 422,756 21,428 5.1% Net asset value per share $ 11.44 $ 11.54 $ (0.10) -0.9%
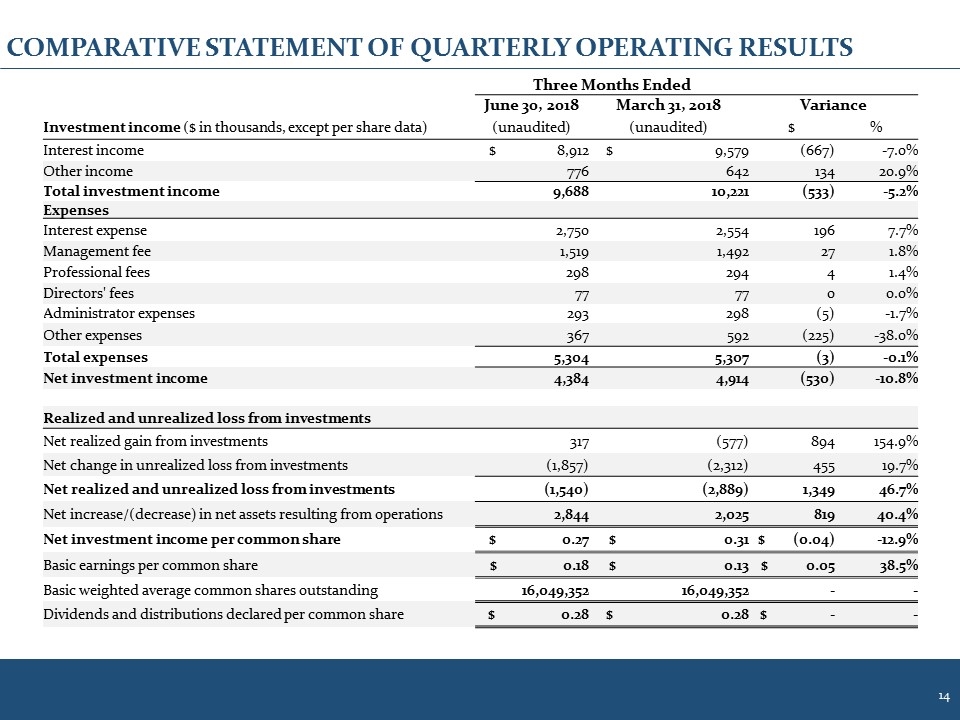
COMPARATIVE STATEMENT OF QUARTERLY OPERATING RESULTS Three Months Ended June 30, 2018 March 31, 2018 Variance Investment income ($ in thousands, except per share data) (unaudited) (unaudited) $ % Interest income $ 8,912 $ 9,579 (667) -7.0% Other income 776 642 134 20.9% Total investment income 9,688 10,221 (533) -5.2% Expenses Interest expense 2,750 2,554 196 7.7% Management fee 1,519 1,492 27 1.8% Professional fees 298 294 4 1.4% Directors' fees 77 77 0 0.0% Administrator expenses 293 298 (5) -1.7% Other expenses 367 592 (225) -38.0% Total expenses 5,304 5,307 (3) -0.1% Net investment income 4,384 4,914 (530) -10.8% Realized and unrealized loss from investments Net realized gain from investments 317 (577) 894 154.9% Net change in unrealized loss from investments (1,857) (2,312) 455 19.7% Net realized and unrealized loss from investments (1,540) (2,889) 1,349 46.7% Net increase/(decrease) in net assets resulting from operations 2,844 2,025 819 40.4% Net investment income per common share $ 0.27 $ 0.31 $ (0.04) -12.9% Basic earnings per common share $ 0.18 $ 0.13 $ 0.05 38.5% Basic weighted average common shares outstanding 16,049,352 16,049,352 - - Dividends and distributions declared per common share $ 0.28 $ 0.28 $ - -
GARRISON CAPITAL INC. 1290 Avenue of the Americas, 9th Floor New York, NY 10104 Tel: 212-372-9590 Fax: 212-372-9525 Contact Information CONTACT INFORMATION
