Attached files
| file | filename |
|---|---|
| 8-K - 8-K - TRUIST FINANCIAL CORP | form8k-investordeck_3q18.htm |

Investor Presentation Daryl N. Bible Third Quarter 2018

Forward-Looking Information This presentation contains "forward-looking statements" within the meaning of the Private Securities Litigation Reform Act of 1995, regarding the financial condition, results of operations, business plans and the future performance of BB&T. Forward-looking statements are not based on historical facts but instead represent management's expectations and assumptions regarding BB&T's business, the economy and other future conditions. Because forward-looking statements relate to the future, they are subject to inherent uncertainties, risks and changes in circumstances difficult to predict. BB&T's actual results may differ materially from those contemplated by the forward-looking statements. Words such as "anticipates," "believes," "estimates," "expects," "forecasts," "intends," "plans," "projects," "may," "will," "should," "could," and other similar expressions are intended to identify these forward-looking statements. Such statements are subject to factors that could cause actual results to differ materially from anticipated results. While there is no assurance any list of risks and uncertainties or risk factors is complete, important factors that could cause actual results to differ materially from those in the forward- looking statements include the following, without limitation, as well as the risks and uncertainties more fully discussed under Item 1A-Risk Factors in our Annual Report on Form 10-K for the year ended December 31, 2017 and in any of BB&T’s subsequent filings with the Securities and Exchange Commission: = general economic or business conditions, either nationally or regionally, may be less favorable than expected, resulting in, among other things, slower deposit and/or asset growth, and a deterioration in credit quality and/or a reduced demand for credit, insurance or other services; = disruptions to the national or global financial markets, including the impact of a downgrade of U.S. government obligations by one of the credit ratings agencies, the economic instability and recessionary conditions in Europe, the eventual exit of the United Kingdom from the European Union; = changes in the interest rate environment, including interest rate changes made by the Federal Reserve, as well as cash flow reassessments may reduce net interest margin and/or the volumes and values of loans and deposits as well as the value of other financial assets and liabilities; = competitive pressures among depository and other financial institutions may increase significantly; = legislative, regulatory or accounting changes, including changes resulting from the adoption and implementation of the Dodd-Frank Act may adversely affect the businesses in which BB&T is engaged; = local, state or federal taxing authorities may take tax positions that are adverse to BB&T; = a reduction may occur in BB&T's credit ratings; = adverse changes may occur in the securities markets; = competitors of BB&T may have greater financial resources or develop products that enable them to compete more successfully than BB&T and may be subject to different regulatory standards than BB&T; = cybersecurity risks could adversely affect BB&T's business and financial performance or reputation, and BB&T could be liable for financial losses incurred by third parties due to breaches of data shared between financial institutions; = higher-than-expected costs related to information technology infrastructure or a failure to successfully implement future system enhancements could adversely impact BB&T's financial condition and results of operations and could result in significant additional costs to BB&T; = natural or other disasters, including acts of terrorism, could have an adverse effect on BB&T, materially disrupting BB&T's operations or the ability or willingness of customers to access BB&T's products and services; = costs related to the integration of the businesses of BB&T and its merger partners may be greater than expected; = failure to execute on strategic or operational plans, including the ability to successfully complete and/or integrate mergers and acquisitions or fully achieve expected cost savings or revenue growth associated with mergers and acquisitions within the expected time frames could adversely impact financial condition and results of operations; = significant litigation and regulatory proceedings could have a material adverse effect on BB&T; = unfavorable resolution of legal proceedings or other claims and regulatory and other governmental investigations or other inquiries could result in negative publicity, protests, fines, penalties, restrictions on BB&T's operations or ability to expand its business and other negative consequences, all of which could cause reputational damage and adversely impact BB&T's financial conditions and results of operations; = risks resulting from the extensive use of models; = risk management measures may not be fully effective; = deposit attrition, customer loss and/or revenue loss following completed mergers/acquisitions may exceed expectations; and = widespread system outages, caused by the failure of critical internal systems or critical services provided by third parties, could adversely impact BB&T's financial condition and results of operations. Non-GAAP Information This presentation contains financial information and performance measures determined by methods other than in accordance with accounting principles generally accepted in the United States of America ("GAAP"). BB&T's management uses these "non-GAAP" measures in their analysis of the Corporation's performance and the efficiency of its operations. Management believes these non-GAAP measures provide a greater understanding of ongoing operations, enhance comparability of results with prior periods and demonstrate the effects of significant items in the current period. The company believes a meaningful analysis of its financial performance requires an understanding of the factors underlying that performance. BB&T's management believes investors may find these non-GAAP financial measures useful. These disclosures should not be viewed as a substitute for financial measures determined in accordance with GAAP, nor are they necessarily comparable to non-GAAP performance measures that may be presented by other companies. Below is a listing of the types of non-GAAP measures used in this presentation: = The adjusted efficiency ratio is non-GAAP in that it excludes securities gains (losses), amortization of intangible assets, merger-related and restructuring charges and other selected items. BB&T's management uses this measure in their analysis of the Corporation's performance. BB&T's management believes this measure provides a greater understanding of ongoing operations and enhances comparability of results with prior periods, as well as demonstrates the effects of significant gains and charges. = Tangible common equity and related measures are non-GAAP measures that exclude the impact of intangible assets and their related amortization. These measures are useful for evaluating the performance of a business consistently, whether acquired or developed internally. BB&T's management uses these measures to assess the quality of capital and returns relative to balance sheet risk and believes investors may find them useful in their analysis of the Corporation. = Core net interest margin is a non-GAAP measure that adjusts net interest margin to exclude the impact of purchase accounting. The interest income and average balances for PCI loans are excluded in their entirety as the accounting for these loans can result in significant and unusual trends in yields. The purchase accounting marks and related amortization for a) securities acquired from the FDIC in the Colonial acquisition and b) non-PCI loans, deposits and long-term debt acquired from Susquehanna and National Penn are excluded to approximate their yields at the pre-acquisition rates. BB&T's management believes the adjustments to the calculation of net interest margin for certain assets and liabilities acquired provide investors with useful information related to the performance of BB&T's earning assets. = The adjusted diluted earnings per share is non-GAAP in that it excludes merger-related and restructuring charges and other selected items, net of tax. BB&T's management uses this measure in their analysis of the Corporation's performance. BB&T's management believes this measure provides a greater understanding of ongoing operations and enhances comparability of results with prior periods, as well as demonstrates the effects of significant gains and charges. = The adjusted operating leverage ratio is non-GAAP in that it excludes securities gains (losses), amortization of intangible assets, merger-related and restructuring charges and other selected items. BB&T's management uses this measure in their analysis of the Corporation's performance. BB&T's management believes this measure provides a greater understanding of ongoing operations and enhances comparability of results with prior periods, as well as demonstrates the effects of significant gains and charges. = The adjusted performance ratios are non-GAAP in that they exclude merger-related and restructuring charges and, in the case of return on average tangible common shareholders' equity, amortization of intangible assets. BB&T's management uses these measures in their analysis of the Corporation's performance. BB&T's management believes these measures provide a greater understanding of ongoing operations and enhances comparability of results with prior periods, as well as demonstrates the effects of significant gains and charges. = The adjusted net interest margin is a non-GAAP measure in that it estimates the impact on taxable-equivalent net interest income as if the tax reform legislation had not been enacted. BB&T's management believes this measure provides a greater understanding of ongoing operations and enhances comparability of results with prior periods, as well as demonstrates the effects of tax reform. A reconciliation of these non-GAAP measures to the most directly comparable GAAP measure is included in the Appendix. Capital ratios are preliminary.

Well-Positioned for the Future . Differentiated businesses driving top-tier operating performance . Diversification produces stable, consistent and growing earnings . Achieving targeted cost savings / intense focus on expenses . “Disrupt or Die” – investing in our company . Client first mentality . Achieving positive operating leverage . Committed to a strong and consistently growing dividend and a strong TSR . Strong, conservative credit culture . Vision, Mission and Values 3

BB&T Corporation: A Growing Franchise 8th Largest U.S. Financial Institution1 # of Deposits1 Deposit State Branches3 ($bn) Rank North Carolina2 319 $29.6 2 Virginia 303 23.2 4 Florida 288 18.0 7 Pennsylvania 232 13.7 6 Georgia 141 12.0 5 Maryland 152 10.0 6 South Carolina 99 8.1 3 Texas 115 6.3 14 Kentucky 93 5.7 4 West Virginia 63 5.3 1 Alabama 75 3.9 6 Tennessee 42 2.7 8 New Jersey 28 2.0 16 District of 12 1.3 9 Columbia Indiana 2 NM NM Ohio 3 NM NM Total # of Branches 1,967 1 Deposit market share data as of 06/30/2017 3 Branch totals as of 06/30/2018 4 2 Excludes home office deposits Source: FactSet, FDIC, S&P Global

Diversification Drives Revenue and Productivity Superior Performance… PPNR/average assets 10-year average (2Q08 – 1Q18) Revenue Diversification by Segment* Insurance Holdings & Community Premium Bank – Retail 2.0% Finance 44% 1.6% 1.6% 17% BB&T National Largest Peers 4 Banks …With Less Volatility PPNR/average assets 10-year standard deviation (2Q08 – 1Q18) Financial Services & Commercial Finance 0.6% 17% 0.4% 0.3% Community Bank - Commercial National Largest 4 22% BB&T Peers Banks * Based on segment revenues, excluding other, treasury and corporate for the year-to-date period ended 06/30/2018 PPNR data per S&P Global as of 03/31/18 National peer group: CFG, CMA, FITB, HBAN, KEY, MTB, PNC, RF, STI, USB, WFC and ZION 5 Largest 4 BHCs: BAC, C, JPM, WFC

Our Differentiating Businesses Diversification and Execution 6

Strategic Advantage The BB&T Leadership Institute The BB&T Leadership Institute provides organizations with a leadership development partner that helps create dynamic and effective leaders, increase employee retention and improve the bottom line. Beginning with each client's specific goals and challenges, the institute’s consultants identify the best approaches to address a company's needs and tailor offerings to individual executives, teams or both. . Services include – Leadership development – Team optimization – Talent services – Change management – Engagement Visit us online at www.bbtleadershipinstitute.com or email leadershipinstitute@bbandt.com 7
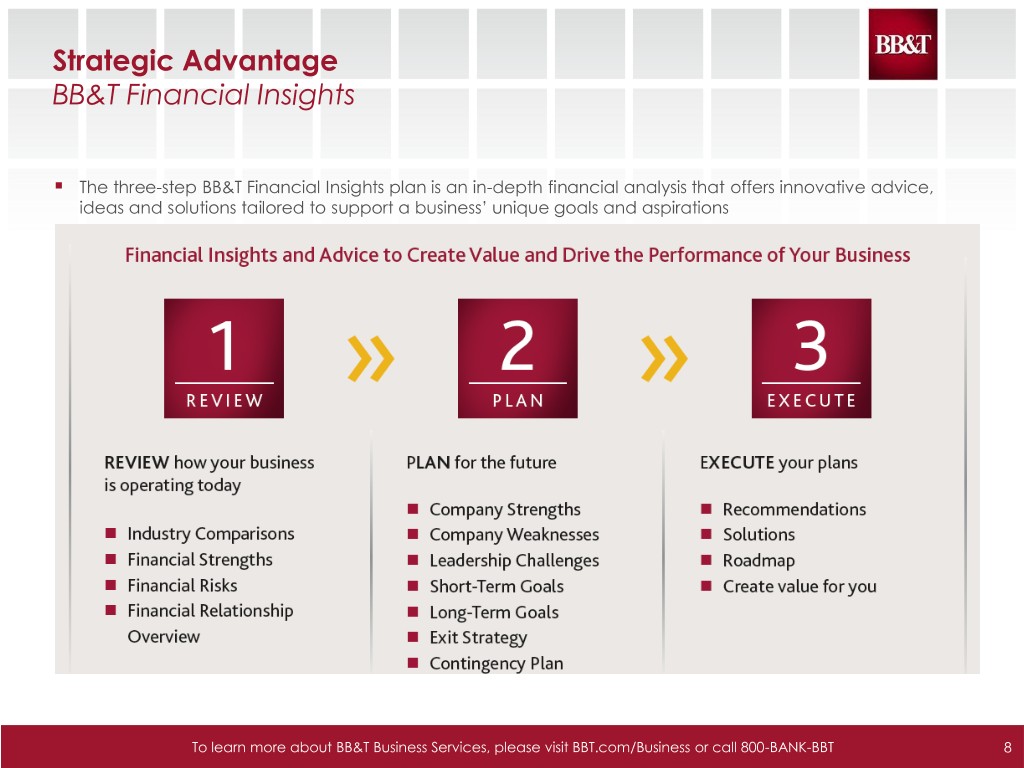
Strategic Advantage BB&T Financial Insights . The three-step BB&T Financial Insights plan is an in-depth financial analysis that offers innovative advice, ideas and solutions tailored to support a business’ unique goals and aspirations To learn more about BB&T Business Services, please visit BBT.com/Business or call 800-BANK-BBT 8

2018 Represents an Inflection Point 9

Investing in Our Businesses: Disrupt or Die Rationalize / Increased branch closures improve risk (148 in 2017 and 160-170 in 2018) management Optimize systems branch Voice of the Client Consistent network Substantially Small Business focus FTE reductions positive increase digital operating client services Enhance “U” No new major leverage and marketing systems projects Large increase in social media and advertising New branch Renew focus on A.I. products commercial and Reconceptualizing Restructure and strategies retail Our and digitize Robotics Regional Presidents community Businesses support drive commercial bank services strategies and IRM Agile DevOps Corporate Robotics process Improve improvements Insurance Increase Sheffield profitability and national grow faster lending Mortgage IRM (organic & Expand wealth businesses CRE acquisitions) and fee businesses Equipment Finance Asset management and IRM brokerage 10
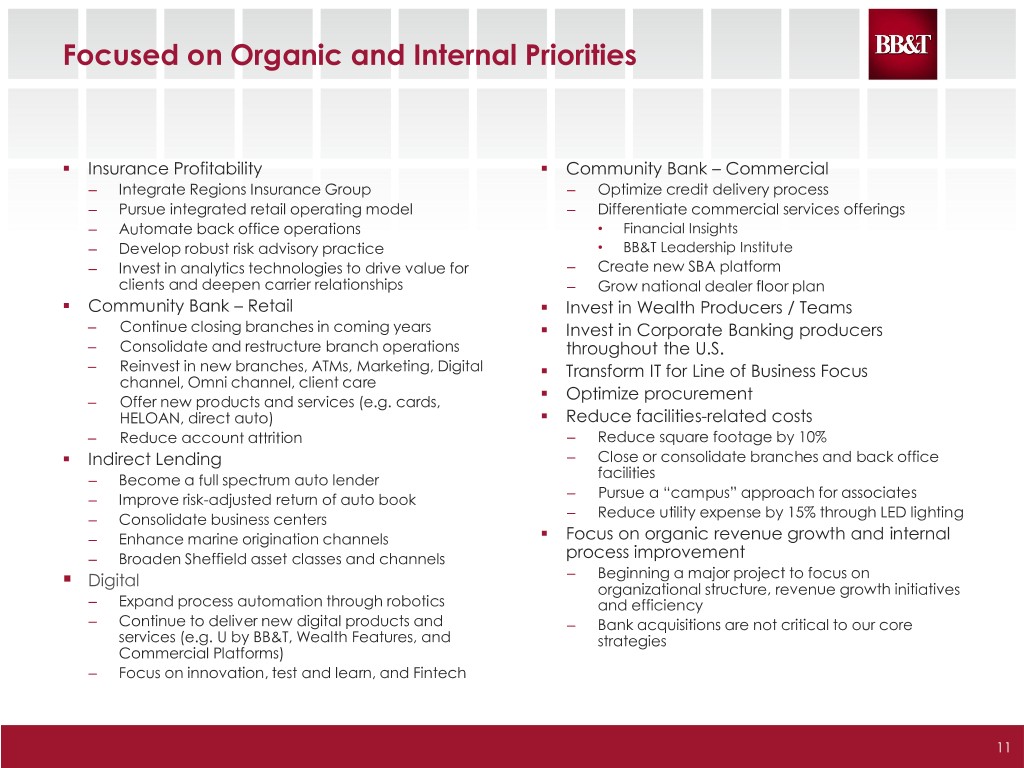
Focused on Organic and Internal Priorities . Insurance Profitability . Community Bank – Commercial – Integrate Regions Insurance Group – Optimize credit delivery process – Pursue integrated retail operating model – Differentiate commercial services offerings – Automate back office operations • Financial Insights – Develop robust risk advisory practice • BB&T Leadership Institute – Invest in analytics technologies to drive value for – Create new SBA platform clients and deepen carrier relationships – Grow national dealer floor plan . Community Bank – Retail . Invest in Wealth Producers / Teams – Continue closing branches in coming years . Invest in Corporate Banking producers – Consolidate and restructure branch operations throughout the U.S. – Reinvest in new branches, ATMs, Marketing, Digital . Transform IT for Line of Business Focus channel, Omni channel, client care . Optimize procurement – Offer new products and services (e.g. cards, . HELOAN, direct auto) Reduce facilities-related costs – Reduce account attrition – Reduce square footage by 10% . Indirect Lending – Close or consolidate branches and back office – Become a full spectrum auto lender facilities – Improve risk-adjusted return of auto book – Pursue a “campus” approach for associates – Reduce utility expense by 15% through LED lighting – Consolidate business centers . – Enhance marine origination channels Focus on organic revenue growth and internal – Broaden Sheffield asset classes and channels process improvement . Digital – Beginning a major project to focus on organizational structure, revenue growth initiatives – Expand process automation through robotics and efficiency – Continue to deliver new digital products and – Bank acquisitions are not critical to our core services (e.g. U by BB&T, Wealth Features, and strategies Commercial Platforms) – Focus on innovation, test and learn, and Fintech 11

Focused on…Reducing Expenses . FTE reductions . Back office consolidation . Continued rationalization of branch network and corresponding reinvestment strategies – 148 branches closed in 2017 – 160-170 branches to be closed in 2018 • Developing prospective 5 year optimization and reinvestment plan – ATM-infrastructure, enhanced capabilities and refurbishment/replacement – Care centers-virtual banking centers with enhanced capabilities and proactive outreach – Increase multi-channel marketing initiative investments-media, digital and direct mail – De Novo branches-strategically identify opportunities for additions of branches; more technology focused with enhanced digital capabilities . Robotic Process Automation . Energy-efficient investments 12

Digital Performance Online Account Opening Percentage of Total Bank Production* Accolades Retail Checking Retail Savings Business Checking Bankcard Mortgage 7%7% 15% 6% 17%19% 21%21% 26%27% iOS Mobile App Rating 4.8 †† 20% -34% 14% 32% 70% *YTD 2018, Unit Sales Growth YOY Digital Users† Android Mobile App Rating App 4.3 751K †† Digital Users YOY Growth 2.96MM Browser App Active Digital Users 2018 Dynatrace Browser Browser & App -5% 18% Q1 Mobile Banker Scorecard 1.44MM 767K Top 3 Mobile App Top 5 Mobile Browser †June 2018 U Web, U Mobile, Small Business, OLB Mobile Check Deposit Activity Zelle Activity 2017 S&P Global Market Intelligence Month 390k 263k Top 5 Mobile App Number 282k 2017 Javelin (Thousands) Total 43k Online Banking Contender Dec-17 Mar-18 Jun-18 Total DepositsTotalPer Jun-17 Sep-17 Dec-17 Mar-18 Jun-18 Outgoing)and (Incoming ††June 2018 11% of app clients use MCD†† 4.3% of digital clients use Zelle †† 13

BB&T’s Primary Focus is Organic Growth; However, Acquisitions May Be Considered That Benefit BB&T’s Shareholders . Strategic Fit: Quality institution, generally in the $20 billion to $30 billion asset size range . Culture: Target’s culture must be compatible with BB&T’s culture . Risk Appetite: Consistent with BB&T’s risk appetite . Funding: Strong core deposit funded client base . Synergies: Favor in-market transaction with a high percentage of cost savings – 30% - 50% . Financial Criteria: – EPS accretive, excluding merger-related costs, within the first full year – IRR of 15% or better; terminal valuation consistent with current valuation – Tangible Book Value accretive within approximate 3 year earn-back period1 1 Earn-back period defined using the crossover method 14
Client First Strategy 15

Enterprise “Voice of the Client” Program Launched enterprise-wide VOC program in 2018 that provides near real-time aggregate and granular client feedback on a digital platform across multiple lines and multiple channels. VOC program enables dynamic data analytics that is leveraged to support the ongoing delivery of the “Perfect Client Experience”. . Provides near real-time reporting tools for up-to-the minute insights . Constantly gather client feedback and allows client care specialist to immediately respond to unresolved client opportunities . Delivers persistent and dynamic feedback for coaching associates . Aggregates and analyzes collected feedback . Delivers transformative client insights to quickly and effectively identify emerging trends . Ensures our relentless pursuit of client experience distinction 16

Client First Solutions Established Client First Council with the Chief Client Experience Officer as the Executive Sponsor Six Sigma like team dedicated daily to discover, uncover and dissolve multi-channel client and associate challenges related to the client experience Driven to eliminate client friction and effort by incorporating immediate needed changes or enhancements with policy, process, and/or product Extreme enterprise level focus across all business lines Continuous improvements driving towards client experience distinction 17

Virtual Banking Center (VBC) VBC Objective: Enhance and deepen client relationships to improve client retention, expand household product penetration, ultimately resulting in increased revenue generation. Service to Sales Model The Virtual Banking Center Servicing clients who are a Interacting with digital Financial Checkups are used (VBC) proactively reaches longer distance from the centric clients and to inquire, discover and solve out by phone or digitally to branch (i.e. West Texas) educating non-digital client’s financial needs by engage clients who prefer to centric clients on how to providing the right financial interact with us through our interact with digital products solutions to ultimately virtual channels (i.e. OLB client not using improve the client’s financial BillPay) well-being 18

Maintaining a strong, conservative credit culture
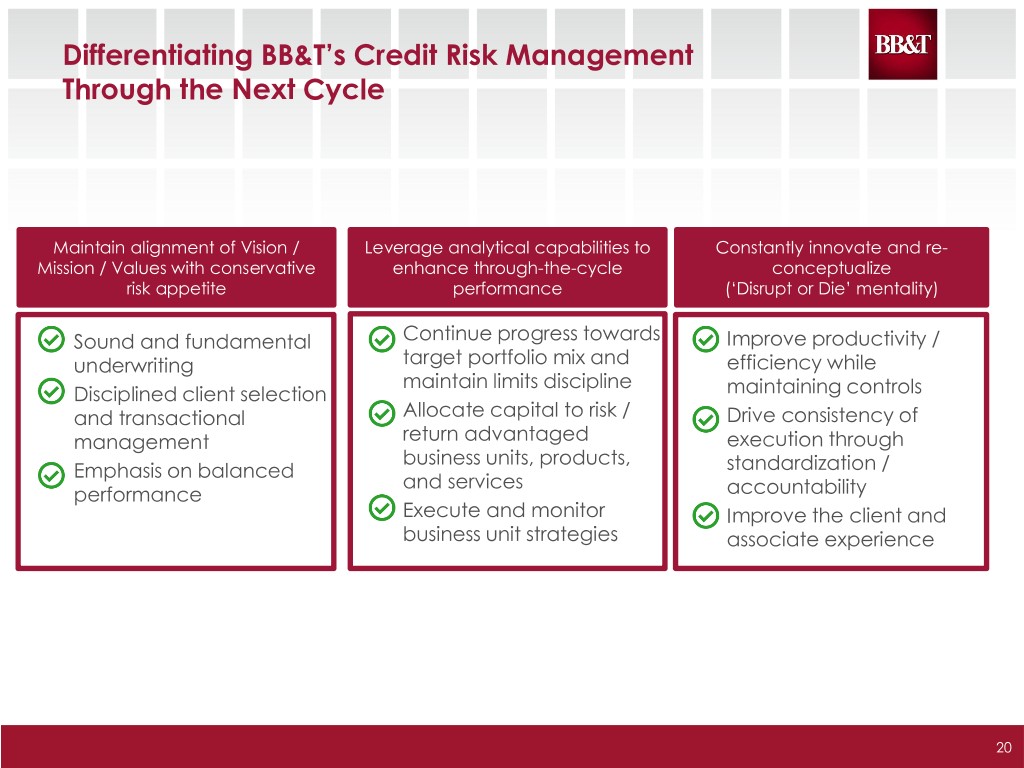
Differentiating BB&T’s Credit Risk Management Through the Next Cycle Maintain alignment of Vision / Leverage analytical capabilities to Constantly innovate and re- Mission / Values with conservative enhance through-the-cycle conceptualize risk appetite performance (‘Disrupt or Die’ mentality) Continue progress towards Sound and fundamental Improve productivity / underwriting target portfolio mix and efficiency while maintain limits discipline Disciplined client selection maintaining controls and transactional Allocate capital to risk / Drive consistency of management return advantaged execution through business units, products, Emphasis on balanced standardization / and services performance accountability Execute and monitor Improve the client and business unit strategies associate experience 20

BB&T’s Loan Portfolio Consistently Outperformed Over Multiple Cycles… Risk Adjusted Loan Yield % (Yield – NCO) Risk Adjusted Loan Yield % (Yield – NCO) 14% 14% Tightening of peer performance 12% 12% occurred at ‘peak’ 10% 10% of last cycle BB&T Consistently All-time tightest 8% 8% Higher range for peers 6% 6% 4% 4% 2% 2% 0% 0% 3/1/1990 7/1/1991 3/1/1994 7/1/1999 3/1/2002 7/1/2007 3/1/2010 7/1/2015 3/1/2018 7/1/1995 3/1/1998 7/1/2003 3/1/2006 7/1/2011 3/1/2014 3/1/1990 7/1/1991 3/1/1998 7/1/1999 3/1/2002 7/1/2003 3/1/2006 3/1/2010 7/1/2011 7/1/2015 3/1/2018 3/1/1994 7/1/1995 7/1/2007 3/1/2014 11/1/1996 11/1/2004 11/1/2012 11/1/1992 11/1/2000 11/1/2008 11/1/2016 11/1/1992 11/1/1996 11/1/2004 11/1/2008 11/1/2012 11/1/2016 11/1/2000 Loan Yield % 15% Loan Yield % 15% 13% 13% 11% 11% 9% BB&T Consistently 9% Higher All-time tightest 7% 7% range for peers 5% 5% 3% 3% 3/1/1990 8/1/1991 1/1/1993 6/1/1994 4/1/1997 9/1/1998 2/1/2000 7/1/2001 5/1/2004 3/1/2007 8/1/2008 1/1/2010 6/1/2011 4/1/2014 9/1/2015 2/1/2017 3/1/1990 7/1/1991 3/1/1994 3/1/1998 3/1/2002 3/1/2006 7/1/2007 3/1/2010 7/1/2011 7/1/2015 7/1/1995 7/1/1999 7/1/2003 3/1/2014 3/1/2018 11/1/1995 12/1/2002 10/1/2005 11/1/2012 11/1/1992 11/1/1996 11/1/2000 11/1/2004 11/1/2008 11/1/2012 11/1/2016 BB&T Peer Average Recession BB&T Range of Peer results 21

BB&T’s Consistent and Superior Risk / Return Positioning (BB&T Risk / Return Positioning vs Peers (2014 DFAST) (BB&TBB&T Risk / ReturnRisk / PositioningReturn Positioning vs Peers (2018 vs DFAST)Peers (2018 DFAST) 2.25% (Higher Return, (Higher Return, Lower Risk) (Higher Return, (Higher Return, Lower Risk) 2.25% Higher Risk) Higher Risk) USB MTB 2.00% 2.00% MTB FITB BBT 1.75% 1.75% FITB USB BBT Average Return PNC PNC 1.50% 1.50% HBAN KEY Average Return STI WFC RF 1.25% HBAN KEY 1.25% CFG % Return% CMA STI Return% 1.00% ZION 1.00% 0.75% 0.75% RF (Lower Return, Higher RiskAverage (Lower Return, Lower Risk) (Lower Return, Average Average Risk Risk) (Lower Return, Lower Risk) Higher Risk) 0.50% 0.50% 2013 Actual PPNR Less 2013 Actual Loss Rate LossActual 2013Less PPNR2013Actual 1.0% 1.5% 2.0% 2.5% 3.0% Rate LossActual Less2017 PPNR2017Actual 1.0% 1.5% 2.0% 2.5% 3.0% % Risk % Risk (Difference between FRB Severely Adverse Stress Loss Rate and 2013 Actual Loss Rate (Difference between FRB Severely Adverse Stress Loss Rate and 2017Actual Loss Rate) Source: S&P Global, Dodd-Frank Act Stress Test 2018: Supervisory Stress Test Methodology and Results 22

CCAR 2018 vs 2017: More Resilient Capital Under Stress 158 22 55 Change to Minimum CET1 – CCAR 2018 Change to Minimum CET1 – CCAR 2017 252 184 USB BBT HBAN STI FITB PNC KEY CFG WFC RF MTB USB HBAN CMA WFC BBT KEY FITB STI PNC MTB CFG RF ZION 18 0.0% 0.0% -1.0% 161 -1.0% 146 -2.0% 141 -2.0% -3.0% 64 -3.0% 64 -4.0% 64 -4.0% -5.0% 179 -5.0% 161 -6.0% 198 -7.0% -6.0% 241 241 241 23
Second quarter performance recap

2018 Second Quarter Performance Highlights1 Record net income GAAP efficiency NPA ratio available to common ratio was 59.7% was 0.28% a shareholders totaled adjusted decrease of 3 bps vs. 2Q17 $775 million, efficiency ratio up 22.8% vs. 2Q17 was 57.4% in 2Q18 Diluted EPS Increased was a record Achieved the common positive operating $0.99, up 28.6% vs. dividend 8.0% leverage vs. 2Q17 2Q17 10 1 Includes non-GAAP measures; refer to non-GAAP reconciliation in the attached Appendix for adjusted measures 25

BB&T is Defined by Top-Tier Performance Return on Average Tangible Return on Average Assets NPAs / Assets Common Equity #4 out of 13 #2 out of 13 #1 out of 13 1.60% 0.60% 24.00% 1.52% BB&T GAAP = 1.49% BB&T GAAP = 19.78% 1.42% 0.50% 20.21% 1.40% 0.46% 20.00% 0.40% 16.31% 1.20% 16.00% 0.30% 0.28% 1.00% 0.20% 12.00% BBT Peer Average BBT Peer Average BBT Peer Average Net Interest Margin Efficiency Ratio Fee Income Ratio #4 out of 13 #4 out of 13 #3 out of 13 3.60% 59.0% 45.0% BB&T GAAP = 59.7% 3.45% 42.5% 42.5% 3.40% 58.0% 3.28% 58.0% 40.0% 3.20% 57.4% 37.5% 36.8% 3.00% 57.0% 35.0% BBT Peer Average BBT Peer Average BBT Peer Average 15 As of / for the quarter ended 06/30/2018 Peers include CFG, CMA, FITB, KEY, MTB, PNC, RF, STI, USB and WFC ROA, ROTCE, and Efficiency are adjusted measures; HBAN and ZION 2Q data not available at time of preparation 26 See non-GAAP reconciliations in the attached appendix Source: S&P Global and company reports

Noninterest-bearing Deposit Growth vs. Peers 158 22 55 252 NIB DDA Growth (LQA) NIB DDA Growth (Like) 184 8.00% 6.00% 18 4.30% 4.00% 161 4.00% 146 2.60% 141 2.00% 0.00% 64 64 0.00% 64 -4.00% 179 -2.00% 161 198 -8.00% -4.00% 241 241 -12.00% 241 -6.00% -16.00% -8.00% BBT BBT Peer1 Peer2 Peer3 Peer4 Peer5 Peer6 Peer7 Peer8 Peer1 Peer2 Peer3 Peer4 Peer5 Peer6 Peer8 Peer9 Peer9 Peer7 Peer10 Peer10 Peer11 Peer12 Peer11 Peer12 27
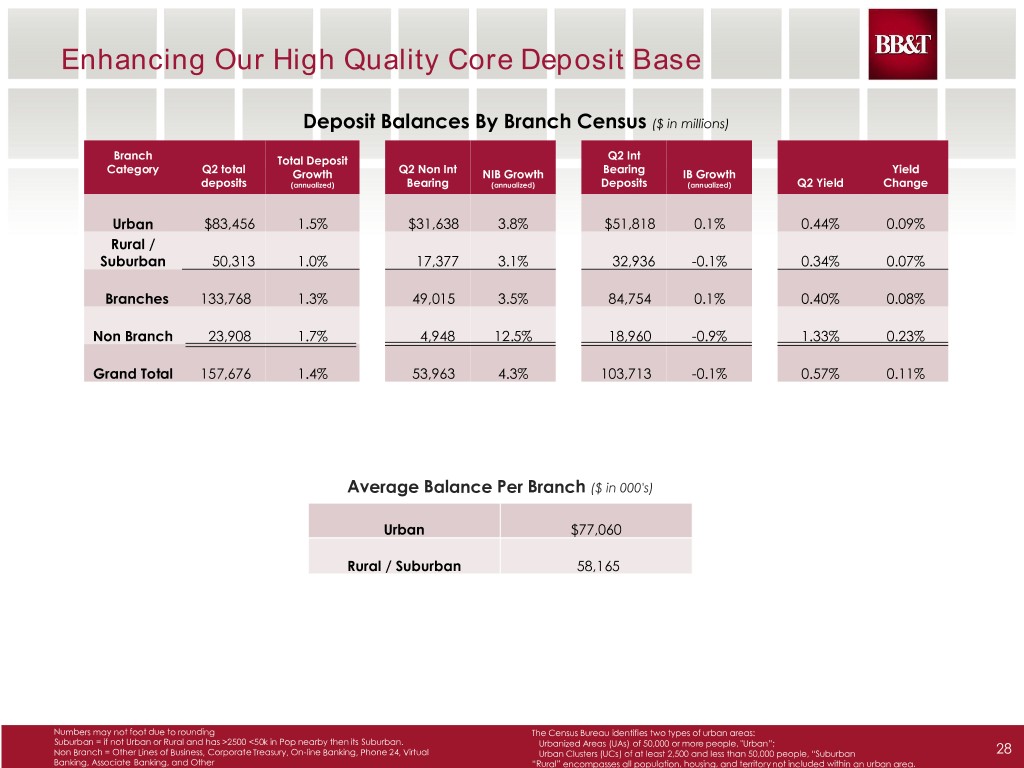
Enhancing Our High Quality Core Deposit Base 158 22 Deposit Balances By Branch Census ($ in millions) 55 Branch Total Deposit Q2 Int Category Q2 total Growth Q2 Non Int NIB Growth Bearing IB Growth Yield 252 deposits (annualized) Bearing (annualized) Deposits (annualized) Q2 Yield Change 184 18 Urban $83,456 1.5% $31,638 3.8% $51,818 0.1% 0.44% 0.09% Rural / 161 Suburban 50,313 1.0% 17,377 3.1% 32,936 -0.1% 0.34% 0.07% 146 141 Branches 133,768 1.3% 49,015 3.5% 84,754 0.1% 0.40% 0.08% Non Branch 23,908 1.7% 4,948 12.5% 18,960 -0.9% 1.33% 0.23% 64 64 Grand Total 157,676 1.4% 53,963 4.3% 103,713 -0.1% 0.57% 0.11% 64 179 161 198 Average Balance Per Branch ($ in 000's) 241 241 Urban $77,060 241 Rural / Suburban 58,165 Numbers may not foot due to rounding The Census Bureau identifies two types of urban areas: Suburban = if not Urban or Rural and has >2500 <50k in Pop nearby then its Suburban. Urbanized Areas (UAs) of 50,000 or more people, "Urban”; Non Branch = Other Lines of Business, Corporate Treasury, On-line Banking, Phone 24, Virtual Urban Clusters (UCs) of at least 2,500 and less than 50,000 people, “Suburban 28 Banking, Associate Banking, and Other “Rural” encompasses all population, housing, and territory not included within an urban area.

3Q18 and Full-year 2018 Outlook Category 3Q18 Average total loans Up 4% - 6% annualized vs. 2Q18 Credit quality NCOs expected to be 35 - 45 bps Net interest margin GAAP and core margins up slightly vs. 2Q18 Noninterest income3 Up 3% - 5% vs. 3Q17 Expenses1,3 Up 1% - 3% vs. 3Q17 Effective tax rate 20% Category Full-year 2018 Average total loans Up 1% - 3% vs. 2017 Revenue2,3 Up 1% - 3% vs. 2017 Expenses1,3 Flat vs. 2017 Effective tax rate 20% - 21% 1 Excludes merger-related and restructuring charges and selected items listed on page 16 of the Quarterly Performance Summary 2 Taxable-equivalent 29 3 Includes Regions Insurance Group

Our Long-Term Performance Advantage

Long-term Performance Advantage 4.25% Net Interest Margin 3.75% 3.68% 3.46% 3.45% 3.42% 3.39% 3.32% 3.28% 3.28% 3.25% 3.15% 3.09% 2.98% 2.95% 2.75% 2013 2014 2015 2016 2017 1H18 BBT Peers Reflects fully taxable-equivalent Peers include CFG, CMA, FITB, HBAN, KEY, MTB, PNC, RF, STI, USB, WFC and ZION 31 Source: S&P Global

Long-term Performance Advantage Efficiency Ratio 70.0% 65.8% 65.2% 65.0% 63.4% 62.8% 62.5% 62.3% 63.1% 61.6% 59.9% 60.3% 59.8% 59.5% 60.0% 59.2% 59.7% 58.1% 57.8% 58.0% 57.4% 55.0% 2013 2014 2015 2016 2017 1H18 BBT GAAP BBT Adjusted Peers Source: S&P Global and company reports Peers include CFG, CMA, FITB, HBAN, KEY, MTB, PNC, RF, STI, USB, WFC and ZION 32 See non-GAAP reconciliations included in the attached Appendix

Long-term Performance Advantage Return on Equity 19.57% 19.00% 16.26% 16.00% 14.68% 14.59% 13.99% 13.65% 13.34% 13.00% 13.69% 11.62% 11.53% 11.85% 11.07% 10.97% 11.59% 9.92% 10.00% 9.32% 8.71% 8.57% 8.07% 8.25% 9.11% 8.34% 8.23% 7.00% 7.88% 2013 2014 2015 2016 2017 1H18 BBT ROCE BBT ROTCE Peers ROCE Peers ROTCE Source: S&P Global Peers include CFG, CMA, FITB, HBAN, KEY, MTB, PNC, RF, STI, USB, WFC and ZION 33
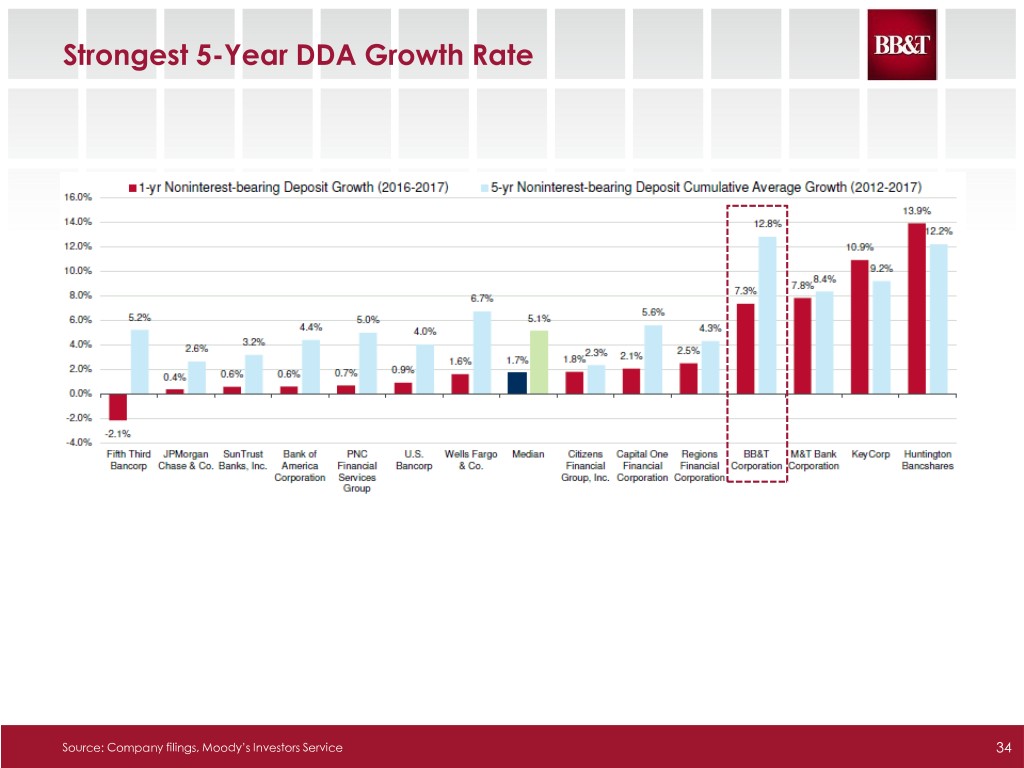
Strongest 5-Year DDA Growth Rate Source: Company filings, Moody’s Investors Service 34

BB&T Has Seen the Strongest Shift in Deposit Mix 158 22 55 252 184 2012Y 2Q18 Change in Deposit Composition 18 Non-Interest Bearing Deposit Composition (%) Non-Interest Bearing Deposit Composition (%) MRQ vs. 2012Y (% Points) 161 CMA 42 CMA 53 BBT 12 146 ZION ZION CMA 141 38 45 10 MTB 35 RF 38 RF 7 64 KEY 33 MTB 35 ZION 7 64 64 FITB 32 BBT 34 WFC 0 RF 31 FITB 32 FITB (0) 179 161 PNC 31 PNC 29 MTB (0) 198 STI 29 KEY 29 HBAN (1) 241 USB 29 WFC 28 PNC (1) 241 241 WFC 28 STI 27 CFG (2) HBAN 27 HBAN 26 STI (2) CFG 27 CFG 25 KEY (3) BBT 23 USB 24 USB (5) 0 20 40 60 0 20 40 60 (8) (4) 0 4 8 12 Source: S&P Global 35

Our Commitments

To make the world a better place to live by: . Helping our CLIENTS achieve economic success and financial security; . Creating a place where our ASSOCIATES can learn, grow and be fulfilled in their work; . Making the COMMUNITIES in which we work better places to be; and thereby: . Optimizing the long-term return to our SHAREHOLDERS, while providing a safe and sound investment. 37 37
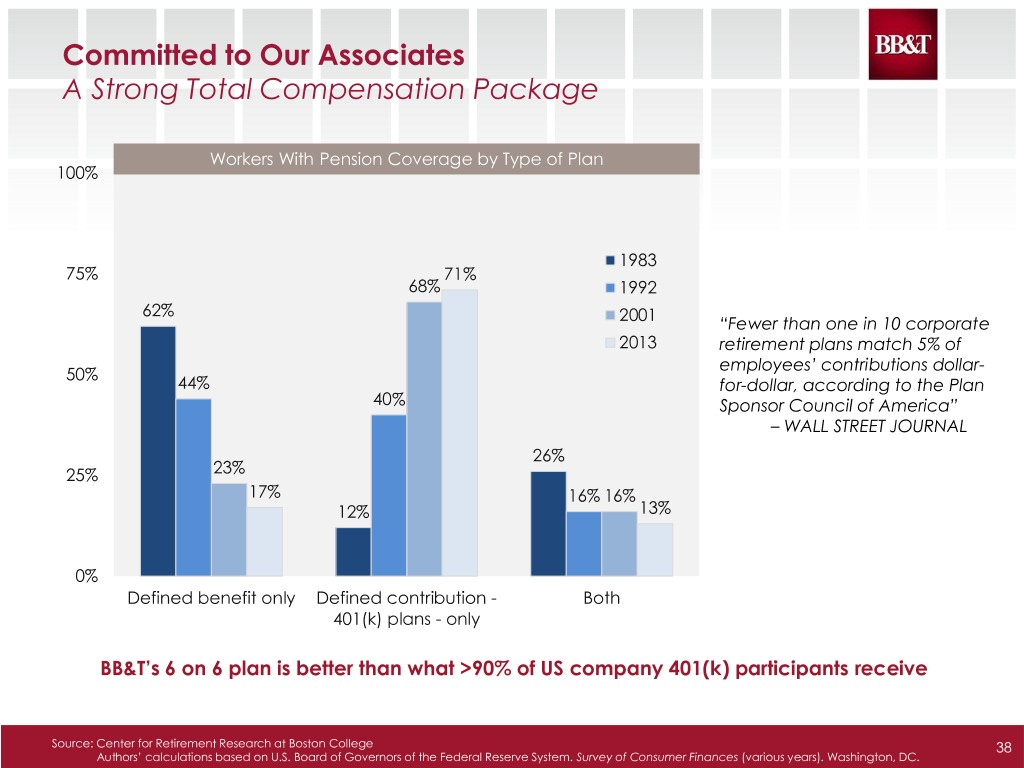
Committed to Our Associates A Strong Total Compensation Package Workers With Pension Coverage by Type of Plan 100% 1983 75% 71% 68% 1992 62% 2001 “Fewer than one in 10 corporate 2013 retirement plans match 5% of employees’ contributions dollar- 50% 44% for-dollar, according to the Plan 40% Sponsor Council of America” – WALL STREET JOURNAL 26% 25% 23% 17% 16% 16% 12% 13% 0% Defined benefit only Defined contribution - Both 401(k) plans - only BB&T’s 6 on 6 plan is better than what >90% of US company 401(k) participants receive Source: Center for Retirement Research at Boston College 38 Authors’ calculations based on U.S. Board of Governors of the Federal Reserve System. Survey of Consumer Finances (various years). Washington, DC.

Committed to Our Communities Lighthouse Project . Since 2009 we have completed more than 10,000 community service projects, provided more than 500,000 volunteer hours, and helped change the lives of more than 15 million people 39

Committed to Our Shareholders Top Tier Dividend Yield Dividend Yield as of 07/31/2018 4.00% 3.63% 3.50% 3.26% 3.19% 3.01% 3.00% 3.00% 2.71% Peer Median: 2.62% 2.55% 2.48% 2.43% 2.50% 2.32% 2.26% 2.22% 2.00% 1.85% 1.50% 1.00% 0.50% 0.00% HBAN KEY BBT RF WFC CFG PNC CMA FITB ZION USB STI MTB Source: Nasdaq IR 40

Committed to Corporate Social Responsibility Environmental Sustainability . Bank-wide facilities initiatives Corporate paper recycling Many departments working towards paperless goals Purchase of copy paper recycled using sustainable forestry practices Environmentally-friendly janitorial cleaning products Targeting a 25% reduction in energy usage within 5 years Targeting a 10% reduction in water usage within 5 years 15.8MM lbs of Paper Recycled 11.4MM lbs 31,555 Cubic Yards CO2 Avoided Landfill Space Conserved 132,634 216.6MM Trees gallons Preserved Water Saved 17.9MM kWh Electricity Saved 41

BB&T’s Credit Ratings Aligned with Best-in-Class Banks 158 22 55 252 184 S&P Moody’s1 Fitch2 18 161 AA-/Aa3 146 141 A+/A1 64 64 64 A/A2 179 161 198 A-/A3 241 BBB+/ 241 Baa1 241 BBB/ Baa2 BBB-/ Baa3 Source: S&P, Moody’s and Fitch Reports 1. Excludes CFG, which is not rated by Moody’s 42 2. Excludes ZION, which Is not rated by Fitch

Well-Positioned for the Future . Differentiated businesses driving top-tier operating performance . Diversification produces stable, consistent and growing earnings . Achieving targeted cost savings / intense focus on expenses . “Disrupt or Die” – investing in our company . Client first mentality . Achieving positive operating leverage . Committed to a strong and consistently growing dividend and a strong TSR . Strong, conservative credit culture . Vision, Mission and Values 43

A-44


Appendix 46

Non-GAAP reconciliations Efficiency ratio (Dollars in millions) Quarter Ended June 30 2018 Efficiency ratio numerator - noninterest expense - GAAP $ 1,720 Amortization of intangibles (31 ) Merger-related and restructuring charges, net (24 ) Gain (loss) on early extinguishment of debt — Charitable contribution — One-time bonus — Efficiency ratio numerator - adjusted $ 1,665 Efficiency ratio denominator - revenue1 - GAAP $ 2,879 Taxable equivalent adjustment 22 Securities (gains) losses, net (1 ) Efficiency ratio denominator - adjusted $ 2,900 Efficiency ratio - GAAP 59.7 % Efficiency ratio - adjusted2 57.4 1 Revenue is defined as net interest income plus noninterest income. 2 The adjusted efficiency ratio is non-GAAP in that it excludes securities gains (losses), amortization of intangible assets, merger-related and restructuring charges and other selected items. BB&T's management uses this measure in their analysis of the Corporation's performance. BB&T's management believes this measure provides a greater understanding of ongoing operations and enhances comparability of results with prior periods, as well as demonstrates the effects of significant gains and charges. A-47

Non-GAAP reconciliations Operating leverage1 (Dollars in millions) Quarter Ended June 30 March 31 June 30 % Growth 2Q18 vs. 2018 2018 2017 1Q18 2Q17 (annualized) Revenue2 - GAAP $ 2,879 $ 2,813 $ 2,855 9.4 % 0.8 % Taxable equivalent adjustment 22 23 40 Securities (gains) losses, net (1 ) — — Revenue2 - adjusted $ 2,900 $ 2,836 $ 2,895 9.1 % 0.2 % Noninterest expense - GAAP $ 1,720 $ 1,686 $ 1,742 8.1 % (1.3 )% Amortization of intangibles (31 ) (33 ) (36 ) Merger-related and restructuring charges, net (24 ) (28 ) (10 ) Noninterest expense - adjusted $ 1,665 $ 1,625 $ 1,696 9.9 % (1.8 )% Operating leverage - GAAP 1.3 % 2.1 % Operating leverage - adjusted3 (0.8 ) 2.0 % 1 Operating leverage is defined as percentage growth in revenue growth less percentage growth in noninterest expense. 2 Revenue is defined as net interest income plus noninterest income. 3 The adjusted operating leverage ratio is non-GAAP in that it excludes securities gains (losses), amortization of intangible assets, merger-related and restructuring charges and other selected items. BB&T's management uses this measure in their analysis of the Corporation's performance. BB&T's management believes this measure provides a greater understanding of ongoing operations and enhances comparability of results with prior periods, as well as demonstrates the effects of significant gains and charges. A-48
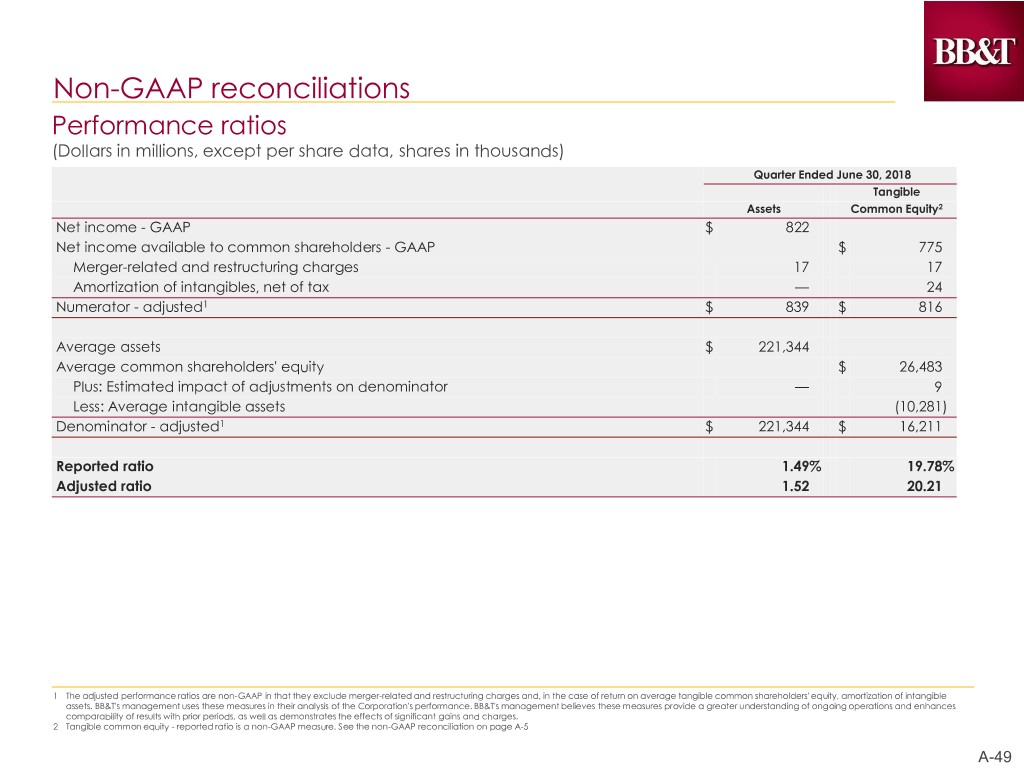
Non-GAAP reconciliations Performance ratios (Dollars in millions, except per share data, shares in thousands) Quarter Ended June 30, 2018 Tangible Assets Common Equity2 Net income - GAAP $ 822 Net income available to common shareholders - GAAP $ 775 Merger-related and restructuring charges 17 17 Amortization of intangibles, net of tax — 24 Numerator - adjusted1 $ 839 $ 816 Average assets $ 221,344 Average common shareholders' equity $ 26,483 Plus: Estimated impact of adjustments on denominator — 9 Less: Average intangible assets (10,281) Denominator - adjusted1 $ 221,344 $ 16,211 Reported ratio 1.49% 19.78% Adjusted ratio 1.52 20.21 1 The adjusted performance ratios are non-GAAP in that they exclude merger-related and restructuring charges and, in the case of return on average tangible common shareholders' equity, amortization of intangible assets. BB&T's management uses these measures in their analysis of the Corporation's performance. BB&T's management believes these measures provide a greater understanding of ongoing operations and enhances comparability of results with prior periods, as well as demonstrates the effects of significant gains and charges. 2 Tangible common equity - reported ratio is a non-GAAP measure. See the non-GAAP reconciliation on page A-5 A-49
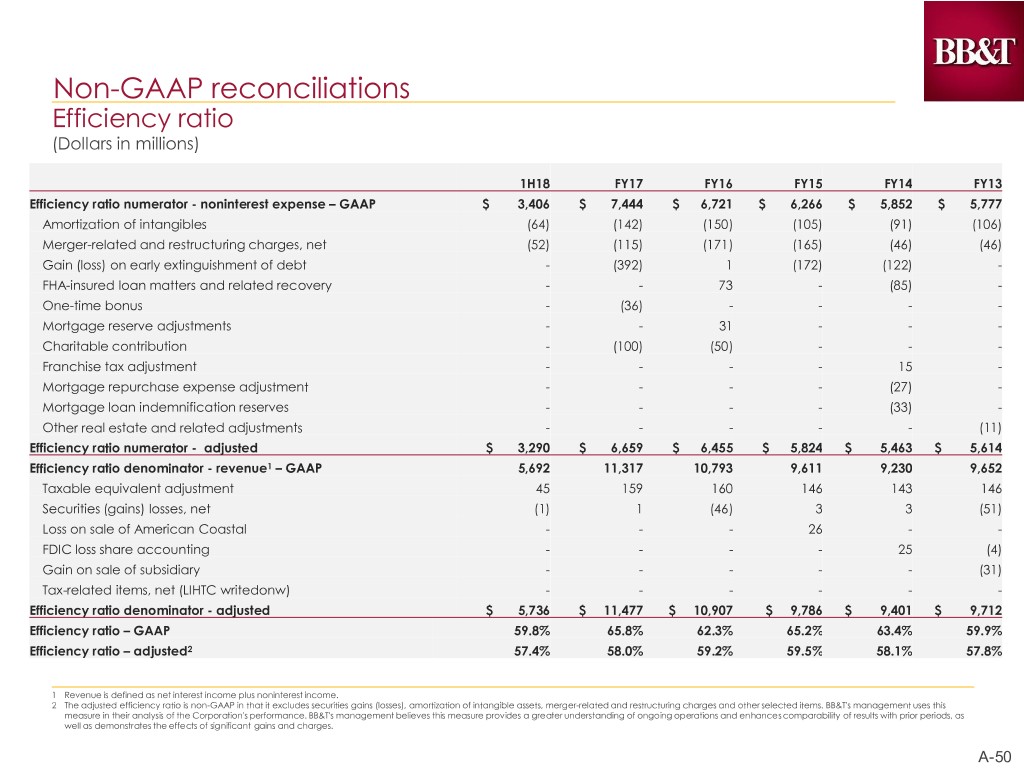
Non-GAAP reconciliations Efficiency ratio (Dollars in millions) 1H18 FY17 FY16 FY15 FY14 FY13 Efficiency ratio numerator - noninterest expense – GAAP $ 3,406 $ 7,444 $ 6,721 $ 6,266 $ 5,852 $ 5,777 Amortization of intangibles (64) (142) (150) (105) (91) (106) Merger-related and restructuring charges, net (52) (115) (171) (165) (46) (46) Gain (loss) on early extinguishment of debt - (392) 1 (172) (122) - FHA-insured loan matters and related recovery - - 73 - (85) - One-time bonus - (36) - - - - Mortgage reserve adjustments - - 31 - - - Charitable contribution - (100) (50) - - - Franchise tax adjustment - - - - 15 - Mortgage repurchase expense adjustment - - - - (27) - Mortgage loan indemnification reserves - - - - (33) - Other real estate and related adjustments - - - - - (11) Efficiency ratio numerator - adjusted $ 3,290 $ 6,659 $ 6,455 $ 5,824 $ 5,463 $ 5,614 Efficiency ratio denominator - revenue1 – GAAP 5,692 11,317 10,793 9,611 9,230 9,652 Taxable equivalent adjustment 45 159 160 146 143 146 Securities (gains) losses, net (1) 1 (46) 3 3 (51) Loss on sale of American Coastal - - - 26 - - FDIC loss share accounting - - - - 25 (4) Gain on sale of subsidiary - - - - - (31) Tax-related items, net (LIHTC writedonw) - - - - - - Efficiency ratio denominator - adjusted $ 5,736 $ 11,477 $ 10,907 $ 9,786 $ 9,401 $ 9,712 Efficiency ratio – GAAP 59.8% 65.8% 62.3% 65.2% 63.4% 59.9% Efficiency ratio – adjusted2 57.4% 58.0% 59.2% 59.5% 58.1% 57.8% 1 Revenue is defined as net interest income plus noninterest income. 2 The adjusted efficiency ratio is non-GAAP in that it excludes securities gains (losses), amortization of intangible assets, merger-related and restructuring charges and other selected items. BB&T's management uses this measure in their analysis of the Corporation's performance. BB&T's management believes this measure provides a greater understanding of ongoing operations and enhances comparability of results with prior periods, as well as demonstrates the effects of significant gains and charges. A-50

Non-GAAP reconciliations Return on Average Tangible Common Equity Return on average tangible common equity 1H18 FY2017 FY2016 FY2015 FY2014 FY2013 Net income available to common shareholders $ 1,520 $ 2,220 $ 2,259 $ 1,936 $ 1,983 $ 1,563 Plus: Amortization of intangibles, net of tax 48 89 94 66 57 66 Tangible net income available to common shareholders $ 1,568 $ 2,309 $ 2,353 $ 2,002 $ 2,040 $ 1,629 Average common shareholders' equity $ 26,455 $ 26,907 $ 26,349 $ 23,206 $ 21,280 $ 19,367 Less: Average intangible assets 10,295 10,402 10,215 8,194 7,388 7,437 Average tangible common shareholders' equity $ 16,160 $ 16,505 $ 16,134 $ 15,012 $ 13,892 $ 11,930 Return on average common shareholders’ equity 11.59% 8.25% 8.57% 8.34% 9.32% 8.07% Return on average tangible common shareholders' equity 19.57% 13.99% 14.59% 13.34% 14.68% 13.65% Tangible common equity and related measures are non-GAAP measures that exclude the impact of intangible assets and their related amortization. These measures are useful for evaluating the performance of a business consistently, whether acquired or developed internally. BB&T's management uses these measures to assess the quality of capital and returns relative to balance sheet risk and believes investors may find them useful in their analysis of the Corporation. These measures are not necessarily comparable to similar measures that may be presented by other companies. A-51
