Attached files
| file | filename |
|---|---|
| EX-32.2 - EXHIBIT 32.2 - UNITED INSURANCE HOLDINGS CORP. | exh32230jun18.htm |
| EX-32.1 - EXHIBIT 32.1 - UNITED INSURANCE HOLDINGS CORP. | exh32130jun18.htm |
| EX-31.2 - EXHIBIT 31.2 - UNITED INSURANCE HOLDINGS CORP. | exh31230jun18.htm |
| EX-31.1 - EXHIBIT 31.1 - UNITED INSURANCE HOLDINGS CORP. | exh31130jun18.htm |
UNITED STATES
SECURITIES AND EXCHANGE COMMISSION
WASHINGTON, D.C. 20549
_______________________
FORM 10-Q
_______________________
QUARTERLY REPORT PURSUANT TO SECTION 13 OR 15(d) OF THE SECURITIES EXCHANGE ACT OF 1934
For the quarterly period ended June 30, 2018
Commission File Number 001-35761
_____________________
United Insurance Holdings Corp.
(Exact name of Registrant as specified in its charter)
_______________________
Delaware | 75-3241967 | |||
(State of Incorporation) | (IRS Employer Identification Number) | |||
800 2nd Avenue S
St. Petersburg, Florida 33701
(Address, including zip code, of principal executive offices)
727-895-7737
(Registrant's telephone number, including area code)
_______________________
Indicate by check mark whether the registrant (1) has filed all reports required to be filed by Section 13 or 15(d) of the Securities Exchange Act of 1934 during the preceding 12 months (or for such shorter period that the registrant was required to file such reports), and (2) has been subject to such filing requirements for the past 90 days. Yes R No £
Indicate by check mark whether the registrant has submitted electronically and posted on its corporate Web site, if any, every Interactive Data File required to be submitted and posted pursuant to Rule 405 of Regulation S-T during the preceding 12 months (or for such shorter period that the registrant was required to submit and post such files). Yes R No £
Indicate by check mark whether the registrant is a large accelerated filer, an accelerated filer, a non-accelerated filer, a smaller reporting company, or an emerging growth company. See the definitions of “large accelerated filer,” “accelerated filer,” “smaller reporting company,” and "emerging growth company" in Rule 12b-2 of the Exchange Act.
Large accelerated filer | £ | Accelerated filer | þ | |
Non-accelerated filer | £ | Smaller reporting company | £ | |
Emerging growth company | £ | |||
If an emerging growth company, indicate by check mark if the registrant has elected to use the extended transition period for complying with any new or revised financial accounting standards provided pursuant to Section 13(a) of the Exchange Act. £
Indicate by check mark whether the registrant is a shell company (as defined in Rule 12b-2 of the Exchange Act). Yes £ No R
As of July 31, 2018, 42,822,187 shares of common stock, par value $0.0001 per share, were outstanding.
UNITED INSURANCE HOLDINGS CORP.
PART I. FINANCIAL INFORMATION | ||
Item 1. Financial Statements | ||
Unaudited Condensed Consolidated Balance Sheets | ||
Unaudited Condensed Consolidated Statements of Comprehensive Income | ||
Unaudited Condensed Consolidated Statements of Cash Flows | ||
Notes to Unaudited Consolidated Financial Statements | ||
Item 2. Management's Discussion and Analysis of Financial Condition and Results of Operations | ||
Item 3. Quantitative and Qualitative Disclosures About Market Risk | ||
Item 4. Controls and Procedures | ||
PART II. OTHER INFORMATION | ||
Item 1. Legal Proceedings | ||
Item 1A. Risk Factors | ||
Item 2. Unregistered Sales of Equity Securities and Use of Proceeds | ||
Item 3. Defaults Upon Senior Securities | ||
Item 4. Mine Safety Disclosures | ||
Item 5. Other Information | ||
Item 6. Exhibits | ||
Signatures | ||
Throughout this Quarterly Report on Form 10-Q (Form 10-Q), we present amounts in all tables in thousands, except for share amounts, per share amounts, policy counts or where more specific language or context indicates a different presentation. In the narrative sections of this Form 10-Q, we show full values rounded to the nearest thousand.
2
UNITED INSURANCE HOLDINGS CORP.
FORWARD-LOOKING STATEMENTS
Statements in this Form 10-Q contain “forward-looking statements” within the meaning of the Private Securities Litigation Reform Act of 1995. These forward-looking statements include statements about anticipated growth in revenues, gross written premium, earnings per share, estimated unpaid losses on insurance policies, investment returns, and diversification and expectations about our liquidity, our ability to meet our investment objectives and to manage and mitigate market risk with respect to our investments. Without limiting the generality of the foregoing, words such as “may,” “will,” “expect,” “endeavor,” “project,” “believe,” "plan," “anticipate,” “intend,” “could,” “would,” “estimate,” or “continue” or the negative variations thereof or comparable terminology are intended to identify forward-looking statements. These statements are based on current expectations, estimates and projections about the industry and market in which we operate, and management's beliefs and assumptions. Forward-looking statements are not guarantees of future performance and involve certain known and unknown risks and uncertainties that could cause actual results to differ materially from those expressed or implied by such statements. The risks and uncertainties include, without limitation:
• | our exposure to catastrophic events and severe weather conditions; |
• | the regulatory, economic and weather conditions present in Florida, the state in which we are most concentrated; |
• | the effectiveness of our diversification strategy; |
• | our ability to cultivate and maintain agent relationships, particularly our relationship with AmRisc, LLC (AmRisc); |
• | the possibility that actual claims incurred may exceed our loss reserves for claims; |
• | assessments charged by various governmental agencies; |
• | our ability to implement and maintain adequate internal controls over financial reporting; |
• | our ability to maintain adequate technology, data security, and outsourcing relationships; |
• | our reliance on key vendor relationships, and the ability of our vendors to protect the personal information of our customers; |
• | our ability to attract and retain the services of senior management; |
• | risks and uncertainties relating to our acquisitions, including our ability to successfully integrate the acquired companies: |
• | our ability to increase or maintain our market share; |
• | changes in the regulatory environment present in the states in which we operate; |
• | the impact of new federal or state regulations that affect the property and casualty insurance market; |
• | the cost, variability and availability of reinsurance; |
• | our ability to collect from our reinsurers on our reinsurance claims; |
• | dependence on investment income and the composition of our investment portfolio and related market risks; |
• | the possibility of the pricing and terms for our products to decline due to the historically cyclical nature of the property and casualty insurance and reinsurance industry; |
• | the outcome of litigation pending against us, including the terms of any settlements; |
• | downgrades in our financial strength ratings; |
• | the impact of future sales of substantial amounts of our common stock by us to our existing stockholders on our stock price; |
• | our ability to pay dividends in the future; |
• | the ability of R. Daniel Peed and his affiliates to exert significant control over us due to substantial ownership of our common stock, subject to certain restrictive covenants that may restrict our ability to pursue certain opportunities; |
• | the ability of others to obtain control of us due to provisions in our charter documents; and |
• | other risks and uncertainties described in the section entitled "Risk Factors" in Part I, Item 1A in our Annual Report on Form 10-K for the year ended December 31, 2017. |
We caution you not to place reliance on these forward-looking statements, which are valid only as of the date they were made. Except as may be required by applicable law, we undertake no obligation to update or revise any forward-looking statements to reflect new information, the occurrence of unanticipated events or otherwise.
3
UNITED INSURANCE HOLDINGS CORP.
PART I. FINANCIAL INFORMATION
Item 1. Financial Statements
Condensed Consolidated Balance Sheets
(Unaudited)
June 30, 2018 | December 31, 2017 | |||||||
ASSETS | ||||||||
Investments, at fair value: | ||||||||
Fixed maturities, available-for-sale (amortized cost of $864,321 and $763,434, respectively) | $ | 848,882 | $ | 762,855 | ||||
Equity securities | 83,345 | 63,295 | ||||||
Other investments (amortized cost of $7,884 and $8,057, respectively) | 8,242 | 8,381 | ||||||
Portfolio loans | — | 20,000 | ||||||
Total investments | $ | 940,469 | $ | 854,531 | ||||
Cash and cash equivalents | 208,675 | 229,556 | ||||||
Restricted cash | 33,526 | 46,719 | ||||||
Total cash, cash equivalents and restricted cash | $ | 242,201 | $ | 276,275 | ||||
Accrued investment income | 6,181 | 5,577 | ||||||
Property and equipment, net | 17,742 | 17,291 | ||||||
Premiums receivable, net | 116,894 | 75,275 | ||||||
Reinsurance recoverable on paid and unpaid losses | 369,651 | 395,774 | ||||||
Prepaid reinsurance premiums | 395,819 | 201,904 | ||||||
Goodwill | 73,045 | 73,045 | ||||||
Deferred policy acquisition costs | 109,601 | 103,882 | ||||||
Intangible assets | 34,081 | 45,271 | ||||||
Other assets | 11,978 | 11,096 | ||||||
Total Assets | $ | 2,317,662 | $ | 2,059,921 | ||||
LIABILITIES AND STOCKHOLDERS' EQUITY | ||||||||
Liabilities: | ||||||||
Unpaid losses and loss adjustment expenses | $ | 432,431 | $ | 482,232 | ||||
Unearned premiums | 651,561 | 555,873 | ||||||
Reinsurance payable | 374,499 | 149,117 | ||||||
Payments outstanding | 43,443 | 41,786 | ||||||
Accounts payable and accrued expenses | 56,069 | 46,594 | ||||||
Other liabilities | 54,207 | 85,830 | ||||||
Notes payable | 160,718 | 161,364 | ||||||
Total Liabilities | $ | 1,772,928 | $ | 1,522,796 | ||||
Commitments and contingencies (Note 11) | ||||||||
Stockholders' Equity: | ||||||||
Preferred stock, $0.0001 par value; 1,000,000 shares authorized; none issued or outstanding | — | — | ||||||
Common stock, $0.0001 par value; 50,000,000 shares authorized; 43,034,270 and 42,965,137 issued, respectively; 42,822,187 and 42,753,054 outstanding, respectively | 4 | 4 | ||||||
Additional paid-in capital | 388,193 | 387,145 | ||||||
Treasury shares, at cost: 212,083 shares | (431 | ) | (431 | ) | ||||
Accumulated other comprehensive income (loss) | (11,493 | ) | 9,221 | |||||
Retained earnings | 168,461 | 141,186 | ||||||
Total Stockholders' Equity | $ | 544,734 | $ | 537,125 | ||||
Total Liabilities and Stockholders' Equity | $ | 2,317,662 | $ | 2,059,921 | ||||
See accompanying Notes to Unaudited Consolidated Financial Statements.
4
UNITED INSURANCE HOLDINGS CORP.
Condensed Consolidated Statements of Comprehensive Income
(Unaudited)
Three Months Ended | Six Months Ended | |||||||||||||||
June 30, | June 30, | |||||||||||||||
2018 | 2017 | 2018 | 2017 | |||||||||||||
REVENUE: | ||||||||||||||||
Gross premiums written | $ | 384,662 | $ | 352,347 | $ | 664,279 | $ | 521,189 | ||||||||
Change in gross unearned premiums | (95,021 | ) | (90,763 | ) | (95,688 | ) | (77,540 | ) | ||||||||
Gross premiums earned | 289,641 | 261,584 | 568,591 | 443,649 | ||||||||||||
Ceded premiums earned | (118,335 | ) | (101,966 | ) | (232,385 | ) | (176,848 | ) | ||||||||
Net premiums earned | 171,306 | 159,618 | 336,206 | 266,801 | ||||||||||||
Investment income | 7,091 | 4,637 | 12,777 | 7,588 | ||||||||||||
Net realized investment losses | (438 | ) | (132 | ) | (227 | ) | (483 | ) | ||||||||
Net unrealized gains (losses) on equity securities | 1,381 | — | (1,063 | ) | — | |||||||||||
Other revenue | 3,808 | 13,950 | 7,508 | 26,800 | ||||||||||||
Total revenue | 183,148 | 178,073 | 355,201 | 300,706 | ||||||||||||
EXPENSES: | ||||||||||||||||
Losses and loss adjustment expenses | 88,595 | 86,938 | 165,841 | 150,271 | ||||||||||||
Policy acquisition costs | 50,454 | 43,320 | 99,516 | 78,756 | ||||||||||||
Operating expenses | 9,682 | 6,257 | 18,000 | 12,129 | ||||||||||||
General and administrative expenses | 12,643 | 28,176 | 35,968 | 39,509 | ||||||||||||
Interest expense | 2,458 | 752 | 4,916 | 1,511 | ||||||||||||
Total expenses | 163,832 | 165,443 | 324,241 | 282,176 | ||||||||||||
Income before other income | 19,316 | 12,630 | 30,960 | 18,530 | ||||||||||||
Other income | 16 | 20 | 87 | 58 | ||||||||||||
Income before income taxes | 19,332 | 12,650 | 31,047 | 18,588 | ||||||||||||
Provision for income taxes | 4,631 | 5,393 | 7,978 | 7,432 | ||||||||||||
Net income | $ | 14,701 | $ | 7,257 | $ | 23,069 | $ | 11,156 | ||||||||
OTHER COMPREHENSIVE INCOME: | ||||||||||||||||
Change in net unrealized gains (losses) on investments | (3,968 | ) | 4,106 | (27,352 | ) | 7,837 | ||||||||||
Reclassification adjustment for net realized investment losses (gains) | 438 | 132 | 227 | 483 | ||||||||||||
Income tax benefit (expense) related to items of other comprehensive income | 488 | (1,615 | ) | 6,411 | (3,157 | ) | ||||||||||
Total comprehensive income (loss) | $ | 11,659 | $ | 9,880 | $ | 2,355 | $ | 16,319 | ||||||||
Weighted average shares outstanding | ||||||||||||||||
Basic | 42,648,660 | 41,799,041 | 42,615,484 | 31,691,267 | ||||||||||||
Diluted | 42,790,346 | 42,028,013 | 42,769,602 | 31,914,559 | ||||||||||||
Earnings per share | ||||||||||||||||
Basic | $ | 0.34 | $ | 0.17 | $ | 0.54 | $ | 0.35 | ||||||||
Diluted | $ | 0.34 | $ | 0.17 | $ | 0.54 | $ | 0.35 | ||||||||
Dividends declared per share | $ | 0.06 | $ | 0.06 | $ | 0.12 | $ | 0.12 | ||||||||
See accompanying Notes to Unaudited Consolidated Financial Statements.
5
UNITED INSURANCE HOLDINGS CORP.
Condensed Consolidated Statements of Cash Flows
(Unaudited)
Six Months Ended June 30, | ||||||||
2018 | 2017 | |||||||
OPERATING ACTIVITIES | ||||||||
Net income | $ | 23,069 | $ | 11,156 | ||||
Adjustments to reconcile net income to net cash used by operating activities: | ||||||||
Depreciation and amortization | 12,931 | 13,613 | ||||||
Bond amortization and accretion | 2,639 | 2,320 | ||||||
Net realized losses (gains) on investments | 227 | 483 | ||||||
Net unrealized losses (gains) on equity securities | 1,063 | — | ||||||
Provision for uncollectable premiums | (61 | ) | 144 | |||||
Deferred income taxes, net | 1,624 | 1,323 | ||||||
Stock based compensation | 1,048 | 1,294 | ||||||
Changes in operating assets and liabilities: | ||||||||
Accrued investment income | (604 | ) | (96 | ) | ||||
Premiums receivable | (41,558 | ) | (23,224 | ) | ||||
Reinsurance recoverable on paid and unpaid losses | 26,123 | (25,566 | ) | |||||
Prepaid reinsurance premiums | (193,915 | ) | (209,048 | ) | ||||
Deferred policy acquisition costs, net | (5,719 | ) | (29,392 | ) | ||||
Other assets | (882 | ) | 4,963 | |||||
Unpaid losses and loss adjustment expenses | (49,801 | ) | 3,310 | |||||
Unearned premiums | 95,688 | 77,540 | ||||||
Reinsurance payable | 225,382 | 209,714 | ||||||
Payments outstanding | 1,657 | (37 | ) | |||||
Accounts payable and accrued expenses | 9,475 | 11,926 | ||||||
Other liabilities | (29,799 | ) | 7,963 | |||||
Net cash provided by operating activities | $ | 78,587 | $ | 58,386 | ||||
INVESTING ACTIVITIES | ||||||||
Proceeds from sales, maturities and repayments of investments | 116,116 | 81,998 | ||||||
Purchases of investments | (220,809 | ) | (108,376 | ) | ||||
Cash from acquisition | 95,284 | |||||||
Cost of property, equipment and capitalized software acquired | (2,014 | ) | (3,797 | ) | ||||
Net cash provided by (used in) investing activities | $ | (106,707 | ) | $ | 65,109 | |||
FINANCING ACTIVITIES | ||||||||
Repayments of borrowings | (762 | ) | (468 | ) | ||||
Payments of debt issuance costs | (62 | ) | — | |||||
Dividends | (5,130 | ) | (3,862 | ) | ||||
Outstanding checks in excess of funds on deposit | — | (15,682 | ) | |||||
Net cash used in financing activities | $ | (5,954 | ) | $ | (20,012 | ) | ||
(Decrease) increase in cash, cash equivalents and restricted cash | (34,074 | ) | 103,483 | |||||
Cash, cash equivalents and restricted cash at beginning of period | 276,275 | 150,688 | ||||||
Cash, cash equivalents and restricted cash at end of period | $ | 242,201 | $ | 254,171 | ||||
Supplemental Cash Flows Information | ||||||||
Interest paid | $ | 4,948 | $ | 1,292 | ||||
Income taxes paid | $ | 4,565 | $ | 3,917 | ||||
Non-cash transactions | ||||||||
Issuance of common stock | $ | — | $ | 274,384 | ||||
See accompanying Notes to Unaudited Consolidated Financial Statements.
6
UNITED INSURANCE HOLDINGS CORP.
Notes to Unaudited Consolidated Financial Statements
June 30, 2018
1) ORGANIZATION, CONSOLIDATION AND PRESENTATION
(a)Business
United Insurance Holdings Corp. (referred to in this document as we, our, us, the Company or UPC Insurance) is a property and casualty insurance holding company that sources, writes and services residential and commercial property and casualty insurance policies using a network of agents and four wholly-owned insurance subsidiaries. Our largest insurance subsidiary is United Property & Casualty Insurance Company (UPC), which was formed in Florida in 1999 and has operated continuously since that time. Our three other insurance subsidiaries are Family Security Insurance Company, Inc. (FSIC), acquired via merger on February 3, 2015, Interboro Insurance Company (IIC), acquired via merger on April 29, 2016, and American Coastal Insurance Company (ACIC), acquired via merger on April 3, 2017. See Note 4 in these Notes to Unaudited Consolidated Financial Statements for additional information regarding acquisitions.
Our other subsidiaries include United Insurance Management L.C. (UIM), a managing general agent that manages
substantially all aspects of UPC, FSIC and IIC's business; Skyway Claims Services, LLC, which provides claims adjusting services to UPC, FSIC and IIC; AmCo Holding Company (AmCo) and Family Security Holdings (FSH), which are holding company subsidiaries that consolidate their respective insurance companies; BlueLine Cayman Holdings (BlueLine) which reinsures portfolios of excess and surplus policies; UPC Re which can provide a portion of the reinsurance protection purchased by our insurance subsidiaries when needed; and Skyway Reinsurance Services which provides reinsurance brokerage services for our insurance companies.
Our primary product is homeowners' insurance, which we currently offer in 12 states, under authorization from the insurance regulatory authorities in each state. In addition, we write commercial residential insurance in the state of Florida. We are also licensed to write property and casualty insurance in an additional six states; however, we have not commenced writing in these states.
We conduct our operations under one business segment.
(b)Consolidation and Presentation
We prepare our unaudited consolidated interim financial statements in conformity with U.S. generally accepted accounting principles (GAAP). We have condensed or omitted certain information and footnote disclosures normally included in annual consolidated financial statements presented in accordance with GAAP. In management's opinion, the accompanying unaudited consolidated financial statements reflect all adjustments, including normal recurring items, considered necessary for a fair presentation of interim periods. All intercompany balances and transactions have been eliminated. Our unaudited consolidated interim financial statements and footnotes should be read in conjunction with our consolidated financial statements and footnotes in our Annual Report on Form 10-K for the year ended December 31, 2017.
While preparing our unaudited consolidated financial statements, we make estimates and assumptions that affect the reported amounts of assets and liabilities and disclosures of contingent assets and liabilities at the date of the unaudited consolidated financial statements, as well as reported amounts of revenues and expenses during the reporting period. Accordingly, actual results could differ from those estimates. Reported amounts that require us to make extensive use of estimates include our reserves for unpaid losses and loss adjustment expenses, investments and goodwill. Except for the captions on our Unaudited Consolidated Balance Sheets and Unaudited Consolidated Statements of Comprehensive Income, we generally use the term loss(es) to collectively refer to both loss and loss adjustment expenses.
We reclassified certain amounts in the 2017 financial statements to conform to the 2018 presentation. These reclassifications had no impact on our results of operations or stockholders' equity, as previously reported.
Our results of operations and our cash flows as of the end of the interim periods reported herein do not necessarily indicate our results for the remainder of the year or for any other future period.
2) SIGNIFICANT ACCOUNTING POLICIES
(a) Changes to significant accounting policies
7
UNITED INSURANCE HOLDINGS CORP.
Notes to Unaudited Consolidated Financial Statements
June 30, 2018
We have made no changes to our significant accounting policies as reported in our Annual Report on Form 10-K for the year ended December 31, 2017, except as noted below.
(b) Income Taxes
As of June 30, 2018, we had not fully completed our accounting for the tax effects of the enactment of the legislation commonly known as the Tax Cuts and Jobs Act of 2017 with regard to the deductibility of compensation expense for certain covered executives due to uncertainty surrounding the appropriate tax treatment of outstanding performance-based awards and uncertainty surrounding the discount factors to be applied for loss reserve discounting as during this period, the U.S. Treasury Department and the Internal Revenue Service have not issued further clarification or guidance for the items for which our accounting for the Tax Act is incomplete. Interpretive guidance of the Tax Act will be received throughout 2018, and we expect to update our estimates and our disclosure on a quarterly basis as interpretive guidance is received within each quarter that it is received.
(c) Fair value assumptions
The carrying amounts for the following financial instrument categories approximate their fair values at June 30, 2018 and December 31, 2017, because of their short-term nature: cash and cash equivalents, accrued investment income, premiums receivable, reinsurance recoverable, reinsurance payable, other assets, and other liabilities. The carrying amount of the notes payable to the Florida State Board of Administration, the Branch Banking & Trust Corporation (BB&T) and our senior notes approximate fair value as the interest rates and terms are variable.
(d) Reinsurance
We record provisional ceding commissions that we receive in connection with our reinsurance contracts for the 2018 underwriting year as an offset to deferred acquisition costs to the extent that they relate to compensation for acquisition costs that are incurred that are deferrable. The remaining provisional ceding commissions are recorded as unearned reinsurance commission and are recognized as an offset to other acquisition costs based in proportion to the premiums earned or coverage provided by the reinsurance contracts.
(e) Recently Adopted Accounting Pronouncements
In May 2017, the Financial Accounting Standards Board (FASB) issued Accounting Standards Update (ASU) No. 2017-09, Compensation-Stock Compensation (Topic 718): Scope of Modification Accounting (ASU 2017-09). This standard provides guidance about which changes to the terms or conditions of a share-based payment award require an entity to apply modification accounting in Topic 718. ASU 2017-09 is effective for annual periods beginning after December 15, 2017, including interim periods within those annual periods, with early adoption permitted for certain requirements. We did not early adopt and the new guidance did not impact the way in which we account for share-based payment transactions. Therefore, the adoption as of January 1, 2018 had no impact on our results of operations.
In November 2016, the FASB issued ASU No. 2016-18, Statement of Cash Flows (Topic 230): Restricted Cash (ASU 2016-18). This standard provides guidance on the presentation of restricted cash in the statement of cash flows. We are required to explain the changes during a reporting period in the total of cash, cash equivalents and amounts generally described as restricted cash or restricted cash equivalents in the statement of cash flows. We retrospectively adopted this standard on April 1, 2018. The adoption of this new accounting standard impacted the presentation of our Unaudited Consolidated Statement of Cash Flows but had no effect on our results of operations. The restricted cash on our consolidated balance sheets at June 30, 2018 and December 31, 2017 represents cash that is held in trust for assumed business and cash held in deposit accounts to satisfy state statutory deposit requirements.
In January 2016, the FASB issued ASU No. 2016-01, Recognition and Measurement of Financial Assets and Financial Liabilities (ASU 2016-01). This update substantially revises standards for the recognition, measurement and presentation of financial instruments. This standard revised our accounting related to (1) the classification and measurement of investments in equity securities and (2) the presentation of certain fair value changes for financial liabilities measured at fair value. It also amended certain disclosure requirements associated with the fair value of financial instruments. ASU 2016-01 is effective for annual periods beginning after December 15, 2017, including interim periods within those annual periods, with early adoption permitted for certain requirements. We adopted this standard as of January 1, 2018, which resulted in a reclassification of a $9,338,000 gain, net of tax, on equity securities from accumulated other comprehensive income to retained earnings on our
8
UNITED INSURANCE HOLDINGS CORP.
Notes to Unaudited Consolidated Financial Statements
June 30, 2018
consolidated financial statements. Refer to Note 14 in these Notes to Unaudited Consolidated Financial Statements for a reconciliation.
(f) Pending Accounting Pronouncements
We have evaluated recent accounting pronouncements that have had or may have a significant effect on our financial statements or on our disclosures.
In January 2017, the FASB issued ASU No. 2017-04, Intangibles—Goodwill and Other (Topic 350): Simplifying the Test for Goodwill Impairment (ASU 2017-04). This update simplifies the manner in which an entity is required to test goodwill for impairment by eliminating Step 2 from the goodwill impairment test. ASU 2017-07 is effective for annual periods beginning after December 15, 2019, including interim periods within those annual periods, with early adoption permitted for certain requirements. We do not intend to early adopt and are assessing the impact of adopting this new accounting standard on our consolidated financial statements and related disclosures. Any impact of the standard on our consolidated financial statements and related disclosures will be dependent on market conditions of the reporting units at the time of adoption.
In February 2016, the FASB issued ASU No. 2016-02, Leases (Topic 842) (ASU 2016-02). This update is intended to replace existing lease guidance by requiring a lessee to recognize substantially all leases (whether operating or finance leases) on the balance sheet as a right-of-use asset and an associated lease liability. Short-term leases of 12 months or less are excluded from this amendment. ASU 2016-02 is effective for fiscal years beginning after December 15, 2018, including interim periods within those fiscal years, with early adoption permitted. We do not intend to early adopt and are assessing the impact of adopting this new accounting standard on our consolidated financial statements and related disclosures using a retrospective approach upon adoption. We are currently quantifying the expected recognition on our balance sheet for a right to use asset and a lease liability as required by this standard.
9
UNITED INSURANCE HOLDINGS CORP.
Notes to Unaudited Consolidated Financial Statements
June 30, 2018
3) INVESTMENTS
The following table details fixed maturity available-for-sale and equity securities, by major investment category, at June 30, 2018 and December 31, 2017:
Cost or Adjusted/Amortized Cost | Gross Unrealized Gains | Gross Unrealized Losses | Fair Value | ||||||||||||
June 30, 2018 | |||||||||||||||
U.S. government and agency securities | $ | 90,391 | $ | 2 | $ | 1,912 | $ | 88,481 | |||||||
Foreign government | 3,002 | — | 24 | 2,978 | |||||||||||
States, municipalities and political subdivisions | 161,257 | 555 | 1,997 | 159,815 | |||||||||||
Public utilities | 25,892 | 17 | 738 | 25,171 | |||||||||||
Corporate securities | 290,701 | 224 | 6,597 | 284,328 | |||||||||||
Mortgage-backed securities | 212,320 | 37 | 4,711 | 207,646 | |||||||||||
Asset backed securities | 79,993 | 2 | 217 | 79,778 | |||||||||||
Redeemable preferred stocks | 765 | 7 | 87 | 685 | |||||||||||
Total fixed maturities | $ | 864,321 | $ | 844 | $ | 16,283 | $ | 848,882 | |||||||
Mutual funds | $ | 44,385 | $ | 3,219 | $ | 44 | $ | 47,560 | |||||||
Public utilities | 1,946 | 327 | 30 | 2,243 | |||||||||||
Other common stocks | 24,059 | 8,188 | 446 | 31,801 | |||||||||||
Non-redeemable preferred stocks | 1,718 | 39 | 16 | 1,741 | |||||||||||
Total equity securities | $ | 72,108 | $ | 11,773 | $ | 536 | $ | 83,345 | |||||||
December 31, 2017 | |||||||||||||||
U.S. government and agency securities | $ | 93,827 | $ | 40 | $ | 1,241 | $ | 92,626 | |||||||
Foreign government | 2,022 | 14 | — | 2,036 | |||||||||||
States, municipalities and political subdivisions | 200,706 | 1,929 | 1,123 | 201,512 | |||||||||||
Public utilities | 20,215 | 127 | 85 | 20,257 | |||||||||||
Corporate securities | 287,025 | 1,746 | 1,209 | 287,562 | |||||||||||
Mortgage-backed securities | 143,982 | 235 | 952 | 143,265 | |||||||||||
Asset-backed securities | 14,902 | 23 | 20 | 14,905 | |||||||||||
Redeemable preferred stocks | 755 | 11 | 74 | 692 | |||||||||||
Total fixed maturities | $ | 763,434 | $ | 4,125 | $ | 4,704 | $ | 762,855 | |||||||
Mutual fund | $ | 29,079 | $ | 2,845 | $ | — | $ | 31,924 | |||||||
Public utilities | 1,343 | 359 | — | 1,702 | |||||||||||
Other common stocks | 18,856 | 9,093 | 47 | 27,902 | |||||||||||
Non-redeemable preferred stocks | 1,718 | 53 | 4 | 1,767 | |||||||||||
Total equity securities | $ | 50,996 | $ | 12,350 | $ | 51 | $ | 63,295 | |||||||
10
UNITED INSURANCE HOLDINGS CORP.
Notes to Unaudited Consolidated Financial Statements
June 30, 2018
When we sell investments, we calculate the gain or loss realized on the sale by comparing the sales price (fair value) to the cost or adjusted/amortized cost of the security sold. We determine the cost or adjusted/amortized cost of the security sold using the specific-identification method. The following table details our realized gains (losses) by major investment category for the three and six months ended June 30, 2018 and 2017:
2018 | 2017 | ||||||||||||||
Gains (Losses) | Fair Value at Sale | Gains (Losses) | Fair Value at Sale | ||||||||||||
Three Months Ended June 30, | |||||||||||||||
Fixed maturities | $ | 14 | $ | 4,706 | $ | 41 | $ | 6,310 | |||||||
Equity securities | 59 | 207 | 7 | 19 | |||||||||||
Total realized gains | 73 | 4,913 | 48 | 6,329 | |||||||||||
Fixed maturities | (511 | ) | 38,091 | (170 | ) | 13,848 | |||||||||
Equity securities | — | — | (10 | ) | 100 | ||||||||||
Total realized losses | (511 | ) | 38,091 | (180 | ) | 13,948 | |||||||||
Net realized investment gains (losses) | $ | (438 | ) | $ | 43,004 | $ | (132 | ) | $ | 20,277 | |||||
Six Months Ended June 30, | |||||||||||||||
Fixed maturities | $ | 56 | $ | 6,881 | $ | 140 | $ | 18,896 | |||||||
Equity securities | 509 | 1,182 | 7 | 19 | |||||||||||
Total realized gains | 565 | 8,063 | 147 | 18,915 | |||||||||||
Fixed maturities | (792 | ) | 70,319 | (620 | ) | 37,396 | |||||||||
Equity securities | — | — | (10 | ) | 100 | ||||||||||
Total realized losses | (792 | ) | 70,319 | (630 | ) | 37,496 | |||||||||
Net realized investment gains (losses) | $ | (227 | ) | $ | 78,382 | $ | (483 | ) | $ | 56,411 | |||||
The table below summarizes our fixed maturities at June 30, 2018 by contractual maturity periods. Actual results may differ as issuers may have the right to call or prepay obligations, with or without penalties, prior to the contractual maturities of those obligations.
June 30, 2018 | |||||||||||||
Cost or Amortized Cost | Percent of Total | Fair Value | Percent of Total | ||||||||||
Due in one year or less | $ | 60,570 | 7.0 | % | $ | 60,252 | 7.1 | % | |||||
Due after one year through five years | 321,349 | 37.2 | % | 316,312 | 37.3 | % | |||||||
Due after five years through ten years | 179,582 | 20.8 | % | 174,875 | 20.6 | % | |||||||
Due after ten years | 10,507 | 1.2 | % | 10,020 | 1.2 | % | |||||||
Asset and mortgage backed securities | 292,313 | 33.8 | % | 287,423 | 33.8 | % | |||||||
Total | $ | 864,321 | 100.0 | % | $ | 848,882 | 100.0 | % | |||||
11
UNITED INSURANCE HOLDINGS CORP.
Notes to Unaudited Consolidated Financial Statements
June 30, 2018
The following table summarizes our net investment income by major investment category:
Three Months Ended June 30, | Six Months Ended June 30, | ||||||||||||||
2018 | 2017 | 2018 | 2017 | ||||||||||||
Fixed maturities | $ | 5,392 | $ | 4,087 | $ | 10,204 | $ | 6,585 | |||||||
Equity securities | 467 | 345 | 930 | 565 | |||||||||||
Cash and cash equivalents | 617 | 90 | 839 | 160 | |||||||||||
Other investments | 607 | 109 | 789 | 261 | |||||||||||
Other assets | 8 | 6 | 15 | 17 | |||||||||||
Investment income | 7,091 | 4,637 | 12,777 | 7,588 | |||||||||||
Investment expenses | (246 | ) | (19 | ) | (489 | ) | (269 | ) | |||||||
Net investment income | $ | 6,845 | $ | 4,618 | $ | 12,288 | $ | 7,319 | |||||||
Portfolio monitoring
We have a comprehensive portfolio monitoring process to identify and evaluate each fixed income security whose carrying value may be other-than-temporarily impaired.
For each fixed income security in an unrealized loss position, we determine if the loss is temporary or other-than-temporary. If our management decides to sell the security or determines that it is more likely than not that we will be required to sell the security before recovery of the cost or amortized cost basis for reasons such as liquidity needs, contractual or regulatory requirements, then the security's decline in fair value is considered other-than-temporary and is recorded in earnings.
If we have not made the decision to sell the fixed income security and it is more likely than not that we will be required to sell the fixed income security before recovery of its amortized cost basis, we evaluate whether we expect the security to receive cash flows sufficient to recover the entire cost or amortized cost basis of the security. We calculate the estimated recovery value by discounting the best estimate of future cash flows at the security's original or current effective rate, as appropriate, and compare this to the cost or amortized cost of the security. If we do not expect to receive cash flows sufficient to recover the entire cost or amortized cost basis of the fixed income security, the credit loss component of the impairment is recorded in earnings, with the remaining amount of the unrealized loss related to other factors recognized in other comprehensive income.
Our portfolio monitoring process includes a quarterly review of all fixed-income securities to identify instances where the fair value of a security compared to its cost or amortized cost is below established thresholds. The process also includes the monitoring of other impairment indicators such as ratings, ratings downgrades and payment defaults. The securities identified, in addition to other securities for which we may have a concern, are evaluated for potential other-than-temporary impairment using information relevant to the collectability or recovery of the security that is reasonably available. Inherent in our evaluation of other-than-temporary impairment for these fixed income securities are assumptions and estimates about the financial condition and future earnings potential of the issue or issuer. Some of the factors that may be considered in evaluating whether a decline in fair value is other-than-temporary are: (1) the financial condition, near-term and long-term prospects of the issue or issuer, including relevant industry specific market conditions and trends, geographic location and implications of rating agency actions and offering prices; (2) the specific reasons that a security is in an unrealized loss position, including overall market conditions which could affect liquidity; and (3) the length of time and extent to which the fair value has been less than amortized cost or cost.
12
UNITED INSURANCE HOLDINGS CORP.
Notes to Unaudited Consolidated Financial Statements
June 30, 2018
The following table presents an aging of our unrealized investment losses by investment class:
Less Than Twelve Months | Twelve Months or More | ||||||||||||||||||||
Number of Securities(1) | Gross Unrealized Losses | Fair Value | Number of Securities(1) | Gross Unrealized Losses | Fair Value | ||||||||||||||||
June 30, 2018 | |||||||||||||||||||||
U.S. government and agency securities | 41 | $ | 547 | $ | 33,151 | 57 | $ | 1,364 | $ | 53,423 | |||||||||||
Foreign governments | 5 | 24 | 2,979 | — | — | — | |||||||||||||||
States, municipalities and political subdivisions | 145 | 1,634 | 113,255 | 23 | 363 | 14,571 | |||||||||||||||
Public utilities | 43 | 668 | 22,118 | 5 | 70 | 986 | |||||||||||||||
Corporate securities | 521 | 5,860 | 240,733 | 44 | 737 | 18,231 | |||||||||||||||
Mortgage-backed securities | 187 | 3,923 | 176,704 | 60 | 788 | 15,118 | |||||||||||||||
Asset backed securities | 87 | 214 | 70,926 | 5 | 3 | 1,249 | |||||||||||||||
Redeemable preferred stocks | 1 | 3 | 122 | 3 | 85 | 304 | |||||||||||||||
Total fixed maturities | 1,030 | 12,873 | 659,988 | 197 | 3,410 | 103,882 | |||||||||||||||
Mutual Fund | 1 | 44 | 14,937 | — | — | — | |||||||||||||||
Public utilities | 4 | 30 | 629 | — | — | — | |||||||||||||||
Other common stocks | 54 | 410 | 5,342 | 2 | 36 | 205 | |||||||||||||||
Non-redeemable preferred stocks | 12 | 16 | 563 | — | — | — | |||||||||||||||
Total equity securities | 71 | 500 | 21,471 | 2 | 36 | 205 | |||||||||||||||
Total | 1,101 | $ | 13,373 | $ | 681,459 | 199 | $ | 3,446 | $ | 104,087 | |||||||||||
December 31, 2017 | |||||||||||||||||||||
U.S. government and agency securities | 40 | $ | 166 | $ | 26,979 | 73 | $ | 1,075 | $ | 58,980 | |||||||||||
States, municipalities and political subdivisions | 106 | 734 | 91,245 | 31 | 389 | 19,718 | |||||||||||||||
Public utilities | 16 | 44 | 7,052 | 5 | 41 | 1,016 | |||||||||||||||
Corporate securities | 263 | 871 | 134,755 | 52 | 338 | 16,476 | |||||||||||||||
Mortgage-backed securities | 89 | 475 | 76,349 | 50 | 477 | 15,210 | |||||||||||||||
Asset-backed securities | 18 | 20 | 11,682 | — | — | — | |||||||||||||||
Redeemable preferred stocks | — | — | — | 3 | 74 | 303 | |||||||||||||||
Total fixed maturities | 532 | 2,310 | 348,062 | 214 | 2,394 | 111,703 | |||||||||||||||
Mutual Funds | 1 | — | 131 | — | — | — | |||||||||||||||
Other common stocks | 5 | 47 | 748 | — | — | — | |||||||||||||||
Non-redeemable preferred stocks | 4 | 4 | 87 | — | — | — | |||||||||||||||
Total equity securities | 10 | 51 | 966 | — | — | — | |||||||||||||||
Total | 542 | $ | 2,361 | $ | 349,028 | 214 | $ | 2,394 | $ | 111,703 | |||||||||||
(1) This amount represents the actual number of discrete securities, not the number of shares or units of those securities. The numbers are not presented in thousands.
During our quarterly evaluations of our securities for impairment, we determined that none of our investments in fixed-income securities that reflected an unrealized loss position were other-than-temporarily impaired. The issuers of our debt securities continue to make interest payments on a timely basis. We do not intend to sell nor is it likely that we would be required to sell the debt securities before we recover our amortized cost basis. Due to the adoption of ASU 2016-01 as of January 1, 2018, equity securities are reported at fair value with changes in fair value recognized in valuation of equity investments and are no longer included in impairment write-downs, change in intent write-downs and sales.
During the three and six months ended June 30, 2018 and 2017, we recorded no other-than-temporary impairment charges.
13
UNITED INSURANCE HOLDINGS CORP.
Notes to Unaudited Consolidated Financial Statements
June 30, 2018
Fair value measurement
Fair value is defined as the price that would be received to sell an asset or paid to transfer a liability in an orderly transaction between market participants at the measurement date. The hierarchy for inputs used in determining fair value maximizes the use of observable inputs and minimizes the use of unobservable inputs by requiring that observable inputs be used when available. Assets and liabilities recorded on our Unaudited Consolidated Balance Sheets at fair value are categorized in the fair value hierarchy based on the observability of inputs to the valuation techniques as follows:
Level 1: Assets and liabilities whose values are based on unadjusted quoted prices for identical assets or liabilities in an active market that we can access.
Level 2: Assets and liabilities whose values are based on the following:
(a) Quoted prices for similar assets or liabilities in active markets;
(b) Quoted prices for identical or similar assets or liabilities in markets that are not active; or
(c) Valuation models whose inputs are observable, directly or indirectly, for substantially the full term of the asset or liability.
Level 3: Assets and liabilities whose values are based on prices or valuation techniques that require inputs that are both unobservable and significant to the overall fair value measurement. Unobservable inputs reflect our estimates of the assumptions that market participants would use in valuing the assets and liabilities.
We estimate the fair value of our investments using the closing prices on the last business day of the reporting period, obtained from active markets such as the NYSE, Nasdaq and NYSE MKT. For securities for which quoted prices in active markets are unavailable, we use a third-party pricing service that utilizes quoted prices in active markets for similar instruments, benchmark interest rates, broker quotes and other relevant inputs to estimate the fair value of those securities for which quoted prices are unavailable. Our estimates of fair value reflect the interest rate environment that existed as of the close of business on June 30, 2018 and December 31, 2017. Changes in interest rates subsequent to June 30, 2018 may affect the fair value of our investments.
The fair value of our fixed maturities is initially calculated by a third-party pricing service. Valuation service providers typically obtain data about market transactions and other key valuation model inputs from multiple sources and, through the use of proprietary models, produce valuation information in the form of a single fair value for individual fixed income and other securities for which a fair value has been requested. The inputs used by the valuation service providers include, but are not limited to, market prices from recently completed transactions and transactions of comparable securities, interest rate yield curves, credit spreads, liquidity spreads, currency rates and other information, as applicable. Credit and liquidity spreads are typically implied from completed transactions and transactions of comparable securities. Valuation service providers also use proprietary discounted cash flow models that are widely accepted in the financial services industry and similar to those used by other market participants to value the same financial information. The valuation models take into account, among other things, market observable information as of the measurement date, as described above, as well as the specific attributes of the security being valued, including its term, interest rate, credit rating, industry sector and, where applicable, collateral quality and other issue or issuer specific information. Executing valuation models effectively requires seasoned professional judgment and experience.
For our Level 3 assets, our internal pricing methods are primarily based on models using discounted cash flow methodologies that determine a single best estimate of fair value for individual financial instruments. In addition, our models use a discount rate and internally assigned credit ratings as inputs (which are generally consistent with any external ratings) and those we use to report our holdings by credit rating. Market related inputs used in these fair values, which we believe are representative of inputs other market participants would use to determine fair value of the same instruments include: interest rate yield curves, quoted market prices of comparable securities, credit spreads and other applicable market data. As a result of the significance of non-market observable inputs, including internally assigned credit ratings as described above, judgment is required in developing these fair values. The fair value of these financial assets may differ from the amount actually received if we were to sell the asset. Moreover, the use of different valuation assumptions may have a material effect on the fair values of the financial assets.
Any change in the estimated fair value of our fixed-income securities would impact the amount of unrealized gain or loss we have recorded, which could change the amount we have recorded for our investments and other comprehensive income on our Unaudited Consolidated Balance Sheet as of June 30, 2018.
14
UNITED INSURANCE HOLDINGS CORP.
Notes to Unaudited Consolidated Financial Statements
June 30, 2018
The following table presents the fair value of our financial instruments measured on a recurring basis by level at June 30, 2018 and December 31, 2017:
Total | Level 1 | Level 2 | Level 3 | ||||||||||||
June 30, 2018 | |||||||||||||||
U.S. government and agency securities | $ | 88,481 | $ | — | $ | 88,481 | $ | — | |||||||
Foreign government | 2,979 | — | 2,979 | — | |||||||||||
States, municipalities and political subdivisions | 159,815 | — | 159,815 | — | |||||||||||
Public utilities | 25,172 | — | 25,172 | — | |||||||||||
Corporate securities | 284,328 | — | 284,328 | — | |||||||||||
Mortgage-backed securities | 207,646 | — | 207,646 | — | |||||||||||
Asset-backed securities | 79,778 | — | 79,778 | — | |||||||||||
Redeemable preferred stocks | 685 | 563 | 122 | — | |||||||||||
Total fixed maturities | 848,884 | 563 | 848,321 | — | |||||||||||
Mutual funds | 47,560 | 47,560 | — | — | |||||||||||
Public utilities | 2,242 | 2,242 | — | — | |||||||||||
Other common stocks | 31,802 | 31,802 | — | — | |||||||||||
Non-redeemable preferred stocks | 1,741 | 1,741 | — | — | |||||||||||
Total equity securities | 83,345 | 83,345 | — | — | |||||||||||
Other long-term investments | 8,242 | 300 | 7,296 | 646 | |||||||||||
Total investments | $ | 940,471 | $ | 84,208 | $ | 855,617 | $ | 646 | |||||||
December 31, 2017 | |||||||||||||||
U.S. government and agency securities | $ | 92,626 | $ | — | $ | 92,626 | $ | — | |||||||
Foreign government | 2,036 | — | 2,036 | — | |||||||||||
States, municipalities and political subdivisions | 201,512 | — | 201,512 | — | |||||||||||
Public utilities | 20,257 | — | 20,257 | — | |||||||||||
Corporate securities | 287,562 | — | 287,562 | — | |||||||||||
Mortgage-backed securities | 143,265 | — | 143,265 | — | |||||||||||
Asset-backed securities | 14,905 | — | 14,905 | — | |||||||||||
Redeemable preferred stocks | 692 | 692 | — | — | |||||||||||
Total fixed maturities | 762,855 | 692 | 762,163 | — | |||||||||||
Mutual Funds | 31,924 | 31,924 | — | — | |||||||||||
Public utilities | 1,702 | 1,702 | — | — | |||||||||||
Other common stocks | 27,902 | 27,902 | — | — | |||||||||||
Non-redeemable preferred stocks | 1,767 | 1,767 | — | — | |||||||||||
Total equity securities | 63,295 | 63,295 | — | — | |||||||||||
Other long-term investments | 8,381 | 300 | 7,447 | 634 | |||||||||||
Total investments | $ | 834,531 | $ | 64,287 | $ | 769,610 | $ | 634 | |||||||
15
UNITED INSURANCE HOLDINGS CORP.
Notes to Unaudited Consolidated Financial Statements
June 30, 2018
The table below presents the rollforward of our Level 3 investments held at fair value during the six months ended June 30, 2018:
Other Investments | ||||
December 31, 2017 | $ | 634 | ||
Transfers in | — | |||
Partnership income | 71 | |||
Return of capital | (93 | ) | ||
Unrealized gains in accumulated other comprehensive income | 34 | |||
June 30, 2018 | $ | 646 | ||
We are responsible for the determination of fair value and the supporting assumptions and methodologies. We have implemented a system of processes and controls designed to provide assurance that our assets and liabilities are appropriately valued. For fair values received from third parties, our processes are designed to provide assurance that the valuation methodologies and inputs are appropriate and consistently applied, the assumptions are reasonable and consistent with the objective of determining fair value, and the fair values are accurately recorded.
At the end of each quarter, we determine whether we need to transfer the fair values of any securities between levels of the fair value hierarchy and, if so, we report the transfer as of the end of the quarter. During the quarter ended June 30, 2018, we did not transfer any investments between levels. We used unobservable inputs to derive our estimated fair value for Level 3 investments, and the unobservable inputs are significant to the overall fair value measurement.
For our investments in U.S. government securities that do not have prices in active markets, agency securities, state and municipal governments, and corporate bonds, we obtain the fair values from our investment custodians, which use a third-party valuation service. The valuation service calculates prices for our investments in the aforementioned security types on a month-end basis by using several matrix-pricing methodologies that incorporate inputs from various sources. The model the valuation service uses to price U.S. government securities and securities of states and municipalities incorporates inputs from active market makers and inter-dealer brokers. To price corporate bonds and agency securities, the valuation service calculates non-call yield spreads on all issuers, uses option-adjusted yield spreads to account for any early redemption features, and adds final spreads to the U.S. Treasury curve at 3 p.m. (ET) as of quarter end. Since the inputs the valuation service uses in its calculations are not quoted prices in active markets, but are observable inputs, they represent Level 2 inputs.
16
UNITED INSURANCE HOLDINGS CORP.
Notes to Unaudited Consolidated Financial Statements
June 30, 2018
Other investments
We acquired investments in limited partnerships, recorded in the other investments line of our Unaudited Consolidated Balance Sheets and these investments are currently being accounted for at fair value utilizing a discounted cash flow methodology. The estimated fair value of our investments in the limited partnership interests at June 30, 2018 was $7,942,000. We have fully funded two investments and are still obligated to fund an additional $3,170,000 for the remaining four investments.
The information presented in the table below is as of June 30, 2018:
Book Value | Unrealized Gain | Unrealized Loss | Fair Value | |||||||||||||
Limited partnership investments | $ | 7,584 | $ | 358 | $ | — | $ | 7,942 | ||||||||
Certificates of deposit | 300 | — | — | 300 | ||||||||||||
Total other investments | $ | 7,884 | $ | 358 | $ | — | $ | 8,242 | ||||||||
The following table summarizes the quantitative impact that the significant unobservable inputs used to estimate the fair value of our Level 3 investments has on the estimated fair value of our investments shown in the tables above. Those limited partnership investments being carried at cost are excluded from the table below. Our investment in DCR Mortgage Partners VI, L.P. (DCR VI) was valued using a duration of 60 months for both periods presented below.
Fair Value | Valuation | Rate | ||||||||
Impact | Technique | Unobservable Input | Adjustment | |||||||
June 30, 2018 | ||||||||||
DCR VI | $ | (32 | ) | Discounted cash flow | Discount rate based on D&B paydex scale | 2.35% | ||||
December 31, 2017 | ||||||||||
DCR VI | $ | (37 | ) | Discounted cash flow | Discount rate based on D&B paydex scale | 2.35% | ||||
Portfolio loans
At December 31, 2017, we held commercial portfolio loans of $20,000,000. We believe that making sound loans is a necessary and desirable means of employing funds available for investment. Recognizing our obligation to our stockholders, management is expected to seek to develop and make sound, profitable loans that resources permit and that opportunity affords. These were short-term collateralized loans (less than one year), which were repaid in full in April 2018, primarily from cash flows of the borrowers.
4) | ACQUISITIONS |
We account for business acquisitions in accordance with the acquisition method of accounting, which requires, among other things, that most assets acquired, liabilities assumed and earn-out consideration be recognized at their fair values as of the acquisition date. Measurement period adjustments to provisional purchase price allocations are recognized in the period in which they are determined as if the accounting had been completed on the acquisition date.
On April 3, 2017, we completed our acquisition of AmCo and its subsidiaries. The transaction was completed through a series of mergers that ultimately resulted in the Company issuing 20,956,355 shares of its common stock as consideration to the equity holders of RDX Holding, LLC, the former parent company of AmCo. As a result of the mergers, AmCo merged with and into a wholly-owned subsidiary of the Company. The acquisition of AmCo supported our growth strategy and further strengthened our overall position in the commercial property and casualty insurance market. Goodwill recorded in the transaction, which reflected the synergies expected from the acquisition and enhanced reinsurance opportunities, is not tax deductible.
The operations of AmCo are included in our Unaudited Consolidated Statements of Comprehensive Income effective April 3, 2017. The final purchase price allocation is as follows:
17
UNITED INSURANCE HOLDINGS CORP.
Notes to Unaudited Consolidated Financial Statements
June 30, 2018
Cash and cash equivalents | $ | 95,284 | |
Investments | 222,920 | ||
Premium and agents' receivable | 31,439 | ||
Reinsurance recoverable | 20,230 | ||
Prepaid reinsurance premiums | 22,544 | ||
Intangible assets | 30,286 | ||
Insurance contract asset | 33,812 | ||
Goodwill | 59,475 | ||
Other assets | 4,591 | ||
Unpaid losses and loss adjustment expenses | (60,529 | ) | |
Unearned premiums | (128,824 | ) | |
Reinsurance payable | (22,406 | ) | |
Deferred taxes | (17,093 | ) | |
Other liabilities | (6,261 | ) | |
Total purchase price | $ | 285,468 | |
The unaudited pro forma financial information below has been prepared as if the acquisition of AmCo had taken place on January 1, 2017. The unaudited pro forma financial information is not necessarily indicative of the results that we would have achieved had the transaction taken place on January 1, 2017, and the unaudited pro forma information does not purport to be indicative of future financial operating results.
Six Months Ended June 30, | |||||||||||
2017 | |||||||||||
As | Pro Forma | ||||||||||
Reported | Adjustments | Pro Forma | |||||||||
Revenues | $ | 300,706 | $ | 38,096 | $ | 338,802 | |||||
Net income (loss) | 11,156 | 6,712 | 17,868 | ||||||||
Diluted earnings per share | 0.35 | — | 0.42 | ||||||||
5) EARNINGS PER SHARE
Basic earnings per share (EPS) is based on the weighted average number of common shares outstanding for the period, excluding any dilutive common share equivalents. Diluted EPS reflects the potential dilution resulting from the vesting of restricted stock awards. The following table shows the computation of basic and diluted EPS for the three and six-month periods ended June 30, 2018 and 2017, respectively:
18
UNITED INSURANCE HOLDINGS CORP.
Notes to Unaudited Consolidated Financial Statements
June 30, 2018
Three Months Ended June 30, | Six Months Ended June 30, | |||||||||||||||
2018 | 2017 | 2018 | 2017 | |||||||||||||
Numerator: | ||||||||||||||||
Net income attributable to common stockholders | $ | 14,701 | $ | 7,257 | $ | 23,069 | $ | 11,156 | ||||||||
Denominator: | ||||||||||||||||
Weighted-average shares outstanding | 42,648,660 | 41,799,041 | 42,615,484 | 31,691,267 | ||||||||||||
Effect of dilutive securities | 141,686 | 228,972 | 154,118 | 223,292 | ||||||||||||
Weighted-average diluted shares | 42,790,346 | 42,028,013 | 42,769,602 | 31,914,559 | ||||||||||||
Basic earnings per share | $ | 0.34 | $ | 0.17 | $ | 0.54 | $ | 0.35 | ||||||||
Diluted earnings per share | $ | 0.34 | $ | 0.17 | $ | 0.54 | $ | 0.35 | ||||||||
See Note 16 of these Notes to Unaudited Consolidated Financial Statements for additional information on the stock grants related to dilutive securities.
6) PROPERTY AND EQUIPMENT, NET
Property and equipment, net consisted of the following:
June 30, 2018 | December 31, 2017 | |||||||
Land | $ | 2,114 | $ | 2,114 | ||||
Building and building improvements | 6,504 | 5,695 | ||||||
Computer hardware and software | 17,640 | 18,985 | ||||||
Office furniture and equipment | 2,752 | 3,413 | ||||||
Leasehold improvements | 20 | — | ||||||
Total, at cost | 29,030 | 30,207 | ||||||
Less: accumulated depreciation and amortization | (11,288 | ) | (12,916 | ) | ||||
Property and equipment, net | $ | 17,742 | $ | 17,291 | ||||
Depreciation and amortization expense under property and equipment was $819,000 and $1,421,000 for the three months ended June 30, 2018 and 2017, respectively, and $1,563,000 and $2,036,000 for the six months ended June 30, 2018 and 2017, respectively.
7) GOODWILL AND INTANGIBLE ASSETS
Goodwill
The carrying amount of goodwill, both at June 30, 2018 and December 31, 2017, was $73,045,000. There was no goodwill acquired or disposed of during the three-month or six-month periods ended June 30, 2018.
Using a qualitative assessment, we completed our most recent goodwill impairment testing during the fourth quarter of 2017 and determined that there was no impairment in the value of the asset as of December 31, 2017. No impairment loss in the value of goodwill was recognized during the six months ended June 30, 2018. Additionally, there was no accumulated impairment or accumulated amortization related to goodwill at June 30, 2018 or December 31, 2017.
19
UNITED INSURANCE HOLDINGS CORP.
Notes to Unaudited Consolidated Financial Statements
June 30, 2018
Intangible Assets
The following is a summary of intangible assets excluding goodwill recorded as intangible assets on our Unaudited Consolidated Balance Sheets:
June 30, 2018 | December 31, 2017 | |||||||
Intangible assets subject to amortization | $ | 30,525 | $ | 41,715 | ||||
Indefinite-lived intangible assets(1) | 3,556 | 3,556 | ||||||
Total | $ | 34,081 | $ | 45,271 | ||||
(1) Indefinite-lived intangible assets are comprised of state insurance and agent licenses, as well as perpetual software licenses.
Intangible assets subject to amortization consisted of the following:
Weighted-average remaining amortization period (in years) | Gross carrying amount | Accumulated amortization | Net carrying amount | |||||||||||
June 30, 2018 | ||||||||||||||
Value of business acquired | — | $ | 42,788 | $ | (42,788 | ) | $ | — | ||||||
Agency agreements acquired | 7.6 | 34,661 | (8,917 | ) | 25,744 | |||||||||
Trade names acquired | 5.6 | 6,381 | (1,600 | ) | 4,781 | |||||||||
Total | $ | 83,830 | $ | (53,305 | ) | $ | 30,525 | |||||||
December 31, 2017 | ||||||||||||||
Value of business acquired | 0.3 | $ | 42,788 | $ | (34,335 | ) | $ | 8,453 | ||||||
Agency agreements acquired | 8.0 | 34,661 | (6,669 | ) | 27,992 | |||||||||
Trade names acquired | 6.0 | 6,381 | (1,111 | ) | 5,270 | |||||||||
Total | $ | 83,830 | $ | (42,115 | ) | $ | 41,715 | |||||||
No impairment in the value of amortizing or non-amortizing intangible assets was recognized during the three and six months ended June 30, 2018 and 2017.
Amortization expense of our intangible assets was $1,365,000 and $10,167,000 for the three months ended June 30, 2018 and 2017, respectively. Amortization expense of our intangible assets was $11,190,000 and $11,522,000 for the six months ended June 30, 2018 and 2017, respectively.
Estimated amortization expense of our intangible assets to be recognized by the Company over the next five years is as follows:
Year ending December 31, | Estimated Amortization Expense | |||
Remaining 2018 | $ | 2,730 | ||
2019 | 5,355 | |||
2020 | 4,267 | |||
2021 | 3,555 | |||
2022 | 3,246 | |||
2023 | 3,246 | |||
20
UNITED INSURANCE HOLDINGS CORP.
Notes to Unaudited Consolidated Financial Statements
June 30, 2018
8) REINSURANCE
Our reinsurance program is designed, utilizing our risk management methodology, to address our exposure to catastrophes. According to the Insurance Service Office (ISO), a catastrophe loss is defined as a single unpredictable incident or series of closely related incidents that result in $25,000,000 or more in U.S. industry-wide direct insured losses to property and that affect a significant number of policyholders and insurers (ISO catastrophes). In addition to ISO catastrophes, we also include as catastrophes those events (non-ISO catastrophes), which may include losses, that we believe are, or will be, material to our operations, either in amount or in number of claims made.
Our program provides reinsurance protection for catastrophes including hurricanes, tropical storms and tornadoes. These reinsurance agreements are part of our catastrophe management strategy, which is intended to provide our stockholders an acceptable return on the risks assumed in our property business, and to reduce variability of earnings, while providing protection to our policyholders.
Effective June 1, 2018, UPC Insurance, through our wholly-owned insurance subsidiaries ACIC, UPC, FSIC, IIC and BlueLine, entered into reinsurance agreements with private reinsurers and with the Florida State Board of Administration, which administers the Florida Hurricane Catastrophe Fund (FHCF). These agreements provide coverage for catastrophe losses from named or numbered windstorms and earthquakes in all states in which UPC Insurance operates except for the agreement with FHCF, which only provides coverage in Florida against storms that the National Hurricane Center designates as hurricanes.
Highlights of the coverage within these contracts include:
• | Increased frequency and severity protection, with an overall program exhaustion point excess of $3,100,000,000; |
◦ | Sufficient coverage for approximately a single 1-in-400 year event; |
◦ | Sufficient coverage for a 1-in-100 year event followed by a 1-in-50 year event in the same season; |
• | Lower per occurrence retention levels which include all BlueLine business; |
◦ | First event retention of $60,000,000 in Florida and $25,000,000 outside of Florida which, as a percentage of the group equity, represents approximately 11% and 4.6%, respectively; |
◦ | $25,000,000 for second event in all states; |
• | Successful completion of Armor Re II CAT Bond providing $100,000,000 of limit on a multi-year basis; |
• | Coverage from 41 reinsurers with 93% of the open market limit placed on a fully collateralized basis or with reinsurers having an A+ or better A.M. Best financial strength rating; and |
• | Up to $262,500,000 of multi-year limit including the CAT Bond limit. |
For the FHCF reimbursement contracts effective June 1, 2018, UPC Insurance has elected a 45% coverage for all its insurance subsidiaries with Florida exposure. We estimate the total mandatory FHCF layer will provide approximately $907,000,000 of aggregate coverage with varying retentions and limits among the three FHCF contracts that all inure to the benefit of the open market coverage secured from private reinsurers.
The $2,185,000,000 of aggregate open market catastrophe reinsurance coverage is structured into multiple layers with a cascading feature that all layers drop down as layers below them are exhausted. Any remaining unused layer protection drops down for subsequent events until exhausted, ensuring there are no potential gaps in coverage up to the $3,100,000,000 program exhaustion point.
Effective January 1, 2018, UPC Insurance, through its wholly-owned insurance subsidiaries UPC, ACIC, IIC and FSIC, renewed the aggregate excess of loss agreement with a private reinsurer. The treaty provides coverage for all catastrophe perils other than hurricanes, tropical storms, tropical depressions and earthquakes. Under this agreement, we will retain, in the aggregate, 100% of those losses up to 4.75% of the covered companies’ gross earned premium. The reinsurer will then be liable for all losses in excess of 4.75% of the covered companies’ gross earned premium in the aggregate not to exceed $20,000,000 over the term of the treaty. Recoveries under this treaty will be calculated quarterly based on the cumulative gross earned premium. We ceded $20,000,000 of catastrophe losses to this treaty for the six months ended June 30, 2018. Reinsurance recoveries under this agreement may change in future periods as the cumulative subject gross earned premiums and eligible gross catastrophe losses incurred are recognized in subsequent calendar quarters during 2018 in accordance with the terms of the agreement. No allowance has been recorded against the $20,000,000 reinsurance recoverable at June 30, 2018 since future catastrophe losses are inherently unpredictable and cannot be reasonably estimated.
Effective December 31, 2017, UPC Insurance, through our wholly-owned insurance subsidiary UPC, replaced its quota share agreement with private reinsurers. The quota share agreement has a term of 12 months and a cession rate of 20% for all
21
UNITED INSURANCE HOLDINGS CORP.
Notes to Unaudited Consolidated Financial Statements
June 30, 2018
subject business. The quota share agreement provides coverage for all catastrophe perils and attritional losses. For all catastrophe perils, the quota share agreement provides ground-up protection effectively reducing our retention for catastrophe losses. Quota share reinsurers’ participation in paying attritional losses is subject to an attritional loss ratio cap.
We amortize our prepaid reinsurance premiums over the annual agreement period, and we record that amortization in ceded premiums earned on our Unaudited Consolidated Statements of Comprehensive Income. The table below summarizes the amounts of our ceded premiums written under the various types of agreements, as well as the amortization of prepaid reinsurance premiums:
Three Months Ended June 30, | Six Months Ended June 30, | ||||||||||||||
2018 | 2017 | 2018 | 2017 | ||||||||||||
Quota share | $ | (27,400 | ) | $ | (27,411 | ) | $ | (47,972 | ) | $ | (46,781 | ) | |||
Excess-of-loss | (350,230 | ) | (315,457 | ) | (364,091 | ) | (325,686 | ) | |||||||
Equipment & identity theft | (2,631 | ) | (2,596 | ) | (4,751 | ) | (4,669 | ) | |||||||
Flood | (5,568 | ) | (5,369 | ) | (9,239 | ) | (8,760 | ) | |||||||
Ceded premiums written | $ | (385,829 | ) | $ | (350,833 | ) | $ | (426,053 | ) | $ | (385,896 | ) | |||
Increase (decrease) in ceded unearned premiums | 267,494 | 248,867 | 193,668 | 209,048 | |||||||||||
Ceded premiums earned | $ | (118,335 | ) | $ | (101,966 | ) | $ | (232,385 | ) | $ | (176,848 | ) | |||
Current year catastrophe losses disaggregated between named and numbered storms and all other catastrophe loss events are shown in the following table:
2018 | 2017 | |||||||||||||||||||
Number of Events | Incurred Loss and LAE (1) | Combined Ratio Impact | Number of Events | Incurred Loss and LAE (1) | Combined Ratio Impact | |||||||||||||||
Three Months Ended June 30, | ||||||||||||||||||||
Current period catastrophe losses incurred | ||||||||||||||||||||
Named and numbered storms | 1 | $ | 1,214 | 0.7 | % | 1 | $ | 264 | 0.2 | % | ||||||||||
All other catastrophe loss events | 8 | 16,126 | 9.4 | % | 14 | 21,534 | 13.5 | % | ||||||||||||
Total | 9 | $ | 17,340 | 10.1 | % | 15 | $ | 21,798 | 13.7 | % | ||||||||||
Six Months Ended June 30, | ||||||||||||||||||||
Current period catastrophe losses incurred | ||||||||||||||||||||
Named and numbered storms | 1 | $ | 1,214 | 0.3 | % | 1 | $ | 264 | 0.1 | % | ||||||||||
All other catastrophe loss events | 16 | 22,443 | 6.7 | % | 14 | 32,146 | 12.0 | % | ||||||||||||
Total | 17 | $ | 23,657 | 7.0 | % | 15 | $ | 32,410 | 12.1 | % | ||||||||||
(1) Incurred loss and LAE (as defined below) is equal to losses and LAE paid plus the change in case and incurred but not reported reserves. Shown net of losses ceded to reinsurers. Incurred loss and LAE and number of events includes the development on storms during the year in which it occurred.
We collected cash recoveries under our reinsurance agreements totaling $151,526,000 and $18,081,000 for the three month periods ended June 30, 2018 and 2017, respectively, and $274,038,000 and $20,565,000 for the six-month periods ended June 30, 2018 and 2017, respectively.
We write flood insurance under an agreement with the National Flood Insurance Program. We cede 100% of the premiums written and the related risk of loss to the federal government. We earn commissions for the issuance of flood policies based upon a fixed percentage of net written premiums and the processing of flood claims based upon a fixed percentage of incurred losses, and we can earn additional commissions by meeting certain growth targets for the number of in-force policies. We recognized commission revenue from our flood program of $399,000 and $303,000 for the three-month periods ended June 30, 2018 and 2017, respectively, and $787,000 and $597,000 for the six-month periods ended June 30, 2018 and 2017, respectively.
9) LIABILITY FOR UNPAID LOSSES AND LOSS ADJUSTMENT EXPENSE (LAE)
22
UNITED INSURANCE HOLDINGS CORP.
Notes to Unaudited Consolidated Financial Statements
June 30, 2018
We determine the reserve for unpaid losses on an individual case basis for all incidents reported. The liability also includes amounts for incurred but not reported (IBNR) claims as of the balance sheet date.
The table below shows the analysis of our reserve for unpaid losses for the six months ended June 30, 2018 and 2017 on a GAAP basis:
June 30, | |||||||
2018 | 2017 | ||||||
Balance at January 1 | $ | 482,232 | $ | 140,855 | |||
Less: reinsurance recoverable on unpaid losses | 305,673 | 18,724 | |||||
Net balance at January 1 | $ | 176,559 | $ | 122,131 | |||
Acquisition of AmCo reserves (net of reinsurance recoverables of $19,945) | — | 40,583 | |||||
Incurred related to: | |||||||
Current year | 167,392 | 152,061 | |||||
Prior years | (1,551 | ) | (1,790 | ) | |||
Total incurred | $ | 165,841 | $ | 150,271 | |||
Paid related to: | |||||||
Current year | 83,297 | 91,732 | |||||
Prior years | 92,937 | 69,878 | |||||
Total paid | $ | 176,234 | $ | 161,610 | |||
Net balance at June 30 | $ | 166,166 | $ | 151,375 | |||
Plus: reinsurance recoverable on unpaid losses | 266,265 | 53,319 | |||||
Balance at June 30 | $ | 432,431 | $ | 204,694 | |||
Composition of reserve for unpaid losses and LAE: | |||||||
Case reserves | $ | 230,926 | $ | 94,608 | |||
IBNR reserves | 201,505 | 110,086 | |||||
Balance at June 30 | $ | 432,431 | $ | 204,694 | |||
Based upon our internal analysis and our review of the statement of actuarial opinion provided by our actuarial consultants, we believe that the reserve for unpaid losses reasonably represents the amount necessary to pay all claims and related expenses which may arise from incidents that have occurred as of the balance sheet date.
As reflected by our losses incurred related to prior years, the favorable development experienced at June 30 2018 and 2017, respectively, was primarily the result of the incurrence of fewer losses than expected, as compared to those same periods in the 2017 and 2016 accident years.
10) LONG-TERM DEBT
Long-Term Debt
The table below presents all long-term debt outstanding as of June 30, 2018 and December 31, 2017:
Effective Interest Rate | Carrying Value at | ||||||||||
Maturity | June 30, 2018 | December 31, 2017 | |||||||||
$150M Senior Notes Payable | December 15, 2027 | 6.25% | $ | 150,000 | $ | 150,000 | |||||
Florida State Board of Administration Note Payable | July 1, 2026 | 2.77% | 9,412 | 10,000 | |||||||
BB&T Term Note Payable | May 26, 2031 | 3.63% | 4,478 | 4,651 | |||||||
Total long-term debt | $ | 163,890 | $ | 164,651 | |||||||
$150M Senior Notes Payable
On December 13, 2017, we issued $150,000,000 of senior notes (the $150M senior notes) that will mature in 10 years and bear interest at a rate equal to 6.25% per annum payable semi-annually on each June 15 and December 15, commencing June 15, 2018. The $150M senior notes are senior unsecured obligations of the Company. We may redeem the $150M senior notes at our option, at any time and from time to time in whole or in part, at a redemption price equal to the greater of (i) 100% of the principal amount of the notes to be redeemed and (ii) the sum of the present values of the remaining scheduled payments of principal and interest thereon from the date of redemption to September 15, 2027. On or after that date, we may redeem the $150M senior notes at par.
Florida State Board of Administration Note Payable
On September 22, 2006, we issued a $20,000,000, 20-year note payable to the Florida State Board of Administration (the SBA note). For the first three years of the SBA note we were required to pay interest only. On October 1, 2009, we began to repay the principal in addition to interest. The note bears an annual interest rate equivalent to the 10-year U.S. Treasury Bond rate. The rate will be adjusted quarterly for the term of the SBA note based on the 10-year Constant Maturity Treasury rate.
BB&T Term Note Payable
On May 26, 2016, we issued a $5,200,000, 15-year term note payable to BB&T (the BB&T note) with the intent to use the funds to purchase, renovate, furnish and equip our home office. The note bears interest at 1.65% in excess of the one-month LIBOR. In the event of default, BB&T may, among other things, declare its loan immediately due and payable, require us to pledge additional collateral to the bank, and take possession of and foreclose upon our home office, which has been pledged to the bank as security for the loan.
Financial Covenants
The $150M senior notes, SBA note and BB&T note contain representations and warranties, conditions and covenants. If these requirements are not met, all amounts outstanding or otherwise owed could become due and payable immediately and other limitations could be placed on our ability to use any available borrowing capacity. At June 30, 2018, we were in compliance with all covenants as specified in the $150M senior notes, SBA note and BB&T note. Refer to Part I; Item 2 for additional information regarding our financial covenants.
Debt Issuance Costs
The table below presents the rollforward of our debt issuance costs paid, in conjunction with the debt instruments described above, during the six months ended June 30, 2018:
23
UNITED INSURANCE HOLDINGS CORP.
Notes to Unaudited Consolidated Financial Statements
June 30, 2018
2018 | 2017 | ||||||
Balance at January 1, | $ | 3,287 | $ | 549 | |||
Additions | 63 | — | |||||
Amortization | (178 | ) | (57 | ) | |||
Balance at June 30, | $ | 3,172 | $ | 492 | |||
11) COMMITMENTS AND CONTINGENCIES
We are involved in claims-related legal actions arising in the ordinary course of business. We accrue amounts resulting from claims-related legal actions in unpaid losses and LAE during the period that we determine an unfavorable outcome becomes probable and we can estimate the amounts. Management makes revisions to our estimates based on its analysis of subsequent information that we receive regarding various factors, including: (i) per claim information; (ii) company and industry historical loss experience; (iii) judicial decisions and legal developments in the awarding of damages, and (iv) trends in general economic conditions, including the effects of inflation.
At June 30, 2018, we were not involved in any material non-claims-related legal actions.
See Note 10 of these Notes to Unaudited Consolidated Financial Statements for information regarding commitments related to long-term debt, and Note 12 of these Notes to Unaudited Consolidated Financial Statements for information regarding commitments related to regulatory actions.
12) STATUTORY ACCOUNTING AND REGULATION
The insurance industry is heavily regulated. State laws and regulations, as well as national regulatory agency requirements, govern the operations of all insurers such as our insurance subsidiaries. The various laws and regulations require that insurers maintain minimum amounts of statutory surplus and risk-based capital, restrict insurers' ability to pay dividends, specify allowable investment types and investment mixes, and subject insurers to assessments. Our insurance subsidiaries, UPC and ACIC, are domiciled in Florida, while FSIC and IIC are domiciled in Hawaii and New York, respectively. At June 30, 2018, and during the three and six months then ended, our insurance subsidiaries met all regulatory requirements of the states in which they operate. In March 2018, we received a recoupable assessment for $570,000 from the Texas Fair Plan Association. We did not receive any additional significant assessments from regulatory authorities in the states in which our insurance subsidiaries operate.
The National Association of Insurance Commissioners (NAIC) has Risk-Based Capital (RBC) guidelines for insurance companies that are designed to assess capital adequacy and to raise the level of protection that statutory surplus provides for policyholders. Most states, including Florida, Hawaii and New York, have enacted statutory requirements adopting the NAIC RBC guidelines, and insurers having less statutory surplus than required will be subject to varying degrees of regulatory action, depending on the level of capital inadequacy. State insurance regulatory authorities could require an insurer to cease operations in the event the insurer fails to maintain the required statutory capital.
The state laws of Florida, Hawaii and New York permit an insurer to pay dividends or make distributions out of that part of statutory surplus derived from net operating profit and net realized capital gains. The state laws further provide calculations to determine the amount of dividends or distributions that can be made without the prior approval of the insurance regulatory authorities in those states and the amount of dividends or distributions that would require prior approval of the insurance regulatory authorities in those states. Statutory RBC requirements may further restrict our insurance subsidiaries' ability to pay dividends or make distributions if the amount of the intended dividend or distribution would cause statutory surplus to fall below minimum RBC requirements.
The SBA note is considered a surplus note pursuant to statutory accounting principles. As a result, UPC is subject to the authority of the Insurance Commissioner of the State of Florida with regard to its ability to repay principal and interest on the SBA note. Any payment of principal or interest requires permission from the insurance regulatory authority.
We have reported our insurance subsidiaries' assets, liabilities and results of operations in accordance with GAAP, which varies from statutory accounting principles prescribed or permitted by state laws and regulations, as well as by general industry practices. The following items are principal differences between statutory accounting and GAAP:
24
UNITED INSURANCE HOLDINGS CORP.
Notes to Unaudited Consolidated Financial Statements
June 30, 2018
• | Statutory accounting requires that we exclude certain assets, called non-admitted assets, from the balance sheet. |
• | Statutory accounting requires us to expense policy acquisition costs when incurred, while GAAP allows us to defer to the extent realizable, and amortize policy acquisition costs over the estimated life of the policies. |
• | Statutory accounting requires that surplus notes, also known as surplus debentures, be recorded in statutory surplus, while GAAP requires us to record surplus notes as a liability. |
• | Statutory accounting allows certain investments to be carried at amortized cost or fair value based on the rating received from the Securities Valuation Office of the NAIC, while they are recorded at fair value for GAAP because the investments are held as available for sale. |
• | Statutory accounting allows ceding commission income to be recognized when written if the cost of acquiring and renewing the associated business exceeds the ceding commissions, but under GAAP such income is deferred and recognized over the coverage period. |
• | Statutory accounting requires that unearned premiums and loss reserves are presented net of related reinsurance rather than on a gross basis under GAAP. |
• | Statutory accounting requires that a provision for reinsurance liability be established for reinsurance recoverable on paid losses aged over 90 days and for unsecured amounts recoverable from unauthorized reinsurers. Under GAAP there is no charge for uncollateralized amounts ceded to a company not licensed in the insurance subsidiary's domiciliary state and a reserve for uncollectable reinsurance is charged through earnings rather than surplus or equity. |
• | Statutory accounting requires an additional admissibility test and the change in deferred income tax is reported directly in capital and surplus, rather than being reported as a component of income tax expense under GAAP. |
Our insurance subsidiaries must each file with the various insurance regulatory authorities an “Annual Statement” which reports, among other items, statutory net income (loss) and surplus as regards policyholders, which is called stockholders' equity under GAAP. For the three and six months ended June 30, 2018, our combined recorded statutory net income was $16,546,000 and $25,538,000, respectively. For the three and six months ended June 30, 2017, our combined recorded statutory net income (loss) was $(507,000) and $4,590,000, respectively.
Our insurance subsidiaries must maintain capital and surplus ratios or balances as determined by the regulatory authority of the states in which they are domiciled. At June 30, 2018, we have met these requirements. The amount of surplus as regards policyholders for our regulated entities at June 30, 2018 and December 31, 2017, was $410,307,000 and $389,384,000, respectively.
13) RELATED PARTY TRANSACTIONS
One of our executive officers, Ms. Salmon, is a former partner at the law firm of Groelle & Salmon, PA, where her spouse remains partner and co-owner. Groelle & Salmon, PA provides legal representation to us related to our claims litigation, and also provided representation to us for several years prior to Ms. Salmon joining UPC Insurance in 2014. During the three months ended June 30, 2018 and 2017, Groelle & Salmon, PA billed us approximately $717,000 and $775,000, respectively. During the six months ended June 30, 2018 and 2017, Groelle & Salmon, PA billed us approximately $1,425,000 and $1,643,000, respectively. Ms. Salmon's spouse has a 50% interest in these billings, or approximately $359,000 and $388,000, for the three months ended June 30, 2018 and 2017, respectively, and approximately $713,000 and $822,000, for the six months ended June 30, 2018 and 2017, respectively.
AmRisc, a managing general agent, handles the underwriting, claims processing, premium collection and reinsurance review for AmCo. R. Daniel Peed, Vice Chairman of our Board of Directors (Board), beneficially owns approximately 7.7% of AmRisc and is also the Chief Executive Officer of AmRisc.
In accordance with the managing general agent underwriting contract with AmRisc, we recorded $127,757,000 and $221,763,000 of gross written premiums for the three and six month periods ended June 30, 2018, respectively, and $110,310,000 for the three month period ended June 30, 2017, resulting in fees and commission (including a profit commission) of $34,737,000 and $59,166,000, for the three and six month periods ended June 30, 2018, respectively, and $16,823,000 for
25
UNITED INSURANCE HOLDINGS CORP.
Notes to Unaudited Consolidated Financial Statements
June 30, 2018
the three month period ended June 30, 2017, due to AmRisc. Receivables are stated net of the fees and commission due under the contract.
In addition to the direct premiums written, we recorded $1,805,000 and $3,366,000 in ceded premiums to AmRisc as a reinsurance intermediary for the three and six month periods ended June 30, 2018, respectively, and $1,772,000 for the three month period ended June 30, 2017. We also incurred $5,000 and $9,000, respectively, during the three and six month periods ended June 30, 2018, respectively, and $16,000 for the three month period ended June 30, 2017, for rent under a sublease agreement with AmRisc.
Net premiums receivable (net of commissions) of $67,842,000 were due from AmRisc as of June 30, 2018. These premiums were paid by AmRisc to our premium trust account by wire transfer within 15 days of collection pursuant to the underwriting contract with AmRisc.
14) ACCUMULATED OTHER COMPREHENSIVE INCOME
We report changes in other comprehensive income items within comprehensive income on the Unaudited Consolidated Statements of Comprehensive Income, and we include accumulated other comprehensive income as a component of stockholders' equity on our Unaudited Consolidated Balance Sheets.
The table below details the components of accumulated other comprehensive income at period end:
Pre-Tax Amount | Tax (Expense) Benefit | Net-of-Tax Amount | |||||||||
December 31, 2017 | $ | 12,044 | $ | (2,823 | ) | $ | 9,221 | ||||
Reclassification adjustment for adoption of ASU 2016-01(1) | (12,300 | ) | 2,962 | (9,338 | ) | ||||||
Adjusted balance at January 1, 2018 | (256 | ) | 139 | (117 | ) | ||||||
Changes in net unrealized gains on investments | (15,052 | ) | 3,506 | (11,546 | ) | ||||||
Reclassification adjustment for realized gains | 227 | (57 | ) | 170 | |||||||
June 30, 2018 | $ | (15,081 | ) | $ | 3,588 | $ | (11,493 | ) | |||
(1) Reflects the fair value changes on equity securities as of December 31, 2017, which are reclassified under the new accounting guidance. Refer to Note 2 in these Notes to Unaudited Consolidated Financial Statements for further information.
15) STOCKHOLDERS' EQUITY
Our Board declared dividends on our outstanding shares of common stock to stockholders of record as follows for the periods presented (in thousands except per share amounts):
Six Months Ended June 30, | ||||||||||||||||
2018 | 2017 | |||||||||||||||
Per Share Amount | Aggregate Amount | Per Share Amount | Aggregate Amount | |||||||||||||
First Quarter | $ | 0.06 | $ | 2,565 | $ | 0.06 | $ | 1,301 | ||||||||
Second Quarter | $ | 0.06 | $ | 2,565 | $ | 0.06 | $ | 2,561 | ||||||||
See Note 16 in these Notes to Unaudited Consolidated Financial Statements for information regarding stock-based compensation activity.
16) STOCK-BASED COMPENSATION
We account for stock-based compensation under the fair value recognition provisions of ASC Topic 718 - Compensation - Stock Compensation.
Stock-based compensation cost for restricted stock grants is measured based on the closing fair market value of our common stock on the date of grant. We recognize stock-based compensation cost over the award’s requisite service period on a straight-line basis for time-based restricted stock grants.
We granted 76,250 and 86,210 shares of restricted common stock during the three and six month periods ended June 30, 2018, respectively, which had a weighted-average grant date fair value of $19.72 and $19.70 per share, respectively. We granted 65,000 and 155,122 shares of restricted common stock during the three and six month periods ended June 30, 2017, respectively, which had weighted-average grant date fair values of $14.91 and $15.57 per share, respectively.
The following table presents certain information related to the activity of our non-vested common stock grants:
26
UNITED INSURANCE HOLDINGS CORP.
Notes to Unaudited Consolidated Financial Statements
June 30, 2018
Number of Restricted Shares | Weighted Average Grant Date Fair Value | |||||
Outstanding as of December 31, 2017 | 212,094 | $ | 16.44 | |||
Granted | 86,210 | 19.70 | ||||
Less: Forfeited | 17,077 | 18.07 | ||||
Less: Vested | 136,183 | 16.38 | ||||
Outstanding as of June 30, 2018 | 145,044 | $ | 18.24 | |||
We had approximately $841,000 of unrecognized stock compensation expense at June 30, 2018 related to non-vested stock-based compensation granted, which we expect to recognize over the next three years. We recognized $240,000 and $488,000 of stock-based compensation expense during the three and six month periods ended June 30, 2018, respectively. We recognized $410,000 and $786,000 of stock-based compensation expense during the three and six month periods ended June 30, 2017, respectively.
We had approximately $1,285,000 of unrecognized director stock-based compensation expense at June 30, 2018 related to non-vested director stock-based compensation granted, which we expect to recognize ratably until vesting one year after the date of grant. We recognized $322,000 and $561,000 of director stock-based compensation expense during the three and six month periods ended June 30, 2018, respectively. We recognized $242,000 and $508,000 of stock-based compensation expense during the three and six month periods ended June 30, 2017, respectively.
17) SUBSEQUENT EVENTS
On July 30, 2018, our Board declared a $0.06 per share quarterly cash dividend payable on August 20, 2018, to stockholders of record on August 13, 2018.
27
UNITED INSURANCE HOLDINGS CORP.
Item 2. Management's Discussion and Analysis of Financial Condition and Results of Operations
The following discussion and analysis of our financial condition and results of operations should be read in conjunction with our Unaudited Consolidated Financial Statements and related notes appearing elsewhere in this Form 10-Q, as well as with the Consolidated Financial Statements and related footnotes under Part II. Item 8 of our Annual Report on Form 10-K for the year ended December 31, 2017. This discussion and analysis contains forward-looking statements that involve risks, uncertainties and assumptions. Actual results may differ materially from those expressed or implied in these forward-looking statements as a result of certain known and unknown risks and uncertainties. See "Forward-Looking Statements."
EXECUTIVE SUMMARY
Overview
United Insurance Holding Corp. (referred to in this document as we, our, us, the Company or UPC Insurance) is a holding company primarily engaged in residential and commercial property and casualty insurance in the United States. We conduct our business principally through four wholly-owned insurance subsidiaries: United Property & Casualty Insurance Company (UPC); American Coastal Insurance Company (ACIC); Family Security Insurance Company (FSIC); and Interboro Insurance Company (IIC). Collectively, we refer to the holding company and all our subsidiaries, including non-insurance subsidiaries, as “UPC Insurance,” which is the preferred brand identification for our Company.
Our Company’s primary source of revenue is generated from writing insurance in Connecticut, Florida, Georgia, Hawaii,
Louisiana, Massachusetts, New Jersey, New York, North Carolina, Rhode Island, South Carolina and Texas. We are also licensed to write property and casualty insurance in an additional six states; however, we have not commenced writing in these states. Our target market in such areas consists of states where the perceived threat of natural catastrophe has caused large national insurance carriers to reduce their concentration of policies. We believe an opportunity exists for UPC Insurance to write profitable business in such areas.
We have historically grown our business through strong organic growth complemented by strategic acquisitions, including
our acquisition of AmCo Holding Company (AmCo) and its subsidiaries, including ACIC, in April 2017, IIC in April 2016, and Family Security Holdings, LLC (FSH), including its subsidiary FSIC in February 2015. As a result of these acquisitions, along with the organic growth of premium in states in which we currently write premium, we have grown our policies in-force by 14.1% from 488,574 policies in-force at June 30, 2017 to 557,523 policies in-force at June 30, 2018.
Our business is subject to the impact of weather-related catastrophes on our loss and loss adjustment expense (LAE). During the third quarter of 2017, Hurricane Harvey made landfall in Texas and Hurricane Irma made landfall in Florida. In 2017, we retained $83,000,000 of pre-tax catastrophe losses, net of reinsurance recoverable as a result of hurricanes. During the six months ended June 30, 2018, we increased our loss and LAE reserve as a result of development trends from Hurricane Irma that indicated our ultimate gross loss estimate should be increased. There was no net change or impact to our second quarter 2018 results as a result of this reserve re-estimation as it was 100% ceded under our catastrophe reinsurance program.
The following discussion highlights significant factors influencing the consolidated financial position and results of
operations of UPC Insurance. In evaluating our results of operations, we use premiums written and earned, policies in-force and
new and renewal policies by geographic concentration. We also consider the impact of catastrophe losses and prior year
development on our loss ratios, expense ratios and combined ratios. In monitoring our investments, we use credit quality,
investment income, cash flows, realized gains and losses, unrealized gains and losses, asset diversification and portfolio
duration. To evaluate our financial condition, we consider our liquidity, financial strength, ratings, book value per share and
return on equity.
28
UNITED INSURANCE HOLDINGS CORP.
2018 Highlights
($ in thousands, except per share) | Three Months Ended June 30, | Six Months Ended June 30, | |||||||||||||
2018 | 2017 | 2018 | 2017 | ||||||||||||
Gross premiums written | $ | 384,662 | $ | 352,347 | $ | 664,279 | $ | 521,189 | |||||||
Gross premiums earned | 289,641 | 261,584 | 568,591 | 443,649 | |||||||||||
Net premiums earned | 171,306 | 159,618 | 336,206 | 266,801 | |||||||||||
Total revenues | 183,148 | 178,073 | 355,201 | 300,706 | |||||||||||
Earnings before income tax | 19,332 | 12,650 | 31,047 | 18,588 | |||||||||||
Consolidated net income | 14,701 | 7,257 | 23,069 | 11,156 | |||||||||||
Net income per diluted share | $ | 0.34 | 0.17 | $ | 0.54 | 0.35 | |||||||||
Reconciliation of net income to core income: | |||||||||||||||
Plus: Merger expenses | $ | — | $ | 6,743 | $ | — | $ | 6,894 | |||||||
Plus: Non-cash amortization of intangible assets | 1,972 | 11,395 | 12,386 | 13,189 | |||||||||||
Less: Realized losses on investment portfolio | (438 | ) | (132 | ) | (227 | ) | (483 | ) | |||||||
Less: Unrealized gains (losses) on equity securities | 1,381 | — | (1,063 | ) | — | ||||||||||
Less: Net tax impact (1) | 257 | 6,395 | 3,419 | 7,198 | |||||||||||
Core income(2) | 15,473 | 19,133 | 33,326 | 24,524 | |||||||||||
Core income per diluted share(2) | $ | 0.36 | $ | 0.46 | $ | 0.78 | $ | 0.77 | |||||||
Book value per share | $ | 12.72 | 12.39 | ||||||||||||
(1) In order to reconcile the net income to the core income measure, we included the tax impact of all adjustments using the effective rate at the end of each period.
(2) Core income, a measure that is not based on U.S. generally accepted accounting principles (GAAP), is reconciled above to net income, the most directly comparable GAAP measure. Additional information regarding non-GAAP financial measures presented in this Form 10-Q is in "Definitions of Non-GAAP Measures" below.
29
UNITED INSURANCE HOLDINGS CORP.
Consolidated Net Income
Three Months Ended June 30, | Six Months Ended June 30, | |||||||||||||||
2018 | 2017 | 2018 | 2017 | |||||||||||||
REVENUE: | ||||||||||||||||
Gross premiums written | $ | 384,662 | $ | 352,347 | $ | 664,279 | $ | 521,189 | ||||||||
Change in gross unearned premiums | (95,021 | ) | (90,763 | ) | (95,688 | ) | (77,540 | ) | ||||||||
Gross premiums earned | 289,641 | 261,584 | 568,591 | 443,649 | ||||||||||||
Ceded premiums earned | (118,335 | ) | (101,966 | ) | (232,385 | ) | (176,848 | ) | ||||||||
Net premiums earned | 171,306 | 159,618 | 336,206 | 266,801 | ||||||||||||
Investment income | 7,091 | 4,637 | 12,777 | 7,588 | ||||||||||||
Net realized investment gains (losses) | (438 | ) | (132 | ) | (227 | ) | (483 | ) | ||||||||
Net unrealized loss on equity securities | 1,381 | — | (1,063 | ) | — | |||||||||||
Other revenue | 3,808 | 13,950 | 7,508 | 26,800 | ||||||||||||
Total revenue | 183,148 | 178,073 | 355,201 | 300,706 | ||||||||||||
EXPENSES: | ||||||||||||||||
Losses and loss adjustment expenses | 88,595 | 86,938 | 165,841 | 150,271 | ||||||||||||
Policy acquisition costs | 50,454 | 43,320 | 99,516 | 78,756 | ||||||||||||
Operating expenses | 9,682 | 6,257 | 18,000 | 12,129 | ||||||||||||
General and administrative expenses | 12,643 | 28,176 | 35,968 | 39,509 | ||||||||||||
Interest expense | 2,458 | 752 | 4,916 | 1,511 | ||||||||||||
Total expenses | 163,832 | 165,443 | 324,241 | 282,176 | ||||||||||||
Income before other income | 19,316 | 12,630 | 30,960 | 18,530 | ||||||||||||
Other income | 16 | 20 | 87 | 58 | ||||||||||||
Income before income taxes | 19,332 | 12,650 | 31,047 | 18,588 | ||||||||||||
Provision for income taxes | 4,631 | 5,393 | 7,978 | 7,432 | ||||||||||||
Net income | $ | 14,701 | $ | 7,257 | $ | 23,069 | $ | 11,156 | ||||||||
Net income per diluted share | $ | 0.34 | $ | 0.17 | $ | 0.54 | $ | 0.35 | ||||||||
Book value per share | $ | 12.72 | $ | 12.39 | ||||||||||||
Return on equity based on trailing twelve months GAAP net income | 4.2 | % | 3.5 | % | ||||||||||||
Loss ratio, net (1) | 51.7 | % | 54.5 | % | 49.3 | % | 56.3 | % | ||||||||
Expense ratio (2) | 42.5 | % | 48.7 | % | 45.7 | % | 48.9 | % | ||||||||
Combined ratio (CR) (3) | 94.2 | % | 103.2 | % | 95.0 | % | 105.2 | % | ||||||||
Effect of current year catastrophe losses on CR | 10.1 | % | 13.7 | % | 7.0 | % | 12.1 | % | ||||||||
Effect of prior year development on CR | (0.5 | )% | (0.8 | )% | (0.5 | )% | (0.7 | )% | ||||||||
Effect of ceding commission income on CR (4) | — | % | 6.6 | % | — | % | 7.5 | % | ||||||||
Underlying combined ratio (5) | 84.6 | % | 83.7 | % | 88.5 | % | 86.3 | % | ||||||||
(1) Loss ratio, net is calculated as losses and LAE, net of losses ceded to reinsurers, relative to net premiums earned.
(2) Expense ratio is calculated as the sum of all operating expenses less interest expense relative to net premiums earned.
(3) Combined ratio is the sum of the loss ratio, net and the expense ratio, net.
(4) For the six months ended June 30, 2018, we presented $20,674,000 of ceding commissions earned as a $4,498,000 decrease to ceded earned premium and a $16,175,000 decrease in policy acquisition costs, which reduced other revenue and removed the distortive impact to our underlying combined ratio. For the three months ended June 30, 2018, we presented $10,375,000 of ceding commissions earned as a $2,273,000 decrease to ceded earned premium and an $8,102,000 decrease in policy acquisition costs.
(5) Underlying combined ratio, a measure that is not based on GAAP, is reconciled above to the combined ratio, the most directly comparable GAAP measure. Additional information regarding non-GAAP financial measures presented in this Form 10-Q is in "Definitions of Non-GAAP Measures" below.
30
UNITED INSURANCE HOLDINGS CORP.
Definitions of Non-GAAP Measures
We believe that investors' understanding of UPC Insurance's performance is enhanced by our disclosure of the following non-GAAP measures. Our methods for calculating these measures may differ from those used by other companies and therefore comparability may be limited.
Combined ratio excluding the effects of current year catastrophe losses, prior year reserve development and ceding commission income earned (underlying combined ratio) is a non-GAAP ratio, which is computed by subtracting the effect of current year catastrophe losses, prior year development, and ceding commission income earned related to our quota share reinsurance agreement from the combined ratio. We believe that this ratio is useful to investors and it is used by management to reveal the trends in our business that may be obscured by current year catastrophe losses, losses from lines in run-off, prior year development, and ceding commission income earned. Current year catastrophe losses cause our loss trends to vary significantly between periods as a result of their incidence of occurrence and magnitude, and can have a significant impact on the combined ratio. Prior year development is caused by unexpected loss development on historical reserves. Ceding commission income compensates the Company for expenses it incurs in generating the premium ceded under our quota share reinsurance agreement. We believe it is useful for investors to evaluate these components separately and in the aggregate when reviewing our performance. The most direct comparable GAAP measure is the combined ratio. The underlying combined ratio should not be considered as a substitute for the combined ratio and does not reflect the overall profitability of our business.
Net loss and LAE excluding the effects of current year catastrophe losses and prior year reserve development (underlying loss and LAE) is a non-GAAP measure which is computed by subtracting the effect of current year catastrophe losses and prior year reserve development from net loss and LAE. We use underlying loss and LAE figures to analyze our loss trends that may be impacted by current year catastrophe losses and prior year development on our reserves. As discussed previously, these two items can have a significant impact on our loss trends in a given period. We believe it is useful for investors to evaluate these components separately and in the aggregate when reviewing the Company's performance. The most direct comparable GAAP measure is net loss and LAE. The underlying loss and LAE measure should not be considered a substitute for net loss and LAE and does not reflect the overall profitability of our business.
Operating expenses excluding the effects of ceding commission income earned, merger expenses, and amortization of intangible assets (underlying expense) is a non-GAAP measure which is computed by subtracting ceding income earned related to our quota share reinsurance agreement, merger expenses and amortization of intangibles. Ceding commission income compensates the Company for expenses it incurs in generating the premium ceded under our quota share reinsurance agreement. Merger expenses are directly related to past mergers and are not reflective of current period operating performance. Similarly, amortization expense is related to the amortization of intangible assets acquired through mergers and therefore the expense does not arise through normal operations. We believe it is useful for investors to evaluate these components separately and in the aggregate when reviewing our performance. The most direct comparable GAAP measure is operating expenses. The underlying expense measure should not be considered a substitute for the expense ratio and does not reflect the overall profitability of our business.
Net income excluding the effects of non-cash amortization of intangible assets, realized gains (losses) and unrealized gains (losses) on equity securities, net of tax (core income) is a non-GAAP measure which is computed by adding amortization, net of tax, to net income and subtracting realized gains (losses) on our investment portfolio, net of tax, and unrealized gains (losses) on our equity securities, net of tax, from net income. Amortization expense is related to the amortization of intangible assets acquired through mergers and therefore the expense does not arise through normal operations. Investment portfolio gains (losses) and unrealized equity security gains (losses) vary independent of our operations. We believe it is useful for investors to evaluate these components separately and in the aggregate when reviewing our performance. The most direct comparable GAAP measure is net income. The core income measure should not be considered a substitute for net income and does not reflect the overall profitability of our business.
CRITICAL ACCOUNTING POLICIES AND ESTIMATES
When we prepare our consolidated financial statements and accompanying notes in conformity with GAAP, we must make estimates and assumptions about future events that affect the amounts we report. Certain of these estimates result from judgments that can be subjective and complex. As a result of that subjectivity and complexity, and because we continuously evaluate these estimates and assumptions based on a variety of factors, actual results could materially differ from our estimates and assumptions if changes in one or more factors require us to make accounting adjustments. During the three and six months
31
UNITED INSURANCE HOLDINGS CORP.
ended June 30, 2018, we reassessed our critical accounting policies and estimates as disclosed in Note 1 to the Notes to Unaudited Consolidated Financial Statements and our Annual Report on Form 10-K for the year ended December 31, 2017; however, we have made no material changes or additions with regard to those policies and estimates, except for those standards adopted in 2018 as described in Note 2 in the Notes to Unaudited Consolidated Financial Statements.
RECENT ACCOUNTING STANDARDS
Please refer to Note 2 in the Notes to Unaudited Consolidated Financial Statements for a discussion of recent accounting standards that may affect us.
32
UNITED INSURANCE HOLDINGS CORP.
ANALYSIS OF FINANCIAL CONDITION - JUNE 30, 2018 COMPARED TO DECEMBER 31, 2017
The following discussion and analysis of our financial condition and results of operations should be read in conjunction with our accompanying unaudited consolidated interim financial statements and related notes, and in conjunction with the section entitled "Management's Discussion and Analysis of Financial Condition and Results of Operations" in our Annual Report on Form 10-K for the year ended December 31, 2017.
Investments
The primary goals of our investment strategy are to preserve capital, maximize after-tax investment income, maintain liquidity and minimize risk. To accomplish our goals, we purchase debt securities in sectors that represent the most attractive relative value, and we maintain a moderate equity exposure. Limiting equity exposure limits risk and helps to preserve capital for two reasons: first, bond market returns are less volatile than stock market returns, and second, should the bond issuer enter bankruptcy liquidation, bondholders generally have a higher priority than equityholders in a bankruptcy proceeding.
We must comply with applicable state insurance regulations that prescribe the type, quality and concentrations of investments our insurance subsidiaries can make; therefore, our current investment policy limits investment in non-investment-grade fixed maturities and limits total investment amounts in preferred stock, common stock and mortgage notes receivable. We do not invest in derivative securities.
Two outside asset management companies, which have authority and discretion to buy and sell securities for us, manage our investments subject to (i) the guidelines established by our Board of Directors and (ii) the direction of management. The Investment Committee of our Board of Directors reviews and approves our investment policy on a regular basis.
Our cash, cash equivalents and investment portfolio totaled $1,182,670,000 at June 30, 2018, compared to $1,130,806,000 at December 31, 2017.
The following table summarizes our investments, by type:
June 30, 2018 | December 31, 2017 | ||||||||||||
Estimated Fair Value | Percent of Total | Estimated Fair Value | Percent of Total | ||||||||||
U.S. government and agency securities | $ | 88,481 | 7.5 | % | $ | 92,626 | 8.2 | % | |||||
Foreign government | 2,978 | 0.3 | % | 2,036 | 0.2 | % | |||||||
States, municipalities and political subdivisions | 159,815 | 13.5 | % | 201,512 | 17.8 | % | |||||||
Public utilities | 25,171 | 2.1 | % | 20,257 | 1.8 | % | |||||||
Corporate securities | 284,328 | 24.0 | % | 287,562 | 25.4 | % | |||||||
Mortgage-backed securities | 207,646 | 17.6 | % | 143,265 | 12.7 | % | |||||||
Asset-backed securities | 79,778 | 6.7 | % | 14,905 | 1.3 | % | |||||||
Redeemable preferred stocks | 685 | 0.1 | % | 692 | 0.1 | % | |||||||
Total fixed maturities | 848,882 | 71.8 | % | 762,855 | 67.5 | % | |||||||
Mutual funds | 47,560 | 4.0 | % | 31,924 | 2.8 | % | |||||||
Public utilities | 2,243 | 0.2 | % | 1,702 | 0.2 | % | |||||||
Other common stocks | 31,801 | 2.7 | % | 27,902 | 2.5 | % | |||||||
Non-redeemable preferred stocks | 1,741 | 0.1 | % | 1,767 | 0.2 | % | |||||||
Total equity securities | 83,345 | 7.0 | % | 63,295 | 5.7 | % | |||||||
Other long-term investments | 8,242 | 0.7 | % | 8,381 | 0.7 | % | |||||||
Portfolio loans | — | — | % | 20,000 | 1.8 | % | |||||||
Total investments | 940,469 | 79.5 | % | 854,531 | 75.7 | % | |||||||
Cash and cash equivalents | 208,675 | 17.7 | % | 229,556 | 20.2 | % | |||||||
Restricted cash | 33,526 | 2.8 | % | 46,719 | 4.1 | % | |||||||
Total cash, cash equivalents, restricted cash and investments | $ | 1,182,670 | 100.0 | % | $ | 1,130,806 | 100.0 | % | |||||
We classify all of our fixed maturity investments as available-for-sale. Our investments at June 30, 2018 and December 31, 2017 consisted mainly of U.S. government and agency securities, states, municipalities and political subdivisions and securities
33
UNITED INSURANCE HOLDINGS CORP.
of investment-grade corporate issuers. Our equity holdings consisted mainly of securities issued by companies in the energy, consumer products, financial, technology and industrial sectors. Most of the corporate bonds we hold reflected a similar diversification. At June 30, 2018, approximately 87.5% of our fixed maturities were U.S. Treasuries or corporate bonds rated “A” or better, and 12.5% were corporate bonds rated “BBB” or "BB".
Reinsurance
We follow industry practice of reinsuring a portion of our risks. Reinsurance involves transferring, or "ceding", all or a
portion of the risk exposure on policies we write to another insurer, known as a reinsurer. To the extent that our reinsurers are
unable to meet the obligations they assume under our reinsurance agreements, we remain primarily liable for the entire insured loss under the policies we write.
During the second quarter of 2018, we placed our reinsurance program for the 2018 hurricane season. We purchased catastrophe excess of loss reinsurance protection of $3,100,000,000. The contracts reinsure for personal and commercial lines property excess catastrophe losses caused by multiple perils including hurricanes, tropical storms and tornadoes. The agreements are effective as of June 1, 2018, for a one-year term, and incorporate the mandatory coverage required by and placed with the Florida Hurricane Catastrophe Fund.
Effective December 31, 2017, we replaced our 15% quota share agreement that expired on November 30, 2017 and our 5% quota share agreement that was set to renew on December 1, 2017 with a new quota share reinsurance agreement with a term of 12 months and a cession rate of 20% for all subject business.
Effective January 1, 2018, we placed a new aggregate excess of loss treaty to provide $20,000,000 of coverage against accumulated losses from specified catastrophe events in excess of 4.75% of cumulative subject gross premiums earned during each calendar quarter, for a term of 12 months.
Excluding our business for which we cede 100% of the risk of loss, reinsurance costs in the second quarter of 2018 were 38.8% of our gross premiums earned, compared to 37.1% of gross premiums earned for the second quarter of 2017. The increase in this ratio was driven primarily by the increased coverage purchased for our 2018-19 combined catastrophe reinsurance program.
See Note 8 in our Notes to Unaudited Consolidated Financial Statements for additional information regarding our reinsurance program.
Unpaid Losses and Loss Adjustments
We generally use the term “loss(es)” to collectively refer to both loss and LAE. We establish reserves for both reported and unreported unpaid losses that have occurred at or before the balance sheet date for amounts we estimate we will be required to pay in the future, including provisions for claims that have been reported but are unpaid at the balance sheet date and for obligations on claims that have been incurred but not reported at the balance sheet date. Our policy is to establish these loss reserves after considering all information known to us at each reporting period. At any given point in time, our loss reserve represents our best estimate of the ultimate settlement and administration costs of our insured claims incurred and unpaid.
Unpaid losses and LAE totaled $432,431,000 and $482,232,000 as of June 30, 2018 and December 31, 2017, respectively. The balance has decreased from year end as a result of reduced losses incurred from both weather-related and non weather-related activity and from the payment of claims during the first six months of 2018 compared to the same period in 2017.
Since the process of estimating loss reserves requires significant judgment due to a number of variables, such as fluctuations in inflation, judicial decisions, legislative changes and changes in claims handling procedures, our ultimate liability will likely differ from these estimates. We revise our reserve for unpaid losses as additional information becomes available, and reflect adjustments, if any, in our earnings in the periods in which we determine the adjustments as necessary.
See Note 9 in our Notes to Unaudited Consolidated Financial Statements for additional information regarding our losses and loss adjustments.
34
UNITED INSURANCE HOLDINGS CORP.
RESULTS OF OPERATIONS - COMPARISON OF THE THREE-MONTH PERIODS ENDED JUNE 30, 2018 AND 2017
Net income for the three months ended June 30, 2018 increased $7,444,000, or 102.7%, to $14,701,000 for the second quarter of 2018 from $7,257,000 for the same period in 2017. The increase in net income was primarily due to the increase in gross premiums earned and the decrease in amortization and merger expenses during the second quarter of 2018 compared to the second quarter of 2017.
Revenue
Our gross written premiums increased $32,315,000, or 9.2%, to $384,662,000 for the second quarter ended June 30, 2018 from $352,347,000 for the same period in 2017, primarily reflecting organic growth in new and renewal business generated in all regions. The breakdown of the quarter-over-quarter changes in both direct written and assumed premiums by region and gross written premium by line of business are shown in the table below.
($ in thousands) | Three Months Ended June 30, | |||||||||||
2018 | 2017 | Change | ||||||||||
Direct Written and Assumed Premium by Region (1) | ||||||||||||
Florida | $ | 204,885 | $ | 199,736 | $ | 5,149 | ||||||
Gulf | 59,022 | 56,622 | 2,400 | |||||||||
Northeast | 47,346 | 40,842 | 6,504 | |||||||||
Southeast | 28,433 | 25,088 | 3,345 | |||||||||
Total direct written premium by region | 339,686 | 322,288 | 17,398 | |||||||||
Assumed premium (2) | 44,976 | 30,059 | 14,917 | |||||||||
Total gross written premium by region | $ | 384,662 | $ | 352,347 | $ | 32,315 | ||||||
Gross Written Premium by Line of Business | ||||||||||||
Personal property | $ | 256,910 | $ | 235,132 | $ | 21,778 | ||||||
Commercial property | 127,752 | 117,215 | 10,537 | |||||||||
Total gross written premium by line of business | $ | 384,662 | $ | 352,347 | $ | 32,315 | ||||||
(1) "Gulf" is comprised of Hawaii, Louisiana and Texas; "Northeast" is comprised of Connecticut, Massachusetts, New Jersey, New York and Rhode Island; and "Southeast" is comprised of Georgia, North Carolina and South Carolina.
(2) Assumed premium written for 2018 and 2017 is primarily commercial property business assumed from unaffiliated insurers.
Three Months Ended June 30, | ||||||||
New and Renewal Policies by Region (1) | 2018 | 2017 | Change | |||||
Florida | 74,646 | 70,098 | 4,548 | |||||
Gulf | 36,816 | 35,326 | 1,490 | |||||
Northeast | 36,155 | 30,924 | 5,231 | |||||
Southeast | 24,920 | 21,233 | 3,687 | |||||
Total | 172,537 | 157,581 | 14,956 | |||||
(1) Only includes new and renewal homeowner, commercial and dwelling fire policies written during the quarter.
We expect our gross written premium growth to continue as we increase our policies in-force in the states in which we currently write policies and as we expand into other states in which we are currently licensed to write property and casualty insurance.
35
UNITED INSURANCE HOLDINGS CORP.
Expenses
Expenses for the three months ended June 30, 2018 decreased $1,611,000, or 1.0%, to $163,832,000 for the second quarter of 2018 from $165,443,000 for the same period in 2017. The decrease in expenses was primarily due to decreased general and administrative expenses resulting from amortization costs related to the merger with AmCo that applied during the second quarter of 2017 but were fully amortized at the end of the first quarter of 2018. This decrease was offset by an increase in losses, policy acquisition costs and operating costs as explained below, as well as interest expenses due to the senior notes issued in December 2017. The calculations of our loss ratios and underlying loss ratios are shown below.
Three Months Ended June 30, | |||||||||||
2018 | 2017 | Change | |||||||||
Net loss and LAE | $ | 88,595 | $ | 86,938 | $ | 1,657 | |||||
% of Gross earned premiums | 30.6 | % | 33.2 | % | (2.6) pts | ||||||
% of Net earned premiums | 51.7 | % | 54.5 | % | (2.8) pts | ||||||
Less: | |||||||||||
Current year catastrophe losses | $ | 17,340 | $ | 21,798 | $ | (4,458 | ) | ||||
Prior year reserve (favorable) development | (870 | ) | (1,264 | ) | 394 | ||||||
Underlying loss and LAE (1) | $ | 72,125 | $ | 66,404 | $ | 5,721 | |||||
% of Gross earned premiums | 24.9 | % | 25.4 | % | (0.5) pts | ||||||
% of Net earned premiums | 42.1 | % | 41.6 | % | 0.5 pts | ||||||
(1) Underlying loss and LAE is a non-GAAP measure and is reconciled above to Net loss and LAE, the most directly comparable GAAP measure. Additional information regarding non-GAAP financial measures presented in this document is in the "Definitions of Non-GAAP Measures" section of this Form 10-Q.
The calculations of our expense ratio and underlying expense ratios are shown below.
Three Months Ended June 30, | |||||||||||
2018 | 2017 | Change | |||||||||
Policy acquisition costs | $ | 50,454 | $ | 43,320 | $ | 7,134 | |||||
Operating and underwriting | 9,682 | 6,257 | 3,425 | ||||||||
General and administrative | 12,643 | 28,176 | (15,533 | ) | |||||||
Total Operating Expenses | $ | 72,779 | $ | 77,753 | $ | (4,974 | ) | ||||
% of Gross earned premiums | 25.1 | % | 29.7 | % | (4.6) pts | ||||||
% of Net earned premiums | 42.5 | % | 48.7 | % | (6.2) pts | ||||||
Less: | |||||||||||
Ceding commission income (1) | $ | — | $ | 10,562 | (10,562 | ) | |||||
Underlying expense (2) | $ | 72,779 | $ | 67,191 | $ | 5,588 | |||||
% of Gross earned premiums | 25.1 | % | 25.7 | % | (0.6) pts | ||||||
% of Net earned premiums | 42.5 | % | 42.1 | % | 0.4 pts | ||||||
(1) For the three months ended June 30, 2018, we presented $10,675,000 of ceding commissions earned as a $2,273,000 decrease to ceded earned premium and a $8,102,000 decrease in policy acquisition costs, which reduced other revenue and removed the distortive impact to our underlying expense ratio.
(2) Underlying expense is a non-GAAP measure and is reconciled above to total operating expenses, the most directly comparable GAAP measure. Additional information regarding non-GAAP financial measures presented in this document in the "Definitions of Non-GAAP Measures" section of this Form 10-Q.
Loss and LAE increased $1,657,000, or 1.9%, to $88,595,000 for the second quarter of 2018 from $86,938,000 for the second quarter of 2017. Loss and LAE expense as a percentage of net earned premiums decreased 2.8 points to 51.7% for the second quarter of 2018, compared to 54.5% for the same period last year. Excluding catastrophe losses and reserve development, our gross underlying loss and LAE ratio for the second quarter of 2018 was 24.9%, a decrease of 0.5 points from 25.4% during the second quarter of 2017.
Policy acquisition costs increased $7,134,000, or 16.5%, to $50,454,000 for the second quarter of 2018 from $43,320,000 for the second quarter of 2017. The primary driver of the increase in costs was the managing general agent fees related to AmCo
36
UNITED INSURANCE HOLDINGS CORP.
commercial premiums along with agent commissions which were generally consistent with our growth in premium production and higher average market commission rates outside of Florida.
Operating and underwriting expenses increased $3,425,000, or 54.7%, to $9,682,000 for the second quarter of 2018 from $6,257,000 for the second quarter of 2017, primarily due to increased costs related to incurred expenses for software tools and agent incentive costs.
General and administrative expenses decreased $15,533,000, or 55.1%, to $12,643,000 for the second quarter of 2018 from $28,176,000 for the second quarter of 2017, primarily due to amortization costs related to the merger with AmCo during the second quarter of 2017 that were fully expensed at the end of the first quarter of 2018 as well as merger expenses that were incurred during the second quarter of 2017.
RESULTS OF OPERATIONS - COMPARISON OF THE SIX MONTH PERIODS ENDED JUNE 30, 2018 AND 2017
Net income for the six months ended June 30, 2018 increased $11,916,000, or 106.8%, to $23,069,000 from $11,156,000 for the same period in 2017. The increase in net income was primarily due to increases in gross premiums earned for the six months ended June 30, 2018 compared to the six months ended June 30, 2017 with the inclusion of six months of premium for AmCo in 2018 compared to three months of premium in 2017. In addition, we incurred approximately $7,000,000 in merger expenses in 2017 that were non-recurring in 2018.
Revenue
Our gross written premiums increased $143,090,000, or 27.5%, to $664,279,000 for the six months ended June 30, 2018 from $521,189,000 for the same period in 2017, primarily reflecting organic growth in new and renewal business generated in all regions. The breakdown of the year-over-year changes in both direct and assumed written premiums by region and gross written premium by line of business are shown in the table below.
($ in thousands) | Six Months Ended June 30, | |||||||||||
2018 | 2017 | Change | ||||||||||
Direct Written and Assumed Premium by Region (1) | ||||||||||||
Florida | $ | 362,837 | $ | 275,100 | $ | 87,737 | ||||||
Gulf | 103,819 | 97,400 | 6,419 | |||||||||
Northeast | 82,238 | 71,979 | 10,259 | |||||||||
Southeast | 51,320 | 45,280 | 6,040 | |||||||||
Total direct written premium by region | 600,214 | 489,759 | 110,455 | |||||||||
Assumed premium (2) | 64,065 | 31,430 | 32,635 | |||||||||
Total gross written premium by region | $ | 664,279 | $ | 521,189 | $ | 143,090 | ||||||
Gross Written Premium by Line of Business | ||||||||||||
Personal property | $ | 442,535 | $ | 400,005 | $ | 42,530 | ||||||
Commercial property | 221,744 | 121,184 | 100,560 | |||||||||
Total gross written premium by line of business | $ | 664,279 | $ | 521,189 | $ | 143,090 | ||||||
(1) Each region is comprised of the following states: Gulf includes Hawaii, Louisiana and Texas; Northeast includes Connecticut, Massachusetts, New Jersey, New York and Rhode Island' and Southeast includes Georgia, North Carolina and South Carolina.
(2) Assumed premium for 2018 and 2017 is primarily commercial property business assumed from unaffiliated insurers.
Six Months Ended June 30, | ||||||||
New and Renewal Policies By Region (1) | 2018 | 2017 | Change | |||||
Florida | 128,052 | 115,452 | 12,600 | |||||
Gulf | 66,880 | 62,631 | 4,249 | |||||
Northeast | 63,335 | 54,219 | 9,116 | |||||
Southeast | 44,830 | 38,189 | 6,641 | |||||
Total | 303,097 | 270,491 | 32,606 | |||||
37
UNITED INSURANCE HOLDINGS CORP.
(1) Only includes new and renewal homeowner, commercial and dwelling fire policies written during the year.
We expect our gross written premium growth to continue as we increase our policies in-force in the states in which we currently write policies and as we expand into other states in which we are currently licensed to write property and casualty insurance.
Expenses
Expenses for the six months ended June 30, 2018 increased $42,065,000, or 14.9%, to $324,241,000 from $282,176,000 for the same period in 2017. The increase in expenses was primarily due to the change in presentation of ceding commission income in 2018 from other revenue to policy acquisition costs. The calculations of our loss ratios and underlying loss ratios are shown below.
Six Months Ended June 30, | |||||||||||
2018 | 2017 | Change | |||||||||
Net Loss and LAE | $ | 165,841 | $ | 150,271 | $ | 15,570 | |||||
% of Gross earned premiums | 29.2 | % | 33.9 | % | (4.7) pts | ||||||
% of Net earned premiums | 49.3 | % | 56.3 | % | (7.0) pts | ||||||
Less: | |||||||||||
Current year catastrophe losses | $ | 23,657 | $ | 32,410 | $ | (8,753 | ) | ||||
Prior year reserve (favorable) development | (1,551 | ) | (1,790 | ) | 239 | ||||||
Underlying loss and LAE (1) | $ | 143,735 | $ | 119,651 | $ | 24,084 | |||||
% of Gross earned premiums | 25.3 | % | 27.0 | % | (1.7) pts | ||||||
% of Net earned premiums | 42.8 | % | 44.8 | % | (2.0) pts | ||||||
(1) Underlying Loss and LAE is a non-GAAP measure and is reconciled above to Net Loss and LAE, the most directly comparable GAAP measure. Additional information regarding non-GAAP financial measures presented in this document is in the "Definitions of Non-GAAP Measures" section of this Form 10-Q.
The calculations of our expense ratios and underlying expense ratios are shown below.
Six Months Ended June 30, | |||||||||||
2017 | 2016 | Change | |||||||||
Policy acquisition costs | $ | 99,516 | $ | 78,756 | $ | 20,760 | |||||
Operating and underwriting | 18,000 | 12,129 | 5,871 | ||||||||
General and administrative | 35,968 | 39,509 | (3,541 | ) | |||||||
Total Operating Expenses | $ | 153,484 | $ | 130,394 | $ | 23,090 | |||||
% of Gross earned premiums | 27.0 | % | 29.4 | % | (2.4) pts | ||||||
% of Net earned premiums | 45.7 | % | 48.9 | % | (3.2) pts | ||||||
Less: | |||||||||||
Ceding commission income (1) | $ | — | $ | 20,094 | $ | (20,094 | ) | ||||
Underlying expense (2) | $ | 153,484 | $ | 110,300 | $ | 43,184 | |||||
% of Gross earned premiums | 27.0 | % | 24.9 | % | 2.1 pts | ||||||
% of Net earned premiums | 45.7 | % | 41.5 | % | 4.2 pts | ||||||
(1) For the six months ended June 30, 2018, we presented $20,674,000 of ceding commissions earned as a $4,498,000 decrease to ceded earned premium and a $16,175,000 decrease in policy acquisition costs, which reduced other revenue and removed the distortive impact to our underlying expense ratio
(2) Underlying Expense is a non-GAAP measure and is reconciled above to total operating expenses, the most directly comparable GAAP measure. Additional information regarding non-GAAP financial measures presented in this document is in the "Definitions of Non-GAAP Measures" section of this Form 10-Q.
Loss and LAE increased $15,570,000, or 10.4%, to $165,841,000 for the six months ended June 30, 2018 from $150,271,000 for the same period in 2017. Loss and LAE expense as a percentage of net earned premiums decreased 7.0 points to 49.3% for the year, compared to 56.3% for the same period last year. Excluding catastrophe losses and reserve development, our gross underlying loss and LAE ratio for the six months ended June 30, 2018, was 25.3%, a decrease of 1.7 points from 27.0% during the six months ended June 30, 2017.
38
UNITED INSURANCE HOLDINGS CORP.
Policy acquisition costs increased $20,760,000, or 26.4%, to $99,516,000 for the six months ended June 30, 2018 from $78,756,000 for the same period in 2017. The primary driver of the increase was the result of the reclassification of ceding commission income from other revenue to policy acquisition costs in 2018.
Operating expenses increased $5,871,000, or 48.4%, to $18,000,000 for the six months ended June 30, 2018 from $12,129,000 for the same period in 2017, primarily due to increased costs related to the Company's ongoing growth, incurred expenses related to software and costs related assessments.
General and administrative expenses decreased $3,541,000, or 9.0%, to $35,968,000 for the six months ended June 30, 2018 from $39,509,000 for the same period in 2017, primarily due to non-recurring merger expenses and amortization costs related to the merger with AmCo which occurred during the six months ended June 30, 2017.
LIQUIDITY AND CAPITAL RESOURCES
We generate cash through premium collections, reinsurance recoveries, investment income, the sale or maturity of invested assets, the issuance of debt and the issuance of additional shares of our stock. We use our cash to pay reinsurance premiums, claims and related costs, policy acquisition costs, salaries and employee benefits, other expenses and stockholder dividends, acquire subsidiaries and pay associated costs, as well as to repay debts and purchase investments.
As a holding company, we do not conduct any business operations of our own and, as a result, we rely on cash dividends or intercompany loans from our management subsidiaries to pay our general and administrative expenses. Insurance regulatory authorities heavily regulate our insurance subsidiaries, including restricting any dividends paid by our insurance subsidiaries and requiring approval of any management fees our insurance subsidiaries pay to our management subsidiaries for services rendered; however, nothing restricts our non-insurance company subsidiaries from paying us dividends other than state corporate laws regarding solvency. Our management subsidiaries pay us dividends primarily using cash from the collection of management fees from our insurance subsidiaries, pursuant to the management agreements in effect between those entities. In accordance with state laws, our insurance subsidiaries may pay dividends or make distributions out of that part of their statutory surplus derived from their net operating profit and their net realized capital gains. The Risk-Based Capital (RBC) guidelines published by the National Association of Insurance Commissioners (NAIC) may further restrict our insurance subsidiaries’ ability to pay dividends or make distributions if the amount of the intended dividend or distribution would cause their respective surplus as it regards policyholders to fall below minimum RBC guidelines. See Note 12 in our Notes to Unaudited Consolidated Financial Statements for additional information.
During the six month periods ended June 30, 2018 and 2017, we did not make any capital contributions to our insurance subsidiaries. We may make future contributions of capital to our insurance subsidiaries as circumstances require.
On December 13, 2017, we issued $150,000,000 of senior notes (the $150M senior notes) that will mature on December 15, 2027 and bear interest at a rate equal to 6.250% per annum payable semi-annually on each June 15 and December 15, commencing June 15, 2018. The $150M senior notes are senior unsecured obligations of the Company. We may redeem the $150M senior notes at our option, at any time and from time to time in whole or in part, at a redemption price equal to the greater of (i) 100% of the principal amount of the $150M senior notes to be redeemed and (ii) the sum of the present values of the remaining scheduled payments of principal and interest thereon from the date of redemption to the date that is three months prior to maturity. On and after that date, we may redeem the $150M senior notes at par.
On April 3, 2017, we successfully completed our acquisition of AmCo. The acquisition was completed through a series of mergers that ultimately resulted in the Company issuing 20,956,355 shares of its common stock as merger consideration to the equity holders of RDX Holding, LLC, the former parent company of AmCo. As a result of the mergers, AmCo merged with and into a wholly-owned subsidiary of the Company. We incurred $7,000,000 of merger-related expenses. Please refer to Note 4 in the Notes to Unaudited Consolidated Financial Statements for additional information on the merger transaction.
Financial Covenants
$150M Senior Notes - Our $150M senior notes provide that the Company and its subsidiaries shall not incur any indebtedness unless no default exists and the Company’s leverage ratio as of the last day of any annual or quarterly period (the balance sheet date) immediately preceding the date on which such additional indebtedness is incurred would have been no greater than 0.3:1, determined on a pro forma basis as if the additional indebtedness and all other indebtedness incurred since the immediately preceding balance sheet date had been incurred and the proceeds therefrom applied as of such day. The Company and its subsidiaries also may not create, assume, incur or permit to exist any indebtedness for borrowed money that is
39
UNITED INSURANCE HOLDINGS CORP.
secured by a lien on the voting stock of any significant subsidiary without selling the $150M senior notes equally. The Company may not issue, sell, assign, transfer or otherwise dispose of, directly or indirectly, any of the capital stock of the Company’s significant subsidiaries as of the issue date of the notes (except to the Company or to one or more of the Company’s other subsidiaries, or for the purpose of qualifying directors or as may be required by law or regulation), subject to certain exceptions. At June 30, 2018, we were in compliance with the covenants in the $150M senior notes.
Florida State Board of Administration Note Payable - Our $20,000,000, 20-year note payable to the Florida State Board of Administration (the SBA note) requires that UPC maintain either a 2:1 ratio of net written premium to surplus, or net writing ratio, or a 6:1 ratio of gross written premium to surplus, or gross writing ratio, to avoid additional interest penalties. The SBA note agreement defines surplus for the purpose of calculating the required ratios as the $20,000,000 of capital contributed to UPC under the agreement plus the outstanding balance of the note. Should UPC fail to exceed either a net writing ratio of 1.5:1 or a gross writing ratio of 4.5:1, UPC's interest rate will increase by 450 basis points above the 10-year Constant Maturity Treasury rate (as defined in the SBA note agreement) which was 2.85% at the end of June 2018. Any other writing ratio deficiencies result in an interest rate penalty of 25 basis points above the stated rate of the note, which was 2.77% at the end of June 2018. Our SBA note further provides that the Florida State Board of Administration may, among other things, declare its loan immediately due and payable upon any default existing under the SBA note; however, any payment is subject to approval by the insurance regulatory authority. At June 30, 2018, we were in compliance with the covenants in the SBA note.
BB&T Term Note Payable - Our $5,200,000, 15-year term note payable to the Branch Banking & Trust Company (the BB&T note) requires that, at all times while there has been no losses from our insurance subsidiaries' operations (non-recurring losses), we will maintain a minimum Cash Flow Coverage ratio of 1.2:1. The Cash Flow Coverage ratio is defined as our cash flow to debt services. This ratio will be tested annually, based on UPC Insurance's audited financial statements. For the one-year period following a non-recurring loss, UPC Insurance is required to maintain a minimum Cash Flow Coverage ratio of 1.0:1. This covenant will only be effective if the pre non-recurring losses test is failed, and is only available and effective for one annual test period. Thereafter, the non-recurring loss Cash Flow Coverage Ratio of 1.2:1 will immediately apply. At the time of the most recent annual test period, December 31, 2017, we were in compliance with the covenants in the BB&T note.
In addition, the BB&T note requires that we establish and maintain with BB&T at all times during the term of the loan a non-interest bearing demand deposit account with a minimum balance of $500,000, and an interest-bearing account with a minimum balance of $1,500,000. In the event of default, BB&T may, among other things, declare its loan immediately due and payable, require us to pledge additional collateral to the bank, and take possession of and foreclose upon our corporate headquarters, which has been pledged to the bank as security for the loan. At June 30, 2018, we were in compliance with the covenants in the BB&T note.
Cash Flows for the six months ended June 30, 2018 and 2017 (in millions)
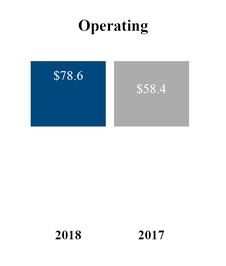
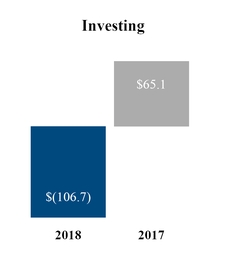
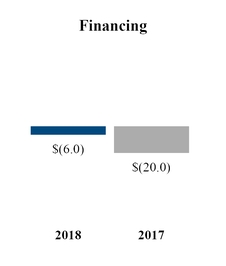
Operating Activities
The principal cash inflows from our operating activities come from premium collections, reinsurance recoveries and investment income. The principal cash outflows from our operating activities are the result of claims and related costs, reinsurance premiums, policy acquisition costs and salaries and employee benefits. A primary liquidity concern with respect to these cash flows is the risk of large magnitude catastrophe events.
40
UNITED INSURANCE HOLDINGS CORP.
During the six months ended June 30, 2018, operating assets and liabilities were impacted by the continued settlement of catastrophe losses associated with Hurricanes Harvey and Irma, each of which occurred during the second half of 2017. Reinsurance recoverables on paid and unpaid losses increased during the six months ended June 30, 2018. We expect that a comparable increase in cash inflows related to reinsurance recoveries in the near future will largely offset any cash outflows from the payment of losses. The reinsurance payable also increased as we entered into our contract for the 2018-2019 catastrophe reinsurance program.
Investing Activities
The principal cash inflows from our investing activities come from repayments of principal, proceeds from maturities and sales of investments. We closely monitor and manage these risks through our comprehensive investment risk management process. The principal cash outflows relate to purchases of investments and cost of property, equipment and capitalized software acquired. The primary liquidity concerns with respect to these cash flows are the risk of default by debtors and market disruption. During the six months ended June 30, 2017, we had an increase of $95,284,000 in cash provided by investing activities as the result of the merger with AmCo that did not occur during the six months ended June 30, 2018.
Financing Activities
The principal cash outflows from our financing activities come from repayments of debt and payments of dividends. The primary liquidity concern with respect to these cash flows is market disruption in the cost and availability of credit. We believe our current capital resources, together with cash provided from our operations, are sufficient to meet currently anticipated working capital requirements. During the six months ended June 30, 2017, we had an increase of $15,682,000 in cash used in financing activities as the result of bank overdrafts that did not occur in the six months ended June 30, 2018.
OFF-BALANCE SHEET ARRANGEMENTS
At June 30, 2018, we did not have any off-balance-sheet arrangements or material changes to our contractual obligations during the quarter.
Item 3. Quantitative and Qualitative Disclosures About Market Risk
We are exposed to market risks, including interest rate risk related to changes in interest rates in our fixed-maturity securities, credit risk related to changes in the financial condition of the issuers of our fixed-maturities and equity price risk related to changes in equity security prices. These risks are disclosed in Part II, Item 7A of our Annual Report on Form 10-K for the year ended December 31, 2017. We had no material changes in our market risk during the six months ended June 30, 2018.
Item 4. Controls and Procedures
We maintain a set of disclosure controls and procedures designed to ensure that the information we must disclose in reports we file or submit under the Securities Exchange Act of 1934, as amended (Exchange Act), is recorded, processed, summarized and reported within the time periods specified in the Securities and Exchange Commission's rules and forms. We designed our disclosure controls with the objective of ensuring we accumulate and communicate this information to our management, including our principal executive officer and principal financial officer, as appropriate, to allow timely decisions regarding required disclosure.
Under the supervision and with the participation of our management, including our principal executive officer and principal financial officer, we conducted an evaluation of the effectiveness of the design and operations of our disclosure controls and procedures, as such term is defined in Rules 13a-15(e) and 15d-15(e) under the Exchange Act, as of the end of the period covered by this report. Based on our evaluation, our principal executive officer and principal financial officer concluded that our disclosure controls and procedures were not effective as of the end of the period covered by this report, due to previously disclosed material weaknesses in internal control over financial reporting as discussed below. These material weakness were identified and discussed in Part II, Item 9A of our Form 10-K for the year ended December 31, 2017.
Notwithstanding these material weaknesses, management has concluded that the consolidated financial statements included in this Form 10-Q fairly present, in all material respects, the financial position, results of operations and cash flows for the periods presented in accordance with U.S. generally accepted accounting principles.
Material Weakness in Internal Control Over Financial Reporting
We identified the following material weaknesses in the operation of our internal control over financial reporting as previously disclosed in our 2017 Form 10-K:
41
UNITED INSURANCE HOLDINGS CORP.
• | A failure of the operating effectiveness of a monitoring control designed to ensure that the Company obtains evidence of the design and operating effectiveness of the general information technology controls intended to prevent unauthorized system access and inappropriate change management to two third-party service organization's professional services systems and information contained within. |
• | We did not maintain effective accounting policies and procedural controls over the financial reporting for income taxes, acquisition purchase accounting and investments to ensure accurate and consistent financial reporting in accordance with GAAP. |
Remediation Plans
Our management, with oversight from our Audit Committee, has initiated a plan to remediate the material weakness previously identified in the Form 10-K for the period ended December 31, 2017. These plans include implementing effective controls over third-party systems and working with the providers to receive timely Service Organization Control reports in the future, as well as focusing on the accounting and disclosure for unusual and complex transactions, while augmenting existing staff with additional skilled accounting resources and strengthening the review process to improve the operation of financial reporting and corresponding internal controls. These new controls and procedures are in the process of being implemented and will be tested in connection with audit procedures for the year ending December 31, 2018. Until management has tested the remediation and concluded that the controls are operating effectively as designed, the material weaknesses will continue to exist.
Changes in Internal Control over Financial Reporting
Except for the material weakness remediation efforts identified above, we did not make any changes in our internal control over financial reporting that have materially affected, or are reasonably likely to materially affect, our internal control over financial reporting during the quarter ended June 30, 2018.
42
UNITED INSURANCE HOLDINGS CORP.
PART II. OTHER INFORMATION
Item 1. Legal Proceedings
We are involved in claims-related legal actions arising in the ordinary course of business. We accrue amounts resulting from claims-related legal actions in unpaid losses and loss adjustment expenses during the period that we determine an unfavorable outcome becomes probable and we can estimate the amounts. Management makes revisions to our estimates based on its analysis of subsequent information that we receive regarding various factors, including: (i) per claim information; (ii) company and industry historical loss experience; (iii) judicial decisions and legal developments in the awarding of damages; and (iv) trends in general economic conditions, including the effects of inflation.
At June 30, 2018, we were not involved in any material non-claims-related legal actions.
Item 1A. Risk Factors
There have been no material changes to the risk factors previously disclosed in Part I, Item 1A "Risk Factors" in our Annual Report on Form 10-K for the year ended December 31, 2017.
Item 2. Unregistered Sales of Equity Securities and Use of Proceeds
During the three and six months ended June 30, 2018, we did not sell any unregistered equity securities or repurchase any of our equity securities.
Item 3. Defaults Upon Senior Securities
None.
Item 4. Mine Safety Disclosures
Not applicable.
Item 5. Other Information
None.
Item 6. Exhibits
The following exhibits are filed or furnished herewith or are incorporated herein by reference:
Exhibit | Description | |
Certification of Principal Executive Officer pursuant to Section 302 of the Sarbanes-Oxley Act. | ||
Certification of Principal Financial Officer pursuant to Section 302 of the Sarbanes-Oxley Act. | ||
Certification of Principal Executive Officer pursuant to Section 906 of the Sarbanes-Oxley Act. | ||
Certification of Principal Financial Officer pursuant to Section 906 of the Sarbanes-Oxley Act. | ||
101.INS | XBRL Instance Document | |
101.SCH | XBRL Taxonomy Extension Schema | |
101.CAL | XBRL Taxonomy Extension Calculation Linkbase | |
101.DEF | XBRL Taxonomy Extension Definition Linkbase | |
101.LAB | XBRL Taxonomy Extension Label Linkbase | |
101.PRE | XBRL Taxonomy Extension Presentation Linkbase | |
43
UNITED INSURANCE HOLDINGS CORP.
SIGNATURES
Pursuant to the requirements of the Securities Exchange Act of 1934, the Registrant has duly caused this report to be signed on its behalf by the undersigned thereunto duly authorized.
UNITED INSURANCE HOLDINGS CORP. | ||
August 3, 2018 | By: | /s/ John Forney |
John Forney, Chief Executive Officer (principal executive officer and duly authorized officer) | ||
August 3, 2018 | By: | /s/ B. Bradford Martz |
B. Bradford Martz, Chief Financial Officer (principal financial officer and principal accounting officer) | ||
44