Attached files
| file | filename |
|---|---|
| EX-99.1 - EX-99.1 - TripAdvisor, Inc. | trip-ex991_7.htm |
| 8-K - 8-K - TripAdvisor, Inc. | trip-8k_20180801.htm |
Exhibit 99.2

TripAdvisor, Inc. Q2 2018 Prepared Remarks
(All comparisons are against the same period of the prior year, unless otherwise noted; some calculations may not foot due to rounding)
We are pleased with our solid second quarter results. Q2 consolidated revenue grew 2% and adjusted EBITDA grew 8%, including 6% adjusted EBITDA growth in our Hotel segment. We’re making great progress; operational changes have taken hold, and we are pursuing large growth opportunities across our global travel platform.
Our honed marketing investments was a key driver of Hotel segment adjusted EBITDA growth in Q2. Our product and marketing execution, as well as stable auction dynamics, drove improved revenue per hotel shopper performance. We also rapidly scaled bookable supply in Experiences and Restaurants, addressing our strong consumer demand and driving strong bookings and revenue growth in those offerings.
Business trends have strengthened since the beginning of the year. Our first half results and recent performance make us incrementally confident we can deliver on our near-term expectation for consolidated adjusted EBITDA growth this year.
Q2 2018 Hotel Segment Update
Our Q2 results further demonstrate how we are changing the profit trajectory of our Hotel segment.
Hotel adjusted EBITDA growth improved for the third straight quarter, growing 6% in Q2, while Hotel segment revenue results improved compared to Q1 to negative 4% year-over-year. Click-based revenue improved compared to Q1 to negative 7% year-over-year. Display and subscription revenue grew 8% helped by early partner adoption of our media ad product. Other hotel revenue declined 11% as we optimized performance marketing investments in this area of the business.
In our auction, revenue per hotel shopper performance trends improved five points compared to Q1. Stable auction dynamics have persisted since mid-Q4 2017, though difficult year-over-year comparisons for auction pricing will persist throughout most of this year.
During Q2, mobile revenue per hotel shopper again grew double-digits and reached a new all-time high. Mobile hotel shoppers grew 17% and accounted for nearly 50% of total hotel shoppers in Q2, highlighting significant engagement on this strategic platform. Mobile click-based revenue grew more than 30%. Across all devices, we remain focused on enhancing our hotel shopping experience, gaining mindshare with consumers as a great place to find the best hotel price when they are ready to book, and driving conversion gains that will enable TripAdvisor to gain share of partner marketing budgets.
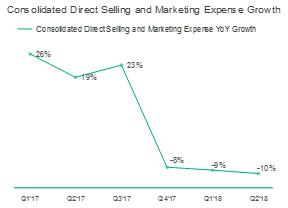
At the same time, ongoing optimization of our hotel marketing investments has established a more solid foundation. Despite investing approximately $17 million more on TV advertising in Q2 2018 compared to Q2 2017 ($33 million versus $16 million) and expanding our Non-Hotel direct advertising budget,
1
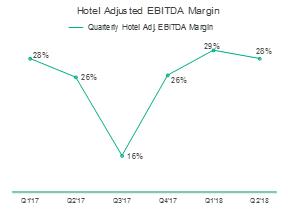
consolidated direct selling and marketing expenses decreased by 10% year-over-year, once again highlighting our material reduction of hotel online direct marketing expenses. Our streamlined Hotel marketing efforts drove Hotel segment adjusted EBITDA back to positive growth in Q2 and Hotel segment adjusted EBITDA margin of 28%, which was a 200 basis point improvement compared to Q2 2017, as illustrated by the graphics below.
This efficiency has come with expected trade-offs and the modest 3% hotel shopper decline in Q2 was a solid outcome relative to our significant reduction in performance marketing expenses year-over-year.
Lastly, we’ve seen traction for our media ad product, that helps more of the 1.2 million hoteliers on our platform get discovered in more hotel searches. Our early progress speaks to the TripAdvisor platform’s unique potential to connect more partners with additional media advertising opportunities as they look to tap into TripAdvisor’s massive global audience. We are just getting started and have exciting work ahead.
We are pleased with our progress so far this year as we continue to establish a better foundation for long-term profitable growth.
Q2 2018 Non-Hotel Segment Update
In our Non-Hotel segment, during Q2 we drove bookable supply growth, product enhancements, and platform expansion.
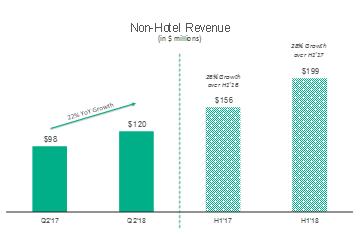
Non-Hotel segment revenue grew 22% in Q2, decelerating compared to Q1 primarily due to a tougher year-over-year growth comparison. We had continued strong demand and supply growth trends in Experiences and Restaurants during the second quarter, and we note that first half 2018 revenue growth was in line with last year. Similarly, our performance to-date keeps us on track for full year Non-Hotel segment growth in line with prior years, as illustrated by the graphic below.
2
Non-Hotel adjusted EBITDA grew 18% to $20 million, a strong result now that we have lapped the operational and marketing efficiency gains we implemented at the beginning of last year.
In Experiences, during Q2 we expanded our marketplace, reinforcing our leadership position as the world’s largest online platform to book and sell tours, attractions and travel experiences. Bookable product growth accelerated again to 98%, reaching 121,000. Our supply offering is also growing in breadth as traveler demand grows for experiential categories like food, cultural and outdoor experiences, nicely complementing our selection of traditional tours, activities and attractions.

Note: Starting in Q1 2018, Experiences bookable product figures are inclusive of products with seasonal availability.
Other key growth initiatives are doing well, as the TripAdvisor channel and mobile each continue to gain share of total Experiences bookings on our platform.
We are very pleased with our progress and we are investing to further our lead in this $110 billion category.
3
Restaurants is our other fast-growing Non-Hotel offering, with continued strong demand and bookable supply growth in our transaction business, as well as further traction of our new TripAdvisor ad products.
We reached nearly 52,000 bookable restaurants on LaFourchette, up 18% year-over-year, and seated diners grew 20% – with three-quarters of bookings via mobile.
TripAdvisor restaurant pages have more than 200 million visits per month from consumers looking for great places to eat. Our TripAdvisor media ad products launched last year are helping tens of thousands of restauranteurs enhance their profiles and increase their visibility with the TripAdvisor audience. The vast majority of partner sign-ups to-date have been conducted through self-service channels, and at less than 1% penetration of the 4.7 million restaurants on our platform, we see a tremendous growth opportunity ahead.
Finally, Rentals listings grew to 855,000, nicely rounding out our consumer offering of places to stay. Nearly 85% of this inventory is bookable online, and we’re quickly increasing the percentage that can be booked seamlessly and instantly on our platform. Though finding year-on-year growth remains challenging in the competitive, global alternative accommodations market, we continue to manage costs judiciously while operating this business at a nice profit margin.
Our Non-Hotel offerings continue to capitalize on significant supply and demand advantages and our focus remains on driving revenue growth and market share gains. We continue to invest in product enhancements, supply growth and platform expansion as we help consumers find, book and enjoy more great travel experiences.
Q2 2018 Consolidated Financials
Consolidated total revenue increased 2% year-over-year in reported currency. We estimate that changes in foreign currency provided a 2% tailwind in the period.
Consolidated GAAP net income increased to $32 million. The Q2 GAAP effective tax rate was approximately 24%.
Consolidated total adjusted EBITDA increased by 8% in reported currency. We estimate that changes in foreign currency provided a 5% tailwind in the period.
Cash provided by operating activities was $186 million, or 43% of revenue, during Q2. Capital expenditures were $16 million, or 4% of revenue.
Cash, cash equivalents and short-term and long-term marketable securities were $680 million at June 30, 2018, a decrease of $55 million since December 31, 2017, driven primarily by our net repayment of $230 million of borrowings under our 2015 credit facility, and $100 million of cash used to repurchase 2.6 million shares of our common stock at an average price of $38.73 per share, offset partially by our strong operating cash flow generation year-to-date.
Of the $100 million we’ve allocated to share repurchases year-to-date, $90 million was allocated during the second quarter of 2018 to repurchase approximately 2.3 million shares of outstanding common
4
stock at an average price of $38.60 per share. $150 million remains available under the share repurchase program authorized in January 2018 by TripAdvisor’s Board of Directors.
2018 Outlook
As a reminder, consumer adoption of mobile, competition on marketing channels, travel industry competitive dynamics, bidding volatility in our click-based auction and macro-economic events – among a number of other factors outside of our control – can limit our visibility into near-term financial performance. We endeavor to be as accurate as possible with our forward-looking commentary, though these factors can cause actual results to vary materially.
As outlined above, our first half results and recent performance make us incrementally confident in our consolidated adjusted EBITDA growth expectation. We expect to deliver full year 2018 adjusted EBITDA growth in both our Hotel segment and our Non-Hotel segment.
We maintain our expectation that full year 2018 Hotel segment revenue will decline compared to 2017 due to re-balancing our paid marketing investment mix and due to tough year-over-year comparisons for click-based revenue. We also continue to expect click-based revenue trends to improve later in the year as we lap difficult year-over-year comparisons for auction pricing.
We also remain on track to deliver Non-Hotel segment revenue growth at levels similar to 2016 and 2017.
In summary, it was a strong first half of 2018. The TripAdvisor travel platform continues to strengthen and we are executing in pursuit of exciting growth opportunities.
* * *
TripAdvisor’s second quarter 2018 earnings press release is available on the Investor Relations section of the TripAdvisor website at http://ir.tripadvisor.com/. The earnings release is also included as Exhibit 99.1 to our Current Report on Form 8-K as furnished to the U.S. Securities Exchange Commission, or SEC, on August 1, 2018, which is available on the Investor Relations section of our website at http://ir.tripadvisor.com/ and the SEC’s website at www.sec.gov.
Forward-Looking Statements:
These prepared remarks contain “forward-looking statements” within the meaning of Section 27A of the Securities Act of 1933, as amended, or the Securities Act, and Section 21E of the Securities Exchange Act of 1934, as amended, or the Exchange Act. The following words, when used, are intended to identify forward-looking statements: “anticipate,” “believe,” “could,” “estimate,” “expect,” “intend,” “may,” “might,” “plan,” “project,” “should,” “will,” and similar expressions which do not relate solely to historical matters. We caution investors that any forward-looking statements in these prepared remarks, or which management may make orally or in writing from time to time, are based on management’s beliefs and on assumptions made by, and information currently available to, management. Such statements are subject to risks, uncertainties and assumptions and are not guarantees of future performance, which may be affected by known and unknown risks, trends, uncertainties and factors that are beyond our control. Some of the risks and uncertainties that may cause our actual results, performance or achievements to differ materially from those expressed or
5
implied by forward-looking statements are more fully described in Part II. Item 1A. "Risk Factors" of our Quarterly Report on Form 10-Q. Moreover, we operate in a rapidly changing environment. New risk factors emerge from time to time and it is not possible for management to predict all such risk factors, nor can we assess the impact of all such risk factors on our business or the extent to which any factor, or combination of factors, may cause actual results to differ materially from those contained in any forward-looking statements. We caution you that, while forward-looking statements reflect our good faith beliefs when we make them, they are not guarantees of future performance and are impacted by actual events when they occur after we make such statements. We expressly disclaim any responsibility to update our forward-looking statements, whether as a result of new information, future events or otherwise.
Investors should also refer to our quarterly reports on Form 10-Q for future periods and current reports on Form 8-K as we file them with the SEC and to other materials we may furnish to the public from time to time through current reports on Form 8-K or otherwise, for a discussion of risks and uncertainties that may cause actual results, performance or achievements to differ materially from those expressed or implied by forward-looking statements.
Use of Non-GAAP Financial Measures:
These prepared remarks may include references to non-GAAP measures, such as adjusted EBITDA (including forecasted adjusted EBITDA), free cash flow, and constant currency measurements, such as, non-GAAP revenue before effects of foreign exchange, and adjusted EBITDA before effects of foreign exchange, which are considered non-GAAP financial measures as they are not prepared in conformity with accounting principles generally accepted in the United States (“GAAP”). These non-GAAP financial measures are not prepared under a comprehensive set of accounting rules and, therefore, should only be reviewed alongside results reported under GAAP.
We encourage investors to review our earnings press release as it contains important information about our financial results, including tabular reconciliations to the most directly comparable GAAP financial measure, definitions, limitations and other related information about these non-GAAP financial measures. The earning press release in addition to other supplemental financial information is available on the Investor Relations section of our website at http://ir.tripadvisor.com/. The earnings press release is also included as Exhibit 99.1 to our Current Report on Form 8-K as furnished to the SEC on August 1, 2018, which is available on the Investor Relations section of our website at http://ir.tripadvisor.com/ and the SEC’s website at www.sec.gov.
6