Attached files
| file | filename |
|---|---|
| EX-99.1 - EX-99.1 - INSIGHT ENTERPRISES INC | d590155dex991.htm |
| 8-K - 8-K - INSIGHT ENTERPRISES INC | d590155d8k.htm |

Insight Enterprises, Inc. Second Quarter 2018 Earnings Conference Call and Webcast Exhibit 99.2
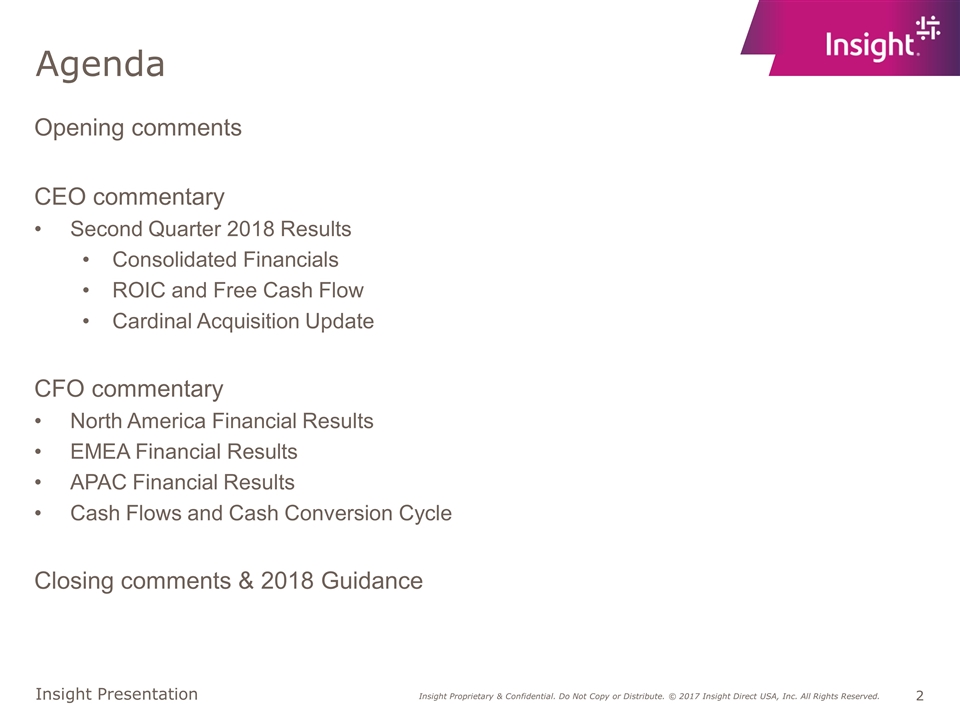
Agenda Opening comments CEO commentary Second Quarter 2018 Results Consolidated Financials ROIC and Free Cash Flow Cardinal Acquisition Update CFO commentary North America Financial Results EMEA Financial Results APAC Financial Results Cash Flows and Cash Conversion Cycle Closing comments & 2018 Guidance
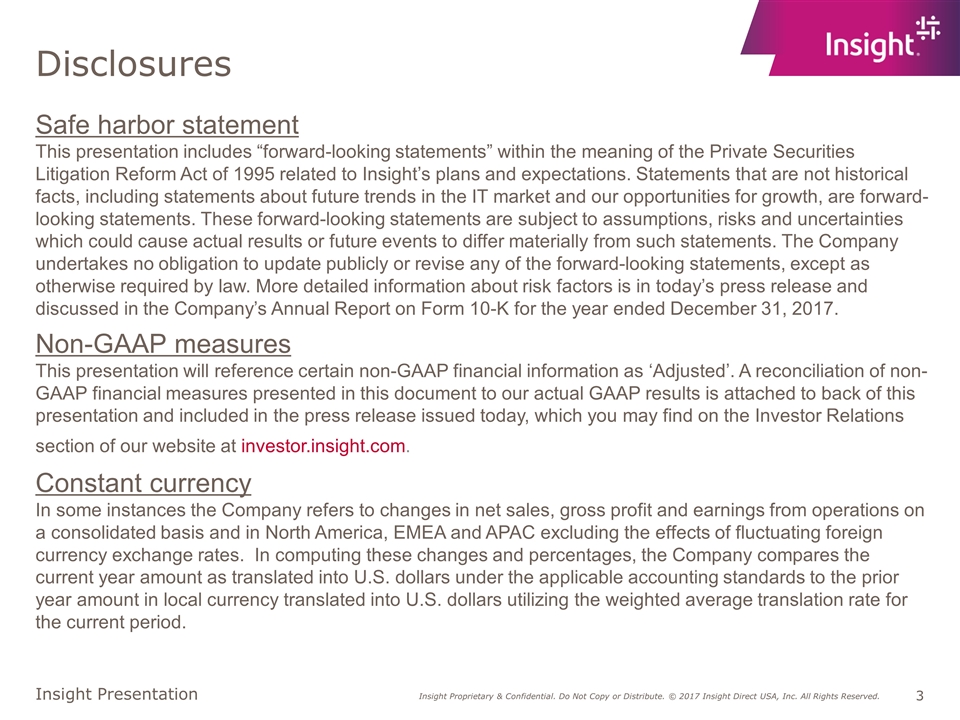
Disclosures Safe harbor statement This presentation includes “forward-looking statements” within the meaning of the Private Securities Litigation Reform Act of 1995 related to Insight’s plans and expectations. Statements that are not historical facts, including statements about future trends in the IT market and our opportunities for growth, are forward-looking statements. These forward-looking statements are subject to assumptions, risks and uncertainties which could cause actual results or future events to differ materially from such statements. The Company undertakes no obligation to update publicly or revise any of the forward-looking statements, except as otherwise required by law. More detailed information about risk factors is in today’s press release and discussed in the Company’s Annual Report on Form 10-K for the year ended December 31, 2017. Non-GAAP measures This presentation will reference certain non-GAAP financial information as ‘Adjusted’. A reconciliation of non-GAAP financial measures presented in this document to our actual GAAP results is attached to back of this presentation and included in the press release issued today, which you may find on the Investor Relations section of our website at investor.insight.com. Constant currency In some instances the Company refers to changes in net sales, gross profit and earnings from operations on a consolidated basis and in North America, EMEA and APAC excluding the effects of fluctuating foreign currency exchange rates. In computing these changes and percentages, the Company compares the current year amount as translated into U.S. dollars under the applicable accounting standards to the prior year amount in local currency translated into U.S. dollars utilizing the weighted average translation rate for the current period.
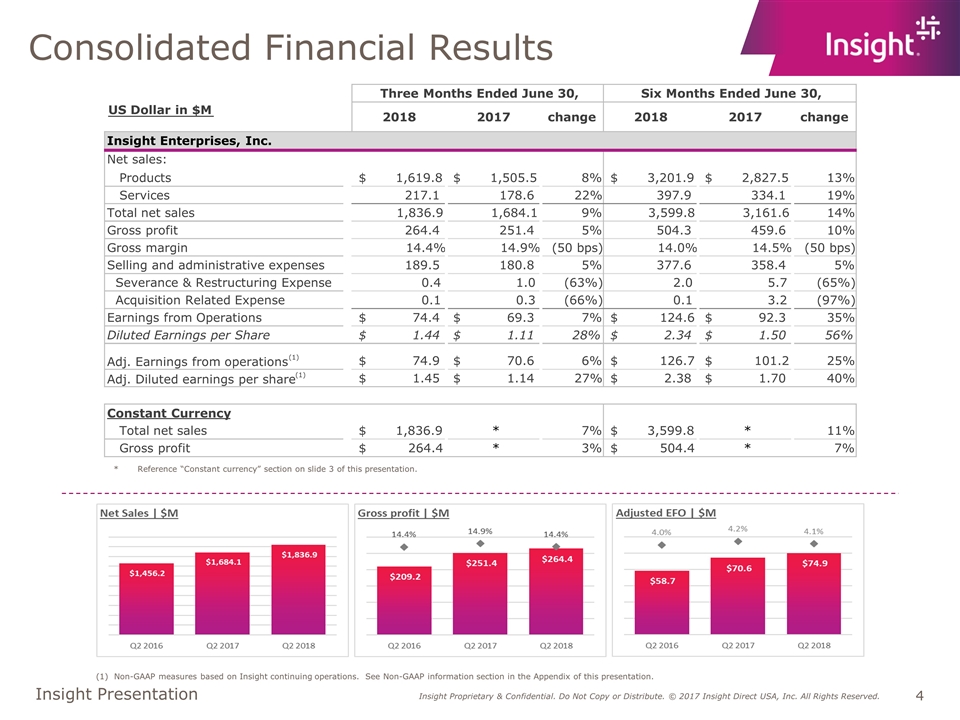
Consolidated Financial Results (1) Non-GAAP measures based on Insight continuing operations. See Non-GAAP information section in the Appendix of this presentation. *Reference “Constant currency” section on slide 3 of this presentation. US Dollar in $M 2018 2017 change 2018 2017 change Products $ 1,619.8 $ 1,505.5 8% $ 3,201.9 $ 2,827.5 13% Services 217.1 178.6 22% 397.9 334.1 19% Total net sales 1,836.9 1,684.1 9% 3,599.8 3,161.6 14% Gross profit 264.4 251.4 5% 504.3 459.6 10% Gross margin 14.4% 14.9% (50 bps) 14.0% 14.5% (50 bps) Selling and administrative expenses 189.5 180.8 5% 377.6 358.4 5% Severance & Restructuring Expense 0.4 1.0 (63%) 2.0 5.7 (65%) Acquisition Related Expense 0.1 0.3 (66%) 0.1 3.2 (97%) Earnings from Operations $ 74.4 $ 69.3 7% $ 124.6 $ 92.3 35% Diluted Earnings per Share $ 1.44 $ 1.11 28% $ 2.34 $ 1.50 56% Adj. Earnings from operations (1) $ 74.9 $ 70.6 6% $ 126.7 $ 101.2 25% Adj. Diluted earnings per share (1) $ 1.45 $ 1.14 27% $ 2.38 $ 1.70 40% Constant Currency Total net sales $ 1,836.9 * 7% $ 3,599.8 * 11% Gross profit $ 264.4 * 3% $ 504.4 * 7% Three Months Ended June 30, Six Months Ended June 30, Insight Enterprises, Inc. Net sales:
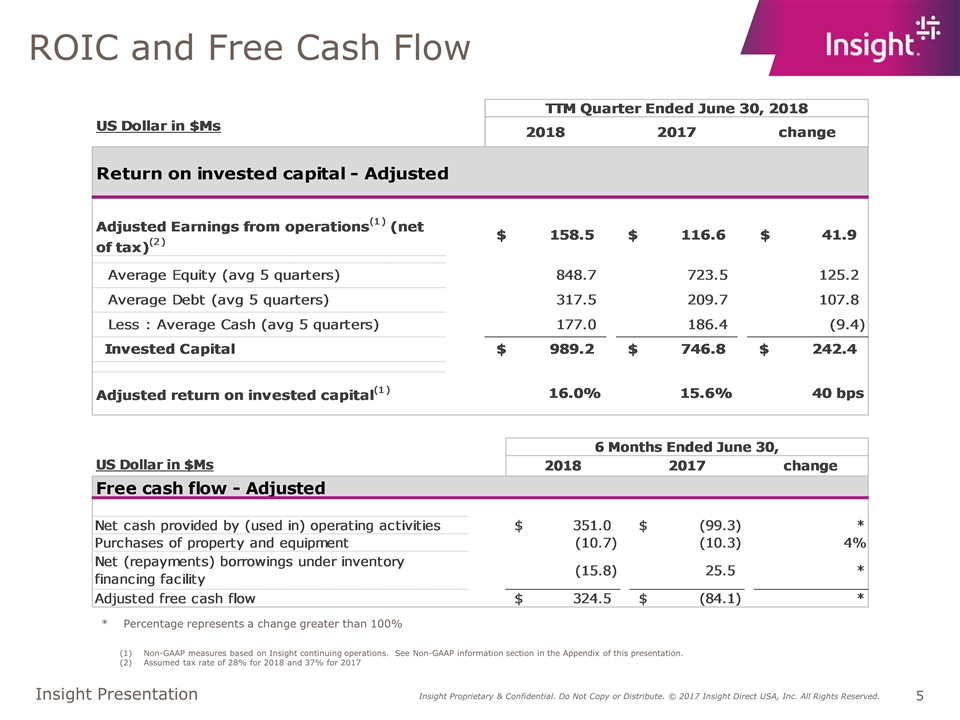
ROIC and Free Cash Flow * Percentage represents a change greater than 100% Non-GAAP measures based on Insight continuing operations. See Non-GAAP information section in the Appendix of this presentation. Assumed tax rate of 28% for 2018 and 37% for 2017
Cardinal Acquisition Update Expertise in mobile app development, IoT, and cloud enabled BI 450 technical sales and service delivery teammates Expect to acquire for ~$79M (net of cash acquired, subject to a final working capital adjustment)
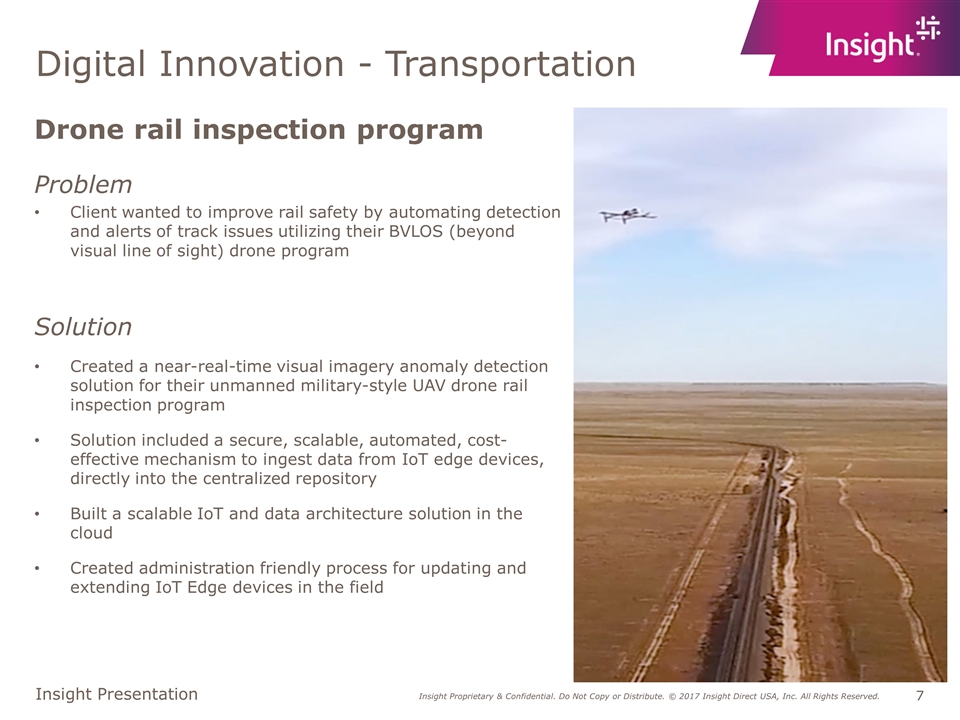
Digital Innovation - Transportation Drone rail inspection program Problem Client wanted to improve rail safety by automating detection and alerts of track issues utilizing their BVLOS (beyond visual line of sight) drone program Solution Created a near-real-time visual imagery anomaly detection solution for their unmanned military-style UAV drone rail inspection program Solution included a secure, scalable, automated, cost-effective mechanism to ingest data from IoT edge devices, directly into the centralized repository Built a scalable IoT and data architecture solution in the cloud Created administration friendly process for updating and extending IoT Edge devices in the field
CFO Commentary North America Financial Results EMEA Financial Results APAC Financial Results Cash Flows and Cash Conversion Cycle
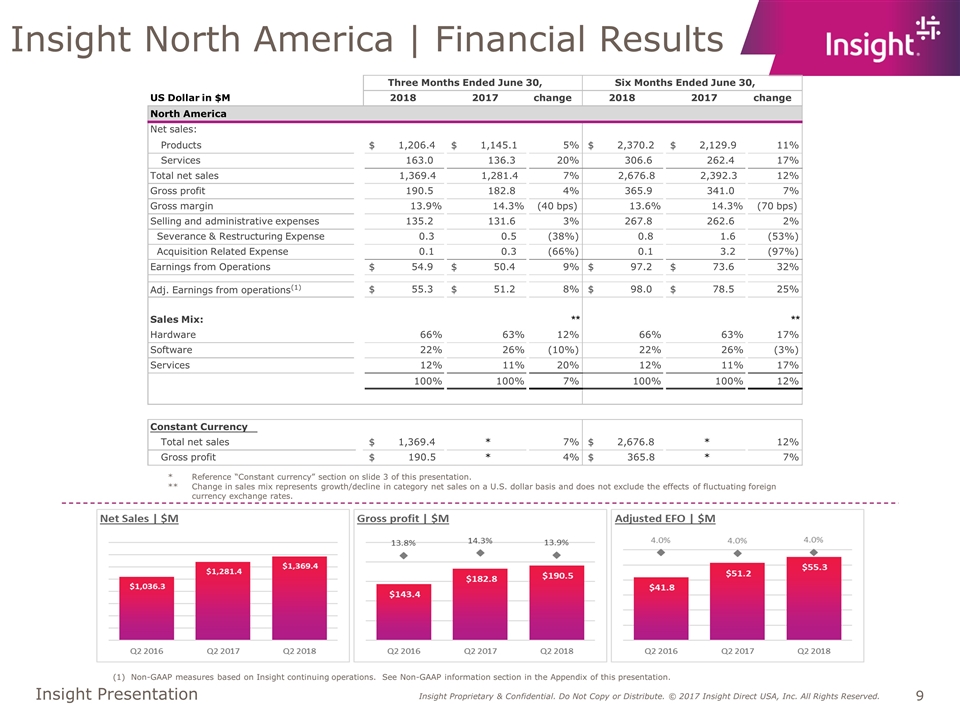
Insight North America | Financial Results *Reference “Constant currency” section on slide 3 of this presentation. **Change in sales mix represents growth/decline in category net sales on a U.S. dollar basis and does not exclude the effects of fluctuating foreign currency exchange rates. (1) Non-GAAP measures based on Insight continuing operations. See Non-GAAP information section in the Appendix of this presentation. US Dollar in $M 2018 2017 change 2018 2017 change North America Products $ 1,206.4 $ 1,145.1 5% $ 2,370.2 $ 2,129.9 11% Services 163.0 136.3 20% 306.6 262.4 17% Total net sales 1,369.4 1,281.4 7% 2,676.8 2,392.3 12% Gross profit 190.5 182.8 4% 365.9 341.0 7% Gross margin 13.9% 14.3% (40 bps) 13.6% 14.3% (70 bps) Selling and administrative expenses 135.2 131.6 3% 267.8 262.6 2% Severance & Restructuring Expense 0.3 0.5 (38%) 0.8 1.6 (53%) Acquisition Related Expense 0.1 0.3 (66%) 0.1 3.2 (97%) Earnings from Operations $ 54.9 $ 50.4 9% $ 97.2 $ 73.6 32% Adj. Earnings from operations (1) $ 55.3 $ 51.2 8% $ 98.0 $ 78.5 25% ** ** Hardware 66% 63% 12% 66% 63% 17% Software 22% 26% (10%) 22% 26% (3%) Services 12% 11% 20% 12% 11% 17% 100% 100% 7% 100% 100% 12% Constant Currency Total net sales $ 1,369.4 * 7% $ 2,676.8 * 12% Gross profit $ 190.5 * 4% $ 365.8 * 7% Three Months Ended June 30, Six Months Ended June 30, Net sales: Sales Mix:
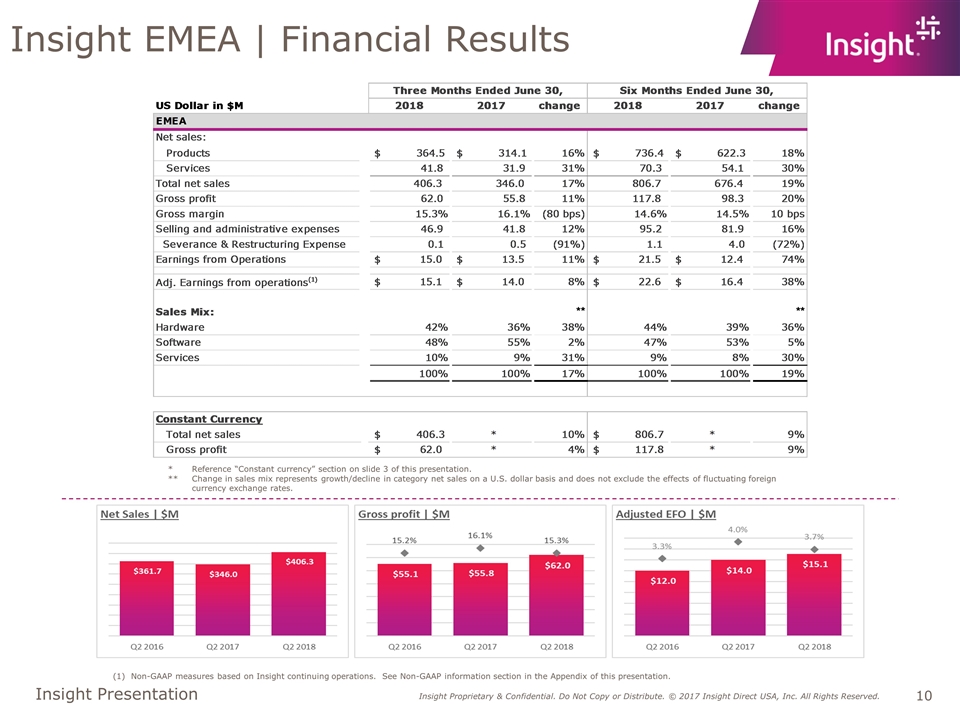
Insight EMEA | Financial Results *Reference “Constant currency” section on slide 3 of this presentation. **Change in sales mix represents growth/decline in category net sales on a U.S. dollar basis and does not exclude the effects of fluctuating foreign currency exchange rates. (1) Non-GAAP measures based on Insight continuing operations. See Non-GAAP information section in the Appendix of this presentation.
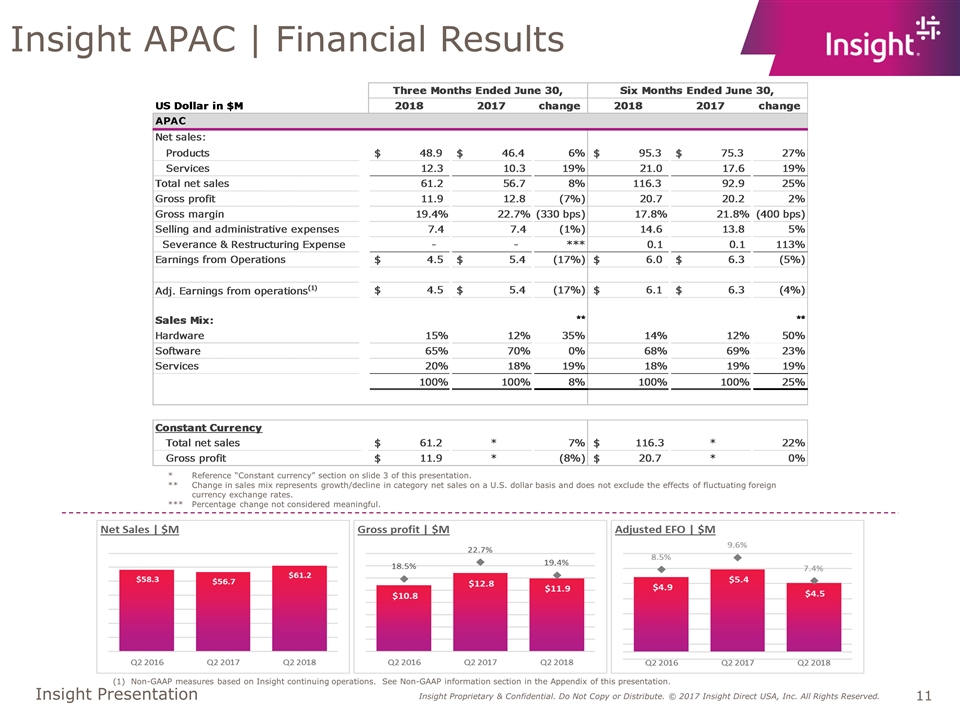
Insight APAC | Financial Results *Reference “Constant currency” section on slide 3 of this presentation. **Change in sales mix represents growth/decline in category net sales on a U.S. dollar basis and does not exclude the effects of fluctuating foreign currency exchange rates. ***Percentage change not considered meaningful. (1) Non-GAAP measures based on Insight continuing operations. See Non-GAAP information section in the Appendix of this presentation.
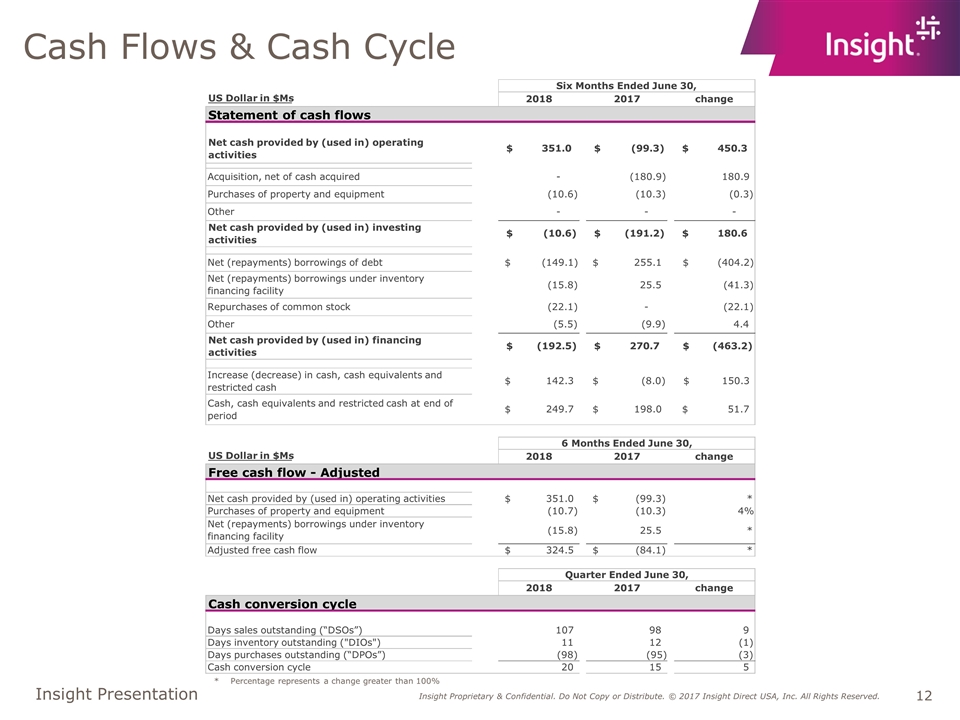
Cash Flows & Cash Cycle * Percentage represents a change greater than 100% US Dollar in $Ms 2018 2017 change Net cash provided by (used in) operating activities 351.0 $ (99.3) $ 450.3 $ Acquisition, net of cash acquired - (180.9) 180.9 Purchases of property and equipment (10.6) (10.3) (0.3) Other - - - Net cash provided by (used in) investing activities (10.6) $ (191.2) $ 180.6 $ Net (repayments) borrowings of debt (149.1) $ 255.1 $ (404.2) $ Net (repayments) borrowings under inventory financing facility (15.8) 25.5 (41.3) Repurchases of common stock (22.1) - (22.1) Other (5.5) (9.9) 4.4 Net cash provided by (used in) financing activities (192.5) $ 270.7 $ (463.2) $ Increase (decrease) in cash, cash equivalents and restricted cash 142.3 $ (8.0) $ 150.3 $ Cash, cash equivalents and restricted cash at end of period 249.7 $ 198.0 $ 51.7 $ US Dollar in $Ms 2018 2017 change Free cash flow - Adjusted Net cash provided by (used in) operating activities 351.0 $ (99.3) $ * Purchases of property and equipment (10.7) (10.3) 4% Net (repayments) borrowings under inventory financing facility (15.8) 25.5 * Adjusted free cash flow 324.5 $ (84.1) $ * 2018 2017 change Days sales outstanding (“DSOs”) 107 98 9 Days inventory outstanding ("DIOs") 11 12 (1) Days purchases outstanding (“DPOs”) (98) (95) (3) Cash conversion cycle 20 15 5 Cash conversion cycle Quarter Ended June 30, 6 Months Ended June 30, Six Months Ended June 30, Statement of cash flows
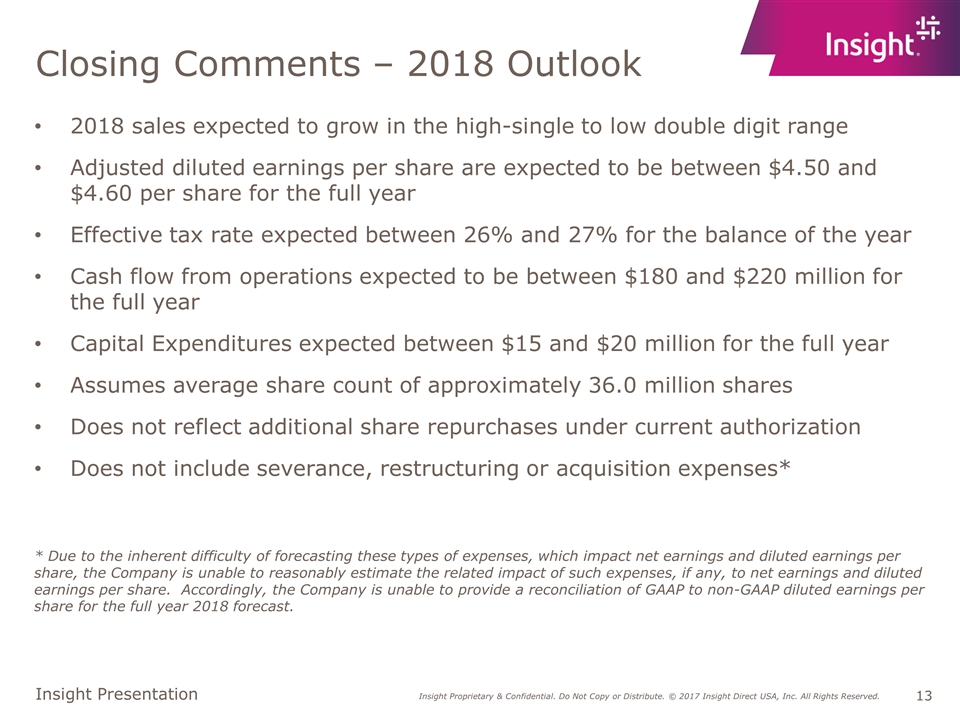
Closing Comments – 2018 Outlook 2018 sales expected to grow in the high-single to low double digit range Adjusted diluted earnings per share are expected to be between $4.50 and $4.60 per share for the full year Effective tax rate expected between 26% and 27% for the balance of the year Cash flow from operations expected to be between $180 and $220 million for the full year Capital Expenditures expected between $15 and $20 million for the full year Assumes average share count of approximately 36.0 million shares Does not reflect additional share repurchases under current authorization Does not include severance, restructuring or acquisition expenses* * Due to the inherent difficulty of forecasting these types of expenses, which impact net earnings and diluted earnings per share, the Company is unable to reasonably estimate the related impact of such expenses, if any, to net earnings and diluted earnings per share. Accordingly, the Company is unable to provide a reconciliation of GAAP to non-GAAP diluted earnings per share for the full year 2018 forecast.
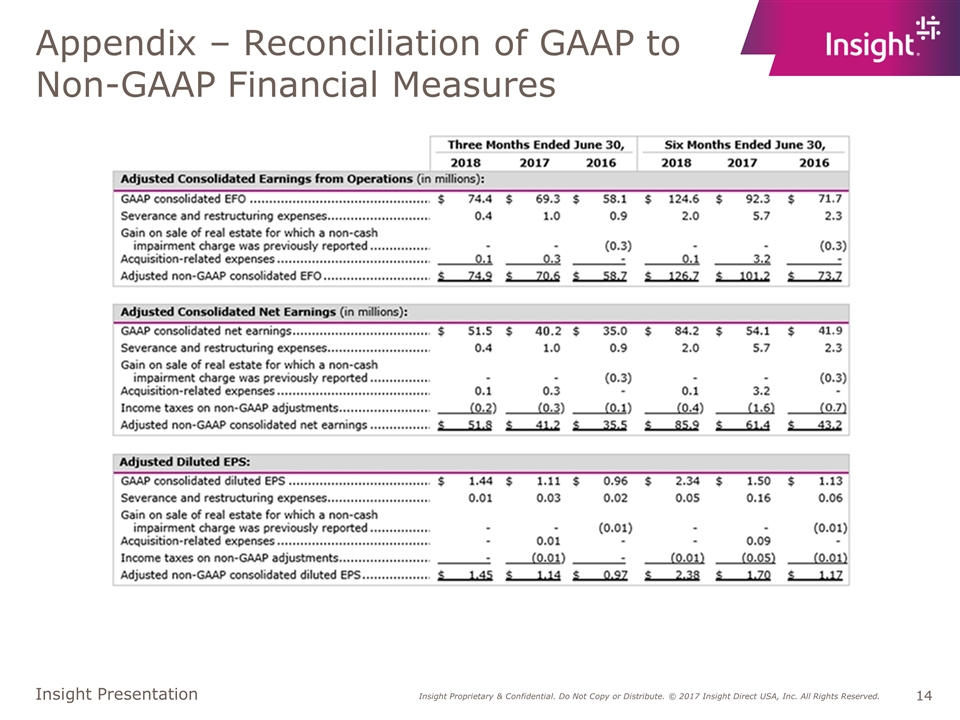
Appendix – Reconciliation of GAAP to Non-GAAP Financial Measures
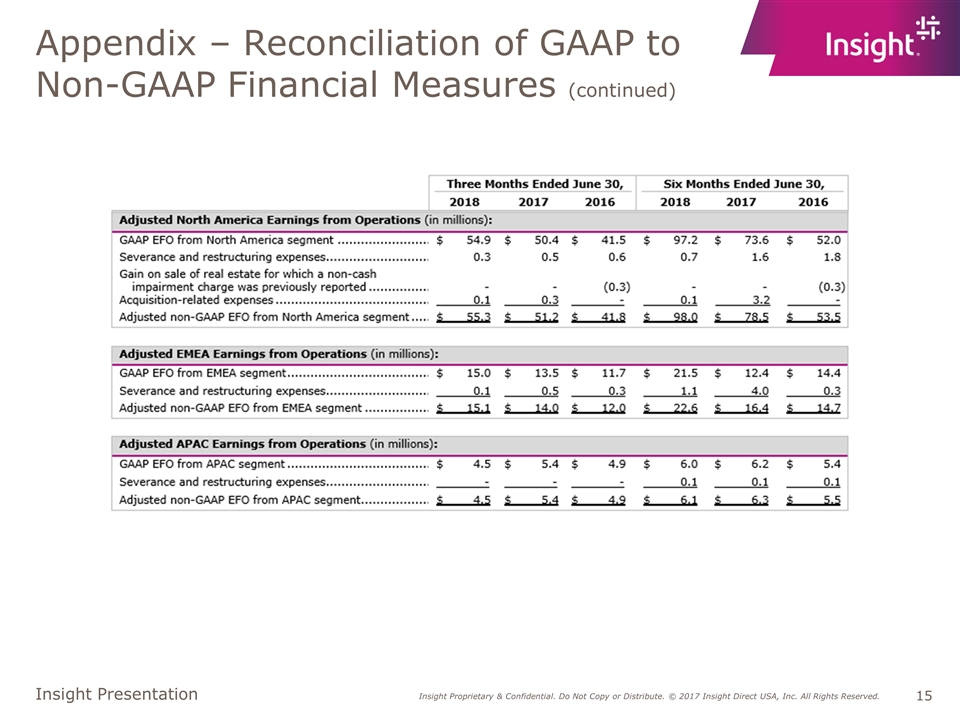
Appendix – Reconciliation of GAAP to Non-GAAP Financial Measures (continued)
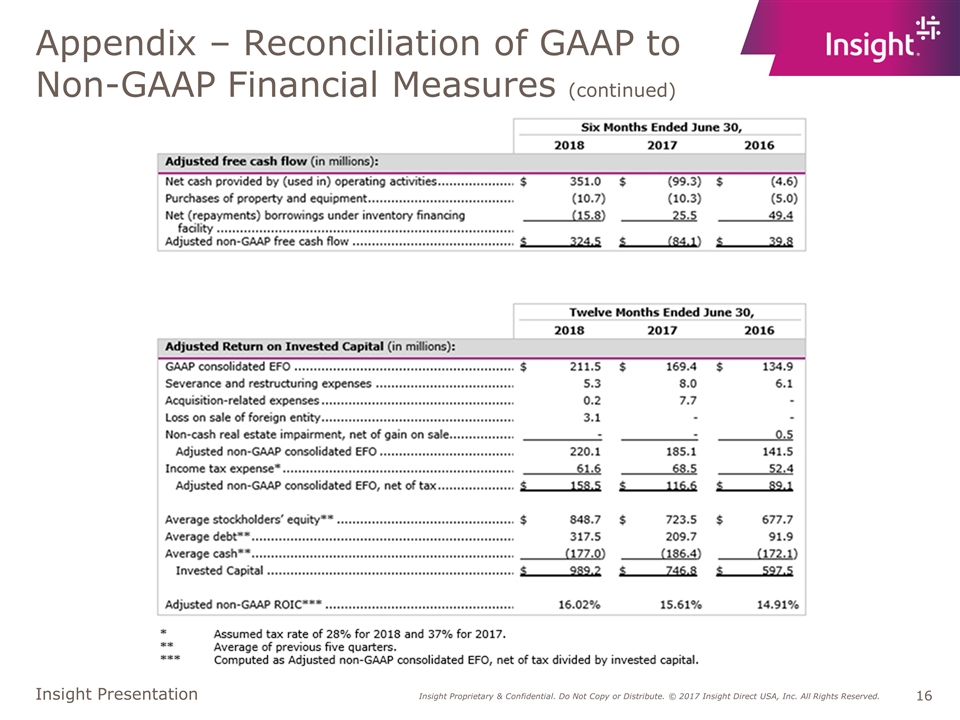
Appendix – Reconciliation of GAAP to Non-GAAP Financial Measures (continued)
