Attached files
| file | filename |
|---|---|
| EX-32.2 - EX-32.2 - MCDERMOTT INTERNATIONAL INC | mdr-ex322_7.htm |
| EX-32.1 - EX-32.1 - MCDERMOTT INTERNATIONAL INC | mdr-ex321_9.htm |
| EX-31.2 - EX-31.2 - MCDERMOTT INTERNATIONAL INC | mdr-ex312_10.htm |
| EX-31.1 - EX-31.1 - MCDERMOTT INTERNATIONAL INC | mdr-ex311_8.htm |
UNITED STATES
SECURITIES AND EXCHANGE COMMISSION
Washington, D.C. 20549
FORM 10-Q
(Mark One)
|
☑ |
QUARTERLY REPORT PURSUANT TO SECTION 13 OR 15(d) OF THE SECURITIES EXCHANGE ACT OF 1934 |
For the quarterly period ended June 30, 2018
OR
|
☐ |
TRANSITION REPORT PURSUANT TO SECTION 13 OR 15(d) OF THE SECURITIES EXCHANGE ACT OF 1934 |
For the transition period from to
Commission File No. 001-08430
McDERMOTT INTERNATIONAL, INC.
(Exact name of registrant as specified in its charter)
|
REPUBLIC OF PANAMA |
|
|
72-0593134 |
|
(State or Other Jurisdiction of Incorporation or Organization) |
|
|
(I.R.S. Employer Identification No.) |
|
|
|
|
|
|
757 N. Eldridge Parkway HOUSTON, TEXAS |
|
|
77079 |
|
(Address of Principal Executive Offices) |
|
|
(Zip Code) |

Registrant’s Telephone Number, Including Area Code: (281) 870-5000
Indicate by check mark whether the registrant (1) has filed all reports required to be filed by Section 13 or 15(d) of the Securities Exchange Act of 1934 during the preceding 12 months (or for such shorter period that the registrant was required to file such reports), and (2) has been subject to such filing requirements for the past 90 days. Yes ☑ No ☐
Indicate by check mark whether the registrant has submitted electronically and posted on its corporate Web site, if any, every Interactive Data File required to be submitted and posted pursuant to Rule 405 of Regulation S-T (§ 232.405 of this chapter) during the preceding 12 months (or for such shorter period that the registrant was required to submit and post such files). Yes ☑ No ☐
Indicate by check mark whether the registrant is a large accelerated filer, an accelerated filer, a non-accelerated filer, a smaller reporting company, or an emerging growth company. See the definitions of “large accelerated filer,” “accelerated filer”, “smaller reporting company” and “emerging growth company” in Rule 12b-2 of the Exchange Act.
|
Large accelerated filer |
☑ |
Accelerated filer |
☐ |
|
|
|
|
|
|
Non-accelerated filer |
☐ (Do not check if a smaller reporting company) |
Smaller reporting company |
☐ |
|
|
|
|
|
|
|
|
Emerging growth company |
☐ |
If an emerging growth company, indicate by check mark if the registrant has elected not to use the extended transition period for complying with any new or revised financial accounting standards provided pursuant to Section 13(a) of the Exchange Act. ☐
Indicate by check mark whether the registrant is a shell company (as defined in Rule 12b-2 of the Exchange Act). Yes ☐ No ☑
The number of shares of the registrant’s common stock outstanding at July 27, 2018 was 180,536,768.
TABLE OF CONTENTS
McDERMOTT INTERNATIONAL, INC.
INDEX—FORM 10-Q
|
|
|
PAGE |
|
|
1 |
|
|
Item 1—Condensed Consolidated Financial Statements |
|
|
|
|
1 |
|
|
|
2 |
|
|
|
3 |
|
|
|
4 |
|
|
|
5 |
|
|
|
7 |
|
|
Item 2—Management’s Discussion and Analysis of Financial Condition and Results of Operations |
|
43 |
|
Item 3—Quantitative and Qualitative Disclosures about Market Risk |
|
64 |
|
|
65 |
|
|
|
66 |
|
|
|
66 |
|
|
|
66 |
|
|
|
83 |
|
|
|
85 |
|
|
|
88 |
CONDENSED CONSOLIDATED FINANCIAL STATEMENTS
PART I: Item 1—FINANCIAL INFORMATION
|
McDERMOTT INTERNATIONAL, INC. |
|
|||||||||||||||
|
CONDENSED CONSOLIDATED STATEMENTS OF OPERATIONS |
|
|||||||||||||||
|
(Unaudited) |
|
|||||||||||||||
|
|
|
Three Months Ended June 30, |
|
|
Six Months Ended June 30, |
|
||||||||||
|
|
|
2018 |
|
|
2017 |
|
|
2018 |
|
|
2017 |
|
||||
|
|
|
(In millions, except per share amounts) |
|
|||||||||||||
|
Revenues |
|
$ |
1,735 |
|
|
$ |
789 |
|
|
$ |
2,343 |
|
|
$ |
1,308 |
|
|
|
|
|
|
|
|
|
|
|
|
|
|
|
|
|
|
|
|
Costs and Expenses: |
|
|
|
|
|
|
|
|
|
|
|
|
|
|
|
|
|
Cost of operations |
|
|
1,486 |
|
|
|
650 |
|
|
|
1,962 |
|
|
|
1,079 |
|
|
Project related intangibles amortization |
|
|
12 |
|
|
|
- |
|
|
|
12 |
|
|
|
- |
|
|
Total cost of operations |
|
|
1,498 |
|
|
|
650 |
|
|
|
1,974 |
|
|
|
1,079 |
|
|
Research and development expenses |
|
|
5 |
|
|
|
1 |
|
|
|
5 |
|
|
|
1 |
|
|
Selling, general and administrative expenses |
|
|
75 |
|
|
|
50 |
|
|
|
124 |
|
|
|
87 |
|
|
Other intangibles amortization |
|
|
10 |
|
|
|
- |
|
|
|
10 |
|
|
|
- |
|
|
Transaction costs |
|
|
37 |
|
|
|
- |
|
|
|
40 |
|
|
|
- |
|
|
Restructuring and integration costs |
|
|
63 |
|
|
|
- |
|
|
|
75 |
|
|
|
- |
|
|
Other operating expenses (income), net |
|
|
1 |
|
|
|
- |
|
|
|
1 |
|
|
|
(2 |
) |
|
Total expenses |
|
|
1,689 |
|
|
|
701 |
|
|
|
2,229 |
|
|
|
1,165 |
|
|
|
|
|
|
|
|
|
|
|
|
|
|
|
|
|
|
|
|
Income (loss) from investments in unconsolidated affiliates |
|
|
3 |
|
|
|
(3 |
) |
|
|
(1 |
) |
|
|
(6 |
) |
|
|
|
|
|
|
|
|
|
|
|
|
|
|
|
|
|
|
|
Operating income |
|
|
49 |
|
|
|
85 |
|
|
|
113 |
|
|
|
137 |
|
|
|
|
|
|
|
|
|
|
|
|
|
|
|
|
|
|
|
|
Other expense: |
|
|
|
|
|
|
|
|
|
|
|
|
|
|
|
|
|
Interest expense, net |
|
|
(72 |
) |
|
|
(22 |
) |
|
|
(83 |
) |
|
|
(39 |
) |
|
Other non-operating expense, net |
|
|
(16 |
) |
|
|
(3 |
) |
|
|
(14 |
) |
|
|
(2 |
) |
|
Total other expense, net |
|
|
(88 |
) |
|
|
(25 |
) |
|
|
(97 |
) |
|
|
(41 |
) |
|
|
|
|
|
|
|
|
- |
|
|
|
|
|
|
|
|
|
|
(Loss) income before provision for income taxes |
|
|
(39 |
) |
|
|
60 |
|
|
|
16 |
|
|
|
96 |
|
|
|
|
|
|
|
|
|
- |
|
|
|
|
|
|
|
|
|
|
Income tax (benefit) expense |
|
|
(84 |
) |
|
|
23 |
|
|
|
(63 |
) |
|
|
34 |
|
|
|
|
|
|
|
|
|
|
|
|
|
|
|
|
|
|
|
|
Non-operating loss from investments in unconsolidated affiliates |
|
|
- |
|
|
|
(1 |
) |
|
|
- |
|
|
|
(2 |
) |
|
|
|
|
|
|
|
|
- |
|
|
|
|
|
|
|
|
|
|
Net income |
|
|
45 |
|
|
|
36 |
|
|
|
79 |
|
|
|
60 |
|
|
|
|
|
|
|
|
|
|
|
|
|
|
|
|
|
|
|
|
Less: Net (loss) income attributable to noncontrolling interests |
|
|
(2 |
) |
|
|
- |
|
|
|
(3 |
) |
|
|
2 |
|
|
|
|
|
|
|
|
|
|
|
|
|
|
|
|
|
|
|
|
Net income attributable to McDermott |
|
$ |
47 |
|
|
$ |
36 |
|
|
$ |
82 |
|
|
$ |
58 |
|
|
|
|
|
|
|
|
|
|
|
|
|
|
|
|
|
|
|
|
Net income per share attributable to McDermott |
|
|
|
|
|
|
|
|
|
|
|
|
|
|
|
|
|
Basic |
|
$ |
0.33 |
|
|
$ |
0.38 |
|
|
$ |
0.68 |
|
|
$ |
0.67 |
|
|
Diluted |
|
$ |
0.33 |
|
|
$ |
0.38 |
|
|
$ |
0.68 |
|
|
$ |
0.62 |
|
|
|
|
|
|
|
|
|
|
|
|
|
|
|
|
|
|
|
|
Shares used in the computation of net income per share: |
|
|
|
|
|
|
|
|
|
|
|
|
|
|
|
|
|
Basic |
|
|
144 |
|
|
|
94 |
|
|
|
120 |
|
|
|
87 |
|
|
Diluted |
|
|
144 |
|
|
|
94 |
|
|
|
120 |
|
|
|
94 |
|
See accompanying Notes to these Condensed Consolidated Financial Statements.
|
|
1 |
|

CONDENSED CONSOLIDATED FINANCIAL STATEMENTS
|
McDERMOTT INTERNATIONAL, INC. |
|
|||||||||||||||
|
CONDENSED CONSOLIDATED STATEMENTS OF COMPREHENSIVE INCOME |
|
|||||||||||||||
|
(Unaudited) |
|
|||||||||||||||
|
|
|
Three Months Ended June 30, |
|
|
Six Months Ended June 30, |
|
||||||||||
|
|
|
2018 |
|
|
2017 |
|
|
2018 |
|
|
2017 |
|
||||
|
|
|
(In millions) |
|
|||||||||||||
|
Net income |
|
$ |
45 |
|
|
$ |
36 |
|
|
$ |
79 |
|
|
$ |
60 |
|
|
Other comprehensive (loss) income, net of tax: |
|
|
|
|
|
|
|
|
|
|
|
|
|
|
|
|
|
(Loss) gain on derivatives |
|
|
(12 |
) |
|
|
9 |
|
|
|
(12 |
) |
|
|
11 |
|
|
Foreign currency translation |
|
|
(11 |
) |
|
|
- |
|
|
|
(12 |
) |
|
|
- |
|
|
Total comprehensive income |
|
|
22 |
|
|
|
45 |
|
|
|
55 |
|
|
|
71 |
|
|
Less: Comprehensive (loss) income attributable to noncontrolling interests |
|
|
(2 |
) |
|
|
- |
|
|
|
(3 |
) |
|
|
2 |
|
|
Comprehensive income attributable to McDermott |
|
$ |
24 |
|
|
$ |
45 |
|
|
$ |
58 |
|
|
$ |
69 |
|
See accompanying Notes to these Condensed Consolidated Financial Statements.
|
|
2 |
|
CONDENSED CONSOLIDATED FINANCIAL STATEMENTS
|
McDERMOTT INTERNATIONAL, INC. |
||||
|
|
|
|
||
|
|
|
June 30, 2018 |
|
December 31, 2017 |
|
|
|
(In millions, except per share amounts) |
||
|
Assets |
|
(Unaudited) |
|
|
|
Current assets: |
|
|
|
|
|
Cash and cash equivalents ($140 and $0 related to variable interest entities ("VIEs")) |
|
$814 |
|
$390 |
|
Restricted cash and cash equivalents |
|
324 |
|
18 |
|
Accounts receivable—trade, net ($29 and $0 related to VIEs) |
|
968 |
|
328 |
|
Accounts receivable—other ($52 and $0 related to VIEs) |
|
130 |
|
42 |
|
Contracts in progress ($213 and $0 related to VIEs) |
|
918 |
|
621 |
|
Project related intangible assets, net |
|
129 |
|
- |
|
Inventory |
|
48 |
|
- |
|
Other current assets ($22 and $0 related to VIEs) |
|
190 |
|
36 |
|
Total current assets |
|
3,521 |
|
1,435 |
|
Property, plant and equipment, net |
|
2,090 |
|
1,666 |
|
Accounts receivable—long-term retainages |
|
61 |
|
39 |
|
Investments in unconsolidated affiliates |
|
423 |
|
8 |
|
Goodwill |
|
3,926 |
|
- |
|
Other intangibles, net |
|
1,039 |
|
- |
|
Deferred income taxes |
|
178 |
|
18 |
|
Other non-current assets |
|
190 |
|
57 |
|
Total assets |
|
$11,428 |
|
$3,223 |
|
|
|
|
|
|
|
Liabilities and Equity |
|
|
|
|
|
Current liabilities: |
|
|
|
|
|
Current maturities of long-term debt |
|
$42 |
|
$24 |
|
Accounts payable ($354 and $0 related to VIEs) |
|
906 |
|
279 |
|
Advance billings on contracts ($66 and $0 related to VIEs) |
|
1,227 |
|
32 |
|
Project related intangible liabilities, net |
|
29 |
|
- |
|
Accrued liabilities ($94 and $0 related to VIEs) |
|
1,442 |
|
337 |
|
Income taxes payable |
|
123 |
|
35 |
|
Total current liabilities |
|
3,769 |
|
707 |
|
Long-term debt |
|
3,418 |
|
513 |
|
Non-current other taxes |
|
96 |
|
63 |
|
Other non-current liabilities |
|
579 |
|
151 |
|
Total liabilities |
|
7,862 |
|
1,434 |
|
Commitments and contingencies |
|
|
|
|
|
Stockholders' equity: |
|
|
|
|
|
Common stock, par value $1.00 per share, authorized 255 shares; |
|
|
|
|
|
issued 183 and 98 shares, respectively |
|
183 |
|
98 |
|
Capital in excess of par value |
3,480 |
|
1,858 |
|
|
Retained earnings/ (accumulated deficit) |
|
54 |
|
(48) |
|
Accumulated other comprehensive loss |
|
(75) |
|
(51) |
|
Treasury stock, at cost: 3 and 3 shares, respectively |
|
(96) |
|
(96) |
|
Total McDermott Stockholders' Equity |
|
3,546 |
|
1,761 |
|
Noncontrolling interest |
|
20 |
|
28 |
|
Total stockholders' equity |
|
3,566 |
|
1,789 |
|
Total liabilities and stockholders' equity |
|
$11,428 |
|
$3,223 |
See accompanying Notes to these Condensed Consolidated Financial Statements.
|
|
3 |
|
CONDENSED CONSOLIDATED FINANCIAL STATEMENTS
|
McDERMOTT INTERNATIONAL, INC. |
|
|||||||
|
CONDENSED CONSOLIDATED STATEMENTS OF CASH FLOWS |
|
|||||||
|
(Unaudited) |
|
|||||||
|
|
|
Six Months Ended June 30, |
|
|||||
|
|
|
2018 |
|
|
2017 |
|
||
|
|
|
(In millions) |
|
|||||
|
Cash flows from operating activities: |
|
|
|
|
|
|
|
|
|
Net income |
|
$ |
79 |
|
|
$ |
60 |
|
|
Non-cash items included in net income: |
|
|
|
|
|
|
|
|
|
Depreciation and intangible amortization |
|
|
80 |
|
|
|
50 |
|
|
Debt issuance cost amortization |
|
|
17 |
|
|
|
10 |
|
|
Stock-based compensation charges |
|
|
28 |
|
|
|
12 |
|
|
Deferred taxes |
|
|
(100 |
) |
|
|
4 |
|
|
Other non-cash items |
|
|
- |
|
|
|
(2 |
) |
|
Changes in operating assets and liabilities, net of effects of businesses acquired: |
|
|
|
|
|
|
|
|
|
Accounts receivable |
|
|
278 |
|
|
|
37 |
|
|
Contracts in progress, net of Advance billings on contracts |
|
|
(141 |
) |
|
|
(411 |
) |
|
Inventory |
|
|
14 |
|
|
|
- |
|
|
Accounts payable |
|
|
129 |
|
|
|
260 |
|
|
Other current and non-current assets |
|
|
(2 |
) |
|
|
(13 |
) |
|
Investments in unconsolidated affiliates |
|
|
1 |
|
|
|
8 |
|
|
Other current and non-current liabilities |
|
|
52 |
|
|
|
76 |
|
|
Total cash provided by operating activities |
|
|
435 |
|
|
|
91 |
|
|
|
|
|
|
|
|
|
|
|
|
Cash flows from investing activities: |
|
|
|
|
|
|
|
|
|
CB&I combination consideration, net of cash of $498 acquired |
|
|
(2,374 |
) |
|
|
- |
|
|
Purchases of property, plant and equipment |
|
|
(43 |
) |
|
|
(81 |
) |
|
Advances with third party participants of proportionately consolidated consortiums, net |
|
|
(45 |
) |
|
|
- |
|
|
Proceeds from asset dispositions |
|
|
2 |
|
|
|
55 |
|
|
Investments in unconsolidated affiliates |
|
|
(3 |
) |
|
|
(1 |
) |
|
Other |
|
|
2 |
|
|
|
- |
|
|
Total cash used in investing activities |
|
|
(2,461 |
) |
|
|
(27 |
) |
|
|
|
|
|
|
|
|
|
|
|
Cash flows from financing activities: |
|
|
|
|
|
|
|
|
|
Proceeds from issuance of long-term debt |
|
|
3,560 |
|
|
|
- |
|
|
Repayment of debt |
|
|
(515 |
) |
|
|
(230 |
) |
|
Advances with joint ventures, proportionately consolidated consortiums and third party participants |
|
|
(42 |
) |
|
|
- |
|
|
Debt and letter of credit issuance costs |
|
|
(208 |
) |
|
|
(19 |
) |
|
Debt extinguishment costs |
|
|
(10 |
) |
|
|
- |
|
|
Acquisition of NCI |
|
|
- |
|
|
|
(11 |
) |
|
Repurchase of common stock |
|
|
(14 |
) |
|
|
(7 |
) |
|
Total cash provided by (used in) financing activities |
|
|
2,771 |
|
|
|
(267 |
) |
|
|
|
|
|
|
|
|
|
|
|
Effects of exchange rate changes on cash, cash equivalents and restricted cash |
|
|
(15 |
) |
|
|
- |
|
|
Net increase (decrease) in cash, cash equivalents and restricted cash |
|
|
730 |
|
|
|
(203 |
) |
|
Cash, cash equivalents and restricted cash at beginning of period |
|
|
408 |
|
|
|
612 |
|
|
Cash, cash equivalents and restricted cash at end of period |
|
$ |
1,138 |
|
|
$ |
409 |
|
See accompanying Notes to these Condensed Consolidated Financial Statements.
|
|
4 |
|
CONDENSED CONSOLIDATED FINANCIAL STATEMENTS
|
McDERMOTT INTERNATIONAL, INC. |
|
|||||||||||||||||||||||||||||||
|
CONDENSED CONSOLIDATED STATEMENTS OF EQUITY |
|
|||||||||||||||||||||||||||||||
|
(Unaudited) |
|
|||||||||||||||||||||||||||||||
|
|
|
Common Stock Par Value |
|
|
Capital in Excess of Par Value |
|
|
Retained Earnings/ (Accumulated Deficit) |
|
|
Accumulated Other Comprehensive Loss ("AOCI") |
|
|
Treasury Stock |
|
|
Stockholders' Equity |
|
|
Noncontrolling Interest ("NCI") |
|
|
Total Equity |
|
||||||||
|
|
(In millions) |
|
||||||||||||||||||||||||||||||
|
Balance at December 31, 2017 |
|
$ |
98 |
|
|
$ |
1,858 |
|
|
$ |
(48 |
) |
|
$ |
(51 |
) |
|
$ |
(96 |
) |
|
$ |
1,761 |
|
|
$ |
28 |
|
|
$ |
1,789 |
|
|
Adoption of ASC 606 |
|
|
- |
|
|
|
- |
|
|
|
20 |
|
|
|
- |
|
|
|
- |
|
|
|
20 |
|
|
|
- |
|
|
|
20 |
|
|
Balance at January 1, 2018 |
|
|
98 |
|
|
|
1,858 |
|
|
|
(28 |
) |
|
|
(51 |
) |
|
|
(96 |
) |
|
|
1,781 |
|
|
|
28 |
|
|
|
1,809 |
|
|
Net income |
|
|
- |
|
|
|
- |
|
|
|
82 |
|
|
|
- |
|
|
|
- |
|
|
|
82 |
|
|
|
(3 |
) |
|
|
79 |
|
|
CB&I combination |
|
|
85 |
|
|
|
1,608 |
|
|
|
- |
|
|
|
- |
|
|
|
- |
|
|
|
1,693 |
|
|
|
(5 |
) |
|
|
1,688 |
|
|
Other comprehensive loss, net of tax |
|
|
- |
|
|
|
- |
|
|
|
- |
|
|
|
(24 |
) |
|
|
- |
|
|
|
(24 |
) |
|
|
- |
|
|
|
(24 |
) |
|
Common stock issued |
|
|
1 |
|
|
|
(1 |
) |
|
|
- |
|
|
|
- |
|
|
|
- |
|
|
|
- |
|
|
|
- |
|
|
|
- |
|
|
Stock-based compensation charges |
|
|
- |
|
|
|
28 |
|
|
|
- |
|
|
|
- |
|
|
|
- |
|
|
|
28 |
|
|
|
- |
|
|
|
28 |
|
|
Purchase of treasury shares |
|
|
- |
|
|
|
- |
|
|
|
- |
|
|
|
- |
|
|
|
(14 |
) |
|
|
(14 |
) |
|
|
- |
|
|
|
(14 |
) |
|
Retirement of common stock |
|
|
(1 |
) |
|
|
(13 |
) |
|
|
- |
|
|
|
- |
|
|
|
14 |
|
|
|
- |
|
|
|
- |
|
|
|
- |
|
|
Balance at June 30, 2018 |
|
$ |
183 |
|
|
$ |
3,480 |
|
|
$ |
54 |
|
|
$ |
(75 |
) |
|
$ |
(96 |
) |
|
$ |
3,546 |
|
|
$ |
20 |
|
|
$ |
3,566 |
|
See accompanying Notes to these Condensed Consolidated Financial Statements.
|
|
5 |
|
NOTES TO THE CONDENSED CONSOLIDATED FINANCIAL STATEMENTS (UNAUDITED)
|
|
|
|
|
|
|
PAGE |
|
|
7 |
|
|
Note 2—Basis of Presentation and Significant Accounting Policies |
|
7 |
|
|
14 |
|
|
|
18 |
|
|
|
20 |
|
|
|
21 |
|
|
|
21 |
|
|
Note 8—Contracts in Progress and Advance Billings on Contracts |
|
22 |
|
|
22 |
|
|
|
23 |
|
|
|
25 |
|
|
|
26 |
|
|
|
31 |
|
|
|
32 |
|
|
|
32 |
|
|
|
33 |
|
|
|
34 |
|
|
|
35 |
|
|
|
36 |
|
|
|
37 |
|
|
|
40 |
|
|
|
42 |
|
|
6 |
|
NOTES TO THE CONDENSED CONSOLIDATED FINANCIAL STATEMENTS (UNAUDITED)
NOTE 1—NATURE OF OPERATIONS AND ORGANIZATION
Nature of Operations
McDermott International, Inc. (“McDermott,” “MDR,” “we,” “our,” “us” or the “Company”), a corporation incorporated under the laws of the Republic of Panama in 1959, is a fully-integrated provider of engineering, procurement, construction and installation (“EPCI”) and technology solutions to the energy industry. On May 10, 2018, we completed our combination with Chicago Bridge & Iron Company N.V. (“CB&I”) through a series of transactions (the “Combination”) (see Note 3, Business Combination, for further discussion). We design and build end-to-end infrastructure and technology solutions, from the wellhead to the storage tank, to transport and transform oil and gas into a variety of products. Our proprietary technologies, integrated expertise and comprehensive solutions are utilized for offshore, subsea, power, liquefied natural gas (“LNG”) and downstream energy projects around the world. Our customers include national, major integrated and other oil and gas companies as well as producers of petrochemicals and electric power, and we operate in most major energy producing regions throughout the world. We execute our contracts through a variety of methods, principally fixed-price, but also including cost reimbursable, cost-plus, day-rate and unit-rate basis or some combination of those methods.
Organization
Our business is organized into five operating groups, which represent our reportable segments consisting of: North, Central and South America (“NCSA”); Europe, Africa, Russia and Caspian (“EARC”); the Middle East and North Africa (“MENA”); Asia Pacific (“APAC”); and Technology. See Note 21, Segment Reporting, for further discussion.
NOTE 2—BASIS OF PRESENTATION AND SIGNIFICANT ACCOUNTING POLICIES
Basis of Accounting and Consolidation
The accompanying Condensed Consolidated Financial Statements (the “Financial Statements”) are unaudited and have been prepared from our books and records in accordance with Rule 10-1 of Regulation S-X for interim financial information. Accordingly, they do not include all of the information and notes required by accounting principles generally accepted in the United States (“U.S. GAAP”) for complete financial statements and are not necessarily indicative of results of operations for a full year. Therefore, they should be read in conjunction with the Financial Statements and Notes thereto included in our Current Report on Form 8-K filed with the SEC on July 31, 2018 (the “July 31 Form 8-K”).
These Financial Statements reflect all wholly owned subsidiaries and those entities which we are required to consolidate. See the “Joint Venture and Consortium Arrangements” section of this footnote for further discussion of our consolidation policy for those entities that are not wholly owned. In the opinion of our management, all adjustments, consisting only of normal recurring adjustments, considered necessary for a fair presentation have been included. Intercompany balances and transactions are eliminated in consolidation. Values presented within tables (excluding per share data) are in millions and may not sum due to rounding.
Reclassifications
In the second quarter of 2018, we made certain classification changes, as well as reclassifications to our historical financial statements to align with our current presentation as follows:
|
|
• |
Bidding and Proposal Costs—In conjunction with the Combination, we realigned our commercial personnel within the operating groups for the combined company. As a result of the realignment, beginning in the second quarter of 2018, we included our bid and proposal expenses in Cost of operations in our Condensed Consolidated Statements of Operations (the “Statements of Operations”) to better represent how those costs are managed and controlled. For periods reported prior to the second quarter of 2018, bid and proposal expenses are included in Selling, general and administrative (“SG&A”) expenses. Our Cost of operations for the three months ended June 30, 2018 includes $17 million of bid and proposal expenses. Our SG&A expense for the six months ended June 30, 2018 includes bid and proposal expenses of $10 million incurred in the first quarter of 2018, and the three and six months ended June 30, 2017 includes bid and proposal expenses of $9 million and $16 million, respectively. |
|
|
7 |
|
NOTES TO THE CONDENSED CONSOLIDATED FINANCIAL STATEMENTS (UNAUDITED)
|
|
• |
Reverse Common Stock Split—We amended our Amended and Restated Articles of Incorporation to effect a three-to-one reverse stock split of McDermott common stock, effective May 9, 2018. Common stock, capital in excess of par, share and per share (except par value per share, which was not affected) information for all periods presented has been recast in the Financial Statements and the accompanying Notes to reflect the reverse stock split. |
|
|
• |
Pension and Postretirement Benefit Costs—In conjunction with our adoption of Accounting Standards Update (“ASU”) 2017-07, we reclassified non-service costs relating to our pension and postretirement plans from SG&A to Other non-operating income (expense) for all historical periods presented. The reclassification did not result in a material impact. |
|
|
• |
Restructuring and Integration/Transaction Costs—Approximately $11 million of restructuring and integration costs and $3 million of transaction costs related to the Combination, which were previously recorded within Other operating (income) expenses, net during the three months ended March 31, 2018, were reclassified to (i) Restructuring and integration costs and (ii) Transaction costs, respectively, in our Statements of Operations for the six months ended June 30, 2018. |
Use of Estimates and Judgments
The preparation of financial statements in conformity with U.S. GAAP requires us to make estimates and judgments that affect the reported amounts of assets, liabilities, revenue and expenses and related disclosures of contingent assets and liabilities. We believe the most significant estimates and judgments are associated with: (i) revenue recognition for our contracts, including estimating costs to complete each contract and the recognition of incentive fees and unapproved change orders and claims; (ii) determination of fair value with respect to acquired assets and liabilities; (iii) fair value and recoverability assessments that must be periodically performed with respect to long-lived tangible assets, goodwill and other intangible assets; (iv) valuation of deferred tax assets and financial instruments; (v) the determination of liabilities related to self-insurance programs and income taxes; and (vi) consolidation determinations with respect to our joint venture and consortium arrangements. If the underlying estimates and assumptions upon which the Financial Statements are based change in the future, actual amounts may differ from those included in the Financial Statements.
Significant Accounting Policies
Revenue Recognition—Our revenue is primarily derived from long-term contracts with customers, and we determine the appropriate accounting treatment for each contract at inception in accordance with ASU 2014-09 (Accounting Standards Codification (“ASC”) Topic 606), Revenue from Contracts with Customers. Our contracts primarily relate to: EPCI services; engineering services; construction services; pipe and steel fabrication services; engineered and manufactured products; technology licensing; and catalyst supply. An EPCI contract may also include technology licensing, and our services may be provided between or among our reportable segments.
|
|
8 |
|
NOTES TO THE CONDENSED CONSOLIDATED FINANCIAL STATEMENTS (UNAUDITED)
|
|
predictability regarding the timing of revenue recognition. A contract may include technology licensing services, which may be provided between our reportable segments. |
|
|
• |
Performance Obligations—A performance obligation is a promise in a contract to transfer a distinct good or service to a customer and is the unit of account in ASC Topic 606. The transaction price of a contract is allocated to each distinct performance obligation and recognized as revenue when, or as, the performance obligation is satisfied. Our contract costs and related revenues are generally recognized over time as work progresses due to continuous transfer to the customer. To the extent a contract is deemed to have multiple performance obligations, we allocate the transaction price of the contract to each performance obligation using our best estimate of the standalone selling price of each distinct good or service in the contract. In addition, certain contracts may be combined and deemed to be a single performance obligation. Our EPCI contracts are generally deemed to be single performance obligations and our contracts with multiple performance obligations were not material as of June 30, 2018. |
|
|
• |
Performance Obligations Satisfied Over Time—Revenues for our contracts that satisfy the criteria for over time recognition are recognized as the work progresses. Revenues for contracts recognized over time include revenues for contracts to provide: EPCI services; engineering services; construction services; pipe and steel fabrication services; engineered and manufactured products; technology licensing; and “non-generic” catalyst supply. We measure transfer of control utilizing an input method to measure progress of the performance obligation based upon the cost-to-cost measure of progress, with Cost of operations including direct costs, such as materials and labor, and indirect costs that are attributable to contract activity. Under the cost-to-cost approach, the use of estimated costs to complete each performance obligation is a significant variable in the process of determining recognized revenues and is a significant factor in the accounting for such performance obligations. Significant estimates impacting the cost to complete each performance obligation are: costs of engineering, materials, components, equipment, labor and subcontracts; vessel costs; labor productivity; schedule durations, including subcontractor or supplier progress; contract disputes, including claims; achievement of contractual performance requirements; and contingency, among others. The cumulative impact of revisions in total cost estimates during the progress of work is reflected in the period in which these changes become known, including, to the extent required, the reversal of profit recognized in prior periods and the recognition of losses expected to be incurred on contracts in progress. Additionally, external factors such as weather, customer requirements and other factors outside of our control, may affect the progress and estimated cost of a project’s completion and, therefore, the timing and amount of recognition of revenues and income. Due to the various estimates inherent in our contract accounting, actual results could differ from those estimates, which could result in material changes to our financial statements and related disclosures. See Note 4, Revenue Recognition, for further discussion. |
|
|
• |
Performance Obligation Satisfied at a Point-in-Time Method—Contracts with performance obligations that do not meet the criteria to be recognized over time are required to be recognized at a point-in-time, whereby revenues and gross profit are recognized only when a performance obligation is complete and a customer has obtained control of a promised asset. Revenues for contracts recognized at a point in time include our “generic” catalyst supply and certain manufactured products (which are recognized upon shipment) and certain non-engineering and non-construction oriented services (which are recognized when the services are performed). In determining when a performance obligation is complete for contracts with revenues recognized at a point-in-time, we measure transfer of control considering physical possession of the asset, legal transfer of title, significant risks and awards rewards of ownership, customer acceptance and our rights to payment. See Note 4, Revenue Recognition, for further discussion. |
|
|
• |
Remaining Performance Obligations (“RPOs”)―RPOs represent the amount of revenues we expect to recognize in the future from our contract commitments on projects. RPOs include the entire expected revenue values for joint ventures we consolidate and our proportionate value for consortiums we proportionately consolidate. We do not include expected revenues of contracts related to unconsolidated joint ventures in our RPOs, except to the extent of any subcontract awards we receive from those joint ventures. Currency risks associated with RPOs that are not mitigated within the contracts are generally mitigated with the use of foreign currency derivative (hedging) instruments, when deemed significant. However, these actions may not eliminate all currency risk exposure included within our long-term contracts. RPOs may not be indicative of future operating results, and projects included in RPOs may be cancelled, modified or otherwise altered by customers. See Note 4, Revenue Recognition, for further discussion. |
|
|
9 |
|
NOTES TO THE CONDENSED CONSOLIDATED FINANCIAL STATEMENTS (UNAUDITED)
|
|
modification of the existing contract and performance obligation. We estimate variable consideration for a performance obligation at the most likely amount to which we expect to be entitled (or the most likely amount we expect to incur in the case of liquidated damages), utilizing estimation methods that best predict the amount of consideration to which we will be entitled (or will be incurred in the case of liquidated damages). We include variable consideration in the estimated transaction price to the extent it is probable that a significant reversal of cumulative revenues recognized will not occur or when the uncertainty associated with the variable consideration is resolved. Our estimates of variable consideration and determinations of whether to include estimated amounts in transaction prices are based largely on assessments of our anticipated performance and all information (historical, current and forecasted) reasonably available to us. The effect of variable consideration on the transaction price of a performance obligation is recognized as an adjustment to revenues on a cumulative catch-up basis. To the extent unapproved change orders and claims reflected in transaction price (or excluded from transaction price in the case of liquidated damages) are not resolved in our favor, or to the extent incentives reflected in transaction price are not earned, there could be reductions in, or reversals of, previously recognized revenue. See Note 4, Revenue Recognition, for further discussion. |
|
|
• |
Loss Recognition―A risk associated with our contracts is that revenues from customers may not cover increases in our costs. It is possible that current estimates could materially change for various reasons. For all contracts, if a current estimate of total contract cost indicates a loss, the projected loss is recognized in full immediately and reflected in Cost of operations in the Statements of Operations. It is possible that these estimates could change due to unforeseen events, which could result in adjustments to overall contract revenues and costs. Variations from estimated contract performance could result in material adjustments to operating results for any fiscal quarter or year. In our Condensed Consolidated Balance Sheets (“Balance Sheets”), the provisions for estimated losses on all active uncompleted projects are included in Advance billings on contracts. See Note 4, Revenue Recognition, for further discussion. |
|
|
• |
Accounts Receivable and Contract Balances―The timing of when we bill our customers is generally dependent upon advance billing terms, milestone billings based on the completion of certain phases of the work, or when the services are provided or products are shipped. |
|
|
• |
Accounts Receivable―Any uncollected billed amounts for our performance obligations recognized over time, including contract retainages to be collected within one year, are recorded within Accounts receivable-trade, net. Any uncollected billed amounts and unbilled receivables for our performance obligations recognized at a point in time are also recorded within Accounts receivable-trade, net. Contract retainages to be collected beyond one year are recorded within Accounts receivable-long-term retainages. We establish allowances for doubtful accounts based on our assessments of collectability. See Note 7, Accounts Receivable, for further discussion. |
|
|
• |
Contracts in Progress—Projects with performance obligations recognized over time that have revenues recognized to date in excess of cumulative billings are reported within Contracts in progress on our Balance Sheets. We expect to invoice customers for all unbilled revenues, and our payment terms are generally for less than 12 months upon billing. Our contracts typically do not include a significant financing component. See Note 8, Contracts in Progress and Advances Billings on Contracts, for further discussion. |
|
|
• |
Advance Billings on Contracts—Projects with performance obligations recognized over time that have cumulative billings in excess of revenues are reported within Advance billings on contracts on our Balance Sheets. Our Advance billings on contracts balance also includes our provisions for estimated losses on all active projects. See Note 8, Contracts in Progress and Advances Billings on Contracts for further discussion. |
Bidding and Proposal Costs―Bidding and proposal costs are generally charged to Cost of operations as incurred, but in certain cases their recognition may be deferred if specific probability criteria are met. We had no significant deferred bidding and proposal costs at June 30, 2018.
Goodwill—Goodwill represents the excess of the purchase price over the fair value of net assets acquired in connection with the Combination. Goodwill is not amortized, but instead is reviewed for impairment at least annually at a reporting unit level, absent any indicators of impairment. We will perform our annual impairment assessment during the fourth quarter of each year based on balances as of October 1. We identify a potential impairment by comparing the fair value of the applicable reporting unit to its net book value, including goodwill. If the net book value exceeds the fair value of the reporting unit, we measure the impairment by comparing the carrying value of the reporting unit to its fair value.
To determine the fair value of our reporting units and test for impairment, we utilize an income approach (discounted cash flow method) as we believe this is the most direct approach to incorporate the specific economic attributes and risk profiles of our reporting units into our valuation model. We generally do not utilize a market approach, given the lack of relevant information generated by market transactions involving comparable businesses. However, to the extent market indicators of fair value become available, we
|
|
10 |
|
NOTES TO THE CONDENSED CONSOLIDATED FINANCIAL STATEMENTS (UNAUDITED)
consider such market indicators in our discounted cash flow analysis and determination of fair value. See Note 3, Business Combination, for further discussion.
Intangible and Other Long-Lived Assets—Our finite-lived intangible assets resulted from the Combination and are amortized over their estimated remaining useful economic lives. Our project-related intangible assets are amortized as the applicable projects progress, customer relationships are amortized utilizing an accelerated method based on the pattern of cash flows expected to be realized, taking into consideration expected revenues and customer attrition, and our other intangibles are amortized utilizing a straight-line method. We review tangible assets and finite-lived intangible assets for impairment whenever events or changes in circumstances indicate the carrying value of the asset may not be recoverable. If a recoverability assessment is required, the estimated future cash flow associated with the asset or asset group will be compared to their respective carrying amounts to determine if an impairment exists. See Note 3, Business Combination, and Note 9, Intangible Assets, for further discussion.
Income Taxes—Deferred tax assets and liabilities are recognized for the future tax consequences attributable to differences between the financial statement carrying amounts of existing assets and liabilities and their respective tax bases using currently enacted income tax rates for the years in which the differences are expected to reverse. We provide for income taxes based on the tax laws and rates in the countries in which we conduct our operations. McDermott International, Inc. is a Panamanian corporation that earns all of its income outside of Panama. As a result, we are not subject to income tax in Panama. We operate in numerous taxing jurisdictions around the world. Each of these jurisdictions has a regime of taxation that varies, not only with respect to statutory rates, but also with respect to the basis on which these rates are applied. These variations, along with changes in our mix of income or loss from these jurisdictions, may contribute to shifts, sometimes significant, in our effective tax rate.
A valuation allowance (“VA”) is provided to offset any net deferred tax assets (“DTAs”) if, based on the available evidence, it is more likely than not that some or all of the DTAs will not be realized. The realization of our net DTAs depends upon our ability to generate sufficient future taxable income of the appropriate character and in the appropriate jurisdictions.
On a periodic and ongoing basis, we evaluate our DTAs (including our net operating loss (“NOL”) DTAs) and assess the appropriateness of our VAs. In assessing the need for a VA, we consider both positive and negative evidence related to the likelihood of realization of the DTAs. If, based on the weight of available evidence, our assessment indicates it is more likely than not a DTA will not be realized, we record a VA. Our assessments include, among other things, the amount of taxable temporary differences which will result in future taxable income, the value and quality of our RPOs, evaluations of existing and anticipated market conditions, analysis of recent and historical operating results (including cumulative losses over multiple periods) and projections of future results, strategic plans and alternatives for associated operations, as well as asset expiration dates, where applicable. At June 30, 2018 and December 31, 2017, we had VAs against certain U.S. and non-U.S. DTAs, as we do not believe it is more likely than not that we will utilize those DTAs. See the July 31 Form 8-K for further discussion of our VA assessments.
If the factors upon which we based our assessment of realizability of our DTAs differ materially from our expectations, including future operating results being lower than our current estimates, our future assessments could be impacted and result in an increase in VAs and increase in tax expense.
Income tax and associated interest and penalty reserves, where applicable, are recorded in those instances where we consider it more likely than not that additional tax will be due in excess of amounts reflected in income tax returns filed worldwide, irrespective of whether we have received tax assessments. We continually review our exposure to additional income tax obligations and, as further information becomes known or events occur, changes in our tax, interest and penalty reserves may be recorded within income tax expense. See Note 17, Income Taxes, for further discussion.
Foreign Currency—The nature of our business activities involves the management of various financial and market risks, including those related to changes in foreign currency exchange rates. The effects of translating financial statements of foreign operations into our reporting currency are recognized as a cumulative translation adjustment in accumulated other comprehensive income (loss) (“AOCI”), which is net of tax, where applicable.
Derivative Financial Instruments—We utilize derivative financial instruments in certain circumstances to mitigate the effects of changes in foreign currency exchange rates and interest rates, as described below.
|
|
11 |
|
NOTES TO THE CONDENSED CONSOLIDATED FINANCIAL STATEMENTS (UNAUDITED)
|
|
generally seek hedge accounting treatment for contracts used to hedge operating exposures and designate them as cash flow hedges. Therefore, gains and losses, exclusive of credit risk and forward points (which represent the time value component of the fair value of our derivative positions), are included in AOCI until the associated underlying operating exposure impacts our earnings. Changes in the fair value of (i) credit risk and forward points, (ii) instruments deemed ineffective during the period, and (iii) instruments that we do not designate as cash flow hedges are recognized within Other non-operating income (expense). |
|
|
• |
Interest Rate Derivatives—Our interest rate derivatives are limited to a swap arrangement entered into on May 8, 2018, to hedge against interest rate variability associated with $1.94 billion of our $2.26 billion “Term Facility” described in Note 12, Debt. The swap arrangement has been designated as a cash flow hedge as its critical terms matched those of the Term Facility at inception and through June 30, 2018. Accordingly, changes in the fair value of the swap arrangement are included in AOCI until the associated underlying exposure impacts our interest expense. |
See Note 15, Fair Value Measurements, and Note 16, Derivative Financial Instruments, for further discussion.
Joint Venture and Consortium Arrangements—In the ordinary course of business, we execute specific projects and conduct certain operations through joint venture, consortium and other collaborative arrangements (referred to as “joint ventures” and “consortiums”). We have various ownership interests in these joint ventures and consortiums, with such ownership typically proportionate to our decision making and distribution rights. The joint ventures and consortiums generally contract directly with their third-party customers; however, services may be performed directly by the joint ventures and consortium, us, our co-venturers, or a combination thereof.
Joint ventures and consortium net assets consist primarily of working capital and property and equipment, and assets may be restricted from use for obligations outside of the joint venture or consortiums. These joint ventures and consortiums typically have limited third-party debt or have debt that is non-recourse in nature. They may provide for capital calls to fund operations or require participants in the joint venture or consortiums to provide additional financial support, including advance payment or retention letters of credit.
Each joint venture or consortium is assessed at inception and on an ongoing basis as to whether it qualifies as a Variable Interest Entity (“VIE”) under the consolidations guidance in ASC Topic 810, Consolidations. A venture generally qualifies as a VIE when it (i) meets the definition of a legal entity, (ii) absorbs the operational risk of the projects being executed, creating a variable interest, and (iii) lacks sufficient capital investment from the co-venturers, potentially resulting in the joint venture or consortium requiring additional subordinated financial support to finance its future activities.
If at any time a joint venture or consortium qualifies as a VIE, we perform a qualitative assessment to determine whether we are the primary beneficiary of the VIE and therefore need to consolidate the VIE. We are the primary beneficiary if we have (i) the power to direct the economically significant activities of the VIE and (ii) the right to receive benefits from and obligation to absorb losses of the VIE. If the joint venture or consortium is a VIE and we are the primary beneficiary, or we otherwise have the ability to control the joint venture or consortium, it is consolidated. If we determine we are not the primary beneficiary of the VIE or only have the ability to significantly influence, rather than control the joint venture or consortium, it is not consolidated.
We account for unconsolidated joint ventures and consortiums using either (i) proportionate consolidation for both the Balance Sheet and Statement of Operations when we meet the applicable accounting criteria to do so, or (ii) utilize the equity method. For incorporated unconsolidated joint ventures and consortiums under the equity method, we record our share of the profit or loss of the investments, net of income taxes, in the Statements of Operations. We evaluate our equity method investments for impairment when events or changes in circumstances indicate the carrying value of such investments may have experienced an other-than-temporary decline in value. When evidence of loss in value has occurred, we compare the estimated fair value of our investment to the carrying value of our investment to determine whether an impairment has occurred. If the estimated fair value is less than the carrying value and we consider the decline in value to be other-than-temporary, the excess of the carrying value over the estimated fair value is recognized in the Financial Statements as an impairment. See Note 10, Joint Venture and Consortium Arrangements, for further discussion.
Transaction Costs—Transaction costs primarily related to professional service fees (including audit, legal and advisory services) associated with the Combination. See Note 3, Business Combination, for further discussion.
Restructuring and Integration Costs—Restructuring and integration costs primarily relate to costs to achieve our combination profitability initiative (“CPI”). See Note 11, Restructuring and Integration Costs, for further discussion.
|
|
12 |
|
NOTES TO THE CONDENSED CONSOLIDATED FINANCIAL STATEMENTS (UNAUDITED)
See Note 2, Basis of Presentation and Significant Accounting Policies, included in the July 31 Form 8-K, for additional information relating to our accounting policies.
Recently Adopted Accounting Guidance
Revenue from Contracts with Customers (ASC Topic 606)—In May 2014, the Financial Accounting Standards Board (the “FASB”) issued a new standard related to revenue recognition which supersedes most of the existing revenue recognition requirements in U.S. GAAP and requires entities to recognize revenue at an amount that reflects the consideration to which an entity expects to be entitled in exchange for transferring goods or services to a customer. It also requires significantly expanded disclosures regarding the qualitative and quantitative information of an entity’s nature, amount, timing and uncertainty of revenue and cash flows arising from contracts with customers.
The FASB has issued several amendments to the standard, including clarification on accounting for licenses of intellectual property, identifying performance obligations, reporting gross versus net revenue and narrow-scope revisions and practical expedients.
We adopted the new standard on January 1, 2018 (the “initial application” date):
|
|
• |
using the modified retrospective application, with no restatement of the comparative periods presented and a cumulative effect adjustment to retained earnings as of the date of adoption; |
|
|
• |
applying the new standard only to those contracts that are not substantially complete at the date of initial application; and |
|
|
• |
disclosing the impact of the new standard in our 2018 Financial Statements. |
Significant changes to our accounting policies as a result of adopting of the new standard are discussed below:
|
|
• |
We measure transfer of control utilizing an input method to measure progress for individual contracts or combinations of contracts based on the total costs incurred as applicable to each contract. Previously, under ASC Topic 605-35, Construction-Type and Production-Type Contracts, we generally excluded certain costs from the cost-to-cost method of measuring progress toward completion, such as significant costs for procured materials and third-party subcontractors. |
|
|
• |
Our Balance Sheets no longer reflect assets related to cost incurred in excess of cost recognized due to the inclusion of all costs incurred in our results and associated measurement of progress toward completion under our current policy. |
|
|
• |
Variable consideration, including change orders, claims, bonus, incentive fees and liquidated damages or penalties are now included in the estimated contract revenue at the most likely amount to which we expect to be entitled. We include variable consideration in the estimated transaction price to the extent we conclude that it is probable a significant revenue reversal will not occur or when the uncertainty associated with the variable consideration is resolved. |
For accounting policies and disclosures related to our adoption of ASC 606, see our significant accounting policies within this note, Note 4, Revenue Recognition, and Note 8, Contracts in Progress and Advance Billing on Contracts.
Pension and Postretirement Benefits—In March 2017, the FASB issued ASU 2017-07, Compensation—Retirement Benefits (Topic 715): Improving the Presentation of Net Periodic Pension Cost and Net Periodic Postretirement Benefit. This ASU requires bifurcation of certain components of net pension and postretirement benefit cost in the Statements of Operations. We adopted this ASU effective as of January 1, 2018. As a result, benefit costs, excluding any service cost component, previously included in SG&A, are now included in other non-operating income (expense), net in our Statements of Operations. All comparable periods presented have been retrospectively revised to reflect this change.
Income Taxes—In October 2016, the FASB issued ASU 2016-16, Income Taxes (Topic 740): Intra-Entity Transfers of Assets Other Than Inventory. This ASU requires entities to recognize the income tax consequences of an intra-entity transfer of an asset other than inventory when the transfer occurs. This ASU is effective for interim and annual periods beginning after December 15, 2017. The adoption of ASU 2016-16 during the first quarter 2018 did not have a material impact on the Financial Statements. During the three months ended June 30, 2018, we had an income tax benefit of $117 million resulting from an intra-entity transfer of assets. See Note 17, Income Taxes, for further discussion.
|
|
13 |
|
NOTES TO THE CONDENSED CONSOLIDATED FINANCIAL STATEMENTS (UNAUDITED)
In December 2017, the SEC issued Staff Accounting Bulletin (“SAB”) 118 to address the application of U.S. GAAP in situations in which a registrant does not have the necessary information available, prepared or analyzed (including computations) in reasonable detail to complete the accounting for certain income tax effects of the U.S. Tax Cuts and Jobs Act (the “Tax Reform Act”), signed into law on December 22, 2017. In March 2018, the FASB issued ASU 2018-05, which amended ASC 740 to incorporate the requirements of SAB 118. We recognized the provisional tax impacts of the Tax Reform Act in the fourth quarter of 2017. During the six months ended June 30, 2018, we did not receive any additional information regarding these provisional calculations. As a result, we continue to anticipate finalizing our analysis in connection with the completion of our tax return for 2017 to be filed in 2018.
Goodwill—In January 2017, the FASB issued ASU 2017-04, Intangibles-Goodwill and Other (Topic 350): Simplifying the Test for Goodwill Impairment. This ASU eliminates the second step of the goodwill impairment test that required a hypothetical purchase price allocation. The ASU requires that, if a reporting unit’s carrying value exceeds its fair value, an impairment charge would be recognized for the excess amount, not to exceed the carrying amount of goodwill. We early adopted this ASU during the second quarter 2018. Our adoption of the standard did not have a material impact on the Financial Statements.
Accounting Guidance Issued But Not Adopted as of June 30, 2018
Financial Instruments—In June 2016, the FASB issued ASU 2016-13, Financial Instruments—Credit Losses (Topic 326): Measurement of Credit Losses on Financial Instruments. This ASU will require a financial asset measured at amortized cost basis to be presented at the net amount expected to be collected. A valuation account, allowance for credit losses, will be deducted from the amortized cost basis of the financial asset to present the net carrying value at the amount expected to be collected on the financial asset. This ASU is effective for interim and annual periods beginning after December 15, 2019. We are currently assessing the impact of this guidance on our future consolidated financial statements and related disclosures.
Leases—In February 2016, the FASB issued ASU 2016-02, Leases (Topic 842). The ASU will require entities that lease assets—referred to as “lessees”—to recognize on the balance sheet the assets and liabilities for the rights and obligations created by leases with lease terms of more than 12 months. Consistent with current U.S. GAAP, the recognition, measurement and presentation of expenses and cash flows arising from a lease by a lessee primarily will depend on its classification as a finance or operating lease. However, unlike current U.S. GAAP—which requires only capital leases to be recognized on the balance sheet—the new ASU will require both types of leases to be recognized on the balance sheet. This ASU is effective for interim and annual periods beginning after December 15, 2018. Early adoption is permitted. We are currently assessing the impact of this ASU on our future Consolidated Financial Statements and related disclosures.
Income Taxes—In January 2018, the FASB issued ASU 2018-02, Reporting Comprehensive Income (Topic 220). This ASU gives entities the option to reclassify to retained earnings the tax effects resulting from the Tax Reform Act related to items in AOCI that the FASB refers to as having been stranded in AOCI. The standard may be applied retrospectively to each period in the year of adoption. This ASU will also require new disclosures regarding our accounting policy for releasing the tax effects in AOCI. This ASU is effective for us in the first quarter of 2019, although early adoption is permitted. We are assessing the timing of adoption of the new standard and its potential impact on our future Consolidated Financial Statements.
General―On December 18, 2017, we entered into an agreement (as amended, the “Business Combination Agreement”) to combine our business with CB&I, an established downstream provider of industry-leading petrochemical, refining, power, gasification and gas processing technologies and solutions. On May 10, 2018 (the “Combination Date”) we completed the Combination.
Transaction Overview―On the Combination Date, we acquired the equity of certain U.S. and non-U.S. CB&I subsidiaries that owned CB&I’s technology business, as well as certain intellectual property rights, for $2.87 billion in cash consideration that was funded using debt financing, as discussed further in Note 12, Debt, and existing cash. Also on the Combination Date, CB&I shareholders received 0.82407 shares of McDermott common stock for each share of CB&I common stock tendered in the exchange offer. Each remaining share of CB&I common stock held by CB&I shareholders not acquired by McDermott in the exchange offer was effectively converted into the right to receive the same 0.82407 shares of McDermott common stock that was paid in the exchange offer, together with cash in lieu of any fractional shares of McDermott common stock, less any applicable withholding taxes. Stock-settled equity based awards relating to shares of CB&I’s common stock were either canceled and converted into the right to receive cash or were converted into comparable McDermott awards on generally the same terms and conditions as prior to the Combination Date. We
|
|
14 |
|
NOTES TO THE CONDENSED CONSOLIDATED FINANCIAL STATEMENTS (UNAUDITED)
issued 84.5 million shares of McDermott common stock to the former CB&I shareholders and converted CB&I stock-settled equity awards into McDermott stock-settled equity-based awards to be settled in approximately 2.2 million shares of McDermott common stock.
Transaction Accounting―The Combination is accounted for using the acquisition method of accounting in accordance with ASC Topic 805, Business Combinations. McDermott is considered the acquirer for accounting purposes based on the following facts at the Combination Date: (i) McDermott’s stockholders owned approximately 53 percent of the combined business on a fully diluted basis; (ii) a group of McDermott’s directors, including the Chairman of the Board, constituted a majority of the Board of Directors; and (iii) McDermott’s President and Chief Executive Officer and Executive Vice President and Chief Financial Officer continue in those roles. The series of transactions resulting in McDermott’s acquisition of CB&I’s entire business is being accounted for as a single accounting transaction, as such transactions were entered into at the same time in contemplation of one another and were collectively designed to achieve an overall commercial effect.
Purchase Consideration―We completed the Combination for a gross purchase price of approximately $4.6 billion ($4.1 billion net of cash acquired), detailed as follows (in millions, except per share amounts):
|
CB&I shares for Combination consideration |
|
103 |
|
Conversion Ratio: 1 CB&I share = 0.82407 McDermott shares |
|
85 |
|
McDermott stock price on May 10, 2018 |
|
$19.92 |
|
Equity Combination consideration transferred |
|
$1,684 |
|
Fair value of converted awards earned prior to the Combination |
|
9 |
|
Total equity Combination consideration transferred |
|
1,693 |
|
Cash consideration transferred |
|
2,872 |
|
Total Combination consideration transferred |
|
4,565 |
|
Less: Cash acquired |
|
(498) |
|
Total Combination consideration transferred, net of cash acquired |
|
$4,067 |
Preliminary Purchase Price Allocation—The aggregate purchase price noted above was allocated to the major categories of assets and liabilities acquired based upon their estimated fair values at the Combination Date, which were based, in part, upon outside preliminary appraisal and valuation of certain assets, including specifically identified intangible assets and property and equipment. The excess of the purchase price over the preliminary estimated fair value of the net tangible and identifiable intangible assets acquired totaling $3.9 billion, was recorded as goodwill.
|
|
15 |
|
NOTES TO THE CONDENSED CONSOLIDATED FINANCIAL STATEMENTS (UNAUDITED)
The following summarizes our preliminary purchase price allocation at the Combination Date (in millions):
|
|
|
May 10, 2018 |
|
|
|
Net tangible assets: |
|
|
|
|
|
Cash |
|
$ |
498 |
|
|
Accounts receivable |
|
|
905 |
|
|
Inventory |
|
|
62 |
|
|
Contracts in progress |
|
|
341 |
|
|
Assets held for sale (1) |
|
|
66 |
|
|
Other current assets |
|
|
153 |
|
|
Deferred tax assets |
|
|
45 |
|
|
Investments in unconsolidated affiliates |
|
|
403 |
|
|
Property, plant and equipment |
|
|
409 |
|
|
Deferred tax liabilities |
|
|
(17 |
) |
|
Other non-current assets |
|
|
145 |
|
|
Accounts payable |
|
|
(498 |
) |
|
Advance billings on contracts (2) |
|
|
(1,400 |
) |
|
Other current liabilities |
|
|
(1,189 |
) |
|
Other non-current liabilities |
|
|
(445 |
) |
|
Total net tangible assets |
|
|
(522 |
) |
|
Project related intangible assets/liabilities, net (3) |
|
|
112 |
|
|
Other intangible assets (4) |
|
|
1,049 |
|
|
Net identifiable assets |
|
|
639 |
|
|
Goodwill (5) |
|
|
3,926 |
|
|
Total Combination consideration transferred |
|
|
4,565 |
|
|
Less: Cash acquired |
|
|
(498 |
) |
|
Total Combination consideration transferred, net of cash acquired |
|
$ |
4,067 |
|
|
(1) |
Assets held for sale includes CB&I’s former administrative headquarters within Corporate and various fabrication facilities within NCSA. |
|
(2) |
Advance billings on contracts includes provisions for estimated losses on projects of $112 million. |
|
(3) |
Project related intangible assets/liabilities, net includes intangible asset and liabilities of $145 million and $33 million, respectively. The balances represent the fair value of acquired RPOs and normalized profit margin fair value associated with acquired long-term contracts that were deemed to be lower than fair value (excluding amounts recorded in Advance billings on contracts and Contracts in progress) as of the Combination Date. The project related intangible assets and liabilities will be amortized as the applicable projects progress over a range of 2 to 4 years within Project intangibles amortization in our Statements of Operations. |
|
(4) |
Other Intangible assets are reflected in the table below and recorded at estimated fair value, as determined by our management, based on available information which includes a preliminary valuation from outside experts. The estimated useful lives for intangible assets were determined based upon the remaining useful economic lives of the intangible assets that are expected to contribute directly or indirectly to future cash flows. |
|
|
|
|
|
|
|
|
|
|
|
|
|
|
|
|
|
May 10, 2018 Fair value |
|
|
Useful Life Range |
|
|
Weighted Average Life |
|
|||
|
|
|
(In millions) |
|
|
|
|
|
|
|
|
|
|
|
Process technologies |
|
$ |
515 |
|
|
10-30 |
|
|
|
27 |
|
|
|
Trade names |
|
|
420 |
|
|
10-20 |
|
|
|
12 |
|
|
|
Customer relationships |
|
|
87 |
|
|
|
3-10 |
|
|
|
9 |
|
|
Trademarks |
|
|
27 |
|
|
|
10 |
|
|
|
10 |
|
|
Total |
|
$ |
1,049 |
|
|
|
|
|
|
|
|
|
|
|
16 |
|
NOTES TO THE CONDENSED CONSOLIDATED FINANCIAL STATEMENTS (UNAUDITED)
|
recorded in conjunction with the Combination, $1.7 billion is deductible for tax purposes. Given the proximity of the Combination Date to the reporting date of June 30, 2018, the allocation of goodwill for each of our operating groups is in process, and therefore has not been presented. We have not finalized our assessment of the fair values of purchased receivables, intangible assets and liabilities, inventory, property and equipment, joint venture and consortium arrangements, tax balances, contingent liabilities, long-term leases or acquired contracts. The purchase price allocation is based on preliminary information and is subject to change when additional information is obtained. The final purchase price allocation will result in adjustments to various assets and liabilities, including the residual amount allocated to goodwill during the measurement period. |
Impact on RPOs—CB&I RPOs totaled approximately $7.7 billion at the Combination Date. We reviewed the RPOs acquired through the Combination to ensure consistency in the application of our policies regarding revenues dependent upon one or more future events, and we made adjustments related to our purchase accounting estimates. As a result, the RPO balance on the Combination Date included the net reduction of approximately $860 million for the acquired RPOs. This adjustment to the opening RPOs was not the result of contract cancellations.
Impact of Combination on Statements of Operations—From the Combination Date through June 30, 2018, revenues and operating income associated with CB&I totaled $1.1 billion and $61 million (excluding $51 million of Restructuring and integration costs), respectively. Additionally, in connection with the Combination, during the three and six months ended June 30, 2018, we incurred transaction costs of $37 million and $40 million, respectively, which primarily related to professional service fees (including audit, legal and advisory services).
Supplemental Pro Forma Information (Unaudited)—The following unaudited pro forma financial information reflects the Combination and the related events as if they occurred on January 1, 2017, and gives effect to pro forma events that are directly attributable to the Combination, factually supportable, and expected to have a continuing impact on the combined results of the Company, following the Combination. The pro forma financial information includes adjustments to: (i) include additional intangibles amortization and net interest expense associated with the Combination and (ii) exclude restructuring, integration and transaction costs and debt extinguishment costs that were included in McDermott and CB&I’s historical results and are expected to be non-recurring. This pro forma financial information is presented for illustrative purposes only and is not necessarily indicative of the operating results that would have been achieved had the pro forma events taken place on the dates indicated. Further, the pro forma financial information does not purport to project the future operating results of the combined business operations following the Combination.
|
|
|
Three Months Ended June 30, |
|
Six Months Ended June 30, |
||||
|
|
|
2018 (1) |
|
2017 |
|
2018 (1) |
|
2017 |
|
|
|
(In millions) |
||||||
|
Pro forma revenue |
|
$2,492 |
|
$2,072 |
|
$4,845 |
|
$4,419 |
|
Pro forma net income (loss) attributable to McDermott |
|
63 |
|
(315) |
|
112 |
|
(334) |
|
Pro forma net income (loss) per share attributable to McDermott: |
|
|
|
|
|
|
|
|
|
Basic |
|
0.44 |
|
(2.19) |
|
0.78 |
|
(2.32) |
|
Diluted |
|
0.44 |
|
(2.19) |
|
0.78 |
|
(2.32) |
|
|
|
|
|
|
|
|
|
|
|
Basic (2) |
|
144 |
|
144 |
|
144 |
|
144 |
|
Diluted |
|
144 |
|
144 |
|
144 |
|
144 |
|
(1) |
Adjustments, net of tax, included in the pro forma net income above were of a non-recurring nature and totaled $94 million and $109 million for the three and six months ended June 30, 2018, respectively. The adjustments reflect the elimination of restructuring and integration costs ($54 million and $62 million), transaction costs ($29 million and $36 million) and debt extinguishment costs ($11 million and $11 million) that were included in McDermott and CB&I’s historical results for the three and six months ended June 30, 2018, respectively. These pro forma results exclude the effect of adjustments to the opening balance sheet associated with fair value purchase accounting judgments. |
|
(2) |
Pro forma net income (loss) per share was calculated using basic and diluted shares outstanding as of June 30, 2018. |
|
|
17 |
|
NOTES TO THE CONDENSED CONSOLIDATED FINANCIAL STATEMENTS (UNAUDITED)
Effect of ASC Topic 606 Adoption
The cumulative effect of adopting ASC 606 due to our change in method of measuring project progress toward completion, as discussed in Note 2, Basis of Presentation and Significant Accounting Policies, is as follows:
|
|
|
Impact of ASC 606 adoption |
|
|||||||||
|
|
|
Recognition under previous guidance |
|
|
Adjustment |
|
|
Recognition under ASC 606 |
|
|||
|
|
|
(In millions) |
|
|||||||||
|
Consolidated Statement of Operations for six months ended June 30, 2018 |
|
|
|
|
|
|
|
|
|
|
|
|
|
Revenues |
|
$ |
2,550 |
|
|
$ |
(207 |
) |
|
$ |
2,343 |
|
|
Cost of operations |
|
|
2,141 |
|
|
|
(179 |
) |
|
|
1,962 |
|
|
Net income |
|
|
110 |
|
|
|
(28 |
) |
|
|
82 |
|
|
|
|
|
|
|
|
|
|
|
|
|
|
|
|
Consolidated Balance Sheet as of June 30, 2018 |
|
|
|
|
|
|
|
|
|
|
|
|
|
Assets |
|
|
|
|
|
|
|
|
|
|
|
|
|
Current assets: |
|
|
|
|
|
|
|
|
|
|
|
|
|
Contracts in progress |
|
|
926 |
|
|
|
(8 |
) |
|
|
918 |
|
|
|
|
|
|
|
|
|
|
|
|
|
|
|
|
Stockholders' equity (1) |
|
|
|
|
|
|
|
|
|
|
|
|
|
Retained earnings |
|
|
62 |
|
|
|
(8 |
) |
|
|
54 |
|
|
(1) |
Includes $20 million of cumulative catch-up adjustment to Retained earnings (Accumulated deficit) on January 1, 2018, upon adoption of ASC 606. |
Remaining Performance Obligations (“RPOs”)
Our RPOs by segment were as follows:
|
|
June 30, 2018 |
|
|
December 31, 2017 |
|
||||||||||
|
|
(In approximate millions) |
|
|||||||||||||
|
NCSA |
$ |
5,181 |
|
|
|
51 |
% |
|
$ |
437 |
|
|
|
11 |
% |
|
EARC |
|
1,250 |
|
|
|
12 |
% |
|
|
732 |
|
|
|
19 |
% |
|
MENA |
|
2,630 |
|
|
|
26 |
% |
|
|
2,249 |
|
|
|
58 |
% |
|
APAC |
|
638 |
|
|
|
6 |
% |
|
|
483 |
|
|
|
12 |
% |
|
Technology |
|
487 |
|
|
|
5 |
% |
|
|
- |
|
|
|
- |
|
|
Total |
$ |
10,186 |
|
|
|
100 |
% |
|
$ |
3,901 |
|
|
|
100 |
% |
Of the June 30, 2018 RPOs, we expect to recognize revenues as follows:
|
|
2018 |
|
|
2019 |
|
|
Thereafter |
|
|||
|
|
(In approximate millions) |
|
|||||||||
|
Total RPOs |
$ |
4,480 |
|
|
$ |
4,249 |
|
|
$ |
1,457 |
|
|
|
18 |
|
NOTES TO THE CONDENSED CONSOLIDATED FINANCIAL STATEMENTS (UNAUDITED)
Our revenue by product offering, contract types and revenue recognition methodology was as follows:
|
|
|
Three months ended June 30, (2) |
|
|
Six months ended June 30, (2) |
|
||||||||||
|
|
|
2018 |
|
|
2017 |
|
|
2018 |
|
|
2017 |
|
||||
|
|
|
(In millions) |
|
|||||||||||||
|
Revenue by product offering: |
|
|
|
|
|
|
|
|
|
|
|
|
|
|
|
|
|
Offshore and subsea |
|
$ |
653 |
|
|
$ |
789 |
|
|
$ |
1,261 |
|
|
$ |
1,308 |
|
|
LNG |
|
|
382 |
|
|
|
- |
|
|
|
382 |
|
|
|
- |
|
|
Downstream (1) |
|
|
496 |
|
|
|
- |
|
|
|
496 |
|
|
|
- |
|
|
Power |
|
|
204 |
|
|
|
- |
|
|
|
204 |
|
|
|
- |
|
|
|
|
$ |
1,735 |
|
|
$ |
789 |
|
|
$ |
2,343 |
|
|
$ |
1,308 |
|
|
|
|
|
|
|
|
|
|
|
|
|
|
|
|
|
|
|
|
Contract types: |
|
|
|
|
|
|
|
|
|
|
|
|
|
|
|
|
|
Fixed priced |
|
$ |
1,313 |
|
|
$ |
786 |
|
|
$ |
1,896 |
|
|
|
1,262 |
|
|
Reimbursable |
|
|
269 |
|
|
|
- |
|
|
|
269 |
|
|
|
- |
|
|
Hybrid |
|
|
124 |
|
|
|
- |
|
|
|
124 |
|
|
|
- |
|
|
Unit-basis and other |
|
|
29 |
|
|
|
3 |
|
|
|
54 |
|
|
|
46 |
|
|
|
|
$ |
1,735 |
|
|
$ |
789 |
|
|
$ |
2,343 |
|
|
$ |
1,308 |
|
|
|
|
|
|
|
|
|
|
|
|
|
|
|
|
|
|
|
|
Revenue recognition methodology |
|
|
|
|
|
|
|
|
|
|
|
|
|
|
|
|
|
Over time |
|
$ |
1,707 |
|
|
$ |
789 |
|
|
$ |
2,315 |
|
|
$ |
1,308 |
|
|
At a point in time |
|
|
28 |
|
|
|
- |
|
|
|
28 |
|
|
|
- |
|
|
|
|
$ |
1,735 |
|
|
$ |
789 |
|
|
$ |
2,343 |
|
|
$ |
1,308 |
|
|
(1) |
Includes the results of our Technology operating group. |
|
(2) |
Intercompany amounts have been eliminated in consolidation. |
Unapproved Change Orders, Claims and Incentives
Unapproved Change Orders, Claims and Incentives—At June 30, 2018 we had unapproved change orders and claims included in transaction prices aggregating to approximately $472 million, of which approximately $99 million were included in our RPO balance. At December 31, 2017, we had unapproved change orders and claims included in transaction prices aggregating to approximately $117 million, of which approximately $8 million were included in our RPO balance.
At June 30, 2018, we also had incentives included in transaction prices of approximately $89 million, of which approximately $13 million were included in our RPO balance. At December 31, 2017, we did not have any material incentives included in transaction prices for our projects.
The aforementioned amounts recorded in contract prices and recognized as revenue reflect our best estimates of recovery; however, the ultimate resolution and amounts received could differ from these estimates and could have a material adverse effect on our results of operations, financial position and cash flow.
Loss Projects
Included in the Combination were three projects in a substantial loss position at the Combination Date. The loss positions include our changes in cost estimates of $165 million on the Cameron LNG project, $23 million on the Calpine project and $33 million on the now-completed IPL gas power project. These changes in cost estimates did not have a direct impact on our net income for the three months ended June 30, 2018 as the impact of their changes in estimates were included as adjustments to the fair value of the acquired balance sheet. Summary information for the ongoing projects as of June 30, 2018 is as follows:
|
|
19 |
|
NOTES TO THE CONDENSED CONSOLIDATED FINANCIAL STATEMENTS (UNAUDITED)
Cameron LNG―At June 30, 2018, our U.S. LNG export facility project in Hackberry, Louisiana for Cameron LNG (within our NCSA operating group) was in a loss position. The project was acquired in the Combination and at June 30, 2018 was approximately 23% complete on a post-Combination basis (approximately 88% on a pre-Combination basis) and had a reserve for estimated losses of approximately $32 million. A reduction in workforce on the project has subsequently been implemented to improve productivity and maintain schedule.
Calpine Power Project―At June 30, 2018, our U.S. gas turbine power project in the Northeast for Calpine (within our NCSA operating group) was in a loss position. The project was acquired in the Combination and at June 30, 2018 was approximately 28% complete on a post-Combination basis (approximately 89% on a pre-Combination basis) and had a reserve for estimated losses of approximately $42 million.
There were no other material active projects as of June 30, 2018 in a substantial loss position.
NOTE 5—PROJECT CHANGES IN ESTIMATES
Our RPOs for each of our operating groups generally consist of several hundred contracts and our results may be impacted by changes in estimated margins. The following is a discussion of our most significant changes in cost estimates that impacted segment operating income for the three and six months ended June 30, 2018 and 2017.
Three months ended June 30, 2018
Segment operating income for the three months ended June 30, 2018 was positively impacted by net favorable changes in estimates totaling approximately $84 million, primarily in our MENA and APAC segments.
MENA—Our segment results were positively impacted by net favorable changes in estimates aggregating approximately $39 million, primarily due to productivity improvements on marine, fabrication and other activities, primarily on two of our projects and savings on several other projects in the Middle East that were not individually significant.
APAC—Our segment results were positively impacted by net favorable changes in estimates aggregating approximately $46 million, primarily due to:
|
|
• |
costs savings from marine campaigns on a project off the Australian coast; and |
|
|
• |
cost savings upon the substantial completion of pipelay and offshore construction campaign on the Greater Western Flank Phase 2 project in Australia, partly offset by the impact of weather related delays on the project. |
Six months ended June 30, 2018
Segment operating income for the six months ended June 30, 2018 was positively impacted by net favorable changes in estimates totaling approximately $121 million, primarily in our MENA and APAC segments.
MENA—Our segment results were positively impacted by favorable changes in estimates aggregating approximately $69 million, primarily due to:
|
|
• |
productivity improvements on marine, fabrication and other activities, primarily on two of our projects and savings on several other projects in the Middle East that were not individually significant; |
|
|
• |
cost savings associated with fabrication, procurement and marine campaigns on two Saudi Aramco lump-sum EPCI projects under the second Saudi Aramco Long Term Agreement (“LTA II”); |
|
|
• |
savings associated with marine campaigns, reimbursement for costs incurred and reduction in estimated costs to complete multiple projects in the Middle East, none of which were individually material; |
These favorable changes in estimates were partially offset by higher estimated costs associated with;
|
|
• |
hook-up and marine campaigns on two Saudi Aramco projects; and |
|
|
• |
standby equipment and mechanical equipment downtime on Middle East projects. |
|
|
20 |
|
NOTES TO THE CONDENSED CONSOLIDATED FINANCIAL STATEMENTS (UNAUDITED)
APAC—Our segment results were positively impacted by favorable changes in estimates aggregating approximately $55 million. This included a net reduction in estimates of costs to complete on offshore campaigns and several other active projects, partially offset by additional costs associated with weather downtime on two active projects.
Three and six months ended June 30, 2017
Segment operating income for the three and six months ended June 30, 2017 was positively impacted by net favorable changes in estimates totaling approximately $32 million and $79 million, respectively, primarily in our MENA (approximately $20 million and $36 million, respectively) and APAC (approximately $16 million and $41 million, respectively) segments.
NOTE 6—CASH, CASH EQUIVALENTS AND RESTRICTED CASH
The following is a reconciliation of cash, cash equivalents and restricted cash reported within the Balance Sheets that sum to the totals of such amounts shown in the Statements of Cash Flows at June 30, 2018 and December 31, 2017:
|
|
|
June 30, 2018 |
|
|
December 31, 2017 |
|
||
|
|
|
(In millions) |
|
|||||
|
Cash and cash equivalents |
|
$ |
814 |
|
|
$ |
390 |
|
|
Restricted cash and cash equivalents (1) |
|
|
324 |
|
|
|
18 |
|
|
Total cash, cash equivalents and restricted cash shown in the Consolidated Statements of Cash Flows |
|
$ |
1,138 |
|
|
$ |
408 |
|
|
(1) |
Our restricted cash balances primarily served as cash collateral deposits for our letter of credit facilities. See Note 12, Debt for further discussion. |
Accounts Receivable—Trade, Net―Our trade accounts receivable balances at June 30, 2018 and December 31, 2017 included the following:
|
|
|
June 30, 2018 |
|
|
December 31, 2017 |
|
||
|
|
|
(In millions) |
|
|||||
|
Contract receivables (1) |
|
$ |
857 |
|
|
$ |
225 |
|
|
Retainages (2) |
|
|
128 |
|
|
|
120 |
|
|
Less allowances |
|
|
(17 |
) |
|
|
(17 |
) |
|
Accounts receivable—trade, net |
|
$ |
968 |
|
|
$ |
328 |
|
|
(1) |
Unbilled receivables for our performance obligations recognized at a point in time are recorded within accounts receivable and were approximately $21 million at June 30, 2018 (all resulted from the acquired CB&I operations). |
|
(2) |
Retainages classified within Accounts receivable-trade, net are anticipated to be collected within one year. Retainages anticipated to be collected beyond one year are classified as Accounts receivable long-term retainages on our Balance Sheet. |
|
|
21 |
|
NOTES TO THE CONDENSED CONSOLIDATED FINANCIAL STATEMENTS (UNAUDITED)
NOTE 8—CONTRACTS IN PROGRESS AND ADVANCE BILLINGS ON CONTRACTS
Our contract assets and liabilities at June 30, 2018 and December 31, 2017 were as follows:
|
|
|
June 30, 2018 (1) |
|
|
December 31, 2017 |
|
||
|
|
|
(In millions) |
|
|||||
|
Costs incurred in excess of costs recognized (1) |
|
$ |
8 |
|
|
$ |
98 |
|
|
Revenues recognized less billings to customers (2) |
|
|
910 |
|
|
|
523 |
|
|
Contracts in progress |
|
$ |
918 |
|
|
$ |
621 |
|
|
|
|
|
|
|
|
|
|
|
|
Costs recognized in excess of costs incurred (1) |
|
$ |
10 |
|
|
$ |
(14 |
) |
|
Billings to customers less revenues recognized (2) |
|
|
1,217 |
|
|
|
46 |
|
|
Advance billings on contracts |
|
$ |
1,227 |
|
|
$ |
32 |
|
|
(1) |
Costs incurred in excess of costs recognized (assets) and costs recognized in excess of costs incurred (liabilities) resulted from the exclusion of certain costs when measuring progress toward completion under the cost-to-cost method, prior to our adoption of ASC Topic 606. These remaining amounts will be recognized in Cost of operations as the underlying projects progress. |
|
(2) |
During the six months ended June 30, 2018, the change in the asset and liability balances includes $411 million and $1.2 billion, respectively, resulting from the Combination. Revenues recognized for the three and six-months periods ended June 30, 2018 with respect to amounts included in our contract liability balance as of December 31, 2017 were $7 million and $45 million, respectively. |
For the three months ended June 30, 2018, revenues recognized from changes in transaction prices associated with performance obligations satisfied in prior periods were $13 million, primarily in our MENA segment. For the six-months ended June 30, 2018, we recognized $79 million of revenues resulting from the second quarter 2018 impact discussed above and changes in transaction prices during the first quarter 2018 associated with performance obligations satisfied in prior periods, primarily in our APAC segment. The change in transaction prices primarily related to reimbursement of costs incurred in prior periods.
Project Related Intangibles—The accumulated amortization and weighted-average useful lives for each major project-related intangible asset class and in total at June 30, 2018 were as follows:
|
|
|
June 30, 2018 |
|
|
|
|
|
|||||
|
|
|
Gross Carrying Amount |
|
|
Accumulated Amortization |
|
|
Weighted Average Life |
|
|||
|
|
|
(In millions) |
|
|
(In years) |
|
||||||
|
Project-related intangible assets |
|
$ |
145 |
|
|
$ |
(16 |
) |
|
|
3 |
|
|
Project-related intangible liabilities |
|
|
(33 |
) |
|
|
4 |
|
|
|
2 |
|
|
Total (1) |
|
$ |
112 |
|
|
$ |
(12 |
) |
|
|
|
|
|
(1) |
All project related intangible assets at June 30, 2018 resulted from the Combination. Amortization expense was $12 million for the three months ended June 30, 2018 and is anticipated to be $42 million, $27 million, $19 million and $12 million for the remainder of 2018, 2019, 2020 and 2021, respectively. |
|
|
22 |
|
NOTES TO THE CONDENSED CONSOLIDATED FINANCIAL STATEMENTS (UNAUDITED)
Other Intangible Assets—The accumulated amortization and weighted-average useful lives for each major other intangible asset class and in total at June 30, 2018 were as follows:
|
|
|
June 30, 2018 |
|
|
|
|
|
|||||
|
|
|
Gross Carrying Amount |
|
|
Accumulated Amortization |
|
|
Weighted Average Life |
|
|||
|
|
|
(In millions) |
|
|
(In years) |
|
||||||
|
Process technologies |
|
$ |
515 |
|
|
$ |
(3 |
) |
|
|
27 |
|
|
Trade names |
|
|
420 |
|
|
|
(6 |
) |
|
|
12 |
|
|
Customer relationships |
|
|
87 |
|
|
|
(1 |
) |
|
|
9 |
|
|
Trademarks |
|
|
27 |
|
|
|
- |
|
|
|
10 |
|
|
Total (1) |
|
$ |
1,049 |
|
|
$ |
(10 |
) |
|
|
|
|
|
(1) |
All other intangible assets at June 30, 2018 resulted from the Combination. Amortization expense was $10 million for the three months ended June 30, 2018 and is anticipated to be $45 million, $81 million, $81 million, $77 million and $73 million for the remainder of 2018, 2019, 2020, 2021 and 2022, respectively. |
NOTE 10—JOINT VENTURE AND CONSORTIUM ARRANGEMENTS
As discussed in Note 2, Basis of Presentation and Significant Accounting Policies we account for our unconsolidated joint ventures or consortiums using either proportionate consolidation, when we meet the applicable accounting criteria to do so, or the equity method. Further, we consolidate any joint venture or consortium that is determined to be a VIE for which we are the primary beneficiary, or which we otherwise effectively control.
Proportionately Consolidated Consortiums—The following is a summary description of our significant consortiums that have been accounted for using proportionate consolidation:
|
|
• |
McDermott/Zachry—We have a 50%/50% consortium with Zachry to perform engineering, procurement and construction (“EPC”) work for two LNG liquefaction trains in Freeport, Texas. In addition, we have subcontract and risk sharing arrangements with Chiyoda to support our responsibilities to the venture. The costs of these arrangements are recorded in Cost of operations. |
|
|
• |
McDermott/Zachry/Chiyoda—We have a consortium with Zachry and Chiyoda (MDR—33.3% / Zachry—33.3% / Chiyoda—33.3%) to perform EPC work for an additional LNG liquefaction train at the project site in Freeport, Texas. |
|
|
• |
McDermott/Chiyoda—We have a 50%/50% consortium with Chiyoda to perform EPC work for three LNG liquefaction trains in Hackberry, Louisiana. |
|
|
• |
McDermott/CTCI—We have 42.5%/57.5% consortium with CTCI Americas to perform EPC work for a mono-ethylene glycol facility in Gregory, Texas. The results were not material for any of the periods presented in the Financial Statements, but will become more material as project activities progress. |
The following table presents summarized balance sheet information for our share of our proportionately consolidated consortiums:
|
|
|
June 30, 2018 (1) |
|
|
|
|
|
(In millions) |
|
|
|
Current assets (2) |
|
$ |
382 |
|
|
Non-current assets |
|
|
8 |
|
|
Total assets |
|
$ |
390 |
|
|
|
|
|
|
|
|
Current liabilities |
|
$ |
433 |
|
|
(1) |
All balances at June 30, 2018 resulted from the Combination and are subject to change when additional information is obtained during the measurement period. |
|
|
23 |
|
NOTES TO THE CONDENSED CONSOLIDATED FINANCIAL STATEMENTS (UNAUDITED)
At June 30, 2018, Accrued liabilities on the Balance Sheets included $49 million related to advances to McDermott from the consortiums.
Equity Method Joint Ventures—The following is a summary description of our significant joint ventures accounted for using the equity method:
|
|
• |
Chevron-Lummus Global (“CLG”)—We have a 50%/50% joint venture with Chevron which provides proprietary process technology licenses and associated engineering services and catalyst, primarily for the refining industry. As sufficient capital investments in CLG have been made by the joint venture participants, it does not qualify as a VIE. |
|
|
• |
NET Power—We have a joint venture with Exelon and 8 Rivers Capital (McDermott—33.3% / Exelon—33.3% / 8 Rivers Capital—33.3%) to commercialize a new natural gas power generation system that recovers the carbon dioxide produced during combustion. NET Power is building a first-of-its-kind demonstration plant which is being funded by contributions and services from the joint venture participants and other parties. We have determined the joint venture to be a VIE; however, we are not the primary beneficiary, and therefore do not consolidate it. Our cash commitment for NET Power totals $57 million, and at June 30, 2018, we had made cumulative investments totaling $47 million (all prior to the Combination). |
|
|
• |
McDermott/CTCI—We have a 50%/50% joint venture with CTCI to perform EPC work for a liquids ethylene cracker and associated units at Sohar, Oman. We have determined the joint venture to be a VIE; however, we are not the primary beneficiary, and therefore do not consolidate it. Our joint venture arrangement allows for excess working capital of the joint venture to be advanced to the joint venture participants. Such advances are returned to the joint venture for working capital needs as necessary. At June 30, 2018, Accrued liabilities on the Balance Sheets included $95 million related to advances to McDermott from the joint venture. |
|
|
• |
io Oil and Gas—We co-own several 50%/50% joint venture entities with Baker Hughes, a GE company. These joint venture entities focus on the pre-FEED phases of projects in offshore markets. They bring comprehensive field development expertise and provide technically advanced solutions in new full field development concept selection and evaluation. |
|
|
• |
Qingdao McDermott Wuchuan Offshore Engineering Company Ltd.—We have a 50%/50% joint venture with Wuhan Wuchuan Investment Holding Co., Ltd., a leading shipbuilder in China. This joint venture provides project management, procurement, engineering, fabrication, construction and pre-commissioning of onshore and offshore oil and gas structures, including onshore modules, topsides, floating production storage, off-loading modules, subsea structures, and manifolds. |
As discussed in Note 2, Basis of Presentation and Significant Accounting Policies in the second quarter of 2018 we implemented certain changes to our financial reporting structure, including presentation of income and losses from investments (listed above) in unconsolidated affiliates, as a component of operating income in the Statements of Operations. Income and loss from investments in unconsolidated affiliates were previously presented below provision for income taxes. We believe this presentation better represents the integrated operating nature of these joint ventures which are considered essential to our core operations.
Our income and losses from investments in unconsolidated affiliates that were dissolved or not considered integral to our core operations as of December 31, 2017 are presented below provision for income taxes in the consolidated statements of operations for the comparative three and six-month periods ended June 30, 2017.
|
|
24 |
|
NOTES TO THE CONDENSED CONSOLIDATED FINANCIAL STATEMENTS (UNAUDITED)
Aggregate summarized financial information for CLG and Qingdao McDermott Wuchuan Offshore Engineering Company Ltd. is as follows:
|
|
|
Three months ended June 30, |
|
|
Six months ended |
|
||||||||||
|
|
|
2018 |
|
|
2017 |
|
|
2018 |
|
|
2017 |
|
||||
|
|
|
(In millions) |
|
|||||||||||||
|
Revenues |
|
$ |
56 |
|
|
$ |
2 |
|
|
$ |
56 |
|
|
$ |
2 |
|
|
Cost of operations |
|
|
(45 |
) |
|
|
- |
|
|
|
(45 |
) |
|
|
- |
|
|
Gross profit |
|
|
11 |
|
|
|
2 |
|
|
|
11 |
|
|
|
2 |
|
|
Income (loss) from operations |
|
|
4 |
|
|
|
(2 |
) |
|
|
1 |
|
|
|
(4 |
) |
|
Net income (loss) (1) |
|
$ |
3 |
|
|
$ |
(3 |
) |
|
$ |
(2 |
) |
|
$ |
(8 |
) |
|
(1) |
Includes results for CLG from the Combination Date. |
Consolidated Joint Ventures—The following is a summary description of our significant joint venture we consolidate due to its designation as a VIE for which we are the primary beneficiary:
|
|
• |
McDermott/Orano—We have a joint venture with Orano (McDermott—52% / Orano—48%) relating to a mixed oxide fuel fabrication facility in Aiken, South Carolina. |
The following table presents summarized balance sheet information for our consolidated joint ventures:
|
|
|
June 30, 2018 (1) |
|
|
|
|
|
(In millions) |
|
|
|
Current assets |
|
$ |
74 |
|
|
Non-current assets |
|
|
15 |
|
|
Total assets |
|
$ |
89 |
|
|
|
|
|
|
|
|
Current liabilities |
|
$ |
81 |
|
|
(1) |
All balances at June 30, 2018 resulted from the Combination and are subject to change when additional information is obtained during the measurement period. |
Other—The use of these joint ventures and consortiums exposes us to a number of risks, including the risk that the third party joint venture or consortium participants may be unable or unwilling to provide their share of capital investment to fund the operations of the joint venture or consortium or complete their obligations to us, the joint venture or consortium, or ultimately, our customer. Differences in opinions or views among joint venture or consortium participants could also result in delayed decision-making or failure to agree on material issues, which could adversely affect the business and operations of a joint venture or consortium. In addition, agreement terms may subject us to joint and several liability for the third-party participants in our joint ventures or consortiums, and the failure of any of those third parties to perform their obligations could impose additional performance and financial obligations on us. These factors could result in unanticipated costs to complete the projects, liquidated damages or contract disputes.
NOTE 11—RESTRUCTURING AND INTEGRATION COSTS
Restructuring and integration costs primarily relate to costs to achieve our CPI program. We launched the CPI program in the second quarter of 2018, with the goal of realizing transformative cost savings across our business. The program incorporates the activities of our Fit 2 Grow program previously announced in the fourth quarter of 2017 and targets a significant improvement in cost controls across five main opportunity areas: (i) procurement and supply chain; (ii) systems, applications and support; (iii) assets and facilities; (iv) perquisites, travel and other; and (v) workforce efficiency. The program also includes other costs associated with the Combination, including change-in-control, severance, incremental incentive plan costs and professional fees. These costs are recorded within our Corporate operating results and were $63 million and $75 million for the three and six months ended June 30, 2018, respectively. Our accrued liability for this program was $27 million at June 30, 2018, and we anticipate incurring an additional $135 million prior to its completion date, which is anticipated in the fourth quarter of 2019.
|
|
25 |
|
NOTES TO THE CONDENSED CONSOLIDATED FINANCIAL STATEMENTS (UNAUDITED)
The carrying values of our long-term debt obligations as of June 30, 2018 and December 31, 2017 are as follows:
|
|
|
June 30, 2018 |
|
|
December 31, 2017 |
|
||
|
|
(In millions) |
|
||||||
|
Current |
|
|
|
|
|
|
|
|
|
Current maturities of long-term debt |
|
|
43 |
|
|
|
24 |
|
|
Less: unamortized debt issuance costs |
|
|
(1 |
) |
|
|
- |
|
|
Current maturities of long-term debt, net of unamortized debt issuance costs |
|
|
42 |
|
|
|
24 |
|
|
|
|
|
|
|
|
|
|
|
|
Long-term |
|
|
|
|
|
|
|
|
|
Term Facility |
|
$ |
2,254 |
|
|
$ |
- |
|
|
10.625% senior notes |
|
|
1,300 |
|
|
|
- |
|
|
8.000% second-lien notes |
|
|
- |
|
|
|
500 |
|
|
North Ocean 105 construction financing |
|
|
21 |
|
|
|
25 |
|
|
Vendor equipment financing |
|
|
10 |
|
|
|
16 |
|
|
Capital lease |
|
|
22 |
|
|
|
1 |
|
|
Less: current maturities of long-term debt |
|
|
(43 |
) |
|
|
(24 |
) |
|
Less: unamortized debt issuance costs |
|
|
(146 |
) |
|
|
(5 |
) |
|
Long-term debt, net of unamortized debt issuance costs |
|
$ |
3,418 |
|
|
$ |
513 |
|
Credit Agreement
On May 10, 2018, we entered into a Credit Agreement (the “Credit Agreement”) with a syndicate of lenders and letter of credit issuers, Barclays Bank PLC, as administrative agent for a term facility under the Credit Agreement, and Crédit Agricole Corporate and Investment Bank, as administrative agent for the other facilities under the Credit Agreement. The Credit Agreement provides for borrowings and letters of credit in the aggregate principal amount of $4.65 billion, consisting of the following:
|
|
• |
a $2.26 billion senior secured term loan facility (the “Term Facility”), the full amount of which was borrowed, and $319.3 million of which has been deposited into a restricted cash collateral account (the “LC Account”) to secure reimbursement obligations in respect of up to $310.0 million of letters of credit (the “Term Facility Letters of Credit”); |
|
|
• |
a $1.0 billion senior secured revolving credit facility (the “Revolving Credit Facility”); and |
|
|
• |
a $1.39 billion senior secured letter of credit facility (the “LC Facility”). |
The Credit Agreement provides that:
|
|
• |
Term Facility Letters of Credit can be issued in an amount up to the amount on deposit in the LC Account ($319.6 million at June 30, 2018), less an amount equal to approximately 3% of such amount on deposit (to be held as a reserve for related letter of credit fees), not to exceed $310.0 million; |
|
|
• |
subject to compliance with the financial covenants in the Credit Agreement, the full amount of the Revolving Credit Facility is available for revolving loans; |
|
|
• |
subject to our utilization in full of our capacity to issue Term Facility Letters of Credit, the full amount of the Revolving Credit Facility is available for the issuance of performance letters of credit and up to $200 million of the Revolving Credit Facility is available for the issuance of financial letters of credit; and |
|
|
• |
the full amount of the LC Facility is available for the issuance of performance letters of credit. |
Borrowings are available under the Revolving Credit Facility for working capital and other general corporate purposes. Certain existing letters of credit outstanding under our previously existing Amended and Restated Credit Agreement, dated as of June 30, 2017 (the “Prior Credit Agreement”) and certain existing letters of credit outstanding under CB&I’s previously existing credit facilities have been deemed issued under the Credit Agreement, and letters of credit were issued under the Credit Agreement to backstop certain other existing letters of credit issued for the account of McDermott, CB&I and their respective subsidiaries and affiliates.
|
|
26 |
|
NOTES TO THE CONDENSED CONSOLIDATED FINANCIAL STATEMENTS (UNAUDITED)
The Credit Agreement includes mandatory commitment reductions and prepayments in connection with, among other things, certain asset sales and casualty events (subject to reinvestment rights with respect to asset sales of less than $500 million). In addition, we are required to make annual prepayments of term loans under the Term Facility and cash collateralize letters of credit issued under the Revolving Credit Facility and the LC Facility with 75% of excess cash flow (as defined in the Credit Agreement), reducing to 50% of excess cash flow and 25% of excess cash flow depending on our secured leverage ratio.
Term Facility—At June 30, 2018, we had $2.25 billion of borrowings outstanding under our seven-year Term Facility. Proceeds of our borrowing under the Term Facility were used, together with proceeds from the senior notes described below and cash on hand, (i) to consummate the Business Combination Agreement, including the repayment of certain existing indebtedness of CB&I and its subsidiaries, (ii) to redeem our $500 million aggregate principal amount of the 8.000% second-lien notes, (iii) to prepay existing indebtedness under, and to terminate in full, our Prior Credit Agreement, and (iv) to pay fees and expenses in connection with the Combination, the Credit Agreement and the issuance of the Senior Notes.
Principal under the Term Facility is payable quarterly and interest is assessed at either (i) the Eurodollar rate plus a margin of 5.00% per year or (ii) the base rate (the highest of the Federal Funds rate plus 0.50%, the Eurodollar rate plus 1.0%, or the administrative agent’s prime rate) plus a margin of 4.00%, subject to a 1.0% floor with respect to the Eurodollar rate and is payable periodically dependent upon the interest rate in effect during the period. However, on May 8, 2018, we entered into a U.S. dollar interest rate swap arrangement to mitigate exposure associated with cash flow variability on $1.94 billion of the $2.26 billion Term Facility. This resulted in a weighted average interest rate of 7.09%, inclusive of the applicable margin during the period ending June 30, 2018. The Credit Agreement requires us to prepay a portion of the term loans made under the Term Facility on the last day of each fiscal quarter in an amount equal to $5.65 million.
The future scheduled maturities of the Term Facility are:
|
|
|
(In millions) |
|
|
|
2018 |
|
$ |
11 |
|
|
2019 |
|
|
23 |
|
|
2020 |
|
|
23 |
|
|
2021 |
|
|
23 |
|
|
2022 |
|
|
23 |
|
|
Thereafter |
|
|
2,151 |
|
|
|
|
$ |
2,254 |
|
Additionally, at June 30, 2018, there were approximately $308 million of Term Facility Letters of Credit issued (or deemed issued) under the Credit Agreement.
Revolving Credit Facility and LC Facility—We have a $1.0 billion Revolving Credit Facility which is scheduled to expire in May 2023. Through June 30, 2018, we had not made any borrowings under the Revolving Credit Facility. As of June 30, 2018, we had approximately $121 million of letters of credit outstanding (including $60 million of financial letters of credit), leaving $879 million of available capacity under the Revolving Credit Facility. We also have a $1.39 billion LC Facility that is scheduled to expire in May 2023. As of June 30, 2018, we had approximately $1.377 billion of letters of credit outstanding, leaving $13 million of available capacity under the LC Facility. If we borrow funds under the Revolving Credit Facility, interest will be assessed at either the base rate plus a floating margin ranging from 2.75% to 3.25% (3.25% at June 30, 2018) or the Eurodollar rate plus a floating margin ranging from 3.75% to 4.25% (4.25% at June 30, 2018), in each case depending on our leverage ratio (calculated quarterly). We are charged a commitment fee of 0.50% per year on the daily amount of the unused portions of the commitments under the Revolving Credit Facility and the LC Facility. Additionally, with respect to all letters of credit outstanding under the Credit Agreement, we are charged a fronting fee of 0.25% per year and, with respect to all letters of credit outstanding under the Revolving Credit Facility and the LC Facility, we are charged a participation fee of (i) between 3.75% to 4.25% (4.25% at June 30, 2018) per year in respect of financial letters of credit and (ii) between 1.875% to 2.125% (2.125% at June 30, 2018) per year in respect of performance letters of credit, in each case depending on our leverage ratio (calculated quarterly). We are also required to pay customary issuance fees and other fees and expenses in connection with the issuance of letters of credit under the Credit Agreement.
|
|
27 |
|
NOTES TO THE CONDENSED CONSOLIDATED FINANCIAL STATEMENTS (UNAUDITED)
Credit Agreement Covenants—The Credit Agreement includes the following financial covenants that will be tested on a quarterly basis commencing September 30, 2018:
|
|
• |
the minimum permitted fixed charge coverage ratio (as defined in the Credit Agreement) is 1.50 to 1.00; |
|
|
• |
the maximum permitted leverage ratio is (i) 4.25 to 1.00 for each fiscal quarter ending on or before September 30, 2019, (ii) 4.00 to 1.00 for the fiscal quarter ending December 31, 2019, (iii) 3.75 to 1.00 for each fiscal quarter ending after December 31, 2019 and on or before December 31, 2020, (iv) 3.50 to 1.00 for each fiscal quarter ending after December 31, 2020 and on or before December 31, 2021 and (v) 3.25 to 1.00 for each fiscal quarter ending after December 31, 2021; and |
|
|
• |
the minimum liquidity (as defined in the Credit Agreement, but generally meaning the sum of McDermott’s unrestricted cash and cash equivalents plus unused commitments under the Credit Agreement available for revolving borrowings) is $200 million. |
In addition, the Credit Agreement contains various covenants that, among other restrictions, limit our ability to:
|
|
• |
incur or assume indebtedness; |
|
|
• |
grant or assume liens; |
|
|
• |
make acquisitions or engage in mergers; |
|
|
• |
sell, transfer, assign or convey assets; |
|
|
• |
make investments; |
|
|
• |
repurchase equity and make dividends and certain other restricted payments; |
|
|
• |
change the nature of its business; |
|
|
• |
engage in transactions with affiliates; |
|
|
• |
enter into burdensome agreements; |
|
|
• |
modify its organizational documents; |
|
|
• |
enter into sale and leaseback transactions; |
|
|
• |
make capital expenditures; |
|
|
• |
enter into speculative hedging contracts; and |
|
|
• |
make prepayments on certain junior debt. |
As of June 30, 2018, we were in compliance with all our restrictive covenants under the Credit Agreement. Our financial covenant requirements under the Credit Agreement will be subject to testing beginning in the third quarter of 2018.
The Credit Agreement contains events of default that we believe are customary for a secured credit facility. If an event of default relating to bankruptcy or other insolvency events occurs, all obligations under the Credit Agreement will immediately become due and payable. If any other event of default exists under the Credit Agreement, the lenders may accelerate the maturity of the obligations outstanding under the Credit Agreement and exercise other rights and remedies. In addition, if any event of default exists under the Credit Agreement, the lenders may commence foreclosure or other actions against the collateral.
If any default exists under the Credit Agreement, or if the Borrowers are unable to make any of the representations and warranties in the Credit Agreement at the applicable time, the Borrowers will be unable to borrow funds or have letters of credit issued under the Credit Agreement.
|
|
28 |
|
NOTES TO THE CONDENSED CONSOLIDATED FINANCIAL STATEMENTS (UNAUDITED)
On April 18, 2018, we issued $1.3 billion in aggregate principal of 10.625% senior notes due 2024 (the “Senior Notes”), pursuant to an indenture we entered into with Wells Fargo Bank, National Association, as trustee (the “Senior Notes Indenture”). Interest on the Senior Notes is payable semi-annually in arrears, and the Senior Notes are scheduled to mature in May 2024. However, at any time or from time to time on or after May 1, 2021, we may redeem the Senior Notes, in whole or in part, at the redemption prices (expressed as percentages of principal amount of the Senior Notes to be redeemed) set forth below, together with accrued and unpaid interest to (but excluding) the redemption date (subject to the right of holders of record on the relevant record date to receive interest due on the relevant interest payment date), if redeemed during the 12-month period beginning on May 1 of the years indicated:
|
Year |
|
Optional redemption price |
|
|
|
2021 |
|
|
105.313 |
% |
|
2022 |
|
|
102.656 |
% |
|
2023 and thereafter |
|
|
100.000 |
% |
In addition, prior to May 1, 2021, we may redeem up to 35.0% of the aggregate principal amount of the outstanding Senior Notes, in an amount not greater than the net cash proceeds of one or more qualified equity offerings (as defined in the Senior Notes Indenture) at a redemption price equal to 110.625% of the principal amount of the notes to be redeemed, plus accrued and unpaid interest to (but excluding) the date of redemption (subject to the right of holders of record on the relevant record date to receive interest due on the relevant interest payment date), subject to certain limitations and other requirements. The Senior Notes may also be redeemed, in whole or in part, at any time prior to May 1, 2021 at our option, at a redemption price equal to 100% of the principal amount of the Senior Notes redeemed, plus the applicable premium (as defined in the Senior Notes Indenture) as of, and accrued and unpaid interest to (but excluding) the applicable redemption date (subject to the right of the holders of record on the relevant record date to receive interest due on the relevant interest payment date).
The Senior Notes Indenture contains covenants that, among other things, limit our ability to: (i) incur or guarantee additional indebtedness or issue preferred stock; (ii) make investments or certain other restricted payments; (iii) pay dividends or distributions on its capital stock or purchase or redeem its subordinated indebtedness; (iv) sell assets; (v) create restrictions on the ability of its restricted subsidiaries to pay dividends or make other payments to McDermott; (vi) create certain liens; (vii) sell all or substantially all of its assets or merge or consolidate with or into other companies; (viii) enter into transactions with affiliates; and (ix) create unrestricted subsidiaries. Those covenants are subject to various exceptions and limitations.
As of June 30, 2018, we were in compliance with all our restrictive covenants under the Senior Notes Indenture.
Other Financing Arrangements
North Ocean Financing―On September 30, 2010, McDermott International Inc., as guarantor, and North Ocean 105 AS, in which we then had a 75% ownership interest, as borrower, entered into a financing agreement to pay a portion of the construction costs of the NO 105. Borrowings under the agreement are secured by, among other things, a pledge of all of the equity of North Ocean 105 AS, a mortgage on the NO 105, and a lien on substantially all of the other assets of North Ocean 105 AS. The financing agreement requires principal repayment in 17 consecutive semiannual installments of $4.1 million, which commenced on October 1, 2012.
In the second quarter of 2017 we exercised our option under the North Ocean 105 AS joint venture agreement and purchased the 25% ownership interest of Oceanteam ASA (“Oceanteam”) in the vessel-owning company for approximately $11 million in cash. As part of that transaction, we also assumed the right to a $5 million note payable from North Ocean 105 AS to Oceanteam (which had been issued in connection with a dividend declared by North Ocean 105 AS in 2016). As of June 30, 2018, the outstanding borrowing under this facility was approximately $21 million. Future maturities are approximately $4 million, $8 million and $8 million for the remainder of 2018 and the years 2019 and 2020, respectively.
Receivable Factoring Facility―During the three months ended June 30, 2018, we sold, without recourse, approximately $138.7 million of receivables under an uncommitted receivables purchase agreement in Mexico at a discount rate of applicable LIBOR plus a margin of 2.00%. We recorded approximately $1.9 million of factoring costs in Other operating income (expense) during the three months ended June 30, 2018.
|
|
29 |
|
NOTES TO THE CONDENSED CONSOLIDATED FINANCIAL STATEMENTS (UNAUDITED)
Vendor Equipment Financing―In February 2017, JRM Mexico entered into a 21-month loan agreement for equipment financing in the amount of $47 million. Borrowings under the loan agreement bear interest at a fixed rate of 5.75%. JRM Mexico’s obligations in connection with this equipment financing are guaranteed by McDermott International Management, S. de RL., one of our indirect, wholly owned subsidiaries. The equipment financing agreement contains various customary affirmative covenants, as well as specific affirmative covenants, including the pledge of specified equipment. The equipment financing agreement also requires compliance with various negative covenants, including restricted use of the proceeds. As of June 30, 2018, the outstanding borrowings under this facility were approximately $10 million and will mature during the remainder of 2018.
Capital Lease Obligations―In May 2018, we entered into a vessel related capital lease arrangement and recorded a $21 million asset for the present value of the future minimum lease payments, along with a corresponding liability. The future annual maturities of the obligation are $0.6 million, $1.3 million, $1.4 million, $1.5 million, $1.6 million and $14.0 million for the remainder of 2018, 2019, 2020, 2021, 2022 and thereafter.
Uncommitted Bilateral Credit Facilities—We are party to a number of short-term uncommitted bilateral credit facilities and surety bond arrangements (the “Uncommitted Facilities”) across several geographic regions, as follows:
|
|
|
June 30, 2018 |
|
|
December 31, 2017 |
|
||||||||||
|
|
|
Uncommitted Line Capacity |
|
|
Utilized |
|
|
Uncommitted Line Capacity |
|
|
Utilized |
|
||||
|
|
|
(In millions) |
|
|||||||||||||
|
Bank Guarantee and Bilateral Letter of Credit (1) |
|
$ |
1,608 |
|
|
$ |
945 |
|
|
$ |
725 |
|
|
$ |
572 |
|
|
Surety Bonds (2) |
|
825 |
|
|
400 |
|
|
|
300 |
|
|
|
49 |
|
||
|
Bilateral arrangements to issue cash collateralized letters of credit |
|
|
- |
|
|
|
- |
|
|
|
175 |
|
|
|
18 |
|
|
(1) |
Approximately $175 million of this capacity is available only upon provision of an equivalent amount of cash collateral. |
|
(2) |
Excludes approximately $395 million of surety bonds maintained on behalf of CB&I’s former Capital Services Operations, which were sold to CSVC Acquisition Corp (“CSVC”) in June 2017. We also continue to maintain guarantees on behalf of CB&I’s former Capital Services Operations business in support of approximately $44 million of RPOs. We have received indemnity from CSVC for both the surety bonds and guarantees. |
Debt Issuance Costs—We incurred approximately $150 million of fees relating to the establishment of our Credit Agreement (including $93 million associated with the Term Facility and $57 million associated with the Revolving Credit Facility and LC Facility) and approximately $58 million relating to the issuance of our Senior Notes. On the Balance Sheets, the costs associated with the Term Facility and Senior Notes are reflected as a direct reduction from the related debt liability and amortized over the terms of the respective facilities. The costs associated with the Revolving Credit Facility and LC Facility are reflected within Other current and noncurrent assets and amortized within Interest expense, net, over the terms of the respective facilities.
Debt Extinguishment Costs—We incurred approximately $10 million of make-whole fees in connection with the redemption of our $500 million 8.000% second-lien notes, as well as charges of approximately $4 million relating to the write-off of deferred debt issuance costs resulting from the extinguishment of our previous debt arrangements. These costs were recorded within Other non-operating expense, net, in our Statement of Operations.
|
|
30 |
|
NOTES TO THE CONDENSED CONSOLIDATED FINANCIAL STATEMENTS (UNAUDITED)
NOTE 13—PENSION AND POSTRETIREMENT BENEFITS
We sponsor various defined benefit pension plans covering eligible employees and provide specific post-retirement benefits for eligible retired U.S. employees and their dependents through health care and life insurance benefit programs. These plans may be changed or terminated by us at any time. Our post-retirement benefit plans are not material.
The following table provides contribution information for our plans at June 30, 2018:
|
|
|
Non-U.S. Pension Plans |
|
|
|
|
|
(In millions) |
|
|
|
Contributions made through June 30, 2018 |
|
$ |
1 |
|
|
Contributions expected for the remainder of 2018 |
|
|
9 |
|
|
Total contributions expected for 2018 (1) |
|
$ |
10 |
|
|
(1) |
All contributions expected for 2018 are associated with pension plans acquired in the Combination. Total contributions for our U.S. pension plans are not anticipated to be material. |
The following table provides a breakout of the components of the net periodic benefit cost (income) associated with our defined benefit pension and other postretirement plans for the three and six months ended June 30, 2018 and 2017:
|
|
|
Three Months Ended June 30, |
|
|
Six Months Ended June 30, |
|
||||||||||
|
|
|
2018 |
|
|
2017 |
|
|
2018 |
|
|
2017 |
|
||||
|
|
|
(In millions) |
|
|||||||||||||
|
U.S. pension plans: |
|
|
|
|
|
|
|
|
|
|
|
|
|
|
|
|
|
Service cost |
|
$ |
- |
|
|
$ |
- |
|
|
$ |
- |
|
|
$ |
- |
|
|
Interest cost |
|
|
5 |
|
|
|
5 |
|
|
|
9 |
|
|
|
10 |
|
|
Expected return on plan assets |
|
|
(5 |
) |
|
|
(5 |
) |
|
|
(9 |
) |
|
|
(10 |
) |
|
Net periodic benefit cost (income) (1) (2) |
|
$ |
- |
|
|
$ |
- |
|
|
$ |
- |
|
|
$ |
- |
|
|
|
|
|
|
|
|
|
|
|
|
|
|
|
|
|
|
|
|
Non-U.S. pension plans: |
|
|
|
|
|
|
|
|
|
|
|
|
|
|
|
|
|
Service cost |
|
$ |
2 |
|
|
$ |
- |
|
|
$ |
2 |
|
|
$ |
- |
|
|
Interest cost |
|
|
3 |
|
|
|
- |
|
|
|
3 |
|
|
|
1 |
|
|
Expected return on plan assets |
|
|
(4 |
) |
|
|
- |
|
|
|
(4 |
) |
|
|
(1 |
) |
|
Net periodic benefit cost (income) (1) (2) |
|
$ |
1 |
|
|
$ |
- |
|
|
$ |
1 |
|
|
$ |
- |
|
|
(1) |
Includes approximately $.04 million and $0.6 million of pension cost associated with our U.S. and non-U.S. plans, respectively, for both the three and six months ended June 30, 2018, which resulted from the Combination. |
|
(2) |
The components of net periodic benefit cost (income) other than the service cost component are included in Other non-operating (income) expense, net in our Statements of Operations. The service cost component is included in Cost of operations and SG&A, in our Statements of Operations, along with other compensation costs rendered by the participating employees. |
In August 2017, one of our non-U.S. plans was amended to issue lump-sum distributions of certain accrued benefits or allow transfer of such benefits into the defined contribution plan. As of December 31, 2017, all investments in the trust for that plan were converted to cash and cash equivalents to facilitate settlements. Settlements are expected to be completed by the end of 2018. As of June 30, 2018, total benefits remaining under the plan were approximately $13 million.
We recognize mark-to-market fair value adjustments on defined benefit pension and other postretirement plans in Other non-operating (income) expense, net in our Statements of Operations in the fourth quarter of each year.
|
|
31 |
|
NOTES TO THE CONDENSED CONSOLIDATED FINANCIAL STATEMENTS (UNAUDITED)
|
|
|
June 30, 2018 |
|
|
December 31, 2017 |
|
||
|
|
|
(In millions) |
|
|||||
|
Accrued contract costs |
|
$ |
711 |
|
|
$ |
141 |
|
|
Advances from equity method and proportionally consolidated joint ventures and consortiums (1) |
|
|
144 |
|
|
|
- |
|
|
Other accrued liabilities (2) |
|
|
587 |
|
|
|
196 |
|
|
Accrued liabilities |
|
$ |
1,442 |
|
|
$ |
337 |
|
|
(1) |
Represents advances to us from the joint ventures and consortiums in which we participate. See Note 10, Joint Venture and Consortium Arrangements for further discussion. |
|
(2) |
Represents various accruals that are each individually less than 5% of total current liabilities. |
NOTE 15—FAIR VALUE MEASUREMENTS
Fair Value of Financial Instruments—Financial instruments are required to be categorized within a valuation hierarchy based upon the lowest level of input that is available and significant to the fair value measurement. The three levels of the valuation hierarchy are as follows:
|
|
• |
Level 1—inputs are based on quoted prices for identical instruments traded in active markets. |
|
|
• |
Level 2—inputs are based on quoted prices for similar instruments in active markets, quoted prices for similar or identical instruments in inactive markets and model-based valuation techniques for which all significant assumptions are observable in the market or can be corroborated by observable market data for substantially the full term of the assets and liabilities. |
|
|
• |
Level 3—inputs are generally unobservable and typically reflect management’s estimates of assumptions that market participants would use in pricing the asset or liability. The fair values are therefore determined using model-based techniques that include option pricing models, discounted cash flow models and similar valuation techniques. |
The following table presents the fair value of our financial instruments at June 30, 2018 and December 31, 2017 that are (i) measured and reported at fair value in the Financial Statements on a recurring basis and (ii) not measured at fair value on a recurring basis in the Financial Statements:
|
|
|
June 30, 2018 |
|
|||||||||||||||||
|
|
|
Carrying Amount |
|
|
Fair Value |
|
|
Level 1 |
|
|
Level 2 |
|
|
Level 3 |
|
|||||
|
|
|
(In millions) |
|
|||||||||||||||||
|
Measured at fair value on recurring basis |
|
|
|
|
|
|
|
|
|
|
|
|
|
|
|
|
|
|
|
|
|
Forward contracts (1) |
|
$ |
(14 |
) |
|
$ |
(14 |
) |
|
$ |
- |
|
|
$ |
(14 |
) |
|
$ |
- |
|
|
Not measured at fair value on recurring basis |
|
|
|
|
|
|
|
|
|
|
|
|
|
|
|
|
|
|
|
|
|
Debt (2) |
|
|
(3,460 |
) |
|
|
(3,676 |
) |
|
|
- |
|
|
|
(3,623 |
) |
|
|
(53 |
) |
|
|
|
|
|
|
|
|
|
|
|
|
|
|
|
|
|
|
|
|
|
|
|
|
|
December 31, 2017 |
|
|||||||||||||||||
|
|
|
Carrying Amount |
|
|
Fair Value |
|
|
Level 1 |
|
|
Level 2 |
|
|
Level 3 |
|
|||||
|
|
|
(In millions) |
|
|||||||||||||||||
|
Measured at fair value on recurring basis |
|
|
|
|
|
|
|
|
|
|
|
|
|
|
|
|
|
|
|
|
|
Forward contracts (1) |
|
$ |
2 |
|
|
$ |
2 |
|
|
$ |
- |
|
|
$ |
2 |
|
|
$ |
- |
|
|
Not measured at fair value on recurring basis |
|
|
|
|
|
|
|
|
|
|
|
|
|
|
|
|
|
|
|
|
|
Debt (2) |
|
|
(537 |
) |
|
|
(558 |
) |
|
|
- |
|
|
|
(516 |
) |
|
|
(42 |
) |
|
(1) |
The fair value of forward contracts is classified as Level 2 within the fair value hierarchy and is valued using observable market parameters for similar instruments traded in active markets. Where quoted prices are not available, the income approach is used to value forward contracts. This approach discounts future cash flows based on current market expectations and credit risk. |
|
|
32 |
|
NOTES TO THE CONDENSED CONSOLIDATED FINANCIAL STATEMENTS (UNAUDITED)
The carrying amounts that we have reported for our other financial instruments, including cash and cash equivalents, restricted cash and cash equivalents, accounts receivables and accounts payable approximate their fair values due to the short maturity of those instruments. The fair value of financial instruments included in purchase accounting estimates as a result of the Combination are subject to change when additional information is obtained.
NOTE 16—DERIVATIVE FINANCIAL INSTRUMENTS
Foreign Currency Exchange Rate Derivatives—The notional value of our outstanding foreign exchange rate derivative contracts totaled $898 million at June 30, 2018, with maturities extending through August 2022. These instruments consist of contracts to purchase or sell foreign-denominated currencies. As of June 30, 2018, the fair value of these contracts was in a net liability position totaling approximately $5 million. The fair value of outstanding derivative instruments is determined using observable financial market inputs, such as quoted market prices, and is classified as Level 2 in nature.
As of June 30, 2018, for, we deferred approximately $5 million of net losses in AOCI in connection with foreign exchange rate derivatives designated as cash flow hedges, and we expect to reclassify approximately $3 million of deferred losses out of AOCI by June 30, 2019, as hedged items are recognized in earnings.
Interest Rate Derivatives—On May 8, 2018, we entered into a U.S. dollar interest rate swap arrangement to mitigate exposure associated with cash flow variability on the Term Facility in an aggregate notional value of $1.94 billion. The swap arrangement has been designated as a cash flow hedge as its critical terms matched those of the Term Facility at inception and through June 30, 2018. Accordingly, changes in the fair value of the swap arrangement are included in AOCI until the associated underlying exposure impacts our interest expense. As of June 30, 2018, the fair value of the swap arrangement was in a net liability position totaling approximately $10 million. The fair value of outstanding derivative instruments is determined using observable financial market inputs, such as quoted market prices, and is classified as Level 2 in nature.
As of June 30, 2018, in connection with the interest rate swap arrangement, we deferred approximately $10 million of net losses in AOCI, and we expect to reclassify approximately $2 million of deferred losses out of AOCI by June 30, 2019, as the hedged items are recognized in earnings.
The following table presents the total fair value of the derivatives by underlying risk and balance sheet classification:
|
|
|
June 30, 2018 |
|
|
December 31, 2017 |
|
||||||||||
|
|
|
Derivatives designated as cash flow hedges |
|
|
Derivatives not designated as cash flow hedges |
|
|
Derivatives designated as cash flow hedges |
|
|
Derivatives not designated as cash flow hedges |
|
||||
|
|
|
(In millions) |
|
|||||||||||||
|
Other current assets |
|
$ |
5 |
|
|
$ |
4 |
|
|
$ |
2 |
|
|
$ |
- |
|
|
Other non-current assets |
|
|
1 |
|
|
|
- |
|
|
|
- |
|
|
|
- |
|
|
Total derivatives asset |
|
$ |
6 |
|
|
$ |
4 |
|
|
$ |
2 |
|
|
$ |
- |
|
|
|
|
|
|
|
|
|
|
|
|
|
|
|
|
|
|
|
|
Accrued liabilities |
|
$ |
11 |
|
|
$ |
2 |
|
|
$ |
1 |
|
|
$ |
- |
|
|
Other non-current liabilities |
|
|
11 |
|
|
|
- |
|
|
|
- |
|
|
|
- |
|
|
Total derivatives liability |
|
$ |
22 |
|
|
$ |
2 |
|
|
$ |
1 |
|
|
$ |
- |
|
|
|
33 |
|
NOTES TO THE CONDENSED CONSOLIDATED FINANCIAL STATEMENTS (UNAUDITED)
The following table presents the total value, by underlying risk, recognized in other comprehensive income and reclassified from AOCI to Cost of operations (foreign currency derivatives) and Interest expense, net (interest rate derivatives) in the Statements of Operations for the three and six months ended June 30, 2018 and 2017, in connection with derivatives designated as cash flow hedges:
|
|
|
Three Months Ended June 30, |
|
|
Six Months Ended June 30, |
|
||||||||||
|
|
|
2018 |
|
|
2017 |
|
|
2018 |
|
|
2017 |
|
||||
|
|
|
(In millions) |
|
|||||||||||||
|
Foreign currency hedges |
|
|
|
|
|
|
|
|
|
|
|
|
|
|
|
|
|
Amount of gain (loss) recognized in other comprehensive income (loss) |
|
$ |
(5 |
) |
|
$ |
5 |
|
|
$ |
(5 |
) |
|
$ |
10 |
|
|
Loss (gain) reclassified from AOCI to Cost of operations |
|
|
- |
|
|
|
1 |
|
|
|
- |
|
|
|
(3 |
) |
|
Ineffective portion and amount excluded from effectiveness testing: gain (loss) recognized in Other non-operating income (expense) |
|
|
(3) |
|
|
|
(1 |
) |
|
|
(2) |
|
|
|
(1 |
) |
|
Interest rate hedges |
|
|
|
|
|
|
|
|
|
|
|
|
|
|
|
|
|
Amount of gain (loss) recognized in other comprehensive income (loss) |
|
|
(10 |
) |
|
|
- |
|
|
|
(10 |
) |
|
|
- |
|
|
|
|
|
|
|
|
|
|
|
|
|
|
|
|
|
|
|
The following table presents the total value of gain (loss) recognized in Other non-operating income (expense), net, in our Statements of Operations for the three and six months ended June 30, 2018 and 2017, in connection with derivatives not designated as cash flow hedges:
|
|
|
Three Months Ended June 30, |
|
|
Six Months Ended June 30, |
|
||||||||||
|
|
|
2018 |
|
|
2017 |
|
|
2018 |
|
|
2017 |
|
||||
|
|
|
(In millions) |
|
|||||||||||||
|
Foreign currency hedges |
|
$ |
(10 |
) |
|
$ |
- |
|
|
$ |
(10 |
) |
|
$ |
- |
|
During the three months ended June 30, 2018, we recognized an income tax benefit of $84 million (effective tax rate of 215.4%), compared to tax expense of $23 million (effective tax rate of 38.3%) for the second quarter of 2017. Our provision for the second quarter of 2018 benefited from the release of a valuation allowance ($117 million) as a result of the taxable sale of low tax basis, pre-Combination McDermott assets to our new Technology entity that files its U.S. income taxes separately from pre-Combination McDermott. The pre-Combination McDermott U.S. net operating loss carryforwards utilized by this transaction previously had been offset by a valuation allowance. This benefit was partially offset by non-deductible transaction costs ($16 million), changes in other valuation allowances ($12 million) and state tax and other items ($15 million combined).
During the six months ended June 30, 2018, we recognized an income tax benefit of $63 million (effective tax rate of 393.8%), compared to tax expense of $34 million (effective tax rate of 35.4%) for the six months ended June 30, 2017. Our provision for the six months ended June 30, 2018 benefited from the tax effect ($117 million) of the sale described above, partially offset by non-deductible transaction costs ($16 million), changes in valuation allowances ($19 million) and state tax and other items ($15 million combined).
For the three-months ended June 30, 2018, the pre-Combination McDermott operations continued to utilize the discrete-period method to compute its interim tax provision, due to significant variations in the relationship between income tax expense and pre-tax accounting income or loss; consequently, the actual effective rate for the interim period is reported. The discrete-period method is applied when the application of the estimated annual effective tax rate is impractical, because it is not possible to reliably estimate the annual effective tax rate. The pre-Combination CB&I operations used the estimated annual effective tax rate approach to calculate its interim tax provision related to ordinary income and continued to use this method for the three months ended June 30, 2018. We are currently assessing the timeframe and process to implement an estimated annual effective tax rate approach on a combined company basis.
|
|
34 |
|
NOTES TO THE CONDENSED CONSOLIDATED FINANCIAL STATEMENTS (UNAUDITED)
Due to the impact of ongoing tax losses in the U.S. and the corresponding valuation allowance on our U.S. net deferred tax asset position, the new provisions from the Tax Reform Act taking effect in 2018 are not expected to have a material impact on our 2018 tax position. See Note 2, Basis of Presentation and Significant Accounting Policies, for further discussion.
As a result of the Combination, our unrecognized tax benefits increased $17 million during the second quarter of 2018. We do not anticipate significant changes to this balance in the next twelve months.
NOTE 18—STOCKHOLDERS’ EQUITY AND EQUITY-BASED INCENTIVE PLANS
Stockholders’ Equity
On May 2, 2018, stockholders of McDermott approved an amendment to McDermott’s Amended and Restated Articles of Incorporation to effect a three-to-one reverse stock split of McDermott shares of common stock with par value of $1.00 per share, which became effective May 9, 2018. All comparable periods presented have been retrospectively revised to reflect this change.
Shares Outstanding and Treasury Shares―The changes in the number of shares outstanding and treasury shares held by the Company for the six months ended June 30, 2018 and 2017 are as follows (in millions):
|
|
|
Six Months Ended June 30, |
|
|||||
|
|
|
2018 |
|
|
2017 |
|
||
|
Shares outstanding |
|
|
|
|
|
|
|
|
|
Beginning balance |
|
|
95 |
|
|
|
80 |
|
|
Common stock issued |
|
|
2 |
|
|
|
15 |
|
|
Shares issued in the Combination (Note 3, Business Combination) |
|
|
85 |
|
|
|
- |
|
|
Purchase of common stock |
|
|
(1 |
) |
|
|
- |
|
|
Ending balance |
|
|
181 |
|
|
|
95 |
|
|
|
|
|
|
|
|
|
|
|
|
Shares held as treasury shares |
|
|
|
|
|
|
|
|
|
Beginning balance |
|
|
3 |
|
|
|
3 |
|
|
Purchase of common stock |
|
|
1 |
|
|
|
- |
|
|
Retirement of common stock |
|
|
(1 |
) |
|
|
- |
|
|
Ending balance |
|
|
3 |
|
|
|
3 |
|
|
|
|
|
|
|
|
|
|
|
|
Ordinary shares issued at the end of the period |
|
|
183 |
|
|
|
98 |
|
Combination—As discussed in Note 3, Business Combination, we issued 84.5 million shares of McDermott common stock to the former CB&I shareholders. Additionally, effective as of the Combination Date, unvested and unexercised stock-settled equity-based awards (which included 2.1 million restricted stock units and 0.1 million stock options) relating to shares of CB&I’s common stock were canceled and converted into comparable McDermott stock-settled awards with generally the same terms and conditions as those prior to the Combination Date. The restricted stock units generally vest over a period ranging from three to four years from the original grant date.
Stock-Based Compensation Expense―During the three months ended June 30, 2018 and 2017, we recognized $9 million and $7 million, respectively, of stock-based compensation expense, and during the six months ended June 30, 2018 and 2017, we recognized $15 million and $12 million, respectively, primarily within SG&A in our Statements of Operations. In addition, we recognized $26 million of expense in the second quarter of 2018 as a result of accelerated vesting for employees terminated in connection with the Combination, which was recorded within Restructuring and integration costs in our Statements of Operations.
|
|
35 |
|
NOTES TO THE CONDENSED CONSOLIDATED FINANCIAL STATEMENTS (UNAUDITED)
The components of AOCI included in stockholders’ equity are as follows:
|
|
|
June 30, 2018 |
|
|
December 31, 2017 |
|
||
|
|
|
(In millions) |
|
|||||
|
Foreign currency translation adjustments ("CTA") |
|
$ |
(61 |
) |
|
$ |
(49 |
) |
|
Net unrealized loss on derivative financial instruments |
|
|
(14 |
) |
|
|
(2 |
) |
|
Accumulated other comprehensive loss |
|
$ |
(75 |
) |
|
$ |
(51 |
) |
The following table presents the components of AOCI and the amounts that were reclassified during the periods indicated:
|
|
|
Foreign currency translation adjustments |
|
|
Gain (loss) on derivative (1) |
|
|
TOTAL |
|
|||
|
|
|
(In millions) |
|
|||||||||
|
For the Six Months Ended June 30, 2018 |
|
|
|
|
|
|
|
|
|
|
|
|
|
Balance at January 1, 2018 |
|
$ |
(49 |
) |
|
$ |
(2 |
) |
|
|
(51 |
) |
|
Other comprehensive income before reclassification |
|
|
(12 |
) |
|
|
(15 |
) |
|
|
(27 |
) |
|
Amounts reclassified from AOCI (2) |
|
|
- |
|
|
|
3 |
|
|
|
3 |
|
|
Net current period other comprehensive income |
|
|
(12 |
) |
|
|
(12 |
) |
|
|
(24 |
) |
|
Balance at June 30, 2018 |
|
$ |
(61 |
) |
|
$ |
(14 |
) |
|
$ |
(75 |
) |
|
|
|
|
|
|
|
|
|
|
|
|
|
|
|
For the Six Months Ended June 30, 2017 |
|
|
|
|
|
|
|
|
|
|
|
|
|
Balance at January 1, 2017 |
|
$ |
(42 |
) |
|
$ |
(25 |
) |
|
$ |
(67 |
) |
|
Other comprehensive income before reclassification |
|
|
- |
|
|
|
10 |
|
|
|
10 |
|
|
Acquisition of NCI |
|
|
- |
|
|
|
2 |
|
|
|
2 |
|
|
Amounts reclassified from AOCI (2) |
|
|
- |
|
|
|
(1 |
) |
|
|
(1 |
) |
|
Net current period other comprehensive income |
|
|
- |
|
|
|
11 |
|
|
|
11 |
|
|
Balance at June 30, 2017 |
|
$ |
(42 |
) |
|
$ |
(14 |
) |
|
$ |
(56 |
) |
|
(1) |
Refer to Note 16, Derivative Financial Instruments for additional details. |
|
(2) |
Amounts are net of tax, which was not material for the three- and six-month periods ended June 30, 2018 and 2017. |
On May 2, 2018, stockholders of McDermott approved an amendment to McDermott’s Amended and Restated Articles of Incorporation to effect a three-to-one reverse stock split of McDermott shares of common stock (par value of $1.00 per share), which became effective May 9, 2018. All comparable periods presented have been retrospectively revised to reflect this change.
|
|
36 |
|
NOTES TO THE CONDENSED CONSOLIDATED FINANCIAL STATEMENTS (UNAUDITED)
The following table sets forth the computation of basic and diluted earnings per common share.
|
|
Three Months Ended June 30, |
|
|
Six Months Ended June 30, |
|
||||||||||
|
|
2018 |
|
|
2017 |
|
|
2018 |
|
|
2017 |
|
||||
|
|
(In millions, except per share amounts) |
|
|||||||||||||
|
Net income attributable to McDermott |
$ |
47 |
|
|
$ |
36 |
|
|
$ |
82 |
|
|
$ |
58 |
|
|
|
|
|
|
|
|
|
|
|
|
|
|
|
|
|
|
|
Weighted average common stock (basic) |
|
144 |
|
|
|
94 |
|
|
|
120 |
|
|
|
87 |
|
|
Effect of dilutive securities: |
|
|
|
|
|
|
|
|
|
|
|
|
|
|
|
|
Tangible equity units |
|
- |
|
|
|
- |
|
|
|
- |
|
|
|
6 |
|
|
Stock options, restricted stock and restricted stock units |
|
- |
|
|
|
- |
|
|
|
- |
|
|
|
1 |
|
|
Potential dilutive common stock |
|
144 |
|
|
|
94 |
|
|
|
120 |
|
|
|
94 |
|
|
|
|
|
|
|
|
|
|
|
|
|
|
|
|
|
|
|
Net income per share attributable to McDermott |
|
|
|
|
|
|
|
|
|
|
|
|
|
|
|
|
Basic: |
$ |
0.33 |
|
|
$ |
0.38 |
|
|
$ |
0.68 |
|
|
$ |
0.67 |
|
|
Diluted: |
$ |
0.33 |
|
|
$ |
0.38 |
|
|
$ |
0.68 |
|
|
$ |
0.62 |
|
Approximately 0.5 million shares underlying outstanding stock-based awards for the three and six months ended June 30, 2018, and approximately 0.6 million shares underlying outstanding stock-based awards for the three and six months ended June 30, 2017, were excluded from the computation of diluted earnings per share during those periods because the exercise price of those awards was greater than the average market price of our common stock, and the inclusion of such shares would have been antidilutive.
NOTE 20—COMMITMENTS AND CONTINGENCIES
Investigations and Litigation
General—Due to the nature of our business, we and our affiliates are, from time to time, involved in litigation or subject to disputes, governmental investigations or claims related to our business activities, including, among other things:
|
|
• |
performance or warranty-related matters under our customer and supplier contracts and other business arrangements; and |
|
|
• |
workers’ compensation claims, Jones Act claims, occupational hazard claims, premises liability claims and other claims. |
Based upon our prior experience, we do not expect that any of these other litigation proceedings, disputes, investigations and claims will have a material adverse effect on our consolidated financial condition, results of operations or cash flows; however, because of the inherent uncertainty of litigation and other dispute resolution proceedings and, in some cases, the availability and amount of potentially applicable insurance, we can provide no assurance the resolution of any particular claim or proceeding to which we are a party will not have a material effect on our consolidated financial condition, results of operations or cash flows for the fiscal period in which that resolution occurs.
Combination Related Lawsuits—In January, February and March 2018, five shareholders of CB&I filed separate lawsuits under the federal securities laws in the United States District Court for the Southern District of Texas challenging the accuracy of the disclosures made in the registration statement we and a subsidiary of CB&I filed in connection with the Combination (the “Registration Statement”). The cases are captioned (1) McIntyre v. Chicago Bridge & Iron Company N.V., et al., Case No. 4:18-cv-00273 (S.D. Tex.) (the “McIntyre Action”); (2) The George Leon Family Trust v. Chicago Bridge & Iron Company N.V., et al., Case No. 4:18-cv-00314 (S.D. Tex.) (the “Leon Action”); (3) Maresh v. Chicago Bridge & Iron Company N.V., et al., Case No. 4:18-cv-00498 (S.D. Tex.) (the “Maresh Action”); (4) Patel v. Chicago Bridge & Iron Co. N.V., et al., Case No. 4:18-cv-00550 (S.D. Tex.) (the “Patel Action”); and (5) Judd v. Chicago Bridge& Iron Co. N.V., et. al., Case No. 4:18-cv-00799 (S.D. Tex.) (the “Judd Action”). The McIntyre Action, Leon Action, Maresh Action and Judd Action are asserted on behalf of putative classes of CB&I’s public shareholders, while the Patel Action is brought only on behalf of the named plaintiff.
|
|
37 |
|
NOTES TO THE CONDENSED CONSOLIDATED FINANCIAL STATEMENTS (UNAUDITED)
All five actions allege violations of Section 14(a) and 20(a) of the Securities Exchange Act of 1934, as amended (the “Exchange Act”), and Rule 14a-9 promulgated thereunder based on various alleged omissions of material information from the Registration Statement.
|
|
• |
The McIntyre Action names as defendants CB&I, each of CB&I’s directors individually, and certain current and former CB&I officers and employees individually. It seeks to enjoin the Combination, an award of costs and attorneys’ and expert fees, and damages. |
|
|
• |
The Leon Action names as defendants CB&I, certain subsidiaries of CB&I and McDermott that are parties to the Combination Agreement, each of CB&I’s directors, individually, and McDermott as an alleged control person of CB&I. The Leon Action seeks to enjoin the Combination (or, in the alternative, rescission or an award for rescissory damages in the event the Combination is completed), to compel CB&I to issue revised disclosures, and an award of costs and attorneys’ and expert fees. |
|
|
• |
The Maresh Action, which was originally filed in Delaware and voluntarily dismissed without prejudice on February 13, 2018, was re-filed in Texas and names as defendants CB&I, each of CB&I’s directors, individually, and certain current and former CB&I officers and employees, individually. The Maresh Action seeks to enjoin the Combination (or, in the alternative, an award for rescissory damages in the event the Combination is completed) and an award of costs and attorneys’ and expert fees. |
|
|
• |
The Patel Action names as defendants CB&I and each of CB&I’s directors individually and seeks to enjoin the Combination, an award of costs and attorneys’ and expert fees. |
|
|
• |
The Judd Action names as defendants CB&I and each of CB&I’s directors individually and seeks to enjoin the Combination or, in the alternative, in the event the Combination is consummated, to recover rescissory damages from the directors individually, together with an award of costs and attorneys’ and expert fees. |
The Court consolidated all of the actions. The consolidation order appointed the plaintiff in the Leon Action and the plaintiff’s counsel in the Leon Action as the interim lead plaintiff and the interim lead plaintiff’s counsel, respectively. On March 9, 2018, the interim lead plaintiff filed a consolidated amended complaint. On March 16, 2018, defendants moved to dismiss the consolidated amended complaint and interim lead plaintiff filed a motion for preliminary injunction. On March 29, 2018, interim lead plaintiff withdrew its motion for a preliminary injunction. Motions for permanent lead plaintiff status were due on April 2, 2018, and only interim lead plaintiff filed such a motion. On April 5, 2018, interim lead plaintiff sought an extension of time to respond to defendants’ motion to dismiss until after such time as a permanent lead plaintiff is appointed. That motion was granted.
We believe the substantive allegations contained in the complaints are without merit, and we intend to defend against the claims made against us vigorously.
Project Arbitration Matters—We are in arbitration (governed by the arbitration rules of the International Chamber of Commerce) with the customer for one of our previously completed large cost-reimbursable projects, in which the customer is alleging cost overruns and consequential damages on the project. We have a counterclaim against the customer for unpaid receivables. We do not believe a risk of material loss is probable related to this matter, and accordingly, our reserves were not significant at June 30, 2018. While it is possible that a loss may be incurred, we are unable to estimate the range of potential loss, if any.
In addition, we are in arbitration (governed by the arbitration rules of the United Nations Commission on International Trade Law) with the customer for one of our previously completed consolidated joint venture projects, regarding differing interpretations of the contract related to reimbursable billings. We do not believe a risk of material loss is probable related to this matter, and accordingly, no amounts have been accrued. While it is possible that a loss may be incurred, we are unable to estimate the range of potential loss, if any.
Dispute Related to Sale of Nuclear Operations—On December 31, 2015, we sold our Nuclear Operations to Westinghouse Electric Company LLC (“WEC”). In connection with the transaction, a post-closing purchase price adjustment mechanism was negotiated between CB&I and WEC to account for any difference between target working capital and actual working capital as finally determined pursuant to the terms of the purchase agreement. On April 28, 2016, WEC delivered to us a purported closing statement that estimated closing working capital was negative $976.5 million, which was $2.1 billion less than the target working capital amount. In contrast, we calculated closing working capital to be $1.6 billion, which was $427.8 million greater than the target working capital amount. On July 21, 2016, we filed a complaint against WEC in the Court of Chancery in the State of Delaware seeking a declaration
|
|
38 |
|
NOTES TO THE CONDENSED CONSOLIDATED FINANCIAL STATEMENTS (UNAUDITED)
that WEC has no remedy for the vast majority of its claims, and we requested an injunction barring WEC from bringing such claims. On December 2, 2016, the Court of Chancery granted WEC’s motion for judgment on the pleadings and dismissed our complaint, stating that the dispute should follow the dispute resolution process set forth in the purchase agreement, which includes the use of an independent auditor to resolve the working capital dispute. We appealed that ruling to the Delaware Supreme Court. Due to WEC’s bankruptcy filing on March 29, 2017, all claim resolution proceedings were automatically stayed pursuant to the Bankruptcy Code. At the parties’ request, the Bankruptcy Court lifted the automatic stay to permit the appeal and dispute resolution process to continue. Oral argument before the Delaware Supreme Court was held on May 3, 2017, and on June 27, 2017, the Delaware Supreme Court overturned the decision of the Court of Chancery and instructed the Court of Chancery to issue an order enjoining WEC from submitting certain claims to the independent auditor. The parties have discussed those matters still subject to the dispute resolution process and the selection of a new independent auditor to replace the previous auditor, who had resigned. We do not believe a risk of material loss is probable related to this matter, and, accordingly, no amounts have been accrued. While it is possible that a loss may be incurred, we are unable to estimate the range of potential loss, if any. We believe the Delaware Supreme Court ruling significantly improved our position on this matter and intend to continue pursuing our rights under the purchase agreement.
Asbestos Litigation—We are a defendant in numerous lawsuits wherein plaintiffs allege exposure to asbestos at various locations. We have never been a manufacturer, distributor or supplier of asbestos products. We review and defend each case on its own merits and make accruals based on the probability of loss and best estimates of potential loss. We do not believe any unresolved asserted claim will have a material adverse effect on our future results of operations, financial position or cash flow. With respect to unasserted asbestos claims, we cannot identify a population of potential claimants with sufficient certainty to determine the probability of loss or estimate of future loss. While we continue to pursue recovery for recognized and unrecognized contingent losses through insurance, indemnification arrangements and other sources, we are unable to quantify the amount that we may recover because of the variability in coverage amounts, limitations and deductibles or the viability of carriers, with respect to our insurance policies for the years in question.
Environmental Matters
We have been identified as a potentially responsible party at various cleanup sites under the Comprehensive Environmental Response, Compensation, and Liability Act of 1980, as amended (“CERCLA”). CERCLA and other environmental laws can impose liability for the entire cost of cleanup on any of the potentially responsible parties, regardless of fault or the lawfulness of the original conduct.
In connection with the historical operation of our facilities, including those associated with acquired operations, substances which currently are or might be considered hazardous were used or disposed of at some sites that will or may require us to make expenditures for remediation. In addition, we have agreed to indemnify parties from whom we have purchased or to whom we have sold facilities for certain environmental liabilities arising from acts occurring before the dates those facilities were transferred. Generally, however, where there are multiple responsible parties, a final allocation of costs is made based on the amount and type of wastes disposed of by each party and the number of financially viable parties, although this may not be the case with respect to any particular site. We have not been determined to be a major contributor of waste to any of these sites. On the basis of our relative contribution of waste to each site, we expect our share of the ultimate liability for the various sites will not have a material adverse effect on our consolidated financial condition, results of operations or cash flows in any given year.
We believe we are in compliance, in all material respects, with applicable environmental laws and regulations and maintain insurance coverage to mitigate our exposure to environmental liabilities. We do not anticipate we will incur material capital expenditures for environmental controls or for the investigation or remediation of environmental conditions during the remainder of 2018 or 2019. As of June 30, 2018, we had no environmental reserve recorded.
Asset Retirement Obligations
At some sites, we are contractually obligated to decommission our fabrication facilities upon site exit. Currently, we are unable to estimate any asset retirement obligations (“AROs”) due to the indeterminate life of our fabrication facilities. We regularly review the optimal future alternatives for our facilities. Any decision to retire one or more facilities will result in recording the present value of such obligations.
AROs would be recorded at the present value of the estimated costs to retire the asset at the time the obligation is incurred. As of June 30, 2018, we had no AROs recorded.
|
|
39 |
|
NOTES TO THE CONDENSED CONSOLIDATED FINANCIAL STATEMENTS (UNAUDITED)
Contracts Containing Liquidated Damages Provisions
Some of our contracts contain provisions that require us to pay liquidated damages if we are responsible for the failure to meet specified contractual milestone dates and the applicable customer asserts a claim under those provisions. Those contracts define the conditions under which our customers may make claims against us for liquidated damages. In many cases in which we have historically had potential exposure for liquidated damages, such damages ultimately were not asserted by our customers. As of June 30, 2018, we determined that we had approximately $320 million of potential liquidated damages exposure, based on performance under contracts to date, and included $66 million as a reduction in transaction prices related to such exposure. We believe we will be successful in obtaining schedule extensions or other customer-agreed changes that should resolve the potential for the liquidated damages where we have not made a reduction in transaction prices. However, we may not achieve relief on some or all of the issues involved and, as a result, could be subject to liquidated damages being imposed on us in the future.
We disclose the results of each of our reportable segments in accordance with ASC 280, Segment Reporting. Each of the reportable segments is separately managed by a senior executive who is a member of our Executive Committee (“EXCOM”). Our EXCOM is led by our Chief Executive Officer, who is the chief operating decision maker (“CODM”). Discrete financial information is available for each of the segments, and the EXCOM uses the operating results of each of the reportable segments for performance evaluation and resource allocation.
Upon completion of the Combination, during the second quarter of 2018, we reorganized our operations around five operating segments. This reorganization is intended to better serve our global clients, leverage our workforce, help streamline operations, and provide enhanced growth opportunities. Our five operating groups are: NCSA; EARC; MENA; APAC; and Technology. The segment information for the prior periods presented has been recast to conform to the current presentation. We also report certain corporate and other non-operating activities under the heading “Corporate and Other.” Corporate and Other primarily reflects corporate expenses, certain centrally managed initiatives (such as restructuring charges), impairments, year-end mark-to-market pension actuarial gains and losses, costs not attributable to a particular reportable segment and unallocated direct operating expenses associated with the underutilization of vessels, fabrication facilities and engineering resources.
|
|
40 |
|
NOTES TO THE CONDENSED CONSOLIDATED FINANCIAL STATEMENTS (UNAUDITED)
Summarized financial information for the three and six months ended June 30, 2018 and 2017 is as follows:
|
|
|
Three months ended June 30, |
|
|
Six months ended June 30, |
|
||||||||||
|
|
|
2018 |
|
|
2017 |
|
|
2018 |
|
|
2017 |
|
||||
|
|
|
(In millions) |
|
|||||||||||||
|
Revenues (1) : |
|
|
|
|
|
|
|
|
|
|
|
|
|
|
|
|
|
NCSA |
|
$ |
995 |
|
|
$ |
42 |
|
|
$ |
1,093 |
|
|
$ |
70 |
|
|
EARC |
|
|
58 |
|
|
|
2 |
|
|
|
74 |
|
|
|
18 |
|
|
MENA |
|
|
469 |
|
|
|
557 |
|
|
|
814 |
|
|
|
867 |
|
|
APAC |
|
|
108 |
|
|
|
188 |
|
|
|
257 |
|
|
|
353 |
|
|
Technology |
|
|
105 |
|
|
|
- |
|
|
|
105 |
|
|
|
- |
|
|
Total revenues |
|
$ |
1,735 |
|
|
$ |
789 |
|
|
$ |
2,343 |
|
|
$ |
1,308 |
|
|
|
|
|
|
|
|
|
|
|
|
|
|
|
|
|
|
|
|
Operating income |
|
|
|
|
|
|
|
|
|
|
|
|
|
|
|
|
|
Segment operating income: |
|
|
|
|
|
|
|
|
|
|
|
|
|
|
|
|
|
NCSA |
|
$ |
49 |
|
|
$ |
(7 |
) |
|
$ |
51 |
|
|
$ |
(5 |
) |
|
EARC |
|
|
(8 |
) |
|
|
(5 |
) |
|
|
(11 |
) |
|
|
(3 |
) |
|
MENA |
|
|
97 |
|
|
|
118 |
|
|
|
167 |
|
|
|
182 |
|
|
APAC |
|
|
43 |
|
|
|
31 |
|
|
|
116 |
|
|
|
53 |
|
|
Technology |
|
|
25 |
|
|
|
- |
|
|
|
25 |
|
|
|
- |
|
|
Total segment operating income |
|
|
206 |
|
|
|
137 |
|
|
|
348 |
|
|
|
227 |
|
|
Corporate (2) |
|
|
(157 |
) |
|
|
(52 |
) |
|
|
(235 |
) |
|
|
(90 |
) |
|
Total operating income |
|
|
49 |
|
|
|
85 |
|
|
|
113 |
|
|
|
137 |
|
|
|
|
|
|
|
|
|
|
|
|
|
|
|
|
|
|
|
|
Depreciation and amortization: |
|
|
|
|
|
|
|
|
|
|
|
|
|
|
|
|
|
NCSA |
|
$ |
9 |
|
|
$ |
7 |
|
|
$ |
16 |
|
|
$ |
11 |
|
|
EARC |
|
|
3 |
|
|
|
- |
|
|
|
3 |
|
|
|
- |
|
|
MENA |
|
|
10 |
|
|
|
14 |
|
|
|
16 |
|
|
|
22 |
|
|
APAC |
|
|
2 |
|
|
|
5 |
|
|
|
9 |
|
|
|
13 |
|
|
Technology |
|
|
14 |
|
|
|
- |
|
|
|
14 |
|
|
|
- |
|
|
Corporate |
|
|
20 |
|
|
|
2 |
|
|
|
22 |
|
|
|
4 |
|
|
Depreciation and amortization |
|
$ |
58 |
|
|
$ |
28 |
|
|
$ |
80 |
|
|
$ |
50 |
|
|
|
|
|
|
|
|
|
|
|
|
|
|
|
|
|
|
|
|
Capital expenditures (3): |
|
|
|
|
|
|
|
|
|
|
|
|
|
|
|
|
|
NCSA |
|
$ |
- |
|
|
$ |
10 |
|
|
$ |
2 |
|
|
$ |
15 |
|
|
EARC |
|
|
- |
|
|
|
- |
|
|
|
- |
|
|
|
- |
|
|
MENA |
|
|
4 |
|
|
|
5 |
|
|
|
7 |
|
|
|
11 |
|
|
APAC |
|
|
2 |
|
|
|
2 |
|
|
|
5 |
|
|
|
6 |
|
|
Technology |
|
|
- |
|
|
|
- |
|
|
|
- |
|
|
|
|
|
|
Corporate (4) |
|
|
18 |
|
|
|
1 |
|
|
|
29 |
|
|
|
49 |
|
|
Total Capital expenditures |
|
$ |
24 |
|
|
$ |
18 |
|
|
$ |
43 |
|
|
$ |
81 |
|
|
(1) |
Intercompany transactions were not significant for the three and six months ended June 30, 2018 and 2017, respectively. |
|
(2) |
Corporate operating results for the three and six months ended June 30, 2018 include $63 million and $75 million of restructuring and integration costs, respectively. See Note 11, Restructuring and Integration Costs, for further discussion. Corporate operating results for the three and six months ended June 30, 2018 also include $37 million and $40 million of transaction costs, respectively. See Note 3, Business Combination, for further discussion. Corporate operating results for the three and six months ended June 30, 2017 includes approximately $3 million of gain on sale of assets. |
|
(3) |
Liabilities associated with assets acquired during the first six months of 2018 and 2017 were $14 million and $3 million, respectively. |
|
(4) |
Corporate and other capital expenditures in the first half of 2017 include the purchase of the Amazon, a pipelay and construction vessel. Following the purchase, we sold this vessel to an unrelated party and simultaneously entered into an 11-year bareboat charter agreement. |
|
|
41 |
|
NOTES TO THE CONDENSED CONSOLIDATED FINANCIAL STATEMENTS (UNAUDITED)
Our assets by segment at June 30, 2018 and December 31, 2017 were as follows:
|
|
|
June 30, 2018 |
|
|
December 31, 2017 |
|
||
|
|
|
(In millions) |
|
|||||
|
Segment assets: |
|
|
|
|
|
|
|
|
|
NCSA |
|
$ |
2,080 |
|
|
$ |
917 |
|
|
EARC |
|
|
641 |
|
|
|
3 |
|
|
MENA |
|
|
1,494 |
|
|
|
1,022 |
|
|
APAC |
|
|
1,158 |
|
|
|
887 |
|
|
Technology |
|
|
944 |
|
|
|
- |
|
|
Corporate |
|
|
146 |
|
|
|
394 |
|
|
Total tangible assets |
|
|
6,463 |
|
|
|
3,223 |
|
|
Goodwill |
|
|
3,926 |
|
|
|
- |
|
|
Other intangibles, net |
|
|
1,039 |
|
|
|
- |
|
|
Total assets (1) |
|
$ |
11,428 |
|
|
$ |
3,223 |
|
|
(1) |
Our marine vessels are included in the area in which they were located as of the reporting date. |
On July 27, 2018, we entered into agreements (the “Amazon Modification Agreements”) providing for certain modifications to the Amazon vessel and related financing and amended bareboat charter arrangements. The Amazon, a pipelay and construction vessel, was purchased by McDermott in February 2017, sold to an unrelated third party (the “Amazon Owner”) and leased back under a long-term bareboat charter that gives us the right to use the vessel. The total cost of the modifications, including project management and other fees and expenses, is expected to be in the range of approximately $260 million to $290 million. The Amazon Owner is expected to fund the cost of the modifications primarily through an export credit-backed senior loan provided by a group of lenders, supplemented by expected direct capital expenditure by McDermott of approximately $57.5 million over the course of the modifications, of which approximately $18.8 million had been incurred as at June 30, 2018. We will pay for the modification project through an increased bareboat charter rate over an extended 12-year term once the modifications are complete. For additional information about the modifications and the amended bareboat charter terms, see Part II – Other Information – Item 5.
|
|
42 |
|
MANAGEMENT’S DISCUSSION AND ANALYSIS OF FINANCIAL CONDITION AND RESULTS OF OPERATIONS
ITEM 2. MANAGEMENT’S DISCUSSION AND ANALYSIS OF FINANCIAL CONDITION AND RESULTS OF OPERATIONS
In this quarterly report on Form 10-Q, unless the context otherwise indicates, “McDermott”, “MDR”, “we,” “our”, “us” or the “Company” mean McDermott International, Inc. and its consolidated subsidiaries.
CAUTIONARY STATEMENT CONCERNING FORWARD-LOOKING STATEMENTS
We are including the following discussion to inform our existing and potential security holders generally of some of the risks and uncertainties that can affect our company and to take advantage of the “safe harbor” protection for forward-looking statements that applicable federal securities law affords. This information should be read in conjunction with the unaudited Consolidated Financial Statements and the Notes thereto included in Item 1 of this report and the audited Consolidated Financial Statements and the related Notes and Item 7 “Management’s Discussion and Analysis of Financial Condition and Results of Operations” included in our Current Report on Form 8-K filed with the U.S. Securities and Exchange Commission (the “SEC”) on July 31, 2018 (the “July 31 Form 8-K”).
From time to time, our management or persons acting on our behalf make “forward-looking statements,” within the meaning of the Private Securities Litigation Reform Act of 1995, to inform existing and potential security holders about our company. These statements may include projections and estimates concerning the scope, execution, timing and success of specific projects and our future RPOs, revenues, income and capital spending. Forward-looking statements are generally accompanied by words such as “achieve,” “anticipate,” “believe,” “continue,” “could,” “estimate,” “expect,” “forecast,” “goal,” “intend,” “may,” “might,” “plan,” “potential,” “predict,” “project,” “seek,” “should,” “strategy” or other words that convey the uncertainty of future events or outcomes. Sometimes we will specifically describe a statement as being a forward-looking statement and refer to this cautionary statement.
In addition, various statements in this report, including those that express a belief, expectation or intention, as well as those that are not statements of historical fact, are forward-looking statements. Those forward-looking statements appear in the Notes to our Condensed Consolidated Financial Statements (the “Financial Statements”) in Item 1 of this report, in this Management’s Discussion and Analysis of Financial Condition and Results of Operations, Legal Proceedings in Item 1 of Part II of this report and elsewhere in this report.
These forward-looking statements include, but are not limited to, statements that relate to, or statements that are subject to risks, contingencies or uncertainties that relate to:
|
|
• |
expectations regarding our recently completed business combination with Chicago Bridge & Iron Company N.V. (“CB&I”) described in Note 3, Business Combination, to the Financial Statements included in this report and the anticipated benefits of combining CB&I’s business with McDermott’s business; |
|
|
• |
future levels of revenues, operating margins, operating income, cash flows, net income or earnings per share; |
|
|
• |
the outcome of project awards and scope, execution and timing of specific projects, including timing to complete and cost to complete these projects; |
|
|
• |
future project activities, including the commencement and subsequent timing of marine or installation campaigns on specific projects, and the ability of projects to generate sufficient revenues to cover our fixed costs; |
|
|
• |
estimates of revenue over time and contract profits or losses; |
|
|
• |
anticipated levels of demand for our products and services; |
|
|
• |
global demand for oil and gas and fundamentals of the oil and gas industry; |
|
|
• |
expectations regarding offshore development of oil and gas; |
|
|
• |
market outlook for the engineering, procurement, construction and installation (“EPCI”) market; |
|
|
• |
expectations regarding cash flows from operating activities; |
|
|
• |
expectations regarding remaining performance obligations; |
|
|
• |
future levels of capital, environmental or maintenance expenditures; |
|
|
43 |
|
MANAGEMENT’S DISCUSSION AND ANALYSIS OF FINANCIAL CONDITION AND RESULTS OF OPERATIONS
|
|
• |
the adequacy of our sources of liquidity and capital resources; |
|
|
• |
interest expense; |
|
|
• |
the effectiveness of our derivative contracts in mitigating foreign currency risk; |
|
|
• |
results of our capital investment program; |
|
|
• |
expectations regarding the acquisition or divestiture of assets; |
|
|
• |
the impact of U.S. tax reform on our tax position; |
|
|
• |
establishing our parent company’s tax residence in the United Kingdom (“U.K”); |
|
|
• |
the potential effects of judicial or other proceedings on our business, financial condition, results of operations and cash flows; and |
|
|
• |
the anticipated effects of actions of third parties such as competitors, or federal, foreign, state or local regulatory authorities, or plaintiffs in litigation. |
These forward-looking statements speak only as of the date of report; we disclaim any obligation to update these statements unless required by securities law, and we caution you not to rely on them unduly. We have based these forward-looking statements on our current expectations and assumptions about future events. While our management considers these expectations and assumptions to be reasonable, they are inherently subject to significant business, economic, competitive, regulatory and other risks, contingencies and uncertainties, most of which are difficult to predict and many of which are beyond our control. These risks, contingencies and uncertainties relate to, among other matters, the following:
|
|
• |
general economic and business conditions and industry trends; |
|
|
• |
general developments in the industries in which we are involved; |
|
|
• |
the volatility of oil and gas prices; |
|
|
• |
decisions about capital investment to be made by oil and gas companies and other participants in the energy and natural resource industries, demand from which is the largest component of our revenues; |
|
|
• |
other factors affecting future levels of demand, including investments across the natural gas value chain, including liquefied natural gas (“LNG”) and petrochemicals, investments in power and petrochemical facilities and investments in various types of facilities that require storage structures and pre-fabricated pipe; |
|
|
• |
the highly competitive nature of the businesses in which we are engaged; |
|
|
• |
uncertainties as to timing and funding of new contract awards; |
|
|
• |
our ability to appropriately bid, estimate and effectively perform projects on time, in accordance with the schedules established by the applicable contracts with customers; |
|
|
• |
changes in project design or schedule; |
|
|
• |
changes in scope or timing of work to be completed under contracts; |
|
|
• |
cost overruns on fixed-price or similar contracts or failure to receive timely or proper payments on cost-reimbursable contracts, whether as a result of improper estimates, performance, disputes or otherwise; |
|
|
• |
changes in the costs or availability of, or delivery schedule for, equipment, components, materials, labor or subcontractors; |
|
|
• |
risks associated with labor productivity; |
|
|
• |
cancellations of contracts, change orders and other modifications and related adjustments to RPOs and the resulting impact from using RPOs as an indicator of future revenues or earnings; |
|
|
• |
the collectability of amounts reflected in change orders and claims relating to work previously performed on contracts; |
|
|
• |
our ability to settle or negotiate unapproved change orders and claims and estimates regarding liquidated damages; |
|
|
• |
the capital investment required to construct new-build vessels and maintain and/or upgrade our existing fleet of vessels; |
|
|
44 |
|
MANAGEMENT’S DISCUSSION AND ANALYSIS OF FINANCIAL CONDITION AND RESULTS OF OPERATIONS
|
|
• |
the ability of our suppliers and subcontractors to deliver raw materials in sufficient quantities and/or perform in a timely manner; |
|
|
• |
volatility and uncertainty of the credit markets; |
|
|
• |
our ability to comply with covenants in our credit agreements and other debt instruments and the availability, terms and deployment of capital; |
|
|
• |
the unfunded liabilities of our pension and other post-retirement plans, which may negatively impact our liquidity and, depending upon future operations, may impact our ability to fund our pension obligations; |
|
|
• |
the continued availability of qualified personnel; |
|
|
• |
the operating risks normally incident to our lines of business, which could lead to increased costs and affect the quality, costs or availability of, or delivery schedule for, equipment, components, materials, labor or subcontractors and give rise to contractually imposed liquidated damages; |
|
|
• |
natural or man-caused disruptive events that could damage our facilities, equipment or our work-in-progress and cause us to incur losses and/or liabilities; |
|
|
• |
equipment failure; |
|
|
• |
changes in, or our failure or inability to comply with, government regulations; |
|
|
• |
adverse outcomes from legal and regulatory proceedings; |
|
|
• |
impact of potential regional, national and/or global requirements to significantly limit or reduce greenhouse gas and other emissions in the future; |
|
|
• |
changes in, and liabilities relating to, existing or future environmental regulatory matters; |
|
|
• |
changes in tax laws; |
|
|
• |
the continued competitiveness and availability of, and continued demand and legal protection for, our intellectual property assets or rights, including the ability of our patents or licensed technologies to perform as expected and to remain competitive, current, in demand, profitable and enforceable; |
|
|
• |
our ability to keep pace with rapid technological changes or innovations; |
|
|
• |
the risk that we may not be successful in updating and replacing current information technology and the risks associated with information technology systems interruptions and cybersecurity threats; |
|
|
• |
the consequences of significant changes in interest rates and currency exchange rates; |
|
|
• |
difficulties we may encounter in obtaining regulatory or other necessary approvals of any strategic transactions; |
|
|
• |
the risks associated with integrating acquired businesses and forming and operating joint ventures; |
|
|
• |
social, political and economic situations in countries where we do business; |
|
|
• |
the risks associated with our international operations, including risks relating to local content or similar requirements; |
|
|
• |
foreign currency risks and our ability to properly manage or hedge currency or similar risks; |
|
|
• |
interference from adverse weather or sea conditions; |
|
|
• |
the possibilities of war, other armed conflicts or terrorist attacks; |
|
|
• |
the effects of asserted and unasserted claims and the extent of available insurance coverages; |
|
|
• |
our ability to obtain surety bonds, letters of credit and new financing arrangements; |
|
|
• |
our ability to maintain builder’s risk, liability, property and other insurance in amounts and on terms we consider adequate and at rates that we consider economical; |
|
|
• |
the aggregated risks retained in our captive insurance subsidiaries; and |
|
|
• |
the impact of the loss of insurance rights as part of the Chapter 11 Bankruptcy settlement concluded in 2006 involving several of our former subsidiaries. |
|
|
45 |
|
MANAGEMENT’S DISCUSSION AND ANALYSIS OF FINANCIAL CONDITION AND RESULTS OF OPERATIONS
We believe the items we have outlined above are important factors that could cause estimates in our financial statements to differ materially from actual results and those expressed in a forward-looking statement made in this quarterly report or elsewhere by us or on our behalf. We have discussed many of these factors in more detail elsewhere in this report, including those mentioned under the caption “Risk Factors” in this report and in the 2017 Form 10-K. These factors are not necessarily all the factors that could affect us. Unpredictable or unanticipated factors we have not discussed in this report or the 2017 Form 10-K could also have material adverse effects on actual results of matters that are the subject of our forward-looking statements. We do not intend to update our description of important factors each time a potential important factor arises, except as required by applicable securities laws and regulations. We advise our security holders that they should (1) be aware that factors not referred to above could affect the accuracy of our forward-looking statements and (2) use caution and common sense when considering our forward-looking statements.
Overview, Business Segments and Results of Operations
Overview
On May 10, 2018 (the “Combination Date”), we completed our combination with CB&I (the “Combination”) (see Note 3, Business Combination to the accompanying condensed consolidated financial statements (the “Financial Statements”) for further discussion). We are now a fully integrated provider of EPCI and technology solutions to the energy industry and design and build end-to-end infrastructure and technology solutions, from the wellhead to the storage tank, to transport and transform oil and gas into a variety of products. Our customers include national, major integrated and other oil and gas companies as well as producers of petrochemicals and electric power. Our proprietary technologies, integrated expertise and comprehensive solutions are utilized for LNG, power, offshore and subsea, and downstream (includes downstream oil and gas processing facilities and licensed technologies and catalysts) energy projects around the world. We execute our contracts through a variety of methods, principally fixed-price, but also including cost reimbursable, cost-plus, day-rate and unit-rate basis or some combination of those methods. Contracts are awarded usually awarded through a competitive bid process.
Business Segments
Following completion of the Combination, during the second quarter of 2018, we reorganized our operations into five business segments. This reorganization is intended to better serve our global clients, leverage our workforce, help streamline operations and provide enhanced growth opportunities. Our five business segments, which represent our reportable segments are: North, Central & South America (“NCSA”); Europe, Africa, Russia & the Caspian (“EARC”); Middle East & North Africa (“MENA”); Asia Pacific (“APAC”); and Technology. The segment information presented for the prior periods has been recast to conform to the 2018 presentation. We also report certain corporate and other non-operating activities under the heading “Corporate and Other.” Corporate and Other primarily reflects costs that are not allocated to our segments.
|
|
• |
NCSA—Our NCSA segment designs, engineers and constructs upstream offshore oil & gas facilities, downstream oil & gas facilities, gas-fired power plants, LNG import and export terminals, atmospheric and refrigerated storage vessels and terminals, water storage and treatment facilities and pipe and module fabrication. The RPO composition by product offering were 40% Downstream, 29% LNG, 27% Power and 4% Offshore & Subsea. We anticipate future opportunities over the intermediate term are likely to be in the U.S. LNG and petrochemical markets. Our June 30, 2018 RPO distribution for this segment by contracting type was approximately 85% fixed-price and hybrid and 15% cost-reimbursable. |
|
|
• |
EARC―Our EARC segment designs, engineers and constructs upstream offshore oil & gas facilities, downstream oil & gas facilities, LNG import and export terminals, and atmospheric and refrigerated storage vessels and terminals. The RPO composition by product offering were 56% Offshore & Subsea and 44% Downstream and were primarily comprised of fixed-price contracts. We anticipate future opportunities over the intermediate term are likely to be in the downstream markets in Russia and upstream and LNG projects in Africa. |
|
|
• |
APAC—Our APAC segment designs, engineers and constructs upstream offshore oil & gas facilities and pipelines, refining and petrochemical facilities, hydrocarbon processing technology, LNG import and export terminals and atmospheric and refrigerated storage vessels and terminals. The RPO composition by product offering were 85% Offshore & Subsea and 15% Downstream and were primarily comprised of fixed-price contracts. We anticipate future opportunities over the intermediate term are likely to be in the Indian offshore market. |
|
|
46 |
|
MANAGEMENT’S DISCUSSION AND ANALYSIS OF FINANCIAL CONDITION AND RESULTS OF OPERATIONS
|
|
• |
Technology―Our Technology segment is a leading technology licensor of proprietary gas processing, refining, petrochemical and coal gasification technologies as well as a supplier of proprietary catalysts, equipment and related engineering services. These technologies are critical in the refining of crude oil into gasoline, diesel, jet fuel and lubes, the manufacturing of petrochemicals and polymers, as well as the gasification of coal into syngas. Technology also has a 50% owned unconsolidated joint venture that provides proprietary process technology licenses and associated engineering services and catalysts, primarily for the refining industry. Our June 30, 2018 RPO distribution for this segment was 100% Downstream and primarily comprised of fixed-price contracts. |
Acquired Loss Projects
In accounting for the acquisition of CB&I on May 10, 2018, we recorded the fair value of the CB&I balance sheet, including updated estimates on the acquired RPOs. The vast majority of the acquired portfolio did not require material changes to cost estimates. However, we did record changes in estimated costs on three loss projects, including $165 million on the Cameron LNG project, $23 million on the Calpine project and $33 million on the now-completed IPL gas power project. These changes in cost estimates did not have a direct impact on our net income for the three months ended June 30, 2018.
Results of Operations
Remaining Performance Obligations (“RPOs”)
RPOs represent the amount of revenues we expect to recognize in the future from our contract commitments on projects. RPOs include the entire expected revenue values for joint ventures we consolidate and our proportionate values for consortiums we proportionately consolidate. We do not include expected revenues of contracts related to unconsolidated joint ventures in our RPOs, except to the extent of any subcontract awards we receive from those joint ventures.
RPOs for each of our segments can consist of up to several hundred contracts. These contracts vary in size from less than one hundred thousand dollars in contract value to several billion dollars, with varying durations that can exceed five years. The timing of awards and differing types, sizes and durations of our contracts, combined with the geographic diversity and stages of completion of the associated projects, often results in fluctuations in our quarterly segment results as a percentage of total revenue. RPOs may not be indicative of future operating results, and projects in our RPOs may be cancelled, modified or otherwise altered by customers. We can provide no assurance as to the profitability of our contracts reflected in RPOs. It is possible that our estimates of profit could increase or decrease based on, among other things, changes in productivity, actual downtime and the resolution of change orders and claims with the customers.
The timing of our revenue recognition may be impacted by the contracting structure of our contracts. Under fixed-price contracts, we perform our services and execute our projects at an established price. Fixed-price contracts, and hybrid contracts with a more significant fixed-price component, tend to provide us with greater control over project schedule and the timing of when work is performed and costs are incurred, and, accordingly, when revenue is recognized. Under cost-reimbursable contracts, we generally perform our services in exchange for a price that consists of reimbursement of all customer-approved costs and a profit component, which is typically a fixed rate per hour, an overall fixed fee or a percentage of total reimbursable costs. Cost-reimbursable contracts, and hybrid contracts with a more significant cost-reimbursable component, generally provide our customers with greater influence over the timing of when we perform our work, and, accordingly, such contracts often result in less predictability with respect to the timing of revenue recognition. Our shorter-term contracts and services are generally provided on a cost-reimbursable, fixed-price or unit price basis.
Our RPOs by business segment as of June 30, 2018 and December 31, 2017 are as follows:
|
|
June 30, 2018 |
|
|
December 31, 2017 |
|
|
|
|
Change |
|
|||||||||||||||
|
|
(In approximate millions) |
|
|
|
|
|
|
|
|
|
|
|
|||||||||||||
|
NCSA |
$ |
5,181 |
|
|
|
51 |
% |
|
$ |
437 |
|
|
|
11 |
% |
|
|
|
$ |
4,744 |
|
|
|
1086 |
% |
|
EARC |
|
1,250 |
|
|
|
12 |
% |
|
|
732 |
|
|
|
19 |
% |
|
|
|
|
518 |
|
|
|
71 |
% |
|
MENA |
|
2,630 |
|
|
|
26 |
% |
|
|
2,249 |
|
|
|
58 |
% |
|
|
|
|
381 |
|
|
|
17 |
% |
|
APAC |
|
638 |
|
|
|
6 |
% |
|
|
483 |
|
|
|
12 |
% |
|
|
|
|
155 |
|
|
|
32 |
% |
|
Technology |
|
487 |
|
|
|
5 |
% |
|
|
- |
|
|
|
- |
|
|
|
|
|
487 |
|
|
|
NA |
|
|
Total |
$ |
10,186 |
|
|
|
100 |
% |
|
$ |
3,901 |
|
|
|
100 |
% |
|
|
|
$ |
6,285 |
|
|
|
161 |
% |
|
|
47 |
|
MANAGEMENT’S DISCUSSION AND ANALYSIS OF FINANCIAL CONDITION AND RESULTS OF OPERATIONS
|
(1) |
Certain contracts within our NCSA segment are dependent upon funding from the U.S. government, where funds are appropriated on a year-by-year basis, while contract performance may take more than one year. Approximately $280 million of our RPOs at June 30, 2018 for the operating group was for contractual commitments that are subject to future funding approval requirements. |
|
(2) |
Our RPOs increased by $7.7 billion from December 31, 2017 primarily due to the Combination, offset by revenues of $2.3 billion exceeding awards of $1.2 billion. We reviewed the RPOs acquired through the Combination to ensure consistency in the application of our policies regarding revenues dependent upon one or more future events; and made adjustments related to our purchasing account estimates. As a result, the RPO balance on the Combination Date included the net reduction of approximately $860 million for the acquired RPOs. This adjustment to the opening RPOs was not the result of contract cancellations. |
Of the June 30, 2018 RPOs, we expect to recognize revenues as follows:
|
|
2018 |
|
|
2019 |
|
|
Thereafter |
|
|||
|
|
(In approximate millions) |
|
|||||||||
|
Total RPOs |
$ |
4,480 |
|
|
$ |
4,249 |
|
|
$ |
1,457 |
|
See Note 4, Revenue Recognition, to the Financial Statements for further discussion of our RPOs.
Three months ended June 30, 2018 vs three months ended June 30, 2017
Revenues
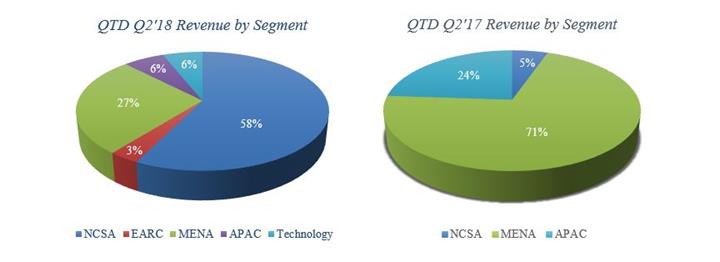
Revenues increased by 120%, or $946 million, in the second quarter of 2018 compared to the second quarter of 2017. Our second quarter 2018 revenues benefited by $1.1 billion from the impact of the Combination.
|
|
Three Months Ended June 30, |
|
|
|
|
|
|
|
|
|
|
|||||
|
|
2018 |
|
|
2017 |
|
|
Change |
|||||||||
|
|
(In millions) |
|
|
Percentage |
||||||||||||
|
Revenues: |
|
|
|
|
|
|
|
|
|
|
|
|
|
|
|
|
|
NCSA |
$ |
995 |
|
|
$ |
42 |
|
|
$ |
953 |
|
|
|
2,269 |
|
% |
|
EARC |
|
58 |
|
|
|
2 |
|
|
|
56 |
|
|
|
2,800 |
|
|
|
MENA |
|
469 |
|
|
|
557 |
|
|
|
(88 |
) |
|
|
(16 |
) |
|
|
APAC |
|
108 |
|
|
|
188 |
|
|
|
(80 |
) |
|
|
(43 |
) |
|
|
Technology |
|
105 |
|
|
|
- |
|
|
|
105 |
|
|
|
NA |
|
|
|
Total |
$ |
1,735 |
|
|
$ |
789 |
|
|
$ |
946 |
|
|
|
120 |
|
% |
NCSA—Revenues increased by 2,269%, or $953 million, in the second quarter of 2018 (including $883 million from the impact of the Combination) compared to the second quarter of 2017.
|
|
48 |
|
MANAGEMENT’S DISCUSSION AND ANALYSIS OF FINANCIAL CONDITION AND RESULTS OF OPERATIONS
In the second quarter of 2018, a variety of projects and activities contributed to revenues, as follows:
|
|
• |
construction progress on our two U.S. LNG export facility projects (approximately $370 million combined); |
|
|
• |
construction progress on our ethane cracker projects in Texas and Louisiana (approximately $260 million combined); |
|
|
• |
fabrication and marine activity progress on the Abkatun-A2 platform, a turnkey EPCI project in the Gulf of Mexico; |
|
|
• |
power projects in the U.S.; and |
|
|
• |
various other projects in the U.S. |
In the second quarter of 2017, a variety of projects and activities contributed to revenues, as follows:
|
|
• |
fabrication activity progress on the Abkatun-A2 platform, which was awarded in the second quarter of 2016; and |
|
|
• |
commencement of fabrication activity on BP Angelin, an EPCI gas field project off the east coast of Trinidad and Tobago, awarded in June 2017. |
EARC—Revenues increased by 2,800%, or $56 million, in the second quarter of 2018 (including $28 million from the impact of the Combination) compared to the second quarter of 2017.
In the second quarter of 2018, a variety of projects and activities contributed to revenues, as follows:
|
|
• |
commencement in 2018 of the Maersk Olie og Gas A/S Tyra Redevelopment EPCI project, awarded in the fourth quarter of 2017; |
|
|
• |
mobilization activities for an oil refinery expansion project in Russia; |
|
|
• |
commencement and completion of the diving scope project for a refinery off the coast of Durban, South Africa; |
|
|
• |
engineering, procurement and supply of process equipment for a deep conversion complex built at a refinery in central Russia; and |
|
|
• |
various other projects. |
In the second quarter of 2017 revenues were primarily associated with completion of activities on the Yamal project.
MENA—Revenues decreased by 16%, or $88 million, in the second quarter of 2018 compared to the second quarter of 2017. Revenues increased by $51 million as a result of the impact of the Combination.
In the second quarter of 2018, a variety of projects and activities contributed to revenues, as follows:
|
|
• |
engineering and fabrication progress and pipelay and spool installation activity by our DB 32 and DB 30 vessels on the Saudi Aramco Safaniya phase 5 project; |
|
|
• |
engineering, fabrication and procurement progress on our Saudi Aramco 13 Jackets project, awarded in the first quarter of 2018; |
|
|
• |
deck installations, tie-ins and hook-up activities by our DB 30 vessel on the Saudi Aramco Header 9 Facilities project; |
|
|
• |
engineering, fabrication and procurement progress on the Saudi Aramco Safaniya phase 6 project, awarded in the fourth quarter of 2017; |
|
|
• |
marine hook-up activities utilizing a jack-up barge on the lump-sum EPCI project under the Saudi Aramco Long-Term Agreement (“LTA II”); |
|
|
• |
marine installation activities by our Emerald Sea and DB 27 vessels on a pipeline replacement project in Qatar; and |
|
|
• |
various other projects. |
In the second quarter of 2017, a variety of projects and activities contributed to revenues, as follows:
|
|
• |
higher engineering, fabrication and marine activities on the LTA II; |
|
|
49 |
|
MANAGEMENT’S DISCUSSION AND ANALYSIS OF FINANCIAL CONDITION AND RESULTS OF OPERATIONS
|
|
• |
increased fabrication and marine activities undertaken on the Saudi Aramco Marjan power system replacement project; |
|
|
• |
near completion of fabrication activities and the commencement of installation activities on the Saudi Aramco nine jackets project; |
|
|
• |
completion of valve skid installation and significant marine activities on a pipeline, spool and risers for a flow assurance project in the Middle East; |
|
|
• |
near completion of fabrication activities and commencement of jackets installation activities on two Saudi Aramco EPCI projects; |
|
|
• |
increased marine activities to complete the Saudi Aramco Safaniya pipeline project; |
|
|
• |
increased pipelay and associated hookup activities on the KJO Hout project in the Divided Zone; and |
|
|
• |
commencement of a Saudi Aramco four jackets and three observation platform project, which was awarded in the fourth quarter of 2016. |
APAC—Revenues decreased by 43%, or $80 million, in the second quarter of 2018 compared to the second quarter of 2017, primarily due to a reduction in the number of active projects. Revenues increased by $12 million as a result of the impact of the Combination.
In the second quarter of 2018, a variety of projects and activities contributed to revenues, as follows:
|
|
• |
substantial completion of pipelay campaign and offshore construction on the Greater Western Flank Phase 2 project in Australia; and |
|
|
• |
commencement of activities on a subsea installation project in India, awarded in the fourth quarter of 2017. |
In the second quarter of 2017, a variety of projects and activities contributed to the reduction in revenues, as follows:
|
|
• |
major marine installation activities undertaken on the Vashishta subsea field infrastructure development EPCI project in India; |
|
|
• |
commencement and substantial completion of the 2017 Brunei Shell Petroleum (“BSP”) marine campaign for transportation and installation of pipelines under a multi-year offshore installation project; and |
|
|
• |
the Ichthys EPCI project in Australia, as the project progressed through the installation phase. |
Technology—Revenues in the second quarter of 2018 were $105 million (all of which resulted from the Combination) and were primarily associated with licensing and proprietary equipment activities in the petrochemical and refining market and the sale of catalyst.
|
|
50 |
|
MANAGEMENT’S DISCUSSION AND ANALYSIS OF FINANCIAL CONDITION AND RESULTS OF OPERATIONS
Operating Income
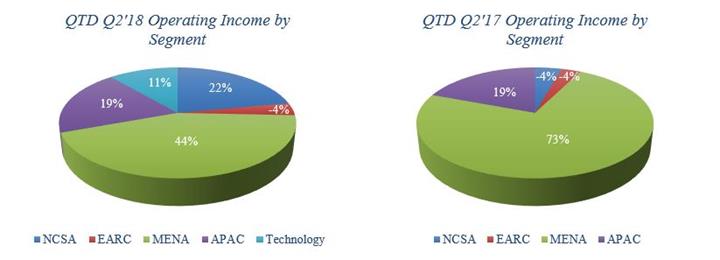
Segment operating income increased by 50%, or $69 million, in the second quarter of 2018 compared to the second quarter of 2017. Our second quarter 2018 operating income benefited by $74 million from the impact of the Combination (including $22 million of project related and other intangible assets amortization), primarily within our NCSA and Technology segments.
|
|
Three Months Ended June 30, |
|
|
|
|
|
|
|
|
|
|
|||||
|
|
2018 |
|
|
2017 |
|
|
Change |
|||||||||
|
|
(In millions) |
|
|
Percentage |
||||||||||||
|
Segment operating income: |
|
|
|
|
|
|
|
|
|
|
|
|
|
|
|
|
|
NCSA |
$ |
49 |
|
|
$ |
(7 |
) |
|
$ |
56 |
|
|
|
800 |
|
% |
|
EARC |
|
(8 |
) |
|
|
(5 |
) |
|
|
(3 |
) |
|
|
(60 |
) |
|
|
MENA |
|
97 |
|
|
|
118 |
|
|
|
(21 |
) |
|
|
(18 |
) |
|
|
APAC |
|
43 |
|
|
|
31 |
|
|
|
12 |
|
|
|
39 |
|
|
|
Technology |
|
25 |
|
|
|
- |
|
|
|
25 |
|
|
|
NA |
|
|
|
Total |
$ |
206 |
|
|
$ |
137 |
|
|
$ |
69 |
|
|
|
50 |
|
% |
NCSA—Segment operating income (loss) in the second quarter of 2018 and 2017 was $49 million and ($7) million, respectively. The impact of the Combination generated approximately $46 million of operating income during the second quarter of 2018 (including $7 million of intangible asset related amortization).
In the second quarter of 2018, a variety of projects and activities contributed to operating income, including:
|
|
• |
construction progress on our ethane cracker projects in Texas and Louisiana; and |
|
|
• |
various other projects in the U.S. |
During the second quarter of 2018, our two U.S. LNG export facility projects and our gas turbine power projects in the Midwest and Northeast did not materially contribute to our operating margin.
Operating loss in the second quarter of 2017 was primarily due to a reduction in the number of active projects (selling, general and administrative expenses were not reduced in the same proportion).
EARC—Segment operating losses in the second quarter of 2018 and 2017 were $8 million and $5 million, respectively. Our second quarter 2018 operating loss included $3 million from the impact of the Combination (including $2 million of project related and other intangible assets amortization).
|
|
51 |
|
MANAGEMENT’S DISCUSSION AND ANALYSIS OF FINANCIAL CONDITION AND RESULTS OF OPERATIONS
In both periods project operating results activity was offset by the selling, general and administrative expense and losses from the investment in the io Oil and Gas unconsolidated joint venture.
MENA—Segment operating income in the second quarter of 2018 and 2017 was $97 million and $118 million, respectively. Our second quarter 2018 operating income benefited by $6 million from the impact of the Combination.
In the second quarter of 2018, a variety of projects and activities contributed to operating income, including:
|
|
• |
engineering and fabrication progress and pipelay activity by our DB 32 vessel on the Saudi Aramco Safaniya phase 5 project, as well as productivity improvements and cost savings on the project; |
|
|
• |
deck installations, tie-ins and hook up activities by our DB 30 vessel on the Saudi Aramco Header 9 Facilities project, as well as productivity improvements and cost savings on the project; |
|
|
• |
a favorable settlement on the Saudi Aramco Safaniya phase 1 project, completed in 2016; |
|
|
• |
marine hook-up activities utilizing a jack-up barge on the lump-sum EPCI project under the LTA II; |
|
|
• |
a demolition campaign on the Saudi Aramco Marjan power systems replacement project; and |
|
|
• |
income from the investment in our CTCI unconsolidated joint venture. |
In the second quarter of 2017, a variety of projects and activities contributed to operating income, including:
|
|
• |
higher engineering, fabrication and marine activities on the lump-sum EPCI project under the LTA II; |
|
|
• |
increased fabrication and marine activities undertaken on the Saudi Aramco Marjan power systems replacement project; |
|
|
• |
completion of valve skid installation and significant marine campaign transpooling, umbilical installation and hook-up activities on pipeline, spool and risers for the flow assurance project in the Middle East; and |
|
|
• |
multiple Saudi Aramco projects, none of which were individually material. |
APAC—Segment operating income in the second quarter of 2018 and 2017 was $43 million and $31 million, respectively. APAC operating project results did not materially benefit from the impact of the Combination.
In the second quarter of 2018, a variety of projects and activities contributed to operating income, including:
|
|
• |
cost savings on active and completed projects; and |
|
|
• |
cost savings upon the substantial completion of pipelay and offshore construction campaign on the Greater Western Flank Phase 2 project in Australia, partly offset by the impact of weather related delays on the project. |
In the second quarter of 2017, a variety of projects and activities contributed to operating income, including:
|
|
• |
the Ichthys EPCI project in Australia, as the project progressed through the installation phase; and |
|
|
• |
the commencement and substantial completion of the 2017 BSP marine campaign for transportation and installation of pipelines under a multi-year offshore installation project. |
Technology—Segment operating income in the second quarter of 2018 was $25 million, net of $13 million of project related and other intangible assets amortization. The results were primarily associated with licensing and proprietary equipment activity, as well as the supply of catalyst and included $3 million of income from our CLG unconsolidated joint venture.
Corporate and Other
|
|
Three Months Ended June 30, |
|
|
|
|
|
|
|
|
|
|
|||||
|
|
2018 |
|
|
2017 |
|
|
Change |
|||||||||
|
|
(In thousands) |
|
|
Percentage |
||||||||||||
|
Corporate and Other |
$ |
(157 |
) |
|
$ |
(52 |
) |
|
$ |
(105 |
) |
|
|
(202 |
) |
% |
|
|
52 |
|
MANAGEMENT’S DISCUSSION AND ANALYSIS OF FINANCIAL CONDITION AND RESULTS OF OPERATIONS
In the second quarter of 2018 and 2017, Corporate and Other expenses were $157 million and $52 million, respectively. The increase in Corporate and Other expenses was primarily due to the following 2018 charges resulting from the impact of the Combination:
|
|
• |
Restructuring and integration costs ($63 million) primarily relate to costs to achieve our combination profitability initiative (“CPI”); and |
|
|
• |
Transaction costs ($37 million) primarily relate to incremental employee related costs and professional fees associated with our integration efforts. |
See Note 3, Business Combination, and Note 11, Restructuring and Integration Costs, to the Financial Statements for further discussion of these costs.
Interest expense, net—Interest expense, net was $72 million and $22 million in the second quarter of 2018 and 2017, respectively. Interest expense, net in the second quarter of 2018 was primarily comprised of:
|
|
• |
$28 million of interest expense and $1 million of deferred debt issuance costs (“DIC”) amortization associated with the issuance of our $1.3 billion principal amount of 10.625% senior notes due 2024 (the “Senior Notes”); |
|
|
• |
$29 million of interest expense and $2 million of deferred DIC amortization associated with our $2.26 billion senior secured term loan facility (the “Term Facility”); |
|
|
• |
$8 million of amortization of deferred DIC associated with our Revolving Credit Facility and LC Facility; and |
|
|
• |
$4 million of interest expense associated with our $500 million principal amount of 8.000% second-lien notes, which were redeemed in May 2018. |
Interest expense, net in the second quarter of 2017 was primarily associated with our 8.000% second-lien notes, which were redeemed in May 2018, and our prior term loan, which was repaid in June 2017.
See Note 12, Debt, to the Financial Statements for further discussion.
Other non-operating expense, net—Other non-operating expense, net was $16 million in the second quarter of 2018 and primarily related to a $10 million make-whole fee and $4 million of charges relating to the write-off of deferred DIC, associated with our redemption of our 8.000% second-lien notes in May 2018. See Note 12, Debt, to the Financial Statements for further discussion.
Income tax (benefit) expense—During the second quarter of 2018, we recognized an income tax benefit of $84 million (effective tax rate of 215.4%), compared to tax expense of $23 million (effective tax rate of 38.3%) for the second quarter of 2017. Our provision for the second quarter of 2018 benefited from the release of valuation allowance ($117 million) as a result of the taxable sale of low tax basis, pre-Combination McDermott assets to our new Technology entity which files its U.S. income taxes separately from pre-Combination McDermott. The pre-combination McDermott U.S. net operating loss carryforwards utilized by this transaction previously had been offset by a valuation allowance. This benefit was partially offset by non-deductible transaction costs ($16 million), changes in other valuation allowances ($12 million) and state tax and other items ($15 million combined).
|
|
53 |
|
MANAGEMENT’S DISCUSSION AND ANALYSIS OF FINANCIAL CONDITION AND RESULTS OF OPERATIONS
Six months ended June 30, 2018 vs six months ended June 30, 2017
Revenues

Revenues increased by 79%, or $1.0 billion, in the six months ended June 30, 2018 compared to the six months ended June 30, 2017. Our revenues for the 2018 period benefited by $1.1 billion from the impact of the Combination, primarily within our NCSA, MENA and Technology segments.
|
|
Six Months Ended June 30, |
|
|
|
|
|
|
|
|
|
|
|||||
|
|
2018 |
|
|
2017 |
|
|
Change |
|||||||||
|
|
(In millions) |
|
|
Percentage |
||||||||||||
|
Revenues: |
|
|
|
|
|
|
|
|
|
|
|
|
|
|
|
|
|
NCSA |
$ |
1,093 |
|
|
$ |
70 |
|
|
$ |
1,023 |
|
|
|
1,461 |
|
% |
|
EARC |
|
74 |
|
|
|
18 |
|
|
|
56 |
|
|
|
311 |
|
|
|
MENA |
|
814 |
|
|
|
867 |
|
|
|
(53 |
) |
|
|
(6 |
) |
|
|
APAC |
|
257 |
|
|
|
353 |
|
|
|
(96 |
) |
|
|
(27 |
) |
|
|
Technology |
|
105 |
|
|
|
- |
|
|
|
105 |
|
|
|
NA |
|
|
|
Total revenues |
$ |
2,343 |
|
|
$ |
1,308 |
|
|
$ |
1,035 |
|
|
|
79 |
|
% |
NCSA—Revenues increased by 1,461%, or $1.0 billion, in the six months ended June 30, 2018 (including $883 million from the impact of the Combination) compared to the six months ended June 30, 2017.
In the six months ended June 30, 2018, a variety of projects and activities contributed to revenues, as follows:
|
|
• |
construction progress on our two U.S. LNG export facility projects (approximately $370 million combined); |
|
|
• |
construction progress on our ethane cracker projects in Texas and Louisiana (approximately $260 million combined); |
|
|
• |
fabrication and marine activity progress on the Abkatun-A2 platform, a turnkey EPCI project in the Gulf of Mexico; |
|
|
• |
power projects in the U.S.; and |
|
|
• |
various other projects in the U.S. |
In the six months ended June 30, 2017, revenue was primarily associated with fabrication activity progress on the Abkatun-A2 platform, which was awarded in the second quarter of 2016, and commencement of fabrication activity on the BP Angelin, EPCI gas field project, awarded in the second quarter of 2017.
|
|
54 |
|
MANAGEMENT’S DISCUSSION AND ANALYSIS OF FINANCIAL CONDITION AND RESULTS OF OPERATIONS
EARC—Revenues increased by 311%, or $56 million, in the six months ended June 30, 2018 (including $28 million from the impact of the Combination) compared to the six months ended June 30, 2017.
In the six months ended June 30, 2018, a variety of projects and activities contributed to revenues, as follows:
|
|
• |
the commencement in 2018 of the Maersk Olie og Gas A/S Tyra Redevelopment EPCI project, awarded in the fourth quarter of 2017; |
|
|
• |
engineering, procurement, and supply of process equipment for a deep conversion complex built at the refinery in central Russia; |
|
|
• |
mobilization activities for the oil refinery expansion project in Russia; |
|
|
• |
commencement and completion of the diving scope project for the refinery off the coast of Durban, South Africa; and |
|
|
• |
various other projects. |
In the six months ended June 30, 2017 revenue was primarily associated with completion of activities on the Yamal project in the beginning of the second quarter of 2017.
MENA—Revenues decreased by 6%, or $53 million, in the six months ended June 30, 2018 (including $51 million from the impact of the Combination) compared to the six months ended June 30, 2017.
In the six months ended June 30, 2018, a variety of projects and activities contributed to revenues, as follows:
|
|
• |
engineering and fabrication progress and pipelay and spool installation activity by our DB 32 and DB 30 vessels on the Saudi Aramco Safaniya phase 5 project; |
|
|
• |
marine hook-up activities utilizing a jack-up barge on the lump-sum EPCI project under the LTA II; |
|
|
• |
deck installations, tie-ins and hook up activities by our DB 30 vessel on the Saudi Aramco Header 9 Facilities project; |
|
|
• |
engineering, fabrication and procurement progress on the Saudi Aramco Safaniya phase 6 project, awarded in the fourth quarter of 2017; |
|
|
• |
engineering, fabrication and procurement progress on our Saudi Aramco 13 Jackets project, awarded in the first quarter of 2018; |
|
|
• |
marine installation activities by our Emerald Sea and DB 27 vessels on a pipeline replacement project in Qatar; and |
|
|
• |
various other projects. |
In the six months ended June 30, 2017, a variety of projects and activities contributed to revenues, as follows:
|
|
• |
higher fabrication and marine activities on the lump-sum EPCI project under the LTA II; |
|
|
• |
increased fabrication and marine activities undertaken on the Marjan power system replacement project; |
|
|
• |
near completion of fabrication activities and the commencement of the installation activities on the Saudi Aramco nine jackets project; |
|
|
• |
completion of valve skid installation and significant marine campaign transpooling, umbilical installation and hook-up activities on pipeline, spool and risers for the flow assurance project in the Middle East; |
|
|
• |
pipelay installation and hookup activities executed by our DB 27 vessel on the KJO Hout project in the Divided Zone; |
|
|
• |
near completion of fabrication activities and commencement of jacket installation activities on two Saudi Aramco EPCI projects; |
|
|
• |
marine hookup activities carried out during the shutdown of the TP-1 platform on the Saudi Aramco Karan-45 project; and |
|
|
• |
completion of the next phase of a large pipeline repair-related project in the Middle East. |
|
|
55 |
|
MANAGEMENT’S DISCUSSION AND ANALYSIS OF FINANCIAL CONDITION AND RESULTS OF OPERATIONS
APAC—Revenues decreased 27%, or $96 million, in the six months ended June 30, 2018 (including $12 million from the impact of the Combination) compared to the six months ended June 30, 2017.
In the six months ended June 30, 2018, a variety of projects and activities contributed to revenues, as follows:
|
|
• |
commencement and substantial completion of pipelay campaign and offshore construction on the Greater Western Flank Phase 2 project in Australia; |
|
|
• |
the Inpex Ichthys project in Australia and Vashishta subsea field infrastructure development project in India, both of which are substantially complete; and |
|
|
• |
commencement of activities on the subsea installation project in India, awarded in the fourth quarter of 2017. |
In the six months ended June 30, 2017, a variety of projects and activities contributed to revenues, as follows:
|
|
• |
progress on marine installation activities on the Vashishta subsea field infrastructure development EPCI project in India; |
|
|
• |
commencement and substantial completion of the 2017 campaign for transportation and installation of pipelines under the multi-year offshore installation contract with BSP; and |
|
|
• |
reduced activity on the Ichthys EPCI project in Australia, as the project progressed through the installation phase. |
Technology—Revenues during the six months ended June 30, 2018 were $105 million (all of which resulted from the impact of the Combination) and were primarily associated with licensing and proprietary equipment activities in the petrochemical and refining market and the sale of catalyst.
Operating Income

|
|
56 |
|
MANAGEMENT’S DISCUSSION AND ANALYSIS OF FINANCIAL CONDITION AND RESULTS OF OPERATIONS
Segment operating income increased by $53%, or $121 million in the first half of 2018 compared to the first half of 2017. Our first half 2018 operating income benefited by $74 million (net of $22 million of project related and other intangible assets amortization) from the impact of the Combination, primarily within our NCSA and Technology segments.
|
|
Six Months Ended June 30, |
|
|
|
|
|
|
|
|
|
|
|||||
|
|
2018 |
|
|
2017 |
|
|
Change |
|||||||||
|
|
(In millions) |
|
|
Percentage |
||||||||||||
|
Segment operating income: |
|
|
|
|
|
|
|
|
|
|
|
|
|
|
|
|
|
NCSA |
$ |
51 |
|
|
$ |
(5 |
) |
|
$ |
56 |
|
|
|
1,120 |
|
% |
|
EARC |
|
(11 |
) |
|
|
(3 |
) |
|
|
(8 |
) |
|
|
(267 |
) |
|
|
MENA |
|
167 |
|
|
|
182 |
|
|
|
(15 |
) |
|
|
(8 |
) |
|
|
APAC |
|
116 |
|
|
|
53 |
|
|
|
63 |
|
|
|
119 |
|
|
|
Technology |
|
25 |
|
|
|
- |
|
|
|
25 |
|
|
|
NA |
|
|
|
Total |
$ |
348 |
|
|
$ |
227 |
|
|
$ |
121 |
|
|
|
53 |
|
% |
NCSA—Segment operating income (loss) was $51 million and ($5) million during the six months ended June 30, 2018 and 2017, respectively. Our first half of 2018 operating income benefited by $46 million from the impact of the Combination, including $7 million of project related and other intangible assets amortization.
In the first half of 2018, a variety of projects and activities contributed to operating income, as follows:
|
|
• |
construction progress on our ethane cracker projects in Texas and Louisiana; and |
|
|
• |
various other projects in the U.S. |
During the first of half of 2018, our two U.S. LNG export facility projects and our gas turbine power projects in the Midwest and Northeast did not materially contribute to our operating margin.
In the first half of 2017, operating income was primarily associated with the commencement of fabrication activity on the BP Angelin EPCI gas field project and close-out improvements and recognition of approved change orders on certain completed projects.
EARC—Segment operating losses were $11 million and $3 million during the six months ended June 30, 2018 and 2017, respectively. Our first half 2018 operating loss included $3 million from the Combination, which included $2 million of project related and other intangible assets amortization.
In both periods project operating results activity was offset by the selling, general and administrative expense and losses from our investment in the io Oil and Gas unconsolidated joint venture.
MENA—Segment operating income was $167 million and $182 million during the six months ended June 30, 2018 and 2017, respectively. Our first half of 2018 operating income benefited by $6 million from the impact of the Combination.
In the first half of 2018, a variety of projects and activities contributed to operating income, as follows:
|
|
• |
engineering and fabrication progress and pipelay and spool installation activity by our DB 32 and DB 30 vessels on the Saudi Aramco Safaniya phase 5 project, as well as productivity improvements and cost savings on the project; |
|
|
• |
marine hook-up activities utilizing a jack-up barge on the lump-sum EPCI project under the LTA II; |
|
|
• |
deck installations, tie-ins and hook up activities by our DB 30 vessel on the Saudi Aramco Header 9 Facilities project, as well as productivity improvements and cost savings on the project; |
|
|
• |
favorable settlement on the Saudi Aramco Safaniya phase 1 project, completed in 2016; |
|
|
• |
demolition campaign on the Saudi Aramco Marjan power systems replacement project; and |
|
|
• |
income from the investment in our CTCI unconsolidated joint venture. |
|
|
57 |
|
MANAGEMENT’S DISCUSSION AND ANALYSIS OF FINANCIAL CONDITION AND RESULTS OF OPERATIONS
In the six months ended June 30, 2017, a variety of projects and activities contributed to operating income, as follows:
|
|
• |
higher engineering, fabrication and marine activities on the lump-sum EPCI project under the LTA II; |
|
|
• |
increased fabrication and marine activities undertaken on the Marjan power systems replacement project; |
|
|
• |
completion of valve skid installation and significant marine campaign transpooling, umbilical installation and hook-up activities on a pipeline, spool and risers for a flow assurance project in the Middle East; |
|
|
• |
multiple Saudi Aramco projects, none of which individually was material; |
|
|
• |
marine hookup activities carried out during the shutdown of the TP-1 platform on our Saudi Aramco Karan-45 project; and |
|
|
• |
completion of the next phase of a large pipeline repair-related project in the Middle East. |
APAC—Segment operating income was $116 million and $53 million during the six months ended June 30, 2018 and 2017, respectively. APAC operating results did not materially benefit from the impact of the Combination.
In the six months ended June 30, 2018, a variety of projects and activities contributed to operating income, as follows:
|
|
• |
cost savings and the close-out of outstanding change orders on active and completed projects; and |
|
|
• |
cost savings upon the commencement and substantial completion of pipelay campaign and offshore construction on the Greater Western Flank Phase 2 project in Australia, partly offset by the impact of weather related delays on the project. |
In the six months ended June 30, 2017, a variety of projects and activities contributed to operating income, as follows:
|
|
• |
activity on the Ichthys project in Australia; |
|
|
• |
2017 marine campaign for transportation and installation of pipelines under the multi-year offshore installation contract with BSP; and |
|
|
• |
close-out improvements from our completed contracts. |
Technology—Segment operating income during the six months ended June 30, 2018 was $25 million, net of $13 million of project related and other intangible assets amortization. The results were primarily associated with licensing and proprietary equipment activities, as well as the supply of catalyst, and included $3 million of income from our CLG unconsolidated affiliate.
Corporate and Other
|
|
Six Months Ended June 30, |
|
|
|
|
|
|
|
|
|
|
|||||
|
|
2018 |
|
|
2017 |
|
|
Change |
|||||||||
|
|
(In millions) |
|
|
Percentage |
||||||||||||
|
Corporate and Other |
$ |
(235 |
) |
|
$ |
(90 |
) |
|
$ |
(145 |
) |
|
|
(160 |
) |
% |
For the six months ended June 30, 2018 and 2017, Corporate and Other expenses were $235 million and $90 million, respectively. The increase in Corporate and Other expenses was primarily due to lower cost recoveries during the first quarter of 2018 and the following charges resulting from the impact of the Combination in the 2018 period:
|
|
• |
Restructuring and integration costs ($75 million) primarily relate to costs to achieve our CPI; and |
|
|
• |
Transaction costs ($40 million) primarily relate to incremental employee related costs and professional fees associated with our integration efforts. |
See Note 3, Business Combination, and Note 11, Restructuring and Integration Costs, to the Financial Statements for further discussion.
|
|
58 |
|
MANAGEMENT’S DISCUSSION AND ANALYSIS OF FINANCIAL CONDITION AND RESULTS OF OPERATIONS
Other Non-operating Items
Interest expense, net—Interest expense, net was $83 million and $39 million during the six months ended June 30, 2018 and 2017, respectively.
Interest expense in the six months ended June 30, 2018 was primarily comprised of:
|
|
• |
$28 million of interest expense and $1 million of deferred DIC amortization associated with the Senior Notes, discussed in Note 12, Debt, to the Financial Statements; |
|
|
• |
$29 million of interest expense and $2 million of deferred DIC amortization, associated with the Term Facility, discussed in Note 12, Debt; to the Financial Statements; |
|
|
• |
$9 million of amortization of deferred DIC associated with our revolving credit facility and LC facility; and |
|
|
• |
$14 million of interest expense associated with our 8.000% second-lien notes, which were redeemed in May 2018. |
See Note 12, Debt, to the Financial Statements for further discussion.
Interest expense, net in the six months ended June 30, 2017 was primarily associated with our 8.000% second-lien notes, which were redeemed in May 2018, and our prior term loan, which was repaid in June 2017.
Other non-operating expense, net—Other non-operating expense, net was $14 million during the six months ended June 30, 2018 and primarily related to a $10 million make-whole fee and $4 million of charges relating to the write-off of deferred DIC, associated with our redemption of our 8.000% second-lien notes in May 2018. See Note 12, Debt, to the Financial Statements for further discussion.
Income tax (benefit) expense—During the six months ended June 30, 2018, we recognized an income tax benefit of $63 million (effective tax rate of 393.8%), compared to tax expense of $34 million (effective tax rate of 35.4%) for the six months ended June 30, 2017. Our provision for the six months ended June 30, 2018 benefited from the tax effect ($117 million) of the taxable sale of low tax basis, pre-Combination McDermott assets to our new Technology entity which files its U.S. income taxes separately from pre-Combination McDermott. The pre-Combination McDermott U.S. net operating loss carryforwards utilized by this transaction previously had been offset by a valuation allowance. This benefit was partially offset by non-deductible transaction costs ($16 million), changes in valuation allowances ($19 million) and state tax and other items ($15 million combined).
Liquidity and Capital Resources
General—Our primary ongoing sources of liquidity are cash flows generated from operations and cash and cash equivalents on hand. We regularly review our sources and uses of funds and may access capital markets to increase our liquidity position or to refinance our existing debt. We plan to fund our ongoing working capital, capital expenditures, debt service and other funding requirements with cash on hand, cash from operating activities, proceeds from the issuance of debt, or a combination thereof.
We believe our cash on hand, cash generated from operations, amounts available under our credit facilities and uncommitted bilateral lines of credit and other external sources of liquidity, such as the issuance of debt and equity instruments, will be sufficient to finance our capital expenditures, including expected capital expenditures for the Amazon vessel (anticipated to be financed through the arrangements discussed in Note 22, Subsequent Events), settle our commitments and contingencies (as more fully described in Note 20, Commitments and Contingencies) and address our normal, anticipated working capital needs for the foreseeable future. However, there can be no assurance that such funding sources will continue to be available, as our ability to generate cash flows from operations and our ability to access our credit facilities and uncommitted bilateral lines of credit, at reasonable terms or at all, may be impacted by a variety of business, economic, legislative, financial and other factors, which may be outside of our control.
Additionally, while we currently have significant uncommitted bonding facilities, primarily to support various commercial provisions in our contracts, a termination or reduction of these bonding facilities could result in the utilization of letters of credit in lieu of performance bonds, thereby reducing the available capacity under our credit facilities and uncommitted bilateral lines of credit. Although we do not anticipate a reduction or termination of the bonding facilities, there can be no assurance that such facilities will continue to be available at reasonable terms to service our ordinary course obligations.
|
|
59 |
|
MANAGEMENT’S DISCUSSION AND ANALYSIS OF FINANCIAL CONDITION AND RESULTS OF OPERATIONS
Cash, Cash Equivalents and Restricted Cash
As of June 30, 2018, we had $1.1 billion of cash, cash equivalents and restricted cash, as compared to $408 million as of December 31, 2017. Approximately $140 million of our cash and cash equivalents at June 30, 2018 was within our variable interest entities (“VIEs”) associated with our joint venture and consortium arrangements, which is generally only available for use in our operating activities when distributed to the joint venture and consortium participants. At June 30, 2018, we had $276 million of cash in jurisdictions outside the U.S., principally in the Netherlands, the United Arab Emirates, the United Kingdom, Ireland, India and Malaysia. Approximately 3.7% of our outstanding cash balance is held in countries that have established government imposed currency restrictions that could impede the ability of our subsidiaries to transfer funds to us.
Cash Flow Activities
Operating activities―Net cash provided by operating activities was $435 million in the six months ended June 30, 2018, as compared to $91 million provided in the six months ended June 30, 2017.
The cash provided by operating activities primarily reflected our net income, adjusted for non-cash items and changes in components of our working capital. The changes in our working capital during the six months ended June 30, 2018 were primarily driven by accounts receivable, contracts in progress net of advance billings on contracts and accounts payable. Fluctuations in working capital are normal in our business. Working capital is impacted by the size of our projects and the achievement of billing milestones on RPOs as we complete certain phases of the projects. The acquired CB&I operations included approximately $1.6 billion of negative working capital at the Combination Date.
The components of working capital that provided cash are:
|
|
• |
Accounts receivable—decrease of $278 million driven by collections primarily within our NCSA segment; and |
|
|
• |
Accounts payable—increase of $129 million driven by project progress primarily within our MENA segment. |
The increase was partially offset by a $141 million increase in Contracts in progress, net of Advance billings on contracts, primarily due to the impact of progress on projects within our NCSA segment, being partially offset by projects within our APAC segment.
In the six months ended June 30, 2017, net cash provided by working capital was $113 million.
The components of working capital that provided cash were:
|
|
• |
Accounts receivable—collections across all segments reduced our accounts receivable by $37 million; and |
|
|
• |
Accounts payable—increases of $260 million in accounts payable were driven by projects progress across all segments. |
Those increases were partially offset by a $411 million increase in Contracts in progress, net of Advance billings on contracts. This increase was primarily due to:
|
|
• |
progress on the Abkatun A-2 project in the NCSA segment, the Saudi Aramco LTA II project in the MENA segment and the Vashishta project in the APAC segment; and |
|
|
• |
cash utilized by the Ichthys project in our APAC segment as the project progressed through the marine installation phase. |
Investing activities―Net cash used in investing activities was $2.5 billion in the six months ended June 30, 2018, as compared to $27 million used in the six months ended June 30, 2017.
The outflows for the six months ended June 30, 2018 were primarily associated with:
|
|
• |
the cash portion of the Combination consideration ($2.4 billion, net of cash acquired of $498 million – see Note 3, Business Combination, to the Financial Statements for further discussion); |
|
|
• |
net outflows from advances of $45 million with our third-party consortium participants of proportionately consolidated consortiums (see Note 10, Joint Venture and Consortium Arrangements, to the Financial Statements for further discussion); and |
|
|
60 |
|
MANAGEMENT’S DISCUSSION AND ANALYSIS OF FINANCIAL CONDITION AND RESULTS OF OPERATIONS
Net cash used in investing activities for the six months ended June 30, 2017 primarily related to capital expenditures, partly offset by the sale lease back of the Amazon vessel discussed below.
Financing activities―Net cash provided by financing activities was $2.8 billion in the six months ended June 30, 2018, as compared to $267 million used in the six months ended June 30, 2017.
Net cash provided for the six months ended June 30, 2018 was primarily attributable to:
|
|
• |
borrowings of $2.26 billion from our Term Facility (see Note 12, Debt, to the Financial Statements for further discussion); and |
|
|
• |
the issuance of $1.3 billion in aggregate principal amount of Senior Notes (see Note 12, Debt, to the Financial Statements for further discussion). |
The inflows were partly offset by:
|
|
• |
redemption of the entire $500 million aggregated principal amount of our 8.000% second-lien notes and a $10 million make-whole associated with the early repayment; |
|
|
• |
$208 million of DIC associated with our Credit Agreement and Senior Notes; |
|
|
• |
net outflows from advances of $42 million with our equity method and proportionately consolidated joint ventures and consortiums; |
|
|
• |
$15 million of other debt repayments; and |
|
|
• |
repurchases of common stock of $14 million tendered by participants in our long-term incentive plans for payment of applicable withholding taxes upon vesting of awards under those plans. |
Net cash used for the six months ended June 30, 2017 was primarily attributable to:
|
|
• |
$218 million and $13 million of term loan and other debts repayments, respectively; |
|
|
• |
$19 million of DIC associated with previous credit agreement; |
|
|
• |
$11 million for the acquisition of the North Ocean AS 105 noncontrolling interest; and |
|
|
• |
repurchases of common stock tendered by participants in our long-term incentive plans for payment of applicable withholding taxes upon vesting of awards under those plans. |
Effects of Exchange Rate Changes on Cash, Cash Equivalents and Restricted Cash—During the first six months of 2018, our cash and cash equivalents balance decreased by $15 million due to the impact of changes in functional currency exchange rates against the U.S. Dollar for non-U.S. Dollar cash balances, primarily for net changes in the Australian Dollar, British Pound and Euro exchange rates. The net unrealized loss on our cash and cash equivalents resulting from these exchange rate movements is reflected in the cumulative translation adjustment component of OCI. Our cash and cash equivalents held in non-U.S. Dollar currencies are used primarily for project-related and other operating expenditures in those currencies, and therefore, our exposure to realized exchange gains and losses is not anticipated to be material.
|
|
61 |
|
MANAGEMENT’S DISCUSSION AND ANALYSIS OF FINANCIAL CONDITION AND RESULTS OF OPERATIONS
As part of our strategic growth program, our management regularly evaluates our marine vessel fleet and our fabrication yard construction capacity to ensure our fleet and construction capabilities are adequately aligned with our overall growth strategy. These assessments may result in capital expenditures to construct, upgrade, acquire or operate vessels or acquire or upgrade fabrication yards that would enhance or grow our technical capabilities, or may involve engaging in discussions to dispose of certain marine vessels or fabrication yards.
Capital expenditures for the six months ended June 30, 2018 and 2017 were $43 million and $81 million, respectively, as discussed below:
|
|
|
|
|
|
• |
Capital expenditures for the 2017 period were primarily attributable to the purchase of the pipelay and construction vessel, the Amazon. Following the purchase, we sold the Amazon to an unrelated third party and simultaneously entered into an 11-year bareboat charter agreement with the purchaser. |
During the remainder of 2018, we expect to spend approximately $80 million for capital projects.
Credit Agreement and Debt
General―As of June 30, 2018, we had $3.4 billion of total debt, net of debt issuance costs of $147 million and $945 million of outstanding bank guarantees issued under uncommitted lines of credit. At June 30, 2018, we also had $400 million of surety bonds issued under general agreements of indemnity (which includes $395 million of surety bonds maintained on behalf of CB&I’s former Capital Services Operations business, which were sold to CSVC Acquisition Corp (“CSVC”) in June 2017). We also continue to maintain guarantees on behalf of CB&I’s former Capital Services Operations in support of approximately $44 million of RPOs. We have received indemnity from CSVC Acquisition Corp (“CSVC”) for both the surety bonds and guarantees. For additional information, see Note 12, Debt, to the Financial Statements.
Compliance―As of June 30, 2018, we were in compliance with all our restrictive covenants under the Credit Agreement and Senior Notes Indenture. Our financial covenant requirements under the Credit Agreement will be subject to testing beginning in the third quarter of 2018. For additional information, see Note 12, Debt, to the Financial Statements.
Other―A portion of our pension plans’ assets are invested in EU government securities, which could be impacted by economic turmoil in Europe or a full or partial break-up of the EU or its currency, the Euro. However, given the long-term nature of pension funding requirements, in the event any of our pension plans (including those with investments in EU government securities) become materially underfunded from a decline in value of our plan assets, we believe our cash on hand and amounts available under our existing Revolving Credit Facility would be sufficient to fund any increases in future contribution requirements.
We are a defendant in a number of lawsuits arising in the normal course of business and we have in place appropriate insurance coverage for the type of work that we perform. As a matter of standard policy, we review our litigation accrual quarterly and as further information is known on pending cases, increases or decreases, as appropriate, may be recorded. See Note 20, Commitments and Contingencies, to the Financial Statements for a discussion of pending litigation.
|
|
62 |
|
MANAGEMENT’S DISCUSSION AND ANALYSIS OF FINANCIAL CONDITION AND RESULTS OF OPERATIONS
The following represents an update as of June 30, 2018 to contractual obligations previously disclosed in our 2017 Form 10-K, primarily resulting from the Combination:
|
|
|
|
|
|
|
Less than |
|
|
1-3 |
|
|
3-5 |
|
|
More than |
|
||||
|
|
|
Total |
|
|
1 Year |
|
|
Years |
|
|
Years |
|
|
5 Years |
|
|||||
|
|
|
(In millions) |
|
|||||||||||||||||
|
Debt and capital lease obligations (1) |
|
$ |
3,607 |
|
|
$ |
43 |
|
|
$ |
61 |
|
|
$ |
49 |
|
|
$ |
3,454 |
|
|
Estimated interest payments (2) |
|
|
2,007 |
|
|
|
311 |
|
|
|
624 |
|
|
|
620 |
|
|
|
452 |
|
|
Operating leases (3) |
|
|
463 |
|
|
|
75 |
|
|
|
115 |
|
|
|
83 |
|
|
|
190 |
|
|
(1) |
Amounts represent the expected cash payments for the principal amounts related to our debt, including capital lease obligations. Amounts exclude debt issuance costs and interest. |
|
(2) |
Amounts represent the expected cash payments for interest on our long-term debt and capital lease obligations. |
|
(3) |
Amounts represent future minimum payments under non-cancelable operating leases with initial or remaining terms of one year or more. |
Critical Accounting Policies and Estimates
For a discussion of the impact of critical accounting policies and estimates on our Consolidated Financial Statements, refer to Item 7 “Management’s Discussion and Analysis of Financial Condition and Results of Operations” included in the July 31 Form 8-K. Additionally, see Note 2, Basis of Presentation and Significant Accounting Policies, to the Financial Statements for discussion of the impact of critical accounting policies and estimates identified as part of the Combination.
New Accounting Standards
See Note 2, Basis of Presentation and Significant Accounting Policies, to the Financial Statements for a discussion of the potential impact of new accounting standards on our Financial Statements.
|
|
63 |
|
QUANTITATIVE AND QUALITATIVE DISCLOSURES ABOUT MARKET RISK
Item 3. Quantitative and Qualitative Disclosures about Market Risk
Foreign Currency Exchange Risk
In the normal course of business, our results of operations are exposed to certain market risks, primarily associated with fluctuations in currency exchange rates.
We have operations in many locations around the world and are involved in transactions in currencies other than those of our entity’s functional currencies, which could adversely affect our results of operations due to changes in currency exchange rates or weak economic conditions in foreign markets. We manage these risks associated with currency exchange rate fluctuations by hedging those risks with foreign currency derivative instruments. Historically, we have hedged those risks with foreign currency forward contracts. In certain cases, contracts with our customers may contain provisions under which payments from our customers are denominated in U.S. dollars and in a foreign currency. The payments denominated in a foreign currency are designed to compensate us for costs that we expect to incur in such foreign currency. In these cases, we may use derivative instruments to reduce the risks associated with currency exchange rate fluctuations arising from differences in timing of our foreign currency cash inflows and outflows. The related gains and losses on these contracts are either: (i) deferred as a component of Accumulated Other Comprehensive Income (“AOCI”) until the hedged item is recognized in earnings; (ii) offset against the change in fair value of the hedged firm commitment through earnings; or (iii) recognized immediately in earnings.
At June 30, 2018, the notional value of our outstanding forward contracts to hedge certain foreign currency exchange-related operating exposures was $898 million. The total fair value of these contracts was a net liability of approximately $5 million at June 30, 2018. The potential change in fair value for our outstanding contracts resulting from a hypothetical ten percent change in quoted foreign currency exchange rates would have been approximately $23 million at June 30, 2018. This potential change in fair value of our outstanding contracts would be offset by the change in fair value of the associated underlying operating exposures.
We are exposed to fluctuating exchange rates relates to the effects of translating financial statements of entities with functional currencies other than the U.S. Dollar into our reporting currency. With respect to the translation of our balance sheet, net movements in the Australian Dollar, British Pound, and Euro exchange rates against the U.S. Dollar unfavorably impacted the cumulative translation adjustment component of AOCI by approximately $12 million, net of tax, and our cash balance as unfavorably impacted by approximately $15 million as of June 30, 2018. We generally do not hedge our exposure to potential foreign currency translation adjustments.
Interest Rate Risk
On May 8, 2018, we entered into U.S. dollar floating-to-fixed interest rate swap arrangement to mitigate exposure associated with cash flow variability on our $2.26 billion Term Facility in an aggregate notional value of $1.94 billion. The swap arrangement has been designated as a cash flow hedge as its critical terms matched those of the Term Facility at inception and through June 30, 2018. Accordingly, changes in the fair value of the swap arrangement are initially recorded in AOCI and then reclassified into earnings in the period in which corresponding interest payments are made. As of June 30, 2018, the fair value of the swap arrangement was in a net liability position totaling approximately $10 million. The potential change in fair value for our interest rate swap resulting from a hypothetical one percent change in the Eurodollar rate would have been approximately $69 million at June 30, 2018.
At June 30, 2018, the fair value of our Term Facility, based on current market rates for debt with similar credit risk and maturities, approximated their carrying values as interest is based upon the Eurodollar rate plus an applicable floating margin. Our Senior Notes had an approximate fair value of $1.4 billion at June 30, 2018, based on current market rates for debt with similar credit risk and maturities and was categorized within level 2 on the valuation hierarchy. See Note 15, Fair Value Measurements, to the Financial Statements for further discussion of our financial instruments.
|
|
64 |
|
CONTROLS AND PROCEDURES
Item 4. Controls and Procedures
Disclosure Controls and Procedures—As of the end of the period covered by this quarterly report, we carried out an evaluation, under the supervision and with the participation of our management, including our Chief Executive Officer and Chief Financial Officer, of the effectiveness of the design and operation of our disclosure controls and procedures (as that term is defined in Rules 13a-15(e) and 15d-15(e) adopted by the SEC under the Securities Exchange Act of 1934, as amended (the “Exchange Act”)). Our disclosure controls and procedures were developed through a process in which our management applied its judgment in assessing the costs and benefits of such controls and procedures, which, by their nature, can provide only reasonable assurance regarding the control objectives. You should note that the design of any system of disclosure controls and procedures is based in part upon various assumptions about the likelihood of future events, and we cannot assure you that any design will succeed in achieving its stated goals under all potential future conditions, regardless of how remote. Based on the evaluation referred to above, our Chief Executive Officer and Chief Financial Officer concluded that the design and operation of our disclosure controls and procedures are effective as of June 30, 2018 to provide reasonable assurance that information required to be disclosed by us in the reports that we file or submit under the Exchange Act is recorded, processed, summarized and reported within the time periods specified in the rules and forms of the Securities and Exchange Commission, and such information is accumulated and communicated to management, including our principal executive and principal financial officers or persons performing similar functions, as appropriate to allow timely decisions regarding disclosure.
As previously disclosed, we completed the Combination on May 10, 2018. As of June 30, 2018, we are in the process of reviewing and evaluating CB&I’s internal control over financial reporting as part of the process of aligning and integrating the business and operations. As permitted by SEC guidance for newly acquired businesses, management’s assessment of our disclosure controls and procedures did not include an assessment of those controls and procedures specific to the operations of CB&I that are part of the acquired operation’s internal controls over financial reporting. CB&I accounted for approximately 65% of total assets as of June 30, 2018 and approximately 62% of total revenues of the combined company for the quarter ended June 30, 2018.
Changes in Internal Control Over Financial Reporting—With exception of the Combination, there has been no change in our internal control over financial reporting, which was identified in connection with the evaluation required by paragraph (d) of Rules 13a-15 and 15d-15 under the Exchange Act, during the quarter ended June 30, 2018 that has materially affected, or is reasonably likely to materially affect, our internal control over financial reporting.
|
|
65 |
|
OTHER INFORMATION
For information regarding ongoing investigations and litigation, see Note 20, Commitments and Contingencies to our unaudited Financial Statements in Part I of this report, which we incorporate by reference into this Item.
The following discussion updates the risk factor disclosure in “Item 1A. Risk Factors” in our Annual Report on Form 10-K for the year ended December 31, 2017.
You should carefully consider each of the following risks and all of the other information contained in this Quarterly Report and in our other filings with the SEC. If any of these risks develop into actual events, our business, financial condition, results of operations or cash flows could be materially and adversely affected, and, as a result, the trading price of our common stock could decline. Additional risks not presently known to us or that we currently deem immaterial individually or in the aggregate may also materially and adversely affect us.
Risks Factors Relating to Our Business Operations
We derive substantial revenues from companies in various energy-related industries, including the oil and natural gas exploration and development industry, a historically cyclical industry with levels of activity that are significantly affected by the levels and volatility of oil and natural gas prices.
The demand for our EPCI services from companies in various energy-related industries, particularly the oil and gas exploration and development industry, has traditionally been cyclical, depending primarily on the capital expenditures of oil and gas exploration and development companies. These capital expenditures are influenced by such factors as:
|
|
• |
prevailing oil and natural gas prices; |
|
|
• |
expectations about future prices; |
|
|
• |
the cost of exploring for, producing and delivering hydrocarbons; |
|
|
• |
the sale and expiration dates of available offshore leases; |
|
|
• |
the discovery rate, size and location of new hydrocarbon reserves, including in offshore areas; |
|
|
• |
the rate of decline of existing hydrocarbon reserves; |
|
|
• |
laws and regulations related to environmental matters, including those addressing alternative energy sources and the risks of global climate change; |
|
|
• |
the development and exploitation of alternative fuels or energy sources; |
|
|
• |
domestic and international political, military, regulatory and economic conditions; |
|
|
• |
technological advances, including technology related to the exploitation of shale oil; and |
|
|
• |
the ability of oil and gas companies to generate funds for capital expenditures. |
Prices for oil and natural gas have historically been, and we anticipate they will continue to be, extremely volatile and react to changes in the supply of and demand for oil and natural gas (including changes resulting from the ability of the Organization of Petroleum Exporting Countries to establish and maintain production quotas), domestic and worldwide economic conditions and political instability in oil producing countries. Material declines in oil and natural gas prices have affected, and will likely continue to affect, the demand for and pricing of our EPCI services. Since the start of the cyclical oil price decline in the fourth quarter of 2014, many oil and gas exploration and development companies and other energy companies have made significant reductions in their capital expenditure budgets. In particular, some of our customers reduced their spending on exploration, development and production programs, new LNG import and export facilities and power plant projects. Although oil prices have increased, on a relative basis in the recent short term, sustained lower relative prices, have adversely affected demand for our services and lower relative prices compared to recent pricing levels could, over a sustained period of time, have a material adverse effect on our business, financial condition, results of operations and cash flows.
|
|
66 |
|
OTHER INFORMATION
Our results of operations and operating cash flows depend on us obtaining significant EPCI contracts, primarily from companies in the oil and gas exploration and development, petrochemical, natural resources and power industries. The timing of or failure to obtain contracts, delays in awards of contracts, cancellations of contracts, delays in completion of contracts, or failure to obtain timely payments from our customers, could result in significant periodic fluctuations in our results of operations and operating cash flows. In addition, many of our contracts require us to satisfy specific progress or performance milestones in order to receive payment from the customer. As a result, we may incur significant costs for engineering, materials, components, equipment, labor or subcontractors prior to receipt of payment from a customer. Such expenditures could reduce our cash flows and necessitate borrowings under our credit agreements. If customers do not proceed with the completion of significant projects or if significant defaults on customer payment obligations to us arise, or if we encounter disputes with customers involving such payment obligations, we may face difficulties in collecting payment of amounts due to us, including for costs we previously incurred. In addition, some of our customers for large EPCI projects are project-specific entities that do not have significant assets other than their interests in the EPCI project, and it may be even more difficult to collect amounts owed to us by those customers if any of the problems or issues referred to above arise. Our failure to collect amounts owed to us could have a material adverse effect on our business, financial condition, results of operations and cash flows.
We are subject to risks associated with contractual pricing in our industry, including the risk that, if our actual costs exceed the costs we estimate on our fixed-price contracts, our profitability will decline, and we may suffer losses.
We offer our customers a range of commercial options for our contracts, including fixed-price, cost-reimbursable and hybrid, which has both fixed-price and cost-reimbursable components. Under fixed-price contracts, we perform our services and execute our projects at an established price. Under cost-reimbursable contracts, we generally perform our services in exchange for a price that consists of reimbursement of all customer-approved costs and a profit component, which is typically a fixed rate per hour, an overall fixed fee, or a percentage of total reimbursable costs. Under cost-reimbursable contracts, if we are unable to obtain proper reimbursement for all costs incurred due to improper estimates, performance issues, customer disputes, or any of the other factors noted below for fixed-price contracts, the project may be less profitable than we expect.
We are engaged in a highly competitive industry, and we have contracted for a substantial number of projects on a fixed-price basis. In many cases, these projects involve complex design and engineering, significant procurement of equipment and supplies and extensive construction management and other activities conducted over extended time periods, sometimes in remote locations. Our actual costs related to these projects could exceed our projections. We attempt to cover the increased costs of anticipated changes in labor, material and service costs of long-term contracts, either through estimates of cost increases, which are reflected in the original contract price, or through price escalation clauses. Despite these attempts, however, the cost and gross profit we realize on a fixed-price contract could vary materially from the estimated amounts because of supplier, contractor and subcontractor performance, our own performance, including the quality and timeliness of work performed, failure to properly estimate costs of engineering, materials, components, equipment, labor or subcontractors, changes in job conditions, unanticipated weather conditions, variations in labor and equipment productivity and associated costs, increases in the cost of raw materials, particularly steel, over the term of the contract, difficulties in obtaining required governmental permits or approvals, changes in laws and regulations and changes in general economic conditions.
In the future, these factors and other risks generally inherent in the industry in which we operate may result in actual revenues or costs being different from those we originally estimated and may result in reduced profitability or losses on projects. Some of these risks include:
|
|
• |
our engineering, procurement and construction projects may encounter difficulties related to the procurement of materials, or due to schedule disruptions, equipment performance failures or other factors that may result in additional costs to us, reductions in revenues, claims or disputes; |
|
|
• |
we may not be able to obtain compensation for additional work we perform or expenses we incur as a result of customer change orders or our customers providing deficient design or engineering information or equipment or materials; |
|
|
• |
we may be required to pay significant amounts of liquidated damages upon our failure to meet schedule or performance requirements of our contracts; and |
|
|
• |
difficulties in engaging third-party subcontractors, equipment manufacturers or materials suppliers or failures by third-party subcontractors, equipment manufacturers or materials suppliers to perform could result in project delays and cause us to incur additional costs. |
|
|
67 |
|
OTHER INFORMATION
Performance problems relating to any significant existing or future contract arising as a result of any of these or other risks could cause our actual results of operations to differ materially from those we anticipate at the time we enter into the contract and could cause us to suffer damage to our reputation within our industry and our customer base. Additionally, we may be at a greater risk of reduced profitability or losses with respect to our contracts with companies in the oil and gas exploration and development industry in the current low-oil-price environment due to pricing pressures, potential difficulties in obtaining customer approvals of change orders or claims, deterioration in contract terms and conditions, including customer-required extended-payment terms, unexpected project delays, suspensions and cancellations or changes or reductions in project scope or schedule and other factors.
Our use of “over time” revenue recognition could result in volatility in our results of operations.
We recognize revenues and profits from our long-term contracts over time as work progresses for contracts that satisfy the criteria for “over time” recognition. Accordingly, we review contract price and cost estimates periodically as the work progresses and reflect adjustments proportionate to the percentage of completion in income in the period when we revise those estimates. To the extent these adjustments result in a reduction or an elimination of previously reported profits with respect to a project, we would recognize a charge against current earnings, which could be material. Our current estimates of our contract costs and the profitability of our long-term projects, although reasonably reliable when made, could change as a result of the uncertainties associated with these types of contracts, and if adjustments to overall contract costs are significant, the reductions or reversals of previously recorded revenues and profits could be material in future periods. In addition, change orders, which are a normal and recurring part of our business, can increase (and sometimes substantially) the future scope and cost of a job. Therefore, change order awards (although frequently beneficial in the long term) can have the short-term effect of reducing the job percentage of completion and thus the revenues and profits that otherwise would be recognized to date. Additionally, to the extent that claims included in our RPOs, including those which arise from change orders which are under dispute or which have been previously rejected by the customer, are not resolved in our favor, there could be reductions in, or reversals of, previously reported amounts of revenues and profits, and charges against current earnings, all of which could be material.
Our RPOs are subject to unexpected adjustments and cancellations.
The revenues projected in our RPOs may not be realized or, if realized, may not result in profits. Because of project cancellations or changes in project scope and schedule, we cannot predict with certainty when or if projects reflected in our RPOs will be performed. In addition, even where a project proceeds as scheduled, it is possible that contracted parties may default and fail to pay amounts owed to us, or poor project performance could increase the cost associated with a project. Delays, suspensions, cancellations, payment defaults, scope changes and poor project execution could materially reduce the revenues and reduce or eliminate profits that we actually realize from projects reflected in our RPOs.
Reductions in our RPOs due to cancellation or modification by a customer or for other reasons may adversely affect, potentially to a material extent, the revenues and earnings we actually receive from contracts included in our RPOs. Many of the contracts included in our RPOs provide for cancellation fees in the event customers cancel projects. These cancellation fees usually provide for reimbursement of our out-of-pocket costs, revenues for work performed prior to cancellation and a varying percentage of the profits we would have realized had the contract been completed. However, we typically have no contractual right upon cancellation to the total revenues reflected in our RPOs. Projects may remain in our RPOs for extended periods of time. If we experience significant project suspensions, cancellations or scope adjustments to contracts reflected in our RPOs, our business, financial condition, results of operations and cash flows may be materially and adversely impacted.
We may be exposed to additional risks as we obtain significant new awards and execute our RPOs, including greater RPOs concentration in fewer projects, potential cost overruns and increasing requirements for letters of credit, each of which could have a material adverse effect on our financial condition, results of operations and cash flows.
As we obtain significant new project awards and convert the RPOs into revenues, these projects may use larger sums of working capital than other projects and may be concentrated among a smaller number of customers. If any significant projects currently included in our RPOs or awarded in the future were to have material cost overruns, or are significantly delayed, modified or canceled, and we are unable to replace the projects in RPOs, our business, financial condition, results of operations and cash flows could be materially and adversely impacted.
Additionally, as we convert our significant projects from RPOs into active operational phases, we may face significantly greater requirements for the provision of working capital, letters of credit or other forms of credit enhancement. We can provide no assurance that we will be able to access such capital and credit as may be needed or that we would be able to do so on terms we believe to be economically attractive.
|
|
68 |
|
OTHER INFORMATION
We may have difficulties integrating CB&I’s business with McDermott’s businesses, and we may not realize all the anticipated benefits of the Combination.
The ultimate success of the Combination will depend in large part on the success of our management in integrating CB&I’s operations, strategies, policies procedures, technologies, systems and personnel with McDermott’s. We may fail to realize some or all of the anticipated benefits of the Combination if the integration process takes longer than expected or is more costly than expected. Our failure to meet the challenges involved in the integration or to otherwise realize any of the anticipated benefits of the Combination, including cost savings and synergies, could impair our operations. We have been devoting significant management attention and resources to the integration efforts.
Potential issues and difficulties we may encounter as we continue the integration process include the following:
|
|
• |
the inability to integrate the respective businesses of CB&I and McDermott in a manner that permits us to achieve the cost savings, operating synergies and follow-on opportunities expected to result from the Combination, which could result in the anticipated benefits of the Combination not being realized partly or wholly in the time frame currently anticipated or at all; |
|
|
• |
lost sales and customers as a result of any historical customers of either or both of the two companies deciding not to do business with us, or deciding to decrease their amount of business in order to reduce their reliance on a single company; |
|
|
• |
integrating personnel from the two companies while maintaining focus on safety and providing consistent, high quality products and customer service; |
|
|
• |
potential unknown liabilities and unforeseen increased expenses, delays or regulatory conditions associated with the Combination; and |
|
|
• |
performance shortfalls as a result of the diversion of management’s attention to the integration process. |
Business issues historically faced by one of McDermott or CB&I may be imputed to the entire operations of the combined enterprise.
To the extent that either McDermott or CB&I has or is perceived by customers to have operational challenges, such as performance, quality, safety issues or workforce issues, those challenges may raise concerns by historical customers of the other company, which may limit or impede our future ability to obtain additional work from those customers.
We could incur substantial expenses related to the integration of CB&I with McDermott.
We expect to incur substantial expenses in connection with the integration of the respective operations, strategies, policies, procedures, technologies, systems and personnel of McDermott and CB&I. There are a large number of systems that must be integrated, including information management, purchasing, accounting and finance, sales, billing, payroll and benefits, fixed asset and lease administration systems and regulatory compliance. There are a number of factors beyond our control that could affect the total amount or the timing of all of the expected integration expenses. Moreover, many of the expenses that will be incurred are, by their nature, difficult to estimate accurately at the present time. These expenses could, particularly in the near term, reduce the savings that McDermott expects to achieve from the elimination of duplicative expenses and the realization of economies of scale and cost savings and revenue enhancements related to the integration of the businesses, and accordingly, any anticipated net benefits may not be achieved in the near term or at all. These integration expenses may result in us taking significant charges against earnings.
The agreements that govern the indebtedness incurred in connection with the Combination contain various covenants that impose restrictions on us and certain of our subsidiaries that may affect our ability to operate our business.
The agreements that govern the indebtedness incurred in connection with the Combination contain various affirmative and negative covenants that, subject to various exceptions, restrict our ability and the ability of certain of our subsidiaries to, among other things, incur indebtedness, allow our property to be subject to liens, make investments and acquisitions, make dividends and other distributions, change the nature of our business, transact business with affiliates, merge or consolidate and sell or convey our assets. In addition, some of the agreements that govern the indebtedness contain covenants that require the maintenance of specified financial ratios. Our ability and our subsidiaries ability to comply with those provisions may be affected by events beyond our control. Failure to comply with our debt covenants could result in an event of default, which, if not cured or waived, could accelerate the applicable repayment obligations.
|
|
69 |
|
OTHER INFORMATION
We have a substantial investment in our marine fleet. At times, a vessel or several vessels may require increased levels of maintenance and capital expenditures, may be less efficient than competitors’ vessels for certain projects, and may experience mechanical failure with the inability to economically return to service. If we are unable to manage our fleet efficiently and find profitable market opportunities for our vessels, our results of operations may deteriorate and our financial condition and cash flows could be materially and adversely affected.
We operate a fleet of construction and multi-service vessels of varying ages. Some of our competitors’ fleets and competing vessels in those fleets may be substantially newer than ours and more technologically advanced. Our vessels may not be capable of serving all markets and may require additional maintenance and capital expenditures, due to age or other factors, creating periods of downtime. In addition, customer requirements and laws of various jurisdictions may limit the use of older vessels or a foreign-flagged vessel, unless we are able to obtain an exception to such requirements and laws, which may not be available. Our ability to continue to upgrade our fleet depends, in part, on our ability to economically commission the construction of new vessels, as well as the availability to purchase in the secondary market newer, more technologically advanced vessels with the capabilities that may be required by our customers. If we are unable to manage our fleet efficiently and find profitable market opportunities for our vessels, our results of operations may deteriorate and our financial condition and cash flows could be materially and adversely affected.
Vessel construction, upgrade, refurbishment and repair projects are subject to risks, including delays and cost overruns, which could have an adverse impact on our available cash resources and results of operations.
We expect to make significant new construction and upgrade, refurbishment and repair expenditures for our vessel fleet from time to time, particularly in light of the aging nature of our vessels and requests for upgraded equipment from our customers. Some of these expenditures may be unplanned. Vessel construction, upgrade, refurbishment and repair projects may be subject to the risks of delay or cost overruns, including delays or cost overruns resulting from any one or more of the following:
|
|
• |
unexpectedly long delivery times for, or shortages of, key equipment, parts or materials; |
|
|
• |
shortages of skilled labor and other shipyard personnel necessary to perform the work; |
|
|
• |
shipyard delays and performance issues; |
|
|
• |
failures or delays of third-party equipment vendors or service providers; |
|
|
• |
unforeseen increases in the cost of equipment, labor and raw materials, particularly steel; |
|
|
• |
work stoppages and other labor disputes; |
|
|
• |
unanticipated actual or purported change orders; |
|
|
• |
disputes with shipyards and suppliers; |
|
|
• |
design and engineering problems; |
|
|
• |
latent damages or deterioration to equipment and machinery in excess of engineering estimates and assumptions; |
|
|
• |
financial or other difficulties at shipyards; |
|
|
• |
interference from adverse weather conditions; |
|
|
• |
difficulties in obtaining necessary permits or in meeting permit conditions; and |
|
|
• |
customer acceptance delays. |
Significant cost overruns or delays could materially affect our financial condition and results of operations. Additionally, capital expenditures for vessel construction, upgrade, refurbishment and repair projects could materially exceed our planned capital expenditures. The failure to complete such a project on time, or the inability to complete it in accordance with its design specifications, may, in some circumstances, result in loss of revenues, penalties, or delay, renegotiation or cancellation of a contract. In the event of termination of one of these contracts, we may not be able to secure a replacement contract on as favorable terms. Moreover, our vessels undergoing upgrade, refurbishment and repair activities may not earn revenues during periods when they are out of service.
|
|
70 |
|
OTHER INFORMATION
A change in tax laws could have a material adverse effect on us by substantially increasing our corporate income taxes and, consequently, decreasing our future net income and increasing our future cash outlays for taxes.
As a result of a reorganization completed in 1982, McDermott International, Inc. is a corporation organized under the laws of the Republic of Panama. Tax legislative proposals intending to eliminate some perceived tax advantages of companies that have legal domiciles outside the U.S. but operate in the U.S. through one or more subsidiaries have been introduced in the U.S. Congress in recent years. Recent examples include, but are not limited to, legislative proposals that would broaden the circumstances in which a non-U.S. company would be considered a U.S. resident for U.S. tax purposes. It is possible that, if legislation were to be enacted in these areas, we could be subject to a substantial increase in our corporate income taxes and, consequently, a decrease in our future net income and an increase in our future cash outlays for taxes. We are unable to predict the form in which any proposed legislation might become law or the nature of regulations that may be promulgated under any such future legislative enactments. For a discussion of the impact of the new U.S. tax legislation on our financial results, see Note 17, Income Taxes, to the Financial Statements.
Our operations are subject to operating risks and limits on insurance coverage, which could expose us to potentially significant liabilities and costs.
We are subject to a number of risks inherent in our operations, including:
|
|
• |
accidents resulting in injury or the loss of life or property; |
|
|
• |
environmental or toxic tort claims, including delayed manifestation claims for personal injury or loss of life; |
|
|
• |
pollution or other environmental mishaps; |
|
|
• |
hurricanes, tropical storms and other adverse weather conditions; |
|
|
• |
mechanical or equipment failures, including with respect to newer technologies; |
|
|
• |
collisions; |
|
|
• |
property losses; |
|
|
• |
business interruption due to political action or terrorism (including in foreign countries) or other reasons; and |
|
|
• |
labor stoppages. |
We have been, and in the future we may be, named as defendants in lawsuits asserting large claims as a result of litigation arising from events such as these. In addition, we design, engineer, procure, construct, install and provide services (including fabrication of pipe, tanks, platforms and other large, complex structures) for large industrial facilities in which system failure can be disastrous. We may be subject to claims resulting from the subsequent operations of facilities we have designed, engineered, constructed or installed or for which we have provided other services. Under some of our contracts, we must use customer-specified metals or processes for producing or fabricating items for our customers. The failure of any of these metals or processes (whether or not customer-specified) could result in warranty claims against us for significant replacement or rework costs, which could have a material adverse effect on our business, financial condition, results of operations and cash flows.
Insurance against some of the risks inherent in our operations is either unavailable or available only at rates that we consider uneconomical. Also, catastrophic events customarily result in decreased coverage limits, more limited coverage, additional exclusions in coverage, increased premium costs and increased deductibles and self-insured retentions. Risks that we have frequently found difficult to cost-effectively insure against include, but are not limited to, business interruption (including from the loss of or damage to a vessel), property losses from wind, flood and earthquake events, war and confiscation or seizure of property (including by act of piracy), acts of terrorism, strikes, riots, civil unrest and malicious damage, pollution liability, liabilities related to occupational health exposures (including asbestos), professional liability, such as errors and omissions coverage, coverage for costs incurred for investigations related to breaches of laws or regulations, the failure, misuse or unavailability of our information systems or security measures related to those systems, and liability related to risk of loss of our work in progress and customer-owned materials in our care, custody and control. Depending on competitive conditions and other factors, we endeavor to obtain contractual protection against certain uninsured risks from our customers. When obtained, such contractual indemnification protection may not be as broad as we desire or may not be supported by adequate insurance maintained by the customer. Such insurance or contractual indemnity protection may not be sufficient or effective under all circumstances or against all hazards to which we may be subject. A successful claim for which we are not insured, for which we are underinsured or for which our contractual indemnity is insufficient could have a material adverse effect on us.
|
|
71 |
|
OTHER INFORMATION
We have captive insurance company subsidiaries which provide us with various insurance coverages. Claims could adversely impact the ability of our captive insurance company subsidiaries to respond to all claims presented.
Additionally, upon the February 2006 consummation of the Chapter 11 proceedings involving several subsidiaries of our former subsidiary, the Babcock & Wilcox Company, most of our then-existing subsidiaries contributed substantial insurance rights providing coverage for, among other things, asbestos and other personal injury claims, to the asbestos personal injury trust. With the contribution of these insurance rights to the asbestos personal injury trust, we may have underinsured or uninsured exposure for non-derivative asbestos claims or other personal injury or other claims that would have been insured under these coverages had the insurance rights not been contributed to the asbestos personal injury trust.
Our failure to successfully defend against claims made against us by customers, suppliers or subcontractors, or our failure to recover adequately on claims made by us against customers, suppliers or subcontractors, could have a material adverse effect on our business, financial condition, results of operations and cash flows.
Our projects generally involve complex design and engineering, significant procurement of equipment and supplies and construction management. We may encounter difficulties in design or engineering, equipment or supply delivery, schedule changes and other factors, some of which are beyond our control, that affect our ability to complete projects in accordance with the original delivery schedules or to meet other contractual performance obligations. We occasionally bring claims against customers for additional costs exceeding contract prices or for amounts not included in original contract prices. These types of claims may arise due to matters such as customer-caused delays or changes from the initial project scope, which may result in additional costs, both direct and indirect. From time to time, claims are the subject of lengthy and expensive arbitration or litigation proceedings, and it is often difficult to accurately predict when those claims will be fully resolved. When these types of events occur, and unresolved claims are pending, we may invest significant working capital in projects to cover cost overruns pending the resolution of the claims. In addition, claims may be brought against us by customers in connection with our contracts. Claims brought against us may include back charges for alleged defective or incomplete work, breaches of warranty and/or late completion of the work and claims for cancelled projects. The claims can involve actual damages, as well as contractually agreed-upon liquidated sums. Claims among us and our suppliers and subcontractors include claims similar to those described above. These claims, if not resolved through negotiation, may also become subject to lengthy and expensive arbitration or litigation proceedings. Claims among us, our customers, suppliers and subcontractors could have material adverse effect on our business, financial condition, results of operations and cash flows.
In addition, we are from time to time involved in various litigation and other matters related to hazardous substances encountered in our business. In particular, the numerous operating hazards inherent in our business increase the risk of toxic tort litigation relating to any and all consequences arising out of human exposure to hazardous substances, including, without limitation, current or past claims involving asbestos-related materials, formaldehyde, Cesium 137 (radiation), mercury and other hazardous substances, or related environmental damage. As a result, we are subject to potentially material liabilities related to personal injuries or property damages that may be caused by hazardous substance releases and exposures. The outcome of such litigation is inherently uncertain and adverse developments or outcomes can result in significant monetary damages, penalties, other sanctions or injunctive relief against us, limitations on our property rights, or regulatory interpretations that increase our operating costs. If any of these disputes result in a substantial monetary judgment against us or an adverse legal interpretation is settled on unfavorable terms, or otherwise affects our operations, it could have a material adverse effect on our business, financial condition, results of operations and cash flows.
We depend on a relatively small number of customers.
We derive a significant amount of our revenues and profits from a relatively small number of customers in a given year. Our significant customers include major integrated and national oil and gas exploration and development companies. Revenues from Saudi Aramco represented 63% of our total (pre-Combination) consolidated revenues for the year ended December 31, 2017. As of June 30, 2018, approximately 14% of our contractual RPOs were attributable to Saudi Aramco. Our inability to continue to perform substantial services for our large existing customers (whether due to our failure to satisfy their bid tender requirements, disappointing project performance, changing political conditions and changing laws and policies affecting trade and investment, disagreements with respect to new (or potentially new) ventures or other business opportunities), or delays in collecting receivables from these customers, could have a material adverse effect on our business and operations.
|
|
72 |
|
OTHER INFORMATION
We may not be able to compete successfully against current and future competitors.
The industry in which we operate is highly competitive and requires substantial resources and capital investment in equipment, technology and skilled personnel. Several of our competitors have greater financial or other resources than we have. Competition also places downward pressure on our contract prices and margins. Intense competition is expected to continue in our markets, presenting us with significant challenges in our ability to maintain strong growth rates and acceptable margins. In particular, some of our competitors or potential competitors serving the offshore oil and gas exploration and development industry offer a broader range of SPS and SURF services than we provide and have been gaining success in marketing those services on an integrated or “packaged” basis to customers around the world. Our operations may be adversely affected if our current competitors or new market entrants successfully offer SPS and SURF services on an integrated basis in a manner that we may be unable to match, even with our alliance and joint venture arrangements, or introduce new facility designs or improvements to engineering, procurement, construction or installation services. If we are unable to meet these and other competitive challenges, we could lose market share to our competitors and experience reductions in our results of operations and cash flows.
Our employees work on projects that are inherently dangerous. If we fail to maintain safe work sites, we can be exposed to significant financial losses and reputational harm.
Safety is a leading focus of our business, and our safety record is critical to our reputation and is of paramount importance to our employees, customers and stockholders. However, we often work on large-scale and complex projects which can place our employees and others near large mechanized equipment, moving vehicles, dangerous processes or highly regulated materials and in challenging environments. Although we have a functional group whose primary purpose is to implement effective quality, health, safety, environmental and security procedures throughout our company, if we fail to implement effective safety procedures, our employees and others may become injured, disabled or lose their lives, our projects may be delayed and we may be exposed to litigation or investigations.
Unsafe conditions at project work sites also have the potential to increase employee turnover, increase project costs and raise our operating costs. Additionally, many of our customers require that we meet certain safety criteria to be eligible to bid for contracts and our failure to maintain adequate safety standards, could result in reduced profitability, or lost project awards or customers. Any of the foregoing could result in financial losses or reputational harm, which could have a material adverse impact on our business, financial condition, and results of operations.
We are exposed to potential risks and uncertainties associated with our use of joint venture arrangements and our subcontracting and vendor arrangements to execute certain projects.
In the ordinary course of business, we execute specific projects and conduct certain operations through joint venture, consortium and other collaborative arrangements (collectively referred to as “joint ventures”). We have various ownership interests in these joint ventures, with such ownership typically proportionate to our decision-making and distribution rights. Services may be performed directly by the joint ventures or in combination with us or our co-venturers.
The use of these joint ventures exposes us to a number of risks, including the risk that our co-venturers may be unable or unwilling to provide their share of capital investment to fund the operations of the joint ventures or complete their obligations to us, the joint ventures, or ultimately, the customers. Differences in opinions or views among co-venturers could also result in delayed decision-making or failure to agree on material issues, which could adversely affect the business and operations of the applicable joint venture. In addition, agreement terms may subject us to joint and several liability for our co-venturers, and the failure of our co-venturers to perform their obligations could impose additional performance and financial obligations on us. These factors could result in unanticipated costs to complete projects, liquidated damages or contract disputes, including claims against our co-venturers, any of which could have a material adverse effect on our business, financial condition, results of operations and cash flows.
Additionally, we rely on third parties, including equipment manufacturers and subcontractors to assist in the completion of our projects. To the extent these parties cannot execute their portion of the work and are unable to deliver their services, equipment or materials according to the contractual terms, or to the extent we cannot engage subcontractors or acquire equipment or materials, our ability to complete a project in a timely manner may be impacted. If the amount we are required to pay for these goods and services exceeds the amount we have included in the estimates for our work, we could experience project losses or a reduction in estimated profitability.
|
|
73 |
|
OTHER INFORMATION
We face risks associated with investing in foreign subsidiaries and joint ventures, including the risks that our joint ventures may not be able to effectively or efficiently manage their operations, that joint ventures operations create a liability, known or unknown and that we may be restricted in our ability to access the cash flows or assets of those entities.
We conduct substantial operations through foreign subsidiaries and joint ventures. We do not fully control all of our joint ventures. Even in those joint ventures that we fully control, we may be required to consider the interests of the other joint venture participants in connection with decisions concerning the operations of the joint ventures, which in our belief may not be as efficient or effective as in our wholly owned subsidiaries. We may also be affected by the known or unknown actions or omissions of the joint venture and the other joint venture participants, to the extent that they affect the operations of the applicable joint venture. We may experience difficulties relating to the assimilation of personnel, services and systems in the joint venture’s operations or the appropriate transfer of communications and data between us and the joint venture. Any failure to efficiently and effectively operate a joint venture with the other joint venture participants may cause us to fail to realize the anticipated benefits of entering into the joint venture and could adversely affect our operating results for the joint venture. Also, our foreign subsidiaries and joint ventures sometimes face governmentally imposed restrictions on their ability to transfer funds to us. As a result, arrangements involving foreign subsidiaries and joint ventures may restrict us from gaining access to the cash flows or assets of these entities. Additionally, complexities may arise from the termination of our ownership interests in foreign subsidiaries and joint ventures (whether through a sale of equity interests, dissolution, winding-up or otherwise). Those complexities may include issues such as proper valuations of assets, provisions for resolution of trailing liabilities and other issues as to which we may not be aligned with other owners, participants, creditors, customers, governmental entities or other persons or entities that have relationships with such foreign subsidiaries and joint ventures. Resolution of any such issues could give rise to unanticipated expenses or other cash outflows, the loss of potential new contracts or other adverse impacts on our business, any of which could have a material adverse effect on us.
Our international operations are subject to political, economic and other uncertainties.
We derive substantial revenues from international operations. Our international operations are subject to political, economic and other uncertainties. These include:
|
|
• |
risks of war, terrorism, piracy and civil unrest; |
|
|
• |
expropriation, confiscation or nationalization of our assets; |
|
|
• |
renegotiation or nullification of our existing contracts; |
|
|
• |
changing political conditions and changing laws and policies affecting trade and investment; |
|
|
• |
increased costs, lower revenues and RPOs and decreased liquidity resulting from a full or partial break-up of the EU or its currency, the Euro; |
|
|
• |
the lack of well-developed legal systems in some countries in which we make capital investments, operate or provide services, which could make it difficult for us to enforce our rights; |
|
|
• |
overlap of different tax structures; |
|
|
• |
risk of changes in currency exchange rates and currency exchange restrictions that limit our ability to convert local currencies into U.S. dollars; and |
|
|
• |
risks associated with the assertion of national sovereignty over areas in which our operations are conducted. |
We also may be particularly susceptible to regional conditions that may adversely affect our operations. Our major marine construction vessels typically require relatively long periods of time to mobilize over long distances, which could affect our ability to withdraw them from areas of conflict. Additionally, certain of our fabrication facilities are located in regions where conflicts may occur and limit or disrupt our operations. Certain of our insurance coverages could also be cancelled by our insurers. The impacts of these risks are very difficult to cost effectively mitigate or insure against and, in the event of a significant event impacting the operations of one or more of our fabrication facilities, we will very likely not be able to easily replicate the fabrication capacity needed to meet existing contractual commitments, given the time and cost involved in doing so. Any failure by us to meet our material contractual commitments could give rise to loss of revenues, claims by customers and loss of future business opportunities, which could have a material adverse effect on our business, financial condition, results of operations and cash flows.
|
|
74 |
|
OTHER INFORMATION
Various foreign jurisdictions have laws limiting the right and ability of foreign subsidiaries and joint ventures to pay dividends and remit earnings to affiliated companies. Our international operations sometimes face the additional risks of fluctuating currency values, hard currency shortages and controls of foreign currency exchange.
Employee, agent, representative or co-venturer misconduct or our overall failure to comply with laws or regulations could weaken our ability to win contracts, lead to the suspension of our operations and result in reduced revenues and profits.
Misconduct, fraud, non-compliance with applicable laws and regulations, or other improper activities or detrimental business practices by one or more of our employees, agents, representatives or co-venturers (or any of their employees, agents or representatives) could have a significant negative impact on our business and reputation, even if unrelated to the conduct of our business and otherwise unrelated to us. Such misconduct could include the failure to comply with regulations on lobbying or similar activities, regulations pertaining to the internal control over financial reporting and various other applicable laws or regulations. The precautions we and our joint ventures take to prevent and detect fraud, misconduct or failures to comply with applicable laws and regulations may not be effective. A failure by our or any of our joint ventures’ employees, agents or representatives to comply with applicable laws or regulations or acts of fraud or misconduct or other improper activities or detrimental business practices, even if unrelated to the conduct of our business and otherwise unrelated to us, could subject us to fines and penalties, lead to the suspension of operations and/or result in reduced revenues and profits.
We could be adversely affected by violations of the U.S. Foreign Corrupt Practices Act, U.K. Bribery Act, other applicable worldwide anti-corruption laws or our 1976 Consent Decree.
The U.S. Foreign Corrupt Practices Act (“FCPA”) and other applicable worldwide anti-corruption laws generally prohibit companies and their intermediaries from making improper payments to government officials for the purpose of obtaining or retaining business. These laws include the U.K. Bribery Act, which is broader in scope than the FCPA, as it contains no facilitating payments exception. Additionally, in 1976 we entered into a Consent Decree with the SEC, which, among other things, forbids us from making payments in the nature of a commercial bribe to any customer or supplier to induce the purchase or sale of goods, services or supplies. We and several of our joint ventures operate in some countries that international corruption monitoring groups have identified as having high levels of corruption. Those activities create the risk of unauthorized payments or offers of payments by one of our employees, agents or representatives (or those of our joint ventures) that could be in violation of the FCPA or other applicable anti-corruption laws. Our training program and policies mandate compliance with applicable anti-corruption laws and the 1976 Consent Decree. Additionally, our global operations include the import and export of goods and technologies across international borders, which requires a robust compliance program. Although we have policies, procedures and internal controls in place to monitor internal and external compliance, we cannot assure that our policies and procedures will protect us from governmental investigations or inquiries surrounding actions of our employees, agents or representatives (or those of our joint ventures). If we or any of our joint ventures are found to be liable for violations of the FCPA, other applicable anti-corruption laws, other applicable laws and regulations or the 1976 Consent Decree (either due to our own acts or our inadvertence, or due to the acts or inadvertence of others), civil and criminal penalties or other sanctions could be imposed, and negative or derivative consequences could materialize, all of which could have a material adverse effect on our business, financial condition, results of operations and cash flows.
Environmental laws and regulations and civil liability for contamination of the environment or related personal injuries may result in increases in our operating costs and capital expenditures and decreases in our earnings and cash flows.
Governmental requirements relating to the protection of the environment, including those requirements relating to solid waste management, air quality, water quality, generation, storage, handling, treatment and disposal of waste materials and cleanup of contaminated sites, as well as laws and regulations relating to human health and safety, have had a substantial impact on our operations. These requirements are complex and subject to frequent change as well as new restrictions. For example, because of concerns that carbon dioxide, methane and certain other so-called “greenhouse gases” in the Earth’s atmosphere may produce climate changes that have significant adverse impacts on public health and the environment, various governmental authorities have considered and are continuing to consider the adoption of regulatory strategies and controls designed to reduce the emission of greenhouse gases resulting from regulated activities, which adoption in areas where we conduct business could require us or our customers to incur added costs to comply, may result in delays in pursuit of regulated activities and could adversely affect demand for the oil and natural gas that our customers produce, thereby potentially limiting the demand for our services. Failure to comply with these requirements may result in the assessment of administrative, civil and criminal penalties, the imposition of investigatory or remedial obligations or the issuance of orders enjoining performance of some or all of our operations. In some cases, they can impose liability for the entire cost of cleanup on any responsible party without regard to negligence or fault and impose liability on us for the conduct of others or conditions others have caused, or for our acts that complied with all applicable requirements when we performed them. Our compliance with amended, new or more stringent requirements, stricter interpretations of existing requirements or the future discovery
|
|
75 |
|
OTHER INFORMATION
of contamination may require us to make material expenditures or subject us to liabilities that we currently do not anticipate. Such expenditures and liabilities could have a material adverse effect on our business, financial condition, results of operations and cash flows.
In addition, business often involves working around and with volatile, toxic and hazardous substances and other highly regulated pollutants, substances or wastes, for which the improper characterization, handling or disposal could constitute violations of U.S. federal, state or local laws and regulations and laws of other countries, and result in criminal and civil liabilities. Environmental laws and regulations generally impose limitations and standards for certain pollutants or waste materials and require us to obtain permits and comply with various other requirements. Governmental authorities may seek to impose fines and penalties on us, or revoke or deny issuance or renewal of operating permits for failure to comply with applicable laws and regulations. We are also exposed to potential liability for personal injury or property damage caused by any release, spill, exposure or other accident involving such pollutants, substances or wastes. Furthermore, we provide certain environmental remediation services.
We may incur liabilities that may not be covered by insurance policies, or, if covered, the financial amount of such liabilities may exceed our policy limits or fall within applicable deductible or retention limits. A partially or completely uninsured claim, if successful and of significant magnitude, could cause us to suffer a significant loss and reduce cash available for our operations.
In connection with the historical operation of our facilities, including those associated with acquired operations, substances which currently are or might be considered hazardous were used or disposed of at some sites that will or may require us to make expenditures for remediation. In addition, we have agreed to indemnify parties from whom we have purchased or to whom we have sold facilities for certain environmental liabilities arising from acts occurring before the dates those facilities were transferred.
Our businesses require us to obtain, and to comply with, government permits, licenses and approvals.
Our businesses are required to obtain, and to comply with, government permits, licenses and approvals. Any of these permits, licenses or approvals may be subject to denial, revocation or modification under various circumstances. Failure to obtain or comply with the conditions of permits, licenses or approvals may adversely affect our operations by temporarily suspending our activities or curtailing our work and may subject us to penalties and other sanctions. Although existing permits and licenses are routinely renewed by various regulators, renewal could be denied or jeopardized by various factors, including:
|
|
• |
failure to provide adequate financial assurance for closure; |
|
|
• |
failure to comply with environmental and safety laws and regulations or permit conditions; |
|
|
• |
local community, political or other opposition; |
|
|
• |
executive action; and |
|
|
• |
legislative action. |
In addition, if new environmental legislation or regulations are enacted or implemented, or existing laws or regulations are amended or are interpreted or enforced differently, we may be required to obtain additional operating permits, licenses or approvals. Our inability to obtain, and to comply with, the permits, licenses and approvals required for our businesses could have a material adverse effect on us.
Our customers’ and our co-venturers’ abilities to receive applicable regulatory and environmental approvals for our projects and the timeliness of those approvals could adversely affect us.
The regulatory permitting process for various of our projects, particularly power projects, requires significant investments of time and money by our customers and sometimes by us and our co-venturers. There are no assurances that we or our customers will obtain the necessary permits for these projects. Applications for permits to operate newly constructed facilities, including air emissions permits, may be opposed by government entities, individuals or environmental groups, resulting in delays and possible non-issuance of the permits.
|
|
76 |
|
OTHER INFORMATION
We are subject to government regulations that may adversely affect our future operations.
Many aspects of our operations and properties are affected by political developments and are subject to both domestic and foreign governmental regulations, including those relating to:
|
|
• |
constructing and equipping of production platforms and other offshore facilities; |
|
|
• |
marine vessel safety; |
|
|
• |
the operation of foreign-flagged vessels in coastwise trade; |
|
|
• |
currency conversions and repatriation; |
|
|
• |
oil exploration and development; |
|
|
• |
clean air and other environmental protection legislation; |
|
|
• |
taxation of foreign earnings and earnings of expatriate personnel; |
|
|
• |
required use of local employees and suppliers by foreign contractors; and |
|
|
• |
requirements relating to local ownership. |
In addition, we depend to a large extent on the demand for our services from the oil and gas exploration and development industry and, therefore, we are generally affected by changing taxes and price controls, as well as new or amendments to existing laws, regulations, or other government controls imposed on the oil and gas exploration and development industry generally, whether due to a particular incident or because of shifts in political decision making. The adoption of laws and regulations curtailing offshore exploration and development drilling for oil and gas for economic and other policy reasons could adversely affect our operations by limiting the demand for our services. In the U.S. Gulf of Mexico, regulatory initiatives developed and implemented at the federal level have imposed stringent safety, permitting and certification requirements on oil and gas companies pursuing exploration, development and production activities, which, at times, have resulted in increased compliance costs, added delays in drilling and a more aggressive enforcement regimen by regulators.
Additionally, certain ancillary activities related to the offshore construction business, including the transportation of personnel and equipment between ports and the fields of work in the same country’s waters, may constitute “coastwise trade” within the meaning of laws and regulations of the U.S. and other countries. Under these laws and regulations, often referred to as cabotage laws, including the Merchant Marine Act of 1920, as amended (the “Jones Act”), in the U.S., only vessels meeting specific national ownership and registration requirements or which are subject to an exception or exemption, may engage in such “coastwise trade.” When we operate our foreign-flagged vessels, we operate within the current interpretation of such cabotage laws with respect to permitted activities for foreign-flagged vessels. Significant changes in cabotage laws or to the interpretation of such laws in the places where we perform offshore activities could affect our ability to operate, or competitively operate, our foreign-flagged vessels in those waters. We are also subject to the risk of the enactment or amendment of cabotage laws in other jurisdictions in which we operate, which could negatively impact our operations in those jurisdictions.
We cannot determine the extent to which our future operations and earnings may be affected by new legislation, new regulations or changes in existing regulations.
The loss of the services of one or more of our key personnel, or our failure to attract, assimilate and retain trained personnel at a competitive cost, or decreased productivity of such personnel, could disrupt our operations and result in loss of revenues.
Our success depends on the continued active participation of our executive officers and key operating personnel. The unexpected loss of the services of any one of these persons could adversely affect our operations and future operating results. In addition, current and prospective employees may experience uncertainty about their future roles until after the integration of the CB&I business with the McDermott business is complete. This may adversely affect our ability to attract and retain key personnel, which could adversely affect our performance during the integration period.
|
|
77 |
|
OTHER INFORMATION
Our operations require the services of employees having the technical training and experience necessary to obtain the proper operational results. As such, our operations depend, to a considerable extent, on the continuing availability and productivity of such personnel. If we should suffer any material loss of personnel to competitors, have decreased labor productivity of employed personnel for any reason, or be unable to employ additional or replacement personnel with the requisite level of training and experience to adequately operate our businesses, our operations could be adversely affected. A significant increase in the wages or other compensation paid by other employers could result in a reduction in our workforce, increases in wage rates, or both. Our industry has historically experienced high demand for the services of employees and escalating wage rates. If any of these events occurred for a significant period of time, they could have a material adverse effect on our business, financial condition, results of operations and cash flows.
Work stoppages, union negotiations and other labor problems could adversely affect us.
A portion of our employees are represented by labor unions. A lengthy strike or other work stoppage at any of our facilities or involving any of our significant projects could have an adverse effect on us. There is inherent risk that ongoing or future negotiations relating to collective bargaining agreements or union representation may not be favorable to us. From time to time, we also have experienced attempts to unionize some of our nonunion operations. Such efforts can often disrupt or delay work and present risk of labor unrest.
We rely on intellectual property law and confidentiality agreements to protect our intellectual property. We also rely on intellectual property we license from third parties. Our failure to protect our intellectual property rights, our inability to obtain or renew licenses to use intellectual property of third parties, or the obsolescence of our technology, could adversely affect our business.
We believe that we are an industry leader by owning or having access to our technologies. We protect our technology positions through patent registrations, license restrictions and our research and development program. However, our intellectual property could be challenged, invalidated, circumvented or rendered unenforceable. In addition, effective intellectual property protection may be limited or unavailable in some foreign countries where we operate. Further, our competitors may independently develop or obtain access to technologies that are similar or superior to our technologies.
Our failure to protect our intellectual property rights may result in the loss of valuable technologies or adversely affect our competitive business position. We rely significantly on proprietary technology, information, processes and know-how that are not subject to patent or copyright protection. We seek to protect this information through trade secret or confidentiality agreements with our employees, consultants, subcontractors or other parties, as well as through other security measures. These agreements and security measures may be inadequate to deter or prevent misappropriation of our confidential information. In the event of an infringement of our intellectual property rights, a breach of a confidentiality agreement or divulgence of proprietary or confidential information, we may not have adequate legal remedies to protect our intellectual property or other proprietary and confidential information. Litigation to determine the scope of our legal rights, even if ultimately successful, could be costly and could divert management’s attention away from other aspects of our business.
In some instances, we have augmented our technology base by licensing the proprietary intellectual property of third parties. In the future, we may not be able to obtain necessary licenses on commercially reasonable terms, which could adversely affect our business.
We rely on information technology systems and other information technologies to conduct our business, and any failure, interruption or security breach of these systems or technologies could adversely impact us.
In order to achieve our business objectives, we rely heavily on information technology systems and other information technologies, many of which require regular upgrades or improvements and some of which are approaching the point at which they will need to be replaced in the near future. The failure or interruption of these systems or technologies, or the potential implementation of replacements, particularly with respect to our existing key financial and human resources legacy systems, could have a material adverse effect on us. Also, our implementation of new information technology systems or upgrades to existing systems may not result in improvements at the levels anticipated, or at all. In addition, the implementation of new information technology systems or upgrades to existing systems subjects us to inherent costs and risks, including potential disruptions in our business or in our internal control structure, substantial capital expenditures, the alteration, loss or corruption of data, demands on management time and other risks. Any such disruptions or other effects, if not anticipated and appropriately mitigated, could have a material adverse effect on our business, financial condition, results of operations and cash flows.
|
|
78 |
|
OTHER INFORMATION
Our operations are also subject to the risk of cyberattacks and security breaches. Threats to our information technology systems associated with cybersecurity risks and cyber incidents or attacks continue to grow. In addition, a cyberattack or security breach of some of our systems could go undetected for extended periods of time. As a result of a breach or failure of our computer systems or networks, or those of our customers, vendors or others with whom we do business, or a failure of any of those systems to protect against cybersecurity risks, our business operations could be materially interrupted. In addition, any such breach or failure could result in the alteration, loss, theft or corruption of data or unauthorized release of confidential, proprietary or sensitive data concerning our company, business activities, employees, customers or vendors, as well as increased costs to prevent, respond to, or mitigate cybersecurity attacks. These risks could have a material adverse effect on our business, financial condition, results of operations and cash flows.
Our business strategy includes acquisitions and joint ventures with other parties to continue our growth. Acquisitions of other businesses and joint ventures can create certain risks and uncertainties.
We intend to pursue additional growth through joint ventures, alliances and consortia with other parties as well as the acquisition of businesses or assets that we believe will enable us to strengthen or broaden the types of projects we execute and also expand into new businesses and regions. We may be unable to continue this growth strategy if we cannot identify suitable joint venture, alliance or consortium participants, businesses or assets, reach agreement on acceptable terms or for other reasons. We may also be limited in our ability to pursue acquisitions or joint ventures by the terms and conditions of our current financing arrangements. Moreover, joint ventures, alliances and consortia and acquisitions of businesses and assets involve certain risks, including:
|
|
• |
difficulties relating to the assimilation of personnel, services and systems of an acquired business and the assimilation of marketing and other operational capabilities; |
|
|
• |
challenges resulting from unanticipated changes in customer, supplier or subcontractor relationships subsequent to an acquisition or joint venture, alliance or consortium formation; |
|
|
• |
additional financial and accounting challenges and complexities in areas such as tax planning, treasury management, financial reporting and internal controls; |
|
|
• |
assumption of liabilities of an acquired business, including liabilities that were unknown at the time the acquisition transaction was negotiated; |
|
|
• |
diversion of management’s attention from day-to-day operations; |
|
|
• |
failure to realize anticipated benefits, such as cost savings and revenue enhancements; |
|
|
• |
potentially substantial transaction costs associated with business combinations; and |
|
|
• |
potential impairment of goodwill or other intangible assets resulting from the overpayment for an acquisition. |
Acquisitions and joint ventures may be funded by the issuance of additional equity or new debt financing, which may not be available on attractive terms. Moreover, to the extent an acquisition transaction financed by non-equity consideration results in goodwill, it will reduce our tangible net worth, which might have an adverse effect on potential credit and bonding capacity.
Additionally, an acquisition or joint venture, alliance or consortium may bring us into businesses we have not previously conducted and expose us to additional business risks that are different than those we have historically experienced.
We recorded a significant amount of goodwill as a result of the Combination, and that goodwill could become impaired in the future.
In accordance with Accounting Standards Codification Topic ASC 805, Business Combinations, we are accounting for the Combination in accordance with the acquisition method of accounting for business combinations. We recorded net tangible and identifiable intangible assets acquired and liabilities assumed from CB&I at their respective fair values as of the date of the closing of the Combination. The excess of the purchase price over the fair value of the identifiable assets of CB&I was recorded as goodwill.
We will be required to assess goodwill for impairment at least annually. To the extent goodwill becomes impaired, we may be required to incur material charges relating to such impairment. Such a potential impairment charge could have a material impact on our future operating results and statements of financial position.
|
|
79 |
|
OTHER INFORMATION
We are in the process of establishing tax residency in the United Kingdom (“U.K”), which is requiring us to incur additional costs and expenses.
We are in the process of expanding our presence in the U.K. in order to establish tax residency there. To establish tax residency in the U.K., a company must exercise (in whole or in part) its “central management and control” from within the U.K. The test of “central management and control” is largely a question of fact and degree based on all the circumstances. To satisfy this test, we are expanding our presence in the U.K., including by holding regular meetings of our Board of Directors there. We expect to incur additional costs and expenses, including professional fees, to comply with U.K. tax laws.
We may choose to abandon or delay the establishment of residency in the U.K. for tax purposes.
We may abandon or delay the establishment of residency in the U.K. for tax purposes at any time prior to completing the change of tax residency or receiving a ruling from the applicable tax authorities, particularly if it is determined that completing such change is no longer in our best interests or the best interests of our stockholders or may not result in the expected benefits. Additionally, we may not be able to obtain the requisite rulings from the applicable tax authorities. We can provide no assurance as to when the contemplated change of tax residency will be completed, if at all.
Our results of operations could be affected by natural disasters in locations in which we and our customers and suppliers operate.
Our customers and suppliers have operations in locations that are subject to natural disasters, such as flooding, hurricanes, tsunamis, earthquakes, volcanic eruptions or other disasters. The occurrence of any of these events and the impacts of such events could disrupt and adversely affect the operations of our customers and suppliers as well as our operations in the areas in which these types of events occur.
War, other armed conflicts or terrorist attacks could have a material adverse effect on our business.
War, terrorist attacks and unrest have caused and may continue to cause instability in the world’s financial and commercial markets, have significantly increased political and economic instability in some of the geographic areas in which we operate and have contributed to high levels of volatility in prices for oil and gas. Instability and unrest in the Middle East and Asia, as well as threats of war or other armed conflict elsewhere, may cause further disruption to financial and commercial markets and contribute to even higher levels of volatility in prices for oil and gas. In addition, unrest in the Middle East and Asia, or elsewhere, could lead to acts of terrorism in the United States or elsewhere, and acts of terrorism could be directed against companies such as ours. Also, acts of terrorism and threats of armed conflicts in or around various areas in which we operate, such as the Middle East and Asia, could limit or disrupt our markets and operations, including disruptions from evacuation of personnel, cancellation of contracts or the loss of personnel or assets. Armed conflicts and terrorism, and their effects on us or our markets, may significantly affect our business and results of operations in the future.
Risk Factors Relating to Our Financial Condition and Markets
We are vulnerable to significant fluctuations in our liquidity that may vary substantially over time.
Our operations could require us to utilize large sums of working capital, sometimes on short notice and sometimes without assurance of recovery of the expenditures. Circumstances or events that could create large cash outflows that include increased costs or losses resulting from fixed-price or hybrid contracts, inability to achieve contractual billing or payment milestones, inability to recover unapproved change orders or claims, environmental liabilities, litigation risks, unexpected costs or losses resulting from previous acquisitions, contract initiation or completion delays, political conditions, customer payment problems, foreign exchange risks and professional and product liability claims.
Volatility and uncertainty of the financial markets may negatively impact us.
We intend to finance our existing operations and initiatives, primarily with cash and cash equivalents, investments, cash flows from operations and borrowings from our lenders. We also enter into various financial derivative contracts, including foreign currency forward contracts with banks and other financial institutions, to manage our foreign exchange rate risk. In addition, we maintain our cash balances and short-term investments in accounts held by major banks and financial institutions located primarily in North America, Europe and Asia, and some of those accounts hold deposits that exceed available insurance. If national and international economic conditions deteriorate, it is possible that we may not be able to refinance our outstanding indebtedness when it becomes due,
|
|
80 |
|
OTHER INFORMATION
and we may not be able to obtain alternative financing on favorable terms. It is possible that one or more of the financial institutions in which we hold our cash and investments could become subject to bankruptcy, receivership or similar proceedings. As a result, we could be at risk of not being able to access material amounts of our cash, which could result in a temporary liquidity crisis that could impede our ability to fund operations. Some of our customers, suppliers and subcontractors have traditionally accessed commercial financing and capital markets, as well as government backed export credit agency support to fund their operations or projects, and the availability of funding from those sources could be adversely impacted by a volatile credit markets. A deterioration in the credit markets could adversely affect the ability of many of our customers to pursue new projects requiring our services or to pay us on time, and the ability of many of our suppliers and subcontractors to meet our needs on a competitive basis. Our financial derivative contracts involve credit risk associated with our hedging counterparties, and a deterioration in the financial markets, including the markets with respect to any particular currencies, such as the Euro, could adversely affect our hedging counterparties and their abilities to fulfill their obligations to us.
Our debt and related debt service obligations could have negative consequences.
Our debt and related debt service obligations could have negative consequences, including:
|
|
• |
requiring us to dedicate significant cash flows from operations to the payment of principal, interest and other amounts payable on our debt, which would reduce the funds we have available for other purposes, such as working capital, capital expenditures and acquisitions; |
|
|
• |
making it more difficult or expensive for us to obtain any necessary future financing for working capital, capital expenditures, debt service requirements, debt refinancing, acquisitions or other purposes; |
|
|
• |
reducing our flexibility in planning for or reacting to changes in our industry and market conditions; |
|
|
• |
making us more vulnerable in the event of a downturn in our business; and |
|
|
• |
exposing us to increased interest rate risk given that a portion of our debt obligations are at variable interest rates. |
Maintaining adequate letter of credit and bonding capacity is necessary for us to successfully bid on and win various contracts.
In line with industry practice, we are often required to post standby letters of credit to customers or enter into surety bond arrangements in favor of customers. Those letters of credit and surety bond arrangements generally indemnify or protect customers against our failure to perform our obligations under the applicable contracts. However, the terms of those letters of credit, including terms relating to the customer’s ability to draw upon the letter of credit and the amount of the letter of credit required, can vary significantly. If a letter of credit or surety bond is required for a particular project and we are unable to obtain it due to insufficient liquidity or other reasons, we may not be able to pursue that project. We have limited capacity for letters of credit. Moreover, due to events that affect the credit markets generally, letters of credit may be more difficult to obtain in the future or may only be available at significant additional cost. Letters of credit may not continue to be available to us on reasonable terms. Our inability to obtain adequate letters of credit and surety bonds and, as a result, to bid on new work could have a material adverse effect on our business, financial condition and results of operations.
Foreign exchange risks and fluctuations may affect our profitability on certain projects.
We operate on a worldwide basis with substantial operations outside the U.S. that subject us to currency exchange risks. In order to manage some of the risks associated with foreign currency exchange rates, we enter into foreign currency derivative (hedging) instruments, especially when there is currency risk exposure that is not naturally mitigated via our contracts. However, these actions may not always eliminate all currency risk exposure, in particular for our long-term contracts. A disruption in the foreign currency markets, including the markets with respect to any particular currencies, could adversely affect our hedging instruments and subject us to additional currency risk exposure. We do not enter into derivative instruments for trading or other speculative purposes. Our operational cash flows and cash balances may consist of different currencies at various points in time in order to execute our project contracts globally and meet transactional requirements. Non-U.S. asset and liability balances are subject to currency fluctuations when measured period to period for financial reporting purposes in U.S. dollars.
Pension and post-retirement expenses associated with our retirement benefit plans may fluctuate significantly depending on changes in actuarial assumptions, future market performance of plan assets and legislative or other regulatory actions.
A portion of our current and retired employee population is covered by pension and post-retirement benefit plans, the costs and funding requirements of which depend on various assumptions, including estimates of rates of return on benefit-related assets,
|
|
81 |
|
OTHER INFORMATION
discount rates for future payment obligations, rates of future cost growth and trends for future costs. Variances from these estimates could have a material adverse effect on us. In addition, funding requirements for benefit obligations of our pension and post-retirement benefit plans are subject to legislative and other government regulatory actions.
Risk Factors Relating to Our Common Stock
Provisions in our corporate documents and Panamanian law could delay or prevent a change in control of our company, even if that change may be considered beneficial by some stockholders.
The existence of some provisions of our articles of incorporation and by-laws and Panamanian law could discourage, delay or prevent a change in control of our company that a stockholder may consider favorable. These include provisions:
|
|
• |
providing that our board of directors fixes the number of members of the board; |
|
|
• |
limiting who may call special meetings of stockholders; |
|
|
• |
restricting the ability of stockholders to take action by written consent, rather than at a meeting of the stockholders; |
|
|
• |
establishing advance notice requirements for nominations of candidates for election to our board of directors or for proposing matters that can be acted on by stockholders at stockholder meetings; |
|
|
• |
establishing supermajority vote requirements for certain amendments to our articles of incorporation and by-laws; |
|
|
• |
authorizing a large number of shares of common stock that are not yet issued, which would allow our board of directors to issue shares to persons friendly to current management, thereby protecting the continuity of our management, or which could be used to dilute the stock ownership of persons seeking to obtain control of us; and |
|
|
• |
authorizing the issuance of “blank check” preferred stock, which could be issued by our board of directors to increase the number of outstanding shares in an attempt to thwart a takeover. |
In addition, we are registered with the Panamanian National Securities Commission (the “PNSC”) and, as a result, we are subject to Decree No. 45 of December 5, 1977, of the Republic of Panama, as amended (the “Decree”). The Decree imposes certain restrictions on offers to acquire voting securities of a company registered with the PNSC if, following such an acquisition, the acquiror would own directly or indirectly more than 5% of the outstanding voting securities (or securities convertible into voting securities) of such company, with a market value of at least five million Balboas (approximately $5 million). Under the Decree, any such offeror would be required to provide McDermott with a declaration stating, among other things, the identity and background of the offeror, the source and amount of funds to be used in the proposed transaction and the offeror’s plans with respect to McDermott. In that event, the PNSC may, at our request, hold a public hearing as to the adequacy of the disclosure provided by the offeror. Following such a hearing, the PNSC would either determine that full and fair disclosure had been provided and that the offeror had complied with the Decree or prohibit the offeror from proceeding with the offer until it has furnished the required information and fully complied with the Decree. Under the Decree, such a proposed transaction cannot be consummated until 45 days after the delivery of the required declaration prepared or supplemented in a complete and accurate manner, and our board of directors may, in its discretion, within 15 days of receiving a complete and accurate declaration, elect to submit the transaction to a vote of our stockholders. In that case, the transaction could not proceed until approved by the holders of at least two-thirds of the voting power of the shares entitled to vote at a meeting held within 30 days of the date it is called. If such a vote is obtained, the shares held by the offeror would be required to be voted in the same proportion as all other shares that are voted in favor of or against the offer. If the stockholders approved the transaction, it would have to be consummated within 60 days following the date of that approval. The Decree provides for a civil right of action by stockholders against an offeror who does not comply with the provisions of the Decree. It also provides that certain persons, including brokers and other intermediaries who participate with the offeror in a transaction that violates the Decree, may be jointly and severally liable with the offeror for damages that arise from a violation of the Decree. We have a long-standing practice of not requiring a declaration under the Decree from passive investors who do not express any intent to exercise influence or control over our company and who remain as passive investors, so long as they timely file appropriate information on Schedule 13D or Schedule 13G under the Securities Exchange Act of 1934. This practice is consistent with advice we have received from our Panamanian counsel to the effect that our Board of Directors may waive the protection afforded by the Decree and not require declarations from passive investors who invest in our common stock with no intent to exercise influence or control over our company.
We believe these provisions protect our stockholders from coercive or otherwise unfair takeover tactics by requiring potential acquirors to negotiate with our board of directors and by providing our board of directors with more time to assess any acquisition proposal, and are not intended to make our company immune from takeovers. However, these provisions apply even if the offer may be considered beneficial by some stockholders and could delay or prevent an acquisition that our board of directors determines is not in the best interests of our company and our stockholders.
|
|
82 |
|
OTHER INFORMATION
Our sale or issuance of additional shares of common stock could dilute each stockholder’s share ownership.
Part of our business strategy is to expand into new markets and enhance our position in existing markets throughout the world through the strategic and opportunistic acquisition of complementary businesses. In order to complete future acquisitions or fund our other activities, we may issue equity securities that could dilute our earnings per share and each stockholder’s share ownership in McDermott.
We may issue preferred stock that could dilute the voting power or reduce the value of our common stock.
Our articles of incorporation authorize us to issue, without the approval of our stockholders, one or more classes or series of preferred stock having such designation, powers, preferences and relative, participating, optional and other special rights, including preferences over our common stock respecting dividends and distributions, as our board of directors generally may determine. The terms of one or more classes or series of preferred stock could dilute the voting power or reduce the value of our common stock. For example, we could grant holders of preferred stock the right to elect some number of our directors in all events or on the happening of specified events or the right to veto specified transactions. Similarly, the repurchase or redemption rights or liquidation preferences we could assign to holders of preferred stock could affect the residual value of the common stock.
Rule 10b5-1Plans—Certain of our officers and directors may from time to time enter into Rule 10b5-1 sales plans with brokers unaffiliated with McDermott whereby they commit to sell automatically and without discretion a predetermined number of shares of McDermott’s common stock over a period of time according to their own individual criteria. Rule 10b5-1 plans permit individuals who are not in possession of material non-public information to establish pre-arranged plans to buy or sell McDermott common stock. These plans can minimize the market effect of insider purchases or sales by spreading these purchases or sales over a more extended period than the limited trading “windows” designated by McDermott’s securities trading policy.
Under McDermott’s securities trading policy, Rule 10b5-1 stock sales or purchase plans are required to be approved by our general counsel. McDermott expects that any public disclosure regarding purchases or sales under these Rule 10b5-1 plans will be provided through Form 4 and Rule 144 filings with the U.S. Securities and Exchange Commission. McDermott does not intend to disclose further information regarding the existence or terms of these trading plans for individual participants.
Amazon Modifications—On July 27, 2018, we entered into agreements (the “Amazon Modification Agreements”) providing for certain modifications to the Amazon vessel and related financing and amended bareboat charter arrangements.
The Amazon, a pipelay and construction vessel, was purchased by McDermott in February 2017, sold to an unrelated third party (the “Amazon Owner”) and leased back under a long-term bareboat charter that gives us the right to use the vessel. The modifications will consist of removing the existing tower and replacing it with a J-lay system with 1,500 metric tons (1,630 tons) of dynamic top tension on the tower, which will enable large subsea structures and hex sections of pipelines from 4.5 to 24 inches (11 to 60 centimeters) to be installed. The Amazon modifications will include an integrated multi-joint facility, where single joints will be welded to form hex joints. The 10,000 metric tons (11,023 tons) of existing cargo space onboard will remove the requirement for onshore facilities to produce the multi-joints, enhancing mobility of the vessel and reducing reliance on shore bases for support. The Amazon will be delivered to a shipyard in the Netherlands in August 2019 for a conversion period that is expected to last 10 months. We expect the modified vessel to be redelivered to us in the summer of 2020.
|
|
83 |
|
OTHER INFORMATION
The total cost of the modifications, including project management and other fees and expenses, is expected to be in the range of approximately $260 million to $290 million. The Amazon Owner is expected to fund the cost of the modifications primarily through an export credit-backed senior loan provided by a group of lenders, supplemented by expected direct capital expenditure by McDermott of approximately $57.5 million over the course of the modifications, of which approximately $18.8 million had been incurred as at June 30, 2018. This amount, along with approximately $3.5 million incurred following the acquisition of the vessel last year, will be credited against a future purchase of the Amazon by us upon our exercise of one of the purchase options or pursuant to the purchase obligation at the end of the charter term referred to below. The Amazon Owner will enter into interest rate swap agreements, which will convert its floating rate debt under the senior loan to a fixed rate, in order to correspond with our fixed-rate charter hire described below. We will provide guaranties of the Amazon Owner’s hedging obligations to the swap providers, but we are not guaranteeing the Amazon Owner’s debt repayment obligations to its lenders. The Amazon Modification Agreements also require us to maintain financial covenants consistent with those set forth in our principal credit agreement entered into in May 2018.
Pursuant to the Amazon Modification Agreements, the original bareboat charter agreement has been amended and restated, to, among other things, provide for the following:
|
|
• |
an extended 12-year term, commencing upon completion of the modifications; |
|
|
• |
the current charter hire of $7,280 per day will increase to $20,800 per day from February 14, 2019 until completion of the modifications; |
|
|
• |
bareboat charter hire of $101,750 per day from the date of completion of the modifications, reducing from the eighth anniversary of completion to $90,000 per day (following a scheduled prepayment of approximately $28.6 million of charter hire on that date); |
|
|
• |
a fee of approximately $0.7 million per year payable with respect to the Amazon Owner’s additional equity commitment until completion of the modifications; |
|
|
• |
various fixed-price purchase options available to us, starting on the fifth anniversary of the date of completion of the modifications; |
|
|
• |
an obligation for us to purchase the Amazon at the end of the charter term for $76.5 million; and |
|
|
• |
other terms and conditions that our management believes are customary for a complex transaction of this kind (including provisions to adjust the charter hire rates and option and repurchase prices in certain circumstances). |
We intend to account for the amended bareboat charter arrangements as a capital lease. We will record Property, plant, and equipment for the fair value of the Amazon and a long-term lease obligation for the present value of future minimum lease payments. Interest expense will be recognized based on the effective interest rates of the bareboat charter arrangements.
|
|
84 |
|
EXHIBITS
EXHIBIT INDEX
|
Exhibit Number |
|
Description |
|
|
|
|
|
2.1* |
|
|
|
|
|
|
|
3.1* |
|
|
|
|
|
|
|
3.2* |
|
|
|
|
|
|
|
3.3* |
|
|
|
|
|
|
|
4.1* |
|
|
|
|
|
|
|
4.2* |
|
|
|
|
|
|
|
4.3* |
|
|
|
|
|
|
|
4.4* |
|
|
|
|
|
|
|
4.5* |
|
|
|
|
|
|
|
10.1* |
|
|
|
|
|
|
|
10.2* |
|
|
|
85 |
|
EXHIBITS
|
Exhibit Number |
|
Description |
|
|
|
|
|
10.3* |
|
|
|
|
|
|
|
10.4* |
|
|
|
|
|
|
|
10.5* |
|
|
|
|
|
|
|
10.6*
|
|
|
|
|
|
|
|
10.7* |
|
|
|
|
|
|
|
10.8* |
|
|
|
86 |
|
EXHIBITS
|
Exhibit Number |
|
Description |
|
|
|
|
|
10.9* |
|
|
|
|
|
|
|
31.1 |
|
Rule 13a-14(a)/15d-14(a) certification of Chief Executive Officer. |
|
|
|
|
|
31.2 |
|
Rule 13a-14(a)/15d-14(a) certification of Chief Financial Officer. |
|
|
|
|
|
32.1 |
|
|
|
|
|
|
|
32.2 |
|
|
|
|
|
|
|
101.INS XBRL |
|
Instance Document. |
|
|
|
|
|
101.SCH XBRL |
|
Taxonomy Extension Schema Document. |
|
|
|
|
|
101.CAL XBRL |
|
Taxonomy Extension Calculation Linkbase Document. |
|
|
|
|
|
101.LAB XBRL |
|
Taxonomy Extension Label Linkbase Document. |
|
|
|
|
|
101.PRE XBRL |
|
Taxonomy Extension Presentation Linkbase Document. |
|
|
|
|
|
101.DEF XBRL |
|
Taxonomy Extension Definition Linkbase Document. |
|
* |
Incorporated by reference to the filing indicated. |
|
|
87 |
|
SIGNATURES
Pursuant to the requirements of the Securities Exchange Act of 1934, the registrant has duly caused this report to be signed on its behalf by the undersigned thereunto duly authorized.
|
July 31, 2018 |
|
|
||
|
|
|
|
||
|
|
|
McDERMOTT INTERNATIONAL, INC. |
||
|
|
|
|
||
|
|
|
By: |
|
/s/ CHRISTOPHER A. KRUMMEL |
|
|
|
|
|
Christopher A. Krummel Vice President, Finance and Chief Accounting Officer |
|
|
88 |
|