Attached files
| file | filename |
|---|---|
| 8-K - 8-K - BRYN MAWR BANK CORP | bmtc8-k72718.htm |

July 2018 NASDAQ: BMTC
Safe Harbor • This presentation contains statements which, to the extent that they are not recitations of historical fact may constitute forward- looking statements for purposes of the Securities Act of 1933, as amended, and the Securities Exchange Act of 1934, as amended. • Please see the section titled Forward Looking Statements and Safe Harbor beginning on slide 12 for more information regarding these types of statements. • The information contained in this presentation is correct only as of July 19, 2018. Our business, financial condition, results of operations and prospects may have changed since that date, and we do not undertake to update such information. 2

Bryn Mawr Trust - Overview Bryn Mawr Trust is a highly profitable organization focused on building long-term shareholder value by growing our business organically and continually improving our operational effectiveness. Our vision is to be the premier bank and wealth management services organization in the Delaware Valley region. To achieve this objective, we will partner with our clients, through their financial life cycle, to help them achieve their financial goals by providing local access to a comprehensive suite of financial solutions delivered by knowledgeable advisors. Wealth Management Commercial Bank $15,000 Wealth AUM ($ in millions) Loans Deposits Assets ($ in millions) $13,405 $12,969 $5,000 $12,500 $11,328 $4,450 $4,394 $10,000 $4,000 $8,365 $3,422 $7,700 $3,031 $7,500 $3,000 $2,247 $5,000 $2,000 $2,500 $1,000 $0 2014 2015 2016 2017 2Q18 $0 2014 2015 2016 2017 2Q18 3

Market Overview One BMT Offices offer at least two of the following services: wealth management, insurance, lending 4
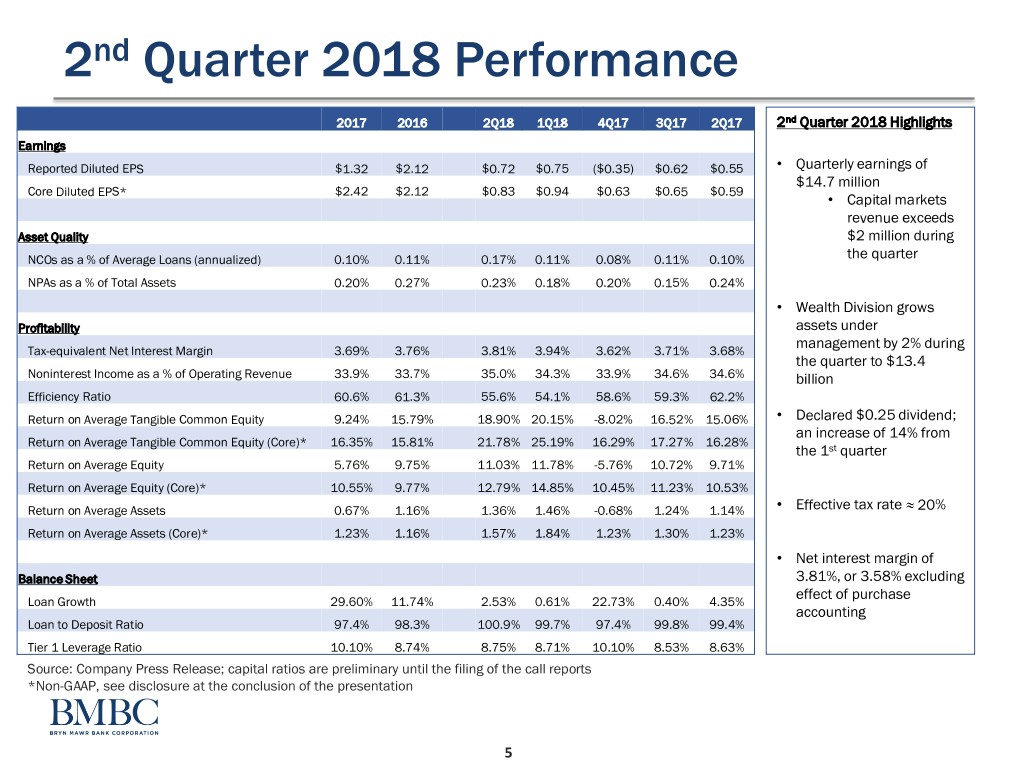
2nd Quarter 2018 Performance 2017 2016 2Q18 1Q18 4Q17 3Q17 2Q17 2nd Quarter 2018 Highlights Earnings Reported Diluted EPS $1.32 $2.12 $0.72 $0.75 ($0.35) $0.62 $0.55 • Quarterly earnings of $14.7 million Core Diluted EPS* $2.42 $2.12 $0.83 $0.94 $0.63 $0.65 $0.59 • Capital markets revenue exceeds Asset Quality $2 million during NCOs as a % of Average Loans (annualized) 0.10% 0.11% 0.17% 0.11% 0.08% 0.11% 0.10% the quarter NPAs as a % of Total Assets 0.20% 0.27% 0.23% 0.18% 0.20% 0.15% 0.24% • Wealth Division grows Profitability assets under management by 2% during Tax-equivalent Net Interest Margin 3.69% 3.76% 3.81% 3.94% 3.62% 3.71% 3.68% the quarter to $13.4 Noninterest Income as a % of Operating Revenue 33.9% 33.7% 35.0% 34.3% 33.9% 34.6% 34.6% billion Efficiency Ratio 60.6% 61.3% 55.6% 54.1% 58.6% 59.3% 62.2% Return on Average Tangible Common Equity 9.24% 15.79% 18.90% 20.15% -8.02% 16.52% 15.06% • Declared $0.25 dividend; an increase of 14% from Return on Average Tangible Common Equity (Core)* 16.35% 15.81% 21.78% 25.19% 16.29% 17.27% 16.28% the 1st quarter Return on Average Equity 5.76% 9.75% 11.03% 11.78% -5.76% 10.72% 9.71% Return on Average Equity (Core)* 10.55% 9.77% 12.79% 14.85% 10.45% 11.23% 10.53% Return on Average Assets 0.67% 1.16% 1.36% 1.46% -0.68% 1.24% 1.14% • Effective tax rate ≈ 20% Return on Average Assets (Core)* 1.23% 1.16% 1.57% 1.84% 1.23% 1.30% 1.23% • Net interest margin of Balance Sheet 3.81%, or 3.58% excluding effect of purchase Loan Growth 29.60% 11.74% 2.53% 0.61% 22.73% 0.40% 4.35% accounting Loan to Deposit Ratio 97.4% 98.3% 100.9% 99.7% 97.4% 99.8% 99.4% Tier 1 Leverage Ratio 10.10% 8.74% 8.75% 8.71% 10.10% 8.53% 8.63% Source: Company Press Release; capital ratios are preliminary until the filing of the call reports *Non-GAAP, see disclosure at the conclusion of the presentation 5
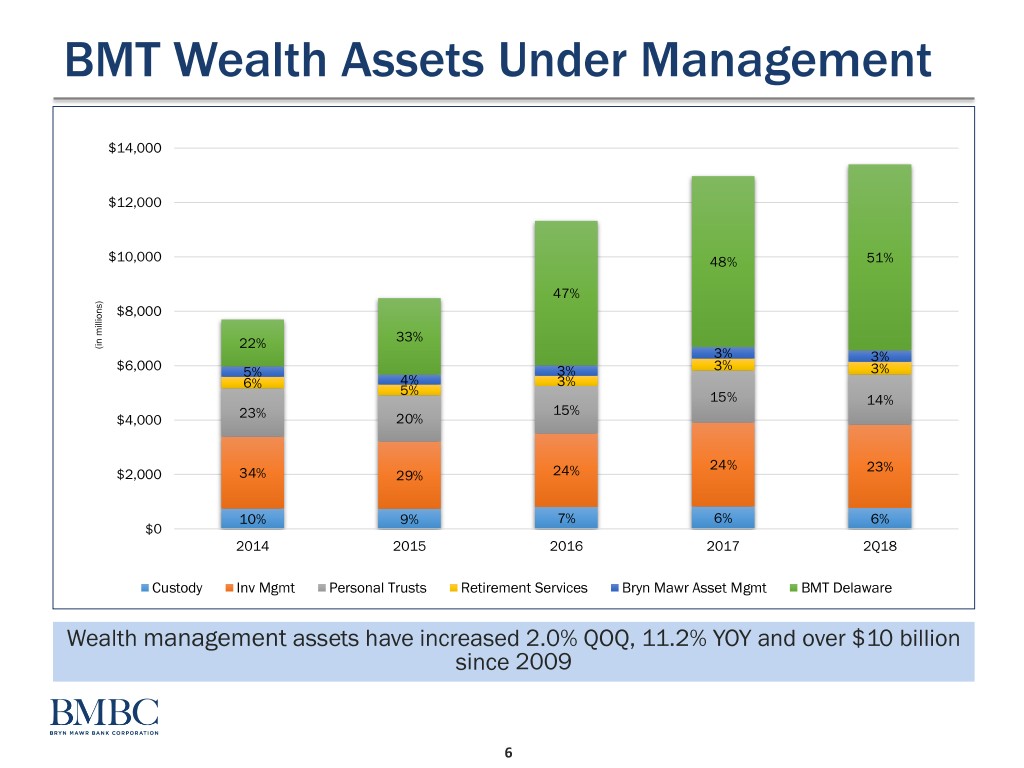
BMT Wealth Assets Under Management $14,000 $12,000 $10,000 48% 51% 47% $8,000 33% (in (in millions) 22% 3% 3% $6,000 5% 3% 3% 3% 6% 4% 3% 5% 15% 14% 15% $4,000 23% 20% 24% 23% $2,000 34% 29% 24% 10% 9% 7% 6% 6% $0 2014 2015 2016 2017 2Q18 Custody Inv Mgmt Personal Trusts Retirement Services Bryn Mawr Asset Mgmt BMT Delaware Wealth management assets have increased 2.0% QOQ, 11.2% YOY and over $10 billion since 2009 6
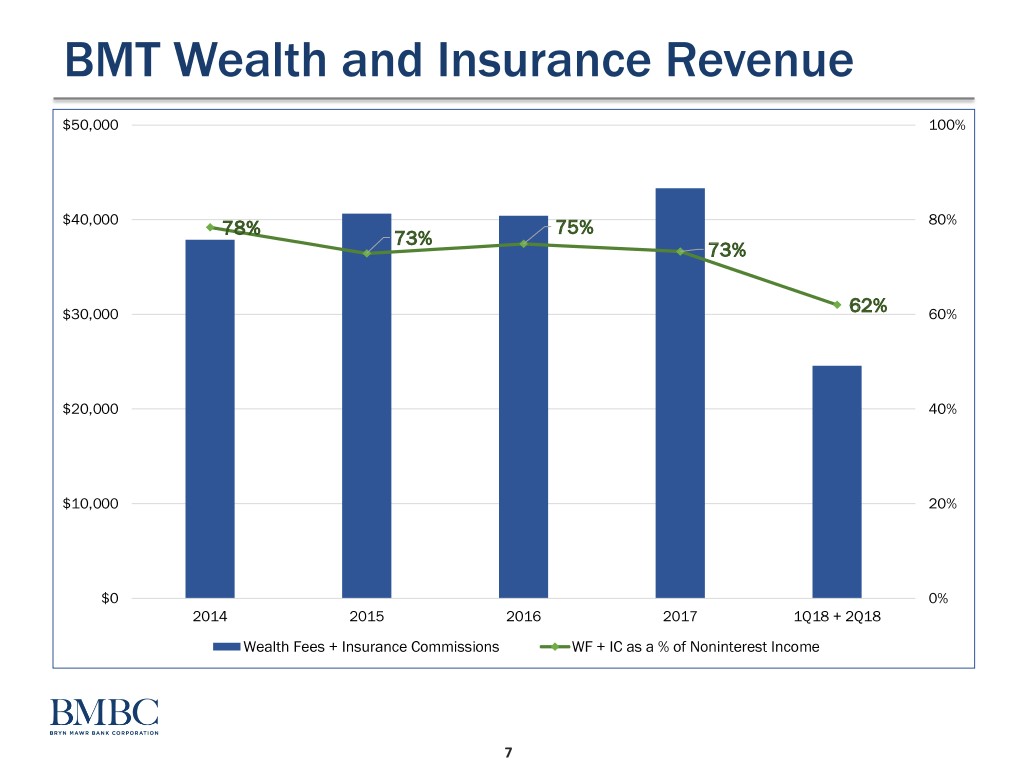
BMT Wealth and Insurance Revenue $50,000 100% $40,000 78% 75% 80% 73% 73% $30,000 62% 60% $20,000 40% $10,000 20% $0 0% 2014 2015 2016 2017 1Q18 + 2Q18 Wealth Fees + Insurance Commissions WF + IC as a % of Noninterest Income 7
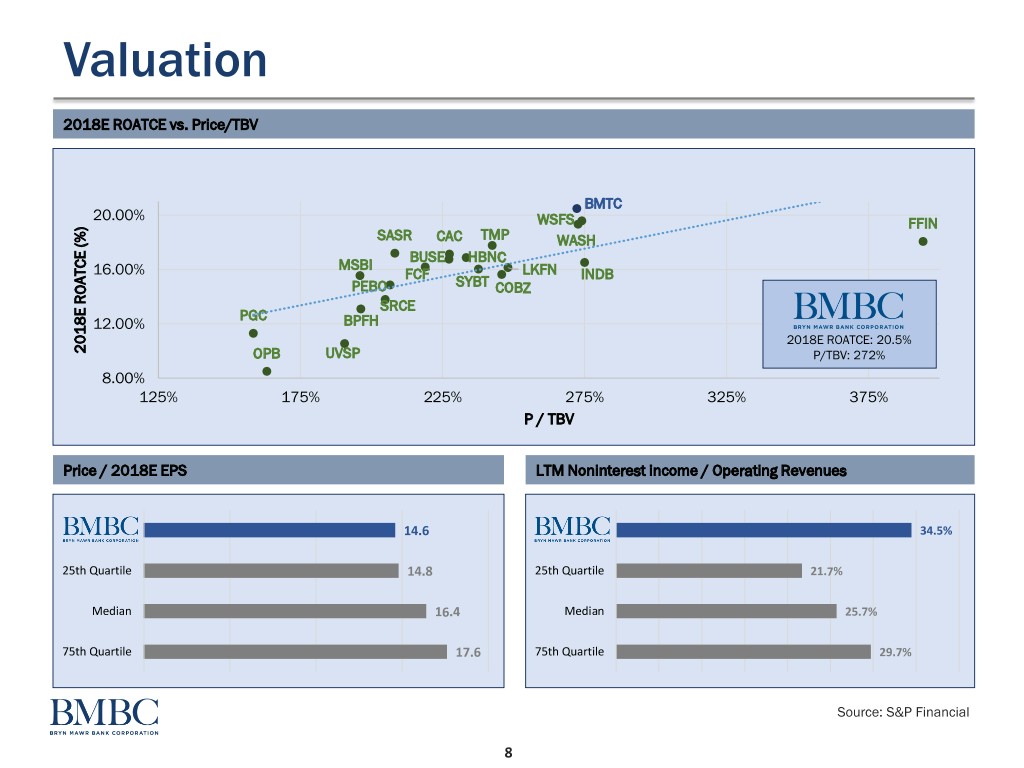
Valuation 2018E ROATCE vs. Price/TBV BMTC 20.00% WSFS FFIN SASR CAC TMP WASH BUSE HBNC MSBI 16.00% FCF LKFN INDB PEBO SYBT COBZ SRCE PGC 12.00% BPFH 2018E ROATCE: 20.5% 2018E ROATCE (%)ROATCE2018E OPB UVSP P/TBV: 272% 8.00% 125% 175% 225% 275% 325% 375% P / TBV Price / 2018E EPS LTM Noninterest income / Operating Revenues 14.6 34.5% 25th Quartile 14.8 25th Quartile 21.7% Median 16.4 Median 25.7% 75th Quartile 17.6 75th Quartile 29.7% Source: S&P Financial 8

Strategic Objectives • Continue to diversify business activities (interest and non-interest income sources) to strengthen predictability of financial performance • Leverage technology to drive process innovation and increased productivity • Export the BMT Brand by selectively investing in new markets using Private Client / Banking model • Continue digital investment with focus on mainstream customer adoption and transforming retail model • Supplement organic growth of bank and fee income segments with strategic acquisitions and lift-outs 9

Relationship Based Sales Approach • Serve as one “BMT” team • Relationship based vs. Wealth transactional Management • Private Banking facilitates client interaction with the Private organization Banking Commercial Consumer • Focus on overlapping Banking Banking needs across segments • Customized solutions and services 10

Deposit Focus (1) 40% Deposit Market Share - Philadelphia MSA Deposit Composition Trend Parent # of Deposits in Market % of Total Rank Parent Holding Company State Branches Market ($mm) Share (%) Deposits 1 TD Group US Holdings LLC DE 147 120,968 44.8% 20.5% 30% 2 Wells Fargo & Co. CA 198 31,664 11.7% 2.4% 3 PNC Financial Services Group PA 166 22,758 8.4% 8.8% 4 Citizens Financial Group Inc. RI 182 17,548 6.5% 15.4% 20% 5 Bank of America Corp. NC 86 14,240 5.3% 1.1% 6 M&T Bank Corp. NY 60 7,800 2.9% 8.3% 7 BB&T Corp. NC 100 5,075 1.9% 3.2% 10% 8 WSFS Financial Corp. DE 48 4,275 1.6% 88.4% 9 Beneficial Bancorp Inc. PA 63 4,270 1.6% 100.0% 10 Santander Holdings USA Inc. MA 73 4,196 1.6% 6.7% 0% 1,123 86.3% 2014 2015 2016 2017 2Q18 11 Bryn Mawr Bank Corp. PA 44 3,264 1.2% 98.8% Interest DDA Money market Savings Top 11 Banks hold: Wholesale Time Deposits Non-interest DDA Total Philadelphia MSA 269,810 87.5% (1) Excludes non-retail competitors (2 or fewer branches in market) ▪ Consistent deposit composition over time 40% Noninterest DDA / Total Deposits ▪ High percentage of noninterest deposits helps maintain low cost of funds: 28% 29% 1.02% during 2Q18 30% 26% 27% 27% ▪ Deposit Beta of 26% vs. SMID Median 26%(1) in 4Q16 – 2Q18 25% 25% 26% 20% 23% 24% ▪ Recent expansion into Philadelphia market through Royal Bank acquisition already generating additional deposit growth opportunities 10% 2014 2015 2016 2017 2Q18 (1)Keefe, Bruyette & Woods. July 22, 2018. Deposit Beta Tracker – 2Q18 Edition, v1. BMTC Peer Median 11

Forward Looking Statements and Safe Harbor This presentation contains statements which, to the extent that they are not recitations of historical fact may constitute forward-looking statements for purposes of the Securities Act of 1933, as amended, and the Securities Exchange Act of 1934, as amended. Such forward-looking statements may include financial and other projections, as well as statements regarding the expected financial and other effects of the transaction, Bryn Mawr Bank Corporation’s (“Bryn Mawr” or “BMBC”) future plans, objectives, performance, revenues, growth, profits, operating expenses or BMBC’s underlying assumptions. The words “may,” “would,” “should,” “could,” “will,” “likely,” “possibly,” “expect,” “anticipate,” “intend,” “indicate,” “estimate,” “target,” “potentially,” “promising,” “probably,” “outlook,” “predict,” “contemplate,” “continue,” “plan,” “forecast,” “project,” “are optimistic,” “are looking,” “are looking forward” and “believe” or other similar words and phrases may identify forward-looking statements. Persons reading this presentation are cautioned that such statements are only predictions, and that BMBC’s actual future results or performance may be materially different. Such forward-looking statements involve known and unknown risks and uncertainties. A number of factors, many of which are beyond BMBC’s control, could cause actual results, events or developments, or industry results, to be materially different from any future results, events or developments expressed, implied or anticipated by such forward-looking statements, and so business and financial condition and results of operations could be materially and adversely affected. In addition to factors previously disclosed in BMBC’s reports filed with the U.S. Securities and Exchange Commission (the “SEC”) and those identified elsewhere in this document, such factors include, among others, that BMBC is unable to successfully implement integration strategies in connection with its acquisitions; reputational risks and the reaction of an acquired company’s customers to an acquisition by BMBC or its subsidiaries; diversion of management time on acquisition-related issues; the integration of acquired businesses with BMBC may take longer than anticipated or be more costly to complete and that the anticipated benefits, including any anticipated cost savings or strategic gains may be significantly harder to achieve or take longer than anticipated or may not be achieved; the need for capital, ability to control operating costs and expenses, and to manage loan and lease delinquency rates; the credit risks of lending activities and overall quality of the composition of loan, lease and securities portfolio; the impact of economic conditions, consumer and business spending habits, and real estate market conditions; changes in the levels of general interest rates, deposit interest rates, or net interest margin and funding sources; changes in banking regulations and policies and the possibility that any banking agency approvals BMBC might require for certain activities will not be obtained in a timely manner or at all or will be conditioned in a manner that would impair BMBC’s ability to implement our business plans; changes in tax regulations or accounting policies and practices; the inability of key third-party providers to perform their obligations to us; our ability to attract and retain key personnel; competition in our marketplace; war or terrorist activities; material differences in the actual financial results, cost savings and revenue enhancements associated with BMBC’s acquisitions. All forward-looking statements and information set forth herein are based on management’s current beliefs and assumptions as of the date hereof and speak only as of the date they are made. BMBC does not undertake to update forward-looking statements. For a complete discussion of the assumptions, risks and uncertainties related to our business, you are encouraged to review our filings with the Securities and Exchange Commission, including our most recent Annual Report on Form 10-K, as updated by our quarterly or other reports subsequently filed with the SEC. This presentation is for discussion purposes only, and shall not constitute any offer to sell or the solicitation of an offer to buy any security, nor is it intended to give rise to any legal relationship between BMBC and you or any other person, nor is it a recommendation to buy any securities or enter into any transaction with BMBC. 12

Peer Companies Boston Private Financial Opus Bank First Busey Corp. Peoples Bancorp Inc. Camden National Corp. Peapack-Gladstone Financial CoBiz Financial Inc. Sandy Spring Bancorp Inc. First Commonwealth Financial 1st Source Corp. First Financial Bankshares Stock Yards Bancorp Inc. Horizon Bancorp Tompkins Financial Corporation Independent Bank Corp. Univest Corp. of Pennsylvania Lakeland Financial Corp. Washington Trust Bancorp Inc. Midland States Bancorp Inc. WSFS Financial Corp. 13

Non GAAP Measures Statement on Non-GAAP Measures: The Corporation believes the presentation of the following non-GAAP financial measures provides useful supplemental information that is essential to an investor’s proper understanding of the results of operations and financial condition of the Corporation. Management uses non-GAAP financial measures in its analysis of the Corporation’s performance. These non-GAAP measures should not be viewed as substitutes for the financial measures determined in accordance with GAAP, nor are they necessarily comparable to non-GAAP performance measures that may be presented by other companies. $ in thousands except per share data 2Q18 1Q18 4Q17 3Q17 2Q17 FY 2017 FY 2016 Net income (a GAAP measure) $14,688 $15,286 ($6,200) $10,739 $9,433 $23,016 $36,036 Less: Tax-effected non-core noninterest income: (Gain) loss on sale of investment securities available for sale - (6) (18) (47) - (66) 50 Add: Tax-effected non-core noninterest expense items: Due diligence, merger-related and merger integration expenses 2,412 3,412 2,280 553 803 3,968 - Add: Federal income tax expense related to the re- measurement of net deferred tax assets due to the tax reform legislation (69) 590 15,193 - - 15,193 - Net income (core) (a non-GAAP measure) $17,031 $19,282 $11,255 $11,245 $10,236 $42,111 $36,086 Weighted average diluted shares 20,447,360 20,450,494 17,844,672 17,253,982 17,232,767 17,398,923 17,028,122 Diluted earnings per common share (core) (a non-GAAP measure) $0.83 $0.94 $0.63 $0.65 $0.59 $2.42 $2.12 Return on Average Assets (Core) 2Q18 1Q18 4Q17 3Q17 2Q17 FY 2017 FY 2016 Net income (core) (a non-GAAP measure) $17,031 $19,282 $11,255 $11,245 $10,236 $42,111 $36,086 Average assets 4,344,541 4,246,180 3,640,667 3,441,906 3,333,307 3,416,146 3,105,650 Return on average assets (core) (a non-GAAP measure) 1.57% 1.84% 1.23% 1.30% 1.23% 1.23% 1.16% 14
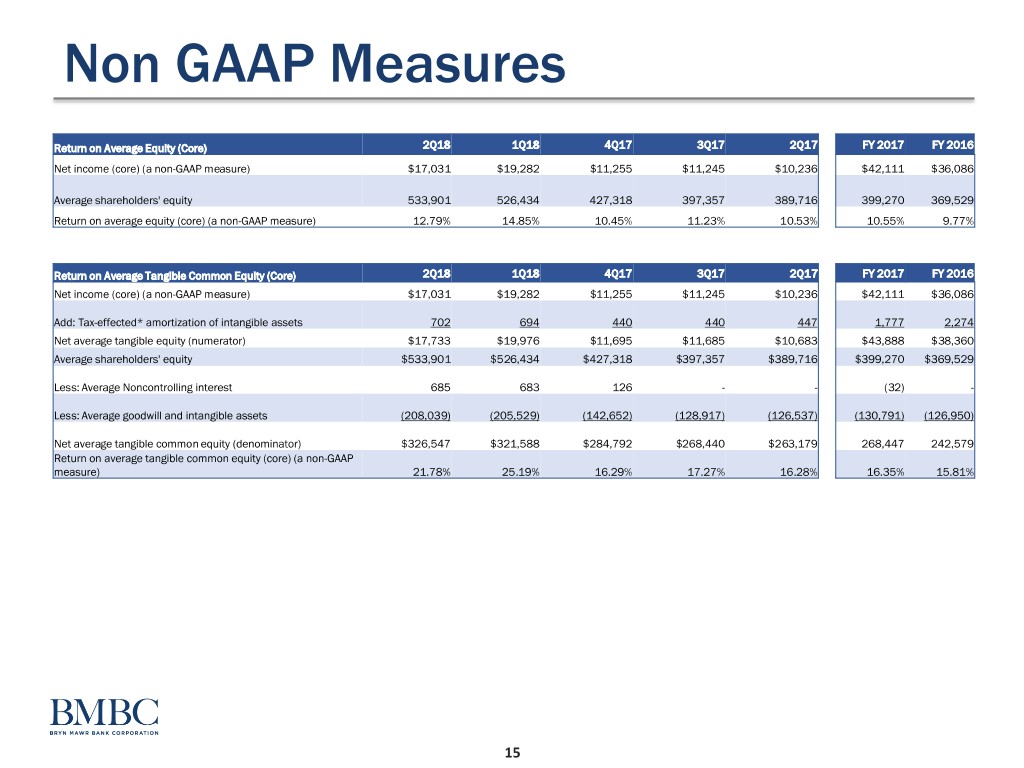
Non GAAP Measures Return on Average Equity (Core) 2Q18 1Q18 4Q17 3Q17 2Q17 FY 2017 FY 2016 Net income (core) (a non-GAAP measure) $17,031 $19,282 $11,255 $11,245 $10,236 $42,111 $36,086 Average shareholders' equity 533,901 526,434 427,318 397,357 389,716 399,270 369,529 Return on average equity (core) (a non-GAAP measure) 12.79% 14.85% 10.45% 11.23% 10.53% 10.55% 9.77% Return on Average Tangible Common Equity (Core) 2Q18 1Q18 4Q17 3Q17 2Q17 FY 2017 FY 2016 Net income (core) (a non-GAAP measure) $17,031 $19,282 $11,255 $11,245 $10,236 $42,111 $36,086 Add: Tax-effected* amortization of intangible assets 702 694 440 440 447 1,777 2,274 Net average tangible equity (numerator) $17,733 $19,976 $11,695 $11,685 $10,683 $43,888 $38,360 Average shareholders' equity $533,901 $526,434 $427,318 $397,357 $389,716 $399,270 $369,529 Less: Average Noncontrolling interest 685 683 126 - - (32) - Less: Average goodwill and intangible assets (208,039) (205,529) (142,652) (128,917) (126,537) (130,791) (126,950) Net average tangible common equity (denominator) $326,547 $321,588 $284,792 $268,440 $263,179 268,447 242,579 Return on average tangible common equity (core) (a non-GAAP measure) 21.78% 25.19% 16.29% 17.27% 16.28% 16.35% 15.81% 15
