Attached files
| file | filename |
|---|---|
| EX-99.1 - PRESS RELEASE - Midland States Bancorp, Inc. | exh_991.htm |
| 8-K - FORM 8-K - Midland States Bancorp, Inc. | f8k_072618.htm |
EXHIBIT 99.2

Midland States Bancorp, Inc. NASDAQ: MSBI Second Quarter 2018 Earnings Call

2 Forward - Looking Statements. This presentation may contain forward - looking statements within the meaning of the federal securities laws. Forward - looking statements express management’s current expectations, forecasts of future events or long - term goals, and may be based upon beliefs, expectations and assumptions of Midland’s management, are generally identifiable by the use of words such as “believe,” “expect,” “anticipate,” “plan,” “intend,” “estimate,” “may,” “will,” “would,” “could,” “shoul d” or other similar expressions. All statements in this presentation speak only as of the date they are made, and Midland undertakes no obligation to update any statement. A number of factors, many of which are beyond the ability of Midland to control or predic t, could cause actual results to differ materially from those in its forward - looking statements. These risks and uncertainties sho uld be considered in evaluating forward - looking statements and undue reliance should not be placed on such statements. Additional information concerning Midland and its respective businesses, including additional factors that could materially affect Midla nd’ s financial results, are included in Midland’s filings with the Securities and Exchange Commission. Use of Non - GAAP Financial Measures. This presentation contains certain financial information determined by methods other than in accordance with accounting principles generally accepted in the United States (“GAAP”). These non - GAAP financial measures include “Adjusted Earnings,” “Adjusted Diluted Earnings Per Share,” “Adjusted Return on Average Assets,” “Adjusted Return on Average Shareholders’ Equity,” “Adjusted Return on Average Tangible Common Equity,” “Efficiency Ratio,” “Tangible Common Equity to Tangible Assets,” “Tangible Book Value Per Share” and “Return on Average Tangible Common Equity.” The Company believes that these non - GAAP financial measures provide both management and investors a more complete understanding of the Company’s funding profile and profitability. These non - GAAP financial measures are supplemental and are not a substitute for any analysis based on GAAP financial measures. The Company believes that these non - GAAP financial measures provide both management and investors a more complete understanding of the Company’s funding profile and profitability. These non - GAAP financial measures are supplemental and are not a substitute for any analysis based on GAAP financial measures. Not all companies use the same calculation of these measures; therefore this presentation may not be comparable to other similarly titled measures as presented by other companies. Reconciliations of these non - GAAP measures are provided in the Appendix section of this presentation.

Overview of 2Q18 3 Improving Revenue Mix 2Q18 Earnings Key Operating Trends Addition of Alpine shifts business mix toward more stable sources of revenue • Increase in loan growth • Stable net interest margin (excluding accretion income) • Solid expense management and improving efficiency ratio Positive Impact from Alpine First full quarter with Alpine’s operations • Positive impact on earnings • Ahead of schedule in realizing synergies • Approximately 80% of cost savings achieved in 2Q18 (1) Represents a non - GAAP financial measure. See “Non - GAAP Reconciliation” in the appendix. Net income of $12.8 million, or $ 0.52 diluted EPS • Integration and acquisition expenses of $2.0 million • Adjusted earnings 1 of $ 0.59 per diluted share

Loan Portfolio Total Loans 4 • Organic loan growth of $67 million or 6.6% annualized • Strongest growth in equipment financing, consumer lending and residential real estate • Equipment financing balances increased $38.1 million from March 31, 2018 » Production booked within either commercial or lease financing portfolios • Fluctuation in large commercial FHA warehouse line impacted commercial loan portfolio Loan Portfolio Mix (in millions, as of quarter - end) (in millions, as of quarter - end) 2Q 2018 1Q 2018 2Q 2017 Commercial $ 763 $ 803 $ 571 Commercial real estate 1,711 1,774 1,471 Construction and land development 248 235 176 Residential real estate 602 570 428 Consumer 544 424 336 Lease financing 229 224 202 Total $ 4,096 $ 4,029 $ 3,184 $3,184 $3,158 $3,227 $4,029 $4,096 2Q 2017 3Q 2017 4Q 2017 1Q 2018 2Q 2018

Total Deposits Total Deposits 5 • Total deposits decreased $74 million to $4.16 billion • Decline in DDA primarily attributable to normal fluctuations in servicing deposits • Decline in interest - bearing deposits primarily attributable to reduction in time and brokered deposits Deposit Mix (in millions, as of quarter - end) (in millions, as of quarter - end) 2Q 2018 1Q 2018 2Q 2017 Noninterest - bearing demand $ 1,002 $ 1,038 $ 781 Checking 1,025 993 842 Money market 844 840 578 Savings 461 467 292 Time 638 672 526 Brokered 191 224 315 Total deposits $ 4,160 $ 4,234 $ 3,333 $3,333 $3,114 $3,131 $4,234 $4,160 2Q 2017 3Q 2017 4Q 2017 1Q 2018 2Q 2018
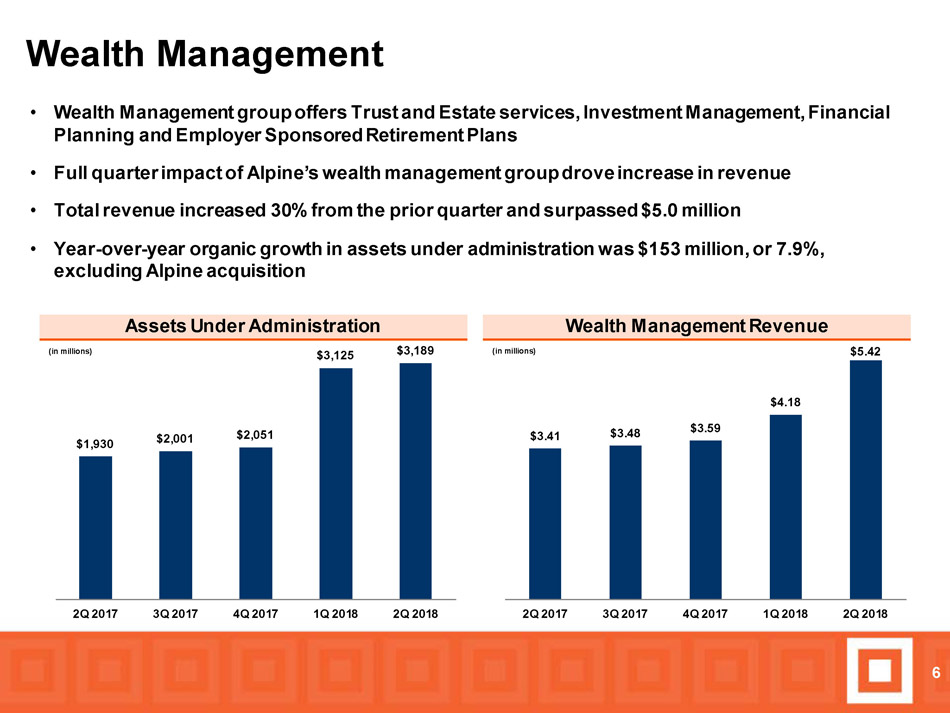
$3.41 $3.48 $3.59 $4.18 $5.42 2Q 2017 3Q 2017 4Q 2017 1Q 2018 2Q 2018 $1,930 $2,001 $2,051 $3,125 $3,189 2Q 2017 3Q 2017 4Q 2017 1Q 2018 2Q 2018 • Wealth Management group offers Trust and Estate services, Investment Management, Financial Planning and Employer Sponsored Retirement Plans • Full quarter impact of Alpine’s wealth management group drove increase in revenue • Total revenue increased 30% from the prior quarter and surpassed $5.0 million • Year - over - year organic growth in assets under administration was $153 million , or 7.9%, excluding Alpine acquisition Wealth Management Wealth Management Revenue 6 Assets Under Administration (in millions) (in millions)

Love Funding – Commercial FHA Review 7 • Change in leadership » Jon Camps, Senior Vice President, promoted to President of Love Funding » Reporting to Jeff Mefford, President of Midland States Bank • Expense levels adjusted for new revenue expectations » Approximately $2.0 million in annualized cost savings • Long - term annual expectations » Total revenue of $12 million to $20 million » Pre - tax margin of 20% to 40%

0.13% 0.27% 0.26% 0.16% 0.40% 3.70% 3.78% 3.73% 3.69% 3.91% 2Q 2017 3Q 2017 4Q 2017 1Q 2018 2Q 2018 NIM Accretion Income • Net interest income increased due to full quarter contribution of Alpine • Net interest margin increased due to higher accretion income • Excluding the impact of accretion income, net interest margin was relatively unchanged • Scheduled accretion income: $3.1 million in 3Q18; $2.3 million in 4Q18; $7.2 million in FY 2019 Net Interest Income/Margin Net Interest Margin 8 Net Interest Income (in millions) $5.9 $2.6 $4.4 $1.9 $4.9 $1.3 $3.0 $2.7 $2.0 $5.5 $29.4 $36.8 $36.0 $38.2 $48.3 2Q 2017 3Q 2017 4Q 2017 1Q 2018 2Q 2018 NII Accretion Income

Non - Interest Income 9 • Non - interest income declined 4.0% due to drop in commercial FHA revenue • All other major fee generating areas increased primarily due to full quarter contribution of Alpine • Increase in residential mortgage banking revenue driven by seasonal strength Non - Interest Income (in millions) $13.6 $15.4 $14.0 $16.6 $15.9 2Q 2017 3Q 2017 4Q 2017 1Q 2018 2Q 2018 All Other Community Banking Revenue Wealth Management Residential Mortgage Commercial FHA (1) Represents service charges, interchange revenue, net gain - on - sale of investment securities, and other income (1)

Non - Interest Expense and Operating Efficiency 10 • Efficiency Ratio 1 was 67.8% in 2Q18 vs. 68.5% in 1Q18 • Integration and acquisition related expenses » $2.0 million in 2Q18 » $11.9 million in 1Q18 • Excluding these items, non - interest expense increased 18.1% on a linked - quarter basis due to the full quarter impact of Alpine’s operations • 2019 quarterly run - rate for non - interest expense projected to be approximately $43 million Non - Interest Expense and Efficiency Ratio 1 (Non - Interest expense in millions) $37.6 $48.4 $36.2 $49.6 $46.6 $7.5 $11.9 $3.1 $11.9 $2.2 66.5% 69.0% 64.6% 68.5% 67.8% 2Q 2017 3Q 2017 4Q 2017 1Q 2018 2Q 2018 Total Non-Interest Expense Adjustments to Non-Interest Expense Efficiency Ratio (1) Represents a non - GAAP financial measure. See “Non - GAAP Reconciliation” in the appendix.

Asset Quality NCO / Average Loans 11 • Stable asset quality in 2Q18 and modest net charge - offs • Slight increase in non - performing loans • Provision for loan losses of $1.9 million in 2Q18 • ALLL/total loans of 0.45% and credit marks/total loans of 0.81% at June 30, 2018 Non - Performing Loans / Total Loans (Total Loans as of quarter - end) 0.87% 1.06% 0.83% 0.66% 0.69% 2Q 2017 3Q 2017 4Q 2017 1Q 2018 2Q 2018 0.13% 0.01% 0.81% 0.09% 0.13% 2Q 2017 3Q 2017 4Q 2017 1Q 2018 2Q 2018
Outlook • Continued discipline in balance sheet growth to manage liquidity and protect net interest margin • Alpine system conversion completed in mid - July • Completion of Alpine integration expected to drive additional cost savings and improved efficiencies • Well positioned to deliver additional earnings growth in 2019 12

APPENDIX

14 Adjusted Earnings Reconciliation (dollars in thousands, except per share data) Income before income taxes - GAAP $ 15,827 $ 3,182 $ 7,766 $ 2,316 $ 4,916 Adjustments to noninterest income: (Loss) gain on sales of investment securities, net (70) 65 2 98 55 Other (48) 150 37 45 (91) Total adjustments to noninterest income (118) 215 39 143 (36) Adjustments to noninterest expense: Loss on mortgage servicing rights held for sale 188 - 442 3,617 - Integration and acquisition expenses 2,019 11,884 2,686 8,303 7,450 Total adjustments to noninterest expense 2,207 11,884 3,128 11,920 7,450 Adjusted earnings pre tax 18,152 14,851 10,855 14,093 12,402 Adjusted earnings tax 3,666 3,550 6,992 4,920 4,326 Revaluation of net deferred tax assets - - (4,540) - - Adjusted earnings - non-GAAP 14,486 11,301 8,403 9,173 8,076 Preferred stock dividends, net 36 36 37 27 19 Adjusted earnings - available to common shareholders - non-GAAP $ 14,450 $ 11,265 $ 8,366 $ 9,146 $ 8,057 Adjusted diluted earnings per common share $ 0.59 $ 0.52 $ 0.42 $ 0.46 $ 0.46 Adjusted return on average assets 1.03 % 0.96 % 0.76 % 0.82 % 0.89 % Adjusted return on average shareholders' equity 9.94 % 9.19 % 7.34 % 8.03 % 8.97 % Adjusted return on average tangible common equity 15.28 % 13.06 % 9.88 % 10.83 % 11.20 % 2018 2018 2017 2017 2017 June 30, March 31, December 31, September 30, June 30, MIDLAND STATES BANCORP, INC.RECONCILIATIONS OF NON-GAAP FINANCIAL MEASURES For the Quarter Ended

15 Efficiency Ratio Reconciliation (dollars in thousands) Noninterest expense - GAAP $ 46,553 $ 49,602 $ 36,192 $ 48,363 $ 37,645 Loss on mortgage servicing rights held for sale (188) - (442) (3,617) - Integration and acquisition expenses (2,019) (11,884) (2,686) (8,303) (7,450) Adjusted noninterest expense $ 44,346 $ 37,718 $ 33,064 $ 36,443 $ 30,195 Net interest income - GAAP $ 48,286 $ 38,185 $ 36,036 $ 36,765 $ 29,400 Effect of tax-exempt income 541 394 659 687 674 Adjusted net interest income 48,827 38,579 36,695 37,452 30,074 Noninterest income - GAAP $ 15,948 $ 16,605 $ 13,998 $ 15,403 $ 13,619 Mortgage servicing rights impairment 500 133 494 104 1,650 Loss (gain) on sales of investment securities, net 70 (65) (2) (98) (55) Other 48 (150) (37) (45) 91 Adjusted noninterest income 16,566 16,523 14,453 15,364 15,305 Adjusted total revenue $ 65,393 $ 55,102 $ 51,148 $ 52,816 $ 45,379 Efficiency ratio 67.81 % 68.45 % 64.64 % 69.00 % 66.54 % 2018 2018 2017 2017 2017 June 30, March 31, December 31, September 30, June 30, MIDLAND STATES BANCORP, INC.RECONCILIATIONS OF NON-GAAP FINANCIAL MEASURES (continued) For the Quarter Ended

16 Tangible Common Equity to Tangible Assets Ratio and Tangible Book Value Per Share (dollars in thousands, except per share data) Shareholders' Equity to Tangible Common Equity Total shareholders' equity—GAAP $ 592,535 $ 585,385 $ 449,545 $ 450,689 $ 451,952 Adjustments: Preferred stock (2,876) (2,923) (2,970) (3,015) (3,134) Goodwill (164,044) (155,674) (98,624) (97,351) (96,940) Other intangibles (41,081) (46,473) (16,932) (17,966) (18,459) Tangible common equity $ 384,534 $ 380,315 $ 331,019 $ 332,357 $ 333,419 Total Assets to Tangible Assets: Total assets—GAAP $ 5,730,600 $ 5,723,372 $ 4,412,701 $ 4,347,761 $ 4,491,642 Adjustments: Goodwill (164,044) (155,674) (98,624) (97,351) (96,940) Other intangibles (41,081) (46,473) (16,932) (17,966) (18,459) Tangible assets $ 5,525,475 $ 5,521,225 $ 4,297,145 $ 4,232,444 $ 4,376,243 Common Shares Outstanding 23,664,596 23,612,430 19,122,049 19,093,153 19,087,409 Tangible Common Equity to Tangible Assets 6.96 % 6.89 % 7.70 % 7.85 % 7.62 % Tangible Book Value Per Share $ 16.25 $ 16.11 $ 17.31 $ 17.41 $ 17.47 Return on Average Tangible Common Equity (ROATCE) (dollars in thousands) Net income available to common shareholders $ 12,746 $ 1,770 $ 1,954 $ 2,009 $ 3,520 Average total shareholders' equity—GAAP $ 584,653 $ 498,941 $ 453,968 $ 453,317 $ 361,335 Adjustments: Preferred stock (2,905) (2,952) (2,997) (3,126) (654) Goodwill (158,461) (118,996) (97,406) (97,129) (61,424) Other intangibles (44,098) (27,156) (17,495) (18,153) (10,812) Average tangible common equity $ 379,189 $ 349,837 $ 336,070 $ 334,909 $ 288,445 ROATCE 13.48 % 2.05 % 2.31 % 2.38 % 4.89 % June 30, March 31, December 31, September 30, June 30, 2018 2018 2017 2017 2017 For the Quarter Ended MIDLAND STATES BANCORP, INC. RECONCILIATIONS OF NON-GAAP FINANCIAL MEASURES (continued) As of June 30, March 31, December 31, September 30, June 30, 2018 2018 2017 2017 2017