Attached files
| file | filename |
|---|---|
| EX-99.2 - EXHIBIT 99.2 - Discover Financial Services | dfs2018630ex992.htm |
| EX-99.1 - EXHIBIT 99.1 - Discover Financial Services | dfs-earningsreleasex2q18ex.htm |
| 8-K - 8-K - Discover Financial Services | a2q188k.htm |

Exhibit 99.3 2Q18 Financial Results July 26, 2018 ©2018 DISCOVER FINANCIAL SERVICES
Notice The following slides are part of a presentation by Discover Financial Services (the "Company") in connection with reporting quarterly financial results and are intended to be viewed as part of that presentation. No representation is made that the information in these slides is complete. For additional financial, statistical, and business related information, as well as information regarding business and segment trends, see the earnings release and financial supplement included as exhibits to the Company’s Current Report on Form 8-K filed today and available on the Company’s website (www.discover.com) and the SEC’s website (www.sec.gov). The information provided herein includes certain non-GAAP financial measures. The reconciliations of such measures to the comparable GAAP figures are included at the end of this presentation, which is available on the Company’s website and the SEC’s website. The presentation contains forward-looking statements. You are cautioned not to place undue reliance on forward-looking statements, which speak only as of the date on which they are made, which reflect management’s estimates, projections, expectations or beliefs at that time, and which are subject to risks and uncertainties that may cause actual results to differ materially. For a discussion of certain risks and uncertainties that may affect the future results of the Company, please see "Special Note Regarding Forward-Looking Statements," "Risk Factors," "Business – Competition," "Business – Supervision and Regulation" and "Management’s Discussion and Analysis of Financial Condition and Results of Operations" in the Company’s Annual Report on Form 10-K for the year ended December 31, 2017, and "Management’s Discussion & Analysis of Financial Condition and Results of Operations" in the company's Quarterly Report on Form 10- Q for the quarter ended March 31, 2018, which are filed with the SEC and available at the SEC's website (www.sec.gov). The Company does not undertake to update or revise forward-looking statements as more information becomes available. 2
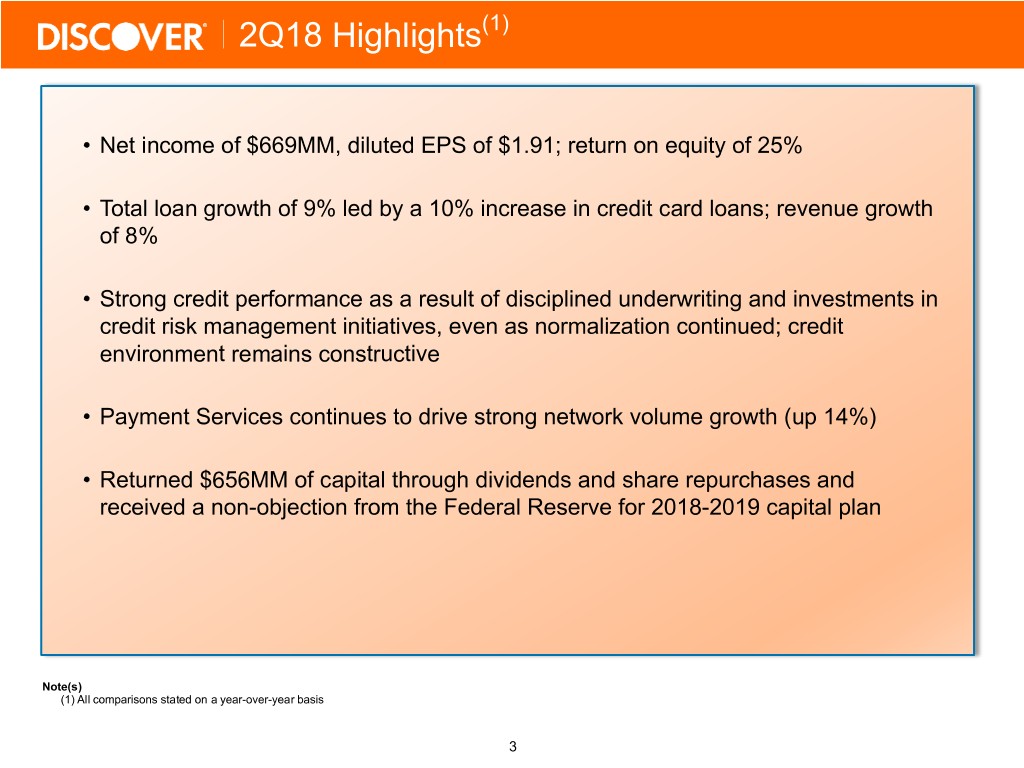
2Q18 Highlights(1) • Net income of $669MM, diluted EPS of $1.91; return on equity of 25% • Total loan growth of 9% led by a 10% increase in credit card loans; revenue growth of 8% • Strong credit performance as a result of disciplined underwriting and investments in credit risk management initiatives, even as normalization continued; credit environment remains constructive • Payment Services continues to drive strong network volume growth (up 14%) • Returned $656MM of capital through dividends and share repurchases and received a non-objection from the Federal Reserve for 2018-2019 capital plan Note(s) (1) All comparisons stated on a year-over-year basis 3
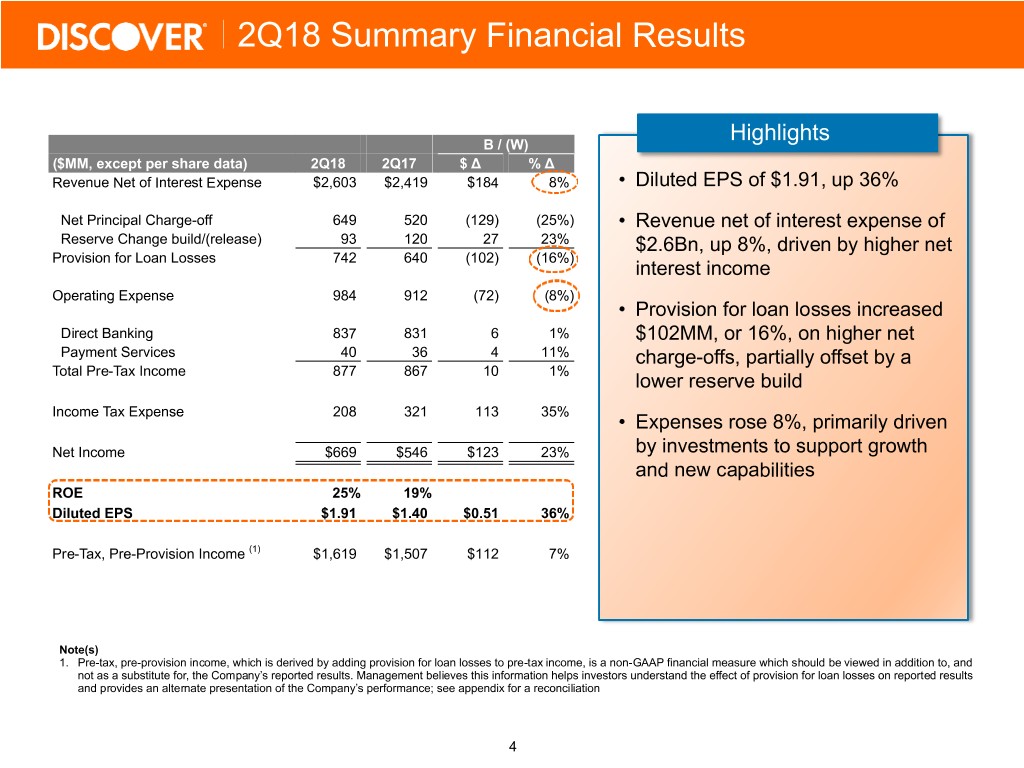
2Q18 Summary Financial Results Highlights B / (W) ($MM, except per share data) 2Q18 2Q17 $ Δ % Δ Revenue Net of Interest Expense $2,603 $2,419 $184 8% • Diluted EPS of $1.91, up 36% Net Principal Charge-off 649 520 (129) (25%) • Revenue net of interest expense of Reserve Change build/(release) 93 120 27 23% $2.6Bn, up 8%, driven by higher net Provision for Loan Losses 742 640 (102) (16%) interest income Operating Expense 984 912 (72) (8%) • Provision for loan losses increased Direct Banking 837 831 6 1% $102MM, or 16%, on higher net Payment Services 40 36 4 11% charge-offs, partially offset by a Total Pre-Tax Income 877 867 10 1% lower reserve build Income Tax Expense 208 321 113 35% • Expenses rose 8%, primarily driven Net Income $669 $546 $123 23% by investments to support growth and new capabilities ROE 25% 19% Diluted EPS $1.91 $1.40 $0.51 36% Pre-Tax, Pre-Provision Income (1) $1,619 $1,507 $112 7% Note(s) 1. Pre-tax, pre-provision income, which is derived by adding provision for loan losses to pre-tax income, is a non-GAAP financial measure which should be viewed in addition to, and not as a substitute for, the Company’s reported results. Management believes this information helps investors understand the effect of provision for loan losses on reported results and provides an alternate presentation of the Company’s performance; see appendix for a reconciliation 4
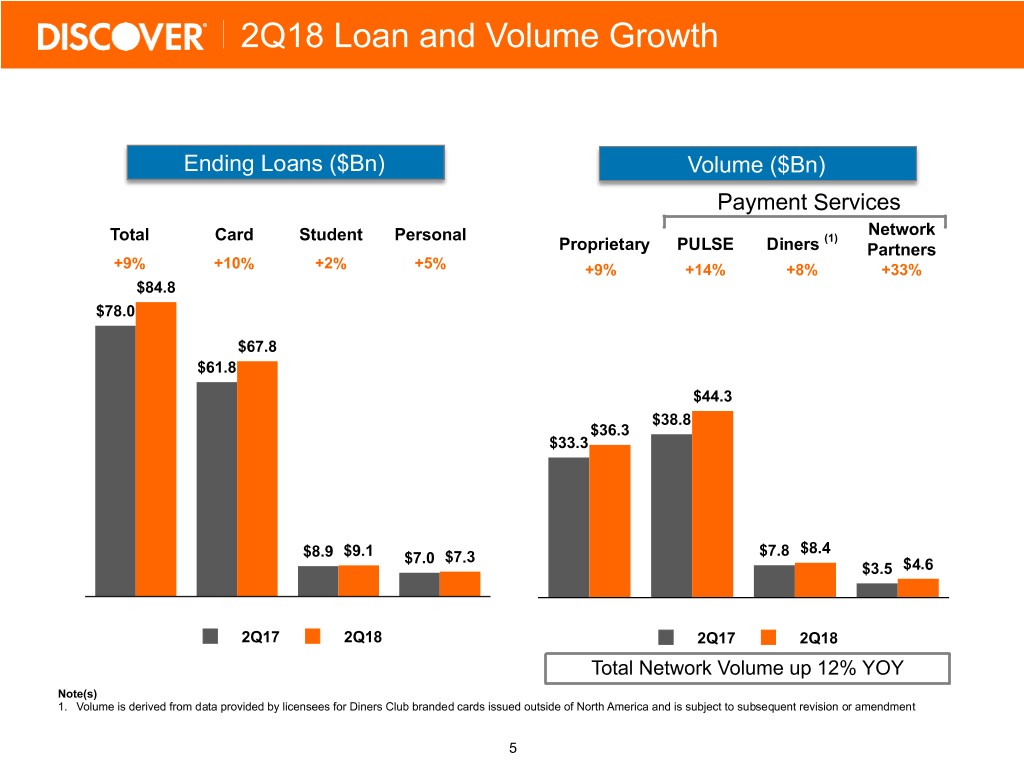
2Q18 Loan and Volume Growth Ending Loans ($Bn) Volume ($Bn) Payment Services Total Card Student Personal (1) Network Proprietary PULSE Diners Partners +9% +10% +2% +5% +9% +14% +8% +33% $84.8 $78.0 $67.8 $61.8 $44.3 $38.8 $36.3 $33.3 $8.4 $8.9 $9.1 $7.0 $7.3 $7.8 $3.5 $4.6 2Q17 2Q18 2Q17 2Q18 Total Network Volume up 12% YOY Note(s) 1. Volume is derived from data provided by licensees for Diners Club branded cards issued outside of North America and is subject to subsequent revision or amendment 5
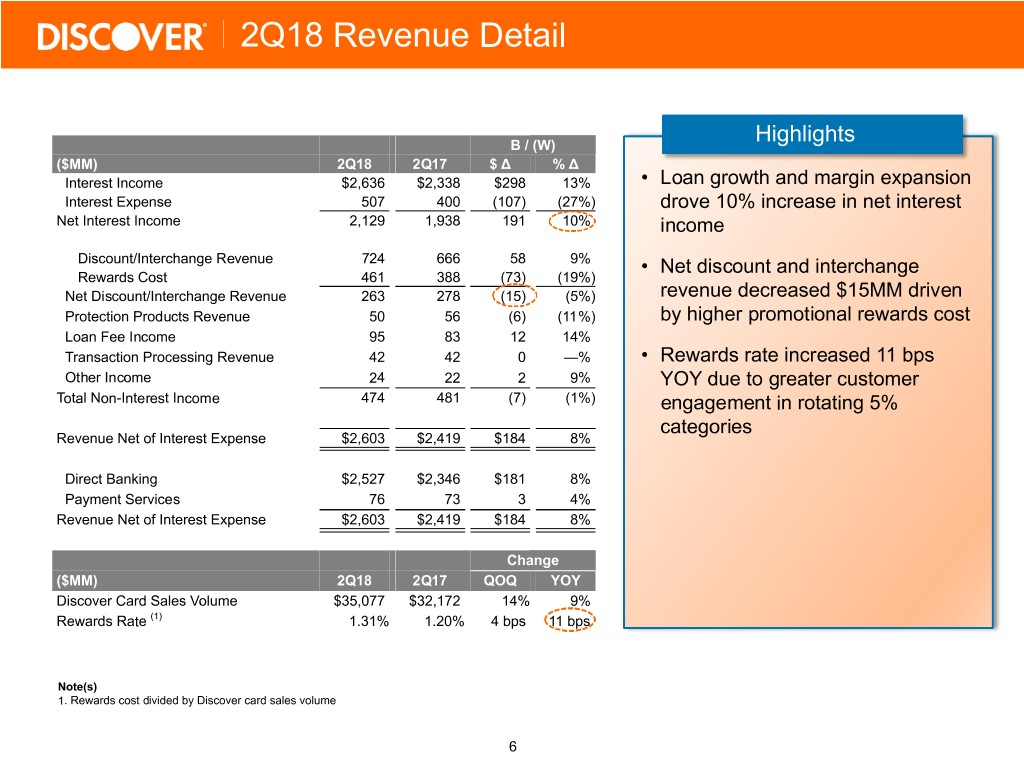
2Q18 Revenue Detail B / (W) Highlights ($MM) 2Q18 2Q17 $ Δ % Δ Interest Income $2,636 $2,338 $298 13% • Loan growth and margin expansion Interest Expense 507 400 (107) (27%) drove 10% increase in net interest Net Interest Income 2,129 1,938 191 10% income Discount/Interchange Revenue 724 666 58 9% • Net discount and interchange Rewards Cost 461 388 (73) (19%) Net Discount/Interchange Revenue 263 278 (15) (5%) revenue decreased $15MM driven Protection Products Revenue 50 56 (6) (11%) by higher promotional rewards cost Loan Fee Income 95 83 12 14% Transaction Processing Revenue 42 42 0 —% • Rewards rate increased 11 bps Other Income 24 22 2 9% YOY due to greater customer Total Non-Interest Income 474 481 (7) (1%) engagement in rotating 5% categories Revenue Net of Interest Expense $2,603 $2,419 $184 8% Direct Banking $2,527 $2,346 $181 8% Payment Services 76 73 3 4% Revenue Net of Interest Expense $2,603 $2,419 $184 8% Change ($MM) 2Q18 2Q17 QOQ YOY Discover Card Sales Volume $35,077 $32,172 14% 9% Rewards Rate (1) 1.31% 1.20% 4 bps 11 bps Note(s) 1. Rewards cost divided by Discover card sales volume 6
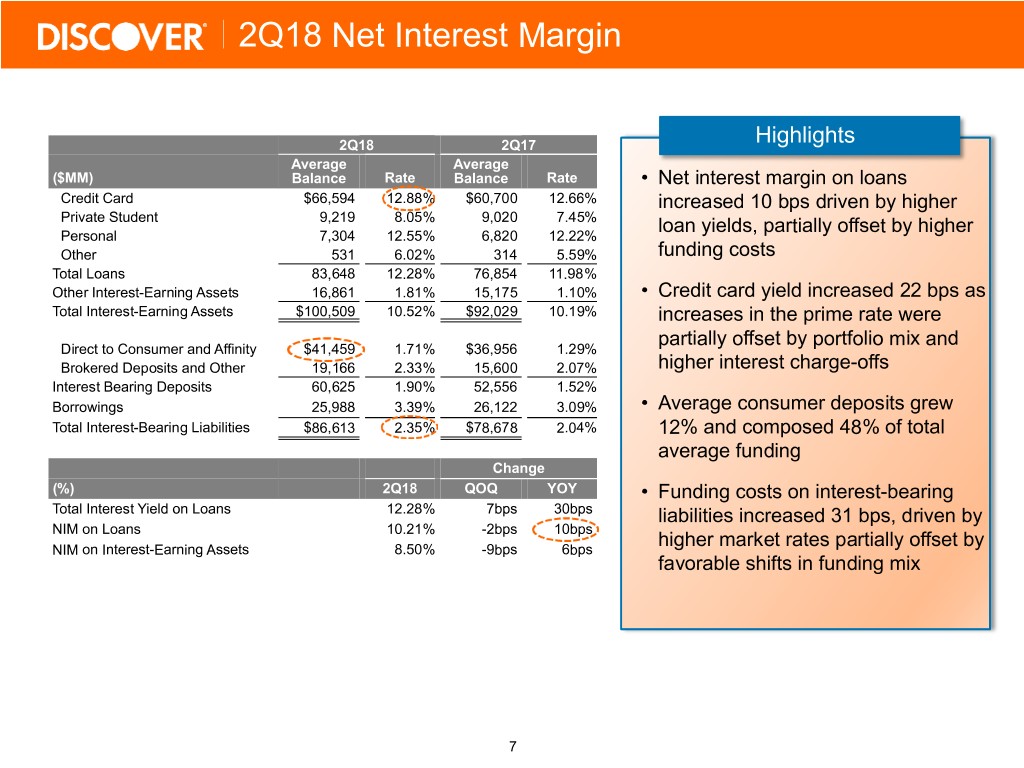
2Q18 Net Interest Margin 2Q18 2Q17 Highlights Average Average ($MM) Balance Rate Balance Rate • Net interest margin on loans Credit Card $66,594 12.88% $60,700 12.66% increased 10 bps driven by higher Private Student 9,219 8.05% 9,020 7.45% loan yields, partially offset by higher Personal 7,304 12.55% 6,820 12.22% Other 531 6.02% 314 5.59% funding costs Total Loans 83,648 12.28% 76,854 11.98% Other Interest-Earning Assets 16,861 1.81% 15,175 1.10% • Credit card yield increased 22 bps as Total Interest-Earning Assets $100,509 10.52% $92,029 10.19% increases in the prime rate were partially offset by portfolio mix and Direct to Consumer and Affinity $41,459 1.71% $36,956 1.29% Brokered Deposits and Other 19,166 2.33% 15,600 2.07% higher interest charge-offs Interest Bearing Deposits 60,625 1.90% 52,556 1.52% Borrowings 25,988 3.39% 26,122 3.09% • Average consumer deposits grew Total Interest-Bearing Liabilities $86,613 2.35% $78,678 2.04% 12% and composed 48% of total average funding Change (%) 2Q18 QOQ YOY • Funding costs on interest-bearing Total Interest Yield on Loans 12.28% 7bps 30bps liabilities increased 31 bps, driven by NIM on Loans 10.21% -2bps 10bps NIM on Interest-Earning Assets 8.50% -9bps 6bps higher market rates partially offset by favorable shifts in funding mix 7
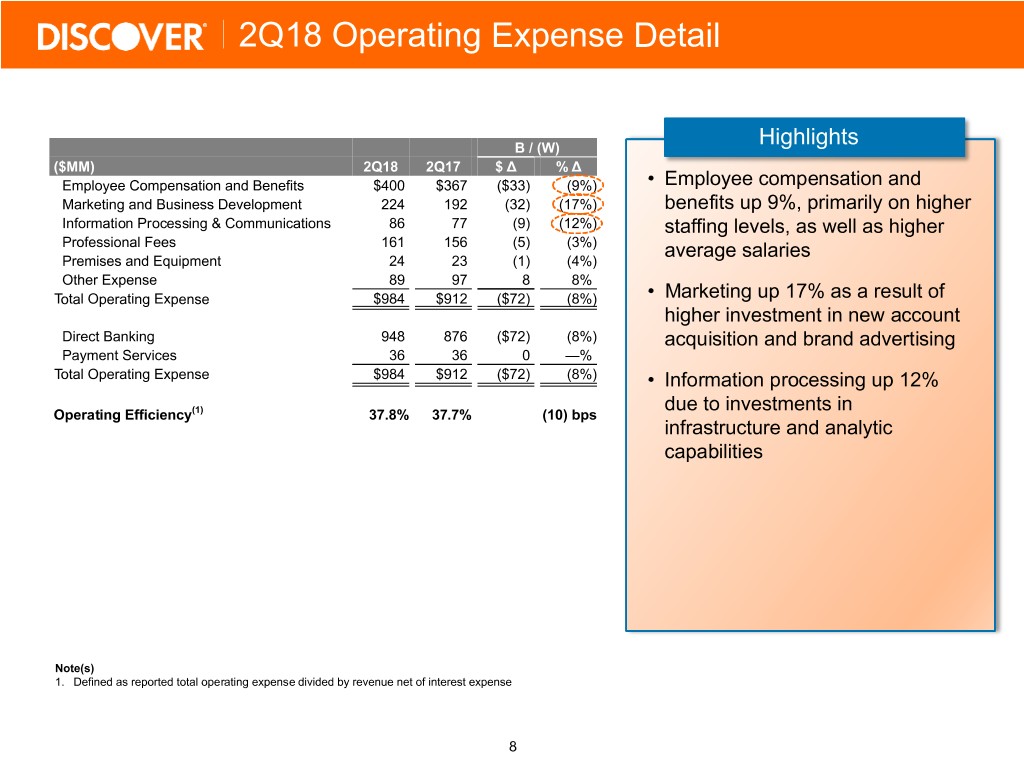
2Q18 Operating Expense Detail B / (W) Highlights ($MM) 2Q18 2Q17 $ Δ % Δ Employee Compensation and Benefits $400 $367 ($33) (9%) • Employee compensation and Marketing and Business Development 224 192 (32) (17%) benefits up 9%, primarily on higher Information Processing & Communications 86 77 (9) (12%) staffing levels, as well as higher Professional Fees 161 156 (5) (3%) average salaries Premises and Equipment 24 23 (1) (4%) Other Expense 89 97 8 8% Total Operating Expense $984 $912 ($72) (8%) • Marketing up 17% as a result of higher investment in new account Direct Banking 948 876 ($72) (8%) acquisition and brand advertising Payment Services 36 36 0 —% Total Operating Expense $984 $912 ($72) (8%) • Information processing up 12% due to investments in Operating Efficiency(1) 37.8% 37.7% (10) bps infrastructure and analytic capabilities Note(s) 1. Defined as reported total operating expense divided by revenue net of interest expense 8
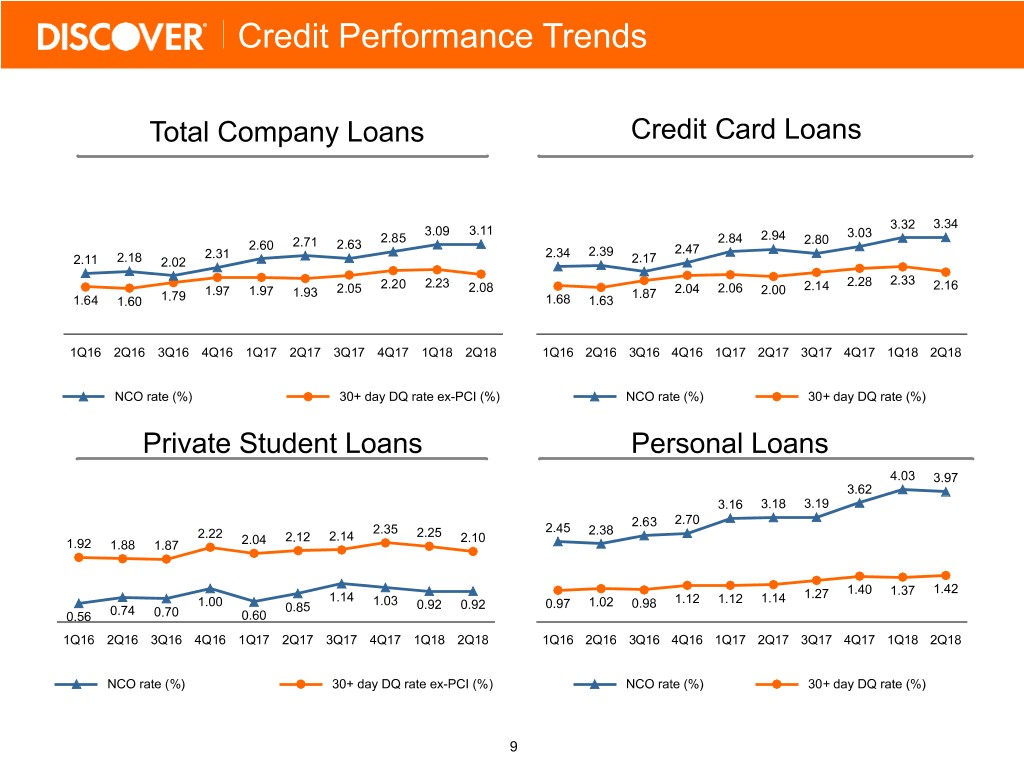
Credit Performance Trends Total Company Loans Credit Card Loans 3.32 3.34 3.09 3.11 2.85 2.84 2.94 3.03 2.60 2.71 2.63 2.80 2.31 2.34 2.39 2.47 2.11 2.18 2.02 2.17 2.20 2.23 2.14 2.28 2.33 2.16 1.97 1.97 1.93 2.05 2.08 1.87 2.04 2.06 2.00 1.64 1.60 1.79 1.68 1.63 1Q16 2Q16 3Q16 4Q16 1Q17 2Q17 3Q17 4Q17 1Q18 2Q18 1Q16 2Q16 3Q16 4Q16 1Q17 2Q17 3Q17 4Q17 1Q18 2Q18 NCO rate (%) 30+ day DQ rate ex-PCI (%) NCO rate (%) 30+ day DQ rate (%) Private Student Loans Personal Loans 4.03 3.97 3.62 3.16 3.18 3.19 2.63 2.70 2.35 2.45 2.38 2.22 2.12 2.14 2.25 2.10 1.92 1.88 1.87 2.04 1.40 1.37 1.42 1.14 1.12 1.12 1.14 1.27 1.00 0.85 1.03 0.92 0.92 0.97 1.02 0.98 0.56 0.74 0.70 0.60 1Q16 2Q16 3Q16 4Q16 1Q17 2Q17 3Q17 4Q17 1Q18 2Q18 1Q16 2Q16 3Q16 4Q16 1Q17 2Q17 3Q17 4Q17 1Q18 2Q18 NCO rate (%) 30+ day DQ rate ex-PCI (%) NCO rate (%) 30+ day DQ rate (%) 9
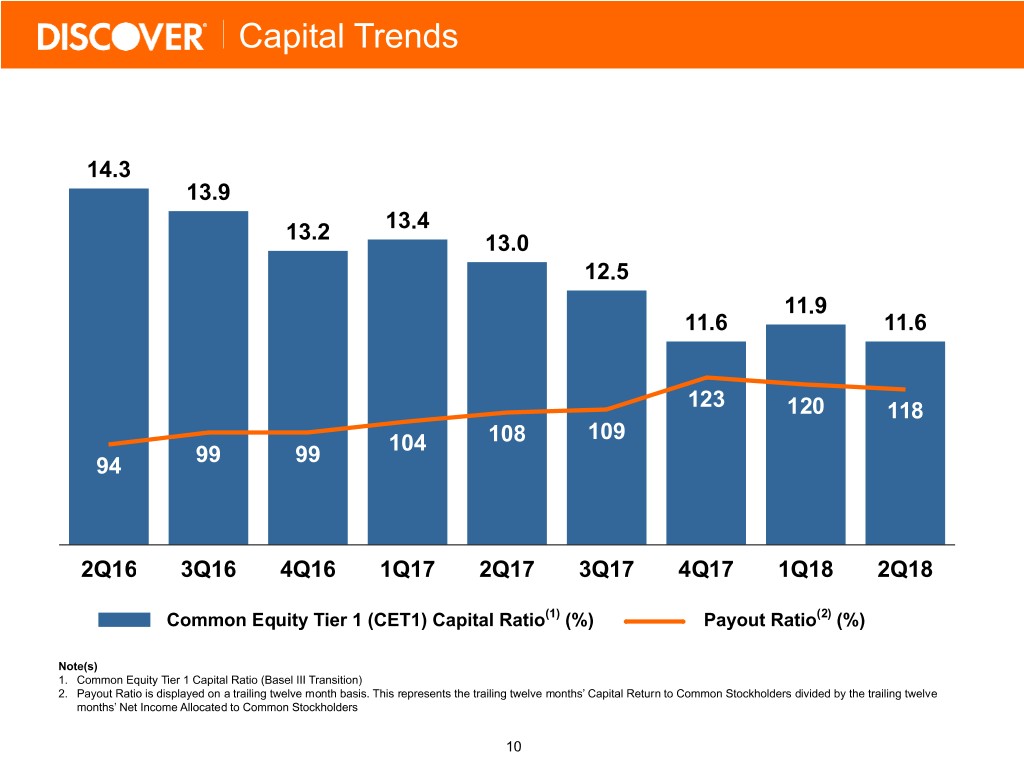
Capital Trends 14.3 13.9 13.4 13.2 13.0 12.5 11.9 11.6 11.6 123 120 118 109 104 108 99 99 94 2Q16 3Q16 4Q16 1Q17 2Q17 3Q17 4Q17 1Q18 2Q18 Common Equity Tier 1 (CET1) Capital Ratio(1) (%) Payout Ratio(2) (%) Note(s) 1. Common Equity Tier 1 Capital Ratio (Basel III Transition) 2. Payout Ratio is displayed on a trailing twelve month basis. This represents the trailing twelve months’ Capital Return to Common Stockholders divided by the trailing twelve months’ Net Income Allocated to Common Stockholders 10
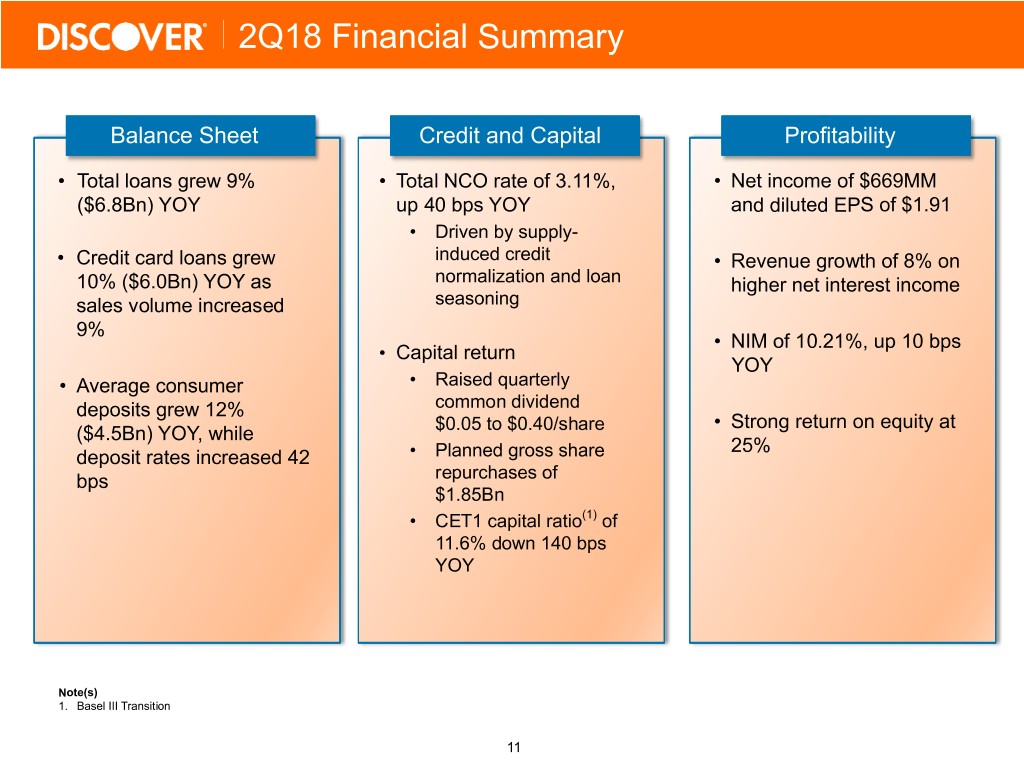
2Q18 Financial Summary Balance Sheet Credit and Capital Profitability • Total loans grew 9% • Total NCO rate of 3.11%, • Net income of $669MM ($6.8Bn) YOY up 40 bps YOY and diluted EPS of $1.91 • Driven by supply- • Credit card loans grew induced credit • Revenue growth of 8% on 10% ($6.0Bn) YOY as normalization and loan higher net interest income sales volume increased seasoning 9% • NIM of 10.21%, up 10 bps • Capital return YOY • Average consumer • Raised quarterly deposits grew 12% common dividend • Strong return on equity at ($4.5Bn) YOY, while $0.05 to $0.40/share 25% deposit rates increased 42 • Planned gross share bps repurchases of $1.85Bn • CET1 capital ratio(1) of 11.6% down 140 bps YOY Note(s) 1. Basel III Transition 11
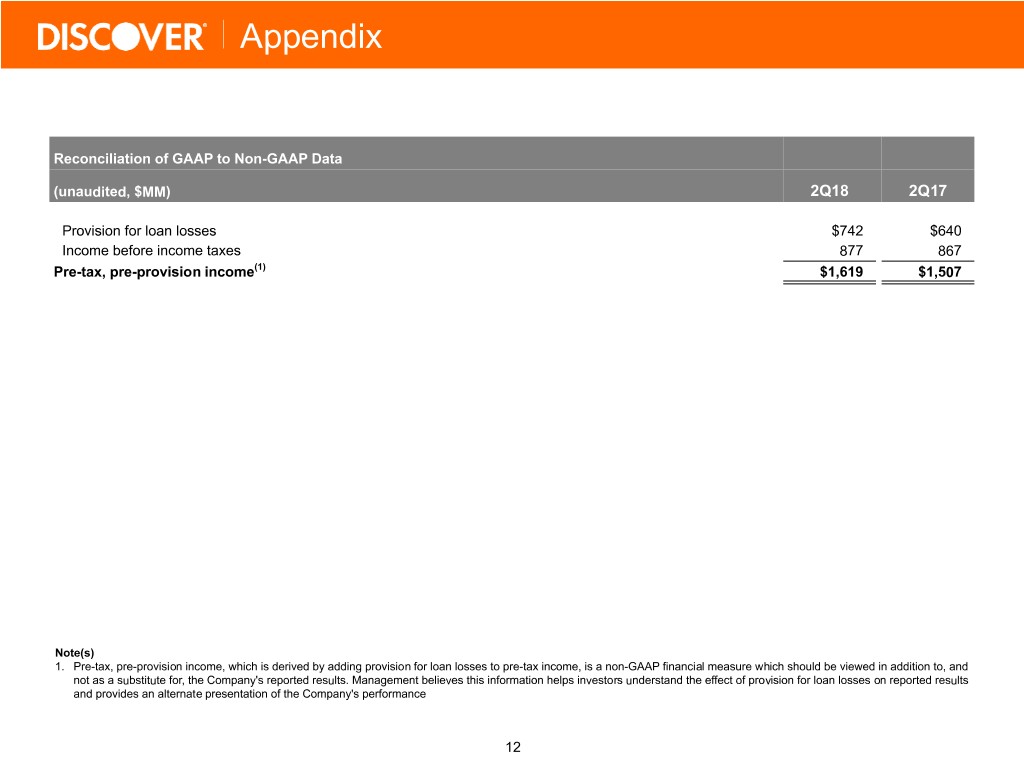
Appendix Reconciliation of GAAP to Non-GAAP Data (unaudited, $MM) 2Q18 2Q17 Provision for loan losses $742 $640 Income before income taxes 877 867 Pre-tax, pre-provision income(1) $1,619 $1,507 Note(s) 1. Pre-tax, pre-provision income, which is derived by adding provision for loan losses to pre-tax income, is a non-GAAP financial measure which should be viewed in addition to, and not as a substitute for, the Company's reported results. Management believes this information helps investors understand the effect of provision for loan losses on reported results and provides an alternate presentation of the Company's performance 12

