Attached files
| file | filename |
|---|---|
| 8-K - 8-K - SPX CORP | a18-16507_18k.htm |

July 2018 2 Certain statements contained in this presentation that are not historical facts, including any statements as to future market conditions, results of operations, and financial projections, are forward-looking statements within the meaning of Section 21E of the Securities Exchange Act of 1934, as amended, and are subject to the safe harbor created thereby. These forward-looking statements are subject to risks, uncertainties, and other factors which could cause actual results to differ materially from future express or implied results. Although SPX believes that the expectations reflected in its forward-looking statements are reasonable, it can give no assurance that such expectations will prove to be correct. In addition, estimates of future operating results are based on the company’s existing operations and complement of businesses, which are subject to change. Particular risks facing SPX include risks relating to market specific cycles and weather related fluctuations; economic, business, and other risks stemming from changes in the economy; legal and regulatory risks; cost of raw materials; pricing pressures; our reliance on U.S. revenues and international operations; our 2015 spin-off transaction; the effectiveness, success, and timing of restructuring plans; our ability to manage changes and measure and estimate the expected revenue and cost associated with our power projects in South Africa; pension funding requirements; liabilities retained in connection with dispositions; and integration of acquisitions and achievement of anticipated synergies. More information regarding such risks can be found in SPX’s Annual Report on Form 10-K and other SEC filings. Statements in this presentation are only as of the time made. All references to 2018 guidance reflect the company’s view of expected full-year results at the time this guidance was issued and/or updated in press releases and presentations made available in the investor relations section of the website SPX.com on July 2, 2018, June 7, 2018 and May 3, 2018. SPX disclaims any responsibility to update or revise such statements except as required by regulatory authorities. This presentation includes forward-looking non-GAAP financial measures, including “Adjusted earnings per share,” “pro form Adjusted earnings per share,” “EBITDA (Core)” of each segment, “Engineered Solutions (Core) segment income,” “Detection & Measurement adjusted segment income,” “Core Revenue,” “Core Segment Income Margin,” and “Adjusted Operating Margin.” Each of these non-GAAP measures excludes items, which would be included in our financial measures presented in accordance with United States generally accepted accounting principles (“GAAP”), that we do not consider indicative of our on-going performance and are calculated by the company in a manner consistent with the presentation of similarly titled measures included in its May 3, 2018 press release announcing the results of operations for the first quarter of 2018, except that EBITDA (Core), which is not presented in such press release, is calculated by adding for each respective segment, its depreciation and amortization expense to segment income (for the HVAC segment), Detection & Measurement adjusted segment income (for the Detection & Measurement segment), and Engineered Solutions (Core) segment income (for the Engineered Solutions segment), and EBITDA margin, which is for each segment such segment’s EBITDA (Core) divided by segment revenues (for the HVAC and Detection & Measurement segments), and Engineered Solutions (Core) revenues (for the Engineered Solutions segment. Because of the forward-looking nature of these items, it is impractical to present a quantitative reconciliation of such measure to a comparable GAAP measure, and accordingly no such GAAP measure is being presented. “Core” and “Engineered Solutions (Core)” results in this presentation are non-GAAP financial measures that exclude the results of the South African projects.
Executive Management Gene Lowe President and CEO Scott Sproule VP, CFO and Treasurer July 2018 3
SPX Corporation Overview July 2018

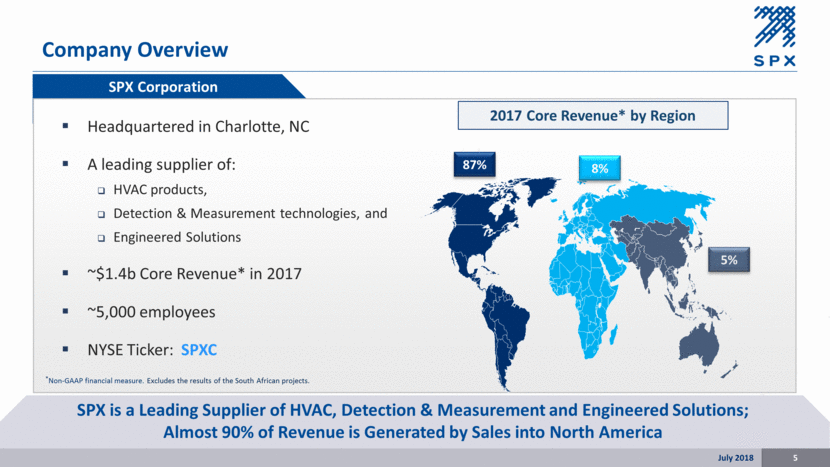
Company Overview SPX Corporation Headquartered in Charlotte, NC A leading supplier of: HVAC products, Detection & Measurement technologies, and Engineered Solutions ~$1.4b Core Revenue* in 2017 ~5,000 employees NYSE Ticker: SPXC 2017 Core Revenue* by Region 8% 5% 87% SPX is a Leading Supplier of HVAC, Detection & Measurement and Engineered Solutions; Almost 90% of Revenue is Generated by Sales into North America *Non-GAAP financial measure. Excludes the results of the South African projects. 5 July 2018
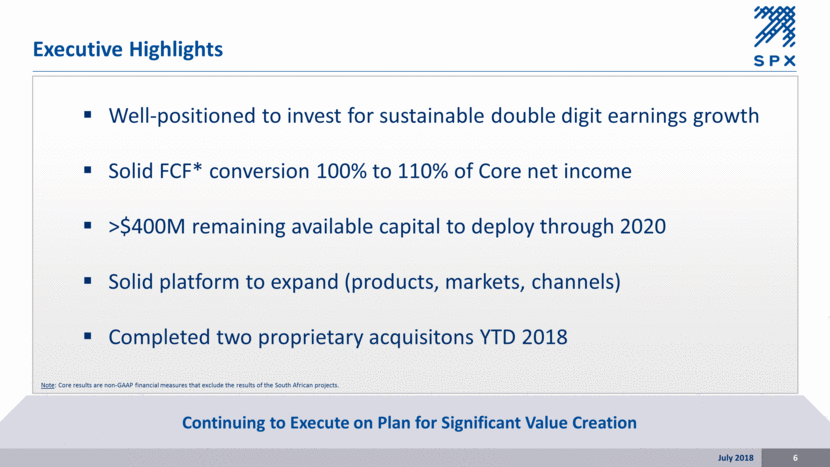
Executive Highlights Well-positioned to invest for sustainable double digit earnings growth Solid FCF* conversion 100% to 110% of Core net income >$400M remaining available capital to deploy through 2020 Solid platform to expand (products, markets, channels) Completed two proprietary acquisitons YTD 2018 Continuing to Execute on Plan for Significant Value Creation 6 July 2018 Note: Core results are non-GAAP financial measures that exclude the results of the South African projects.
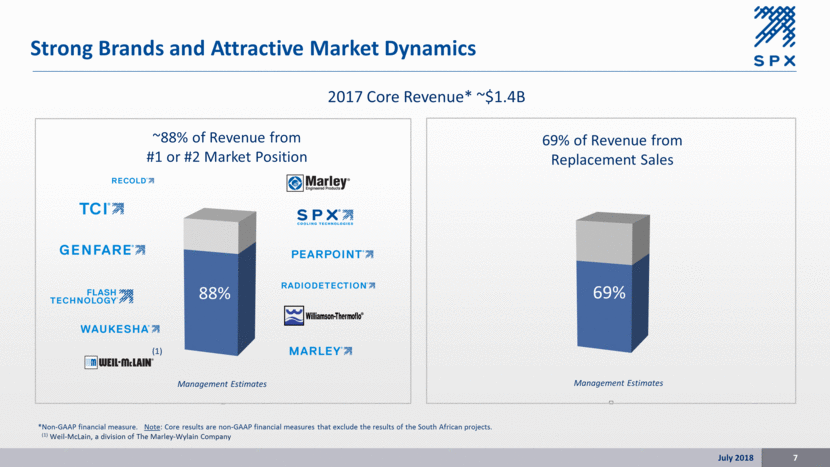
Strong Brands and Attractive Market Dynamics *Non-GAAP financial measure. Note: Core results are non-GAAP financial measures that exclude the results of the South African projects. (1) Weil-McLain, a division of The Marley-Wylain Company July 2018 7 2017 Core Revenue* ~$1.4B Management Estimates (1) ~88% of Revenue from #1 or #2 Market Position 69% of Revenue from Replacement Sales 88% 69% Management Estimates
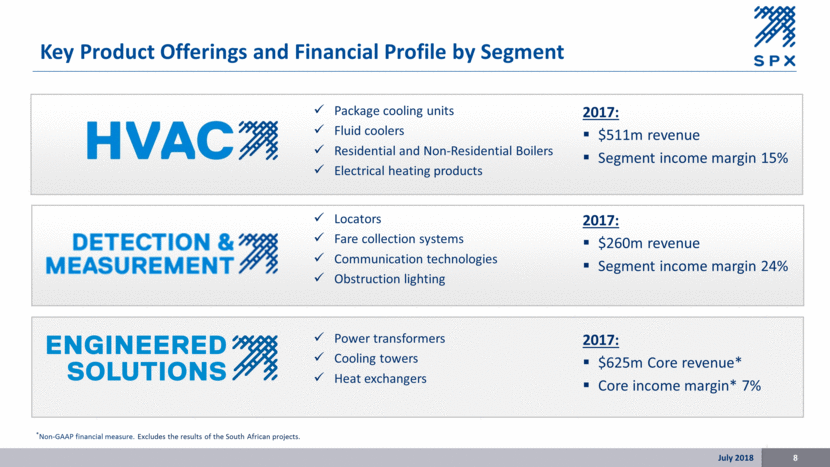
Key Product Offerings and Financial Profile by Segment Locators Fare collection systems Communication technologies Obstruction lighting Package cooling units Fluid coolers Residential and Non-Residential Boilers Electrical heating products Power transformers Cooling towers Heat exchangers 2017: $511m revenue Segment income margin 15% 2017: $625m Core revenue* Core income margin* 7% 2017: $260m revenue Segment income margin 24% *Non-GAAP financial measure. Excludes the results of the South African projects. July 2018 8
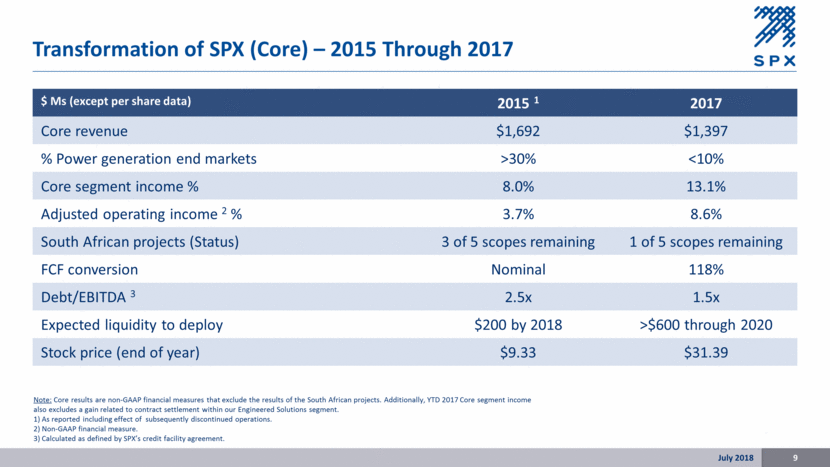
$ Ms (except per share data) 2015 1 2017 Core revenue $1,692 $1,397 % Power generation end markets >30% <10% Core segment income % 8.0% 13.1% Adjusted operating income 2 % 3.7% 8.6% South African projects (Status) 3 of 5 scopes remaining 1 of 5 scopes remaining FCF conversion Nominal 118% Debt/EBITDA 3 2.5x 1.5x Expected liquidity to deploy $200 by 2018 >$600 through 2020 Stock price (end of year) $9.33 $31.39 Transformation of SPX (Core) – 2015 Through 2017 Note: Core results are non-GAAP financial measures that exclude the results of the South African projects. Additionally, YTD 2017 Core segment income also excludes a gain related to contract settlement within our Engineered Solutions segment. 1) As reported including effect of subsequently discontinued operations. 2) Non-GAAP financial measure. 3) Calculated as defined by SPX’s credit facility agreement. July 2018 9
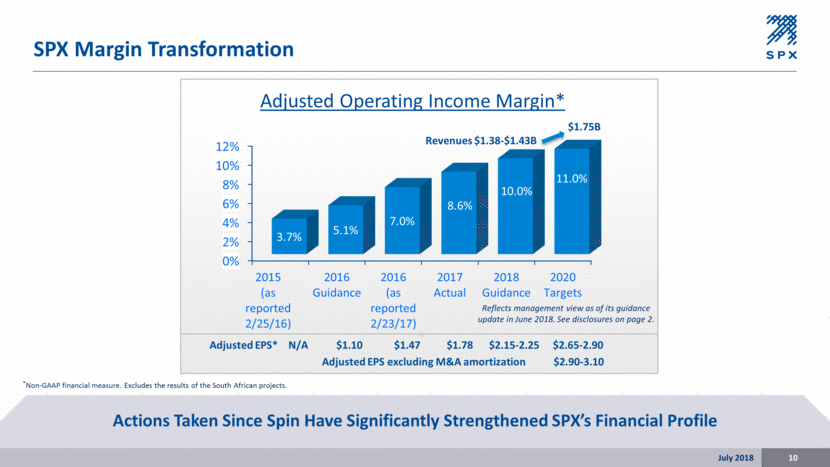
SPX Margin Transformation Actions Taken Since Spin Have Significantly Strengthened SPX’s Financial Profile *Non-GAAP financial measure. Excludes the results of the South African projects. Adjusted EPS* N/A $1.10 $1.47 $1.78 $2.15-2.25 $2.65-2.90 July 2018 10 $1.75B Revenues $1.38-$1.43B Reflects management view as of its guidance update in June 2018. See disclosures on page 2. 0% 2% 4% 6% 8% 10% 12% 2015 (as reported 2/25/16) 2016 Guidance 2016 (as reported 2/23/17) 2017 Actual 2018 Guidance 2020 Targets 3.7% 5.1% 7.0% 8.6% 10.0% 11.0% Adjusted Operating Income Margin* Adjusted EPS excluding M&A amortization $2.90 - 3.10
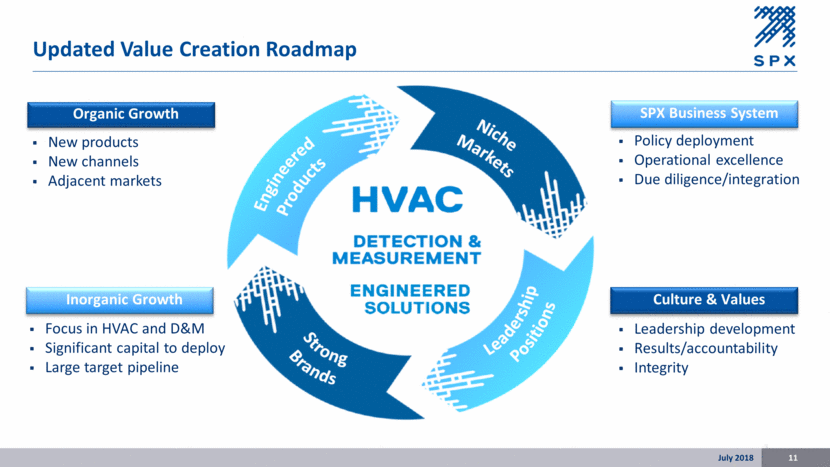
Updated Value Creation Roadmap SPX Business System Organic Growth Culture & Values Inorganic Growth New products New channels Adjacent markets Focus in HVAC and D&M Significant capital to deploy Large target pipeline Policy deployment Operational excellence Due diligence/integration Leadership development Results/accountability Integrity July 2018 11
Segment Overview July 2018

HVAC

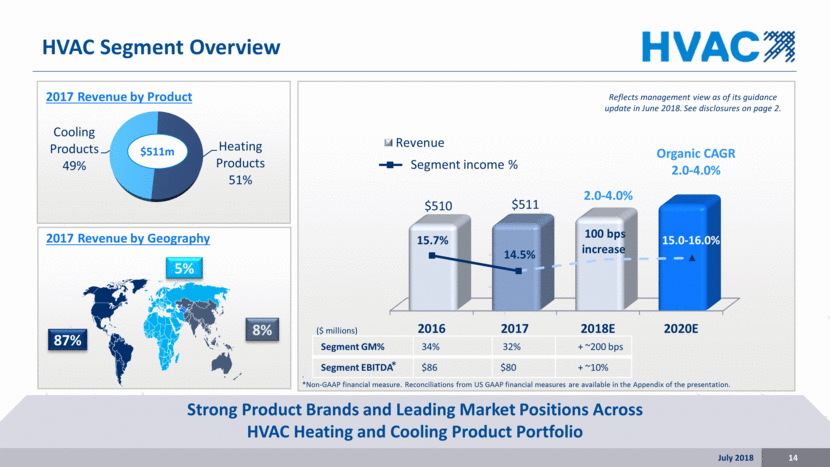
2017 Revenue by Product 2017 Revenue by Geography 87% 5% 8% HVAC Segment Overview July 2018 14 Strong Product Brands and Leading Market Positions Across HVAC Heating and Cooling Product Portfolio ($ millions) Segment income % $511m 14.5% Segment GM% 34% 32% + ~200 bps Segment EBITDA $86 $80 + ~10% . *Non-GAAP financial measure. Reconciliations from US GAAP financial measures are available in the Appendix of the presentation. * Reflects management view as of its guidance update in June 2018. See disclosures on page 2. Cooling Products 49% Heating Products 51% 2016 2017 2018E 2020E $ 510 2.0 - 4.0% $511 Organic CAGR 2.0 - 4.0% Revenue 15.7% 100 bps increase 15.0 - 16.0%
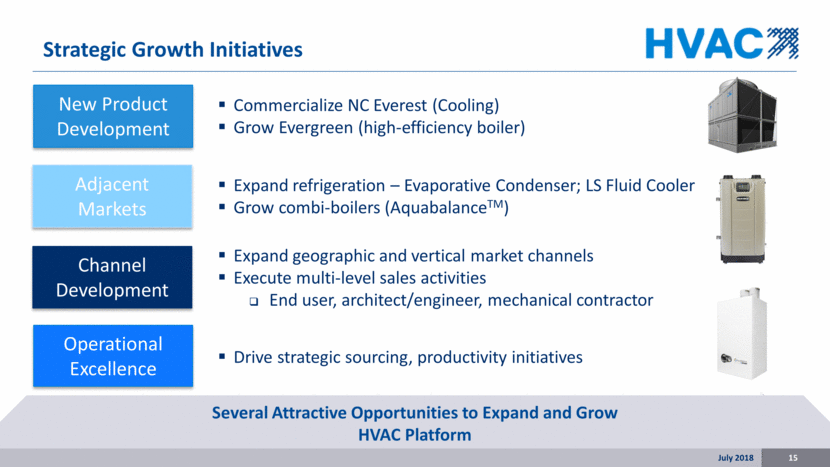
Strategic Growth Initiatives Several Attractive Opportunities to Expand and Grow HVAC Platform Channel Development Operational Excellence Commercialize NC Everest (Cooling) Grow Evergreen (high-efficiency boiler) Expand refrigeration – Evaporative Condenser; LS Fluid Cooler Grow combi-boilers (AquabalanceTM) Expand geographic and vertical market channels Execute multi-level sales activities End user, architect/engineer, mechanical contractor Adjacent Markets New Product Development Drive strategic sourcing, productivity initiatives July 2018 15
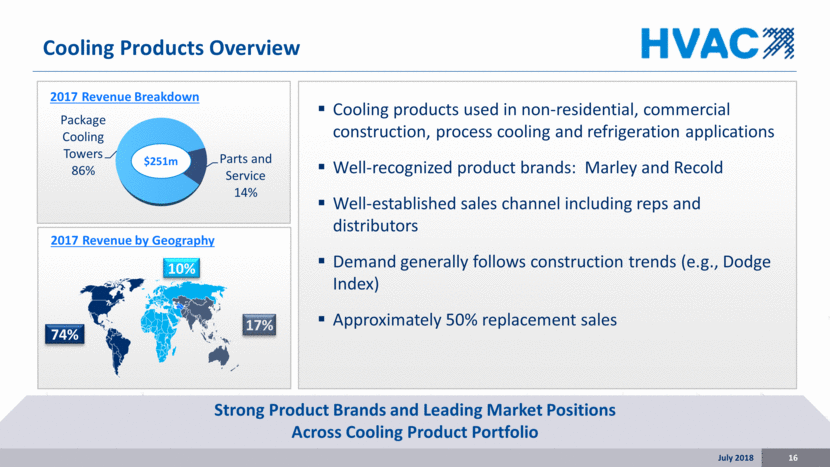
Cooling products used in non-residential, commercial construction, process cooling and refrigeration applications Well-recognized product brands: Marley and Recold Well-established sales channel including reps and distributors Demand generally follows construction trends (e.g., Dodge Index) Approximately 50% replacement sales 2017 Revenue Breakdown 2017 Revenue by Geography 74% 10% 17% Cooling Products Overview July 2018 16 Strong Product Brands and Leading Market Positions Across Cooling Product Portfolio 0 $251m Package Cooling Towers 86% Parts and Service 14%
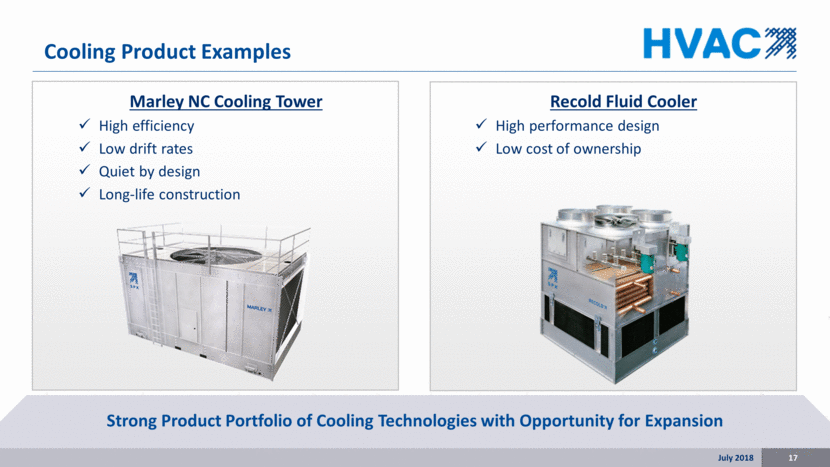
Cooling Product Examples July 2018 17 Strong Product Portfolio of Cooling Technologies with Opportunity for Expansion Marley NC Cooling Tower High efficiency Low drift rates Quiet by design Long-life construction Recold Fluid Cooler High performance design Low cost of ownership
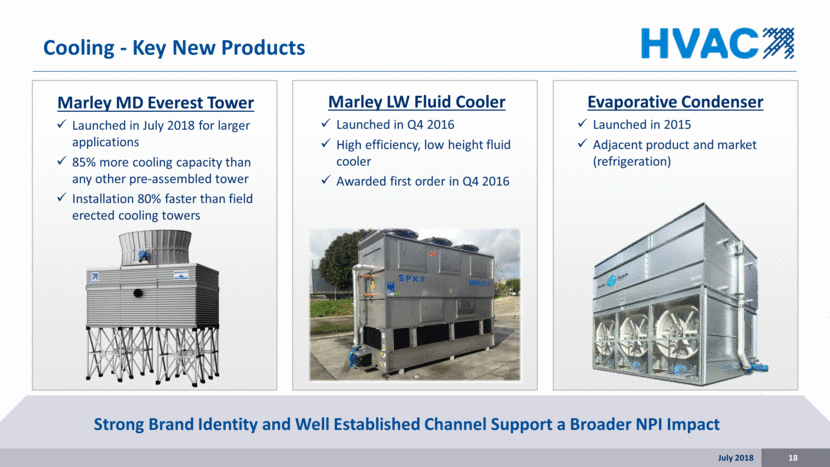
Cooling - Key New Products Strong Brand Identity and Well Established Channel Support a Broader NPI Impact Marley MD Everest Tower Launched in July 2018 for larger applications 85% more cooling capacity than any other pre-assembled tower Installation 80% faster than field erected cooling towers Marley LW Fluid Cooler Launched in Q4 2016 High efficiency, low height fluid cooler Awarded first order in Q4 2016 Evaporative Condenser Launched in 2015 Adjacent product and market (refrigeration) July 2018 18
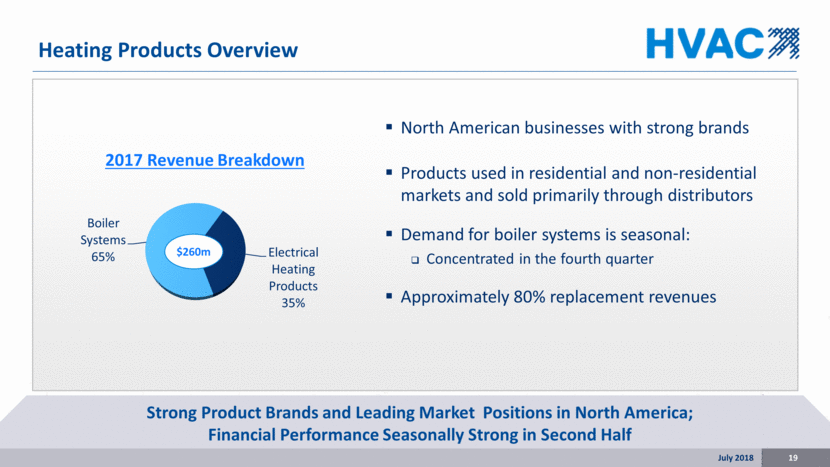
North American businesses with strong brands Products used in residential and non-residential markets and sold primarily through distributors Demand for boiler systems is seasonal: Concentrated in the fourth quarter Approximately 80% replacement revenues 2017 Revenue Breakdown Heating Products Overview Strong Product Brands and Leading Market Positions in North America; Financial Performance Seasonally Strong in Second Half $260m July 2018 19 Boiler Systems 65% Electrical Heating Products 35%
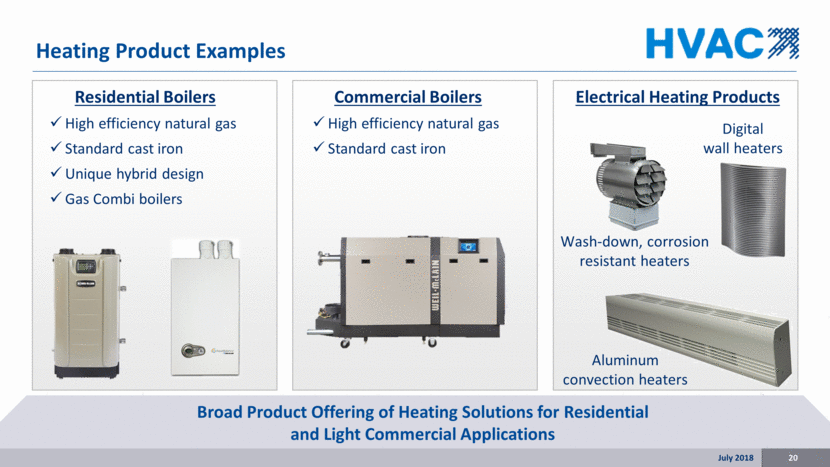
Heating Product Examples Broad Product Offering of Heating Solutions for Residential and Light Commercial Applications Commercial Boilers High efficiency natural gas Standard cast iron Digital wall heaters Aluminum convection heaters Wash-down, corrosion resistant heaters Residential Boilers High efficiency natural gas Standard cast iron Unique hybrid design Gas Combi boilers Electrical Heating Products July 2018 20
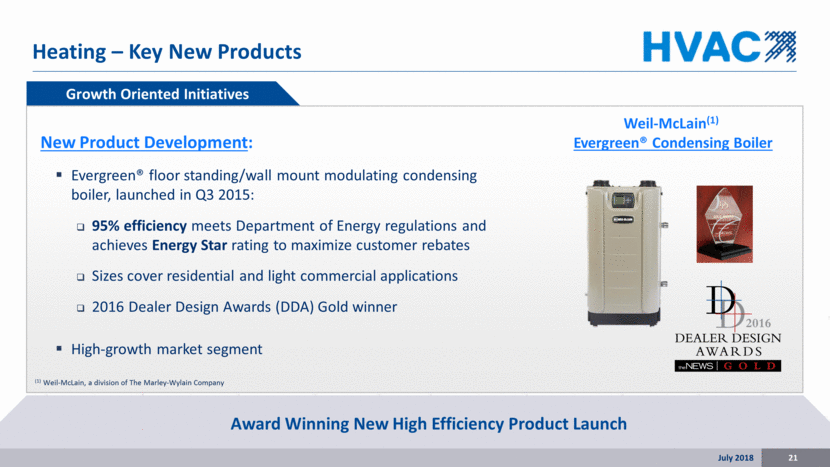
Growth Oriented Initiatives Evergreen® floor standing/wall mount modulating condensing boiler, launched in Q3 2015: 95% efficiency meets Department of Energy regulations and achieves Energy Star rating to maximize customer rebates Sizes cover residential and light commercial applications 2016 Dealer Design Awards (DDA) Gold winner High-growth market segment Heating – Key New Products New Product Development: (1) Weil-McLain, a division of The Marley-Wylain Company Weil-McLain(1) Evergreen® Condensing Boiler Award Winning New High Efficiency Product Launch July 2018 21
Detection & Measurement

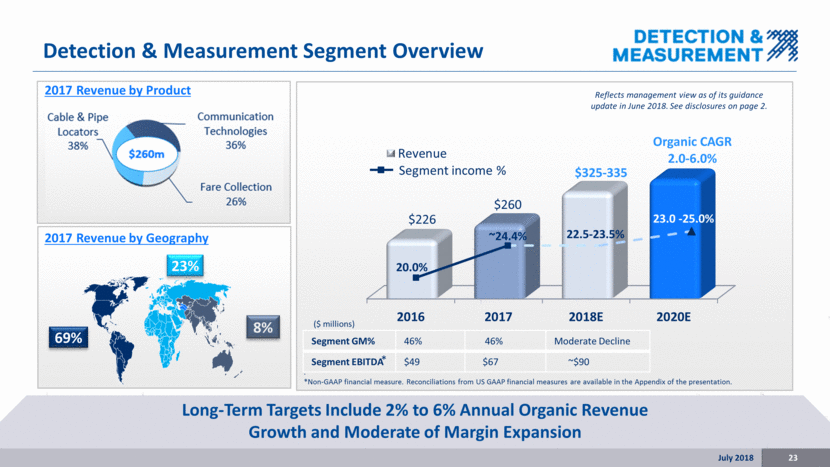
2017 Revenue by Product 2017 Revenue by Geography 69% 23% 8% Detection & Measurement Segment Overview July 2018 23 Long-Term Targets Include 2% to 6% Annual Organic Revenue Growth and Moderate of Margin Expansion ($ millions) Segment income % 22.5-23.5% Segment GM% 46% 46% Moderate Decline Segment EBITDA $49 $67 ~$90 . *Non-GAAP financial measure. Reconciliations from US GAAP financial measures are available in the Appendix of the presentation. * Reflects management view as of its guidance update in June 2018. See disclosures on page 2. 2016 2017 2018E 2020E $226 $325 - 335 $260 Organic CAGR 2.0 - 6.0% Revenue 20.0% ~24.4% 23.0 - 25.0%
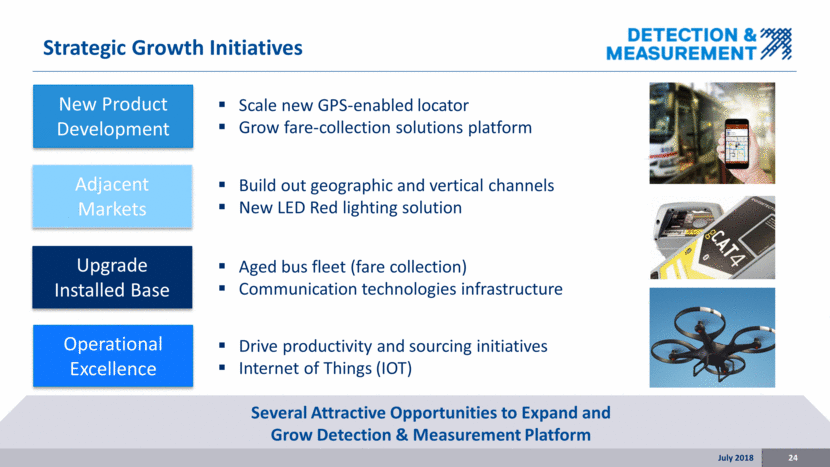
Strategic Growth Initiatives Several Attractive Opportunities to Expand and Grow Detection & Measurement Platform Upgrade Installed Base Operational Excellence Scale new GPS-enabled locator Grow fare-collection solutions platform Build out geographic and vertical channels New LED Red lighting solution Aged bus fleet (fare collection) Communication technologies infrastructure Adjacent Markets New Product Development Drive productivity and sourcing initiatives Internet of Things (IOT) July 2018 24
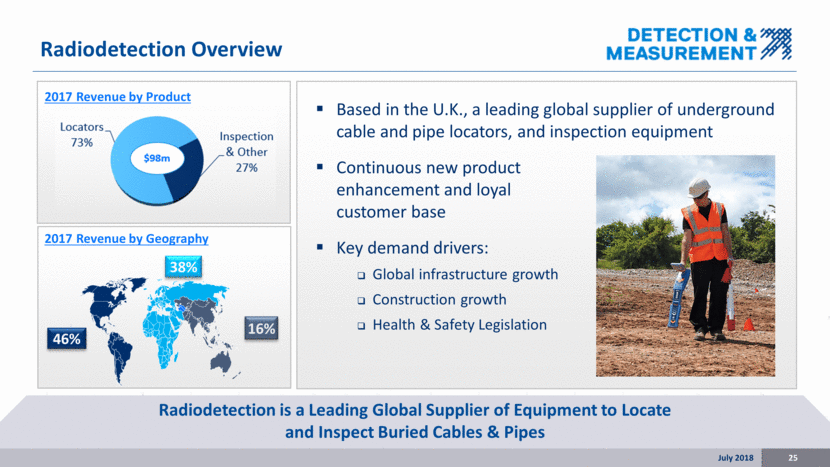
Based in the U.K., a leading global supplier of underground cable and pipe locators, and inspection equipment Continuous new product enhancement and loyal customer base Key demand drivers: Global infrastructure growth Construction growth Health & Safety Legislation Radiodetection Overview July 2018 25 Radiodetection is a Leading Global Supplier of Equipment to Locate and Inspect Buried Cables & Pipes 2017 Revenue by Product 2017 Revenue by Geography 46% 38% 16%
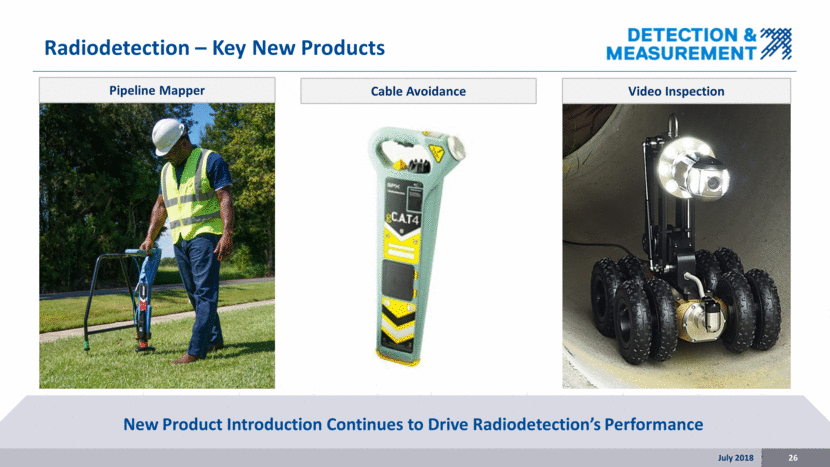
Radiodetection – Key New Products New Product Introduction Continues to Drive Radiodetection’s Performance Video Inspection Cable Avoidance Pipeline Mapper July 2018 26
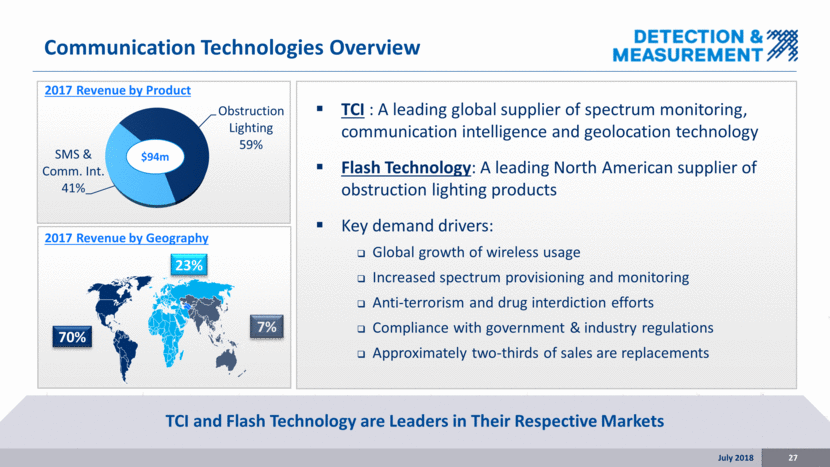
TCI : A leading global supplier of spectrum monitoring, communication intelligence and geolocation technology Flash Technology: A leading North American supplier of obstruction lighting products Key demand drivers: Global growth of wireless usage Increased spectrum provisioning and monitoring Anti-terrorism and drug interdiction efforts Compliance with government & industry regulations Approximately two-thirds of sales are replacements 2017 Revenue by Product 2017 Revenue by Geography Communication Technologies Overview July 2018 27 TCI and Flash Technology are Leaders in Their Respective Markets $94m 70% 23% 7% SMS & Comm. Int. 41% Obstruction Lighting 59%
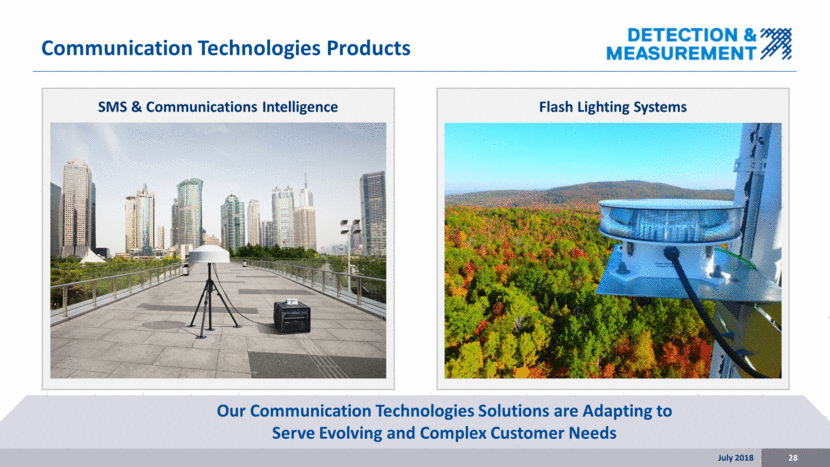
SMS & Communications Intelligence Communication Technologies Products Our Communication Technologies Solutions are Adapting to Serve Evolving and Complex Customer Needs Flash Lighting Systems July 2018 28
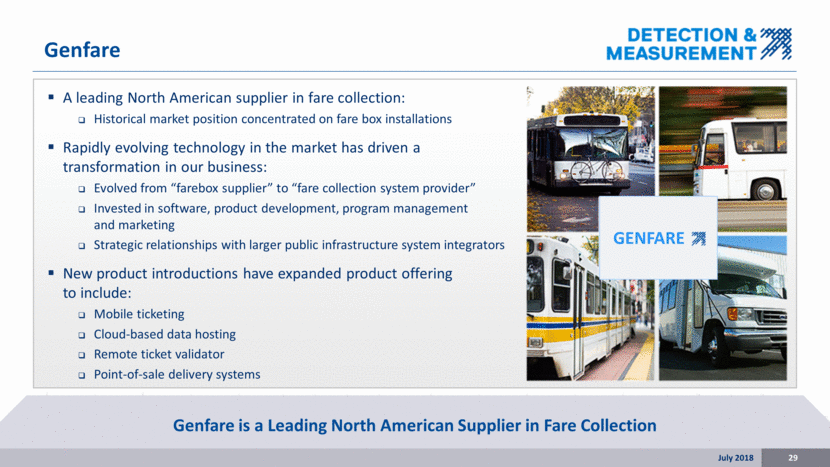
A leading North American supplier in fare collection: Historical market position concentrated on fare box installations Rapidly evolving technology in the market has driven a transformation in our business: Evolved from “farebox supplier” to “fare collection system provider” Invested in software, product development, program management and marketing Strategic relationships with larger public infrastructure system integrators New product introductions have expanded product offering to include: Mobile ticketing Cloud-based data hosting Remote ticket validator Point-of-sale delivery systems Genfare Genfare is a Leading North American Supplier in Fare Collection GENFARE July 2018 29
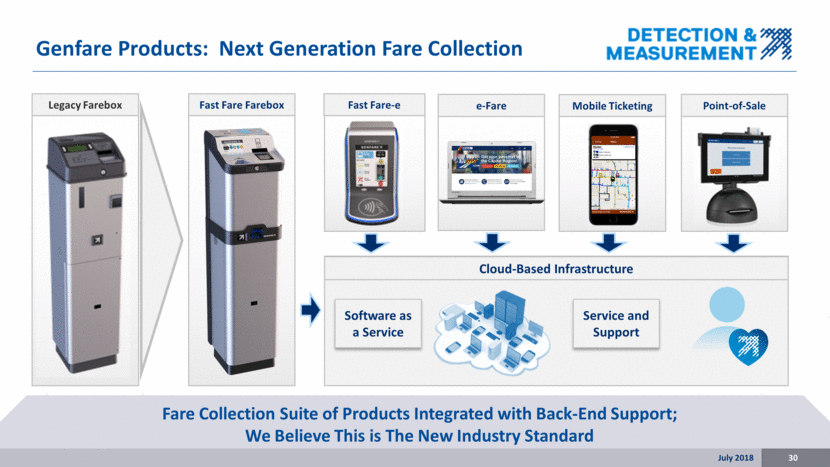
Genfare Products: Next Generation Fare Collection Fare Collection Suite of Products Integrated with Back-End Support; We Believe This is The New Industry Standard e-Fare Point-of-Sale Fast Fare-e Legacy Farebox Cloud-Based Infrastructure Mobile Ticketing Fast Fare Farebox Service and Support Software as a Service July 2018 30
Engineered Solutions

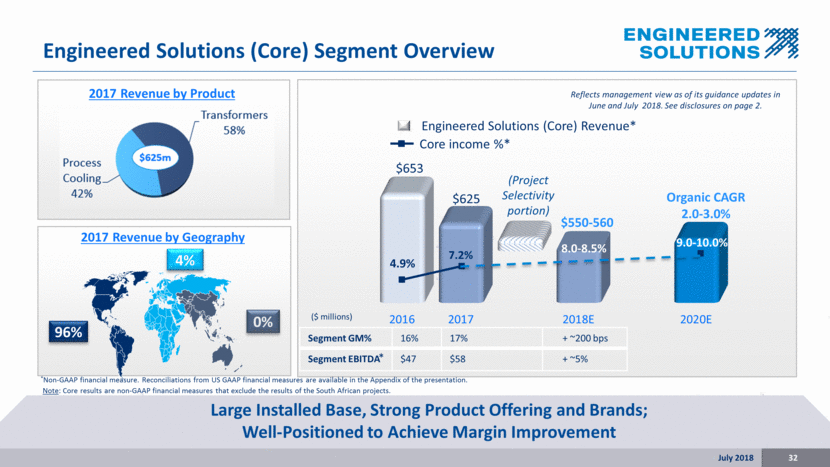
2017 Revenue by Geography Engineered Solutions (Core) Segment Overview July 2018 32 Large Installed Base, Strong Product Offering and Brands; Well-Positioned to Achieve Margin Improvement 96% 4% 0% ($ millions) Core income %* Engineered Solutions (Core) Revenue* Organic CAGR 2.0-3.0% *Non-GAAP financial measure. Reconciliations from US GAAP financial measures are available in the Appendix of the presentation. Note: Core results are non-GAAP financial measures that exclude the results of the South African projects. $550-560 (Project Selectivity portion) 2017 Revenue by Product 9.0-10.0% * Segment GM% 16% 17% + ~200 bps Segment EBITDA $47 $58 + ~5% 8.0-8.5% $653 $625 Reflects management view as of its guidance updates in June and July 2018. See disclosures on page 2. 2016 2017 2018E 2020E 4.9% 7.2%
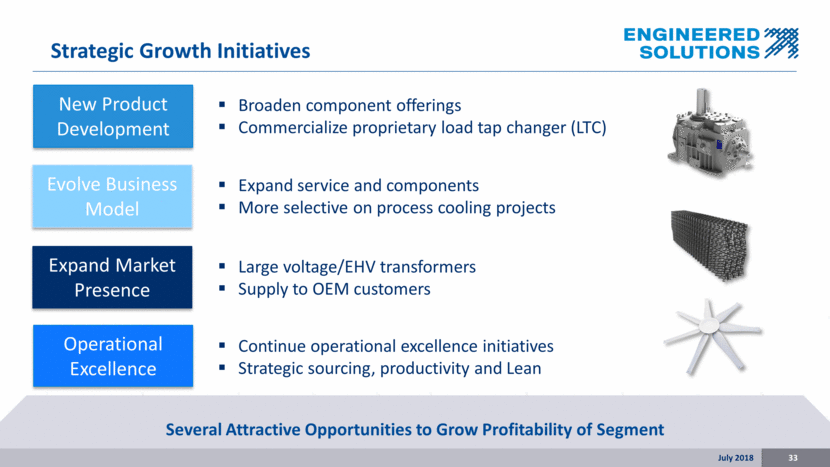
Strategic Growth Initiatives Several Attractive Opportunities to Grow Profitability of Segment Expand Market Presence Operational Excellence Broaden component offerings Commercialize proprietary load tap changer (LTC) Expand service and components More selective on process cooling projects Large voltage/EHV transformers Supply to OEM customers Evolve Business Model New Product Development Continue operational excellence initiatives Strategic sourcing, productivity and Lean July 2018 33
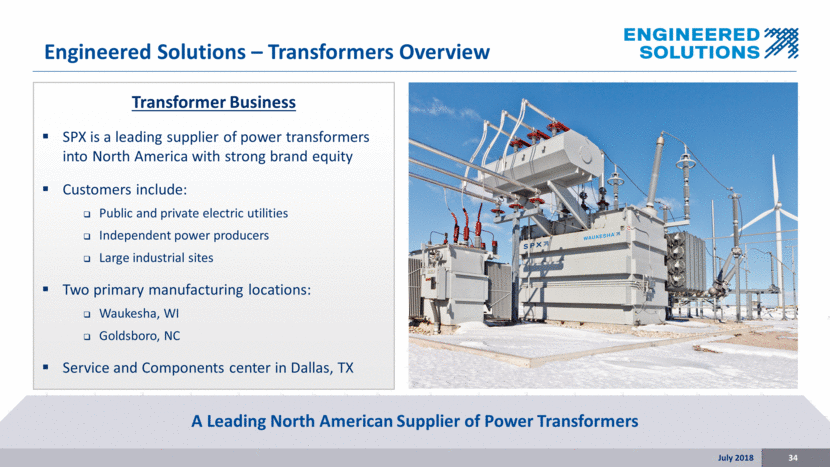
Transformer Business SPX is a leading supplier of power transformers into North America with strong brand equity Customers include: Public and private electric utilities Independent power producers Large industrial sites Two primary manufacturing locations: Waukesha, WI Goldsboro, NC Service and Components center in Dallas, TX Engineered Solutions – Transformers Overview A Leading North American Supplier of Power Transformers July 2018 34
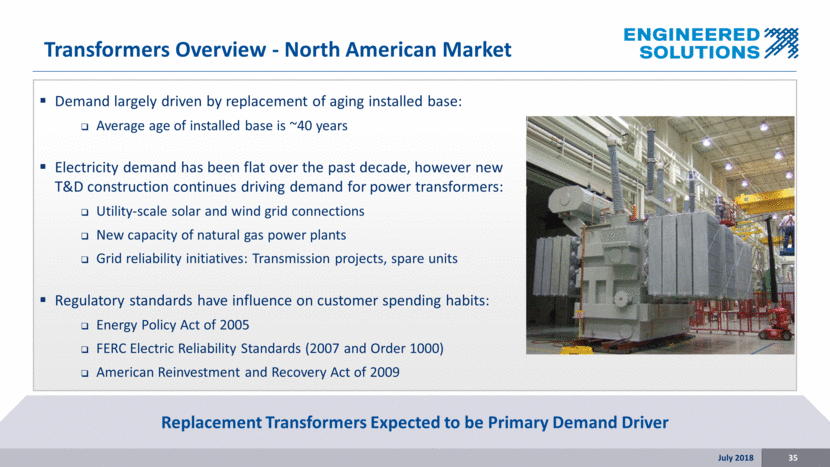
Demand largely driven by replacement of aging installed base: Average age of installed base is ~40 years Electricity demand has been flat over the past decade, however new T&D construction continues driving demand for power transformers: Utility-scale solar and wind grid connections New capacity of natural gas power plants Grid reliability initiatives: Transmission projects, spare units Regulatory standards have influence on customer spending habits: Energy Policy Act of 2005 FERC Electric Reliability Standards (2007 and Order 1000) American Reinvestment and Recovery Act of 2009 Transformers Overview - North American Market Replacement Transformers Expected to be Primary Demand Driver July 2018 35
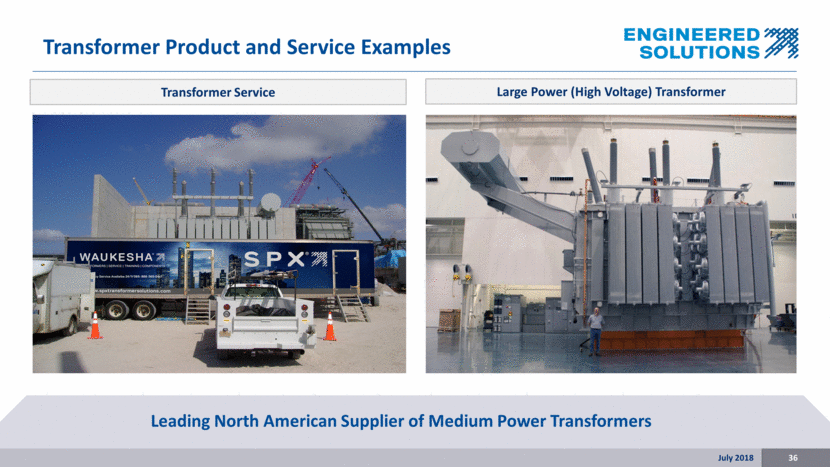
Transformer Product and Service Examples Leading North American Supplier of Medium Power Transformers Transformer Service Large Power (High Voltage) Transformer July 2018 36
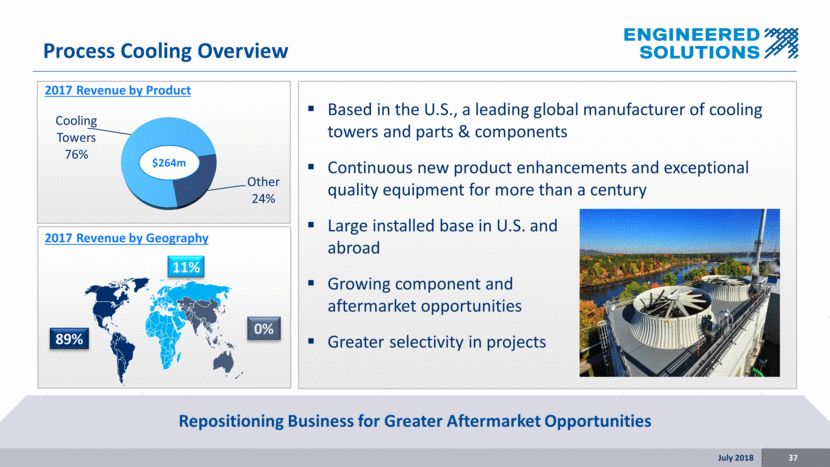
Based in the U.S., a leading global manufacturer of cooling towers and parts & components Continuous new product enhancements and exceptional quality equipment for more than a century Large installed base in U.S. and abroad Growing component and aftermarket opportunities Greater selectivity in projects 2017 Revenue by Product 2017 Revenue by Geography Process Cooling Overview July 2018 37 Repositioning Business for Greater Aftermarket Opportunities $264m 89% 11% 0% Cooling Towers 76% Other 24%
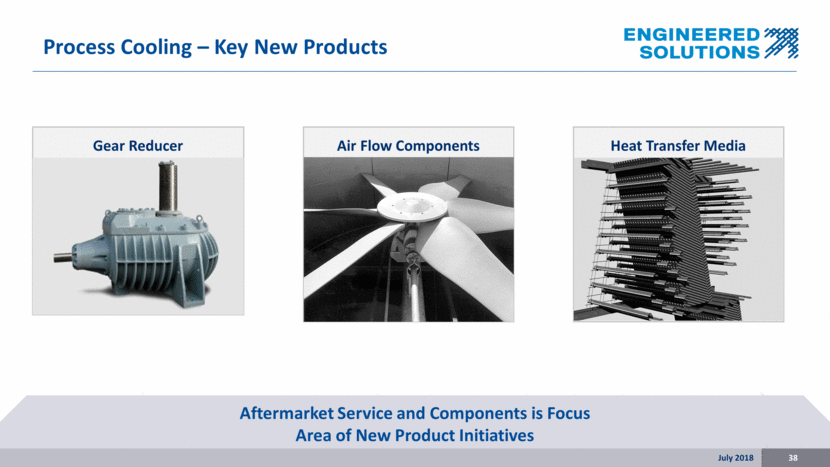
Process Cooling – Key New Products Aftermarket Service and Components is Focus Area of New Product Initiatives Gear Reducer Heat Transfer Media Air Flow Components TBD July 2018 38
Financial Position & Capital Allocation July 2018
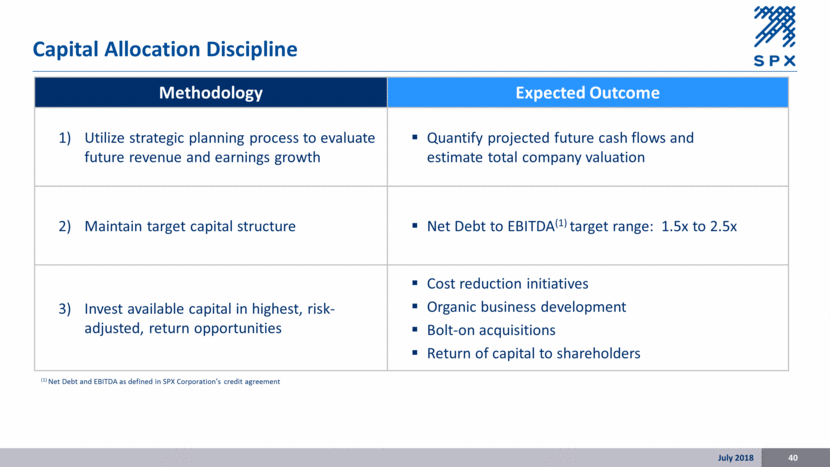
Capital Allocation Discipline July 2018 40 Methodology Expected Outcome Utilize strategic planning process to evaluate future revenue and earnings growth Quantify projected future cash flows and estimate total company valuation Maintain target capital structure Net Debt to EBITDA(1) target range: 1.5x to 2.5x Invest available capital in highest, risk- adjusted, return opportunities Cost reduction initiatives Organic business development Bolt-on acquisitions Return of capital to shareholders (1) Net Debt and EBITDA as defined in SPX Corporation’s credit agreement
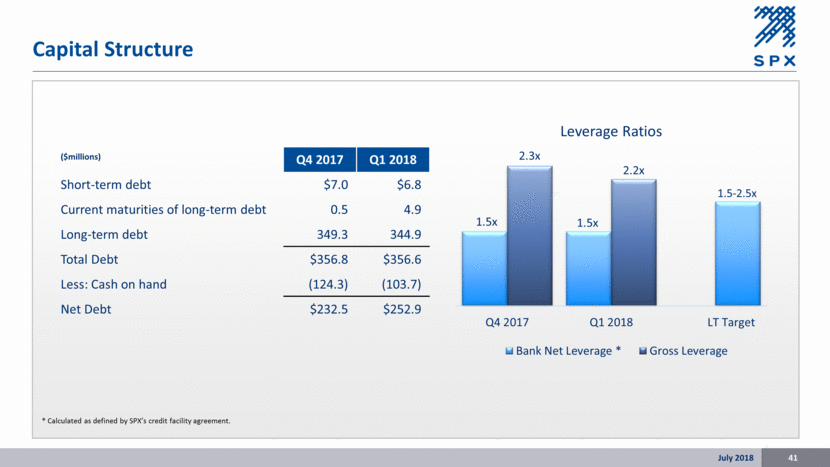
Capital Structure July 2018 41 ($millions) Q4 2017 Q1 2018 Short-term debt $7.0 $6.8 Current maturities of long-term debt 0.5 4.9 Long-term debt 349.3 344.9 Total Debt $356.8 $356.6 Less: Cash on hand (124.3) (103.7) Net Debt $232.5 $252.9 * Calculated as defined by SPX’s credit facility agreement. 1.5x 1.5x 2.3x 2.2x Q4 2017 Q1 2018 LT Target Leverage Ratios Bank Net Leverage * Gross Leverage 1.5 - 2.5x
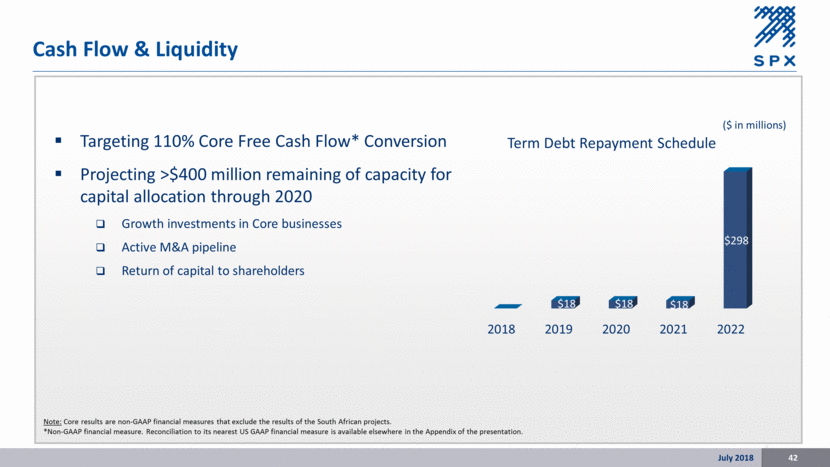
Cash Flow & Liquidity July 2018 42 *Calculated as defined by SPX’s credit facility agreement. Net debt subtracts cash in excess of $50 million. ** Uses gross debt and LTM EBITDA as defined by SPX’s credit facility agreement. ($ in millions) Note: Core results are non-GAAP financial measures that exclude the results of the South African projects. *Non-GAAP financial measure. Reconciliation to its nearest US GAAP financial measure is available elsewhere in the Appendix of the presentation. Targeting 110% Core Free Cash Flow* Conversion Projecting >$400 million remaining of capacity for capital allocation through 2020 Growth investments in Core businesses Active M&A pipeline Return of capital to shareholders 2018 2019 2020 2021 2022 $18 $18 $18 $298 Term Debt Repayment Schedule ($ in millions)
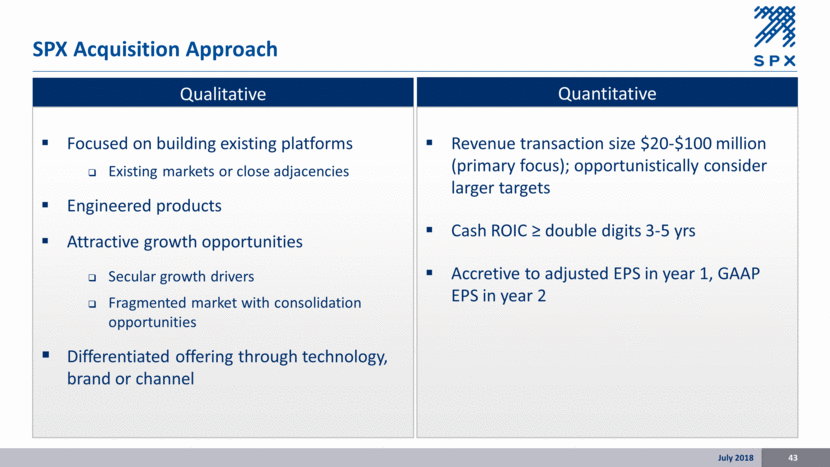
SPX Acquisition Approach July 2018 43 Qualitative Focused on building existing platforms Existing markets or close adjacencies Engineered products Attractive growth opportunities Secular growth drivers Fragmented market with consolidation opportunities Differentiated offering through technology, brand or channel Quantitative Revenue transaction size $20-$100 million (primary focus); opportunistically consider larger targets Cash ROIC > double digits 3-5 yrs Accretive to adjusted EPS in year 1, GAAP EPS in year 2
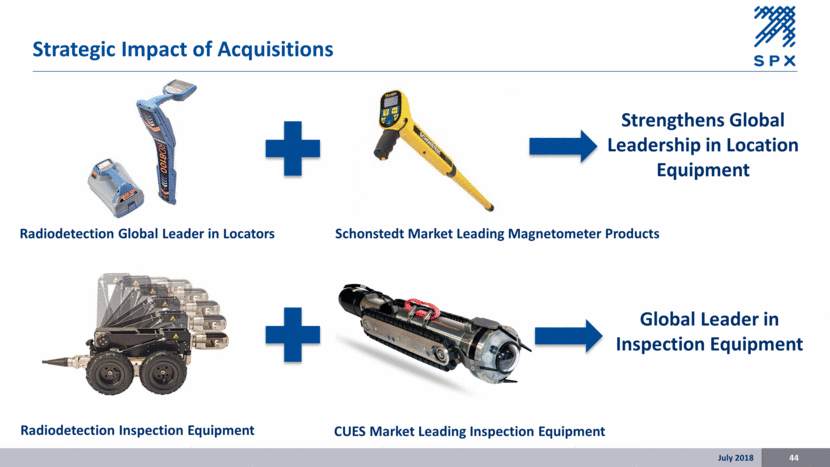
Strategic Impact of Acquisitions July 2018 44 Radiodetection Global Leader in Locators Schonstedt Market Leading Magnetometer Products Strengthens Global Leadership in Location Equipment Radiodetection Inspection Equipment CUES Market Leading Inspection Equipment Global Leader in Inspection Equipment
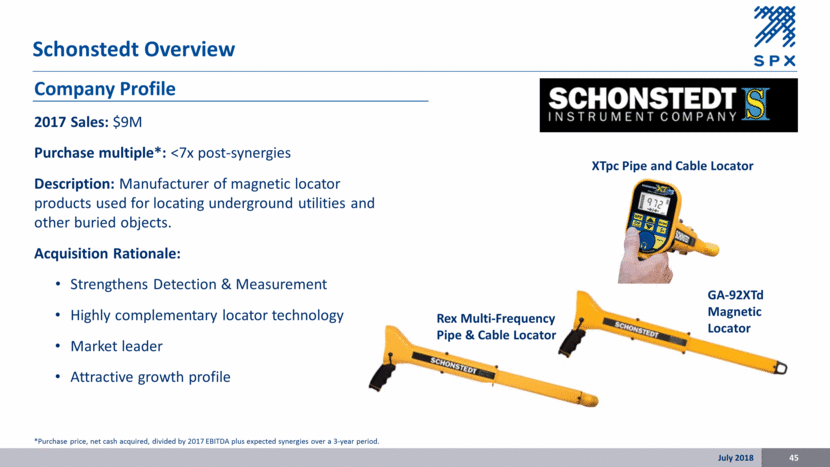
Company Profile 2017 Sales: $9M Purchase multiple*: <7x post-synergies Description: Manufacturer of magnetic locator products used for locating underground utilities and other buried objects. Acquisition Rationale: Strengthens Detection & Measurement Highly complementary locator technology Market leader Attractive growth profile Schonstedt Overview July 2018 45 XTpc Pipe and Cable Locator GA-92XTd Magnetic Locator Rex Multi-Frequency Pipe & Cable Locator *Purchase price, net cash acquired, divided by 2017 EBITDA plus expected synergies over a 3-year period.
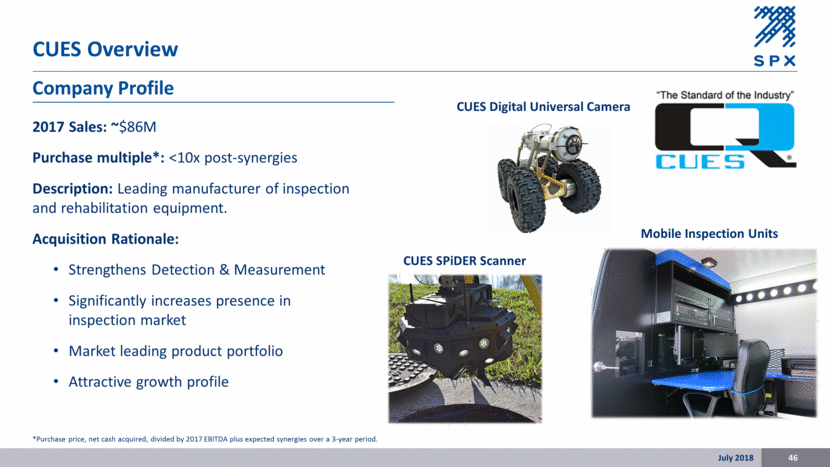
CUES Overview July 2018 46 Company Profile 2017 Sales: ~$86M Purchase multiple*: <10x post-synergies Description: Leading manufacturer of inspection and rehabilitation equipment. Acquisition Rationale: Strengthens Detection & Measurement Significantly increases presence in inspection market Market leading product portfolio Attractive growth profile CUES SPiDER Scanner CUES Digital Universal Camera Mobile Inspection Units *Purchase price, net cash acquired, divided by 2017 EBITDA plus expected synergies over a 3-year period.
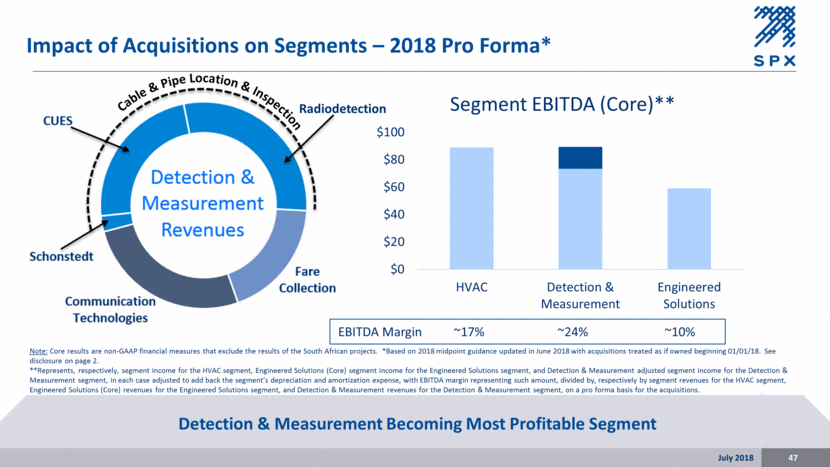
Impact of Acquisitions on Segments – 2018 Pro Forma* July 2018 47 Detection & Measurement Becoming Most Profitable Segment Cable & Pipe Location & Inspection EBITDA Margin ~17% ~24% ~10% Note: Core results are non-GAAP financial measures that exclude the results of the South African projects. *Based on 2018 midpoint guidance updated in June 2018 with acquisitions treated as if owned beginning 01/01/18. See disclosure on page 2. **Represents, respectively, segment income for the HVAC segment, Engineered Solutions (Core) segment income for the Engineered Solutions segment, and Detection & Measurement adjusted segment income for the Detection & Measurement segment, in each case adjusted to add back the segment’s depreciation and amortization expense, with EBITDA margin representing such amount, divided by, respectively by segment revenues for the HVAC segment, Engineered Solutions (Core) revenues for the Engineered Solutions segment, and Detection & Measurement revenues for the Detection & Measurement segment, on a pro forma basis for the acquisitions. Radiodetection $0 $20 $40 $60 $80 $100 HVAC Detection & Measurement Engineered Solutions Segment EBITDA (Core)**
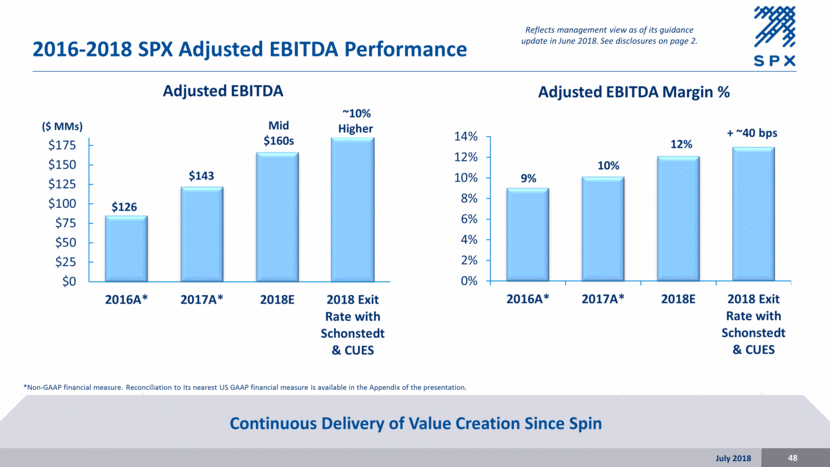
2016-2018 SPX Adjusted EBITDA Performance Continuous Delivery of Value Creation Since Spin July 2018 48 *Non-GAAP financial measure. Reconciliation to its nearest US GAAP financial measure is available in the Appendix of the presentation. ~10% Higher + ~40 bps ($ MMs) Reflects management view as of its guidance update in June 2018. See disclosures on page 2. $0 $25 $50 $75 $100 $125 $150 $175 2016A* 2017A* 2018E 2018 Exit Rate with Schonstedt & CUES Adjusted EBITDA $126 $143 Mid $ 160s 0% 2% 4% 6% 8% 10% 12% 14% 2016A* 2017A* 2018E 2018 Exit Rate with Schonstedt & CUES Adjusted EBITDA Margin % 9% 10% 12%
Financial Targets July 2018

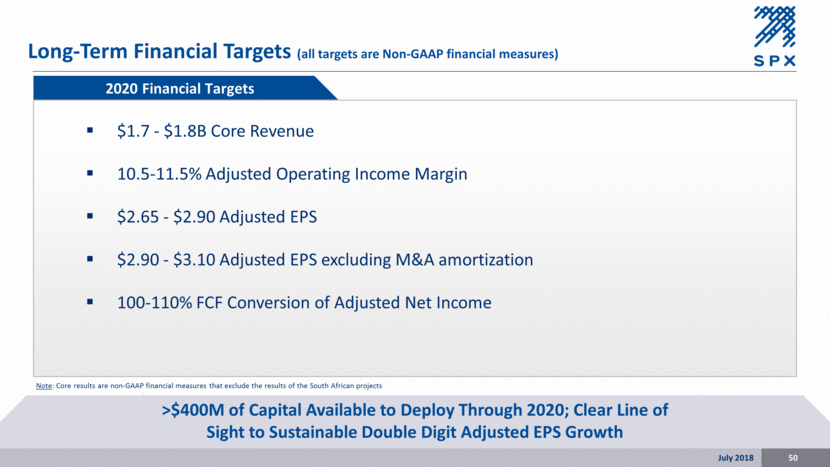
Long-Term Financial Targets (all targets are Non-GAAP financial measures) July 2018 50 >$400M of Capital Available to Deploy Through 2020; Clear Line of Sight to Sustainable Double Digit Adjusted EPS Growth 2020 Financial Targets $1.7 - $1.8B Core Revenue 10.5-11.5% Adjusted Operating Income Margin $2.65 - $2.90 Adjusted EPS $2.90 - $3.10 Adjusted EPS excluding M&A amortization 100-110% FCF Conversion of Adjusted Net Income Note: Core results are non-GAAP financial measures that exclude the results of the South African projects
Appendix July 2018

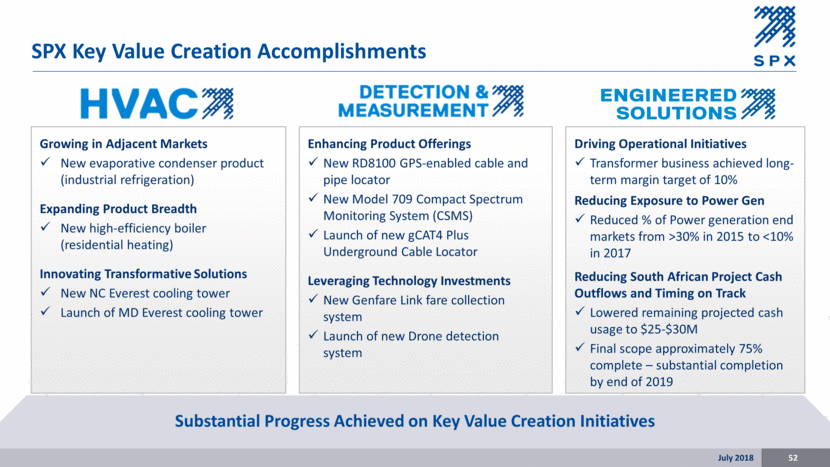
SPX Key Value Creation Accomplishments Substantial Progress Achieved on Key Value Creation Initiatives Growing in Adjacent Markets New evaporative condenser product (industrial refrigeration) Expanding Product Breadth New high-efficiency boiler (residential heating) Innovating Transformative Solutions New NC Everest cooling tower Launch of MD Everest cooling tower Enhancing Product Offerings New RD8100 GPS-enabled cable and pipe locator New Model 709 Compact Spectrum Monitoring System (CSMS) Launch of new gCAT4 Plus Underground Cable Locator Leveraging Technology Investments New Genfare Link fare collection system Launch of new Drone detection system Driving Operational Initiatives Transformer business achieved long-term margin target of 10% Reducing Exposure to Power Gen Reduced % of Power generation end markets from >30% in 2015 to <10% in 2017 Reducing South African Project Cash Outflows and Timing on Track Lowered remaining projected cash usage to $25-$30M Final scope approximately 75% complete – substantial completion by end of 2019 July 2018 52
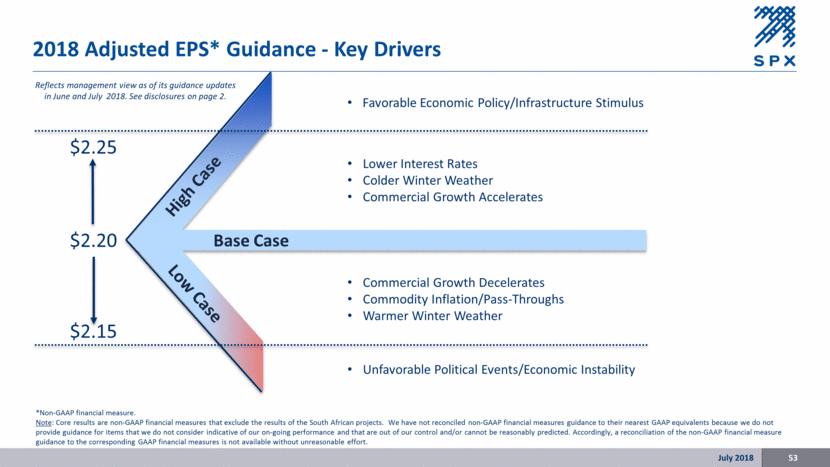
2018 Adjusted EPS* Guidance - Key Drivers 53 Commercial Growth Decelerates Commodity Inflation/Pass-Throughs Warmer Winter Weather Lower Interest Rates Colder Winter Weather Commercial Growth Accelerates $2.25 $2.15 $2.20 High Case Base Case Low Case Favorable Economic Policy/Infrastructure Stimulus Unfavorable Political Events/Economic Instability *Non-GAAP financial measure. Note: Core results are non-GAAP financial measures that exclude the results of the South African projects. We have not reconciled non-GAAP financial measures guidance to their nearest GAAP equivalents because we do not provide guidance for items that we do not consider indicative of our on-going performance and that are out of our control and/or cannot be reasonably predicted. Accordingly, a reconciliation of the non-GAAP financial measure guidance to the corresponding GAAP financial measures is not available without unreasonable effort. July 2018 Reflects management view as of its guidance updates in June and July 2018. See disclosures on page 2.
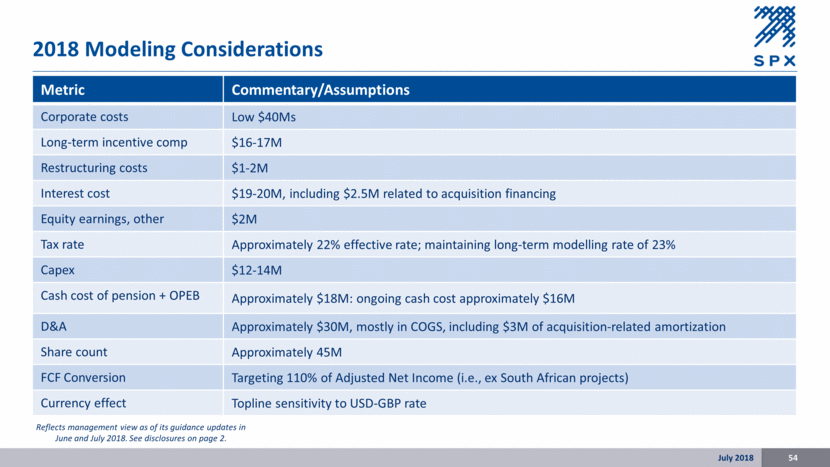
2018 Modeling Considerations Metric Commentary/Assumptions Corporate costs Low $40Ms Long-term incentive comp $16-17M Restructuring costs $1-2M Interest cost $19-20M, including $2.5M related to acquisition financing Equity earnings, other $2M Tax rate Approximately 22% effective rate; maintaining long-term modelling rate of 23% Capex $12-14M Cash cost of pension + OPEB Approximately $18M: ongoing cash cost approximately $16M D&A Approximately $30M, mostly in COGS, including $3M of acquisition-related amortization Share count Approximately 45M FCF Conversion Targeting 110% of Adjusted Net Income (i.e., ex South African projects) Currency effect Topline sensitivity to USD-GBP rate July 2018 54 Reflects management view as of its guidance updates in June and July 2018. See disclosures on page 2.
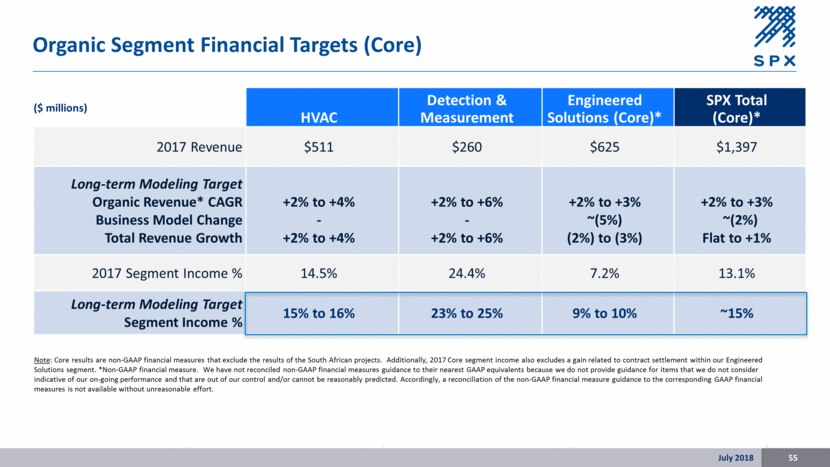
Organic Segment Financial Targets (Core) July 2018 55 HVAC Detection & Measurement Engineered Solutions (Core)* SPX Total (Core)* 2017 Revenue $511 $260 $625 $1,397 Long-term Modeling Target Organic Revenue* CAGR Business Model Change Total Revenue Growth +2% to +4% - +2% to +4% +2% to +6% - +2% to +6% +2% to +3% ~(5%) (2%) to (3%) +2% to +3% ~(2%) Flat to +1% 2017 Segment Income % 14.5% 24.4% 7.2% 13.1% Long-term Modeling Target Segment Income % 15% to 16% 23% to 25% 9% to 10% ~15% ($ millions) Note: Core results are non-GAAP financial measures that exclude the results of the South African projects. Additionally, 2017 Core segment income also excludes a gain related to contract settlement within our Engineered Solutions segment. *Non-GAAP financial measure. We have not reconciled non-GAAP financial measures guidance to their nearest GAAP equivalents because we do not provide guidance for items that we do not consider indicative of our on-going performance and that are out of our control and/or cannot be reasonably predicted. Accordingly, a reconciliation of the non-GAAP financial measure guidance to the corresponding GAAP financial measures is not available without unreasonable effort.
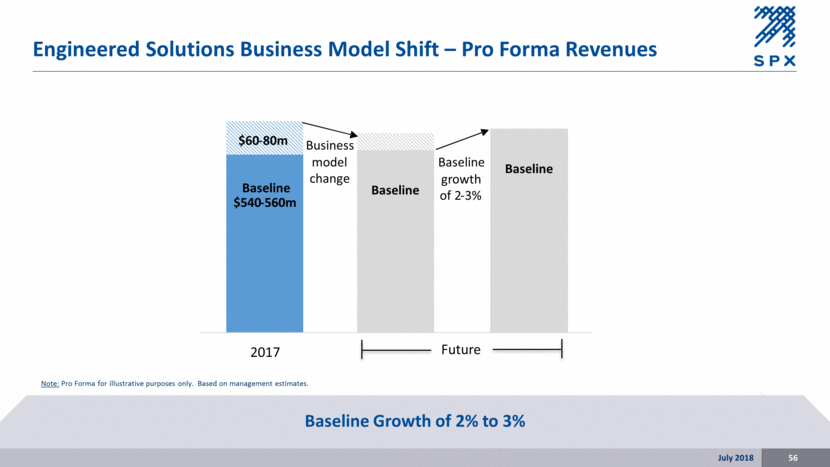
Engineered Solutions Business Model Shift – Pro Forma Revenues Baseline Growth of 2% to 3% 56 July 2018 Note: Pro Forma for illustrative purposes only. Based on management estimates. 2017 Future Baseline Baseline $540 - 560m $60 - 80m Business model change Baseline growth of 2 - 3% Baseline
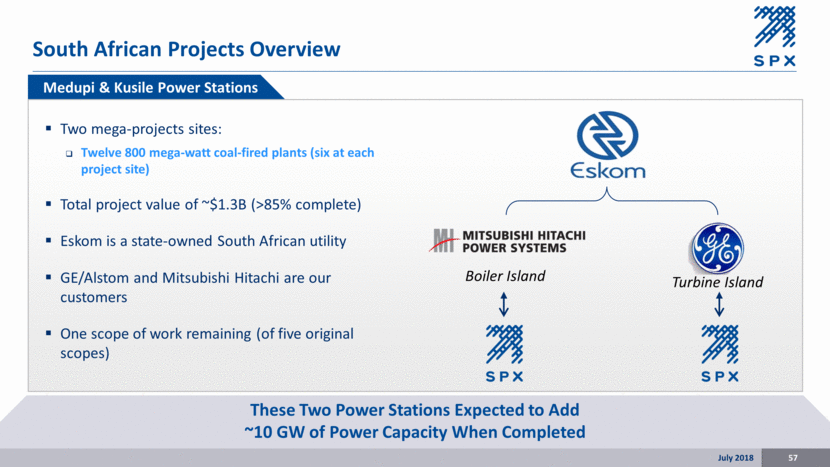
South African Projects Overview July 2018 57 These Two Power Stations Expected to Add ~10 GW of Power Capacity When Completed Medupi & Kusile Power Stations Two mega-projects sites: Twelve 800 mega-watt coal-fired plants (six at each project site) Total project value of ~$1.3B (>85% complete) Eskom is a state-owned South African utility GE/Alstom and Mitsubishi Hitachi are our customers One scope of work remaining (of five original scopes) Boiler Island Turbine Island
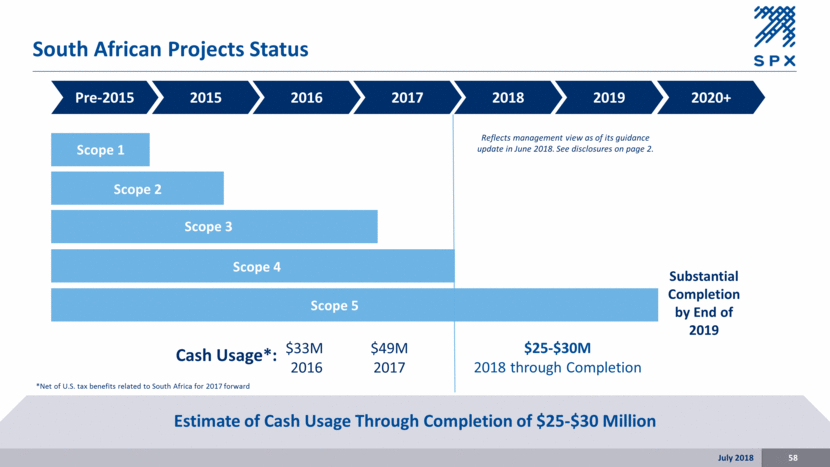
South African Projects Status Estimate of Cash Usage Through Completion of $25-$30 Million 2016 2017 2018 2019 2020 Scope 3 Scope 4 Scope 5 $33M 2016 $49M 2017 $25-$30M 2018 through Completion 2015 Cash Usage*: Scope 1 Scope 2 2015 2016 2017 2018 2019 2020+ Pre-2015 Substantial Completion by End of 2019 *Net of U.S. tax benefits related to South Africa for 2017 forward 58 July 2018 Reflects management view as of its guidance update in June 2018. See disclosures on page 2.
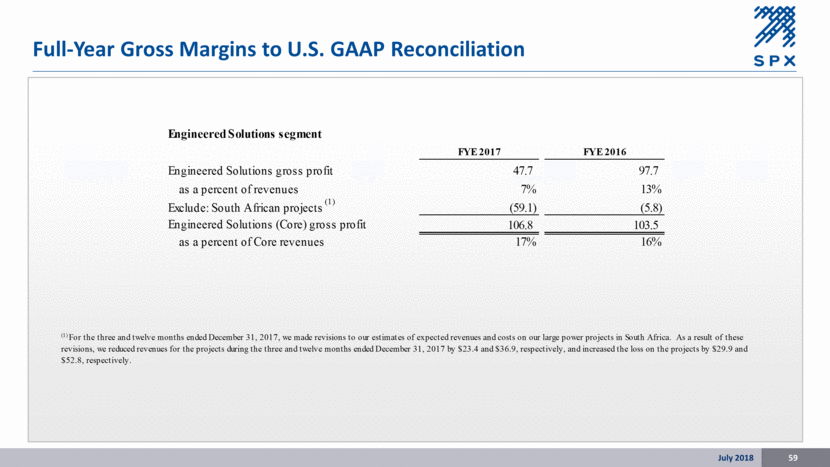
Full-Year Gross Margins to U.S. GAAP Reconciliation July 2018 59 (1) For the three and twelve months ended December 31, 2017, we made revisions to our estimates of expected revenues and costs on our large power projects in South Africa. As a result of these revisions, we reduced revenues for the projects during the three and twelve months ended December 31, 2017 by $23.4 and $36.9, respectively, and increased the loss on the projects by $29.9 and $52.8, respectively. Engineered Solutions segment FYE 2017 FYE 2016 Engineered Solutions gross profit 47.7 97.7 as a percent of revenues 7% 13% Exclude: South African projects (1) (59.1) (5.8) Engineered Solutions (Core) gross profit 106.8 103.5 as a percent of Core revenues 17% 16%
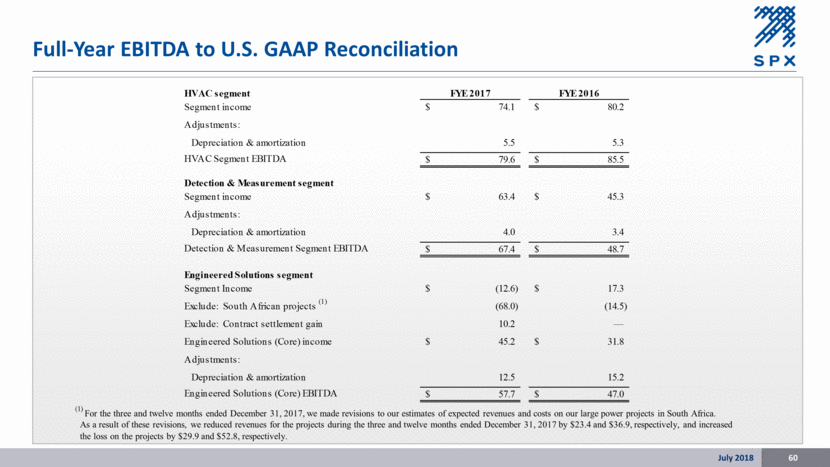
Full-Year EBITDA to U.S. GAAP Reconciliation July 2018 60 (1) For the three and twelve months ended December 31, 2017, we made revisions to our estimates of expected revenues and costs on our large power projects in South Africa. As a result of these revisions, we reduced revenues for the projects during the three and twelve months ended December 31, 2017 by $23.4 and $36.9, respectively, and increased the loss on the projects by $29.9 and $52.8, respectively. HVAC segment FYE 2017 FYE 2016 Segment income 74.1 $ 80.2 $ Adjustments: Depreciation & amortization 5.5 5.3 HVAC Segment EBITDA 79.6 $ 85.5 $ Detection & Measurement segment Segment income 63.4 $ 45.3 $ Adjustments: Depreciation & amortization 4.0 3.4 Detection & Measurement Segment EBITDA 67.4 $ 48.7 $ Engineered Solutions segment Segment Income (12.6) $ 17.3 $ Exclude: South African projects (1) (68.0) (14.5) Exclude: Contract settlement gain 10.2 — Engineered Solutions (Core) income 45.2 $ 31.8 $ Adjustments: Depreciation & amortization 12.5 15.2 Engineered Solutions (Core) EBITDA 57.7 $ 47.0 $
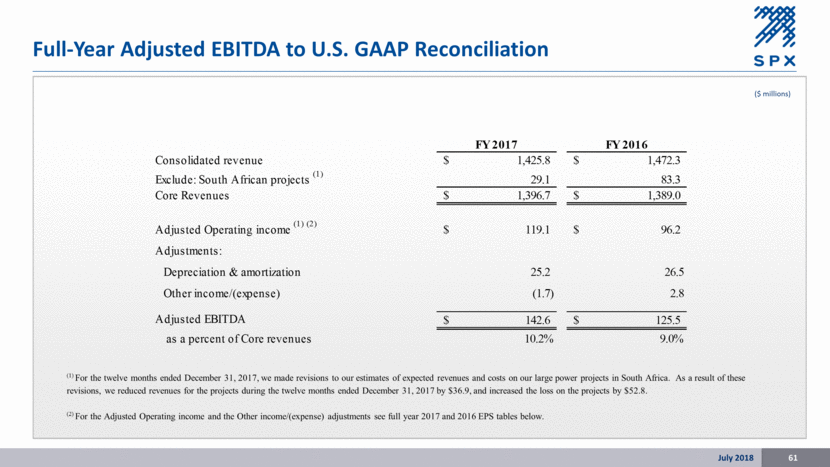
Full-Year Adjusted EBITDA to U.S. GAAP Reconciliation July 2018 61 ($ millions) (1) For the twelve months ended December 31, 2017, we made revisions to our estimates of expected revenues and costs on our large power projects in South Africa. As a result of these revisions, we reduced revenues for the projects during the twelve months ended December 31, 2017 by $36.9, and increased the loss on the projects by $52.8. (2) For the Adjusted Operating income and the Other income/(expense) adjustments see full year 2017 and 2016 EPS tables below. FY 2017 FY 2016 Consolidated revenue 1,425.8 $ 1,472.3 $ Exclude: South African projects (1) 29.1 83.3 Core Revenues 1,396.7 $ 1,389.0 $ Adjusted Operating income (1) (2) 119.1 $ 96.2 $ Adjustments: Depreciation & amortization 25.2 26.5 Other income/(expense) (1.7) 2.8 Adjusted EBITDA 142.6 $ 125.5 $ as a percent of Core revenues 10.2% 9.0%
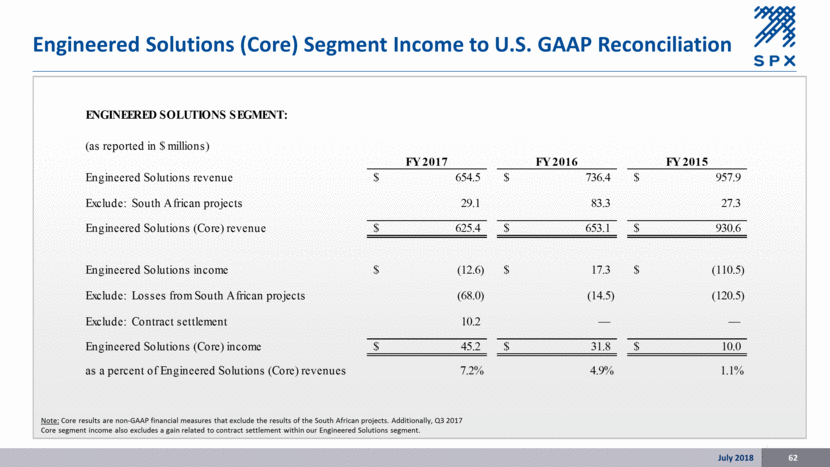
Engineered Solutions (Core) Segment Income to U.S. GAAP Reconciliation July 2018 62 Note: Core results are non-GAAP financial measures that exclude the results of the South African projects. Additionally, Q3 2017 Core segment income also excludes a gain related to contract settlement within our Engineered Solutions segment. ENGINEERED SOLUTIONS SEGMENT: (as reported in $ millions) FY 2017 FY 2016 FY 2015 Engineered Solutions revenue 654.5 $ 736.4 $ 957.9 $ Exclude: South African projects 29.1 83.3 27.3 Engineered Solutions (Core) revenue 625.4 $ 653.1 $ 930.6 $ Engineered Solutions income (12.6) $ 17.3 $ (110.5) $ Exclude: Losses from South African projects (68.0) (14.5) (120.5) Exclude: Contract settlement 10.2 — — Engineered Solutions (Core) income 45.2 $ 31.8 $ 10.0 $ as a percent of Engineered Solutions (Core) revenues 7.2% 4.9% 1.1%
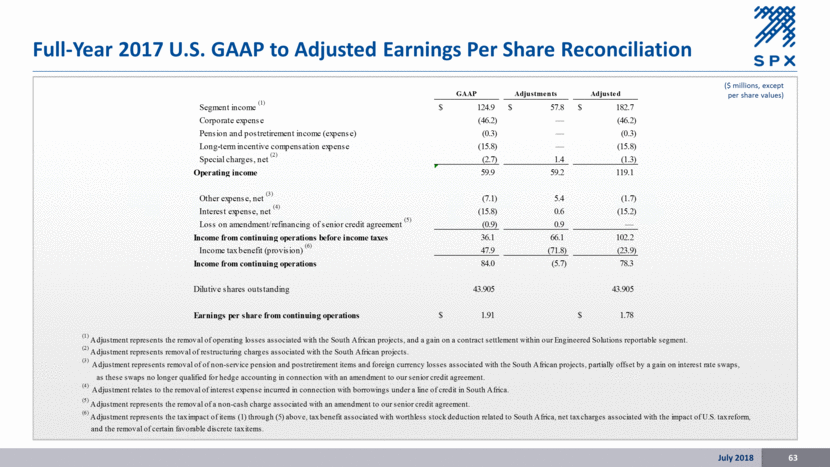
Full-Year 2017 U.S. GAAP to Adjusted Earnings Per Share Reconciliation July 2018 63 ($ millions, except per share values) GAAP Adjustments Adjusted Segment income (1) 124.9 $ 57.8 $ 182.7 $ Corporate expense (46.2) — (46.2) Pension and postretirement income (expense) (0.3) — (0.3) Long-term incentive compensation expense (15.8) — (15.8) Special charges, net (2) (2.7) 1.4 (1.3) Operating income 59.9 59.2 119.1 Other expense, net (3) (7.1) 5.4 (1.7) Interest expense, net (4) (15.8) 0.6 (15.2) Loss on amendment/refinancing of senior credit agreement (5) (0.9) 0.9 — Income from continuing operations before income taxes 36.1 66.1 102.2 Income tax benefit (provision) (6) 47.9 (71.8) (23.9) Income from continuing operations 84.0 (5.7) 78.3 Dilutive shares outstanding 43.905 43.905 Earnings per share from continuing operations 1.91 $ 1.78 $ (1) Adjustment represents the removal of operating losses associated with the South African projects, and a gain on a contract settlement within our Engineered Solutions reportable segment. (2) Adjustment represents removal of restructuring charges associated with the South African projects. (3) Adjustment represents removal of of non-service pension and postretirement items and foreign currency losses associated with the South African projects, partially offset by a gain on interest rate swaps, as these swaps no longer qualified for hedge accounting in connection with an amendment to our senior credit agreement. (4) Adjustment relates to the removal of interest expense incurred in connection with borrowings under a line of credit in South Africa. (5) Adjustment represents the removal of a non-cash charge associated with an amendment to our senior credit agreement. (6) Adjustment represents the tax impact of items (1) through (5) above, tax benefit associated with worthless stock deduction related to South Africa, net tax charges associated with the impact of U.S. tax reform, and the removal of certain favorable discrete tax items.
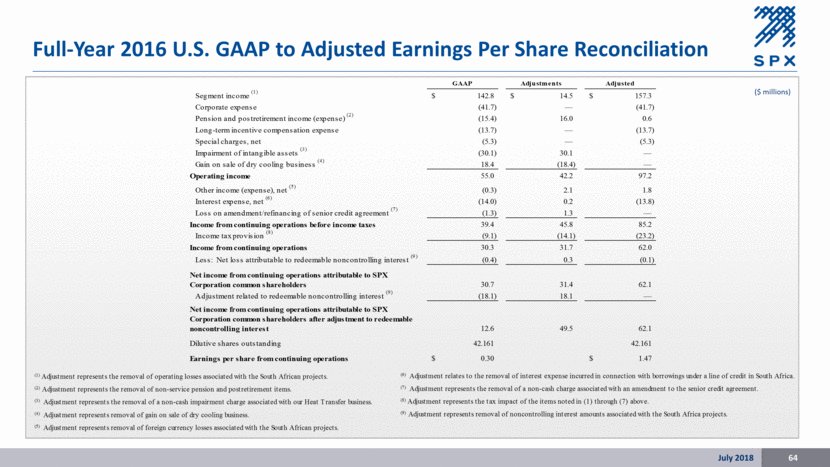
July 2018 64 ($ millions) Full-Year 2016 U.S. GAAP to Adjusted Earnings Per Share Reconciliation GAAP Adjustments Adjusted Segment income (1) 142.8 $ 14.5 $ 157.3 $ Corporate expense (41.7) — (41.7) Pension and postretirement income (expense) (2) (15.4) 16.0 0.6 Long-term incentive compensation expense (13.7) — (13.7) Special charges, net (5.3) — (5.3) Impairment of intangible assets (3) (30.1) 30.1 — Gain on sale of dry cooling business (4) 18.4 (18.4) — Operating income 55.0 42.2 97.2 Other income (expense), net (5) (0.3) 2.1 1.8 Interest expense, net (6) (14.0) 0.2 (13.8) Loss on amendment/refinancing of senior credit agreement (7) (1.3) 1.3 — Income from continuing operations before income taxes 39.4 45.8 85.2 Income tax provision (8) (9.1) (14.1) (23.2) Income from continuing operations 30.3 31.7 62.0 Less: Net loss attributable to redeemable noncontrolling interest (9) (0.4) 0.3 (0.1) Net income from continuing operations attributable to SPX Corporation common shareholders 30.7 31.4 62.1 Adjustment related to redeemable noncontrolling interest (9) (18.1) 18.1 — Net income from continuing operations attributable to SPX Corporation common shareholders after adjustment to redeemable noncontrolling interest 12.6 49.5 62.1 Dilutive shares outstanding 42.161 42.161 Earnings per share from continuing operations 0.30 $ 1.47 $ (6) Adjustment relates to the removal of interest expense incurred in connection with borrowings under a line of credit in South Africa. (7) Adjustment represents the removal of a non-cash charge associated with an amendment to the senior credit agreement. (8) Adjustment represents the tax impact of the items noted in (1) through (7) above. (9) Adjustment represents removal of noncontrolling interest amounts associated with the South Africa projects. (1) Adjustment represents the removal of operating losses associated with the South African projects. (2) Adjustment represents the removal of non-service pension and postretirement items. (3) Adjustment represents the removal of a non-cash impairment charge associated with our Heat Transfer business. (4) Adjustment represents removal of gain on sale of dry cooling business. (5) Adjustment represents removal of foreign currency losses associated with the South African projects.
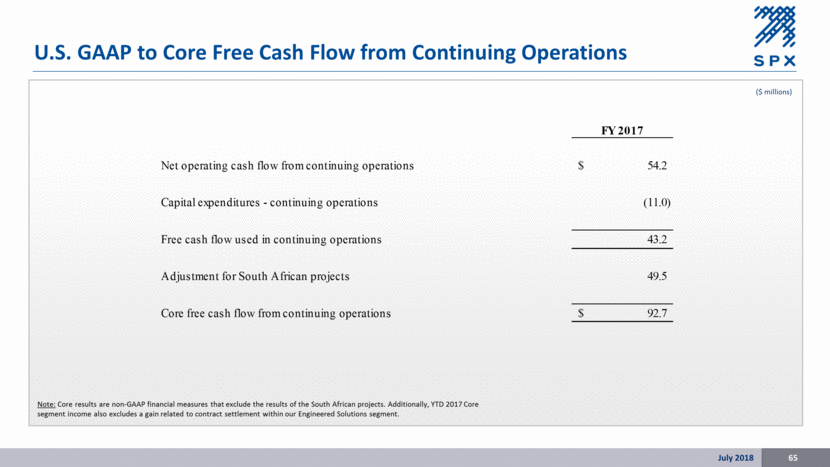
U.S. GAAP to Core Free Cash Flow from Continuing Operations July 2018 65 ($ millions) Note: Core results are non-GAAP financial measures that exclude the results of the South African projects. Additionally, YTD 2017 Core segment income also excludes a gain related to contract settlement within our Engineered Solutions segment. FY 2017 Net operating cash flow from continuing operations 54.2 $ Capital expenditures - continuing operations (11.0) Free cash flow used in continuing operations 43.2 Adjustment for South African projects 49.5 Core free cash flow from continuing operations 92.7 $