Attached files
| file | filename |
|---|---|
| EX-3.1 - EXHIBIT 3.1 RESTATED CERTIFICATE OF INCORPORATION - JOHN WILEY & SONS, INC. | exhibit3_1.htm |
| EX-32.2 - CERTIFICATION - JOHN WILEY & SONS, INC. | exhibit32_2.htm |
| EX-32.1 - CERTIFICATION - JOHN WILEY & SONS, INC. | exhibit32_1.htm |
| EX-31.2 - CERTIFICATION - JOHN WILEY & SONS, INC. | exhibit31_2.htm |
| EX-31.1 - CERTIFICATION - JOHN WILEY & SONS, INC. | exhibit31_1.htm |
| EX-23.1 - EXHIBIT 23.1 - JOHN WILEY & SONS, INC. | exhibit23_1.htm |
| EX-21.1 - EXHIBIT 21.1 - JOHN WILEY & SONS, INC. | exhibit21_1.htm |
| EX-12.1 - EXHIBIT 12.1 - JOHN WILEY & SONS, INC. | exhibit12_1.htm |
| EX-10.16 - EXHIBIT 10.16 EASMIP - JOHN WILEY & SONS, INC. | exhibit10_16.htm |
| EX-10.15 - EXHIBIT 10.15 EAIP - JOHN WILEY & SONS, INC. | exhibit10_15.htm |
| EX-10.14 - EXHIBIT 10.14 ELTIP - JOHN WILEY & SONS, INC. | exhibit10_14.htm |
| EX-3.5 - EXHIBIT 3.5 BY LAWS - JOHN WILEY & SONS, INC. | exhibit3_5.htm |
UNITED STATES
SECURITIES AND EXCHANGE COMMISSION
Washington, DC 20549
FORM 10-K
☒ ANNUAL REPORT PURSUANT TO SECTION 13 OR 15(d) OF
THE SECURITIES EXCHANGE ACT OF 1934
For the fiscal year ended: April 30, 2018
OR
☐ TRANSITION REPORT PURSUANT TO SECTION 13 OR 15(d) OF
THE SECURITIES EXCHANGE ACT OF 1934 (FEE REQUIRED)
For the transition period from to
Commission file number 001-11507
JOHN WILEY & SONS, INC.
(Exact name of Registrant as specified in its charter)
|
NEW YORK
|
13-5593032
|
|
|
State or other jurisdiction of incorporation or organization
|
I.R.S. Employer Identification No.
|
|
|
111 River Street, Hoboken, NJ
|
07030
|
|
|
Address of principal executive offices
|
Zip Code
|
|
(201) 748-6000
|
||
|
Registrant's telephone number including area code
|
|
Securities registered pursuant to Section 12(b) of the Act: Title of each class
|
Name of each exchange on which registered
|
|
|
Class A Common Stock, par value $1.00 per share
|
New York Stock Exchange
|
|
|
Class B Common Stock, par value $1.00 per share
|
New York Stock Exchange
|
|
Securities registered pursuant to Section 12(g) of the Act:
|
||
|
None
|
Indicate by check mark if the registrant is a well-known seasoned issuer, as defined in Rule 405 of the Securities Act. Yes ☒ No ☐
Indicate by check mark if the registrant is not required to file reports pursuant to Section 13 or Section 15(d) of the Exchange Act. Yes ☐ No ☒
Indicate by check mark whether the registrant (1) has filed all reports required to be filed by Section 13 or 15(d) of the Securities Exchange Act of 1934 during the preceding 12 months (or for such shorter period that the registrant was required to file such reports), and (2) has been subject to such filing requirements for the past 90 days. Yes ☒ No ☐
Indicate by check mark whether the registrant has submitted electronically and posted on its corporate Web site, if any, every Interactive Data File required to be submitted and posted pursuant to Rule 405 of Regulation S-T (§232.405 of this chapter) during the preceding 12 months (or for such shorter period that the registrant was required to submit and post such files). Yes ☒ No ☐
Indicate by check mark if disclosure of delinquent filers pursuant to Item 405 of Regulation S-K (§229.405 of this chapter) is not contained herein, and will not be contained, to the best of registrant's knowledge, in definitive proxy or information statements incorporated by reference in Part III of this Form 10-K or any amendment to this Form 10-K. ☐
Indicate by check mark whether the registrant is a large accelerated filer, an accelerated filer, a non-accelerated filer, a smaller reporting company, or an emerging growth company. See definitions of "large accelerated filer," "accelerated filer," "smaller reporting company," and "emerging growth company" in Rule 12b-2 of the Exchange Act. (Check one):
|
Large accelerated filer ☒
|
Accelerated filer ☐
|
|
Non-accelerated filer ☐
|
Smaller reporting company ☐
|
|
(Do not check if a smaller reporting company)
|
Emerging growth company ☐
|
Indicate by check mark whether the registrant is a shell company (as defined in Rule 12b-2 of the Exchange Act). Yes ☐ No☒
The aggregate market value of the voting stock held by non-affiliates of the registrant, computed by reference to the closing price as of the last business day of the registrant's most recently completed second fiscal quarter, October 31, 2017, was approximately $2,453 million. The registrant has no non-voting common stock.
The number of shares outstanding of the registrant's Class A and Class B Common Stock as of May 31, 2018 was 48,346,657 and 9,153,493 respectively.
DOCUMENTS INCORPORATED BY REFERENCE
Portions of the registrant's definitive proxy statement for use in connection with its annual meeting of stockholders scheduled to be held on September 27, 2018, are incorporated by reference into Part III of this Form 10-K.
JOHN WILEY & SONS, INC. AND SUBSIDIARIES
FORM 10-K
FOR THE FISCAL YEAR ENDED APRIL 30, 2018
INDEX
|
PART I
|
PAGE
|
|
|
Business
|
3
|
|
|
Risk Factors
|
9
|
|
|
Unresolved Staff Comments
|
14
|
|
|
Properties
|
15
|
|
|
Legal Proceedings
|
15
|
|
|
Mine Safety Disclosures
|
15
|
|
|
16
|
||
|
PART II
|
||
|
Market for Registrant's Common Equity, Related Stockholder Matters and Issuer Purchases of Equity Securities
|
17
|
|
|
Selected Financial Data
|
18
|
|
|
Management's Discussion and Analysis of Financial Condition and Results of Operations
|
19
|
|
|
Quantitative and Qualitative Disclosures About Market Risk
|
40
|
|
|
Financial Statements and Supplementary Data
|
42
|
|
|
Changes in and Disagreements with Accountants on Accounting and Financial Disclosure
|
76
|
|
|
Controls and Procedures
|
76
|
|
|
Other Information
|
76
|
|
|
PART III
|
||
|
Directors, Executive Officers and Corporate Governance
|
76
|
|
|
Executive Compensation
|
77
|
|
|
Security Ownership of Certain Beneficial Owners and Management and Related Stockholder Matters
|
77
|
|
|
Certain Relationships and Related Transactions, and Director Independence
|
77
|
|
|
Principal Accounting Fees and Services
|
77
|
|
|
PART IV
|
||
|
Exhibits and Financial Statement Schedules
|
78
|
|
|
Form 10-K Summary
|
79
|
|
1
Cautionary Notice Regarding Forward-Looking Statements "Safe Harbor" Statement under the Private Securities Litigation Reform Act of 1995:
This report contains "forward-looking statements" within the meaning of the safe harbor provisions of the Private Securities Litigation Reform Act of 1995 concerning our business, consolidated financial condition and results of operations. The Securities and Exchange Commission ("SEC") encourages companies to disclose forward-looking information so that investors can better understand a company's future prospects and make informed investment decisions. Forward-looking statements are subject to risks and uncertainties, many of which are outside our control, which could cause actual results to differ materially from these statements. Therefore, you should not rely on any of these forward-looking statements. Forward-looking statements can be identified by such words as "anticipates," "believes," "plan," "assumes," "could," "should," "estimates," "expects," "intends," "potential," "seek," "predict," "may," "will" and similar references to future periods. All statements other than statements of historical facts included in this report regarding our strategies, prospects, financial condition, operations, costs, plans and objectives are forward-looking statements. Examples of forward-looking statements include, among others, statements we make regarding our fiscal year 2019 outlook, operations, performance, and financial condition. Reliance should not be placed on forward-looking statements, as actual results may differ materially from those in any forward-looking statements. Any such forward-looking statements are based upon a number of assumptions and estimates that are inherently subject to uncertainties and contingencies, many of which are beyond our control, and are subject to change based on many important factors. Such factors include, but are not limited to (i) the level of investment in new technologies and products; (ii) subscriber renewal rates for our journals; (iii) the financial stability and liquidity of journal subscription agents; (iv) the consolidation of book wholesalers and retail accounts; (v) the market position and financial stability of key retailers; (vi) the seasonal nature of our educational business and the impact of the used-book market; (vii) worldwide economic and political conditions; (viii) our ability to protect our copyrights and other intellectual property worldwide; (ix) our ability to successfully integrate acquired operations and realize expected opportunities and (x) other factors detailed from time to time in our filings with the SEC. We undertake no obligation to update or revise any such forward-looking statements to reflect subsequent events or circumstances.
Please refer to Part I, Item 1A, "Risk Factors," of our Annual Report on Form 10-K for important factors that we believe could cause actual results to differ materially from those in our forward-looking statements. Any forward-looking statement made by us in this report is based only on information currently available to us and speaks only as of the date on which it is made. We undertake no obligation to publicly update any forward-looking statement, whether written or oral, that may be made from time to time, whether as a result of new information, future developments or otherwise.
Non-GAAP Financial Measures:
We present financial information that conforms to Generally Accepted Accounting Principles in the United States of America ("U.S. GAAP"). We also present financial information that does not conform to U.S. GAAP, which we refer to as non-GAAP.
In this report, we may present the following non-GAAP performance measures:
| |
Adjusted Earnings Per Share "(Adjusted EPS)";
|
| |
Free Cash Flow less product development spending;
|
| |
Adjusted Operating Income and margin;
|
| |
Adjusted Contribution to Profit and margin; and
|
| |
Results on a constant currency basis.
|
Management uses these non-GAAP performance measures as supplemental indicators of our operating performance and financial position as well for internal reporting and forecasting purposes, when publicly providing its outlook, to evaluate our performance and calculate incentive compensation. We present these non-GAAP performance measures in addition to U.S. GAAP financial results because we believe that these non-GAAP performance measures provide useful information to certain investors and financial analysts for operational trends and comparisons across accounting periods. The use of these non-GAAP performance measures provides a consistent basis to evaluate operating profitability and performance trends by excluding items that we do not consider to be controllable activities for this purpose.
For example:
| |
Adjusted EPS, Adjusted Operating Profit, and Adjusted Contribution to Profit provide a more comparable basis to analyze operating results and earnings and are measures commonly used by shareholders to measure our performance.
|
| |
Free Cash Flow less Product Development Spending helps assess our ability, over the long term, to create value for our shareholders as it represents cash available to repay debt, pay common dividends and fund share repurchases and new acquisitions.
|
| |
Results on a constant currency basis removes distortion from the effects of foreign currency movements to provide better comparability of our business trends from period to period. We measure our performance before the impact of foreign currency (or at "constant currency"), which means that we apply the same foreign currency exchange rates for the current and equivalent prior period.
|
2
In addition, we have historically provided these or similar non-GAAP performance measures and understand that some investors and financial analysts find this information helpful in analyzing our operating margins, and net income and comparing our financial performance to that of our peer companies and competitors. Based on interactions with investors, we also believe that our non-GAAP performance measures are regarded as useful to our investors as supplemental to our U.S. GAAP financial results, and that there is no confusion regarding the adjustments or our operating performance to our investors due to the comprehensive nature of our disclosures. We have not provided our 2019 outlook for the most directly comparable U.S. GAAP financial measures, as they are not available without unreasonable effort due to the high variability, complexity, and low visibility with respect to certain items, including restructuring charges and credits, gains and losses on foreign currency, and other gains and losses. These items are uncertain, depend on various factors, and could be material to our consolidated results computed in accordance with U.S. GAAP.
Non-GAAP performance measures do not have standardized meanings prescribed by U.S. GAAP and therefore may not be comparable to the calculation of similar measures used by other companies, and should not be viewed as alternatives to measures of financial results under U.S. GAAP. The adjusted metrics have limitations as analytical tools and should not be considered in isolation from or as a substitute for U.S. GAAP information. It does not purport to represent any similarly titled U.S. GAAP information and is not an indicator of our performance under U.S. GAAP. Non-U.S. GAAP financial metrics that we present may not be comparable with similarly titled measures used by others. Investors are cautioned against placing undue reliance on these non-U.S. GAAP measures.
PART I
The Company, founded in 1807, was incorporated in the state of New York on January 15, 1904. Throughout this report, when we refer to "Wiley," the "Company," "we," "our," or "us," we are referring to John Wiley & Sons, Inc. and all of our subsidiaries, except where the context indicates otherwise.
Please refer to Part II, Item 8, "Financial Statements and Supplementary Data," for financial information about the Company and its subsidiaries, which is incorporated herein by reference. Also, when we cross reference to a "Note," we are referring to our "Notes to Consolidated Financial Statements," unless the context indicates otherwise.
We are a global research and learning company. Through the Research segment, we provide scientific, technical, medical, and scholarly journals, as well as related content and services, to academic, corporate, and government libraries, learned societies, and individual researchers and other professionals. The Publishing segment provides scientific, professional, and education books and related content in print and digital formats, as well as test preparation services and course workflow tools, to libraries, corporations, students, professionals, and researchers. The Solutions segment provides online program management services for higher education institutions and learning, development, and assessment services for businesses and professionals. Our operations are primarily located in the United States ("U.S."), Canada, United Kingdom ("U.K."), Germany, Singapore, and Australia.
Business growth strategies include driving pricing and volume growth from existing journal and book brands and titles, as well as learning services related to education and professional development, the development of new journal titles or through publishing partnerships, technology and content acquisitions which complement our existing businesses, designing and implementing new methods of delivering products to our customers, and the development of new products and services.
Business Segments
We report our segment information in accordance with the provisions of Financial Accounting Standards Board Accounting Standards Codification Topic 280, "Segment Reporting" ("FASB ASC Topic 280"). Our segment reporting structure consists of three reportable segments, which are listed below, and a Corporate category:
| |
Research;
|
| |
Publishing; and
|
| |
Solutions
|
Research:
Research's mission is to support researchers, professionals and learners in the discovery and use of research knowledge to help them achieve their goals in research, learning and practice. Research provides scientific, technical, medical, and scholarly journals, as well as related content and services, to academic, corporate, and government libraries, learned societies, and individual researchers and other professionals. Journal publishing areas include the physical sciences and engineering, health sciences, social sciences and humanities and life sciences. Research also includes our acquisition of Atypon Systems, Inc. ("Atypon"), a publishing software and service provider that enables scholarly and professional societies and publishers to deliver, host, enhance, market, and manage their content on the web through the Literatum platform.
3
Research's customers include academic, corporate, government, and public libraries, funders of research, researchers, scientists, clinicians, engineers and technologists, scholarly and professional societies, and students and professors. Research's products are sold and distributed globally in digital and print formats through multiple channels, including research libraries and library consortia, independent subscription agents, direct sales to professional society members, and other customers. Publishing centers include Australia, China, Germany, India, the United Kingdom, and the United States. Research's revenue accounted for approximately 52% of our consolidated revenue in fiscal year 2018.
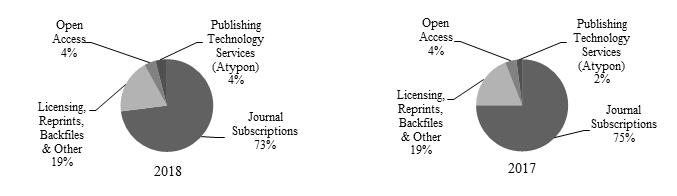
Research's major products are: Journal Subscriptions, Licensing, Reprints, Backfiles, and Other, Open Access and Publishing Technology Services (Atypon). The graphs below present Research revenue by product type for fiscal years 2018 and 2017:
Key growth strategies for the Research business include evolving and developing new licensing models for our institutional customers, developing new open access products and revenue streams, focusing resources on high-growth and emerging markets, and developing new digital products, services, and workflow solutions to meet the needs of researchers, authors, societies, and corporate customers.
Journal Subscriptions
We publish approximately 1,700 academic research journals. We sell journal subscriptions directly through our sales representatives, indirectly through independent subscription agents, through promotional campaigns, and through memberships in professional societies for those journals that are sponsored by societies. Journal subscriptions, making up approximately 38% of our consolidated fiscal year 2018 total company revenue, are primarily licensed through contracts for digital content available online through Wiley Online Library. In March 2018, we migrated our Wiley Online Library platform to our Literatum platform, which we acquired as part of our purchase of Atypon in fiscal year 2017. Contracts are negotiated by us directly with customers or their subscription agents. Licenses range from one to three years in duration and typically cover calendar years. Print journals are generally mailed to subscribers directly from independent printers. We do not own or manage printing facilities. Subscription revenue is generally collected in advance and deferred until we have fulfilled our obligation to the customer, at which time the revenue is earned.
Approximately 50% of Journal Subscription revenue is derived from publishing rights owned by us. Publishing alliances also play a major role in Research's success. Approximately 50% of Journal Subscription revenue is derived from publication rights that are owned by professional societies and published by us pursuant to a long-term contract (generally 5–10 years) or owned jointly with a professional society. These society alliances bring mutual benefit, with the societies gaining Wiley's publishing, marketing, sales, and distribution expertise, while Wiley benefits from being affiliated with prestigious societies and their members. Societies that sponsor or own such journals generally receive a royalty and/or other financial consideration. We may procure editorial services from such societies on a pre-negotiated fee basis. We also enter into agreements with outside independent editors of journals that define the duties of the editors and the fees and expenses for their services. Contributors of articles to our journal portfolio transfer publication rights to us or a professional society, as applicable. We publish the journals of many prestigious societies, including the American Cancer Society, the American Heart Association, the British Journal of Surgery Society, the European Molecular Biology Organization, the American Anthropological Association, the American Geophysical Union, and the German Chemical Society.
4
Literatum, our online publishing platform for our Research segment, delivers integrated access to over 7 million articles from 1,700 journals, as well as 19,000 online books and hundreds of multi-volume reference works, laboratory protocols and databases. Wiley Online Library, which is delivered through our Literatum platform, provides the user with intuitive navigation, enhanced discoverability, expanded functionality, and a range of personalization options. Access to abstracts is free and full content is accessible through licensing agreements or as individual article purchases. Large portions of the content are provided free or at nominal cost to nations in the developing world through partnerships with certain non-profit organizations. Our online publishing platforms provide revenue growth opportunities through new applications and business models, online advertising, deeper market penetration, and individual sales and pay-per-view options. The Literatum platform hosts over 40% of the world's English language journals.
In 2017, Wiley saw an increase in impact factors across more than half of its indexed titles. An impact factor is an industry measure of the importance of a journal within its field and is determined based on the number of citations received by the journal, from other journals. According to the 2016 Journal Citation Reports ("JCR"), re-released in September 2017 by Clarivate Analytics, 66% of Wiley journals increased their impact factor between 2015 and 2016. Wiley had 1,205 journals indexed (73% of the Wiley portfolio), with 11 Wiley titles receiving their first impact factor in this year's JCR release. In addition, 20 Wiley journals achieved a top-category rank, including CA:A Cancer Journal for Clinicians (Impact Factor of 187.040, ranked #1 in Oncology), World Psychiatry (Impact Factor of 26.561, ranked #1 in Psychiatry – an increase of 31% on last year) and WIREs Computational Molecular Science (Impact Factor of 14.016, ranked #1 in Mathematical & Computational Biology). The Clarivate Analytics index is a barometer of journal influence across the research community.
Licensing, Reprints, Backfiles, and Other
Licensing, Reprints, Backfiles, and Other includes advertising, backfile sales, the licensing of publishing rights, journal and article reprints, and individual article sales. We generate advertising revenue from print and online journal subscription products, our online publishing platform, Literatum, online events such as webinars and virtual conferences, community interest Web sites such as spectroscopyNOW.com, and other Web sites. A backfile license provides access to a historical collection of Wiley journals, generally for a one-time fee. We also engage with international publishers and receive licensing revenue from photocopies, reproductions, translations, and other digital uses of our content. Journal and article reprints are primarily used by pharmaceutical companies and other industries for marketing and promotional purposes. Through the Article Select and PayPerView programs, we provide fee-based access to non-subscribed journal articles, content, book chapters, and major reference work articles. The Research business is also a provider of content and services in evidence-based medicine ("EBM"). Through our alliance with The Cochrane Collaboration, we publish The Cochrane Library, a premier source of high-quality independent evidence to inform healthcare decision-making. EBM facilitates the effective management of patients through clinical expertise informed by best practice evidence that is derived from medical literature.
Open Access
Under the Open Access business model, accepted research articles are published subject to payment of Author Publication Charges ("APCs"). All Open Access articles are immediately free to access online. Contributors of Open Access articles retain many rights and typically license their work under terms that permit re-use.
Open Access offers authors choices in how to share and disseminate their work, and it serves the needs of researchers who may be required by their research funder to make articles freely accessible without embargo. APCs are typically paid by the individual author or by the author's funder, and payments are often mediated by the author's institution. We provide specific workflows and infrastructure to authors, funders, and institutions to support the requirements of the Open Access model.
We offer two Open Access publishing models. The first of these is Hybrid Open Access where, upon payment of an APC, authors publishing in the majority of our paid subscription journals are offered, after article acceptance, the opportunity to make their individual research article openly available through the OnlineOpen service.
The second offering of the Open Access model is a growing portfolio of fully open access journals, also known as Gold Open Access Journals, in which all accepted articles are published subject to receipt of an APC. All Open Access articles are subject to the same rigorous peer-review process applied to our subscription-based journals. As with our subscription portfolio, a number of the Gold Open Access Journals are published under contract for, or in partnership with, prestigious societies, including the American Geophysical Union, the American Heart Association, the European Molecular Biology Organization and the British Ecological Society. The Open Access portfolio spans life, physical, medical and social sciences and includes a choice of high impact journals and broad-scope titles that offer a responsive, author-centered service.
5
Publishing:
Our Publishing segment acquires, develops, and publishes scientific, professional and education books and related content, as well as test preparation services and course workflow tools, to libraries, corporations, students, professionals, and researchers. Communities served include business, finance, accounting, workplace learning, management, leadership, technology, behavioral health, engineering/ architecture, science and medicine, and education. Products are developed in print and digitally for worldwide distribution through multiple channels, including chain and online booksellers, libraries, colleges and universities, corporations, direct to consumer, Web sites, distributor networks and other online applications. Publishing centers include Australia, Germany, India, the United Kingdom, and the United States. Publishing accounted for approximately 34% of our consolidated revenue in fiscal year 2018.
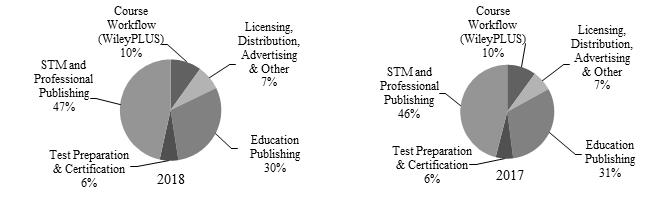
Publishing revenue by product type are: STM (Scientific, Technical and Medical) and Professional Publishing, Education Publishing, Test Preparation and Certification, Course Workflow (WileyPLUS), and Licensing, Distribution, Advertising and Other. The graphs below present Publishing revenue by product type for fiscal years 2018 and 2017:
Key growth strategies for the Publishing business include developing and acquiring products and services to drive corporate development and professional career development, developing leading brands and franchises, executing strategic acquisitions and partnerships, and innovating digital book formats while expanding their global discoverability and distribution. We continue to implement strategies to manage declines in print revenue through cost improvement initiatives and focusing our efforts on growing its digital lines of business. We are continuing to perform portfolio reviews and workforce realignment, restructuring, and operational excellence initiatives. In certain areas, we will explore new formats or promote digital-only, and in other areas, we may rationalize our portfolio. Our approach is to continue to realign our cost structure to help mitigate the market changes that are contributing to revenue decline, and to sharpen our focus on high performing areas and digital opportunities, while improving operating efficiency.
Publishing
Book products accounted for approximately 26% of our consolidated fiscal year 2018 revenue. Categories include STM, Professional, and Education Publishing.
STM books are sold and distributed globally in digital and print formats through multiple channels, including research libraries and library consortia, independent subscription agents, direct sales to professional society members, bookstores, online booksellers, and other customers.
Professional books, which include business and finance, technology, and other professional categories, as well as the For Dummies brand, are sold to bookstores and online booksellers serving the general public, wholesalers who supply such bookstores, warehouse clubs, college bookstores, individual practitioners, industrial organizations and government agencies. We employ sales representatives who call upon independent bookstores, national and regional chain bookstores, and wholesalers. Sales of professional books also result from direct mail campaigns, telemarketing, online access, advertising, and reviews in periodicals.
Education textbooks and related supplementary material and digital products are sold primarily to bookstores and online booksellers serving both for-profit and nonprofit educational institutions (primarily colleges and universities), and direct-to-students. We employ sales representatives who call on faculty responsible for selecting books to be used in courses, and on the bookstores that serve such institutions and their students. The textbook business is seasonal, with the majority of textbook sales occurring during the July-through- October and December-through-January periods. There are active used and rental print textbook markets, which adversely affect the sale of new textbooks. We are exploring opportunities to expand into the print rental market through partnerships.
Book sales are generally made on a returnable basis with certain restrictions. We provide for estimated future returns on sales made during the year based on historical return experience and current market trends.
6
Materials for book publications are obtained from authors throughout most of the world, utilizing the efforts of an editorial staff, outside editorial advisors, and advisory boards. Most materials are originated by the authors themselves or as a result of suggestion or solicitations by editors and advisors. We enter into agreements with authors that state the terms and conditions under which the materials will be published, the name in which the copyright will be registered, the basis for any royalties, and other matters. Most of the authors are compensated with royalties, which vary depending on the nature of the product. We may make advance royalty payments against future royalties to authors of certain publications. Royalty advances are reviewed for recoverability and a reserve for loss is maintained, if appropriate.
We continue to add new titles, revise existing titles, and discontinue the sale of others in the normal course of our business, and we also create adaptations of original content for specific markets based on customer demand. Our general practice is to revise our textbooks approximately every three years, if warranted, and to revise other titles as appropriate. Subscription-based products are updated on a more frequent basis.
We generally contract with independent printers and binderies globally for their services. Management believes that adequate printing and binding facilities and sources of paper and other required materials are available to it, and that it is not dependent upon any single supplier.
In fiscal year 2016, we entered into an agreement to outsource our US-based book distribution operations to Cengage Learning, with the continued aim of improving efficiency in our distribution activities and moving to a more variable cost model. As of April 30, 2018, we had only one global warehousing and distribution facility remaining, which is in the United Kingdom.
We develop content in a digital format that can be used for both digital and print products, resulting in productivity and efficiency savings, and enabling print-on-demand delivery. Book content is available online through Wiley Online Library (delivered through our Literatum platform), WileyPLUS, Wiley Custom Select, and other proprietary platforms. Digital books are delivered to intermediaries, including Amazon, Apple, Google and Ingram/Vital-Source, for re-sale to individuals in various industry-standard formats, which are now the preferred deliverable for licensees of all types, including foreign language publishers. Digital books are also licensed to libraries through aggregators. Specialized formats for digital textbooks go to distributors servicing the academic market, and digital book collections are sold by subscription through independent third-party aggregators servicing distinct communities. Custom deliverables are provided to corporations, institutions, and associations to educate their employees, generate leads for their products, and extend their brands. Content from digital books is also used to create online articles, mobile apps, newsletters, and promotional collateral. This continual re-use of content improves margins, speeds delivery, and helps satisfy a wide range of customer needs. Our online presence not only enables us to deliver content online, but also to sell more books. The growth of online booksellers benefits us because they provide unlimited virtual "shelf space" for our entire backlist.
Publishing alliances and franchise products are important to our strategy. Professional publishing alliance partners include the AICPA, the CFA Institute, ACT (American College Test), IEEE, American Institute of Chemical Engineers, and many others. Education publishing alliance partners include Microsoft®, Blackboard, Instructure, and the Culinary Institute of America. The ability to join Wiley's product development, sales, marketing, distribution, and technology with a partner's content, technology, and/or brand name has contributed to our success.
We also promote active and growing custom professional and education publishing programs. Our custom professional publications are used by professional organizations for internal promotional or incentive programs and include digital and print books written specifically for a customer and customizations of existing publications to include custom cover art, such as imprints, messages, and slogans. More specific are customized For Dummies publications, which leverage the power of this well-known brand to meet the specific information needs of a wide range of organizations around the world. Our custom education publishing program offers an array of tools and services designed to put the creation of customized content in instructors' hands to create high-quality, affordable education solutions tailored to meet individual classroom needs. Through Wiley Custom Select, an online custom textbook system, instructors can build print and digital materials tailored to their specific course needs and add their own content to create a customized solution.
Course Workflow (WileyPLUS)
We offer high-quality online learning solutions, including WileyPLUS, a research-based, online environment for effective teaching and learning that is integrated with a complete digital textbook. WileyPLUS improves student learning through instant feedback, personalized learning plans, and self-evaluation tools, as well as a full range of course-oriented activities, including online planning, presentations, study, homework, and testing. In selected courses, WileyPLUS includes a personalized adaptive learning component, Orion, which is based on cognitive science. Orion helps to build student proficiency on topics while improving the effectiveness of their study time. It assists educators in identifying areas that need reinforcement and measures student engagement and proficiency throughout the course. WileyPLUS revenue is deferred and recognized over the timeframe that each student is enrolled in the course.
7
Test Preparation and Certification
The Test Preparation and Certification business represents learning solutions and training activities that are delivered to customers directly through online digital delivery platforms. Products include CPAExcel, a modular, digital platform comprised of online self-study, videos, mobile apps, and sophisticated planning tools to help professionals prepare for the CPA exam, and test preparation products for the CFA®, CMA, CIA®, CMT®, FRN®, FINRA, Banking, and PMP® exams. Revenue for these products and services is deferred until our obligation has been performed, typically when an online training program has been completed or over the timeframe covered by a license to use the online training and study materials.
Licensing, Distribution, Advertising, and Other
Marketing and distribution services are made available to other publishers under agency arrangements. We also engage in co-publishing titles with international publishers and receive licensing revenue from photocopies, reproductions, translations, and digital uses of our content. Wiley also realizes advertising revenue from branded Web sites (e.g., Dummies.com, etc.) and online applications.
8
Solutions:
Our Solutions segment provides online program management services for higher education institutions and learning, development, and assessment services for businesses and professionals. Key growth strategies include developing new products and services for existing university partners, increasing enrollments for online program management programs, signing new and prestigious university partners, and developing new digital learning solutions by integrating our professional assessment products and services with our Corporate Learning content and technology.
Solutions revenue by product type are Education Services Online Program Management ("OPM"), Professional Assessment, and Corporate Learning. The graphs below present Solutions revenue by product type for fiscal years 2018 and 2017:

Education Services (OPM)
As student demand for online degree and certificate programs continues to increase, traditional institutions are partnering with OPM providers to develop and support these programs. Education Services (OPM) include market research, marketing, student recruitment, enrollment support, proactive retention support, academic services to design courses, faculty support, and access to the Engage Learning Management System, which facilitates the online education experience. Graduate degree programs include Business Administration, Finance, Accounting, Healthcare, Engineering, Communications, and others. Revenue is derived from pre-negotiated contracts with institutions that provide for a share of tuition generated from students who enroll in a program. Education Services (OPM) revenue is deferred and recognized over the timeframe that each student is enrolled in the online degree program. As of April 30, 2018, the Education Services (OPM) business had 34 university partners and 239 degree programs under contract.
Corporate Learning
The Corporate Learning business offers online learning and training solutions for global corporations, universities, and small and medium-sized enterprises, which are sold on a subscription or fee basis. Learning formats and modules on topics such as leadership, diversity, value creation, client orientation, change and corporate strategy are delivered on a cloud-based Learning Management System ("LMS") platform that hosts over 20,000 content assets (videos, digital learning modules, written files, etc.) in 17 languages. Its Mohive offering also provides a collaborative e-learning publishing and program creation system. Revenue growth is derived from legacy markets, such as France, England, and other European markets, and newer markets, such as the U.S. and Brazil. In addition, content and LMS offerings are continuously refreshed and expanded to serve a wider variety of customer needs.
Professional Assessment
Our professional assessment services include pre-hire screening and post-hire personality assessments, which are delivered to business customers through online digital delivery platforms, either directly or through an authorized distributor network of independent consultants, trainers, and coaches. Wiley's leadership assessment offerings also include Kouzes and Posner's Leadership Practices Inventory® and The Five Behaviors of a Cohesive TeamTM.
9
Our assessment tools enable employers to optimize candidate selections and develop the full potential of their employees. These solutions include pre-hire assessments, including those designed to measure and match personality, knowledge, skills, managerial fit, loyalty, and values, and post-hire assessments, focused on measuring sales and managerial effectiveness, employee performance, and career potential. Professional Assessment revenue is deferred until the obligation has been performed, typically when an online assessment has been completed.
Employees
As of April 30, 2018, we employed approximately 5,000 persons on a full-time equivalent basis worldwide.
Financial Information About Business Segments and Foreign and Domestic Operations and Export Sales
The information set forth in Note 18, "Segment Information," of the Notes to Consolidated Financial Statements and Item 7, "Management's Discussion and Analysis of Financial Condition and Results of Operations," of this Form 10-K are incorporated herein by reference.
You should carefully consider all of the information set forth in this Form 10-K, including the following risk factors, before deciding to invest in any of our securities. The risks below are the most significant risks we face, but are not the only risk factors we face. Additional risks not currently known to us or that we presently deem insignificant could impact our consolidated financial position and results of operations. Our business, consolidated financial position, and results of operations could be materially adversely affected by any of these risks. The trading price of our securities could decline due to any of these risks, and investors in our securities may lose all or part of their investment.
If we are unable to introduce new technologies, products, and services, our ability to be profitable may be adversely affected.
We must continue to invest in technology and other innovations to adapt and add value to our products and services to remain competitive. This is particularly true in the current environment, where investment in new technology is ongoing and there are rapid changes in the products competitors are offering, the products our customers are seeking, and our sales and distribution channels. In some cases, investments will take the form of internal development; in others, they may take the form of an acquisition. There are uncertainties whenever developing or acquiring new products and services, and it is often possible that such new products and services may not be launched, or, if launched, may not be profitable or as profitable as existing products and services.
The demand for digital and lower cost books could impact our sales volumes and pricing in an adverse way.
A common trend facing each of our businesses is the digitization of content and proliferation of distribution channels through the internet and other electronic means, which are replacing traditional print formats. The trend to digital content has also created contraction in the print book retail market which increases the risk of bankruptcy for certain retail customers, potentially leading to the disruption of short-term product supply to consumers, as well as potential bad debt write-offs. New distribution channels, such as digital formats, the internet, online retailers, and growing delivery platforms (e.g. tablets and e-readers), combined with the concentration of retailer power, present both risks and opportunities to our traditional publishing models, potentially impacting both sales volumes and pricing.
As the market has shifted to digital products, customer expectations for lower-priced products have increased due to customer awareness of reductions in production costs and the availability of free or low-cost digital content and products. As a result, there has been pressure to sell digital versions of products at prices below their print versions. Increased customer demand for lower prices could reduce our revenue.
We publish educational content for undergraduate, graduate, and advanced placement students, lifelong learners, and in Australia, for secondary school students. Due to growing student demand for less expensive textbooks, many college bookstores, online retailers and other entities offer used or rental textbooks to students at lower prices than new textbooks. The internet has made the used and rental textbook markets more efficient and has significantly increased student access to used and rental books. Further expansion of the used and rental book markets could further adversely affect our sales of print textbooks, subsequently affecting our consolidated financial position and results of operations.
10
A reduction in enrollment at colleges and universities could adversely affect the demand for our higher education products.
Enrollment in U.S. colleges and universities can be adversely affected by many factors, including changes in government and private student loan and grant programs, uncertainty about current and future economic conditions, increases in tuition, general decreases in family income and net worth, and a perception of uncertain job prospects for recent graduates. In addition, enrollment levels at colleges and universities outside the United States are influenced by global and local economic factors, local political conditions, and other factors that make predicting foreign enrollment levels difficult. Reductions in expected levels of enrollment at colleges and universities both within and outside the United States could adversely affect demand for our higher education products, which could adversely impact our consolidated financial position and results of operations.
The competitive pressures we face in our business, as well as our ability to retain our business relationships with our authors and professional societies, could adversely affect our consolidated financial position and results of operations.
We operate in highly competitive markets. Success and continued growth depend greatly on developing new products and the means to deliver them in an environment of rapid technological change. Attracting new authors and professional societies while retaining our existing business relationships is critical to our success. If we are unable to retain our existing business relationships with authors and professional societies, this could have an adverse impact on our consolidated financial position and results of operations.
Our intellectual property rights may not be protected, which could adversely affect our consolidated financial position and results of operations.
A substantial portion of our publications are protected by copyright, held either in our name, in the name of the author of the work, or in the name of a sponsoring professional society. Such copyrights protect our exclusive right to publish the work in many countries abroad for specified periods, in most cases, the author's life plus 70 years, but in any event, a minimum of 50 years for works published after 1978. Our ability to continue to achieve our expected results depends, in part, upon our ability to protect our intellectual property rights. Our consolidated financial position and results of operations may be adversely affected by lack of legal and/or technological protections for its intellectual property in some jurisdictions and markets.
Adverse publicity could negatively impact our reputation, which could adversely affect our consolidated financial position and results of operations.
Our professional customers worldwide rely upon many of our publications to perform their jobs. It is imperative that we consistently demonstrate our ability to maintain the integrity of the information included in our publications. Adverse publicity, whether valid or not, may reduce demand for our publications and adversely affect our consolidated financial position and results of operations.
In our journal publishing business we have a trade concentration and credit risk related to subscription agents, and in our book business the industry has a concentration of customers in national, regional, and online bookstore chains. Changes in the financial position and liquidity of our subscription agents and customers, could adversely impact our consolidated financial position and results of operations.
In the journal publishing business, subscriptions are primarily sourced through journal subscription agents who, acting as agents for library customers, facilitate ordering by consolidating the subscription orders/billings of each subscriber with various publishers. Cash is generally collected in advance from subscribers by the subscription agents and is principally remitted to us between the months of December and April. Although at fiscal year-end we had minimal credit risk exposure to these agents, future calendar-year subscription receipts from these agents are highly dependent on their financial position and liquidity. Subscription agents account for approximately 20% of total annual consolidated revenue and no one agent accounts for more than 10% of total annual consolidated revenue.
Our book business is not dependent upon a single customer; however, the industry is concentrated in national, regional, and online bookstore chains. Although no one book customer accounts for more than 8% of total consolidated revenue and 8% of accounts receivable at April 30, 2018, the top 10 book customers account for approximately 13% of total consolidated revenue and approximately 15% of accounts receivable at April 30, 2018. We maintain approximately $25 million of trade credit insurance, subject to certain limitations, covering balances due from certain named customers, which expires in June 2019.
Changes in laws and regulations, including regulations related to open access, could adversely impact our consolidated financial position and results of operations.
We maintain operations in Asia, Australia, Canada, Europe, and the United States. The conduct of our business, including the sourcing of content, distribution, sales, marketing, and advertising, is subject to various laws and regulations administered by governments around the world. Changes in laws, regulations, or government policies, including tax regulations and accounting standards, may adversely affect our future consolidated financial position and results of operations.
11
The scientific research publishing industry generates much of its revenue from paid customer subscriptions to online and print journal content. There is debate within government, academic, and library communities whether such journal content should be made available for free, immediately or following a period of embargo after publication, referred to as "open access," For instance, certain governments and privately held funding bodies have implemented mandates that require journal articles derived from government-funded research to be made available to the public at no cost after an embargo period. Open access can be achieved in two ways: Green, which enables authors to publish articles in subscription based journals and self–archive the author accepted version of the article for free public use after an embargo period, and Gold, which enables authors to publish their articles in journals that provide immediate free access to the final version of the article on the publisher's Web site, and elsewhere under permissive licensing terms, following payment of an Article Publication Charge ("APC"). These mandates have the potential to put pressure on subscription-based publications. If such regulations are widely implemented, our consolidated financial position and results of operations could be adversely affected.
To date, the majority of governments that have taken a position on open access have favored the green model and have generally specified embargo periods of twelve months. The publishing community generally takes the view that this period should be sufficient to protect subscription revenues, provided that publishers' platforms offer sufficient added value to the article. Governments in Europe have been more supportive of the gold model, which thus far is generating incremental revenue for publishers with active open access programs. A number of European administrations are showing interest in a business model which combines the purchasing of subscription content with the purchase of open access publishing for authors in their country. This development removes an element of risk by fixing revenues from that market, provided that the terms, price, and rate of transition negotiated are acceptable.
A disruption or loss of data sources could limit our collection and use of certain kinds of information, which could adversely impact our communication with our customers.
A number of our businesses rely extensively upon content and data from external sources. Data is obtained from public records, governmental authorities, customers and other information companies, including competitors. Legal regulations, such as the European Union's General Data Protection Regulation ("GDPR"), relating to internet communications, privacy and data protection, e-commerce, information governance, and use of public records, are becoming more prevalent worldwide. The disruption or loss of data sources, either because of changes in the law or because data suppliers decide not to supply them, may impose limits on our collection and use of certain kinds of information about individuals and our ability to communicate such information effectively with our customers. In addition, GDPR imposes a strict data protection compliance regime with severe penalties of up to 4% of worldwide revenue or €20 million, whichever is greater.
We may not realize the anticipated cost savings and benefits from, or our business may be disrupted by, our business transformation and restructuring efforts.
We continue to transform our business from a traditional publishing model to being a global provider of content-enabled solutions with a focus on digital products and services. The acquisitions of Deltak.edu, LLC ("Deltak"), Inscape Holdings, Inc. ("Inscape"), Profiles International ("Profiles"), and CrossKnowledge Group Limited ("CrossKnowledge") comprise our Solutions reporting segment and, along with Atypon Systems, Inc. ("Atypon") in our Research segment, which was acquired in September 2016, represent examples of strategic initiatives that were implemented as part of our business transformation. We will continue to explore opportunities to develop new business models and enhance the efficiency of its organizational structure. The rapid pace and scope of change increases the risk that not all of our strategic initiatives will deliver the expected benefits within the anticipated timeframes. In addition, these efforts may somewhat disrupt our business activities, which could adversely affect our consolidated financial position and results of operations.
We continue to restructure and realign our cost base with current and anticipated future market conditions. Significant risks associated with these actions that may impair our ability to achieve the anticipated cost savings or that may disrupt our business include delays in the implementation of anticipated workforce reductions in highly regulated locations outside of the U.S., decreases in employee morale, the failure to meet operational targets due to the loss of key employees, and disruptions of third parties to whom we have outsourced business functions. In addition, our ability to achieve the anticipated cost savings and other benefits from these actions within the expected timeframe is subject to many estimates and assumptions. These estimates and assumptions are subject to significant economic, competitive, and other uncertainties, some of which are beyond our control. If these estimates and assumptions are incorrect, if we experience delays, or if other unforeseen events occur, our business and consolidated financial position and results of operations could be adversely affected.
We may not realize the anticipated cost savings and processing efficiencies associated with the outsourcing of certain business processes.
We have outsourced certain business functions, principally in technology, content management, printing, manufacturing, warehousing, fulfillment, distribution, returns processing, and certain other transactional processing functions, to third-party service providers to achieve cost savings, and efficiencies. If these third-party service providers do not perform effectively, we may not be able to achieve the anticipated cost savings, and depending on the function involved, we may experience business disruption or processing inefficiencies, all with potential adverse effects on our consolidated financial position and results of operations.
12
We may be susceptible to information technology risks that may adversely impact our business, consolidated financial position and results of operations.
Information technology is a key part of our business strategy and operations. As a business strategy, Wiley's technology enables us to provide customers with new and enhanced products and services and is critical to our success in migrating from print to digital business models. Information technology is also a fundamental component of all of our business processes, collecting and reporting business data, and communicating internally and externally with customers, suppliers, employees, and others.
Our business is dependent on information technology systems to support our businesses. We provide internet-based products and services to our customers. We also use complex information technology systems and products to support our business activities, particularly in infrastructure, and as we move our products and services to an increasingly digital delivery platform.
We face technological risks associated with internet-based product and service delivery in our businesses, including with respect to information technology capability, reliability and security, enterprise resource planning, system implementations and upgrades. Failures of our information technology systems and products (including because of operational failure, natural disaster, computer virus, or hacker attacks) could interrupt the availability of our internet-based products and services, result in corruption or loss of data or breach in security, and result in liability or reputational damage to our brands and/or adversely impact our consolidated financial position and results of operations.
Management has designed and implemented policies, processes and controls to mitigate risks of information technology failure and to provide security from unauthorized access to our systems. In addition, we have disaster recovery plans in place to maintain business continuity. The size and complexity of our information technology and information security systems, and those of our third-party vendors with whom we contract, make such systems potentially vulnerable to cyber-attacks common to most industries from inadvertent or intentional actions by employees, vendors, or malicious third parties. Such attacks are of ever-increasing levels of sophistication and are made by groups and individuals with a wide range of motives. While we have taken steps to address these risks, there can be no assurance that a system failure, disruption, or data security breach would not adversely affect our business and could have an adverse impact on our consolidated financial position and results of operations.
We are continually improving and upgrading our computer systems and software. We are in the process of implementing a new Enterprise Resource Planning ("ERP") system as part of a multi-year plan to integrate and upgrade our operational and financial systems and processes. As of April 30, 2018, we have completed the implementation of record-to-report, purchase-to-pay, and several other business processes within all locations and will continue to roll out additional processes and functionality of the ERP in phases over the next year. Implementation of a new ERP system involves risks and uncertainties. Any disruptions, delays, or deficiencies in the design or implementation of a new system could result in increased costs, disruptions in operations, or delays in the collection of cash from our customers, as well as having an adverse effect on our ability to timely report our financial results, all of which could materially adversely affect our business, consolidated financial position and results of operations.
Cyber risk and the failure to maintain the integrity of our operational or security systems or infrastructure, or those of third parties with which we do business, could have a material adverse effect on our business, consolidated financial condition, and results of operations.
Cyber-attacks and hackers are becoming more sophisticated and pervasive. Our business is dependent on information technology systems to support our businesses. We provide internet-based products and services to our customers. We also use complex information technology systems and products to support our business activities, particularly in infrastructure and as we move our products and services to an increasingly digital delivery platform. Across our businesses, we hold personal data, including that of employees and customers.
Efforts to prevent cyber-attacks and hackers from entering our systems are expensive to implement and may limit the functionality of our systems. Individuals may try to gain unauthorized access to our systems and data for malicious purposes, and our security measures may fail to prevent such unauthorized access. Cyber-attacks and/or intentional hacking of our systems could adversely affect the performance or availability of our products, result in loss of customer data, adversely affect our ability to conduct business, or result in theft of our funds or proprietary information, the occurrence of which could have an adverse impact on our consolidated financial position and results of operations.
Fluctuations in interest rates and foreign currency exchange rates could materially impact our consolidated financial condition and results of operations.
13
Non-U.S. revenues, as well as our substantial non-U.S. net assets, expose our consolidated results to volatility from changes in foreign currency exchange rates. Non-U.S. dollar denominated revenues accounted for 47% of our total consolidated revenues for fiscal year 2018, which primarily includes revenues in British pound sterling of 27% and euro of 12%. In addition, our interest-bearing loans and borrowings are subject to risk from changes in interest rates. These risks and the measures we have taken to help mitigate them are discussed in Part II, Item 7A, "Quantitative and Qualitative Disclosures about Market Risk," of this Annual Report on Form 10-K. We may, from time-to-time, use derivative instruments to hedge such risks. Notwithstanding our efforts to foresee and mitigate the effects of changes in external market or fiscal circumstances, we cannot predict with certainty changes in foreign currency exchange rates and interest rates, inflation, or other related factors affecting our business, consolidated financial position and results of operations.
We may not be able to mitigate the impact of inflation and cost increases, which could have an adverse impact on our consolidated financial position and results of operations.
From time to time, we experience cost increases reflecting, in part, general inflationary factors. There is no guarantee that we can increase selling prices or reduce costs to fully mitigate the effect of inflation on our costs, which may adversely impact our consolidated financial position and results of operations.
Changes in tax laws, including the U.S. recently enacted comprehensive Federal tax legislation originally known as the Tax Cuts and Jobs Act of 2017 (the "Tax Act"), could have a material impact on our consolidated financial position and results of operations.
We are subject to tax laws within the jurisdictions in which we conduct business. In addition to the recently enacted Tax Act in the U.S., changes in tax laws in other jurisdictions where we do business, such as the U.K. and Germany, could significantly impact the taxation of our non-U.S. earnings. This could have a material impact on our consolidated financial position and results of operations as most of our income is earned outside the U.S. In addition, we are subject to audit by tax authorities and are regularly audited by various tax authorities. Although we believe our tax estimates are reasonable, the final determination of tax audits could be materially different from our historical income tax provisions and accruals and could have a material impact on our consolidated financial position and results of operations.
The final impacts of the Tax Act could be materially different from our current estimates.
The Tax Act was enacted on December 22, 2017. The provisions are broad and complex and depend upon future guidance as well any legislative action to address questions. Our estimated amounts are based on information available at this time and our current understanding of the Tax Act. The final transition impacts of the Tax Act may differ from our estimate, possibly materially.
Challenges and uncertainties associated with operating in developing markets has a higher risk due to political instability, economic volatility, crime, terrorism, corruption, social and ethnic unrest, and other factors, which may adversely impact our consolidated financial position and results of operations.
We sell our products to customers in certain sanctioned and previously sanctioned developing markets where we do not have operating subsidiaries. We do not own any assets or liabilities in these markets except for trade receivables. In fiscal year 2018, we recorded revenue and net earnings of $4.8 million and $0.9 million, respectively, related to sales to Cuba, Sudan, Syria and Iran. While sales in these markets are not material to our consolidated financial position and results of operations, adverse developments related to the risks associated with these markets may cause actual results to differ from historical and forecasted future consolidated operating results.
We have certain technology development operations in Russia related to software development and architecture, digital content production, and system testing services. Due to the political instability within the region, there is the potential for future government embargos and sanctions which could disrupt our operations in this area. While we have developed business continuity plans to address these issues, further adverse developments in the region could have a material impact on our consolidated financial position and results of operations.
Approximately 16% of Research journal articles are sourced from authors in China. Any restrictions on exporting intellectual property could adversely affect our business and consolidated financial position and results of operations.
Changes in global economic conditions could impact our ability to borrow funds and meet our future financing needs.
Changes in global financial markets have not had, nor do we anticipate they will have, a significant impact on our liquidity. Due to our significant operating cash flow, financial assets, access to capital markets, and available lines of credit and revolving credit agreements, we continue to believe that we have the ability to meet our financing needs for the foreseeable future. As market conditions change, we will continue to monitor our liquidity position. However, there can be no assurance that our liquidity or our consolidated financial position and results of operations will not be adversely affected by possible future changes in global financial markets and global economic conditions. Unprecedented market conditions including illiquid credit markets, volatile equity markets, dramatic fluctuations in foreign currency rates, and economic recession could affect future results.
14
Changes in pension costs and related funding requirements may impact our consolidated financial position and results of operations.
We provide defined benefit pension plans for certain employees worldwide. Our Board of Directors approved amendments to the U.S., Canada and U.K. defined benefit plans that froze the future accumulation of benefits effective June 30, 2013, December 31, 2015, and April 30, 2015, respectively. The funding requirements and costs of these plans are dependent upon various factors, including the actual return on plan assets, discount rates, plan participant population demographics, and changes in pension regulations. Changes in these factors affect our plan funding, consolidated financial position, and results of operations.
We may not be able to realize the expected benefits of our growth strategies, including successfully integrating acquisitions, which could adversely impact our consolidated financial position and results of operations.
Our growth strategy includes title, imprint, and other business acquisitions, including knowledge-enabled services, which complement our existing businesses. Acquisitions may have a substantial impact on our consolidated financial position and results of operations. Acquisitions involve risks and uncertainties, including difficulties in integrating acquired operations and in realizing expected opportunities, cost synergies, diversions of management resources, and loss of key employees, challenges with respect to operating new businesses, and other uncertainties.
As a result of acquisitions, we may record a significant amount of goodwill and other identifiable intangible assets and we may never realize the full carrying value of the related assets.
As a result of acquisitions, we record a significant amount of goodwill and other identifiable intangible assets, including customer relationships, trademarks and developed technologies. At April 30, 2018, we had $1,019.8 million of goodwill and $848.1 million of intangible assets, of which $232.8 million are indefinite-lived intangible assets, on our consolidated balance sheet. The intangible assets are principally composed of content and publishing rights, customer relationships, and brands and trademarks. Failure to achieve business objectives and financial projections could result in an asset impairment charge, which would result in a non-cash charge to our consolidated results of operations. Goodwill and intangible assets with indefinite lives are tested for impairment on an annual basis and also when events or changes in circumstances indicate that impairment may have occurred. Intangible assets with determinable lives, which were $615.3 million at April 30, 2018, are tested for impairment only when events or changes in circumstances indicate that an impairment may have occurred. Determining whether an impairment exists can be difficult as a result of increased uncertainty and current market dynamics, and requires management to make significant estimates and judgments. A non-cash intangible asset impairment charge could have a material adverse effect on our consolidated financial position and results of operations.
If we are unable to retain key employees and other personnel, our consolidated financial condition or results of operations may be adversely affected.
We have a significant investment in our employees around the world. We offer competitive salaries and benefits in order to attract and retain the highly skilled workforce needed to sustain and develop new products and services required for growth. Employment and benefit costs are affected by competitive market conditions for qualified individuals, and factors such as healthcare and retirement benefit costs.
We are highly dependent on the continued services of key employees who have in-depth market and business knowledge and/or key relationships with business partners. The loss of the services of key personnel for any reason and our inability to replace them with suitable candidates quickly or at all, as well as any negative market perception resulting from such loss, could have a material adverse effect on our business, consolidated financial position, and results of operation.
None
15
We occupy office, warehouse, and distribution facilities in various parts of the world, as listed below (excluding those locations with less than 10,000 square feet of floor area, none of which is considered material property). All of the buildings and the equipment owned or leased are believed to be in good operating condition and are suitable for the conduct of our business.
|
Location
|
Purpose
|
Owned or Leased
|
Approx. Sq. Ft.
|
|||
|
United States:
|
||||||
|
New Jersey
|
Corporate Headquarters
|
Leased
|
303,000
|
|||
|
Office
|
Leased
|
185,000
|
||||
|
Indiana
|
Office
|
Leased
|
123,000
|
|||
|
California
|
Office
|
Leased
|
29,000
|
|||
|
Massachusetts
|
Office
|
Leased
|
26,000
|
|||
|
Illinois
|
Office
|
Leased
|
52,000
|
|||
|
Florida
|
Office
|
Leased
|
58,000
|
|||
|
Minnesota
|
Office
|
Leased
|
22,000
|
|||
|
Texas
|
Office
|
Leased
|
11,000
|
|||
|
Colorado
|
Office
|
Leased
|
15,000
|
|||
|
International:
|
||||||
|
Australia
|
Offices
|
Leased
|
34,000
|
|||
|
Canada
|
Office
|
Leased
|
12,000
|
|||
|
England
|
Distribution Centers
|
Leased
|
298,000
|
|||
|
Offices
|
Leased
|
80,000
|
||||
|
Offices
|
Owned
|
70,000
|
||||
|
France
|
Offices
|
Leased
|
32,000
|
|||
|
Germany
|
Office
|
Owned
|
104,000
|
|||
|
Office
|
Leased
|
18,000
|
||||
|
Jordan
|
Office
|
Leased
|
24,000
|
|||
|
Singapore
|
Offices
|
Leased
|
35,000
|
|||
|
Russia
|
Office
|
Leased
|
24,000
|
|||
|
China
|
Offices
|
Leased
|
26,000
|
|||
|
India
|
Distribution Centers
|
Leased
|
12,000
|
|||
|
Office
|
Leased
|
31,000
|
||||
|
Greece
|
Office
|
Leased
|
16,000
|
The information set forth in Note 14, "Commitments and Contingencies," of the Notes to Consolidated Financial Statements is incorporated herein by reference.
We are involved in routine litigation in the ordinary course of our business. In the opinion of management, the ultimate resolution of all pending litigation will not have a material effect upon our consolidated financial position or results of operations.
Not applicable
16
Set forth below are the current executive officers of the Company. Each of the officers listed will serve until the next organizational meetings of the Board of Directors of the Company and until each of the respective successors are duly elected and qualified.
|
Name, Current and Former Positions
|
Age
|
First Elected to
Current Position
|
||
|
BRIAN A. NAPACK
|
56
|
December 2017
|
||
|
President and Chief Executive Officer and Director
|
||||
|
March 2012 – Senior Advisor, Providence Equity Partners LLC
|
||||
|
JOHN A. KRITZMACHER
|
57
|
July 2013
|
||
|
Chief Financial Officer and Executive Vice President, Operations
|
||||
|
October 2012 – Senior Vice President of Business Operations, Organizational Planning & Structure at WebMD Health Corp
|
||||
|
ARCHANA SINGH
|
48
|
June 2016
|
||
|
Executive Vice President and Chief Human Resources Officer
|
||||
|
2014 – Chief Human Resources Officer, Hay Group
|
||||
|
2012 – Vice President, Human Resources, Computer Science Corporation
|
||||
|
GARY M. RINCK
|
66
|
September 2014
|
||
|
Executive Vice President, General Counsel
|
||||
|
2004 – Senior Vice President, General Counsel
|
||||
|
JUDY VERSES
|
61
|
October 2016
|
||
|
Executive Vice President, Research
|
||||
|
October 2011 – President – Global Enterprise and Education, Rosetta Stone Inc.
|
||||
|
ELLA BALAGULA
|
48
|
October 2017
|
||
|
Executive Vice President, Knowledge & Learning
|
||||
|
January 2013 – Senior Vice President and General Manager, Engineering Solutions, Elsevier
|
||||
|
October 2009 – Senior Vice President, Engineering and Technology Markets, Elsevier
|
||||
|
CHRISTOPHER F. CARIDI
|
52
|
March 2017
|
||
|
Senior Vice President, Corporate Controller and Chief Accounting Officer
|
||||
|
March 2014 – Vice President Finance, Thomson Reuters
|
||||
|
September 2009 – Vice President, Controller/Global Head of Accounting Operations, Thomson Reuters
|
||||
|
VINCENT MARZANO
|
55
|
September 2014
|
||
|
Senior Vice President, Treasurer
|
||||
|
September 2006 – Vice President, Treasurer
|
||||
|
CLAY E. STOBAUGH
|
60
|
September 2014
|
||
|
Executive Vice President, Chief Marketing Officer & Government Affairs
|
||||
|
October 2013 – Senior Vice President & Chief Marketing Officer
|
||||
|
AREF MATIN
|
59
|
May 2018
|
||
|
Executive Vice President, Chief Technology Officer
|
||||
|
February 2015 – Executive Vice President, Chief Technology Officer, Ascend Learning
|
||||
|
July 2012 – Executive Vice President, Chief Technology Officer, Pearson Learning Technologies & Pearson Higher Education
|
17
PART II
Item 5. Market for Registrant's Common Equity, Related Stockholder Matters and Issuer Purchases of Equity Securities
Our Class A and Class B shares are listed on the New York Stock Exchange under the symbols JWa and JWb, respectively. Dividends per share and the market price range (based on daily closing prices) by fiscal quarter for the past two fiscal years were as follows:
|
Class A Common Stock
|
Class B Common Stock
|
|||||||||||||||||||||||
|
Market Price
|
Market Price
|
|||||||||||||||||||||||
|
Dividends
|
High
|
Low
|
Dividends
|
High
|
Low
|
|||||||||||||||||||
|
2018
|
||||||||||||||||||||||||
|
First Quarter
|
$
|
0.32
|
$
|
55.70
|
$
|
49.50
|
$
|
0.32
|
$
|
55.16
|
$
|
51.65
|
||||||||||||
|
Second Quarter
|
0.32
|
56.00
|
51.50
|
0.32
|
54.91
|
51.76
|
||||||||||||||||||
|
Third Quarter
|
0.32
|
68.40
|
54.40
|
0.32
|
67.00
|
54.86
|
||||||||||||||||||
|
Fourth Quarter
|
0.32
|
67.85
|
60.70
|
0.32
|
67.42
|
61.90
|
||||||||||||||||||
|
2017
|
||||||||||||||||||||||||
|
First Quarter
|
$
|
0.31
|
$
|
57.78
|
$
|
47.68
|
$
|
0.31
|
$
|
57.41
|
$
|
47.92
|
||||||||||||
|
Second Quarter
|
0.31
|
58.86
|
48.40
|
0.31
|
58.99
|
49.66
|
||||||||||||||||||
|
Third Quarter
|
0.31
|
57.75
|
49.45
|
0.31
|
57.69
|
52.68
|
||||||||||||||||||
|
Fourth Quarter
|
0.31
|
57.35
|
49.00
|
0.31
|
57.14
|
46.53
|
||||||||||||||||||
On a quarterly basis, the Board of Directors considers the payment of cash dividends based upon its review of earnings, our financial position, and other relevant factors. As of May 31, 2018, the approximate number of holders of our Class A and Class B Common Stock were 777 and 62, respectively, based on the holders of record.
During fiscal year 2017, our Board of Directors approved an additional share repurchase program of four million shares of Class A or B Common Stock. During the fourth quarter of fiscal year 2018, we made the following purchases of Class A Common Stock under this publicly announced stock repurchase program.
|
Total Number
of Shares Purchased
|
Average Price
Paid Per Share
|
Total Number
of Shares Purchased
as Part of a Publicly
Announced Program
|
Maximum Number
of Shares that
May be Purchased
Under the Program
|
|||||||||||||
|
February 2018
|
—
|
$
|
—
|
—
|
3,242,891
|
|||||||||||
|
March 2018
|
101,620
|
64.39
|
101,620
|
3,141,271
|
||||||||||||
|
April 2018
|
60,800
|
63.95
|
60,800
|
3,080,471
|
||||||||||||
|
Total
|
162,420
|
$
|
64.22
|
162,420
|
3,080,471
|
|||||||||||
18
|
For the Years Ended April 30, (a)
|
||||||||||||||||||||
|
Dollars (in millions, except per share data)
|
2018
|
2017
|
2016
|
2015
|
2014
|
|||||||||||||||
|
Revenue
|
$
|
1,796.1
|
$
|
1,718.5
|
$
|
1,727.0
|
$
|
1,822.4
|
$
|
1,775.2
|
||||||||||
|
Operating Income
|
239.5
|
206.2
|
188.1
|
237.7
|
206.7
|
|||||||||||||||
|
Net Income (a)
|
192.2
|
113.6
|
145.8
|
176.9
|
160.5
|
|||||||||||||||
|
Working Capital
|
(394.3
|
)
|
(428.1
|
)
|
(111.1
|
)
|
(62.8
|
)
|
60.1
|
|||||||||||
|
Deferred Revenue in Working Capital (b)
|
(486.4
|
)
|
(436.2
|
)
|
(426.5
|
)
|
(372.1
|
)
|
(385.7
|
)
|
||||||||||
|
Total Assets
|
2,839.5
|
2,606.2
|
2,921.1
|
3,004.2
|
3,077.4
|
|||||||||||||||
|
Long-Term Debt
|
360.0
|
365.0
|
605.0
|
650.1
|
700.1
|
|||||||||||||||
|
Shareholders' Equity
|
1,190.6
|
1,003.1
|
1,037.1
|
1,055.0
|
1,182.2
|
|||||||||||||||
|
Per Share Data
|
||||||||||||||||||||
|
Earnings Per Share
|
||||||||||||||||||||
|
Basic
|
$
|
3.37
|
$
|
1.98
|
$
|
2.51
|
$
|
3.01
|
$
|
2.73
|
||||||||||
|
Diluted
|
$
|
3.32
|
$
|
1.95
|
$
|
2.48
|
$
|
2.97
|
$
|
2.70
|
||||||||||
|
Cash Dividends
|
||||||||||||||||||||
|
Class A Common
|
$
|
1.28
|
$
|
1.24
|
$
|
1.20
|
$
|
1.16
|
$
|
1.00
|
||||||||||
|
Class B Common
|
$
|
1.28
|
$
|
1.24
|
$
|
1.20
|
$
|
1.16
|
$
|
1.00
|
||||||||||
| (a) |
See Item 7, "Management's Discussion and Analysis of Financial Condition and Results of Operations," for a discussion of the factors that contributed to our consolidated operating results for the three years ended April 30, 2018. Certain tax benefits and charges included in fiscal 2018 – 2014 include:
|
| · |
Fiscal year 2018 includes a favorable impact of $25.1 million ($0.43 per share) from the U.S. government enacted comprehensive Federal tax legislation originally known as the Tax Cuts and Jobs Act of 2017 (the "Tax Act"). Given the significant complexity of the Tax Act, anticipated guidance from the U.S. Treasury, and potential additional guidance from the SEC or the Financial Accounting Standards Board, these estimates may be adjusted within 12 months of the enactment date.
|
| · |
Fiscal year 2017 includes the effect of the German Tax litigation of $49.1 million ($0.85 per share).
|
| · |
Fiscal years 2017, 2016, and 2014 include tax benefits of $2.6 million, ($0.04 per share), $5.9 million ($0.10 per share), and $10.6 million ($0.18 per share), respectively, principally associated with consecutive tax legislation enacted in the United Kingdom that reduced the U.K. corporate income tax rates.
|
| · |
Fiscal year 2015 includes a non-recurring tax benefit of $3.1 million ($0.05 per share) related to tax deductions claimed on the write-up of certain foreign tax assets to fair market value.
|
| (b) |
The primary driver of the negative working capital is unearned deferred revenue related to subscriptions for which cash has been collected in advance. Cash received in advance for subscriptions is used by us for a number of purposes, including funding operating activities, acquisitions, debt repayments, dividend payments, and repurchasing treasury shares. The deferred revenue will be recognized as income when the products are shipped or made available online to the customers over the term of the subscription period.
|
19
The information in our Management's Discussion and Analysis of Financial Condition and Results of Operations ("MD&A") should be read together with our Consolidated Financial Statements and related notes set forth in Part II, Item 8, as well as the discussion included above, "Cautionary Notice Regarding Forward-Looking Statements "Safe Harbor" Statement under the Private Securities Litigation Reform Act of 1995" and "Non-GAAP Financial Measures," along with Part I, Item 1A, "Risk Factors," of this Annual Report on Form 10-K. All amounts and percentages are approximate due to rounding and all dollars are in thousands, except per share amounts or where otherwise noted. When we cross-reference to a "Note," we are referring to our "Notes to Consolidated Financial Statements," unless the context indicates otherwise.
Results of Operations
FISCAL YEAR 2018 SUMMARY RESULTS
Revenue:
Revenue for fiscal year 2018 increased 5% to $1,796.1 million, or 1% on a constant currency basis as compared with prior year. The increase was mainly driven by an increase in Research revenue due to a full year of revenue from the Atypon acquisition in fiscal year 2018 and growth in Open Access and, to a lesser extent, higher Education Services (OPM) revenue in Solutions. These increases were partially offset by a decline in Publishing revenue, primarily in STM and in Professional and Education Publishing, which reflected market conditions.
See the "Segment Operating Results" below for additional details on each segment's revenue and contribution to profit performance.
Cost of Sales and Gross Profit Margin:
Cost of sales for fiscal year 2018 increased 5% to $485.2 million, or 2% on a constant currency basis as compared with prior year. The increase was primarily a result of higher revenues and higher royalty costs on Research journals due to title mix and an increase in new titles at a higher royalty rate.
Gross profit margin for fiscal year 2018 was 73.0% and decreased slightly compared with the prior year on a constant currency basis, primarily in our Publishing segment as a result of the decline in revenue.
Operating and Administrative Expenses:
Operating and administrative expenses for fiscal year 2018 remained flat at $994.6 million, but decreased 1% on a constant currency basis as compared with prior year due to the following:
| |
lower technology costs in the current year of $18 million associated with our ERP implementation and other reductions in outsourcing and system development consulting costs;
|
| · |
a one-time pension settlement charge in the prior year related to changes in our retiree and long-term disability plans of $9 million; and
|
| |
savings from operational excellence initiatives and restructuring activities.
|
These factors were partially offset by:
| |
one-time benefits in the prior year related to changes in our retiree and long-term disability plans of $4 million and a life insurance recovery of $2 million;
|
| |
a full year of costs in fiscal year 2018 associated with the Atypon acquisition, which resulted in an incremental impact of $9 million;
|
| |
an increase in strategy consultation costs in the current year of $7 million; and
|
| |
an impairment charge in the current year related to one of our Publishing brands of $4 million.
|
Restructuring and Related Charges:
Beginning in fiscal year 2013, we initiated a global program (the "Restructuring and Reinvestment Program") to restructure and realign our cost base with current and anticipated future market conditions. We are targeting a majority of the cost savings achieved to improve margins and earnings, while the remainder will be reinvested in high-growth digital business opportunities.
20
In fiscal years 2018 and 2017, we recorded pre-tax restructuring charges of $29 million and $13 million, respectively, related to this program. These charges are reflected in Restructuring and Related Charges on the Consolidated Statements of Income and summarized in the following table:
|
2018
|
2017
|
Total Charges
Incurred to Date
|
||||||||||
|
Charges by Segment:
|
||||||||||||
|
Research
|
$
|
5,257
|
$
|
1,949
|
$
|
25,413
|
||||||
|
Publishing
|
6,443
|
1,596
|
38,931
|
|||||||||
|
Solutions
|
3,695
|
1,787
|
6,247
|
|||||||||
|
Corporate Expenses
|
13,171
|
8,023
|
95,919
|
|||||||||
|
Total Restructuring and Related Charges
|
$
|
28,566
|
$
|
13,355
|
$
|
166,510
|
||||||
|
Charges (Credits) by Activity:
|
||||||||||||
|
Severance
|
$
|
27,213
|
$
|
8,386
|
$
|
114,803
|
||||||
|
Process reengineering consulting
|
1,815
|
148
|
20,629
|
|||||||||
|
Other activities
|
(462
|
)
|
4,821
|
31,078
|
||||||||
|
Total Restructuring and Related Charges
|
$
|
28,566
|
$
|
13,355
|
$
|
166,510
|
||||||
Other Activities in 2017 reflects leased facility consolidations contract termination costs, and the curtailment of certain defined benefit pension plans.
Amortization of Intangibles:
Amortization of intangibles for fiscal year 2018 declined 3% to $48 million, or 5% on a constant currency basis compared with prior year. The decrease was a result of the completion of amortization of certain acquired intangible assets.
Interest Expense:
Interest expense for fiscal year 2018 decreased $4 million to $13 million on a reported and constant currency basis. This decrease was due to lower average debt balances outstanding, partially offset by a higher average effective borrowing rate.
Foreign Exchange Transaction (Losses) Gains:
We reported foreign exchange transaction losses of $13 million for fiscal year 2018 compared to gains of $0.4 million in the prior year. The losses in fiscal year 2018 were primarily due to the impact of the change in average foreign exchange rates as compared to the U.S. dollar on our intercompany and third-party accounts receivable and payable balances.
Provision for Income Taxes:
The following table summarizes the effective tax rate for fiscal years 2018 and 2017:
|
2018
|
2017
|
|||||||
|
Effective tax rate as reported
|
10.2
|
%
|
40.5
|
%
|
||||
|
Estimated net impact in fiscal 2018 of non-recurring items from Tax Act
|
11.7
|
—
|
||||||
|
Impact of unfavorable German court decision in fiscal 2017
|
—
|
(25.7
|
)
|
|||||
|
Impact of reduction in U.K. statutory rate on deferred tax balances in fiscal 2017
|
—
|
1.3
|
||||||
|
Effective tax rate excluding the impact of non-recurring items from the Tax Act in fiscal 2018 and the unfavorable German court decision and U.K. tax rate reduction in fiscal 2017
|
21.9
|
%
|
16.1
|
%
|
||||
On December 22, 2017, the U.S. government enacted comprehensive Federal tax legislation originally known as the Tax Cuts and Jobs Act of 2017 (the "Tax Act"). In December 2017, the SEC staff issued Staff Accounting Bulletin No. 118, Income Tax Accounting Implications of the Tax Cuts and Jobs Act ("SAB 118"), which allows us to record provisional amounts related to the effect of the Tax Act during a measurement period not to extend beyond one year of the enactment date. As the Tax Act was passed in December 2017, and ongoing guidance and accounting interpretation are expected over the 12 months following enactment, we consider the accounting of the transition tax, deferred tax re-measurements, and other items to be provisional due to the forthcoming guidance and our ongoing analysis of final data and tax positions. We expect to complete our analysis within the measurement period in accordance with SAB 118.
21
The effective tax rate was lower in fiscal 2018 as compared with fiscal 2017 due to the estimated net tax benefit from non-recurring items in the Tax Act and the effect of the German Tax litigation in fiscal year 2017 as described below. Estimated non-recurring items in the Tax Act reduced our income tax expense by $25 million ($0.43/share) or a reduction in our effective tax rate of 11.7 percentage points for fiscal year 2018. Excluding the effect of the Tax Act, the rate was 21.9% for fiscal year 2018.
The rate excluding the benefit from the non-recurring items in the Tax Act was lower than the U.S. statutory rate for the year ended April 30, 2018, primarily due to lower rates applicable to non-U.S. earnings.
German Tax Litigation Expense: In fiscal 2017, the German Federal Fiscal Court affirmed a lower court decision disallowing deductions related to a stepped-up basis in certain assets. As a result, we incurred an income tax charge of approximately $49 million ($0.85 per share).
Deferred Tax Benefit from U.K. Statutory Tax Rate Change: In fiscal year 2016, the U.K. reduced its statutory rate to 19% beginning April 1, 2017 and 18% beginning April 1, 2020, and in fiscal year 2017, the U.K. further reduced its statutory rate beginning on April 1, 2020, from 18% to 17%. This resulted in a non-cash deferred tax benefit from the re-measurement of our applicable U.K. deferred tax balances of $6 million ($0.10 per share) in fiscal year 2016 and $3 million ($0.04 per share) in fiscal year 2017.
The Tax Act
On December 22, 2017, the U.S. government enacted comprehensive tax legislation. The Tax Act significantly revises the future ongoing U.S. corporate income tax system by, among other changes, the following:
| · |
lowering the U.S. federal corporate income tax rate to 21% with a potentially lower rate for certain foreign derived income;
|
| · |
accelerating deductions for certain business assets;
|
| · |
changing the U.S. system from a worldwide tax system;
|
| · |
requiring companies to pay a one-time transition tax on post-1986 unrepatriated cumulative non-U.S. earnings and profits ("E&P") of foreign subsidiaries;
|
| · |
eliminating certain deductions such as the domestic production deduction;
|
| · |
establishing limitations on the deductibility of certain expenses including interest and executive compensation; and
|
| · |
creating new taxes on certain foreign earnings.
|
The key impacts for the period were the re-measurement of U.S. deferred tax balances to the new U.S. corporate tax rate and the accrual for the one-time transition tax liability. While we have not yet completed our assessment of the effects of the Tax Act, we are able to determine reasonable estimates for the impacts of these key items and reported provisional amounts for these items. In accordance with SAB 118, we are providing additional disclosures related to these provisional amounts.
Deferred tax balances – We remeasured our U.S. deferred tax assets and liabilities based on the federal rate at which they are expected to reverse in the future, generally 21% for reversals anticipated to occur after April 30, 2018. We are still analyzing certain aspects of the Tax Act and refining our calculations, including our estimates of expected reversals, which could affect the measurement of these balances and give rise to new deferred tax amounts. The provisional amount recorded related to the re-measurement of our net deferred tax liability was an estimated benefit of $47 million.
Foreign tax effects – In connection with the transition from a global tax system, the Tax Act establishes a mandatory deemed repatriation tax. The tax is computed using our post-1986 E&P that was previously deferred from U.S. income taxes. The tax is based on the amount of foreign earnings held in cash equivalents and certain net assets, which are taxed at 15.5%, and those held in other assets, which are taxed at 8%. We recorded a provisional amount of $14.2 million. We also established an estimated valuation allowance of $6.5 million. This resulted in a corresponding decrease in deferred tax assets due to the utilization of foreign tax credit carryforwards. The determination of the transition tax requires further guidance as to its applicability to non-calendar year end taxpayers and analysis regarding the amount and composition of our historical foreign earnings. We no longer assert that we intend to permanently reinvest earnings outside the U.S. and accrued a provisional $2.0 million related to our estimated taxes from repatriating earnings with available cash. In addition, we accrued a $0.1 million provisional state tax liability, pending further guidance and legislative action from various states regarding conformity with the Tax Act.
The Tax Act reduces the Federal statutory tax rate from 35% to 21% effective January 1, 2018. As a result, our U.S. federal statutory tax rate for our fiscal year ended April 30, 2018, is a blended rate of 30.4%. Other than the benefit from remeasuring our U.S. deferred tax assets and liabilities, the reduced rate did not have a significant impact on our effective tax rate for fiscal year 2018.
We have not determined a reasonable estimate of the tax liability, if any, under the Tax Act for our remaining outside basis difference. We will continue to evaluate our position for this matter as we finalize our Tax Act calculations.
22
The Tax Act creates new taxes, effective for us on May 1, 2018, including a provision designed to tax global low taxed income ("GILTI") and a provision establishing new minimum taxes, such as the base erosion anti-abuse tax ("BEAT"). We continue to evaluate the Tax Act, but due to the complexity and incomplete guidance of various provisions, we have not completed our accounting for the income tax effects of certain elements of the Tax Act, including the new GILTI and BEAT taxes. We have not yet determined whether such taxes should be recorded as a current-period expense when incurred or factored into the measurement of our deferred taxes. As a result, we have not included an estimate of any tax expense or benefit related to these items for the year ended April 30, 2018.
Because of our estimated benefit from the Tax Act as well as other factors, we expect an approximate estimated effective tax rate of 23%–24% in fiscal year 2019. This effective tax rate excludes the tax impact of certain provision of the Tax Act whose impact is not yet known, as well as the tax impact of certain items we cannot yet provide. These items are not available without unreasonable effort due to the high variability, complexity, low visibility or uncertainty, including restructuring charges and credits, gains and losses on foreign currency, and other gains and losses.
Earnings Per Diluted Share ("EPS"):
EPS for fiscal year 2018 was $3.32 per share compared with $1.95 per share in the prior year. EPS results included the following items, which impacted comparability:
|
2018
|
2017
|
|||||||
|
Restructuring and related charges
|
$
|
(0.39
|
)
|
$
|
(0.15
|
)
|
||
|
Foreign exchange losses on intercompany transactions
|
(0.15
|
)
|
(0.01
|
)
|
||||
|
Estimated impact of the Tax Act
|
0.43
|
—
|
||||||
|
Pension settlement
|
—
|
(0.09
|
)
|
|||||
|
Unfavorable tax settlement
|
—
|
(0.85
|
)
|
|||||
|
Deferred income tax benefit on U.K. tax rate change
|
—
|
0.04
|
||||||
|
Total net impact
|
$
|
(0.11
|
)
|
$
|
(1.06
|
)
|
||
Excluding the impact of the items included above, Adjusted EPS for fiscal year 2018 increased 14% to $3.43 per share compared with $3.01 per share in the prior year. On a constant currency basis, Adjusted EPS increased 3%.
SEGMENT OPERATING RESULTS:
|
2018
|
2017
|
% Change
|
% Change
w/o FX (a)
|
|||||||||||||
|
RESEARCH:
|
||||||||||||||||
|
Revenue:
|
||||||||||||||||
|
Journal Subscriptions
|
$
|
677,685
|
$
|
639,720
|
6
|
%
|
—
|
|||||||||
|
Open Access
|
41,997
|
30,633
|
37
|
%
|
34
|
%
|
||||||||||
|
Licensing, Reprints, Backfiles, and Other
|
181,806
|
164,070
|
11
|
%
|
8
|
%
|
||||||||||
|
Total Journal Revenue
|
$
|
901,488
|
$
|
834,423
|
8
|
%
|
3
|
%
|
||||||||
|
Publishing Technology Services (Atypon)
|
32,907
|
19,066
|
73
|
%
|
73
|
%
|
||||||||||
|
Total Research Revenue
|
$
|
934,395
|
$
|
853,489
|
9
|
%
|
4
|
%
|
||||||||
|
Cost of Sales
|
(247,654
|
)
|
(219,773
|
)
|
13
|
%
|
8
|
%
|
||||||||
|
Gross Profit
|
$
|
686,741
|
$
|
633,716
|
8
|
%
|
3
|
%
|
||||||||
|
Gross Profit Margin
|
73.5
|
%
|
74.3
|
%
|
||||||||||||
|
Operating Expenses
|
(379,175
|
)
|
(353,406
|
)
|
7
|
%
|
5
|
%
|
||||||||
|
Amortization of Intangibles
|
(26,829
|
)
|
(26,133
|
)
|
3
|
%
|
—
|
|||||||||
|
Restructuring Charges (See Note 6)
|
(5,257
|
)
|
(1,949
|
)
|
||||||||||||
|
Contribution to Profit
|
$
|
275,480
|
$
|
252,228
|
9
|
%
|
—
|
|||||||||
|
Contribution Margin
|
29.5
|
%
|
29.6
|
%
|
||||||||||||
| (a) |
Adjusted to exclude Restructuring Charges
|
23
Revenue:
Research revenue increased 9% to $934.4 million, or 4% on a constant currency basis as compared with prior year. The increase was primarily due to:
| |
a full year of revenue from Atypon, which was acquired in September 2016, of which $14 million was the incremental impact;
|
| |
Open Access growth driven by the strong performance of existing titles and, to a lesser extent, new title launches; and
|
| |
other Journal revenue increases, particularly in reprints, backfiles and the licensing of intellectual content.
|
As of April 30, 2018, calendar year 2018 journal subscription renewals were 2% higher than calendar year 2017 on a constant currency basis with approximately 97% of targeted business under contract.
Gross Profit:
Gross profit increased 8% to $686.7 million, or 3% on a constant currency basis as compared with prior year. The increase was driven by higher revenues. Gross profit margin declined by 80 basis points due primarily to higher journal royalty costs associated with title mix and an increase in new titles at higher royalty rates. We anticipate that we will continue to experience gross margin pressure due to higher journal royalty rates in fiscal year 2019. To offset this gross margin pressure, we will continue to pursue additional operations efficiencies.
Contribution to Profit:
Contribution to profit increased 9% to $275.5 million as compared with prior year. On a constant currency basis and excluding restructuring charges, contribution to profit remained flat as compared with prior year as the increase in gross profit was fully offset by higher operating expenses.
The increase in operating expenses was primarily due to:
| · |
a full year of costs in fiscal year 2018 from Atypon which resulted in an incremental impact of $9 million;
|
| · |
higher employment-related costs of $5 million, which included higher incentive compensation from the achievement of certain financial goals and targets;
|
| · |
higher content and editorial costs of $3 million; and
|
| · |
an increase in product technology costs of $5 million.
|
These factors were partially offset by savings from operational excellence initiatives and restructuring activities.
Society Partnerships
For calendar year 2018, 15 new society contracts were signed, with combined annual revenue of approximately $14 million, and 10 society contracts were not renewed with combined annual revenue of approximately $3 million.
24
|
2018
|
2017
|
% Change
|
% Change
w/o FX (a)
|
|||||||||||||
|
PUBLISHING:
|
||||||||||||||||
|
Revenue:
|
||||||||||||||||
|
STM and Professional Publishing
|
$
|
287,315
|
$
|
291,255
|
(1
|
)%
|
(3
|
)%
|
||||||||
|
Education Publishing
|
187,178
|
196,343
|
(5
|
)%
|
(6
|
)%
|
||||||||||
|
Course Workflow (WileyPLUS)
|
59,475
|
62,348
|
(5
|
)%
|
(5
|
)%
|
||||||||||
|
Test Preparation and Certification
|
35,534
|
35,609
|
—
|
—
|
||||||||||||
|
Licensing, Distribution, Advertising and Other
|
48,146
|
47,894
|
1
|
%
|
(2
|
)%
|
||||||||||
|
Total Publishing Revenue
|
$
|
617,648
|
$
|
633,449
|
(2
|
)%
|
(4
|
)%
|
||||||||
|
Cost of Sales
|
(194,900
|
)
|
(194,837
|
)
|
—
|
(1
|
)%
|
|||||||||
|
Gross Profit
|
$
|
422,748
|
$
|
438,612
|
(4
|
)%
|
(5
|
)%
|
||||||||
|
Gross Profit Margin
|
68.4
|
%
|
69.2
|
%
|
||||||||||||
|
Operating Expenses
|
(280,680
|
)
|
(301,510
|
)
|
(7
|
)%
|
(8
|
)%
|
||||||||
|
Amortization of Intangibles
|
(8,108
|
)
|
(9,803
|
)
|
(17
|
)%
|
(17
|
)%
|
||||||||
|
Restructuring Charges (see Note 6)
|
(6,443
|
)
|
(1,596
|
)
|
||||||||||||
|
Publishing brand impairment charge
|
(3,600
|
)
|
—
|
|||||||||||||
|
Contribution to Profit
|
$
|
123,917
|
$
|
125,703
|
(1
|
)%
|
2
|
%
|
||||||||
|
Contribution Margin
|
20.1
|
%
|
19.8
|
%
|
||||||||||||
| (a) |
Adjusted in fiscal year 2018 and 2017 to exclude Restructuring Charges, and in fiscal year 2018 also excludes a Publishing brand impairment charge.
|
Revenue:
Publishing revenue decreased 2% to $617.6 million, or 4% on a constant currency basis as compared with prior year. The decline was driven by lower print book revenues, particularly in Education Publishing, due to overall softness in the market as well as other retail options such as rental and digital. Also contributing to the decline in Publishing revenue was a decline in Course Workflow (WileyPLUS), primarily due to the timing of revenue recognition associated with multi-semester offerings, which are recognized in periods extending across two semesters.
Gross Profit:
Gross profit decreased 4% to $422.7 million, or 5% on a constant currency basis as compared with prior year. The decrease was mainly driven by the decline in revenues, partially offset by lower inventory costs due to cost savings initiatives.
Contribution to Profit:
Contribution to profit decreased 1% to $123.9 million as compared with prior year. On a constant currency basis and excluding restructuring charges and a brand impairment charge in the first quarter of fiscal year 2018, contribution to profit increased 2%. This was primarily due to lower operating expenses, which primarily savings from operational excellence initiatives and restructuring activities.
25
|
2018
|
2017
|
% Change
|
% Change
w/o FX (a)
|
|||||||||||||
|
SOLUTIONS:
|
||||||||||||||||
|
Revenue:
|
||||||||||||||||
|
Education Services (OPM)
|
$
|
119,131
|
$
|
111,638
|
7
|
%
|
7
|
%
|
||||||||
|
Professional Assessment
|
61,094
|
59,868
|
2
|
%
|
2
|
%
|
||||||||||
|
Corporate Learning
|
63,835
|
60,086
|
6
|
%
|
(1
|
)%
|
||||||||||
|
Total Solutions Revenue
|
$
|
244,060
|
$
|
231,592
|
5
|
%
|
3
|
%
|
||||||||
|
Cost of Sales
|
(42,658
|
)
|
(46,146
|
)
|
(8
|
)%
|
(11
|
)%
|
||||||||
|
Gross Profit
|
$
|
201,402
|
$
|
185,446
|
9
|
%
|
7
|
%
|
||||||||
|
Gross Profit Margin
|
82.5
|
%
|
80.1
|
%
|
||||||||||||
|
Operating Expenses
|
(162,317
|
)
|
(155,104
|
)
|
5
|
%
|
3
|
%
|
||||||||
|
Amortization of Intangibles
|
(13,291
|
)
|
(13,733
|
)
|
(3
|
)%
|
(6
|
)%
|
||||||||
|
Restructuring Charges (see Note 6)
|
(3,695
|
)
|
(1,787
|
)
|
||||||||||||
|
Contribution to Profit
|
$
|
22,099
|
$
|
14,822
|
49
|
%
|
56
|
%
|
||||||||
|
Contribution Margin
|
9.1
|
%
|
6.4
|
%
|
||||||||||||
| (a) |
Adjusted to exclude Restructuring Charges
|
Revenue:
Solutions revenue increased 5% to $244.1 million, or 3%, on a constant currency basis as compared with prior year, mainly driven by growth in Education Services (OPM) tuition revenue growth due to higher enrollments, partially offset by a decline in Corporate Learning (CrossKnowledge) where French government funding slowed for unemployment initiatives and blended learning programs.
Gross Profit:
Gross profit increased 9% to $201.4 million, or 7% on a constant currency basis as compared with prior year. The increase primarily reflected the impact of higher revenue.
A 240-basis-point improvement in gross profit margin was due to higher revenues and increased efficiency in recruiting Education Services (OPM) students, which resulted in lower recruitment costs.
Contribution to Profit:
Contribution to profit increased 49% to $22.1 million as compared with prior year. On a constant currency basis and excluding restructuring charges, contribution to profit increased 56%, primarily due to the improvement in gross profit partially offset by higher operating expenses, including higher advertising and marketing expenses of $6 million to support sales growth.
Education Services (OPM) Partners and Programs
As of April 30, 2018, we had 34 university partners and 239 programs under contract.
CORPORATE EXPENSES:
Corporate Expenses were $182.0 million and $186.6 million in fiscal year 2018 and 2017, respectively. On a constant currency basis and excluding restructuring charges and a one-time pension settlement charge in the prior year, these expenses decreased 2%, primarily due to the following:
| · |
lower technology costs of approximately $10 million driven by reduced spending on our ERP system and other reductions in depreciation, outsourcing, and systems development consulting costs; and
|
| · |
savings from operational excellence initiatives and restructuring activities;
|
partially offset by:
| · |
strategy consultation costs in the current year of $7.1 million; and
|
| |
one-time benefits in the prior year related to changes in our retiree and long-term disability plans of $4.2 million and a life insurance recovery of $2 million.
|
26
FISCAL YEAR 2017 SUMMARY RESULTS
Revenue:
Revenue for fiscal year 2017 of $1,718.5 million was consistent with fiscal year 2016, but was 2% higher on a constant currency basis. This increase was primarily due to the following:
| · |
the impact of the previously announced transition to time-based digital journal subscriptions for calendar year 2016 of $34 million;
|
| · |
higher Solutions revenue of $28 million;
|
| · |
incremental revenue from the acquisition of Atypon of $19 million; and
|
| · |
growth in author-funded access of $7 million and other journal revenue of $4 million.
|
These factors were partially offset by a decline in Publishing revenue of $48 million, mainly in print books and the impact of a large backfile sale in the prior year of $10 million.
As previously disclosed, we transitioned from issue-based to time-based journal subscription agreements for calendar year 2016. The transition to time-based digital journal subscription agreements shifted revenue from fiscal year 2016 to the remainder of calendar year 2016 (fiscal year 2017), which resulted in a favorable impact of approximately $34 million in fiscal year 2017. The change had no impact on cash flow from operations. We made these changes to simplify the contracting and administration of digital journal subscriptions.
Cost of Sales and Gross Profit:
Cost of Sales for fiscal year 2017 decreased 1% to $460.8 million, but increased 2% on a constant currency basis. This decrease was mainly driven by lower print book sales volume of $15 million and lower inventory costs due to cost savings initiatives and product mix of $5 million. These factors were partially offset by the following:
| · |
incremental costs associated with the Atypon acquisition of $8 million;
|
| · |
higher royalty costs due to the transition to time-based digital journal subscription agreements of $5 million and new journal titles of $4 million;
|
| · |
higher Solutions sales volume of $5 million;
|
| · |
higher Corporate Learning content development costs of $4 million;
|
| · |
and Online Program Management employment costs of $3 million to support business growth.
|
Gross Profit Margin for fiscal year 2017 increased 20 basis points to 73.2% mainly driven by product mix in Research, partially offset by higher Online Program Management and Corporate Learning costs to support business growth.
Operating and Administrative Expenses:
Operating and administrative expenses for fiscal year 2017 decreased 1% to $988.6 million, but increased 2% on a constant currency basis. This decrease was mainly driven by the following:
| · |
benefits related to changes in our retiree and long-term disability health plans of $4 million;
|
| · |
a life insurance recovery of $2 million in the current year and a disability settlement charge in the prior year of $2 million;
|
| · |
lower advertising costs of $7 million due to title and volume reductions and timing;
|
| · |
lower shipping and handling costs of $3 million;
|
| · |
a market gain on nonqualified pension plan assets of $2 million; and
|
| · |
restructuring and other cost savings.
|
The factors above were partially offset by the following:
| · |
incremental costs associated with the Atypon acquisition of $14 million;
|
| · |
a charge related to lump-sum payments offered to terminated vested employees within our U.S. defined benefit pension plans of $9 million;
|
| · |
spending for our Enterprise Resource Planning ("ERP") and related systems of $6 million and other technology, development and maintenance costs of $4 million;
|
| · |
increased headcount in Solutions of $4 million and Research of $3 million;
|
| · |
higher incentive compensation of $8 million; and
|
| · |
higher Solutions event promotional costs of $3 million.
|
27
Pension Plan Settlement:
We announced a voluntary, limited-time opportunity for terminated vested employees who are participants in the U.S. Employees' Retirement Plan of John Wiley & Sons, Inc. (the Pension Plan) to request early payment of their entire Pension Plan benefit in the form of a single lump sum payment. Eligible participants who wished to receive the lump sum payment were required to make an election by August 29, 2016. Approximately 780 eligible participants made the election to receive the lump sum, totaling $28 million which was paid from Pension Plan assets in October 2016. Settlement accounting rules were applied in the second quarter of fiscal year 2017, which resulted in a plan remeasurement and a recognition of a pro-rata portion of unamortized net actuarial loss of $9 million, which was recorded in Operating and Administrative Expenses in the Consolidated Statements of Income.
Restructuring and Related Charges:
Beginning in fiscal year 2013, we initiated a program (the "Restructuring and Reinvestment Program") to restructure and realign its cost base with current and anticipated future market conditions. We are targeting a majority of the cost savings achieved to improve margins and earnings, while the remainder will be reinvested in high-growth digital business opportunities.
In fiscal years 2017 and 2016, we recorded pre-tax restructuring charges of $13.4 million and $28.6 million, respectively, related to this program. These charges are reflected in Restructuring and Related Charges on the Consolidated Statements of Income and summarized in the following table:
|
2017
|
2016
|
|||||||
|
Charges by Segment:
|
||||||||
|
Research
|
$
|
1,949
|
$
|
2,982
|
||||
|
Publishing
|
1,596
|
4,507
|
||||||
|
Solutions
|
1,787
|
1,042
|
||||||
|
Corporate Expenses
|
8,023
|
20,080
|
||||||
|
Total Restructuring and Related Charges
|
$
|
13,355
|
$
|
28,611
|
||||
|
Charges by Activity:
|
||||||||
|
Severance
|
$
|
8,386
|
$
|
16,443
|
||||
|
Process reengineering consulting
|
148
|
7,191
|
||||||
|
Other activities
|
4,821
|
4,977
|
||||||
|
Total Restructuring and Related Charges
|
$
|
13,355
|
$
|
28,611
|
||||
Other Activities reflects leased facility consolidations, contract termination costs and the curtailment of certain defined benefit pension plans.
Amortization of Intangibles:
Amortization of intangibles for fiscal year 2017 was $49.7 million and consistent with the prior year period.
Interest Expense:
Interest expense for fiscal year 2017 increased $0.2 million to $16.9 million due to an increase in the average borrowing rate, partially offset by lower average debt balances outstanding.
Provision for Income Taxes:
The effective tax rate for fiscal year 2017 was 40.5%, compared to 16.6% in the prior year. The increase was due to the unfavorable German court decision described below. Excluding the expense related to that decision, the rate for fiscal year 2017 would have been 14.9%. The rate for fiscal year 2017, excluding the German court decision, was lower than the prior year's rate due to non-recurring foreign and domestic tax benefits and a favorable earnings mix, partially offset by the impact of non-cash deferred tax benefits related to legislation enacted in the U.K. In fiscal year 2016, the U.K. reduced its statutory rate to 19% beginning April 1, 2017, and 18% beginning April 1, 2020, and in fiscal year 2017, the U.K. further reduced its statutory rate beginning on April 1, 2020, from 18% to 17%. This resulted in a tax benefit from the re-measurement of our applicable U.K. deferred tax balances of $5.9 million in fiscal year 2016 and $2.6 million in fiscal year 2017.
28
Unfavorable German Court Decision
In fiscal year 2003, we reorganized several of our German subsidiaries into a new operating entity which enabled us to increase ("step-up") the tax deductible net asset basis in certain assets and claim additional tax amortization deductions over 15 years beginning that fiscal year.
In May 2012, as part of its routine tax audit process, the German tax authorities challenged our tax position. In September 2014, we filed an appeal with the local finance court. As required by German law, we paid all contested taxes and the related interest to avail ourselves of our right to defend our position. We made all required payments with cumulative total deposits of 56.6 million euros, including interest.
In October 2014, we received an unfavorable decision from the local finance court, which we appealed in January 2015 to the German Federal Fiscal Court. On September 26, 2016, we learned that the court denied our appeal and its tax position. No further appeals are available. As a result, we forfeited our deposit and incurred an income tax charge of $49 million. This one-time charge is included in our income tax expense for fiscal year 2017.
Earnings Per Share:
Earnings per diluted share for fiscal year 2017 was $1.95 per share, compared to $2.48 per share in the prior year. The decrease was mainly driven by the impact of the unfavorable German court tax decision described above ($0.85 per share), lower Publishing revenue, the impact of a large backfile sale in the prior year ($0.10 per share), a one-time charge related to the Pension Plan Settlement ($0.09 per share), lower non-cash deferred tax benefits related to changes in the U.K. corporate income tax rates ($0.06 per share), technology spending for our ERP and other related systems ($0.08 per share), and the unfavorable impact of foreign exchange translation ($0.04 per share).
Partially offsetting the decreases were the impact of the transition to time-based digital journal subscription agreements ($0.38 per share), lower restructuring charges in the current year ($0.17 per share), one-time tax benefits ($0.12 per share), and favorable employment cost reductions. The favorable employment cost reductions include the benefit for changes in our retiree and long-term disability health plans ($0.07 per share), a life insurance recovery in the current year ($0.02 per share) and a disability settlement charge in the prior year ($0.03 per share).
SEGMENT OPERATING RESULTS:
Effective August 1, 2016, we completed a number of changes to our organizational structure that resulted in a change in how we manage our businesses, allocate resources, and measure performance. As a result, we revised our segments into three new reporting segments to reflect how management currently reviews financial information and makes operating decisions. All prior period amounts have been restated to reflect the new reporting segment structure. The new reporting structure consists of Research (Journals and related content and services), Publishing (Books and related content, Course Workflow, and Test Preparation), and Solutions (Online Program Management, Corporate Learning, and Professional Assessment).
29
|
2017
|
2016
|
% Change
|
% Change
w/o FX (a)
|
|||||||||||||
|
RESEARCH:
|
||||||||||||||||
|
Revenue:
|
||||||||||||||||
|
Journal Subscriptions
|
$
|
639,720
|
$
|
622,305
|
3
|
%
|
6
|
%
|
||||||||
|
Open Access
|
30,633
|
25,671
|
19
|
%
|
26
|
%
|
||||||||||
|
Licensing, Reprints, Backfiles, and Other
|
164,070
|
178,802
|
(8
|
)%
|
(3
|
)%
|
||||||||||
|
Total Journal Revenue
|
$
|
834,423
|
$
|
826,778
|
1
|
%
|
4
|
%
|
||||||||
|
Publishing Technology Services (Atypon)
|
19,066
|
—
|
||||||||||||||
|
Total Research Revenue
|
$
|
853,489
|
$
|
826,778
|
3
|
%
|
7
|
%
|
||||||||
|
Cost of Sales
|
(219,773
|
)
|
(214,972
|
)
|
2
|
%
|
6
|
%
|
||||||||
|
Gross Profit
|
$
|
633,716
|
$
|
611,806
|
4
|
%
|
7
|
%
|
||||||||
|
Gross Profit Margin
|
74.3
|
%
|
74.0
|
%
|
||||||||||||
|
Operating Expenses
|
(353,406
|
)
|
(331,989
|
)
|
6
|
%
|
10
|
%
|
||||||||
|
Amortization of Intangibles
|
(26,133
|
)
|
(24,725
|
)
|
6
|
%
|
13
|
%
|
||||||||
|
Restructuring Charges (See Note 6)
|
(1,949
|
)
|
(2,982
|
)
|
||||||||||||
|
Contribution to Profit
|
$
|
252,228
|
$
|
252,110
|
—
|
2
|
%
|
|||||||||
|
Contribution Margin
|
29.6
|
%
|
30.5
|
%
|
||||||||||||
| (a) |
Adjusted to exclude the fiscal year 2017 and 2016 Restructuring Charges
|
Revenue:
Research revenue for fiscal year 2017 increased 3% to $853.5 million, or 7% on a constant currency basis. This increase was mainly driven by the following:
| · |
Journal Subscriptions revenue of $35 million due to the transition to time-based digital journal subscription agreements from issue-based;
|
| · |
incremental revenue from the acquisition of Atypon of $19 million; and
|
| · |
Author-Funded Access revenue growth of $7 million, reflecting new titles and increased business as well as growth associated with the Journal of American Heart Association.
|
These factors were partially offset by a decline in Licensing, Reprints, Backfiles, and Other of $6 million, primarily due to a large backfile sale in the prior year.
Excluding the transition to time-based revenue and the impact of foreign exchange, journal subscription revenue was consistent with the prior period. As of April 30, 2017, calendar year 2017 journal subscription renewals were 1% higher than calendar year 2016 on a currency neutral basis, with approximately 97% of targeted business under contract.
Platform Services includes publishing-software and services that enable scholarly and professional societies and publishers to deliver, host, enhance, market and manage their content on the web. In addition to providing its customers with dedicated technology resources, Atypon provides subscription licenses to its platform, Literatum, through contracts over one to five years in duration. Revenue is recognized evenly over the subscription period.
Cost of Sales:
Cost of Sales for fiscal year 2017 increased 2% to $219.8 million, or 6% on a constant currency basis. The increase was mainly driven by the following:
| · |
incremental costs associated with the Atypon acquisition of $8 million;
|
| · |
higher royalty costs due to the transition to time-based digital journal subscription agreements of $5 million; and
|
| · |
society title growth of $4 million.
|
These factors were partially offset by lower inventory costs due to print run efficiency initiatives and increased digital products of $2 million and unfavorable product mix.
30
Gross Profit:
Gross Profit Margin increased 30 basis points to 74.3% in fiscal year 2017 due to favorable foreign exchange translation (20 basis points), lower journal production costs, and product mix.
Contribution to Profit:
Contribution to Profit for fiscal year 2017 of $252.2 million was flat with the prior year, but increased 2% on a constant currency basis and excluding Restructuring Charges. This increase was primarily due to the increase in revenue discussed above, partially offset by increased operating expenses. The increase in operating expenses was mainly driven by the following:
| · |
incremental costs associated with the Atypon acquisition of $10 million;
|
| · |
higher content-related costs to support business growth of $4 million; and
|
| · |
higher employment costs of $3 million, mainly higher incentive compensation and increased headcount.
|
Amortization of Intangibles in fiscal year 2017 increased 6% to $26.1 million, or 13% on a constant currency basis due to acquired publication rights of $2 million and the Atypon acquisition of $1 million.
Contribution to Profit Margin was 29.6%, compared to 30.5% in the prior year period.
Society Partnerships
For calendar year 2017, 6 new society contracts were signed, with combined annual revenue of approximately $9 million, and 15 society contracts were not renewed, with combined annual revenue of approximately $9 million.
Atypon Acquisition
On September 30, 2016, we acquired the net assets of Atypon, a Silicon Valley-based publishing-software company, for approximately $121 million in cash, net of cash acquired. Atypon is a publishing-software and service provider that enables scholarly and professional societies and publishers to deliver, host, enhance, market, and manage their content on the web. Atypon is headquartered in Santa Clara, CA, with approximately 260 employees in the U.S. and EMEA. Atypon provides services through Literatum, an innovative platform that primarily serves the scientific, technical, medical, and scholarly industry. This software gives publishers direct control over how their content is displayed, promoted, and monetized on the web. Atypon generated over $31 million in calendar year 2015 revenue. Literatum hosts nearly 9,000 journals, 13 million journal articles, and more than 1,800 publication Web sites for over 1,500 societies and publishers, accounting for a third of the world's English-language scholarly journal articles.
|
PUBLISHING:
|
2017
|
2016
|
% Change
|
% Change
w/o FX (a)
|
||||||||||||
|
Revenue:
|
||||||||||||||||
|
STM and Professional Publishing
|
$
|
291,255
|
$
|
330,984
|
(12
|
)%
|
(9
|
)%
|
||||||||
|
Education Publishing
|
196,343
|
229,989
|
(15
|
)%
|
(13
|
)%
|
||||||||||
|
Course Workflow (WileyPLUS)
|
62,348
|
58,519
|
7
|
%
|
7
|
%
|
||||||||||
|
Test Preparation and Certification
|
35,609
|
28,115
|
27
|
%
|
27
|
%
|
||||||||||
|
Licensing, Distribution, Advertising, and Other
|
47,894
|
48,121
|
—
|
3
|
%
|
|||||||||||
|
Total Publishing Revenue
|
$
|
633,449
|
$
|
695,728
|
(9
|
)%
|
(7
|
)%
|
||||||||
|
Cost of Sales
|
(194,837
|
)
|
(215,150
|
)
|
(9
|
)%
|
(7
|
)%
|
||||||||
|
Gross Profit
|
$
|
438,612
|
$
|
480,578
|
(9
|
)%
|
(7
|
)%
|
||||||||
|
Gross Profit Margin
|
69.2
|
%
|
69.1
|
%
|
||||||||||||
|
Operating Expenses
|
(301,510
|
)
|
(338,675
|
)
|
(11
|
)%
|
(10
|
)%
|
||||||||
|
Amortization of Intangibles
|
(9,803
|
)
|
(11,338
|
)
|
(14
|
)%
|
(10
|
)%
|
||||||||
|
Restructuring Charges (see Note 6)
|
(1,596
|
)
|
(4,507
|
)
|
||||||||||||
|
Contribution to Profit
|
$
|
125,703
|
$
|
126,058
|
—
|
—
|
||||||||||
|
Contribution Margin
|
19.8
|
%
|
18.1
|
%
|
||||||||||||
| (a) |
Adjusted to exclude the fiscal year 2017 and 2016 Restructuring Charges
|
31
Revenue:
Publishing revenue for fiscal year 2017 decreased 9% to $633.4 million, or 7% on a constant currency basis. This decline was driven by lower sales of STM and Professional Publishing of $40 million and Education Publishing of $34 million, and partially offset by growth in Course Workflow (WileyPlus) of $4 million, Test Preparation and Certification of $8 million, and Licensing, Distribution, Advertising and Other of $2 million.
The decline in Books and Reference Materials was mainly driven by softness in the book market, title reductions, and the impact of a large digital book sale in the prior year of $4 million. Education books continue to be impacted by rental and other market forces, while STM and Professional Books also saw a continued decline in demand for print books. Growth in Course Workflow (WileyPLUS) reflected continued focus on digital course workflow with particular growth in accounting courses. Online Test Preparation and Certification growth was mainly driven by proprietary sales of our new college entrance examination ACT test preparation products and other professional test certification products. Licensing, Distribution, Advertising, and Other growth was principally driven by licensing of intellectual property rights.
Cost of Sales:
Cost of Sales for fiscal year 2017 decreased 9% to $194.8 million, or 7% on a constant currency basis reflecting the decline in lower sales volume.
Gross Profit:
Gross Profit Margin was 69.2% in fiscal year 2017 and consistent with the prior year period.
Contribution to Profit:
Contribution to Profit was $125.7 million in fiscal year 2017 and flat with the prior year period, both on a reported and constant currency basis and excluding Restructuring Charges. Lower print book revenue was offset by operational efficiencies and restructuring and other cost savings. Contribution Profit Margin was 19.8%, compared to 18.1% in the prior year
|
2017
|
2016
|
% Change
|
% Change
w/o FX (a)
|
|||||||||||||
|
SOLUTIONS:
|
||||||||||||||||
|
Revenue:
|
||||||||||||||||
|
Education Services (OPM)
|
$
|
111,638
|
$
|
96,469
|
16
|
%
|
16
|
%
|
||||||||
|
Professional Assessment
|
59,868
|
57,370
|
4
|
%
|
5
|
%
|
||||||||||
|
Corporate Learning
|
60,086
|
50,692
|
19
|
%
|
20
|
%
|
||||||||||
|
Total Solutions Revenue
|
$
|
231,592
|
$
|
204,531
|
13
|
%
|
14
|
%
|
||||||||
|
Cost of Sales
|
(46,146
|
)
|
(36,055
|
)
|
28
|
%
|
29
|
%
|
||||||||
|
Gross Profit
|
$
|
185,446
|
$
|
168,476
|
10
|
%
|
10
|
%
|
||||||||
|
Gross Profit Margin
|
80.1
|
%
|
82.4
|
%
|
||||||||||||
|
Operating Expenses
|
(155,104
|
)
|
(149,741
|
)
|
4
|
%
|
4
|
%
|
||||||||
|
Amortization of Intangibles
|
(13,733
|
)
|
(13,701
|
)
|
—
|
1
|
%
|
|||||||||
|
Restructuring Charges (see Note 6)
|
(1,787
|
)
|
(1,042
|
)
|
||||||||||||
|
Contribution to Profit
|
$
|
14,822
|
$
|
3,992
|
271
|
%
|
224
|
%
|
||||||||
|
Contribution Margin
|
6.4
|
%
|
2.0
|
%
|
||||||||||||
| (a) |
Adjusted to exclude the fiscal year 2017 and 2016 Restructuring Charges
|
Revenue:
Solutions revenue for fiscal year 2017 increased 13% to $231.6 million, or 14% on a constant currency basis.
32
Growth in Education Services (OPM) of $15 million primarily reflects the impact of increased partners new revenue generating programs, higher enrollments and other related service revenue. As of April 30, 2017, Wiley had 39 university partners and 250 degree programs under contract compared to 38 university partners and 226 degree programs as of April 30, 2016. During fiscal year 2017, Wiley signed several new partners, including George Mason University, Seton Hall University, St. John's University, and the Vlerick Business School in Belgium.
Professional Assessment revenue growth of $3 million was driven by increased post-hire assessment and retail revenue of $4 million, partially offset by a decline in pre-hire assessment revenue of $1 million following portfolio actions to optimize longer-term profitable growth.
The increase in Corporate Learning of $9 million reflected growth from existing customers in the core e-learning business, primarily in Europe.
Cost of Sales:
Cost of Sales for fiscal year 2017 increased 28% to $46.1 million, or 29% on a constant currency basis. This increase was mainly due to higher sales volume of $5 million, higher employment costs in Education Services (OPM) of $3 million, and higher content development costs in Corporate Learning of $4 million to support business growth. These factors were partially offset by restructuring and other cost savings.
Gross Profit:
Gross Profit Margin for fiscal year 2017 declined 230 basis points to 80.1%, principally due to higher content and employment costs to support new business growth in Corporate Learning and Education Services (OPM).
Contribution to Profit:
Contribution to Profit was $14.8 million in fiscal year 2017, compared with $4.0 million in the prior year. The improvement was mainly driven by revenue growth in all areas, partially offset by operating costs incurred to support new business growth in Education Services (OPM) and Corporate Learning. Contribution Margin was 6.4%, compared to 2.0% in the prior year period.
Ranku acquisition:
In September 2016, Wiley acquired Ranku, a recruitment technology and predictive analytics software company for universities, community colleges, and state systems, for $5 million. Ranku has been a partner to more than 1,000 online degree programs at the undergraduate and graduate level. Ranku also offers tech-enabled reporting that helps universities forecast what curriculum to develop based on real-time consumer demand and the needs of the labor market. Ranku plays a critical role in supporting enrollment growth and market research at its partner institutions.
CORPORATE EXPENSES:
Corporate Expenses were $186.6 million and $194.0 million in fiscal year 2017 and 2016, respectively. Excluding restructuring charges and a one-time pension settlement charge in fiscal 2017, these expenses decreased 2%, primarily due to one-time benefits in fiscal 2017 related to changes in our retiree and long-term disability plans of $4 million, a life insurance recovery of $2 million, savings from operational excellence initiatives and restructuring activities.
FISCAL YEAR 2019 OUTLOOK
|
Metric (amounts in millions, except EPS)
|
FY18 Actual
|
FY19 Expectation
Constant Currency
|
|||
|
Revenue
|
$
|
1,796.1
|
Even with prior year
|
||
|
Adjusted EPS
|
$
|
3.43
|
Mid-single digit decline
|
||
|
Cash Provided by Operating Activities
|
$
|
381.8
|
High-single digit decline
|
||
|
Capital Expenditures
|
$
|
150.7
|
Modestly lower
|
||
| · |
Wiley anticipates low-single digit revenue growth in Research and Solutions offset by a low-single digit revenue decline in Publishing.
|
| · |
Adjusted EPS is expected to decline primarily due to increased investment in revenue growth initiatives, particularly in Research and Education Services.
|
| · |
Cash Provided by Operating Activities reflects the impact of growth investments and substantially lower gains in working capital.
|
| · |
Capital Expenditures are expected to decline modestly with the completion of our headquarters transformation. Increased investment is expected in areas of product development and business optimization.
|
33
LIQUIDITY AND CAPITAL RESOURCES:
Principal Sources of Liquidity
We believe that our operating cash flow, together with our revolving credit facilities and other available debt financing, will be adequate to meet our operating, investing, and financing needs in the foreseeable future, although there can be no assurance that continued or increased volatility in the global capital and credit markets will not impair our ability to access these markets on terms commercially acceptable. We do not have any off-balance-sheet debt.
As of April 30, 2018, we had cash and cash equivalents of $169.8 million, of which approximately $147.9 million, or 87% was located outside the U.S. Maintenance of these cash and cash equivalent balances outside the U.S. does not have a material impact on the liquidity or capital resources of our operations. Notwithstanding the Tax Act which generally eliminated federal income tax on future cash repatriation to the U.S., cash repatriation may be subject to state and local taxes or withholding or similar taxes. We no longer intend to permanently reinvest cash outside the U.S. As described in Note 11, "Income Taxes," of the Notes to the Consolidated Financial Statements, we accrued a provisional $2.0 million related to reversing our permanent reinvestment assertion related to estimated taxes from repatriating earnings and $0.1 million for state taxes related to the Tax Act, in addition to using foreign tax credits to offset a provisional deemed repatriation tax of $14.2 million. Other than the above accruals, we have no additional accrued liability for U.S. income tax on the repatriation of non-U.S. earnings and estimate that if such earnings were repatriated, the U.S. income tax liability would not be material to our consolidated financial position or results of operations.
As of April 30, 2018, we had approximately $360.0 million of debt outstanding and approximately $742.8 million of unused borrowing capacity under our Revolving Credit and other facilities.
Contractual Obligations and Commercial Commitments
A summary of contractual obligations and commercial commitments, excluding unrecognized tax benefits further described in Note 11, "Income Taxes," of the Notes to the Consolidated Financial Statements, as of April 30, 2018 is as follows:
|
Payments Due by Period
|
||||||||||||||||||||
|
Total
|
Within
Year 1
|
2–3
Years
|
4–5
Years
|
After 5
Years
|
||||||||||||||||
|
Total Debt
|
$
|
360.0
|
$
|
—
|
$
|
360.0
|
$
|
—
|
$
|
—
|
||||||||||
|
Interest on Debt (1)
|
27.7
|
7.9
|
19.8
|
—
|
—
|
|||||||||||||||
|
Non-Cancelable Leases
|
259.3
|
31.2
|
54.4
|
37.2
|
136.5
|
|||||||||||||||
|
Minimum Royalty Obligations
|
531.8
|
97.3
|
166.2
|
124.7
|
143.6
|
|||||||||||||||
|
Other Operating Commitments
|
47.9
|
36.3
|
11.2
|
0.4
|
—
|
|||||||||||||||
|
Total
|
$
|
1,226.7
|
$
|
172.7
|
$
|
611.6
|
$
|
162.3
|
$
|
280.1
|
||||||||||
| (1) |
Interest on Debt includes the effect of our interest rate swap agreements and the estimated future interest payments on our unhedged variable rate debt, assuming that the interest rates as of April 30, 2018 remain constant until the maturity of the debt
|
Analysis of Historical Cash Flow
The following table shows the changes in our Consolidated Statement of Cash Flows in the fiscal years ended April 30, 2018, 2017 and 2016.
|
Year Ended April 30,
|
||||||||||||
|
2018
|
2017
|
2016
|
||||||||||
|
Net Cash Provided by Operating Activities
|
$
|
381,838
|
$
|
314,903
|
$
|
349,957
|
||||||
|
Net Cash Used in Investing Activities
|
(177,411
|
)
|
(243,010
|
)
|
(151,395
|
)
|
||||||
|
Net Cash Used in Financing Activities
|
(96,831
|
)
|
(346,172
|
)
|
(285,663
|
)
|
||||||
|
Effect of Foreign Currency Exchange Rate Changes on Cash and Cash Equivalents
|
3,661
|
(31,011
|
)
|
(6,534
|
)
|
|||||||
34
Free Cash Flow less Product Development Spending helps assess our ability, over the long term, to create value for our shareholders, as it represents cash available to repay debt, pay common dividends, and fund share repurchases and new acquisitions. Below are the details of Free Cash Flow less Product Development Spending for the fiscal years ended April 30, 2018, 2017, and 2016:
|
Year Ended April 30,
|
||||||||||||
|
2018
|
2017
|
2016
|
||||||||||
|
Net Cash Provided by Operating Activities
|
$
|
381,838
|
$
|
314,903
|
$
|
349,957
|
||||||
|
Less: Additions to Technology, Property, and Equipment
|
(114,225
|
)
|
(105,058
|
)
|
(86,399
|
)
|
||||||
|
Less: Product Development Spending
|
(36,503
|
)
|
(43,603
|
)
|
(44,578
|
)
|
||||||
|
Free Cash Flow less Product Development Spending
|
$
|
231,110
|
$
|
166,242
|
$
|
218,980
|
||||||
Net Cash Provided by Operating Activities
2018 compared to 2017
Net Cash Provided by Operating Activities in fiscal year 2018 increased $66.9 million from fiscal year 2017 to $381.8 million. This was primarily due to:
| · |
a $40.7 million favorable impact on accounts payable from the timing of vendor payments;
|
| · |
a $12.1 million favorable impact from lower employee retirement plan contributions; and
|
| · |
a $15.7 million favorable impact on accounts receivable from the timing of customer payments.
|
The factors above were partially offset by a $15.0 million unfavorable impact from higher taxes paid in fiscal 2018 as compared with prior year.
Our negative working capital was $394.3 million and $428.1 million as of April 30, 2018, and April 30, 2017, respectively. The primary driver of the negative working capital is unearned deferred revenue related to subscriptions for which cash has been collected in advance. Cash received in advance for subscriptions is used by us for a number of purposes, including funding operating activities, acquisitions, debt repayments, dividend payments, and repurchasing treasury shares. The deferred revenue will be recognized as income when the products are shipped or made available online to the customers over the term of the subscription period. Current liabilities as of April 30, 2018 include $486.4 million of such deferred subscription revenue for which cash was collected in advance.
The $33.8 million change in working capital was primarily due to the seasonality of our businesses and the impact from the changes in accounts receivable and accounts payable discussed above. For fiscal year 2019, working capital performance from accounts receivable and accounts payable is expected to be in line with fiscal year 2018.
2017 compared to 2016
Net Cash Provided by Operating Activities in fiscal year 2017 decreased $35.1 million from fiscal year 2016, to $314.9 million, principally due to lower accounts and royalties payable of $24 million due to the timing of vendor payments, higher accounts receivable of $15 million due to the timing of customer payments, higher incentive compensation payments of $5 million, and higher employee retirement plan contributions of $5 million. These factors were partially offset by lower payments related to our restructuring programs of $7 million, lower income tax payments of $5 million, and other working capital changes.
Net Cash Used in Investing Activities
2018 compared to 2017
Net Cash Used in Investing Activities in fiscal year 2018 was $177.4 million, compared to $243.0 million in the prior year. The decrease in net cash used in investing activities in fiscal year 2018 was primarily due to:
| · |
our investment in fiscal year 2017 in acquisitions of $125.9 million compared to no investments in fiscal year 2018. Fiscal year 2017 includes cash used for the acquisitions of Atypon ($121 million) and Ranku ($5 million), net of cash acquired;
|
partially offset by:
| · |
$60.4 million in proceeds we received in fiscal year 2017 related to the settlement of a foreign exchange forward contract that was entered into in fiscal year 2016 to manage foreign currency exposures on intercompany loans.
|
Projected capital spending for Technology, Property, and Equipment and Product Development Spending for fiscal year 2018 is forecast to be approximately $100 million and $35 million, respectively. Projected spending for author advances, which is classified as an operating activity, is forecast to be approximately $127 million for fiscal year 2018.
35
2017 compared to 2016
Net Cash Used in Investing Activities in fiscal year 2017 was $243.0 million, compared to $151.4 million in the prior year. In fiscal year 2017, we invested $125.9 million in acquisitions, compared to none in the prior year. Fiscal year 2017 includes the acquisitions of Atypon ($121 million) and Ranku ($5 million), net of cash acquired. Other acquisitions in both periods reflect the acquisition of publication rights for society journals.
Product Development Spending was $43.6 million in fiscal year 2017, compared to $44.6 million in the prior year. Cash used for technology, property and equipment was $105.1 million in fiscal year 2017, compared to $86.4 million in the prior year. The increase mainly reflects capital spending related to the renovation of our headquarters ($21 million) and increased spending on ERP and related systems ($1 million), partially offset by lower capital spending on other computer software ($9 million).
In fiscal year 2017, we received $60.4 million in proceeds related to the settlement of a foreign exchange forward contract that was entered into in fiscal year 2016 to manage foreign currency exposures on intercompany loans. Prior to its settlement, the notional amount of the foreign exchange forward contract was 274 million pounds sterling.
As discussed in more detail in Note 11, "Income Taxes," of the Notes to the Consolidated Financial Statements, in fiscal year 2017, we received an unfavorable decision from the German Federal Fiscal Court that resulted in the forfeiture of cumulative deposits made by us to German tax authorities of approximately 56.6 million euros (approximately $61.7 million). The deposits were included in the Income Tax Deposits line item on the Consolidated Statements of Financial Position and are no longer reimbursable to us.
Net Cash Used in Financing Activities
2018 compared to 2017
Net Cash Used in Financing Activities was $96.8 million in fiscal year 2018 compared to $346.2 million in fiscal year 2017. This decrease in cash used was due to lower net debt repayments in fiscal year 2018. Net debt repayments in fiscal year 2018 were $8.6 million compared to $240.0 million in the prior year.
During fiscal year 2018, we repurchased 713,177 shares of common stock at an average price of $55.65, compared to 953,188 shares at an average price of $52.80 in the prior year. As of April 30, 2018, we had authorization from our Board of Directors to purchase up to 3,080,471 additional shares.
2017 compared to 2016
Net Cash Used in Financing Activities was $346.2 million in fiscal year 2017, compared to $285.7 million in the prior year. During fiscal year 2017, net debt repayments were $240.0 million compared to $145.1 million in the prior year. Our net debt (debt less cash and cash equivalents) increased $65.3 million from the prior year to $306.5 million.
During fiscal year 2017, we repurchased 953,188 shares of common stock at an average price of $52.80, compared to 1,432,284 shares at an average price of $48.86 in the prior year. As of April 30, 2017, we had authorization from our Board of Directors to purchase up to 3,793,648 additional shares. In fiscal year 2017, we increased our quarterly dividend to shareholders by 3% to $0.31 per share, versus $0.30 per share in the prior year. Higher proceeds from the exercise of stock options mainly reflected a higher volume of stock option exercises in fiscal year 2017 compared to the prior year.
RECENTLY ISSUED STATEMENTS OF FINANCIAL ACCOUNTING STANDARDS, ACCOUNTING GUIDANCE, AND DISCLOSURE REQUIREMENTS
We are subject to numerous recently issued statements of financial accounting standards, accounting guidance, and disclosure requirements. The information set forth in Note 2, "Summary of Significant Accounting Policies, Recently Issued and Recently Adopted Accounting Standards," of the Notes to Consolidated Financial Statements of this Form 10-K is incorporated by reference, and describes these new accounting standards.
CRITICAL ACCOUNTING POLICIES AND ESTIMATES:
The preparation of our Consolidated Financial Statements and related disclosures in conformity with U.S. GAAP requires our management to make estimates and assumptions that affect the reported amounts of assets and liabilities, the disclosure of contingent assets and liabilities as of the date of the financial statements and revenue and expenses during the reporting period. These estimates include, among other items, assessing the collectability of receivables, the use and recoverability of inventory, assumptions used in the calculation of income taxes, useful lives and recoverability of tangible assets and goodwill and other intangible assets, assumptions used in our defined benefit pension plans and other post-employment benefit plans, costs for incentive compensation, and accruals for commitments and contingencies. We review these estimates and assumptions periodically using historical experience and other factors and reflect the effects of any revisions on the Consolidated Financial Statements in the period we determine any revisions to be necessary. Actual results could differ from those estimates, which could affect the reported results. Note 2, "Summary of Significant Accounting Policies, Recently Issued and Recently Adopted Accounting Standards" of the "Notes to Consolidated Financial Statements" includes a summary of the significant accounting policies and methods used in preparation of our Consolidated Financial Statements. Set forth below is a discussion of our more critical accounting policies and methods.
36
Revenue Recognition: We recognize revenue when the following criteria are met: persuasive evidence that an arrangement exists; delivery has occurred, or services have been rendered, the price to the customer is fixed or determinable; and collectability is reasonably assured. If all of the above criteria have been met, revenue is recognized upon shipment of products or when services have been rendered. Revenue related to journal subscriptions and other products and services that is generally collected in advance is deferred and recognized as earned over the term of the subscription, when the related issue is shipped or made available online, or the service is rendered, in accordance with contractual terms. Collectability is evaluated based on the amount involved, the credit history of the customer, and the status of the customer's account with us.
We transitioned from issue-based to time-based digital journal subscription agreements starting in calendar year 2016. Under this new model, we provide access to all journal content published within a calendar year and recognize revenue on a straight-line basis over the calendar year. Under our previous licensing model, a customer subscribed to a discrete number of online journal issues and revenue was recognized as each issue was made available online. We made these changes to simplify the contracting and administration of our digital journal subscriptions.
When a product is sold with multiple deliverables, we account for each deliverable within the arrangement as a separate unit of accounting due to the fact that each deliverable is also sold on a stand-alone basis. The total consideration of a multiple-element arrangement is allocated to each unit of accounting based on the price charged by us when it is sold separately. Our multiple deliverable arrangements principally include WileyPLUS, an online course management tool that includes a complete print or digital textbook for the course, negotiated licenses for bundles of digital content available on Wiley Online Library, the online publishing platform for our Research business, and test preparation, assessment, certification and training services which can include bundles of print and digital content and online workflow solutions. In March 2018, we migrated our Wiley Online Library platform to Atypon's Literatum platform, which we acquired in fiscal year 2017.
We enter into contracts for the resale of our content through a third party where we are not the primary obligor of the arrangement because we are not responsible for fulfilling the customer's order, handling customer requests or claims, and/or maintaining credit risk. We recognize revenue for the sale of our content, net of any commission owed to the third-party seller, or taxes, which are remitted to government authorities.
In May 2014, the Financial Accounting Standards Board (the "FASB") issued ASU 2014-09 "Revenue from Contracts with Customers" (Topic 606) ("ASU 2014-09"), which supersedes most existing revenue recognition guidance. We adopted ASU 2014-09 on May 1, 2018. See Note 2, "Summary of Significant Accounting Policies, Recently Issued and Recently Adopted Accounting Standards," of the Notes to Consolidated Financial Statements, under the caption "Recently Adopted Accounting Standards" for details of our adoption of ASU 2014-09.
Allowance for Doubtful Accounts: The estimated allowance for doubtful accounts is based on a review of the aging of the accounts receivable balances, historical write-off experience, credit evaluations of customers, and current market conditions. A change in the evaluation of a customer's credit could affect the estimated allowance. The allowance for doubtful accounts is shown as a reduction of Accounts Receivable on the Consolidated Statements of Financial Position and amounted to $10.1 million and $7.2 million as of April 30, 2018 and 2017, respectively.
Sales Return Reserves: The process that we use to determine our sales returns and the related reserve provision charged against revenue is based on applying an estimated return rate to current year returnable print book sales. This rate is based upon an analysis of actual historical return experience in the various markets and geographic regions in which we do business. We collect, maintain, and analyze significant amounts of sales returns data for large volumes of homogeneous transactions. This allows us to make reasonable estimates of the amount of future returns. All available data is utilized to identify the returns by market and as to which fiscal year the sales returns apply. This enables management to track the returns in detail and identify and react to trends occurring in the marketplace, with the objective of being able to make the most informed judgments possible in setting reserve rates. Associated with the estimated sales return reserves, we also include a related reduction in inventory and royalty costs as a result of the expected returns. Net print book sales return reserves amounted to $18.6 million and $24.3 million as of April 30, 2018 and 2017, respectively.
37
The reserves are reflected in the following accounts of the Consolidated Statements of Financial Position – (decrease) increase as of April 30:
|
2018
|
2017
|
|||||||
|
Accounts Receivable
|
$
|
(28,302
|
)
|
$
|
(34,769
|
)
|
||
|
Inventories
|
$
|
4,626
|
$
|
4,727
|
||||
|
Royalties Payable
|
$
|
(5,048
|
)
|
$
|
(5,741
|
)
|
||
|
Decrease in Net Assets
|
$
|
(18,628
|
)
|
$
|
(24,300
|
)
|
||
A one percent change in the estimated sales return rate could affect net income by approximately $1.6 million. A change in the pattern or trends in returns could affect the estimated allowance.
Reserve for Inventory Obsolescence: A reserve for inventory obsolescence is estimated based on a review of damaged, obsolete, or otherwise unsalable inventory. The review encompasses historical unit sales trends by title, current market conditions, including estimates of customer demand compared to the number of units currently on hand, and publication revision cycles. The inventory obsolescence reserve is reported as a reduction of the Inventories balance on the Consolidated Statements of Financial Position and amounted to $18.2 million and $21.1 million as of April 30, 2018 and 2017, respectively.
Allocation of Acquisition Purchase Price to Assets Acquired and Liabilities Assumed: In connection with acquisitions, we allocate the cost of the acquisition to the assets acquired and the liabilities assumed based on the estimates of fair value for such items, including intangible assets and technology acquired. Such estimates include discounted estimated cash flows to be generated by those assets and the expected useful lives based on historical experience, current market trends, and synergies to be achieved from the acquisition and the expected tax basis of assets acquired. We may use a third-party valuation consultant to assist in the determination of such estimates.
Goodwill and Indefinite-lived Intangible Assets: Goodwill is reviewed for possible impairment at least annually on a reporting unit level during the fourth quarter of each year. A review of goodwill may be initiated before or after conducting the annual analysis if events or changes in circumstances indicate the carrying value of goodwill may no longer be recoverable.
A reporting unit is the operating segment unless, at businesses one level below that operating segment– the "component" level–discrete financial information is prepared and regularly reviewed by management, and the component has economic characteristics that are different from the economic characteristics of the other components of the operating segment, in which case the component is the reporting unit.
As part of the annual impairment test, we may conduct an assessment of qualitative factors to determine whether it is more likely than not that the fair value of a reporting unit is less than its carrying amount. In a qualitative assessment, we would consider the macroeconomic conditions, including any deterioration of general conditions and industry and market conditions, including any deterioration in the environment where the reporting unit operates, increased competition, changes in the products/services and regulatory and political developments, cost of doing business, overall financial performance, including any declining cash flows and performance in relation to planned revenues and earnings in past periods, other relevant reporting unit specific facts, such as changes in management or key personnel or pending litigation, and events affecting the reporting unit, including changes in the carrying value of net assets.
If an optional qualitative goodwill impairment assessment is not performed, we are required to determine the fair value of each reporting unit using the two-step process. In step one, we compare the fair value of each of our reporting units with goodwill to its carrying value, including the goodwill allocated to the reporting unit. If the fair value of the reporting unit exceeds its carrying value, there is no indication of impairment and no further testing is required. If the fair value of the reporting unit is less than the carrying value, we must perform step two of the impairment test to measure the amount of impairment loss, if any. In step two, the reporting unit's fair value is allocated to all of the assets and liabilities of the reporting unit, including any unrecognized intangible assets, in a hypothetical analysis that calculates the implied fair value of goodwill in the same manner as if the reporting unit were being acquired in a business combination. If the implied fair value of the reporting unit's goodwill is less than the carrying value, the difference is recorded as an impairment loss.
We use a fair value approach to test goodwill for impairment. We must recognize a non-cash impairment charge for the amount, if any, by which the carrying amount of goodwill exceeds its implied fair value. We derive an estimate of fair values for each of our reporting units using a combination of an income approach and a market approach, each based on an applicable weighting. We assess the applicable weighting based on such factors as current market conditions and the quality and reliability of the data. Absent an indication of fair value from a potential buyer or similar specific transactions, we believe that the use of these methods provides a reasonable estimate of a reporting unit's fair value.
38
Fair value computed by these methods is arrived at using a number of factors, including projected future operating results, anticipated future cash flows, effective income tax rates, comparable marketplace data within a consistent industry grouping, and the cost of capital. There are inherent uncertainties, however, related to these factors and to our judgment in applying them to this analysis. Nonetheless, we believe that the combination of these methods provides a reasonable approach to estimate the fair value of our reporting units. Assumptions for sales, net earnings, and cash flows for each reporting unit were consistent among these methods.
Annual Goodwill Impairment Test
During the third quarter of 2018, we completed step one of our annual goodwill impairment test for our reporting units. We concluded that the fair values of these reporting units were above their carrying values and, therefore, there was no indication of impairment.
During the fourth quarter of 2018, we voluntarily changed our annual impairment assessment date from January 31 to February 1 for all of our reporting units and our indefinite-lived intangible assets. This change is being made to improve alignment of impairment testing procedures with year-end financial reporting, our annual business planning and budgeting process and the multi-year strategic forecast, which begins in the fourth quarter of each year. As a result, the goodwill and indefinite-lived intangible asset impairment testing will reflect the result of inputs from each of the businesses in the development of the budget and forecast process, including the impact of seasonality of our financial results. Accordingly, management considers this accounting change preferable. This change does not accelerate, delay, avoid, or cause an impairment charge, nor does this change result in adjustments to previously issued financial statements.
In connection with the change in the date of the annual goodwill impairment test, we completed a qualitative assessment of the goodwill by reporting unit as of February 1, 2018 and concluded that it was more likely than not that the fair value of each of the reporting units exceeded its carrying amount. In addition, we completed a qualitative assessment of our indefinite lived intangible assets as of February 1, 2018 and concluded that it was more likely than not that the fair value of each of the indefinite lived intangible assets exceeded its carrying amount.
Income Approach Used to Determine Fair Values
The income approach is based upon the present value of expected cash flows. Expected cash flows are converted to present value using factors that consider the timing and risk of the future cash flows. The estimate of cash flows used is prepared on an unleveraged debt-free basis. We use a discount rate that reflects a market-derived weighted average cost of capital. We believe that this approach is appropriate because it provides a fair value estimate based upon the reporting unit's expected long-term operating and cash flow performance. The projections are based upon our best estimates of projected economic and market conditions over the related period including growth rates, estimates of future expected changes in operating margins, and cash expenditures. Other significant estimates and assumptions include terminal value long-term growth rates, provisions for income taxes, future capital expenditures, and changes in future cashless, debt-free working capital.
Market Approach Used to Determine Fair Values
The market approach used estimates the fair value of the reporting unit by applying multiples of operating performance measures to the reporting unit's operating performance (the "Guideline Public Company Method"). These multiples are derived from comparable publicly-traded companies with similar investment characteristics to the reporting unit, and such comparable data are reviewed and updated as needed annually. We believe that this approach is appropriate because it provides a fair value estimate using multiples from entities with operations and economic characteristics comparable to our reporting units and the Company.
The key estimates and assumptions that are used to determine fair value under this market approach include current and forward 12-month operating performance results, as applicable, and the selection of the relevant multiples to be applied. Under the Guideline Public Company Method, a control premium, or an amount that a buyer is usually willing to pay over the current market price of a publicly traded company, is considered and applied, to the calculated equity values to adjust the public trading value upward for a 100% ownership interest, where applicable.
In order to assess the reasonableness of the calculated fair values of our reporting units, we also compare the sum of the reporting units' fair values to our market capitalization and calculate an implied control premium (the excess of the sum of the reporting units' fair values over the market capitalization). We evaluate the control premium by comparing it to control premiums of recent comparable market transactions. If the implied control premium is not reasonable in light of these recent transactions, we will reevaluate our fair value estimates of the reporting units by adjusting the discount rates and/or other assumptions.
39
If our assumptions and related estimates change in the future, or if we change our reporting unit structure or other events and circumstances change (such as a sustained decrease in the price of our common stock, a decline in current market multiples, a significant adverse change in legal factors or business climates, an adverse action or assessment by a regulator, heightened competition, strategic decisions made in response to economic or competitive conditions, or a more-likely-than-not expectation that a reporting unit or a significant portion of a reporting unit will be sold or disposed of), we may be required to record impairment charges in future periods. Any impairment charges that we may take in the future could be material to our consolidated results of operations and financial condition.
See Note 10, "Goodwill and Intangible Assets," of the Notes to Consolidated Financial Statements for details of our goodwill balance and the goodwill review performed in 2018 and other related information.
Intangible Assets with Finite Lives and Other Long-Lived Assets: Finite-lived intangible assets principally consist of brands, trademarks, content and publication rights, customer relationships, and non-compete agreements and are amortized over their estimated useful lives. The most significant factors in determining the estimated lives of these intangibles are the history and longevity of the brands, trademarks, and content and publication rights acquired combined with the strength of cash flows. Content and publication rights, trademarks, customer relationships, and brands with finite lives are amortized on a straight-line basis over periods ranging from 2 to 40 years. Non-compete agreements are amortized over the terms of the individual agreement, generally up to 5 years.
Intangible assets with finite lives as of April 30, 2018, are amortized on a straight line basis over the following weighted average estimated useful lives: content and publishing rights – 30 years, customer relationships – 20 years, brands and trademarks – 15 years, non-compete agreements – 5 years.
Assets with finite lives are evaluated for impairment upon a significant change in the operating or macroeconomic environment. In these circumstances, if an evaluation of the projected undiscounted cash flows indicates impairment, the asset is written down to its estimated fair value based on the discounted future cash flows.
Stock-Based Compensation: We recognize stock-based compensation expense based on the fair value of the stock-based awards on the grant date, reduced by an estimate for future forfeited awards. As such, stock-based compensation expense is only recognized for those awards that are expected to ultimately vest. The fair value of stock-based awards is recognized in net income on a straight-line basis over the requisite service period. The grant date fair value for stock options was estimated using the Black-Scholes option-pricing model. The determination of the assumptions used in the Black-Scholes model required us to make significant judgments and estimates, which include the expected life of an option, the expected volatility of our Common Stock over the estimated life of the option, a risk-free interest rate, and the expected dividend yield. Judgment was also required in estimating the amount of stock-based awards that may be forfeited. Stock-based compensation expense associated with performance-based stock awards is based on actual financial results for targets established three years in advance. The cumulative effect on current and prior periods of a change in the estimated number of performance share awards, or estimated forfeiture rate, is recognized as an adjustment to earnings in the period of the revision. If actual results differ significantly from estimates, our stock-based compensation expense and consolidated results of operations could be impacted.
Retirement Plans: We provide defined benefit pension plans for certain employees worldwide. Our Board of Directors approved amendments to the U.S., Canada and U.K. defined benefit plans that froze the future accumulation of benefits effective June 30, 2013, December 31, 2015, and April 30, 2015, respectively. Under the amendments, no new employees will be permitted to enter these plans and no additional benefits for current participants for future services will be accrued after the effective dates of the amendments.
The accounting for benefit plans is highly dependent on assumptions concerning the outcome of future events and circumstances, including discount rates, long-term return rates on pension plan assets, healthcare cost trends, compensation increases and other factors. In determining such assumptions, we consult with outside actuaries and other advisors.
The discount rates for the U.S., Canada and U.K. pension plans are based on the derivation of a single-equivalent discount rate using a standard spot rate curve and the timing of expected benefit payments as of the balance sheet date. The spot rate curve is based upon a portfolio of Moody's-rated Aa3 (or higher) corporate bonds. The discount rates for other non-U.S. plans are based on similar published indices with durations comparable to that of each plan's liabilities. The expected long-term rates of return on pension plan assets are estimated using market benchmarks for equities, real estate, and bonds applied to each plan's target asset allocation and are estimated by asset class, including an anticipated inflation rate. The expected long-term rates are then compared to the historic investment performance of the plan assets as well as future expectations and estimated through consultation with investment advisors and actuaries. Salary growth and healthcare cost trend assumptions are based on our historical experience and future outlook. While we believe that the assumptions used in these calculations are reasonable, differences in actual experience or changes in assumptions could materially affect the expense and liabilities related to our defined benefit pension plans. A hypothetical one percent increase in the discount rate would increase net income and decrease the accrued pension liability by approximately $1.9 million and $143.4 million, respectively. A one percent decrease in the discount rate would decrease net income and increase the accrued pension liability by approximately $1.0 million and $177.9 million, respectively. A one percent change in the expected long-term rate of return would affect net income by approximately $4.7 million.
40
We are exposed to market risk primarily related to interest rates, foreign exchange, and credit risk. It is our policy to monitor these exposures and to use derivative financial investments and/or insurance contracts from time to time to reduce fluctuations in earnings and cash flows when it is deemed appropriate to do so. We do not use derivative financial instruments for trading or speculative purposes.
Interest Rates:
From time to time, we may use interest rate swaps, collars, or options to manage our exposure to fluctuations in interest rates.
We had $360.0 million of variable rate loans outstanding at April 30, 2018, which approximated fair value.
The information set forth in Note 13, "Derivatives Instruments and Activities," of the Notes to Consolidated Financial Statements under the caption "Interest Rate Contracts," is incorporated herein by reference.
On April 4, 2016, we entered into a forward starting interest rate swap agreement that fixed a portion of the variable interest due on a variable rate debt renewal on May 16, 2016. Under the terms of the agreement, we pay a fixed rate of 0.92% and receive a variable rate of interest based on one-month LIBOR from the counterparty, which is reset every month for a three-year period ending May 15, 2019. As of April 30, 2018, the notional amount of the interest rate swap was $350.0 million.
It is management's intention that the notional amount of interest rate swaps be less than the variable rate loans outstanding during the life of the derivatives. During fiscal year 2018, we recognized a gain on our hedge contracts of approximately $1.5 million, which is reflected in Interest Expense on the Consolidated Statement of Income. At April 30, 2018, the fair value of the outstanding interest rate swaps was a deferred gain of $5.1 million. Based on the maturity dates of the contract, the entire deferred gain of $5.1 million was recorded in Other Long-Term Assets. On an annual basis, a hypothetical one percent change in interest rates for the $10 million of unhedged variable rate debt as of April 30, 2018, would affect net income and cash flow by approximately $0.1 million.
Foreign Exchange Rates:
Fluctuations in the currencies of countries where we operate outside the U.S. may have a significant impact on financial results. We are primarily exposed to movements in British pound sterling, euros, Canadian and Australian dollars, and certain currencies in Asia. The Statements of Financial Position of non-U.S. business units are translated into U.S. dollars using period-end exchange rates for assets and liabilities and weighted average exchange rates for revenues and expenses. The percentage of Consolidated Revenue for fiscal year 2018 recognized in the following currencies (on an equivalent U.S. dollar basis) were approximately: 53% U.S dollar, 27% British pound sterling, 12% euro, and 9% other currencies.
Our significant investments in non-U.S. businesses are exposed to foreign currency risk. Adjustments resulting from translating assets and liabilities are reported as a separate component of Accumulated Other Comprehensive Loss within Shareholders' Equity under the caption Foreign Currency Translation Adjustment. During fiscal year 2018, we recorded foreign currency translation gains in other comprehensive income of approximately $67.6 million primarily due to the strengthening of the British pound sterling relative to the U.S. dollar and, to a lesser extent, the strengthening of the euro relative to the U.S. dollar.
Exchange rate gains or losses related to foreign currency transactions are recognized as transaction gains or losses on the Consolidated Statements of Income as incurred. Under certain circumstances, we may enter into derivative financial instruments in the form of foreign currency forward contracts to hedge against specific transactions, including intercompany purchases and loans.
We may enter into forward exchange contracts to manage our exposure on certain foreign currency denominated assets and liabilities. As of April 30, 2018, and 2017, we did not maintain any open forward contracts.
Our foreign currency forward contracts are described in Note 13, "Derivatives Instruments and Activities," which is contained in the Notes to Consolidated Financial Statements, under the caption "Foreign Currency Contracts," is incorporated herein by reference.
41
Customer Credit Risk:
In the journal publishing business, subscriptions are primarily sourced through journal subscription agents who, acting as agents for library customers, facilitate ordering by consolidating the subscription orders/billings of each subscriber with various publishers. Cash is generally collected in advance from subscribers by the subscription agents and is principally remitted to us between the months of December and April. Although at fiscal year-end we had minimal credit risk exposure to these agents, future calendar-year subscription receipts from these agents are highly dependent on their financial condition and liquidity. Subscription agents account for approximately 20% of total annual consolidated revenue and no one agent accounts for more than 10% of total annual consolidated revenue.
Our book business is not dependent upon a single customer; however, the industry is concentrated in national, regional, and online bookstore chains. Although no one book customer accounts for more than 8% of total consolidated revenue and 8% of accounts receivable at April 30, 2018, the top 10 book customers account for approximately 13% of total consolidated revenue and approximately 15% of accounts receivable at April 30, 2018. We maintain approximately $25 million of trade credit insurance, subject to certain limitations, covering balances due from certain named customers, which expires in June 2019, covering all billings through that date.
Disclosure of Certain Activities Relating to Iran:
The European Union, Canada and the U.S. have imposed sanctions on business relationships with Iran, including restrictions on financial transactions and prohibitions on direct and indirect trading with listed "designated persons." In fiscal year 2018, we recorded revenue and net earnings of approximately $4.6 million and $0.9 million, respectively, related to the sale of scientific and medical content to certain publicly funded universities, hospitals, and institutions that meet the definition of the "Government of Iran" as defined under section 560.304 of title 31, Code of Federal Regulations. We have assessed our business relationship and transactions with Iran and believe we are in compliance with the regulations governing the sanctions. We intend to continue in these or similar sales as long as they continue to be consistent with all applicable sanctions-related regulations.
42
The following Consolidated Financial Statements and Notes are filed as part of this report.
John Wiley & Sons, Inc. and Subsidiaries
|
44
|
|
|
Financial Statements
|
|
|
46
|
|
|
47
|
|
|
48
|
|
|
49
|
|
|
50
|
|
|
Notes to Consolidated Financial Statements
|
|
|
51
|
|
|
51
|
|
|
57
|
|
|
58
|
|
|
58
|
|
|
58
|
|
|
59
|
|
|
59
|
|
|
60
|
|
|
60
|
|
|
62
|
|
|
65
|
|
|
66
|
|
|
67
|
|
|
67
|
|
|
70
|
|
|
73
|
|
|
73
|
|
|
75
|
|
|
Financial Statement Schedule
|
|
|
80
|
43
MANAGEMENT'S REPORT ON INTERNAL CONTROL OVER FINANCIAL REPORTING
To our Shareholders
John Wiley & Sons, Inc.:
The management of John Wiley & Sons, Inc. and subsidiaries is responsible for establishing and maintaining adequate internal control over financial reporting, as such term is defined in Exchange Act Rules 13a-15(f) and 15d-15(f).
Under the supervision and with the participation of our management, we conducted an evaluation of the effectiveness of our internal control over financial reporting based on the framework in Internal Control – Integrated Framework (2013) issued by the Committee of Sponsoring Organizations of the Treadway Commission (COSO). Based on our evaluation under the framework in Internal Control – Integrated Framework issued by COSO, our management concluded that our internal control over financial reporting was effective as of April 30, 2018.
Changes in Internal Control over Financial Reporting:
We are in the process of implementing a new global enterprise resource planning system ("ERP") that will enhance our business and financial processes and standardize our information systems. We have completed the implementation of record-to-report, purchase-to-pay and several other business processes within all locations and will continue to roll out the ERP in phases over the next year.
As with any new information system we implement, this application, along with the internal controls over financial reporting included in this process, will require testing for effectiveness. In connection with this ERP implementation, we are updating our internal controls over financial reporting, as necessary, to accommodate modifications to our business processes and accounting procedures. We do not believe that the ERP implementation will have an adverse effect on our internal control over financial reporting.
Except as described above, there were no changes in our internal control over financial reporting that have materially affected, or are reasonably likely to materially affect, our internal control over financial reporting during fiscal year 2018.
The effectiveness of our internal control over financial reporting as of April 30, 2018 has been audited by KPMG LLP, an independent registered public accounting firm, as stated in their report which is included herein.
The Company's Corporate Governance Principles, Committee Charters, Business Conduct and Ethics Policy and the Code of Ethics for Senior Financial Officers are published on our web site at www.wiley.com under the "About Wiley—Corporate Governance" captions. Copies are also available free of charge to shareholders on request to the Corporate Secretary, John Wiley & Sons, Inc., 111 River Street, Hoboken, NJ 07030-5774.
|
/s/ Brian A. Napack
|
|
|
Brian A. Napack
|
|
|
President and Chief Executive Officer
|
|
|
/s/ John A. Kritzmacher
|
|
|
John A. Kritzmacher
|
|
|
Chief Financial Officer and
|
|
|
Executive Vice President, Operations
|
|
|
/s/ Christopher F. Caridi
|
|
|
Christopher F. Caridi
|
|
|
Senior Vice President, Corporate Controller and
|
|
|
Chief Accounting Officer
|
|
|
|
|
|
June 29, 2018
|
|
44
The Board of Directors and Shareholders
John Wiley & Sons, Inc.:
Opinion on the Consolidated Financial Statements
We have audited the accompanying consolidated statements of financial position of John Wiley & Sons, Inc. and subsidiaries (the "Company") as of April 30, 2018 and 2017, the related consolidated statements of income, comprehensive income, cash flows, and shareholders' equity for each of the years in the three-year period ended April 30, 2018, and the related notes and financial statement schedule II (collectively, the "consolidated financial statements"). In our opinion, the consolidated financial statements present fairly, in all material respects, the financial position of the Company as of April 30, 2018 and 2017, and the results of its operations and its cash flows for each of the years in the three-year period ended April 30, 2018, in conformity with U.S. generally accepted accounting principles.
We also have audited, in accordance with the standards of the Public Company Accounting Oversight Board (United States) ("PCAOB"), the Company's internal control over financial reporting as of April 30, 2018, based on criteria established in Internal Control – Integrated Framework (2013) issued by the Committee of Sponsoring Organizations of the Treadway Commission, and our report dated June 29, 2018, expressed an unqualified opinion on the effectiveness of the Company's internal control over financial reporting.
Basis for Opinion
These consolidated financial statements are the responsibility of the Company's management. Our responsibility is to express an opinion on these consolidated financial statements based on our audits. We are a public accounting firm registered with the PCAOB and are required to be independent with respect to the Company in accordance with the U.S. federal securities laws and the applicable rules and regulations of the Securities and Exchange Commission and the PCAOB.
We conducted our audits in accordance with the standards of the PCAOB. Those standards require that we plan and perform the audit to obtain reasonable assurance about whether the consolidated financial statements are free of material misstatement, whether due to error or fraud. Our audits included performing procedures to assess the risks of material misstatement of the consolidated financial statements, whether due to error or fraud, and performing procedures that respond to those risks. Such procedures included examining, on a test basis, evidence regarding the amounts and disclosures in the consolidated financial statements. Our audits also included evaluating the accounting principles used and significant estimates made by management, as well as evaluating the overall presentation of the consolidated financial statements. We believe that our audits provide a reasonable basis for our opinion.
/s/ KPMG LLP
We have served as the Company's auditor since 2002.
New York, New York
June 29, 2018
June 29, 2018
45
Report of Independent Registered Public Accounting Firm
The Board of Directors and Shareholders
John Wiley & Sons, Inc.:
Opinion on Internal Control Over Financial Reporting
We have audited John Wiley & Sons, Inc. and subsidiaries' (the "Company") internal control over financial reporting as of April 30, 2018, based on criteria established in Internal Control – Integrated Framework (2013) issued by the Committee of Sponsoring Organizations of the Treadway Commission. In our opinion, the Company maintained, in all material respects, effective internal control over financial reporting as of April 30, 2018, based on criteria established in Internal Control – Integrated Framework (2013) issued by the Committee of Sponsoring Organizations of the Treadway Commission.
We also have audited, in accordance with the standards of the Public Company Accounting Oversight Board (United States) (PCAOB), the consolidated statements of financial position of the Company as of April 30, 2018 and 2017, the related consolidated statements of income, comprehensive income, cash flows, and shareholders' equity for each of the years in the three-year period ended April 30, 2018, and the related notes (and financial statement schedule II) (collectively, the "consolidated financial statements"), and our report dated June 29, 2018 expressed an unqualified opinion on those consolidated financial statements.
Basis for Opinion
The Company's management is responsible for maintaining effective internal control over financial reporting and for its assessment of the effectiveness of internal control over financial reporting, included in the accompanying Management's Report On Internal Control Over Financial Reporting. Our responsibility is to express an opinion on the Company's internal control over financial reporting based on our audit. We are a public accounting firm registered with the PCAOB and are required to be independent with respect to the Company in accordance with the U.S. federal securities laws and the applicable rules and regulations of the Securities and Exchange Commission and the PCAOB.
We conducted our audit in accordance with the standards of the PCAOB. Those standards require that we plan and perform the audit to obtain reasonable assurance about whether effective internal control over financial reporting was maintained in all material respects. Our audit of internal control over financial reporting included obtaining an understanding of internal control over financial reporting, assessing the risk that a material weakness exists, and testing and evaluating the design and operating effectiveness of internal control based on the assessed risk. Our audit also included performing such other procedures as we considered necessary in the circumstances. We believe that our audit provides a reasonable basis for our opinion.
Definition and Limitations of Internal Control Over Financial Reporting
A company's internal control over financial reporting is a process designed to provide reasonable assurance regarding the reliability of financial reporting and the preparation of financial statements for external purposes in accordance with generally accepted accounting principles. A company's internal control over financial reporting includes those policies and procedures that (1) pertain to the maintenance of records that, in reasonable detail, accurately and fairly reflect the transactions and dispositions of the assets of the company; (2) provide reasonable assurance that transactions are recorded as necessary to permit preparation of financial statements in accordance with generally accepted accounting principles, and that receipts and expenditures of the company are being made only in accordance with authorizations of management and directors of the company; and (3) provide reasonable assurance regarding prevention or timely detection of unauthorized acquisition, use, or disposition of the company's assets that could have a material effect on the financial statements.
Because of its inherent limitations, internal control over financial reporting may not prevent or detect misstatements. Also, projections of any evaluation of effectiveness to future periods are subject to the risk that controls may become inadequate because of changes in conditions, or that the degree of compliance with the policies or procedures may deteriorate.
/s/ KPMG LLP
New York, New York
June 29, 2018
June 29, 2018
46
John Wiley & Sons, Inc. and Subsidiaries
Dollars in thousands
|
April 30,
|
||||||||
|
2018
|
2017
|
|||||||
|
Assets:
|
||||||||
|
Current Assets
|
||||||||
|
Cash and cash equivalents
|
$
|
169,773
|
$
|
58,516
|
||||
|
Accounts receivable, net
|
212,377
|
188,679
|
||||||
|
Inventories
|
39,489
|
47,852
|
||||||
|
Prepaid and other current assets
|
58,332
|
64,688
|
||||||
|
Total Current Assets
|
479,971
|
359,735
|
||||||
|
Product Development Assets
|
78,814
|
80,385
|
||||||
|
Royalty Advances
|
37,058
|
28,320
|
||||||
|
Technology, Property & Equipment
|
289,934
|
243,058
|
||||||
|
Intangible Assets
|
848,071
|
828,099
|
||||||
|
Goodwill
|
1,019,801
|
982,101
|
||||||
|
Other Non-Current Assets
|
85,802
|
84,519
|
||||||
|
Total Assets
|
$
|
2,839,451
|
$
|
2,606,217
|
||||
|
Liabilities and Shareholders' Equity:
|
||||||||
|
Current Liabilities
|
||||||||
|
Accounts payable
|
$
|
90,097
|
$
|
76,335
|
||||
|
Royalties payable
|
73,007
|
62,871
|
||||||
|
Deferred revenue
|
486,353
|
436,235
|
||||||
|
Accrued employment costs
|
116,179
|
98,185
|
||||||
|
Accrued income taxes
|
13,927
|
22,222
|
||||||
|
Accrued pension liability
|
5,598
|
5,776
|
||||||
|
Other accrued liabilities
|
89,150
|
86,232
|
||||||
|
Total Current Liabilities
|
874,311
|
787,856
|
||||||
|
Long-Term Debt
|
360,000
|
365,000
|
||||||
|
Accrued Pension Liability
|
190,301
|
214,597
|
||||||
|
Deferred Income Tax Liabilities
|
143,518
|
160,491
|
||||||
|
Other Long-Term Liabilities
|
80,764
|
75,136
|
||||||
|
Total Liabilities
|
1,648,894
|
1,603,080
|
||||||
|
Shareholders' Equity
|
||||||||
|
Preferred Stock, $1 par value: Authorized – 2 million, Issued – 0
|
—
|
—
|
||||||
|
Class A Common Stock, $1 par value: Authorized – 180 million, Issued – 70,110,603 in 2018 and 70,086,003 in 2017
|
70,111
|
70,086
|
||||||
|
Class B Common Stock, $1 par value: Authorized – 72 million, Issued – 13,071,067 in 2018 and 13,095,667 in 2017
|
13,071
|
13,096
|
||||||
|
Additional paid-in capital
|
407,120
|
387,896
|
||||||
|
Retained earnings
|
1,834,057
|
1,715,423
|
||||||
|
Accumulated other comprehensive (loss):
|
||||||||
|
Foreign currency translation adjustment
|
(251,573
|
)
|
(319,212
|
)
|
||||
|
Unamortized retirement costs, net of tax
|
(191,026
|
)
|
(190,502
|
)
|
||||
|
Unrealized gain on interest rate swap, net of tax
|
3,019
|
2,427
|
||||||
|
(439,580
|
)
|
(507,287
|
)
|
|||||
|
Less: Treasury Shares At Cost (Class A – 21,853,257 in 2018 and 22,096,970 in 2017, Class B – 3,917,574 in 2018 and 3,917,574 in 2017)
|
(694,222
|
)
|
(676,077
|
)
|
||||
|
Total Shareholders' Equity
|
1,190,557
|
1,003,137
|
||||||
|
Total Liabilities and Shareholders' Equity
|
$
|
2,839,451
|
$
|
2,606,217
|
||||
See accompanying notes to the audited consolidated financial statements.
47
John Wiley & Sons, Inc. and Subsidiaries
Dollars in thousands, except per share data
|
For the Years Ended April 30,
|
||||||||||||
|
2018
|
2017
|
2016
|
||||||||||
|
Revenue
|
$
|
1,796,103
|
$
|
1,718,530
|
$
|
1,727,037
|
||||||
|
Costs and Expenses
|
||||||||||||
|
Cost of sales
|
485,220
|
460,756
|
466,177
|
|||||||||
|
Operating and administrative expenses
|
994,552
|
988,597
|
994,372
|
|||||||||
|
Restructuring and related charges
|
28,566
|
13,355
|
28,611
|
|||||||||
|
Amortization of intangibles
|
48,230
|
49,669
|
49,764
|
|||||||||
|
Total Costs and Expenses
|
1,556,568
|
1,512,377
|
1,538,924
|
|||||||||
|
Operating Income
|
239,535
|
206,153
|
188,113
|
|||||||||
|
Interest Expense
|
(13,274
|
)
|
(16,938
|
)
|
(16,707
|
)
|
||||||
|
Foreign Exchange Transaction (Losses) Gains
|
(12,819
|
)
|
421
|
473
|
||||||||
|
Interest and Other Income
|
489
|
1,480
|
2,914
|
|||||||||
|
Income Before Taxes
|
213,931
|
191,116
|
174,793
|
|||||||||
|
Provision for Income Taxes
|
21,745
|
77,473
|
29,011
|
|||||||||
|
Net Income
|
$
|
192,186
|
$
|
113,643
|
$
|
145,782
|
||||||
|
Earnings Per Share
|
||||||||||||
|
Basic
|
$
|
3.37
|
$
|
1.98
|
$
|
2.51
|
||||||
|
Diluted
|
$
|
3.32
|
$
|
1.95
|
$
|
2.48
|
||||||
|
Cash Dividends Per Share
|
||||||||||||
|
Class A Common
|
$
|
1.28
|
$
|
1.24
|
$
|
1.20
|
||||||
|
Class B Common
|
$
|
1.28
|
$
|
1.24
|
$
|
1.20
|
||||||
|
Weighted Average Number of Common Shares Outstanding
|
||||||||||||
|
Basic
|
57,043
|
57,337
|
57,998
|
|||||||||
|
Diluted
|
57,888
|
58,199
|
58,734
|
|||||||||
See accompanying notes to the audited consolidated financial statements.
48
John Wiley & Sons, Inc. and Subsidiaries
Dollars in thousands
|
For the Years Ended April 30,
|
||||||||||||
|
2018
|
2017
|
2016
|
||||||||||
|
Net Income
|
$
|
192,186
|
$
|
113,643
|
$
|
145,782
|
||||||
|
Other Comprehensive Income (Loss):
|
||||||||||||
|
Foreign currency translation adjustment
|
67,639
|
(51,292
|
)
|
(21,066
|
)
|
|||||||
|
Unrealized retirement costs, net of tax benefit of $252, $3,286, and $8,807, respectively
|
(524
|
)
|
(11,097
|
)
|
(19,971
|
)
|
||||||
|
Unrealized gain (loss) on interest rate swaps, net of tax (provision) benefit of $(459), $(1,709), and $10, respectively
|
592
|
2,788
|
(16
|
)
|
||||||||
|
Total Other Comprehensive Income (Loss)
|
67,707
|
(59,601
|
)
|
(41,053
|
)
|
|||||||
|
Comprehensive Income
|
$
|
259,893
|
$
|
54,042
|
$
|
104,729
|
||||||
See accompanying notes to the audited consolidated financial statements.
49
John Wiley & Sons, Inc. and Subsidiaries
Dollars in thousands
|
For the Years Ended April 30,
|
||||||||||||
|
2018
|
2017
|
2016
|
||||||||||
|
Operating Activities
|
||||||||||||
|
Net Income
|
$
|
192,186
|
$
|
113,643
|
$
|
145,782
|
||||||
|
Adjustments to reconcile net income to net cash provided by operating activities:
|
||||||||||||
|
Amortization of intangibles
|
48,230
|
49,669
|
49,764
|
|||||||||
|
Amortization of product development spending
|
41,432
|
40,209
|
39,658
|
|||||||||
|
Depreciation of technology, property, and equipment
|
64,327
|
66,683
|
66,427
|
|||||||||
|
Restructuring charges
|
28,566
|
13,355
|
28,611
|
|||||||||
|
Deferred income tax benefit on U.K. rate changes
|
—
|
(2,575
|
)
|
(5,859
|
)
|
|||||||
|
Stock-based compensation expense
|
11,244
|
17,552
|
16,105
|
|||||||||
|
Excess tax benefits from stock-based compensation
|
—
|
(414
|
)
|
(1,027
|
)
|
|||||||
|
Employee retirement plan expense
|
7,388
|
13,169
|
14,323
|
|||||||||
|
Royalty advances
|
(122,602
|
)
|
(112,370
|
)
|
(110,135
|
)
|
||||||
|
Earned royalty advances
|
116,620
|
114,647
|
109,102
|
|||||||||
|
Impairment of publishing brand
|
3,600
|
—
|
—
|
|||||||||
|
Foreign currency gains (losses)
|
12,819
|
(421
|
)
|
(473
|
)
|
|||||||
|
Unfavorable tax litigation
|
—
|
49,029
|
—
|
|||||||||
|
One-time pension settlement
|
—
|
8,842
|
—
|
|||||||||
|
Other non-cash (credits) charges
|
(30,752
|
)
|
(6,450
|
)
|
1,936
|
|||||||
|
Income tax deposits
|
—
|
—
|
(1,151
|
)
|
||||||||
|
Changes in Operating Assets and Liabilities
|
||||||||||||
|
Accounts receivable, net
|
(14,209
|
)
|
(29,886
|
)
|
(14,456
|
)
|
||||||
|
Inventories
|
13,517
|
8,003
|
3,571
|
|||||||||
|
Accounts payable
|
16,543
|
(24,182
|
)
|
7,169
|
||||||||
|
Royalties payable
|
3,664
|
4,325
|
(3,172
|
)
|
||||||||
|
Deferred revenue
|
36,243
|
22,692
|
66,983
|
|||||||||
|
Income taxes payable
|
(565
|
)
|
19,479
|
(7,091
|
)
|
|||||||
|
Restructuring payments
|
(30,595
|
)
|
(22,854
|
)
|
(29,864
|
)
|
||||||
|
Other accrued liabilities
|
1,022
|
10,367
|
14,968
|
|||||||||
|
Employee retirement plan contributions
|
(27,550
|
)
|
(39,687
|
)
|
(34,214
|
)
|
||||||
|
Other
|
10,710
|
2,078
|
(7,000
|
)
|
||||||||
|
Net Cash Provided by Operating Activities
|
381,838
|
314,903
|
349,957
|
|||||||||
|
Investing Activities
|
||||||||||||
|
Product development spending
|
(36,503
|
)
|
(43,603
|
)
|
(44,578
|
)
|
||||||
|
Additions to technology, property, and equipment
|
(114,225
|
)
|
(105,058
|
)
|
(86,399
|
)
|
||||||
|
Acquisitions of publication rights and other
|
(26,683
|
)
|
(28,842
|
)
|
(20,418
|
)
|
||||||
|
Businesses acquired in purchase transactions, net of cash acquired
|
—
|
(125,924
|
)
|
—
|
||||||||
|
Proceeds from settlement of foreign exchange forward contracts
|
—
|
60,417
|
—
|
|||||||||
|
Net Cash Used in Investing Activities
|
(177,411
|
)
|
(243,010
|
)
|
(151,395
|
)
|
||||||
|
Financing Activities
|
||||||||||||
|
Repayment of long-term debt
|
(467,915
|
)
|
(923,007
|
)
|
(460,085
|
)
|
||||||
|
Repayment of short-term debt
|
—
|
—
|
(150,000
|
)
|
||||||||
|
Borrowing of long-term debt
|
459,304
|
683,000
|
415,000
|
|||||||||
|
Borrowing of short-term debt
|
—
|
—
|
50,000
|
|||||||||
|
Purchase of treasury shares
|
(39,688
|
)
|
(50,326
|
)
|
(69,977
|
)
|
||||||
|
Change in book overdrafts
|
(4,191
|
)
|
(214
|
)
|
1,725
|
|||||||
|
Cash dividends
|
(73,542
|
)
|
(71,545
|
)
|
(69,896
|
)
|
||||||
|
Debt financing costs
|
—
|
—
|
(3,362
|
)
|
||||||||
|
Net proceeds (payments) from exercise of stock options and other
|
29,201
|
15,506
|
(95
|
)
|
||||||||
|
Excess tax benefits from stock-based compensation
|
—
|
414
|
1,027
|
|||||||||
|
Net Cash Used in Financing Activities
|
(96,831
|
)
|
(346,172
|
)
|
(285,663
|
)
|
||||||
|
Effects of Exchange Rate Changes on Cash
|
3,661
|
(31,011
|
)
|
(6,534
|
)
|
|||||||
|
Cash and Cash Equivalents
|
||||||||||||
|
Increase/(Decrease) for year
|
111,257
|
(305,290
|
)
|
(93,635
|
)
|
|||||||
|
Balance at beginning of year
|
58,516
|
363,806
|
457,441
|
|||||||||
|
Balance at end of year
|
169,773
|
58,516
|
363,806
|
|||||||||
|
Cash Paid During the Year for
|
||||||||||||
|
Interest
|
$
|
12,221
|
$
|
15,733
|
$
|
15,050
|
||||||
|
Income taxes, net
|
$
|
48,709
|
$
|
33,674
|
$
|
38,579
|
||||||
See accompanying notes to the audited consolidated financial statements.
50
John Wiley & Sons, Inc. and Subsidiaries
Dollars in thousands
|
Common Stock
Class A
|
Common Stock
Class B
|
Additional
Paid-in Capital
|
Retained
Earnings
|
Treasury
Stock
|
Accumulated Other
Comprehensive Loss
|
Total
Shareholder's Equity
|
||||||||||||||||||||||
|
Balance at April 30, 2015
|
$
|
69,798
|
$
|
13,392
|
$
|
353,018
|
$
|
1,597,439
|
$
|
(571,974
|
)
|
$
|
(406,633
|
)
|
$
|
1,055,040
|
||||||||||||
|
Restricted Shares Issued under Stock-based Compensation Plans
|
—
|
—
|
(3,152
|
)
|
—
|
3,325
|
—
|
173
|
||||||||||||||||||||
|
Net (Payments)/Proceeds from Exercise of Stock Options and Other
|
—
|
—
|
1,700
|
—
|
(1,795
|
)
|
—
|
(95
|
)
|
|||||||||||||||||||
|
Excess Tax Benefits from Stock-based Compensation
|
—
|
—
|
1,027
|
—
|
—
|
—
|
1,027
|
|||||||||||||||||||||
|
Stock-based Compensation Expense
|
—
|
—
|
16,105
|
—
|
—
|
—
|
16,105
|
|||||||||||||||||||||
|
Purchase of Treasury Shares
|
—
|
—
|
—
|
—
|
(69,977
|
)
|
—
|
(69,977
|
)
|
|||||||||||||||||||
|
Class A Common Stock Dividends
|
—
|
—
|
—
|
(58,658
|
)
|
—
|
—
|
(58,658
|
)
|
|||||||||||||||||||
|
Class B Common Stock Dividends
|
—
|
—
|
—
|
(11,238
|
)
|
—
|
—
|
(11,238
|
)
|
|||||||||||||||||||
|
Comprehensive Income (Loss)
|
—
|
—
|
—
|
145,782
|
—
|
(41,053
|
)
|
104,729
|
||||||||||||||||||||
|
Balance at April 30, 2016
|
$
|
69,798
|
$
|
13,392
|
$
|
368,698
|
$
|
1,673,325
|
$
|
(640,421
|
)
|
$
|
(447,686
|
)
|
$
|
1,037,106
|
||||||||||||
|
Restricted Shares Issued under Stock-based Compensation Plans
|
—
|
—
|
(7,617
|
)
|
—
|
8,013
|
—
|
396
|
||||||||||||||||||||
|
Net Proceeds from Exercise of Stock Options and Other
|
—
|
—
|
8,849
|
—
|
6,657
|
—
|
15,506
|
|||||||||||||||||||||
|
Excess Tax Benefits from Stock-based Compensation
|
—
|
—
|
414
|
—
|
—
|
—
|
414
|
|||||||||||||||||||||
|
Stock-based Compensation Expense
|
—
|
—
|
17,552
|
—
|
—
|
—
|
17,552
|
|||||||||||||||||||||
|
Purchase of Treasury Shares
|
—
|
—
|
—
|
—
|
(50,326
|
)
|
—
|
(50,326
|
)
|
|||||||||||||||||||
|
Class A Common Stock Dividends
|
—
|
—
|
—
|
(60,143
|
)
|
—
|
—
|
(60,143
|
)
|
|||||||||||||||||||
|
Class B Common Stock Dividends
|
—
|
—
|
—
|
(11,402
|
)
|
—
|
—
|
(11,402
|
)
|
|||||||||||||||||||
|
Common Stock Class Conversions
|
288
|
(296
|
)
|
—
|
—
|
—
|
—
|
(8
|
)
|
|||||||||||||||||||
|
Comprehensive Income (Loss)
|
—
|
—
|
—
|
113,643
|
—
|
(59,601
|
)
|
54,042
|
||||||||||||||||||||
|
Balance at April 30, 2017
|
$
|
70,086
|
$
|
13,096
|
$
|
387,896
|
$
|
1,715,423
|
$
|
(676,077
|
)
|
$
|
(507,287
|
)
|
$
|
1,003,137
|
||||||||||||
|
Restricted Shares Issued under Stock-based Compensation Plans
|
—
|
—
|
(7,646
|
)
|
(10
|
)
|
7,968
|
—
|
312
|
|||||||||||||||||||
|
Net Proceeds from Exercise of Stock Options and Other
|
—
|
—
|
15,686
|
—
|
13,515
|
—
|
29,201
|
|||||||||||||||||||||
|
Stock-based Compensation Expense
|
—
|
—
|
11,184
|
—
|
60
|
—
|
11,244
|
|||||||||||||||||||||
|
Purchase of Treasury Shares
|
—
|
—
|
—
|
—
|
(39,688
|
)
|
—
|
(39,688
|
)
|
|||||||||||||||||||
|
Class A Common Stock Dividends
|
—
|
—
|
—
|
(61,813
|
)
|
—
|
—
|
(61,813
|
)
|
|||||||||||||||||||
|
Class B Common Stock Dividends
|
—
|
—
|
—
|
(11,729
|
)
|
—
|
—
|
(11,729
|
)
|
|||||||||||||||||||
|
Common Stock Class Conversions
|
25
|
(25
|
)
|
—
|
—
|
—
|
—
|
—
|
||||||||||||||||||||
|
Comprehensive Income
|
—
|
—
|
—
|
192,186
|
—
|
67,707
|
259,893
|
|||||||||||||||||||||
|
Balance at April 30, 2018
|
$
|
70,111
|
$
|
13,071
|
$
|
407,120
|
$
|
1,834,057
|
$
|
(694,222
|
)
|
$
|
(439,580
|
)
|
$
|
1,190,557
|
||||||||||||
See accompanying notes to the audited consolidated financial statements.
51
John Wiley & Sons, Inc. and Subsidiaries
Notes to Consolidated Financial Statements
The Company, founded in 1807, was incorporated in the state of New York on January 15, 1904. Throughout this report, when we refer to "Wiley," the "Company," "we," "our," or "us," we are referring to John Wiley & Sons, Inc. and all of our subsidiaries, except where the context indicates otherwise.
We are a global research and learning company. Through our Research segment, we provide scientific, technical, medical, and scholarly journals, as well as related content and services, to academic, corporate, and government libraries, learned societies, and individual researchers and other professionals. The Publishing segment provides scientific, professional, and education books and related content in print and digital formats, as well as test preparation services and course workflow tools, to libraries, corporations, students, professionals, and researchers. The Solutions segment provides online program management services for higher education institutions and learning, development, and assessment services for businesses and professionals. We have operations primarily located in the United States, Canada, United Kingdom, Germany, Singapore, and Australia.
Note 2 – Summary of Significant Accounting Policies, Recently Issued, and Recently Adopted Accounting Standards
Summary of Significant Accounting Policies
Basis of Presentation:
Our Consolidated Financial Statements include all of the accounts of the Company and our subsidiaries. We have eliminated all significant intercompany transactions and balances in consolidation. All amounts are in thousands, except per share amounts, and approximate due to rounding.
Reclassifications:
Certain prior year amounts have been reclassified to conform to the current year's presentation.
Use of Estimates:
The preparation of our Consolidated Financial Statements and related disclosures in conformity with U.S. GAAP requires our management to make estimates and assumptions that affect the reported amounts of assets and liabilities, the disclosure of contingent assets and liabilities as of the date of the financial statements and revenue and expenses during the reporting period. These estimates include, among other items, assessing the collectability of receivables, the use and recoverability of inventory, assumptions used in the calculation of income taxes, useful lives and recoverability of tangible assets and goodwill and other intangible assets, assumptions used in our defined benefit pension plans and other post-employment benefit plans, costs for incentive compensation, and accruals for commitments and contingencies. We review these estimates and assumptions periodically using historical experience and other factors and reflect the effects of any revisions on the Consolidated Financial Statements in the period we determine any revisions to be necessary. Actual results could differ from those estimates.
Book Overdrafts:
Under our cash management system, a book overdraft balance exists for our primary disbursement accounts. This overdraft represents uncleared checks in excess of cash balances in individual bank accounts. Our funds are transferred from other existing bank account balances or from lines of credit as needed to fund checks presented for payment. As of April 30, 2018 and 2017, book overdrafts of $13.1 million and $17.6 million, respectively, were included in Accounts Payable on the Consolidated Statements of Financial Position.
Revenue Recognition:
We recognize revenue when the following criteria are met: persuasive evidence that an arrangement exists, delivery has occurred, or services have been rendered; the price to the customer is fixed or determinable; and collectability is reasonably assured. If all of the above criteria have been met, revenue is recognized upon shipment of products or when services have been rendered. Revenue related to journal subscriptions and other products and services that is generally collected in advance is deferred and recognized as earned over the term of the subscription, when the related issue is shipped or made available online, or the service is rendered, in accordance with contractual terms. Collectability is evaluated based on the amount involved, the credit history of the customer, and the status of the customer's account with us.
52
We transitioned from issue-based to time-based digital journal subscription agreements starting in calendar year 2016. Under this new model, we provide access to all journal content published within a calendar year and recognize revenue on a straight-line basis over the calendar year. Under our previous licensing model, a customer subscribed to a discrete number of online journal issues and revenue was recognized as each issue was made available online. We made these changes to simplify the contracting and administration of our digital journal subscriptions.
When a product is sold with multiple deliverables, we account for each deliverable within the arrangement as a separate unit of accounting due to the fact that each deliverable is also sold on a stand-alone basis. The total consideration of a multiple-element arrangement is allocated to each unit of accounting based on the price charged by us when it is sold separately. Our multiple deliverable arrangements principally include WileyPLUS, an online course management tool that includes a complete print or digital textbook for the course, negotiated licenses for bundles of digital content available on Wiley Online Library, the online publishing platform for our Research business, and test preparation, assessment, certification and training services which can include bundles of print and digital content and online workflow solutions. In March 2018, we migrated our Wiley Online Library platform to Atypon's Literatum platform, which we acquired in fiscal year 2017.
We enter into contracts for the resale of our content through third parties where we are not the primary obligor of the arrangement because we are not responsible for fulfilling the customer's order, handling customer requests or claims, and/or maintaining credit risk. We recognize revenue for the sale of our content, net of any commission owed to the third-party seller, or taxes, which are remitted to government authorities.
In May 2014, the Financial Accounting Standards Board (the "FASB") issued ASU 2014-09 "Revenue from Contracts with Customers" (Topic 606) ("ASU 2014-09"), which supersedes most existing revenue recognition guidance. We adopted ASU 2014-09 on May 1, 2018. See the caption below, "Recently Adopted Accounting Standards" for details of our adoption of ASU 2014-09.
Cash Equivalents:
Cash equivalents consist of highly liquid investments with an original maturity of three months or less at the time of purchase and are stated at cost, which approximates market value, because of the short-term maturity of the instruments.
Allowance for Doubtful Accounts:
The estimated allowance for doubtful accounts is based on a review of the aging of the accounts receivable balances, historical write-off experience, credit evaluations of customers, and current market conditions. A change in the evaluation of a customer's credit could affect the estimated allowance. The allowance for doubtful accounts is shown as a reduction of Accounts Receivable on the Consolidated Statements of Financial Position and amounted to $10.1 million and $7.2 million as of April 30, 2018 and 2017, respectively.
Sales Return Reserves:
The process that we use to determine our sales returns and the related reserve provision charged against revenue is based on applying an estimated return rate to current year returnable print book sales. This rate is based upon an analysis of actual historical return experience in the various markets and geographic regions in which we do business. We collect, maintain and analyze significant amounts of sales returns data for large volumes of homogeneous transactions. This allows us to make reasonable estimates of the amount of future returns. All available data is utilized to identify the returns by market and to which fiscal year the sales returns apply. This enables management to track the returns in detail and identify and react to trends occurring in the marketplace, with the objective of being able to make the most informed judgments possible in setting reserve rates. Associated with the estimated sales return reserves, we also include a related reduction in inventory and royalty costs as a result of the expected returns. Net print book sales return reserves amounted to $18.6 million and $24.3 million as of April 30, 2018 and 2017, respectively.
The reserves are reflected in the following accounts of the Consolidated Statements of Financial Position – (decrease) increase as of April 30:
|
2018
|
2017
|
|||||||
|
Accounts Receivable
|
$
|
(28,302
|
)
|
$
|
(34,769
|
)
|
||
|
Inventories
|
$
|
4,626
|
$
|
4,727
|
||||
|
Royalties Payable
|
$
|
(5,048
|
)
|
$
|
(5,741
|
)
|
||
|
Decrease in Net Assets
|
$
|
(18,628
|
)
|
$
|
(24,300
|
)
|
||
53
Inventories:
Inventories are carried at the lower of cost or market. U.S. book inventories aggregating $24.0 million and $31.5 million at April 30, 2018 and 2017, respectively, are valued using the last-in, first-out (LIFO) method. All other inventories are valued using the first-in, first-out (FIFO) method.
Reserve for Inventory Obsolescence:
A reserve for inventory obsolescence is estimated based on a review of damaged, obsolete, or otherwise unsalable inventory. The review encompasses historical unit sales trends by title, current market conditions, including estimates of customer demand compared to the number of units currently on hand, and publication revision cycles. The inventory obsolescence reserve is reported as a reduction of the Inventories balance on the Consolidated Statements of Financial Position and amounted to $18.2 million and $21.1 million as of April 30, 2018 and 2017, respectively.
Product Development Assets:
Product development assets consist of book composition costs and other product development costs. Costs associated with developing a book publication are expensed until the product is determined to be commercially viable. Book composition costs represent the costs incurred to bring an edited commercial manuscript to publication, which include typesetting, proofreading, design, illustration costs, and digital formatting. Book composition costs are capitalized and are generally amortized on a double-declining basis over their estimated useful lives, ranging from 1 to 3 years. Other product development costs represent the costs incurred in developing software, platforms, and digital content to be sold and licensed to third parties. Other product development costs are capitalized and generally amortized on a straight-line basis over their estimated useful lives. As of April 30, 2018, the weighted average estimated useful life of other product development costs was approximately 6 years.
Royalty Advances:
Royalty advances are capitalized and, upon publication, are expensed as royalties earned based on sales of the published works. Royalty advances are reviewed for recoverability and a reserve for loss is maintained, if appropriate.
Shipping and Handling Costs:
Costs incurred for third party shipping and handling are reflected in Operating and Administrative Expenses on the Consolidated Statements of Income. We incurred $33.7 million, $39.1 million, and $40.5 million in shipping and handling costs in fiscal years 2018, 2017, and 2016, respectively.
Advertising Expense:
Advertising costs are expensed as incurred. We incurred $68.3 million, $61.4 million and $54.1 million in advertising costs in fiscal years 2018, 2017, and 2016, respectively, and these costs are included in Operating and Administrative Expenses on the Consolidated Statements of Income.
Technology, Property, and Equipment:
Technology, property, and equipment is recorded at cost. Major renewals and improvements are capitalized, while maintenance and repairs are expensed as incurred.
Technology, property and equipment is depreciated using the straight-line method based upon the following estimated useful lives: Computer Software – 3 to 10 years, Computer Hardware – 3 to 5 years; Buildings and Leasehold Improvements – the lesser of the estimated useful life of the asset up to 40 years or the duration of the lease; Furniture, Fixtures, and Warehouse Equipment – 3 to 10 years.
Costs incurred for computer software developed or obtained for internal use are capitalized during the application development stage and expensed as incurred during the preliminary project and post-implementation stages. Costs incurred during the application development stage include costs of materials and services and payroll and payroll-related costs for employees who are directly associated with the software project. Such costs are amortized over the expected useful life of the related software, which is generally 3 to 6 years. Costs related to the investment in our Enterprise Resource Planning and related systems are amortized over an expected useful life of 10 years. Maintenance, training, and upgrade costs that do not result in additional functionality are expensed as incurred.
54
Allocation of Acquisition Purchase Price to Assets Acquired and Liabilities Assumed:
In connection with acquisitions, we allocate the cost of the acquisition to the assets acquired and the liabilities assumed based on the estimates of fair value for such items, including intangible assets and technology acquired. Such estimates include discounted estimated cash flows to be generated by those assets and the expected useful lives based on historical experience, current market trends, and synergies to be achieved from the acquisition and the expected tax basis of assets acquired. We may use a third-party valuation consultant to assist in the determination of such estimates.
Goodwill and Indefinite-lived Intangible Assets:
Goodwill represents the excess of the aggregate of the following: (1) consideration transferred, (2) the fair value of any noncontrolling interest in the acquiree, and (3) if the business combination is achieved in stages, the acquisition-date fair value of our previously held equity interest in the acquiree over the net of the acquisition-date amounts of the identifiable assets acquired and the liabilities assumed.
Indefinite-lived intangible assets primarily consist of brands, trademarks, content, and publishing rights and are typically characterized by intellectual property with a long and well-established revenue stream resulting from strong and well-established imprint/brand recognition in the market.
We use the acquisition method of accounting for all business combinations and do not amortize goodwill or intangible assets with indefinite useful lives. Goodwill and intangible assets with indefinite useful lives are tested for possible impairment annually during the fourth quarter of each fiscal year, or more frequently if events or changes in circumstances indicate that the asset might be impaired.
Intangible Assets with Finite Lives and Other Long-Lived Assets:
Finite-lived intangible assets principally consist of brands, trademarks, content and publication rights, customer relationships, and non-compete agreements and are amortized over their estimated useful lives. The most significant factors in determining the estimated lives of these intangibles are the history and longevity of the brands, trademarks, and content and publication rights acquired combined with the strength of cash flows. Content and publication rights, trademarks, customer relationships, and brands with finite lives are amortized on a straight-line basis over periods ranging from 2 to 40 years. Non-compete agreements are amortized over the terms of the individual agreement, generally up to 5 years.
Intangible assets with finite lives as of April 30, 2018, are amortized on a straight line basis over the following weighted average estimated useful lives: content and publishing rights – 30 years, customer relationships – 20 years, brands and trademarks – 15 years, non-compete agreements – 5 years.
Assets with finite lives are evaluated for impairment upon a significant change in the operating or macroeconomic environment. In these circumstances, if an evaluation of the projected undiscounted cash flows indicates impairment, the asset is written down to its estimated fair value based on the discounted future cash flows.
Derivative Financial Instruments:
From time to time, we enter into foreign exchange forward and interest rate swap contracts as a hedge against foreign currency asset and liability commitments, changes in interest rates, and anticipated transaction exposures, including intercompany purchases. All derivatives are recognized as assets or liabilities and measured at fair value. Derivatives that are not determined to be effective hedges are adjusted to fair value with a corresponding adjustment to earnings. We do not use financial instruments for trading or speculative purposes.
Foreign Currency Gains/Losses:
We maintain operations in many non-U.S. locations. Assets and liabilities are translated into U.S. dollars using end-of-period exchange rates and revenues and expenses are translated into U.S. dollars using weighted average rates. Our significant investments in non-U.S. businesses are exposed to foreign currency risk. Foreign currency translation adjustments are reported as a separate component of Accumulated Other Comprehensive Loss within Shareholders' Equity. During fiscal year 2018, we recorded $67.6 million of foreign currency translation gains primarily due to the strengthening of the British pound sterling relative to the U.S. dollar and, to a lesser extent, the strengthening of the euro relative to the U.S. dollar. Foreign currency transaction gains or losses are recognized on the Consolidated Statements of Income as incurred.
55
Stock-Based Compensation:
We recognize stock-based compensation expense based on the fair value of the stock-based awards on the grant date, reduced by an estimate for future forfeited awards. As such, stock-based compensation expense is only recognized for those awards that are expected to ultimately vest. The fair value of stock-based awards is recognized in net income on a straight-line basis over the requisite service period. The grant date fair value for stock options is estimated using the Black-Scholes option-pricing model. The determination of the assumptions used in the Black-Scholes model required us to make significant judgments and estimates, which include the expected life of an option, the expected volatility of our Common Stock over the estimated life of the option, a risk-free interest rate, and the expected dividend yield. Judgment was also required in estimating the amount of stock-based awards that may be forfeited. Stock-based compensation expense associated with performance-based stock awards is based on actual financial results for targets established three years in advance. The cumulative effect on current and prior periods of a change in the estimated number of performance share awards, or estimated forfeiture rate, is recognized as an adjustment to earnings in the period of the revision. If actual results differ significantly from estimates, our stock-based compensation expense and consolidated results of operations could be impacted.
Recently Adopted Accounting Standards
In May 2017, the FASB issued ASU 2017-09, "Compensation— Stock Compensation (Topic 718): Scope of Modification Accounting," which clarifies when changes to the terms or conditions of a share-based payment award require an entity to apply modification accounting. Under the new guidance, modification accounting is only required if the fair value, vesting conditions or classification (equity or liability) of the new award are different from the original award immediately before the original award is modified. We adopted ASU 2017-09 on May 1, 2018. The new guidance must be applied prospectively to awards modified on or after the adoption date. The future impact of ASU 2017-09 will be dependent on the nature of future stock award modifications.
In March 2017, the FASB issued ASU 2017-07, "Compensation—Retirement Benefits (Topic 715): Improving the Presentation of Net Periodic Pension Cost and Net Periodic Postretirement Benefit Cost." The guidance requires that the service cost component of net pension and postretirement benefit costs be reported in the same line item as other compensation costs arising from services rendered by the pertinent employees during the period, while the other components of net benefit costs must be reported separately from the service cost component and below operating income. The guidance also allows only the service cost component to be eligible for capitalization when applicable. We adopted ASU 2017-07 on May 1, 2018. The new guidance must be applied retrospectively for the presentation of net benefit costs in the income statement and prospectively for the capitalization of the service cost component of net benefit costs. Our net pension and postretirement costs for the fiscal year ended April 30, 2018, includes approximately $8.1 million of net benefits that, upon adoption will be reclassified from operating income to a line item below operating income. Our net pension and retirement costs for the fiscal year ended April 30, 2017, includes $5.3 million of net charges that will be reclassified from operating income to a line item below operating income upon adoption.
In January 2017, the FASB issued ASU 2017-01, "Business Combinations (Topic 805): Clarifying the Definition of a Business", which clarifies the definition of a business in order to allow for the evaluation of whether transactions should be accounted for as acquisitions or disposals of assets or business. We adopted ASU 2017-01 on May 1, 2018. The future impact of ASU 2017-01 will be dependent upon the nature of future acquisitions or dispositions made by us.
In November 2016, the FASB issued ASU 2016-18, Statement of Cash Flows (Topic 230): Restricted Cash. ASU 2016-18 requires that entities include restricted cash and restricted cash equivalents with cash and cash equivalents in the beginning-of-period and end-of-period total amounts shown on the Statement of Cash Flows. We adopted ASU 2016-18 on May 1, 2018. Retrospective transition method is to be applied to each period presented. The adoption of ASU 2016-18 did not have a material impact to our consolidated financial statements.
In October 2016, the FASB issued ASU 2016-16, "Income Taxes (Topic 740): Intra-Entity Transfers of Assets Other than Inventory", which simplifies the accounting for the income tax consequences of intra-entity transfers of assets other than inventory. Current U.S. GAAP prohibits the recognition of current and deferred income taxes for an intra-entity asset transfer until the asset has been sold to an outside party. The new guidance states that an entity should recognize the income tax consequences of an intra-entity transfer of an asset other than inventory when the transfer occurs. Consequently, the amendments in this Standard eliminate the exception for an intra-entity transfer of an asset other than inventory. We adopted ASU 2016-16 on May 1, 2018. The adoption of ASU 2016-16 did not have a material impact to our consolidated financial statements.
In August 2016, the FASB issued ASU 2016-15, "Statement of Cash Flows (Topic 230): Classification of Certain Cash Receipts and Cash Payments," which provides clarification on classifying a variety of activities within the Statement of Cash Flows. We adopted ASU 2016-15 on May 1, 2018. The adoption of ASU 2016-15 did not have a material impact to our consolidated statements of cash flows.
56
In January 2016, the FASB issued ASU 2016-01, "Financial Instruments—Overall (Subtopic 825-10): Recognition and Measurement of Financial Assets and Financial Liabilities." Subsequently, the FASB issued ASU 2018-03, "Technical Corrections and Improvements to Financial Instruments-Overall." ASU 2016-01 requires equity investments except those under the equity method of accounting to be measured at fair value with the changes in fair value recognized in net income. The amendment simplifies the impairment assessment of equity investments without readily determinable fair values by requiring a qualitative assessment to identify impairment. In addition, it also requires enhanced disclosures about investments. We adopted ASU 2016-01 on May 1, 2018. The adoption of ASU 2016- 01 did not have a material impact to our consolidated financial statements.
In May 2014, the FASB issued ASU 2014-09, "Revenue from Contracts with Customers" (Topic 606) which superseded most existing revenue recognition guidance. We adopted ASU 2014-09 on May 1, 2018. The standard allows for either "full retrospective" adoption, meaning the standard is applied to all periods presented, or "modified retrospective" adoption, meaning the standard is applied only to the most current period presented in the financial statements. Subsequently, the FASB issued ASU 2016-08, "Revenue from Contracts with Customers (Topic 606) – Principal versus Agent Considerations", ASU 2016-10, "Revenue from Contracts with Customers (Topic 606) – Identifying Performance Obligations and Licensing", ASU 2016-12, "Revenue from Contracts with Customers (Topic 606) – Narrow Scope Improvements and Practical Expedients", and ASU 2016-20, "Technical Corrections and Improvements to Topic 606, Revenue from Contracts with Customers," which provide clarification and additional guidance related to ASU 2014-09. We also adopted ASU 2016-08, ASU 2016-10, ASU 2016-12, and ASU 2016-20 with ASU 2014-09 on May 1, 2018.
We utilized a comprehensive approach to assess the impact of the standard on our contract portfolio by reviewing our current accounting policies and practices to identify differences that would result from applying the new standard to our revenue contracts.
We adopted the new revenue standard as of May 1, 2018, using the modified retrospective method. The adoption of the standard did not have a material impact to our consolidated revenues, financial position, or results of operations. Accordingly, we will record an immaterial net increase to opening retained earnings upon adoption resulting from the acceleration of revenue recognized under the standard.
Although the adoption of the new revenue standard is not material to our consolidated financial position, or results of operations, there are certain components of our revenue where the standard changes the timing of when revenue is recognized compared to our historical policies due to: (i) perpetual licenses granted in connection with other deliverables, previously recognized over the life of the associated subscription for future content, which we will now recognize the revenue at a point in time, which is when access is granted, (ii) customers' unexercised rights, which was previously recognized at the end of a pre-determined period for situations where we have received a nonrefundable payment for a customer to receive a good or service and the customer has not exercised such right, which we will now recognize such breakage amounts as revenue in proportion to the pattern of rights exercised by the customer, (iii) recognition of royalties in the period of usage, and (iv) recognition of certain arrangements with minimum guarantees on a time-based (straight-line) basis due to a stand-ready obligation to provide additional rights to content.
In addition, the adoption of the standard results in the discontinuance of the historical practice of presenting accounts receivable and deferred revenue balances on a net basis for some of our subscription licensing agreements where we have invoiced a customer in advance of the related revenue being recognized and payment has not yet been received. As of April 30, 2018, the amounts that were netted down from accounts receivable and deferred revenue were $59.5 million.
Effective April 30, 2017, we adopted ASU 2015-17 "Income Taxes (Topic 740): Balance Sheet Classification of Deferred Taxes." ASU 2015-17 requires that deferred tax liabilities and assets be classified as noncurrent in a classified statement of financial position. We elected to adopt this standard prospectively and thus prior period balances were not adjusted. As of April 30, 2017, there were $0.8 million of current deferred tax assets reported within Prepaid and Other Current Assets on the Consolidated Statements of Financial Position.
In March 2016, the FASB issued ASU 2016-09, "Compensation—Stock Compensation (Topic 718): Improvements to Employee Share-Based Payment Accounting," which simplifies the accounting for share-based payment transactions, including income taxes, classification of awards as either equity or liabilities, and classification on the statement of cash flows. The new guidance also allows an entity to make an accounting policy election to account for forfeitures when they occur or to estimate the number of awards that are expected to vest with a subsequent true up to actual forfeitures (current U.S. GAAP). We adopted ASU 2016-09 on a prospective basis on May 1, 2017. As a result of the adoption:
| · |
Excess income tax benefits and deficiencies from stock-based compensation are now recognized as a discrete item within the Provision for Income Taxes in the Consolidated Statements of Income, rather than Additional Paid-In-Capital on the Consolidated Statements of Financial Position, and amounted to $1.6 million for fiscal year 2018.
|
| · |
Excess income tax benefits and deficiencies are no longer considered when applying the treasury stock method for computing diluted shares outstanding, which resulted in an increase in diluted shares outstanding of less than 0.1 million.
|
| · |
Excess income tax benefits and deficiencies are now classified as an Operating Activity on the Consolidated Statements of Cash Flows. There were no excess tax benefits recorded in operating activities for fiscal year 2018, while $0.4 million were recorded in Financing Activities for fiscal year 2017.
|
| · |
We have elected to continue estimating expected forfeitures in determining stock compensation expense each period.
|
57
Recently Issued Accounting Standards
In February 2018, the FASB issued ASU 2018-02 "Income Statement—Reporting Comprehensive Income (Topic 220): Reclassification of Certain Tax Effects from Accumulated Other Comprehensive Income," which allows a reclassification from accumulated other comprehensive income to retained earnings for stranded tax effects resulting from the Tax Cuts and Jobs Act. The standard is effective for us on May 1, 2019, and interim periods within that fiscal year, with early adoption permitted. We are currently assessing the impact the new guidance will have on our consolidated financial statements.
In August 2017, the FASB issued ASU 2017-12, "Derivatives and Hedging (Topic 815): Targeted Improvements to Accounting for Hedging Activities," to simplify and improve the application and financial reporting of hedge accounting. The guidance eases the requirements for measuring and reporting hedge ineffectiveness, and clarifies that changes in the fair value of hedging instruments for cash flow, net investment, and fair value hedges should be reflected in the same income statement line item as the earnings effect of the hedged item. The guidance also permits entities to designate specific components in cash flow and interest rate hedges as the hedged risk, instead of using total cash flows. The standard is effective for us on May 1, 2019, with early adoption permitted. We are currently assessing the impact the new guidance will have on our consolidated financial statements.
In January 2017, the FASB issued ASU 2017-04, "Intangibles–Goodwill and Other (Topic 350): "Simplifying the Test for Goodwill Impairment", which simplifies the measurement of a potential goodwill impairment charge by eliminating the requirement to calculate an implied fair value of the goodwill based on the fair value of a reporting unit's other assets and liabilities. The new guidance eliminates the implied fair value method and instead measures a potential impairment charge based on the excess of a reporting unit's carrying value compared to its fair value. The impairment charge cannot exceed the total amount of goodwill allocated to that reporting unit. The standard is effective for us on May 1, 2020, with early adoption permitted. Based on our most recent annual goodwill impairment test completed in fiscal year 2018, we expect no initial impact on adoption.
In June 2016, the FASB issued ASU 2016-13, "Financial Instruments—Credit Losses (Topic 326), Measurement of Credit Losses on Financial Instruments." ASU 2016-13 requires entities to measure all expected credit losses for most financial assets held at the reporting date based on an expected loss model which includes historical experience, current conditions, and reasonable and supportable forecasts. Entities will now use forward-looking information to better form their credit loss estimates. ASU 2016-13 also requires enhanced disclosures to help financial statement users better understand significant estimates and judgments used in estimating credit losses, as well as the credit quality and underwriting standards of an entity's portfolio. ASU 2016-13 is effective for us on May 1, 2020, including interim periods within those fiscal periods, with early adoption permitted. We are currently assessing the impact the new guidance will have on our consolidated financial statements.
In February 2016, the FASB issued ASU 2016-02, "Leases (Topic 842)". ASU 2016-02 requires an entity to recognize a right-of-use asset and lease liability for all leases with terms of more than 12 months. Recognition, measurement, and presentation of expenses will depend on classification as a finance or operating lease. Similar modifications have been made to lessor accounting in-line with revenue recognition guidance. The standard is effective for us on May 1, 2019, with early adoption permitted. Adoption requires application of the new guidance to the beginning of the earliest period presented using a modified retrospective approach. We are currently assessing the impact the new guidance will have on our consolidated financial statements.
A reconciliation of the shares used in the computation of earnings per share for the years ended April 30 follows:
|
2018
|
2017
|
2016
|
||||||||||
|
Weighted Average Shares Outstanding
|
57,181
|
57,531
|
58,253
|
|||||||||
|
Less: Unvested Restricted Shares
|
(138
|
)
|
(194
|
)
|
(255
|
)
|
||||||
|
Shares Used for Basic Earnings Per Share
|
57,043
|
57,337
|
57,998
|
|||||||||
|
Dilutive Effect of Stock Options and Other Stock Awards
|
845
|
862
|
736
|
|||||||||
|
Shares Used for Diluted Earnings Per Share
|
57,888
|
58,199
|
58,734
|
|||||||||
Since their inclusion in the calculation of diluted earnings per share would have been anti-dilutive, options to purchase 244,590, 301,527 and 336,803 shares of Class A Common Stock have been excluded for fiscal years 2018, 2017 and 2016, respectively. In addition, for fiscal years 2018, 2017 and 2016 unvested restricted shares of 26,740, none and 15,200 respectively, have been excluded as their inclusion would have been anti-dilutive.
58
Changes in Accumulated Other Comprehensive Loss by component, net of tax, for the fiscal years ended April 30, 2018 and 2017, were as follows:
|
Foreign Currency
Translation Adjustment
|
Unamortized
Retirement Costs
|
Interest
Rate Swaps
|
Total
|
|||||||||||||
|
Balance at April 30, 2016
|
$
|
(267,920
|
)
|
$
|
(179,405
|
)
|
$
|
(361
|
)
|
$
|
(447,686
|
)
|
||||
|
Other comprehensive (loss) income before reclassifications
|
(51,292
|
)
|
(18,458
|
)
|
2,735
|
(67,015
|
)
|
|||||||||
|
Amounts reclassified from Accumulated Other Comprehensive Loss
|
—
|
7,361
|
53
|
7,414
|
||||||||||||
|
Total other comprehensive (loss) income
|
(51,292
|
)
|
(11,097
|
)
|
2,788
|
(59,601
|
)
|
|||||||||
|
Balance at April 30, 2017
|
$
|
(319,212
|
)
|
$
|
(190,502
|
)
|
$
|
2,427
|
$
|
(507,287
|
)
|
|||||
|
Other comprehensive income (loss) before reclassifications
|
67,639
|
(4,979
|
)
|
1,739
|
64,399
|
|||||||||||
|
Amounts reclassified from Accumulated Other Comprehensive Loss
|
—
|
4,455
|
(1,147
|
)
|
3,308
|
|||||||||||
|
Total other comprehensive income (loss)
|
67,639
|
(524
|
)
|
592
|
67,707
|
|||||||||||
|
Balance at April 30, 2018
|
$
|
(251,573
|
)
|
$
|
(191,026
|
)
|
$
|
3,019
|
$
|
(439,580
|
)
|
|||||
For the fiscal years ended April 30, 2018 and 2017, pre-tax actuarial losses included in Unamortized Retirement Costs of approximately $5.9 million and $11.1 million, respectively, were amortized from Accumulated Other Comprehensive Loss and recognized as pension expense in Operating and Administrative Expenses on the Consolidated Statements of Income.
Atypon:
On September 30, 2016, we acquired the net assets of Atypon Systems, Inc. ("Atypon"), a Silicon Valley-based publishing-software company, for approximately $121 million in cash, net of cash acquired. We finalized our purchase accounting for Atypon on July 31, 2017, and there were no material changes in the purchase accounting allocation compared to April 30, 2017. We recorded the fair value of the assets acquired and liabilities assumed on the acquisition date, which included $48 million of intangible assets. Goodwill of $70 million was recorded, which is deductible for tax purposes.
Atypon's revenue and operating loss included in our results for fiscal year 2018 were $32.9 million and $2.7 million, respectively. Atypon's revenue and operating loss included in our results for fiscal year 2017 were $19.1 million and $3.5 million, respectively.
In fiscal years 2018, 2017 and 2016, we recorded pre-tax restructuring and related charges of $28.6 million, $13.4 million, and $28.6 million, respectively, which are reflected in the Restructuring and Related Charges line item on the Consolidated Statements of Income and described in more detail below:
Restructuring and Reinvestment Program:
Beginning in fiscal year 2013, we initiated a global program (the "Restructuring and Reinvestment Program") to restructure and realign our cost base with current and anticipated future market conditions. We are targeting a majority of the expected cost savings achieved to improve margins and earnings, while the remainder will be reinvested in high-growth digital business opportunities.
59
The following tables summarize the pre-tax restructuring charges related to this program:
|
2018
|
2017
|
2016
|
Total Charges
Incurred to Date
|
|||||||||||||
|
Charges by Segment:
|
||||||||||||||||
|
Research
|
$
|
5,257
|
$
|
1,949
|
$
|
2,982
|
$
|
25,413
|
||||||||
|
Publishing
|
6,443
|
1,596
|
4,507
|
38,931
|
||||||||||||
|
Solutions
|
3,695
|
1,787
|
1,042
|
6,247
|
||||||||||||
|
Corporate Expenses
|
13,171
|
8,023
|
20,080
|
95,919
|
||||||||||||
|
Total Restructuring and Related Charges
|
$
|
28,566
|
$
|
13,355
|
$
|
28,611
|
$
|
166,510
|
||||||||
|
Charges (Credits) by Activity:
|
||||||||||||||||
|
Severance
|
$
|
27,213
|
$
|
8,386
|
$
|
16,443
|
$
|
114,803
|
||||||||
|
Process Reengineering Consulting
|
1,815
|
148
|
7,191
|
20,629
|
||||||||||||
|
Other Activities
|
(462
|
)
|
4,821
|
4,977
|
31,078
|
|||||||||||
|
Total Restructuring and Related Charges
|
$
|
28,566
|
$
|
13,355
|
$
|
28,611
|
$
|
166,510
|
||||||||
Other Activities in 2017 and 2016 reflects leased facility consolidations, contract termination costs, and the curtailment of certain defined benefit pension plans.
The following table summarizes the activity for the Restructuring and Reinvestment Program liability for fiscal year 2018:
|
April 30, 2017
|
Charges
|
Payments
|
Foreign Translation
and Reclassification
|
April 30, 2018
|
||||||||||||||||
|
Severance
|
$
|
10,082
|
$
|
27,213
|
$
|
(21,197
|
)
|
$
|
1,181
|
$
|
17,279
|
|||||||||
|
Process Reengineering Consulting
|
—
|
1,815
|
(1,815
|
)
|
—
|
—
|
||||||||||||||
|
Other Activities
|
12,708
|
(462
|
)
|
(7,583
|
)
|
(1,891
|
)
|
2,772
|
||||||||||||
|
Total
|
$
|
22,790
|
$
|
28,566
|
$
|
(30,595
|
)
|
$
|
(710
|
)
|
$
|
20,051
|
||||||||
The restructuring liability for accrued severance costs of $17.3 million is reflected in Accrued Employment Costs on the Consolidated Statements of Financial Position. Approximately $0.9 million and $1.9 million of the Other Activities are included in Other Accrued Liabilities and Other Long-Term Liabilities, respectively on the Consolidated Statements of Financial Position. The amount included in Other Long-Term Liabilities that relates to Other Activities is expected to be paid starting in 2020 until 2022.
Inventories at April 30 were as follows:
|
2018
|
2017
|
|||||||
|
Finished Goods
|
$
|
36,503
|
$
|
38,329
|
||||
|
Work-in-Process
|
2,139
|
7,078
|
||||||
|
Paper and Other Materials
|
550
|
650
|
||||||
|
39,192
|
46,057
|
|||||||
|
Inventory Value of Estimated Sales Returns
|
4,626
|
4,727
|
||||||
|
LIFO Reserve
|
(4,329
|
)
|
(2,932
|
)
|
||||
|
Total Inventories
|
$
|
39,489
|
$
|
47,852
|
||||
See Note 2, "Summary of Significant Accounting Policies, Recently Issued and Recently Adopted Accounting Standards," under the caption "Sales Return Reserves," for a discussion of the Inventory Value of Estimated Sales Returns. Finished Goods are net of a reserve for inventory obsolescence of $18.2 million and $21.1 million as of April 30, 2018 and 2017, respectively.
Product development assets consisted of the following at April 30:
|
2018
|
2017
|
|||||||
|
Book Composition Costs
|
$
|
24,887
|
$
|
28,884
|
||||
|
Other Product Development Costs
|
53,927
|
51,501
|
||||||
|
Total
|
$
|
78,814
|
$
|
80,385
|
||||
60
Book composition costs are net of accumulated amortization of $188.7 million and $172.6 million as of April 30, 2018 and 2017, respectively. Other Product Development Costs are net of accumulated amortization of $49.4 million and $33.5 million as of April 30, 2018 and 2017, respectively.
Technology, property and equipment consisted of the following at April 30:
|
2018
|
2017
|
|||||||
|
Capitalized Software
|
$
|
390,774
|
$
|
356,907
|
||||
|
Computer Hardware
|
57,493
|
60,467
|
||||||
|
Buildings and Leasehold Improvements
|
121,381
|
103,774
|
||||||
|
Furniture, Fixtures, and Warehouse Equipment
|
60,869
|
55,106
|
||||||
|
Land and Land Improvements
|
3,678
|
3,354
|
||||||
|
634,195
|
579,608
|
|||||||
|
Accumulated Depreciation and Amortization
|
(344,261
|
)
|
(336,550
|
)
|
||||
|
Total
|
$
|
289,934
|
$
|
243,058
|
||||
The following table details our depreciation and amortization expense for technology, property and equipment for the fiscal years ended April 30:
|
2018
|
2017
|
2016
|
||||||||||
|
Capitalized Software Amortization Expense
|
$
|
45,449
|
$
|
48,343
|
$
|
49,642
|
||||||
|
Depreciation and Amortization Expense, Excluding Capitalized Software
|
18,878
|
18,340
|
16,785
|
|||||||||
|
Total Depreciation and Amortization Expense for Technology, Property, and Equipment
|
$
|
64,327
|
$
|
66,683
|
$
|
66,427
|
||||||
The net book value of capitalized software costs was $198.0 million and $192.7 million as of April 30, 2018 and 2017, respectively.
In fiscal year 2018, we wrote off approximately $51.8 million of fully depreciated capitalized software and computer hardware that were no longer in use.
Goodwill
The following table summarizes the activity in goodwill by segment as of April 30:
|
2017
|
Foreign
Translation
Adjustment
|
2018
|
||||||||||
|
Research
|
$
|
437,928
|
$
|
25,491
|
$
|
463,419
|
||||||
|
Publishing
|
283,192
|
12,209
|
295,401
|
|||||||||
|
Solutions
|
260,981
|
—
|
260,981
|
|||||||||
|
Total
|
$
|
982,101
|
$
|
37,700
|
$
|
1,019,801
|
||||||
We review goodwill for impairment on a reporting unit basis annually during the third quarter of each year, using a measurement date of January 31, and whenever events or changes in circumstances indicate the carrying value of goodwill may not be recoverable. While we are permitted to conduct a qualitative assessment to determine whether it is necessary to perform a two-step quantitative goodwill impairment test, for our annual goodwill impairment test in the third quarter of 2018, 2017, and 2016, we performed a quantitative test for all of our reporting units.
The goodwill impairment test involves a two-step process. In step one, we compare the fair value of each of our reporting units to its carrying value, including the goodwill allocated to the reporting unit. If the fair value of the reporting unit exceeds its carrying value, there is no indication of impairment and no further testing is required. If the fair value of the reporting unit is less than the carrying value, we must perform step two of the impairment test to measure the amount of impairment loss, if any. In step two, the reporting unit's fair value is allocated to all of the assets and liabilities of the reporting unit, including any unrecognized intangible assets, in a hypothetical analysis that calculates the implied fair value of goodwill in the same manner as if the reporting unit was being acquired in a business combination. If the implied fair value of the reporting unit's goodwill is less than the carrying value, the difference is recorded as an impairment loss.
61
2018 Annual Impairment Test as of January 31, 2018
During the third quarter of 2018, we completed step one of our annual goodwill impairment test for our reporting units. We concluded that the fair values of these reporting units were above their carrying values and, therefore, there was no indication of impairment.
We estimated the fair value of these reporting units using a weighting of fair values derived from an income and a market approach. Under the income approach, we determined the fair value of a reporting unit based on the present value of estimated future cash flows. Cash flow projections are based on management's estimates of revenue growth rates and operating margins, taking into consideration industry and market conditions. The discount rate used is based on a weighted average cost of capital adjusted for the relevant risk associated with the characteristics of the business and the projected cash flows. The market approach estimates fair value based on market multiples of current and forward 12-month operating performance results, as applicable, derived from comparable publicly traded companies with similar operating and investment characteristics as the reporting unit.
As noted above, the fair value determined under step one of the goodwill impairment test completed in the third quarter of 2018 exceeded the carrying value for each reporting unit. Therefore, there was no impairment of goodwill. However, if the fair value decreases in future periods, we may fail step one of the goodwill impairment test and be required to perform step two. In performing step two, the fair value would have to be allocated to all of the assets and liabilities of the reporting unit. Therefore, any potential goodwill impairment charge would be dependent upon the estimated fair value of the reporting unit at that time and the outcome of step two of the impairment test. The fair values of the assets and liabilities of the reporting unit, including the intangible assets, could vary depending on various factors.
The future occurrence of a potential indicator of impairment, such as a decrease in expected net earnings, adverse equity market conditions, a decline in current market multiples, a decline in our common stock price, a significant adverse change in legal factors or business climates, an adverse action or assessment by a regulator, unanticipated competition, strategic decisions made in response to economic or competitive conditions, or a more-likely-than-not expectation that a reporting unit or a significant portion of a reporting unit will be sold or disposed of, could require an interim assessment for some or all of the reporting units before the next required annual assessment. In the event of significant adverse changes of the nature described above, we might have to recognize a non-cash impairment of goodwill, which could have a material adverse effect on our consolidated financial condition.
We also review our indefinite-lived intangible assets for impairment annually, which consists of brands and trademarks and certain acquired publishing rights. During the third quarter of 2018, we completed our annual impairment test related to the indefinite lived intangible assets. We concluded that the fair values of these indefinite-lived intangible assets were above their carrying values and, therefore, there was no indication of impairment.
Change in Annual Impairment Assessment Date
During the fourth quarter of 2018, we voluntarily changed our annual impairment assessment date from January 31 to February 1 for all of our reporting units and our indefinite-lived intangible assets. This change was made to improve alignment of impairment testing procedures with year-end financial reporting, our annual business planning and budgeting process and the multi-year strategic forecast, which begins in the fourth quarter of each year. As a result, the goodwill and indefinite-lived intangible asset impairment testing will reflect the result of inputs from each of the businesses in the development of the budget and forecast process, including the impact of seasonality of our financial results. Accordingly, management considers this accounting change preferable. This change does not accelerate, delay, avoid, or cause an impairment charge, nor does this change result in adjustments to previously issued financial statements.
In connection with the change in the date of the annual goodwill impairment test, we completed a qualitative assessment of the goodwill by reporting unit as of February 1, 2018, and concluded that it was more likely than not that the fair value of each of the reporting units exceeded its carrying amount. In addition, we also completed a qualitative assessment of our indefinite-lived intangible assets as of February 1, 2018, and concluded that it was more likely than not that the fair value of each of the indefinite-lived intangible assets exceeded its carrying amount.
62
Intangibles
Intangible assets as of April 30 were as follows:
|
2018
|
2017
|
|||||||||||||||||||||||||||
|
Cost
|
Accumulated
Amortization
|
Accumulated
Impairment
|
Net
|
Cost
|
Accumulated
Amortization
|
Net
|
||||||||||||||||||||||
|
Intangible Assets with Determinable Lives
|
||||||||||||||||||||||||||||
|
Content and Publishing Rights
|
$
|
824,146
|
$
|
(387,386
|
)
|
$
|
—
|
$
|
436,760
|
$
|
775,520
|
$
|
(353,923
|
)
|
$
|
421,597
|
||||||||||||
|
Customer Relationships
|
212,020
|
(50,291
|
)
|
—
|
161,729
|
233,872
|
(64,756
|
)
|
169,116
|
|||||||||||||||||||
|
Brands and Trademarks
|
32,111
|
(16,011
|
)
|
—
|
16,100
|
35,554
|
(18,359
|
)
|
17,195
|
|||||||||||||||||||
|
Covenants not to Compete
|
1,499
|
(844
|
)
|
—
|
655
|
2,377
|
(1,420
|
)
|
957
|
|||||||||||||||||||
|
|
1,069,776
|
(454,532
|
)
|
—
|
615,244
|
1,047,323
|
(438,458
|
)
|
608,865
|
|||||||||||||||||||
|
Intangible Assets with Indefinite Lives
|
||||||||||||||||||||||||||||
|
Brands and Trademarks
|
142,189
|
—
|
(3,600
|
)
|
138,589
|
135,061
|
—
|
135,061
|
||||||||||||||||||||
|
Content and Publishing Rights
|
94,238
|
—
|
—
|
94,238
|
84,173
|
—
|
84,173
|
|||||||||||||||||||||
|
$
|
1,306,203
|
$
|
(454,532
|
)
|
$
|
(3,600
|
)
|
$
|
848,071
|
$
|
1,266,557
|
$
|
(438,458
|
)
|
$
|
828,099
|
||||||||||||
Based on the current amount of intangible assets subject to amortization and assuming current foreign exchange rates, the estimated amortization expense for each of the succeeding five fiscal years are as follows: 2019 – $48.2 million, 2020 – $43.6 million, 2021 – $41.4 million, 2022 – $36.4 million, and 2023 – $32.7 million.
In conjunction with a business review performed in the Publishing segment associated with the restructuring activities in the first quarter of fiscal year 2018, we identified an indefinite-lived brand with forecasted cash flows that did not exceed its carrying value. As a result, an impairment charge of $3.6 million was recorded in the first quarter of fiscal year 2018 to reduce the carrying value of the brand to its fair value of $1.2 million, which will now be amortized over an estimated useful life of 5 years. This impairment charge was included in Operating and Administrative Expenses on the Consolidated Statements of Income.
The provisions for income taxes for the years ended April 30 were as follows:
|
2018
|
2017
|
2016
|
||||||||||
|
Current Provision
|
||||||||||||
|
U.S. – Federal
|
$
|
(2,216
|
)
|
$
|
912
|
$
|
(5,365
|
)
|
||||
|
International
|
46,112
|
105,228
|
31,958
|
|||||||||
|
State and Local
|
961
|
100
|
1,657
|
|||||||||
|
Total Current Provision
|
$
|
44,857
|
$
|
106,240
|
$
|
28,250
|
||||||
|
Deferred Provision (Benefit)
|
||||||||||||
|
U.S. – Federal
|
$
|
(26,062
|
)
|
$
|
(13,852
|
)
|
$
|
6,625
|
||||
|
International
|
2,420
|
(15,330
|
)
|
(6,459
|
)
|
|||||||
|
State and Local
|
530
|
415
|
595
|
|||||||||
|
Total Deferred (Benefit) Provision
|
$
|
(23,112
|
)
|
$
|
(28,767
|
)
|
$
|
761
|
||||
|
Total Provision
|
$
|
21,745
|
$
|
77,473
|
$
|
29,011
|
||||||
International and United States pretax income for the years ended April 30 were as follows:
|
2018
|
2017
|
2016
|
||||||||||
|
International
|
$
|
219,178
|
$
|
192,910
|
$
|
159,152
|
||||||
|
United States
|
(5,247
|
)
|
(1,794
|
)
|
15,641
|
|||||||
|
Total
|
$
|
213,931
|
$
|
191,116
|
$
|
174,793
|
||||||
63
Our effective income tax rate as a percentage of pretax income differed from the U.S. federal statutory rate as shown below:
|
2018
|
2017
|
2016
|
||||||||||
|
U.S. Federal Statutory Rate
|
30.4
|
%
|
35.0
|
%
|
35.0
|
%
|
||||||
|
German Tax Litigation Expense
|
—
|
25.7
|
—
|
|||||||||
|
Benefit from Lower Taxes on Non-U.S. Income
|
(8.4
|
)
|
(12.7
|
)
|
(14.6
|
)
|
||||||
|
State Income Taxes, Net of U.S. Federal Tax Benefit
|
0.4
|
0.1
|
0.8
|
|||||||||
|
U.S. Tax Reform
|
(11.7
|
)
|
—
|
—
|
||||||||
|
Deferred Tax Benefit From U.K. Statutory Tax Rate Change
|
—
|
(1.3
|
)
|
(3.4
|
)
|
|||||||
|
Tax Credits and Related Benefits
|
(1.7
|
)
|
(6.2
|
)
|
(1.6
|
)
|
||||||
|
Tax Adjustments and Other
|
1.2
|
(0.1
|
)
|
0.4
|
||||||||
|
Effective Income Tax Rate
|
10.2
|
%
|
40.5
|
%
|
16.6
|
%
|
||||||
Note: A substantial portion of our income is earned outside the U.S. in jurisdictions with lower statutory income tax rates than our U.S. statutory rate in 2018 including: U.K. (63%), Germany (25%), and Australia (7%).
On December 22, 2017, the U.S. government enacted comprehensive Federal tax legislation originally known as the Tax Cuts and Jobs Act of 2017 (the "Tax Act"). In December 2017, the SEC staff issued Staff Accounting Bulletin No. 118, Income Tax Accounting Implications of the Tax Cuts and Jobs Act ("SAB 118"), which allows us to record provisional amounts related to the effect of the Tax Act during a measurement period not to extend beyond one year of the enactment date. As the Tax Act was passed late in December 2017, and ongoing guidance and accounting interpretation are expected over the 12 months following enactment, we consider the accounting of the transition tax, deferred tax re-measurements and other items to be provisional due to the forthcoming guidance and our ongoing analysis of final data and tax positions. We expect to complete our analysis within the measurement period in accordance with SAB 118.
The effective tax rate for fiscal year 2018 was lower than fiscal 2017 due to the estimated net tax benefit from non-recurring items in the Tax Act and the effect of the German Tax litigation in fiscal year 2017 as described below. Estimated non-recurring items in the Tax Act reduced our income tax expense by $25.1 million ($0.43/share) or a reduction in our effective tax rate of 11.7 percentage points for fiscal year 2018. Excluding the effect of the Tax Act, the rate was 21.9% for fiscal year 2018.
The rate excluding the benefit from the non-recurring items in the Tax Act was lower than the U.S. statutory rate for the year ended April 30, 2018, primarily due to lower rates applicable to non-U.S. earnings.
German Tax Litigation Expense: In fiscal 2017, the German Federal Fiscal Court affirmed a lower court decision disallowing deductions related to a stepped-up basis in certain assets. As a result, we incurred an income tax charge of approximately $49 million ($0.85 per share).
Deferred Tax Benefit from U.K. Statutory Tax Rate Change: In fiscal year 2016, the U.K. reduced its statutory rate to 19% beginning April 1, 2017, and 18% beginning April 1, 2020, and in fiscal year 2017, the U.K. further reduced its statutory rate beginning on April 1, 2020, from 18% to 17%. This resulted in a non-cash deferred tax benefit from the re-measurement of our applicable U.K. deferred tax balances of $5.9 million ($0.10 per share) in fiscal year 2016 and $2.6 million ($0.04 per share) in fiscal year 2017.
Tax Adjustments and Other: In fiscal year 2018, we recorded a tax benefit of $0.6 million related to the expiration of the statute of limitations or favorable resolutions of federal, state, and foreign tax matters with tax authorities. No benefit was recorded in fiscal year 2017 and a benefit of $1.3 million was recorded in fiscal year 2016 related to such matters.
The Tax Act
On December 22, 2017, the U.S. government enacted comprehensive tax legislation. The Tax Act significantly revises the future ongoing U.S. corporate income tax system by, among other changes, the following:
| · |
lowering the U.S. federal corporate income tax rate to 21% with a potentially lower rate for certain foreign derived income;
|
| · |
accelerating deductions for certain business assets;
|
| · |
changing the U.S. system from a worldwide tax system;
|
| · |
requiring companies to pay a one-time transition tax on post-1986 unrepatriated cumulative non-U.S. earnings and profits ("E&P") of foreign subsidiaries;
|
| · |
eliminating certain deductions such as the domestic production deduction;
|
| · |
establishing limitations on the deductibility of certain expenses including interest and executive compensation; and
|
| · |
creating new taxes on certain foreign earnings.
|
64
The key impacts for the period were the re-measurement of U.S. deferred tax balances to the new U.S. corporate tax rate and the accrual for the one-time transition tax liability. While we have not yet completed our assessment of the effects of the Tax Act, we are able to determine reasonable estimates for the impacts of these key items and reported provisional amounts for these items. In accordance with SAB 118, we are providing additional disclosures related to these provisional amounts.
Deferred tax balances – We remeasured our U.S. deferred tax assets and liabilities based on the federal rate at which they are expected to reverse in the future, generally 21% for reversals anticipated to occur after April 30, 2018. We are still analyzing certain aspects of the Tax Act and refining our calculations, including our estimates of expected reversals, which could affect the measurement of these balances and give rise to new deferred tax amounts. The provisional amount recorded related to the re-measurement of our net deferred tax liability was an estimated benefit of $47 million.
Foreign tax effects – In connection with the transition from a global tax system, the Tax Act establishes a mandatory deemed repatriation tax. The tax is computed using our post-1986 E&P that was previously deferred from U.S. income taxes. The tax is based on the amount of foreign earnings held in cash equivalents and certain net assets, which are taxed at 15.5%, and those held in other assets, which are taxed at 8%. We recorded a provisional amount of $14.2 million. We also established an estimated valuation allowance of $6.5 million. This resulted in a corresponding decrease in deferred tax assets due to the utilization of foreign tax credit carryforwards. The determination of the transition tax requires further guidance as to its applicability to non-calendar year end taxpayers and analysis regarding the amount and composition of our historical foreign earnings. We no longer assert that we intend to permanently reinvest earnings outside the U.S. and accrued a provisional $2.0 million related to our estimated taxes from repatriating earnings with available cash. In addition, we accrued a $0.1 million provisional state tax liability, pending further guidance and legislative action from various states regarding conformity with the Tax Act.
The Tax Act reduces the Federal statutory tax rate from 35% to 21% effective January 1, 2018. As a result, our U.S. federal statutory tax rate for our fiscal year ended April 30, 2018, is a blended rate of 30.4%. Other than the benefit from remeasuring our U.S. deferred tax assets and liabilities, the reduced rate did not have a significant impact on our effective tax rate for fiscal year 2018
We have not determined a reasonable estimate of the tax liability, if any, under the Tax Act for our remaining outside basis difference. We will continue to evaluate our position for this matter as we finalize our Tax Act calculations.
The Tax Act creates new taxes, effective for us on May 1, 2018, including a provision designed to tax global low taxed income ("GILTI") and a provision establishing new minimum taxes, such as the base erosion anti-abuse tax ("BEAT"). We continue to evaluate the Tax Act, but due to the complexity and incomplete guidance of various provisions, we have not completed our accounting for the income tax effects of certain elements of the Tax Act, including the new GILTI and BEAT taxes. We have not yet determined whether such taxes should be recorded as a current-period expense when incurred or factored into the measurement of our deferred taxes. As a result, we have not included an estimate of any tax expense or benefit related to these items for the year ended April 30, 2018.
Accounting for Uncertainty in Income Taxes:
As of April 30, 2018 and April 30, 2017, the total amount of unrecognized tax benefits were $6.8 million and $6.1 million, respectively, of which $0.6 million and $0.4 million represented accruals for interest and penalties recorded as additional tax expense in accordance with our accounting policy. Within the income tax provision for both fiscal years 2018 and 2017, we recorded net interest expense on reserves for unrecognized and recognized tax benefits of $0.2 million and $0.3 million respectively. As of April 30, 2018, and April 30, 2017, the total amount of unrecognized tax benefits that would reduce our income tax provision, if recognized, were approximately $6.8 million and $6.1 million, respectively. During the year ended April 30, 2017, our tax position with respect to certain assets in Germany was finally rejected by the German Federal Fiscal Court. Substantially, all of the reduction for prior year tax positions in the table below relates to the resolution of that matter. We do not expect any significant changes to the unrecognized tax benefits within the next twelve months.
A reconciliation of the unrecognized tax benefits included within the Other Long-Term Liabilities line item on the Consolidated Statements of Financial Position follows:
|
2018
|
2017
|
|||||||
|
Balance at May 1st
|
$
|
6,124
|
$
|
19,863
|
||||
|
Additions for Current Year Tax Positions
|
1,372
|
2,566
|
||||||
|
Additions for Prior Year Tax Positions
|
69
|
31,802
|
||||||
|
Reductions for Prior Year Tax Positions
|
(38
|
)
|
—
|
|||||
|
Foreign Translation Adjustment
|
45
|
(419
|
)
|
|||||
|
Payments and Settlements
|
(124
|
)
|
(47,688
|
)
|
||||
|
Reductions for Lapse of Statute of Limitations
|
(615
|
)
|
—
|
|||||
|
Balance at April 30th
|
$
|
6,833
|
$
|
6,124
|
||||
65
Tax Audits:
We file income tax returns in the U.S. and various states and non-U.S. tax jurisdictions. Our major taxing jurisdictions include the United States, the United Kingdom, and Germany. Except for one immaterial item, we are no longer subject to income tax examinations for years prior to fiscal year (2013) in the major jurisdictions in which we are subject to tax. Our last completed U.S. federal tax audit was for fiscal years 2011 through 2013, which resulted in minimal adjustments related to temporary differences.
Deferred Taxes:
Deferred taxes result from temporary differences in the recognition of revenue and expense for tax and financial reporting purposes.
It is more likely than not that the results of future operations will generate sufficient taxable income to realize the net deferred tax assets. The significant components of deferred tax assets and liabilities at April 30 were as follows:
|
2018
|
2017
|
|||||||
|
Net Operating Losses
|
$
|
8,976
|
$
|
5,453
|
||||
|
Reserve for Sales Returns and Doubtful Accounts
|
2,506
|
8,331
|
||||||
|
Accrued Employee Compensation
|
20,096
|
34,305
|
||||||
|
Foreign and Federal Credits
|
31,109
|
15,472
|
||||||
|
Other Accrued Expenses
|
4,632
|
14,303
|
||||||
|
Retirement and Post-Employment Benefits
|
39,160
|
56,633
|
||||||
|
Total Gross Deferred Tax Assets
|
$
|
106,479
|
$
|
134,497
|
||||
|
Less Valuation Allowance
|
(8,811
|
)
|
(1,300
|
)
|
||||
|
Total Deferred Tax Assets
|
$
|
97,668
|
$
|
133,197
|
||||
|
Prepaid Expenses and Other Current Assets
|
$
|
(3,203
|
)
|
$
|
(16,385
|
)
|
||
|
Unremitted Foreign Earnings
|
(1,985
|
)
|
—
|
|||||
|
Intangible and Fixed Assets
|
(231,869
|
)
|
(272,008
|
)
|
||||
|
Total Deferred Tax Liabilities
|
$
|
(237,057
|
)
|
$
|
(288,393
|
)
|
||
|
Net Deferred Tax Liabilities
|
$
|
(139,389
|
)
|
$
|
(155,196
|
)
|
||
|
Reported As
|
||||||||
|
Non-current Deferred Tax Assets
|
$
|
4,129
|
$
|
5,295
|
||||
|
Non-current Deferred Tax Liabilities
|
(143,518
|
)
|
(160,491
|
)
|
||||
|
Net Deferred Tax Liabilities
|
$
|
(139,389
|
)
|
$
|
(155,196
|
)
|
||
The decrease in net deferred tax liabilities is primarily attributable to the re-measurement of our U.S. deferred tax liabilities related to the Tax Act as well as foreign and federal credit carryforwards, net of an estimated $6.5 million valuation allowance related to the Tax Act, for fiscal year ended April 30, 2018. We have concluded that after valuation allowances, it is more likely than not that we will realize substantially all of the net deferred tax assets at April 30, 2018. In assessing the need for a valuation allowance, we take into account related deferred tax liabilities and estimated future reversals of existing temporary differences, future taxable earnings and tax planning strategies to determine which deferred tax assets are more likely than not to be realized in the future. Changes to tax laws, statutory tax rates and future taxable earnings can have an impact on our valuation allowances.
A $2.3 million valuation allowance has also been provided based on the uncertainty of utilizing the tax benefits related to our deferred tax assets for state and, to a small extent, Federal net operating loss carry forwards. As of April 30, 2018, we have apportioned state net operating loss carryforwards totaling $81 million, with a tax effected value of $4.8 million net of federal benefits, expiring in various amounts over one to 20 years.
We no longer intend to permanently reinvest earnings outside the U.S., As such, we established a $2.0 million permanent reinvestment assertion related to the estimated taxes that would be incurred upon repatriating our non-U.S. earnings.
As of April 30, 2018 and 2017, our debt of approximately $360.0 million and $365.0 million, respectively, consisted of amounts due under our revolving credit facilities.
66
We have a revolving credit agreement ("RCA") with a syndicated bank group led by Bank of America. The RCA consists of a $1.1 billion five-year senior revolving credit facility payable March 1, 2021. Under the RCA, which can be drawn in multiple currencies, we have the option of borrowing at the following floating interest rates: (i) at a rate based on the London Interbank Offered Rate ("LIBOR") plus an applicable margin ranging from 0.98% to 1.50%, depending on our consolidated leverage ratio, as defined, or (ii) for U.S. dollar-denominated loans only, at the lender's base rate plus an applicable margin ranging from zero to 0.45%, depending on our consolidated leverage ratio. The lender's base rate is defined as the highest of (i) the U.S. federal funds effective rate plus a 0.50% margin, (ii) the Eurocurrency rate, as defined, plus a 1.00% margin, or (iii) the Bank of America prime lending rate. In addition, we pay a facility fee ranging from 0.15% to 0.25% depending on our consolidated leverage ratio. We also have the option to request an additional credit limit increase of up to $350 million in minimum increments of $50 million, subject to the approval of the lenders. The RCA contains certain restrictive covenants related to our consolidated leverage ratio and interest coverage ratio, which we were in compliance with as of April 30, 2018 and 2017. Due to the fact that there are no principal payments due until the end of the agreement in fiscal year 2021, we have classified our entire debt obligation as long-term as of April 30, 2018 and 2017.
We have other lines of credit aggregating $2.8 million at various interest rates. There were no outstanding borrowings under these credit lines at April 30, 2018 and 2017.
Our total available lines of credit as of April 30, 2018, were approximately $1.1 billion, of which approximately $0.7 billion was unused. The weighted average interest rates on total debt outstanding during fiscal years 2018 and 2017 were 2.44% and 2.19%, respectively. As of April 30, 2018 and 2017, the weighted average interest rates for total debt were 2.58% and 2.74%, respectively. Based on estimates of interest rates currently available to us for loans with similar terms and maturities, the fair value of our debt approximates its carrying value.
From time-to-time, we enter into forward exchange and interest rate swap contracts as a hedge against foreign currency asset and liability commitments, changes in interest rates, and anticipated transaction exposures, including intercompany purchases. All derivatives are recognized as assets or liabilities and measured at fair value. Derivatives that are not determined to be effective hedges are adjusted to fair value with a corresponding adjustment to earnings. We do not use financial instruments for trading or speculative purposes.
Interest Rate Contracts:
We had $360.0 million of variable rate loans outstanding at April 30, 2018, which approximated fair value. As of April 30, 2018 and 2017, the interest rate swap agreements we maintained were designated as fully effective cash flow hedges as defined under Accounting Standards Codification 815 "Derivatives and Hedging" ("ASC 815"). As a result, there was no impact on our Consolidated Statements of Income from changes in the fair value of the interest rate swaps, as they were fully offset by changes in the interest expense on the underlying variable rate debt instruments. Under ASC 815, derivative instruments that are designated as cash flow hedges have changes in their fair value recorded initially within Accumulated Other Comprehensive Loss on the Consolidated Statements of Financial Position. As interest expense is recognized based on the variable rate loan agreements, the corresponding deferred gain or loss on the interest rate swaps is reclassified from Accumulated Other Comprehensive Loss to Interest Expense on the Consolidated Statements of Income. It is management's intention that the notional amount of interest rate swaps be less than the variable rate loans outstanding during the life of the derivatives.
On April 4, 2016, we entered into a forward starting interest rate swap agreement, which fixed a portion of the variable interest due on a variable rate debt renewal on May 16, 2016. Under the terms of the agreement, we will pay a fixed rate of 0.92% and receives a variable rate of interest based on one-month LIBOR (as defined) from the counterparty which is reset every month for a three-year period starting May 16, 2016, ending May 15, 2019. As of April 30, 2018, the notional amount of the interest rate swap was $350.0 million.
On August 15, 2014, we entered into an interest rate swap agreement, which fixed a portion of the variable interest due on our variable rate loans outstanding. Under the terms of the agreement, which expired on August 15, 2016, we paid a fixed rate of 0.65% and received a variable rate of interest based on one-month LIBOR (as defined) from the counterparty which was reset every month for a two-year period ending August 15, 2016. Prior to expiration the notional amount of the interest rate swap was $150.0 million.
We record the fair value of our interest rate swaps on a recurring basis using Level 2 inputs of quoted prices for similar assets or liabilities in active markets. The fair value of the interest rate swaps as of April 30, 2018 and 2017, was a deferred gain of $5.1 million and $3.9 million, respectively. Based on the maturity dates of the contracts, the entire deferred gain as of April 30, 2018 and 2017, was recorded within Other Non-Current Assets. The pre-tax (gains) losses that were reclassified from Accumulated Other Comprehensive Loss to Interest Expense for fiscal years 2018, 2017, and 2016 were $(1.5) million, $1.1 million, and $0.9 million, respectively. Based on the amount in Accumulated Other Comprehensive Loss at April 30, 2018, approximately $3.7 million, net of tax, of unrecognized gains would be reclassified into net income in the next twelve months.
67
Foreign Currency Contracts:
We may enter into forward exchange contracts to manage our exposure on certain foreign currency denominated assets and liabilities. The forward exchange contracts are marked to market through Foreign Exchange Transaction (Losses) Gains on the Consolidated Statements of Income, and carried at their fair value on the Consolidated Statements of Financial Position. Foreign currency denominated assets and liabilities are remeasured at spot rates in effect on the balance sheet date, with the effects of changes in spot rates reported in Foreign Exchange Transaction (Losses) Gains on the Consolidated Statements of Income.
As of April 30, 2018 and 2017, we did not maintain any open forward contracts. As of April 30, 2016, there were two open forward exchange contracts with notional amounts of 31 million euros and 274 million pounds sterling to manage foreign currency exposures on intercompany loans. These contracts matured in May 2016 and February 2017, respectively. As of April 30, 2016, the fair value of the open forward exchange contracts was a gain of approximately $1.3 million and recorded within Prepaid and other current assets. The fair value of the open forward exchange contracts was measured on a recurring basis using Level 2 inputs. For fiscal years 2017 and 2016, the gains recognized on forward contracts were $59.0 million and $1.3 million, respectively.
The following schedule shows the composition of net rent expense for operating leases:
|
2018
|
2017
|
2016
|
||||||||||
|
Minimum Rental
|
$
|
31,451
|
$
|
35,464
|
$
|
37,206
|
||||||
|
Less: Sublease Rentals
|
(708
|
)
|
(626
|
)
|
(597
|
)
|
||||||
|
Total
|
$
|
30,743
|
$
|
34,838
|
$
|
36,609
|
||||||
At April 30, 2018, estimated future minimum annual rental commitments under non-cancelable real and personal property leases, were as follows:
|
Fiscal Year
|
Amount
(in millions)
|
|||
|
2019
|
$
|
31.2
|
||
|
2020
|
28.9
|
|||
|
2021
|
25.5
|
|||
|
2022
|
21.0
|
|||
|
2023
|
16.2
|
|||
|
Thereafter
|
136.5
|
|||
|
Total
|
$
|
259.3
|
||
Rent expense associated with operating leases that include scheduled rent increases and tenant incentives, such as rent holidays or leasehold improvement allowances, are recorded on a straight-line basis over the term of the lease.
We are involved in routine litigation in the ordinary course of our business. A provision for litigation is accrued when information available to us indicates that it is probable a liability has been incurred and the amount of loss can be reasonably estimated. Significant judgment may be required to determine both the probability and estimates of loss. When the amount of the loss can only be estimated within a range, the most likely outcome within that range is accrued. If no amount within the range is a better estimate than any other amount, the minimum amount within the range is accrued. When uncertainties exist related to the probable outcome of litigation and/or the amount or range of loss, we do not record a liability, but disclose facts related to the nature of the contingency and possible losses if management considers the information to be material. Reserves for legal defense costs are recognized when incurred. The accruals for loss contingencies and legal costs are reviewed regularly and may be adjusted to reflect updated information on the status of litigation and advice of legal counsel. In the opinion of management, the ultimate resolution of all pending litigation as of April 30, 2018, will not have a material effect upon our consolidated financial condition or results of operations.
We have retirement plans that cover substantially all employees. The plans generally provide for employee retirement between the ages 60 and 65, and benefits based on length of service and compensation, as defined.
68
Our Board of Directors approved plan amendments that froze the following retirement plans:
| · |
Retirement Plan for the Employees of John Wiley & Sons, Canada was frozen effective December 31, 2015;
|
| · |
Retirement Plan for the Employees of John Wiley & Sons, Ltd., a U.K. plan was frozen effective April 30, 2015 and;
|
| · |
U.S. Employees' Retirement Plan, Supplemental Benefit Plan, and Supplemental Executive Retirement Plan, were frozen effective June 30, 2013.
|
We maintain the Supplemental Executive Retirement Plan for certain officers and senior management which provides for the payment of supplemental retirement benefits after the termination of employment for 10 years or in a lifetime annuity. Under certain circumstances, including a change of control as defined, the payment of such amounts could be accelerated on a present value basis. Future accrued benefits to the Plan have been discontinued as noted above.
The components of net pension expense (income) for the defined benefit plans and the weighted average assumptions were as follows:
|
2018
|
2017
|
2016
|
||||||||||||||||||||||
|
U.S.
|
Non-U.S.
|
U.S.
|
Non-U.S.
|
U.S.
|
Non-U.S.
|
|||||||||||||||||||
|
Service Cost
|
$
|
—
|
$
|
960
|
$
|
—
|
$
|
967
|
$
|
—
|
$
|
1,455
|
||||||||||||
|
Interest Cost
|
11,666
|
13,876
|
12,398
|
14,449
|
13,612
|
16,446
|
||||||||||||||||||
|
Expected Return on Plan Assets
|
(13,154
|
)
|
(26,385
|
)
|
(14,053
|
)
|
(21,173
|
)
|
(14,756
|
)
|
(25,088
|
)
|
||||||||||||
|
Net Amortization of Prior Service Cost
|
(154
|
)
|
57
|
(154
|
)
|
54
|
(154
|
)
|
55
|
|||||||||||||||
|
Recognized Net Actuarial Loss
|
2,289
|
3,832
|
2,622
|
2,553
|
2,240
|
2,475
|
||||||||||||||||||
|
Curtailment/Settlement Loss
|
-
|
19
|
8,842
|
—
|
1,857
|
—
|
||||||||||||||||||
|
Net Pension Expense (Income)
|
$
|
647
|
$
|
(7,641
|
)
|
$
|
9,655
|
$
|
(3,150
|
)
|
$
|
2,799
|
$
|
(4,657
|
)
|
|||||||||
|
Discount Rate
|
4.1
|
%
|
2.6
|
%
|
4.0
|
%
|
3.5
|
%
|
4.2
|
%
|
3.5
|
%
|
||||||||||||
|
Rate of Compensation Increase
|
N/A
|
3.0
|
%
|
N/A
|
3.0
|
%
|
N/A
|
3.0
|
%
|
|||||||||||||||
|
Expected Return on Plan Assets
|
6.8
|
%
|
6.5
|
%
|
6.8
|
%
|
6.7
|
%
|
6.8
|
%
|
6.7
|
%
|
||||||||||||
We announced a voluntary, limited-time opportunity for terminated vested employees who are participants in the U.S. Employees' Retirement Plan of John Wiley & Sons, Inc. (the "Pension Plan") to request early payment of their entire Pension Plan benefit in the form of a single lump sum payment. Eligible participants who wished to receive the lump sum payment were required to make an election by August 29, 2016. Approximately 780 eligible participants made the election to receive the lump sum totaling $28.3 million which was paid from pension plan assets in October 2016. Settlement accounting rules were applied, which resulted in a plan remeasurement and recognition of a pro-rata portion of unamortized net actuarial loss of $8.8 million which was recorded in Operating and Administrative Expenses on the Consolidated Statements of Income in fiscal year 2017. The curtailment/settlement loss in fiscal year 2016 of $1.9 million, noted above, related to a disability payment made subject to terms of the our Supplemental Executive Retirement Plan.
The projected benefit obligation, accumulated benefit obligation, and fair value of plan assets for the retirement plans with accumulated benefit obligations in excess of plan assets were $820.4 million, $787.6 million and $624.4 million, respectively, as of April 30, 2018, and $800.1 million, $753.3 million, and $579.7 million, respectively, as of April 30, 2017.
The Recognized Net Actuarial Loss for each fiscal year is calculated using the "corridor method," which reflects the amortization of the net loss at the beginning of the fiscal year in excess of 10% of the greater of the market value of plan assets or the projected benefit obligation. The amortization period is based on the average expected life of plan participants.
We recognize the overfunded or underfunded status of defined benefit postretirement plans, measured as the difference between the fair value of plan assets and the projected benefit obligation, on the Consolidated Statements of Financial Position. The change in the funded status of the plan is recognized in Accumulated Other Comprehensive Loss on the Consolidated Statements of Financial Position. Plan assets and obligations are measured at fair value as of our balance sheet date.
The amounts in Accumulated Other Comprehensive Loss that are expected to be recognized as components of net periodic benefit cost during the next fiscal year are as follows:
|
U.S.
|
Non-U.S.
|
Total
|
||||||||||
|
Actuarial Loss
|
$
|
1,905
|
$
|
3,998
|
$
|
5,903
|
||||||
|
Prior Service Cost
|
(154
|
)
|
61
|
(93
|
)
|
|||||||
|
Total
|
$
|
1,751
|
$
|
4,059
|
$
|
5,810
|
||||||
69
The following table sets forth the changes in and the status of our defined benefit plans' assets and benefit obligations:
|
2018
|
2017
|
|||||||||||||||
|
U.S.
|
Non-U.S.
|
U.S.
|
Non-U.S.
|
|||||||||||||
|
CHANGE IN PLAN ASSETS
|
||||||||||||||||
|
Fair Value of Plan Assets, Beginning of Year
|
$
|
200,001
|
$
|
390,133
|
$
|
215,923
|
$
|
352,484
|
||||||||
|
Actual Return on Plan Assets
|
15,352
|
2,780
|
17,345
|
75,432
|
||||||||||||
|
Employer Contributions
|
5,020
|
8,385
|
10,463
|
14,041
|
||||||||||||
|
Employee Contributions
|
—
|
—
|
—
|
—
|
||||||||||||
|
Settlements
|
—
|
(239
|
)
|
(28,258
|
)
|
—
|
||||||||||
|
Benefits Paid
|
(15,390
|
)
|
(15,909
|
)
|
(15,472
|
)
|
(9,487
|
)
|
||||||||
|
Foreign Currency Rate Changes
|
—
|
34,298
|
—
|
(42,337
|
)
|
|||||||||||
|
Fair Value, End of Year
|
$
|
204,983
|
$
|
419,448
|
$
|
200,001
|
$
|
390,133
|
||||||||
|
CHANGE IN PROJECTED BENEFIT OBLIGATION
|
||||||||||||||||
|
Benefit Obligation, Beginning of Year
|
$
|
(290,785
|
)
|
$
|
(519,588
|
)
|
$
|
(336,908
|
)
|
$
|
(461,161
|
)
|
||||
|
Service Cost
|
—
|
(960
|
)
|
—
|
(967
|
)
|
||||||||||
|
Interest Cost
|
(11,666
|
)
|
(13,876
|
)
|
(12,398
|
)
|
(14,449
|
)
|
||||||||
|
Actuarial Gains (Losses)
|
7,417
|
23,528
|
14,791
|
(105,151
|
)
|
|||||||||||
|
Benefits Paid
|
15,390
|
15,909
|
15,472
|
9,487
|
||||||||||||
|
Foreign Currency Rate Changes
|
—
|
(45,938
|
)
|
—
|
52,653
|
|||||||||||
|
Settlements and Other
|
—
|
239
|
28,258
|
—
|
||||||||||||
|
Benefit Obligation, End of Year
|
$
|
(279,644
|
)
|
$
|
(540,686
|
)
|
$
|
(290,785
|
)
|
$
|
(519,588
|
)
|
||||
|
Underfunded Status, End of Year
|
$
|
(74,661
|
)
|
$
|
(121,238
|
)
|
$
|
(90,784
|
)
|
$
|
(129,455
|
)
|
||||
|
AMOUNTS RECOGNIZED ON THE STATEMENT OF FINANCIAL POSITION
|
||||||||||||||||
|
Other Noncurrent Assets
|
—
|
—
|
—
|
134
|
||||||||||||
|
Current Pension Liability
|
(4,818
|
)
|
(780
|
)
|
(4,977
|
)
|
(799
|
)
|
||||||||
|
Noncurrent Pension Liability
|
(69,843
|
)
|
(120,458
|
)
|
(85,807
|
)
|
(128,790
|
)
|
||||||||
|
Net Amount Recognized in Statement of Financial Position
|
$
|
(74,661
|
)
|
$
|
(121,238
|
)
|
$
|
(90,784
|
)
|
$
|
(129,455
|
)
|
||||
|
AMOUNTS RECOGNIZED IN ACCUMULATED OTHER COMPREHENSIVE LOSS (BEFORE TAX) CONSIST OF
|
||||||||||||||||
|
Net Actuarial (Losses)
|
$
|
(82,636
|
)
|
$
|
(183,316
|
)
|
$
|
(94,539
|
)
|
$
|
(171,601
|
)
|
||||
|
Prior Service Cost Gains (Losses)
|
2,562
|
(441
|
)
|
2,716
|
(448
|
)
|
||||||||||
|
Total Accumulated Other Comprehensive Loss
|
$
|
(80,074
|
)
|
$
|
(183,757
|
)
|
$
|
(91,823
|
)
|
$
|
(172,049
|
)
|
||||
|
Change in Accumulated Other Comprehensive Loss
|
$
|
11,749
|
$
|
(11,708
|
)
|
$
|
29,394
|
$
|
(32,221
|
)
|
||||||
|
WEIGHTED AVERAGE ASSUMPTIONS USED IN DETERMINING ASSETS AND LIABILITIES
|
||||||||||||||||
|
Discount Rate
|
4.3
|
%
|
2.6
|
%
|
4.1
|
%
|
2.6
|
%
|
||||||||
|
Rate of Compensation Increase
|
N/A
|
3.0
|
%
|
N/A
|
3.0
|
%
|
||||||||||
|
Accumulated Benefit Obligations
|
$
|
(279,644
|
)
|
$
|
(507,932
|
)
|
$
|
(290,785
|
)
|
$
|
(472,841
|
)
|
||||
Pension plan assets/investments:
The investment guidelines for the defined benefit pension plans are established based upon an evaluation of market conditions, plan liabilities, cash requirements for benefit payments, and tolerance for risk. Investment guidelines include the use of actively and passively managed securities. The investment objective is to ensure that funds are available to meet the plans benefit obligations when they are due. The investment strategy is to invest in high quality and diversified equity and debt securities to achieve our long-term expectation. The plans' risk management practices provide guidance to the investment managers, including guidelines for asset concentration, credit rating and liquidity. Asset allocation favors a balanced portfolio, with a global aggregated target allocation of approximately 49% equity securities, 50% fixed income securities and cash, and 1% real estate. Due to volatility in the market, the target allocation is not always desirable and asset allocations will fluctuate between acceptable ranges of plus or minus 5%. We regularly review the investment allocations and periodically rebalance investments to the target allocations. We categorize our pension assets into three levels based upon the assumptions (inputs) used to price the assets. Level 1 provides the most reliable measure of fair value, whereas Level 3 generally requires significant management judgment. The three levels are defined as follows:
| |
Level 1: Unadjusted quoted prices in active markets for identical assets.
|
| |
Level 2: Observable inputs other than those included in Level 1. For example, quoted prices for similar assets in active markets or quoted prices for identical assets in inactive markets.
|
| |
Level 3: Unobservable inputs reflecting assumptions about the inputs used in pricing the asset.
|
70
We did not maintain any level 3 assets during fiscal years 2018 and 2017. In accordance with ASU 2015-07, "Fair Value Measurement ("Topic 820"), certain investments that are measured at fair value using the net asset value ("NAV") per share (or its equivalent) practical expedient do not have to be classified in the fair value hierarchy. We adopted ASU 2015-07 in fiscal year 2018 and it was applied retrospectively to all periods presented. The fair value amounts presented in the following tables are intended to permit reconciliation of the fair value hierarchy to the amounts presented for the total pension benefit plan assets. The following tables set forth, by level within the fair value hierarchy, pension plan assets at their fair value as of April 30:
|
2018
|
2017
|
|||||||||||||||||||||||
|
Level 1
|
Level 2
|
Total
|
Level 1
|
Level 2
|
Total
|
|||||||||||||||||||
|
U.S. Plan Assets
|
||||||||||||||||||||||||
|
Investments measured at NAV:
|
||||||||||||||||||||||||
|
Global Equity Securities: Limited Partnership
|
$
|
95,933
|
$
|
91,397
|
||||||||||||||||||||
|
Fixed Income Securities: Commingled Trust Funds
|
100,295
|
95,922
|
||||||||||||||||||||||
|
Other: Real Estate Commingled Trust Fund
|
8,755
|
12,682
|
||||||||||||||||||||||
|
Total Assets at NAV
|
$
|
204,983
|
$
|
200,001
|
||||||||||||||||||||
|
Non-U.S. Plan Assets
|
||||||||||||||||||||||||
|
Equity Securities:
|
||||||||||||||||||||||||
|
U.S. Equities
|
$
|
—
|
$
|
31,203
|
$
|
31,203
|
$
|
—
|
$
|
28,598
|
$
|
28,598
|
||||||||||||
|
Non-U.S. Equities
|
—
|
96,387
|
96,387
|
—
|
85,961
|
85,961
|
||||||||||||||||||
|
Balanced Managed Funds
|
—
|
91,743
|
91,743
|
10,196
|
69,453
|
79,649
|
||||||||||||||||||
|
Fixed Income Securities: Commingled Funds
|
—
|
197,804
|
197,804
|
—
|
187,797
|
187,797
|
||||||||||||||||||
|
Other:
|
||||||||||||||||||||||||
|
Real Estate/Other
|
—
|
549
|
549
|
—
|
489
|
489
|
||||||||||||||||||
|
Cash and Cash Equivalents
|
1,762
|
—
|
1,762
|
7,639
|
—
|
7,639
|
||||||||||||||||||
|
Total Non-U.S. Plan Assets
|
$
|
1,762
|
$
|
417,686
|
$
|
419,448
|
$
|
17,835
|
$
|
372,298
|
$
|
390,133
|
||||||||||||
|
Total Plan Assets
|
$
|
1,762
|
$
|
417,686
|
$
|
624,431
|
$
|
17,835
|
$
|
372,298
|
$
|
590,134
|
||||||||||||
Expected employer contributions to the defined benefit pension plans in fiscal year 2019 will be approximately $15.6 million, including $10.7 million of minimum amounts required for our non-U.S. plans. From time to time, we may elect to make voluntary contributions to our defined benefit plans to improve their funded status.
Benefit payments to retirees from all defined benefit plans are expected to be the following in the year indicated:
|
Fiscal Year
|
U.S.
|
Non-U.S.
|
Total
|
|||||||||
|
2019
|
$
|
15,435
|
$
|
8,489
|
$
|
23,924
|
||||||
|
2020
|
15,589
|
9,657
|
25,246
|
|||||||||
|
2021
|
14,322
|
10,535
|
24,857
|
|||||||||
|
2022
|
14,550
|
12,109
|
26,659
|
|||||||||
|
2023
|
14,947
|
12,619
|
27,566
|
|||||||||
|
2024-2028
|
75,428
|
75,332
|
150,760
|
|||||||||
|
Total
|
$
|
150,271
|
$
|
128,741
|
$
|
279,012
|
||||||
We provide contributory life insurance and health care benefits, subject to certain dollar limitations, for substantially all of our eligible retired U.S. employees. The retiree health benefit is no longer available for any employee who retires after December 31, 2017. This resulted in a curtailment gain of $2.5 million which was recognized in the Operating and Administrative Expenses line item in our Consolidated Statement of Income in fiscal year 2017. The cost of such benefits is expensed over the years the employee renders service and is not funded in advance. The accumulated post-retirement benefit obligation recognized on the Consolidated Statements of Financial Position as of April 30, 2018 and 2017, was $1.8 million and $1.7 million, respectively. Annual (credits) expenses for these plans for fiscal years 2018, 2017, and 2016 were $(0.1) million, $(0.2) million and $0.2 million, respectively.
We have defined contribution savings plans. Our contribution is based on employee contributions and the level of our match. We may make discretionary contributions to all employees as a group. The expense recorded for these plans was approximately $14.4 million, $15.5 million, and $16.2 million in fiscal years 2018, 2017, and 2016 respectively.
All equity compensation plans have been approved by shareholders. Under the 2014 Key Employee Stock Plan, ("the Plan"), qualified employees are eligible to receive awards that may include stock options, performance-based stock awards, and other restricted stock awards. Under the Plan, a maximum number of 6.5 million shares of our Class A stock may be issued. As of April 30, 2018, there were approximately 4,791,733 securities remaining available for future issuance under the Plan. We issue treasury shares to fund awards issued under the Plan.
71
Stock Option Activity:
Under the terms of our stock option plan, the exercise price of stock options granted may not be less than 100% of the fair market value of the stock at the date of grant. Options are exercisable over a maximum period of 10 years from the date of grant. For fiscal years 2015 and prior, options generally vest 50% on the fourth and fifth anniversary date after the award is granted. For fiscal year 2016, options vest 25% per year on April 30. We did not grant any stock option awards in fiscal year 2018 and 2017. Under certain circumstances relating to a change of control, as defined, the right to exercise options outstanding may be accelerated.
The following table provides the estimated weighted average fair value for options granted in fiscal year 2016 using the Black-Scholes option-pricing model and the significant weighted average assumptions used in their determination. The expected life represents an estimate of the period of time stock options will be outstanding based on the historical exercise behavior of option recipients. The risk-free interest rate is based on the corresponding U.S. Treasury yield curve in effect at the time of the grant. The expected volatility is based on the historical volatility of our Common Stock price over the estimated life of the option, while the dividend yield is based on the expected dividend payments to be made by us.
|
2016
|
||||
|
Fair Value of Options on Grant Date
|
$
|
14.77
|
||
|
|
||||
|
Weighted Average assumptions:
|
||||
|
Expected Life of Options (years)
|
7.2
|
|||
|
Risk-Free Interest Rate
|
2.1
|
%
|
||
|
Expected Volatility
|
29.7
|
%
|
||
|
Expected Dividend Yield
|
2.1
|
%
|
||
|
Fair Value of Common Stock on Grant Date
|
$
|
55.99
|
||
A summary of the activity and status of our stock option plans follows:
|
2018
|
2017
|
2016
|
||||||||||||||||||||||||||||||
|
Number
of Options
(in 000's)
|
Weighted
Average
Exercise Price
|
Weighted Average
Remaining Term
(in years)
|
Aggregate
Intrinsic Value
(in millions)
|
Number
of Options
(in 000's)
|
Weighted
Average
Exercise Price
|
Number
of Options
(in 000's)
|
Weighted
Average
Exercise Price
|
|||||||||||||||||||||||||
|
Outstanding at Beginning of Year
|
1,429
|
$
|
47.39
|
1,966
|
$
|
46.62
|
1,921
|
$
|
45.50
|
|||||||||||||||||||||||
|
Granted
|
—
|
$
|
—
|
—
|
$
|
—
|
166
|
$
|
55.99
|
|||||||||||||||||||||||
|
Exercised
|
(788
|
)
|
$
|
45.97
|
(469
|
)
|
$
|
43.74
|
(103
|
)
|
$
|
40.22
|
||||||||||||||||||||
|
Expired or Forfeited
|
(30
|
)
|
$
|
54.24
|
(68
|
)
|
$
|
49.91
|
(18
|
)
|
$
|
51.02
|
||||||||||||||||||||
|
Outstanding at End of Year
|
611
|
$
|
48.88
|
3.3
|
$
|
10.4
|
1,429
|
$
|
47.39
|
1,966
|
$
|
46.62
|
||||||||||||||||||||
|
Exercisable at End of Year
|
530
|
$
|
47.43
|
4.2
|
$
|
9.8
|
1,064
|
$
|
46.04
|
1,140
|
$
|
45.22
|
||||||||||||||||||||
|
Vested and Expected to Vest in the Future at April 30
|
599
|
$
|
48.90
|
3.3
|
$
|
10.2
|
1,249
|
$
|
45.88
|
1,925
|
$
|
46.61
|
||||||||||||||||||||
The intrinsic value is the difference between our common stock price and the option grant price. The total intrinsic value of options exercised during fiscal years 2018, 2017, and 2016 was $10.4 million, $20.5 million, and $1.5 million, respectively. The total grant date fair value of stock options vested during fiscal year 2018 and 2017 was $13.4 and $19.3 million, respectively.
As of April 30, 2018, there was $0.5 million of unrecognized share-based compensation expense related to stock options, which is expected to be recognized over a period up to 1 year and on a weighted average basis.
72
The following table summarizes information about stock options outstanding and exercisable at April 30, 2018:
|
Options Outstanding
|
Options Exercisable
|
|||||||||||||||||||||
|
Range of Exercise Prices
|
Number
of Options
(in 000's)
|
Weighted Average
Remaining Term
(in years)
|
Weighted
Average
Exercise Price
|
Number
of Options
(in 000's)
|
Weighted
Average
Exercise Price
|
|||||||||||||||||
|
$
|
35.04
|
11
|
1.2
|
$
|
35.04
|
11
|
$
|
35.04
|
||||||||||||||
|
$
|
39.53 to $40.02
|
226
|
3.1
|
$
|
39.62
|
226
|
$
|
39.62
|
||||||||||||||
|
$
|
47.55 to $49.55
|
130
|
3.0
|
$
|
48.71
|
130
|
$
|
48.71
|
||||||||||||||
|
$
|
55.99 to $59.70
|
244
|
3.8
|
$
|
58.12
|
163
|
$
|
58.05
|
||||||||||||||
|
Total/Average
|
611
|
3.3
|
$
|
48.88
|
530
|
$
|
47.43
|
|||||||||||||||
Performance-Based and Other Restricted Stock Activity:
Under the terms of our long-term incentive plans, performance-based restricted unit awards are payable in restricted shares of our Class A Common Stock upon the achievement of certain three-year financial performance-based targets. During each three-year period, we adjust compensation expense based upon our best estimate of expected performance. For fiscal years 2015 and prior, restricted performance shares vest 50% on the first and second anniversary date after the award is earned. For fiscal years 2016 and 2017, restricted performance shares vest 50% on June 30 following the end of the three-year performance cycle and 50% on April 30 of the following year. Beginning in fiscal year 2018, restricted performance share units vest 100% on June 30 following the end of the three-year performance cycle.
We may also grant individual restricted unit awards payable in restricted shares of our Class A Common Stock to key employees in connection with their employment. For fiscal years 2015 and prior, the restricted shares generally vest 50% at the end of the fourth and fifth years following the date of the grant. Starting with fiscal year 2016 grants, restricted shares vest ratably 25% per year.
Under certain circumstances relating to a change of control or termination, as defined, the restrictions would lapse and shares would vest earlier.
Activity for performance-based and other restricted stock awards during fiscal years 2018, 2017, and 2016 was as follows (shares in thousands):
|
2018
|
2017
|
2016
|
||||||||||||||
|
Restricted
Shares
|
Weighted Average
Grant Date Value
|
Restricted
Shares
|
Restricted
Shares
|
|||||||||||||
|
Nonvested Shares at Beginning of Year
|
913
|
$
|
51.85
|
915
|
752
|
|||||||||||
|
Granted
|
525
|
$
|
53.59
|
509
|
289
|
|||||||||||
|
Change in Shares Due to Performance
|
(107
|
)
|
$
|
55.70
|
(67
|
)
|
86
|
|||||||||
|
Vested and Issued
|
(318
|
)
|
$
|
49.47
|
(267
|
)
|
(154
|
)
|
||||||||
|
Forfeited
|
(152
|
)
|
$
|
52.40
|
(177
|
)
|
(58
|
)
|
||||||||
|
Nonvested Shares at End of Year
|
861
|
$
|
53.22
|
913
|
915
|
|||||||||||
As of April 30, 2018, there was $31.1 million of unrecognized share-based compensation cost related to performance-based and other restricted stock awards, which is expected to be recognized over a period up to 4 years, or 2.2 years on a weighted average basis.
Compensation expense for restricted stock awards is measured using the closing market price of our Class A Common Stock at the date of grant. The total grant date value of shares vested during fiscal years 2018, 2017, and 2016 was $15.7 million, $12.1 million, and $7.2 million, respectively.
President and CEO New Hire Equity Awards
On October 17, 2017, we announced Brian A. Napack as the new President and Chief Executive Officer of Wiley effective December 4, 2017 (the "Commencement Date"). Upon the Commencement Date, Mr. Napack also became a member of our Board of Directors (the "Board"). In connection with his appointment, Wiley and Mr. Napack entered into an employment offer letter (the "Employment Agreement").
73
The Employment Agreement provides that beginning with the fiscal year 2018–2020 performance cycle, eligibility to participate in annual grants under our Executive Long-Term Incentive Program (ELTIP). Targeted long-term incentive for this cycle is equal to 300% of base salary, or $2.7 million. Sixty percent of the ELTIP value will be delivered in the form of target performance share units and forty percent in restricted share units. The grant date fair value for restricted share units was $59.15 per share and included 20,611 restricted share units, which vest 25% each year starting on April 30, 2018 to April 30, 2021. In addition, there was a performance share unit award with a target of 30,916 units and a grant date fair value of $59.15. The performance metrics are based on cumulative EBITDA for fiscal year 2018-2020 and cumulative normalized free cash flow for fiscal year 2018–2020.
The awards are described in further detail in Mr. Napack's Employment Agreement filed with the SEC as Exhibit 10.1 to our Current Report on Form 8-K filed on October 17, 2017.
In addition, the Employment Agreement provides for a sign-on grant of restricted share units, with a grant value of $4.0 million, converted to shares using our Class A closing stock price as of the Commencement Date, and vesting in two equal installments on the first and second anniversaries of the employment date. The grant date fair value for this award was $59.15 per share and included 67,625 units at the date of grant. Grants are subject to forfeiture in the case of voluntary termination prior to vesting and accelerated vesting in the case of earlier termination of employment without Cause, due to death or Disability or Constructive Discharge, or upon a Change in Control (as such terms are defined in the Employment Agreement).
The awards are described in further detail in Mr. Napack's Employment Agreement filed with the SEC as Exhibit 10.1 to our Current Report on Form 8-K filed on October 17, 2017.
Director Stock Awards:
Under the terms of our 2014 Director Stock Plan (the "Director Plan"), each non-employee director receives an annual award of Class A Common Stock equal in value to 100% of the annual director retainer fee (excluding additional retainer fees paid to committee chairpersons and Chairman of the Board), based on the stock price at the close of the New York Stock Exchange on the date of grant. The granted shares may not be sold or transferred during the time the non-employee director remains a director. There were 19,900, 20,243, and 19,559 shares awarded under the Director Plan for fiscal years 2018, 2017, and 2016, respectively.
Each share of our Class B Common Stock is convertible into one share of Class A Common Stock. The holders of Class A stock are entitled to elect 30% of the entire Board of Directors and the holders of Class B stock are entitled to elect the remainder. On all other matters, each share of Class A stock is entitled to one tenth of one vote and each share of Class B stock is entitled to one vote.
During fiscal year 2017, our Board of Directors approved an additional share repurchase program of four million shares of Class A or B Common Stock. We repurchased in fiscal year 2018 713,177 Class A shares at an average price of $55.65 per share. In fiscal year 2017 we repurchased 953,188 shares, which included 952,667 Class A shares and 521 Class B shares at an average price of $52.80 per share. As of April 30, 2018, we had authorization from our Board of Directors to purchase up to 3,080,471 additional shares.
Our segment reporting structure consists of three reportable segments, which are listed below and a Corporate category as follows:
| |
Research;
|
| |
Publishing; and
|
| |
Solutions
|
74
Segment information is as follows:
|
For the Years Ended April 30,
|
||||||||||||
|
2018
|
2017
|
2016
|
||||||||||
|
Revenue:
|
||||||||||||
|
Research
|
$
|
934,395
|
$
|
853,489
|
$
|
826,778
|
||||||
|
Publishing
|
617,648
|
633,449
|
695,728
|
|||||||||
|
Solutions
|
244,060
|
231,592
|
204,531
|
|||||||||
|
Total Revenue
|
$
|
1,796,103
|
$
|
1,718,530
|
$
|
1,727,037
|
||||||
|
Contribution to Profit:
|
||||||||||||
|
Research
|
$
|
275,480
|
$
|
252,228
|
$
|
252,110
|
||||||
|
Publishing
|
123,917
|
125,703
|
126,058
|
|||||||||
|
Solutions
|
22,099
|
14,822
|
3,992
|
|||||||||
|
Total Contribution to Profit
|
$
|
421,496
|
$
|
392,753
|
$
|
382,160
|
||||||
|
Corporate Expenses
|
(181,961
|
)
|
(186,600
|
)
|
(194,047
|
)
|
||||||
|
Operating Income
|
$
|
239,535
|
$
|
206,153
|
$
|
188,113
|
||||||
|
For the Years Ended April 30,
|
||||||||||||
|
Total Revenue by Product/Service
|
2018
|
2017
|
2016
|
|||||||||
|
Journals Subscriptions
|
$
|
677,685
|
$
|
639,720
|
$
|
622,305
|
||||||
|
Open Access
|
41,997
|
30,633
|
25,671
|
|||||||||
|
Licensing, Reprints, Backfiles, and Other (Research segment)
|
181,806
|
164,070
|
178,802
|
|||||||||
|
Publishing Technology Services (Atypon)
|
32,907
|
19,066
|
—
|
|||||||||
|
STM and Professional Publishing
|
287,315
|
291,255
|
330,984
|
|||||||||
|
Education Publishing
|
187,178
|
196,343
|
229,989
|
|||||||||
|
Course Workflow (WileyPLUS)
|
59,475
|
62,348
|
58,519
|
|||||||||
|
Test Preparation and Certification
|
35,534
|
35,609
|
28,115
|
|||||||||
|
Licensing, Distribution, Advertising, and Other (Publishing segment)
|
48,146
|
47,894
|
48,121
|
|||||||||
|
Education Services (OPM)
|
119,131
|
111,638
|
96,469
|
|||||||||
|
Professional Assessment
|
61,094
|
59,868
|
57,370
|
|||||||||
|
Corporate Learning
|
63,835
|
60,086
|
50,692
|
|||||||||
|
Total
|
$
|
1,796,103
|
$
|
1,718,530
|
$
|
1,727,037
|
||||||
|
Total Assets
|
||||||||||||
|
Research
|
$
|
1,238,178
|
$
|
1,133,846
|
$
|
1,235,609
|
||||||
|
Publishing
|
575,033
|
582,339
|
672,987
|
|||||||||
|
Solutions
|
563,489
|
575,068
|
439,554
|
|||||||||
|
Corporate
|
462,751
|
314,964
|
572,946
|
|||||||||
|
Total
|
$
|
2,839,451
|
$
|
2,606,217
|
$
|
2,921,096
|
||||||
|
Expenditures for Long Lived Assets
|
||||||||||||
|
Research
|
$
|
(7,538
|
)
|
$
|
(154,189
|
)
|
$
|
(20,418
|
)
|
|||
|
Publishing
|
(23,666
|
)
|
(29,420
|
)
|
(35,966
|
)
|
||||||
|
Solutions
|
(16,786
|
)
|
(21,210
|
)
|
(23,344
|
)
|
||||||
|
Corporate
|
(102,738
|
)
|
(98,608
|
)
|
(71,667
|
)
|
||||||
|
Total
|
$
|
(150,728
|
)
|
$
|
(303,427
|
)
|
$
|
(151,395
|
)
|
|||
|
Depreciation and Amortization
|
||||||||||||
|
Research
|
$
|
33,655
|
$
|
29,330
|
$
|
26,410
|
||||||
|
Publishing
|
39,495
|
43,831
|
47,108
|
|||||||||
|
Solutions
|
27,703
|
26,792
|
22,927
|
|||||||||
|
Corporate
|
53,136
|
56,608
|
59,404
|
|||||||||
|
Total
|
$
|
153,989
|
$
|
156,561
|
$
|
155,849
|
||||||
75
Revenue from external customers based on the location of the customer and long-lived assets by geographic area were as follows:
|
Revenue
|
Long-Lived Assets
(Technology, Property and Equipment)
|
|||||||||||||||||||||||
|
2018
|
2017
|
2016
|
2018
|
2017
|
2016
|
|||||||||||||||||||
|
United States
|
$
|
913,852
|
$
|
786,574
|
$
|
884,185
|
$
|
249,542
|
$
|
208,572
|
$
|
166,878
|
||||||||||||
|
United Kingdom
|
147,406
|
189,479
|
153,442
|
20,955
|
21,368
|
23,246
|
||||||||||||||||||
|
Germany
|
98,404
|
75,090
|
69,676
|
9,259
|
8,770
|
9,629
|
||||||||||||||||||
|
Japan
|
81,572
|
62,674
|
76,930
|
72
|
75
|
35
|
||||||||||||||||||
|
Australia
|
78,270
|
66,309
|
78,786
|
1,454
|
591
|
1,041
|
||||||||||||||||||
|
China
|
53,076
|
39,653
|
52,815
|
229
|
270
|
244
|
||||||||||||||||||
|
Canada
|
55,568
|
50,740
|
50,243
|
3,635
|
1,232
|
1,617
|
||||||||||||||||||
|
France
|
51,826
|
44,760
|
49,970
|
635
|
335
|
2,211
|
||||||||||||||||||
|
India
|
41,637
|
34,306
|
38,208
|
1,437
|
245
|
234
|
||||||||||||||||||
|
Other Countries
|
274,492
|
368,945
|
272,782
|
2,716
|
1,600
|
2,329
|
||||||||||||||||||
|
Total
|
$
|
1,796,103
|
$
|
1,718,530
|
$
|
1,727,037
|
$
|
289,934
|
$
|
243,058
|
$
|
207,464
|
||||||||||||
|
Amounts in millions, except per share data
|
2018
|
2017
|
||||||
|
Revenue
|
||||||||
|
First Quarter
|
$
|
411.4
|
$
|
404.3
|
||||
|
Second Quarter
|
451.7
|
425.6
|
||||||
|
Third Quarter
|
455.7
|
436.4
|
||||||
|
Fourth Quarter
|
477.3
|
452.2
|
||||||
|
Fiscal Year
|
$
|
1,796.1
|
$
|
1,718.5
|
||||
|
Gross Profit
|
||||||||
|
First Quarter
|
$
|
296.7
|
$
|
290.8
|
||||
|
Second Quarter
|
331.9
|
314.0
|
||||||
|
Third Quarter
|
330.5
|
320.1
|
||||||
|
Fourth Quarter
|
351.8
|
332.9
|
||||||
|
Fiscal Year
|
$
|
1,310.9
|
$
|
1,257.8
|
||||
|
Operating Income
|
||||||||
|
First Quarter
|
$
|
14.5
|
$
|
43.8
|
||||
|
Second Quarter
|
82.8
|
47.7
|
||||||
|
Third Quarter
|
67.4
|
51.2
|
||||||
|
Fourth Quarter
|
74.8
|
63.5
|
||||||
|
Fiscal Year
|
$
|
239.5
|
$
|
206.2
|
||||
|
Net Income
|
||||||||
|
First Quarter
|
$
|
9.2
|
$
|
31.0
|
||||
|
Second Quarter
|
60.0
|
(11.5
|
)
|
|||||
|
Third Quarter
|
68.8
|
47.4
|
||||||
|
Fourth Quarter
|
54.2
|
46.7
|
||||||
|
Fiscal Year
|
$
|
192.2
|
$
|
113.6
|
||||
|
2018
|
2017
|
|||||||||||||||
|
Basic
|
Diluted
|
Basic
|
Diluted
|
|||||||||||||
|
Earnings Per Share (1)
|
||||||||||||||||
|
First Quarter
|
$
|
0.16
|
$
|
0.16
|
$
|
0.54
|
$
|
0.53
|
||||||||
|
Second Quarter
|
1.06
|
1.04
|
(0.20
|
)
|
(0.20
|
)
|
||||||||||
|
Third Quarter
|
1.21
|
1.19
|
0.83
|
0.82
|
||||||||||||
|
Fourth Quarter
|
0.95
|
0.93
|
0.82
|
0.81
|
||||||||||||
|
Fiscal Year
|
$
|
3.37
|
$
|
3.32
|
$
|
1.98
|
$
|
1.95
|
||||||||
| (1) |
The sum of the quarterly earnings per share amounts may not agree to the respective annual amounts due to rounding.
|
76
None
Disclosure Controls and Procedures: The Company's Chief Executive Officer and Chief Financial Officer, together with the Chief Accounting Officer and other members of the Company's management, have conducted an evaluation of the Company's disclosure controls and procedures as defined in Rules 13a-15(e) and 15d-15(e) under the Securities Exchange Act of 1934 (the "Exchange Act") as of the end of the period covered by this report. Based on this evaluation, the Chief Executive Officer and Chief Financial Officer have concluded that the Company's disclosure controls and procedures were effective to ensure that information required to be disclosed by the Company in reports filed or submitted under the Exchange Act is (i) recorded, processed, summarized and reported within the time periods specified by the Securities and Exchange Commission's rules and forms and (ii) accumulated and communicated to the Company's management, including its Chief Executive Officer and Chief Financial Officer, as appropriate to allow timely decisions regarding required disclosure.
Management's Report on Internal Control over Financial Reporting: Our Management is responsible for establishing and maintaining adequate internal control over financial reporting, as such term is defined in Rule 13a-15(f) of the Exchange Act. Under the supervision and with the participation of our management, including our Chief Executive Officer and Chief Financial Officer, we conducted an evaluation of the effectiveness of our internal control over financial reporting based upon the framework in Internal Control – Integrated Framework (2013) issued by the Committee of Sponsoring Organizations of the Treadway Commission. Based on that evaluation, our management concluded that our internal control over financial reporting is effective as of April 30, 2018.
KPMG LLP, an independent registered public accounting firm, has audited the consolidated financial statements included in this Annual Report on Form 10-K and, as part of their audit, has issued their report, included herein, on the effectiveness of our internal control over financial reporting.
Changes in Internal Control over Financial Reporting: We are in the process of implementing a new global enterprise resource planning system ("ERP") that will enhance our business and financial processes and standardize our information systems. We have completed the implementation of record-to-report, purchase-to-pay and several other business processes within all locations and will continue to roll out the ERP in phases over the next year.
As with any new information system we implement, this application, along with the internal controls over financial reporting included in this process, will require testing for effectiveness. In connection with this ERP implementation, we are updating our internal controls over financial reporting, as necessary, to accommodate modifications to our business processes and accounting procedures. We do not believe that the ERP implementation will have an adverse effect on our internal control over financial reporting.
Except as described above, there were no changes in our internal control over financial reporting in the fourth quarter of fiscal year 2018 that have materially affected, or are reasonably likely to materially affect, our internal control over financial reporting.
None
PART III
For information with respect to Executive Officers of the Company, see "Executive Officers of the Company" as set forth in Part I of this Annual Report on Form 10-K.
The name, age, and background of each of the directors nominated for election are contained under the caption "Election of Directors" in the Proxy Statement for our 2018 Annual Meeting of Shareholders ("2018 Proxy Statement") and are incorporated herein by reference.
Information on the audit committee financial experts is contained in the 2018 Proxy Statement under the caption "Report of the Audit Committee" and is incorporated herein by reference.
77
Information on the Audit Committee Charter is contained in the 2018 Proxy Statement under the caption "Committees of the Board of Directors and Certain Other Information concerning the Board."
Information with respect to the Company's Corporate Governance principles is publicly available on the Company's Corporate Governance Web site at https://www.wiley.com/en-us/corporategovernance.
Information on compensation of the directors and executive officers is contained in the 2018 Proxy Statement under the captions "Directors' Compensation" and "Executive Compensation," respectively, and is incorporated herein by reference.
| Item 12. |
Security Ownership of Certain Beneficial Owners and Management and Related Stockholder Matters
|
Information on the beneficial ownership reporting for the directors and executive officers is contained under the caption "Section 16(a) Beneficial Ownership Reporting Compliance" within the "Beneficial Ownership of Directors and Management" section of the 2018 Proxy Statement and is incorporated herein by reference. Information on the beneficial ownership reporting for all other shareholders that own 5% of more of the Company's Class A or Class B Common Stock is contained under the caption "Voting Securities, Record Date, Principal Holders" in the 2018 Proxy Statement and is incorporated herein by reference.
The following table summarizes the Company's equity compensation plan information as of April 30, 2018:
|
Plan Category
|
Number of
Securities to be
Issued Upon Exercise
of Outstanding Options,
Warrants and Rights (1)
|
Weighted Average
Exercise Price of
Outstanding Options,
Warrants and Rights
|
Number of
Securities Remaining
Available for Future
Issuance Under Equity
Compensation Plans (2)
|
|||||||||
|
Equity compensation plans approved by shareholders
|
1,472,520
|
$
|
48.88
|
4,791,733
|
||||||||
|
(1)
|
This amount includes the following awards issued under the 2014 Key Employee Stock Plan:
|
| |
611,418 shares issuable upon the exercise of outstanding stock options with a weighted average exercise price of $48.88
|
| |
861,102 non-vested performance-based and other restricted stock awards. Since these awards have no exercise price, they are not included in the weighted average exercise price calculation.
|
|
(2)
|
Per the terms of the 2014 Key Employee Stock Plan ("Plan"), a total of 6,500,000 shares shall be authorized for awards granted under the Plan, less one (1) share for every one (1) share that was subject to an option or stock appreciation right granted after April 30, 2014 under the 2009 Key Employee Stock Plan and 1.76 Shares for every one (1) share that was subject to an award other than an option or stock appreciation right granted after April 30, 2014 under the 2009 Key Employee Stock Plan. Any shares that are subject to options or stock appreciation rights shall be counted against this limit as one (1) share for every one (1) share granted, and any shares that are subject to awards other than options or stock appreciation rights shall be counted against this limit as 1.76 Shares for every one (1) share granted. After the Effective Date of the Plan, no awards may be granted under the 2009 Key Employee Stock Plan.
|
All of the Company's equity compensation plans are approved by shareholders.
Information on related party transactions and the policies and procedures for reviewing and approving related party transactions are contained under the caption "Transactions with Related Persons" within the "Board and Committee Oversight of Risk" section of the 2018 Proxy Statement and are incorporated herein by reference.
Information on director independence is contained under the caption "Director Independence" within the "Board of Directors and Corporate Governance" section of the 2018 Proxy Statement.
Information required by this item is contained in the 2018 Proxy Statement under the caption "Report of the Audit Committee" and is incorporated herein by reference.
78
PART IV
|
(a)
|
See Index to Consolidated Financial Statements and Schedule of this Annual Report on Form 10-K and are filed as part of this report.
|
|
(b)
|
Exhibits
|
|
3.1*
|
Restated Certificate of Incorporation (incorporated by reference to the Company's Report on Form 10-K for the year ended April 30, 1992).
|
|
3.2
|
Certificate of Amendment of the Certificate of Incorporation dated October 13, 1995 (incorporated by reference to the Company's Report on Form 10-K for the year ended April 30, 1996).
|
|
3.3
|
Certificate of Amendment of the Certificate of Incorporation dated as of September 1998 (incorporated by reference to the Company's Report on Form 10-Q for the quarterly period ended October 31, 1998).
|
|
3.4
|
Certificate of Amendment of the Certificate of Incorporation dated as of September 1999 (incorporated by reference to the Company's Report on Form 10-Q for the quarterly period ended October 31, 1999).
|
|
3.5*
|
Amended and Restated By-Laws dated as of September 2007
|
|
10.1
|
Amended and Restated Credit Agreement dated March 1, 2016, among the Company and Bank of America, N.A., as Administrative Agent, Swing line Lender, and L/C Issuer, and Other Lenders Party Hereto (incorporated by reference to the Company's Report on Form 10-Q for the quarterly period ended January 31, 2016).
|
|
10.2
|
Agreement of the Lease dated as of July 14, 2014 between Hub Properties Trust as Landlord, an independent third party and John Wiley and Sons, Inc as Tenant (incorporated by reference to the Company's Report on Form 10-Q for the quarterly period ended July 31, 2014).
|
|
10.3
|
2014 Director Stock Plan (incorporated by reference to the Company's Report on Form 10-Q for the quarterly period ended October 31, 2014).
|
|
10.4
|
2014 Executive Annual Incentive Plan (incorporated by reference to the Company's Report on Form 10-Q for the quarterly period ended October 31, 2014).
|
|
10.5
|
Amended 2014 Key Employee Stock Plan (incorporated by reference to the Company's Report on Form 10-Q for the quarterly period ended October 31, 2014).
|
|
10.6
|
Supplemental Executive Retirement Plan as Amended and Restated effective as of January 1, 2009 (incorporated by reference to the Company's Report on Form 10-K for the year ended April 30, 2010).
|
|
10.7
|
|
|
10.8
|
Resolution amending the Supplemental Executive Retirement Plan to Cease Accruals and Freeze Participation effective June 30, 2013 (incorporated by reference to the Company's Report on Form 10-K for the year ended April 30, 2013)
|
|
10.9
|
Supplemental Benefit Plan Amended and Restated as of January 1, 2009, including amendments through August 1, 2010 (incorporated by reference to the Company's Report on Form 10-Q for the quarterly period ended January 31, 2011).
|
|
10.10
|
Resolution amending the Supplemental Benefit (Retirement) Plan to Cease Accruals and Freeze Participation effective June 30, 2013 (incorporated by reference to the Company's Report on Form 10-K for the year ended April 30, 2013).
|
|
10.11
|
Deferred Compensation Plan as Amended and Restated Effective as of January 1, 2008 (incorporated by reference to the Company's Report on Form 10-K for the year ended April 30, 2010).
|
|
10.12
|
Resolution amending the Deferred Compensation Plan effective July 1, 2013 (incorporated by reference to the Company's Report on Form 10-K for the year ended April 30, 2013).
|
|
10.13
|
Deferred Compensation Plan for Directors' 2005 & After Compensation (incorporated by reference to the Report on Form 8-K, filed December 21, 2005).
|
|
Form of the Fiscal Year 2019 Qualified Executive Long Term Incentive Plan.
|
|
|
Form of the Fiscal Year 2019 Qualified Executive Annual Incentive Plan.
|
|
|
Form of the Fiscal Year 2019 Executive Annual Strategic Milestones Incentive Plan.
|
|
|
10.17
|
Form of the Fiscal Year 2018 Qualified Executive Long Term Incentive Plan (incorporated by reference to the Company's Report on Form 10-K for the year ended April 30, 2017).
|
|
10.18
|
Form of the Fiscal Year 2018 Qualified Executive Annual Incentive Plan (incorporated by reference to the Company's Report on Form 10-K for the year ended April 30, 2017).
|
|
10.19
|
Form of the Fiscal Year 2018 Executive Annual Strategic Milestones Incentive Plan (incorporated by reference to the Company's Report on Form 10-K for the year ended April 30, 2017).
|
|
10.20
|
Form of the Fiscal Year 2017 Qualified Executive Long Term Incentive Plan (incorporated by reference to the Company's Report on Form 10-K for the year ended April 30, 2016).
|
|
10.21
|
Form of the Fiscal Year 2017 Qualified Executive Annual Incentive Plan (incorporated by reference to the Company's Report on Form 10-K for the year ended April 30, 2016).
|
|
10.22
|
Form of the Fiscal Year 2017 Executive Annual Strategic Milestones Incentive Plan (incorporated by reference to the Company's Report on Form 10-K for the year ended April 30, 2016).
|
|
10.23
|
Senior Executive Employment Agreement to Arbitrate dated as of April 29, 2003 (incorporated by reference to the Company's Report on Form 10-K for the year ended April 30, 2003).
|
|
10.24
|
Senior Executive Non-competition and Non-Disclosure Agreement dated as of April 29, 2003 (incorporated by reference to the Company's Report on Form 10-K for the year ended April 30, 2003).
|
|
10.25
|
Senior Executive Employment Agreement dated as of April 15, 2015 between Mark Allin and the Company (incorporated by reference to the Company's Report on Form 8-K dated as of April 15, 2015).
|
|
10.26
|
Separation and Release Agreement, effective June 9, 2017, between Mark Allin, former President and Chief Executive Officer and the Company (incorporated by reference to the Company's Report on Form 10-Q for the period ended July 31, 2017).
|
|
10.27
|
Senior executive Employment Agreement dated as of May 20, 2013 between John A. Kritzmacher and the Company (incorporated by reference to the Company's Report on Form 8-K dated as of June 4, 2013).
|
|
10.28
|
Addendum to the Employment Agreement, effective June 26, 2017, between John A. Kritzmacher, and the Company (incorporated by reference to the Company's Report on Form 10-Q for the period ended July 31, 2017).
|
|
10.29
|
Senior executive Employment Agreement letter dated as of March 15, 2004, between Gary M. Rinck and the Company (incorporated by reference to the Company's Report on Form 10-K for the year ended April 30, 2011).
|
|
10.30
|
Employment Letter dated May 11, 2017 between Matthew Kissner, Interim President and Chief Executive Officer and Chairman of the Board and the Company (incorporated by reference to the Company's Report on Form 10-Q for the period ended July 31, 2017).
|
|
10.31
|
Employment Letter dated October 12, 2017 between Brian A. Napack, President and Chief Executive Officer, and the Company (incorporated by reference to the Company's Report on Form 10-Q for the period ended October 31, 2017).
|
|
12.1*
|
Computation of Ratio of Earnings to Fixed Charges.
|
|
21*
|
List of Subsidiaries of the Company.
|
|
23*
|
Consent of KPMG LLP.
|
|
31.1*
|
Certification of Chief Executive Officer pursuant to Section 302 of the Sarbanes-Oxley Act of 2002.
|
|
31.2*
|
Certification of the Chief Financial Officer pursuant to Section 302 of the Sarbanes-Oxley Act of 2002.
|
|
32.1*
|
Certification of the Chief Executive Officer pursuant to 18 U.S.C. Section 1350, as adopted pursuant to Section 906 of the Sarbanes-Oxley Act of 2002.
|
|
32.2*
|
Certification of Chief Financial Officer pursuant to 18 U.S.C. Section 1350, as adopted pursuant to Section 906 of the Sarbanes-Oxley Act of 2002.
|
|
101.INS
|
XBRL Instance Document
|
|
101.SCH
|
XBRL Taxonomy Extension Schema Document
|
|
101.CAL
|
XBRL Taxonomy Extension Calculation Linkbase Document
|
|
101.DEF
|
XBRL Taxonomy Extension Definition Linkbase Document
|
|
101.LAB
|
XBRL Taxonomy Extension Label Linkbase Document
|
|
101.PRE
|
XBRL Taxonomy Extension Presentation Linkbase Document
|
| * |
Filed herewith
|
None.
79
JOHN WILEY & SONS, INC. AND SUBSIDIARIES
VALUATION AND QUALIFYING ACCOUNTS
FOR THE YEARS ENDED APRIL 30, 2018, 2017, AND 2016
(Dollars in thousands)
|
Description
|
Balance at
Beginning of Period
|
Charged to
Expenses and Other
|
Deductions
From Reserves(2)
|
Balance at
End of Period
|
||||||||||||
|
Year Ended April 30, 2018
|
||||||||||||||||
|
Allowance for Sales Returns (1)
|
$
|
24,300
|
$
|
(3,486
|
)
|
$
|
2,186
|
$
|
18,628
|
|||||||
|
Allowance for Doubtful Accounts
|
$
|
7,186
|
$
|
5,439
|
$
|
2,518
|
$
|
10,107
|
||||||||
|
Allowance for Inventory Obsolescence
|
$
|
21,096
|
$
|
9,182
|
$
|
12,085
|
$
|
18,193
|
||||||||
|
Year Ended April 30, 2017
|
||||||||||||||||
|
Allowance for Sales Returns (1)
|
$
|
19,861
|
$
|
53,482
|
$
|
49,043
|
$
|
24,300
|
||||||||
|
Allowance for Doubtful Accounts
|
$
|
7,254
|
$
|
2,913
|
$
|
2,981
|
$
|
7,186
|
||||||||
|
Allowance for Inventory Obsolescence
|
$
|
21,968
|
$
|
9,538
|
$
|
10,410
|
$
|
21,096
|
||||||||
|
Year Ended April 30, 2016
|
||||||||||||||||
|
Allowance for Sales Returns (1)
|
$
|
25,340
|
$
|
56,094
|
$
|
61,573
|
$
|
19,861
|
||||||||
|
Allowance for Doubtful Accounts
|
$
|
8,290
|
$
|
698
|
$
|
1,734
|
$
|
7,254
|
||||||||
|
Allowance for Inventory Obsolescence
|
$
|
21,901
|
$
|
15,167
|
$
|
15,100
|
$
|
21,968
|
||||||||
| (1) |
Allowance for Sales Returns represents anticipated returns net of a recovery of inventory and royalty costs. The provision is reported as a reduction of gross sales to arrive at revenue and the reserve balance is reported as a reduction of Accounts Receivable with a corresponding increase in Inventories and a reduction in Royalties Payable (See Note 2).
|
| (2) |
Deductions from reserves include foreign exchange translation adjustments, accounts written off, less recoveries and items removed from inventory.
|
80
Pursuant to the requirements of Section 13 or 15(d) of the Securities Exchange Act of 1934, the Company has duly caused this report to be signed on its behalf by the undersigned, thereunto duly authorized.
|
JOHN WILEY & SONS, INC.
|
|||
|
(Company)
|
|||
|
Dated: June 29, 2018
|
By:
|
/s/ Brian A. Napack
|
|
|
Brian A. Napack
|
|||
|
President and Chief Executive Officer
|
Pursuant to the requirements of the Securities Exchange Act of 1934, this report has been signed below by the following persons on behalf of the Company and in the capacities and on the dates indicated.
|
Signatures
|
Titles
|
Dated
|
|||
|
/s/ Brian A. Napack
|
President and Chief Executive Officer and
|
June 29, 2018
|
|||
|
Brian A. Napack
|
Director
|
||||
|
/s/ John A. Kritzmacher
|
Chief Financial Officer and
|
June 29, 2018
|
|||
|
John A. Kritzmacher
|
Executive Vice President, Operations
|
||||
|
/s/ Christopher F. Caridi
|
Senior Vice President, Corporate Controller and
|
June 29, 2018
|
|||
|
Christopher F. Caridi
|
Chief Accounting Officer
|
||||
|
/s/ Matthew S. Kissner
|
Chairman of the Board
|
June 29, 2018
|
|||
|
Matthew S. Kissner
|
|||||
|
/s/ Jesse C. Wiley
|
Manager, Business Development Client Solutions and
|
June 29, 2018
|
|||
|
Jesse C. Wiley
|
Director
|
||||
|
/s/ William J. Pesce
|
Director
|
June 29, 2018
|
|||
|
William J. Pesce
|
|||||
|
/s/ William B. Plummer
|
Director
|
June 29, 2018
|
|||
|
William B. Plummer
|
|||||
|
/s/ Mari J. Baker
|
Director
|
June 29, 2018
|
|||
|
Mari J. Baker
|
|||||
|
/s/ David C. Dobson
|
Director
|
June 29, 2018
|
|||
|
David C. Dobson
|
|||||
|
/s/ Raymond W. McDaniel, Jr.
|
Director
|
June 29, 2018
|
|||
|
Raymond W. McDaniel, Jr.
|
|||||
|
/s/ George D. Bell
|
Director
|
June 29, 2018
|
|||
|
George D. Bell
|
|||||
|
/s/ Laurie A. Leshin
|
Director
|
June 29, 2018
|
|||
|
Laurie A. Leshin
|
|||||
|
/s/ William Pence
|
Director
|
June 29, 2018
|
|||
|
William Pence
|
81