Attached files
| file | filename |
|---|---|
| EX-32.01 - EX-32.01 - ORACLE CORP | d568983dex3201.htm |
| EX-31.02 - EX-31.02 - ORACLE CORP | d568983dex3102.htm |
| EX-31.01 - EX-31.01 - ORACLE CORP | d568983dex3101.htm |
| EX-23.01 - EX-23.01 - ORACLE CORP | d568983dex2301.htm |
| EX-21.01 - EX-21.01 - ORACLE CORP | d568983dex2101.htm |
| EX-12.01 - EX-12.01 - ORACLE CORP | d568983dex1201.htm |
Table of Contents
Index to Financial Statements
UNITED STATES
SECURITIES AND EXCHANGE COMMISSION
Washington, D.C. 20549
FORM 10-K
| ☒ | ANNUAL REPORT PURSUANT TO SECTION 13 OR 15(d) OF THE SECURITIES EXCHANGE ACT OF 1934 |
For the fiscal year ended May 31, 2018
OR
| ☐ | TRANSITION REPORT PURSUANT TO SECTION 13 OR 15(d) OF THE SECURITIES EXCHANGE ACT OF 1934 |
For the transition period from to
Commission File Number: 001-35992
Oracle Corporation
(Exact name of registrant as specified in its charter)
| Delaware | 54-2185193 | |
| (State or other jurisdiction of incorporation or organization) |
(I.R.S. Employer Identification No.) | |
| 500 Oracle Parkway | ||
| Redwood City, California | 94065 | |
| (Address of principal executive offices) | (Zip Code) | |
(650) 506-7000
(Registrant’s telephone number, including area code)
Securities registered pursuant to Section 12(b) of the Act:
| Title of each class | Name of each exchange on which registered | |
| Common Stock, par value $0.01 per share 2.25% senior notes due January 2021 3.125% senior notes due July 2025 |
New York Stock Exchange New York Stock Exchange New York Stock Exchange |
Securities registered pursuant to Section 12(g) of the Act:
None
Indicate by check mark if the registrant is a well-known seasoned issuer, as defined in Rule 405 of the Securities Act. YES ☒ NO ☐
Indicate by check mark if the registrant is not required to file reports pursuant to Section 13 or Section 15(d) of the Act. YES ☐ NO ☒
Indicate by check mark whether the registrant (1) has filed all reports required to be filed by Section 13 or 15(d) of the Securities Exchange Act of 1934 during the preceding 12 months (or for such shorter period that the registrant was required to file such reports), and (2) has been subject to such filing requirements for the past 90 days. YES ☒ NO ☐
Indicate by check mark whether the registrant has submitted electronically and posted on its corporate Website, if any, every Interactive Data File required to be submitted and posted pursuant to Rule 405 of Regulation S-T (§232.405 of this chapter) during the preceding 12 months (or for such shorter period that the registrant was required to submit and post such files). YES ☒ NO ☐
Indicate by check mark if disclosure of delinquent filers pursuant to Item 405 of Regulation S-K (§229.405 of this chapter) is not contained herein, and will not be contained, to the best of registrant’s knowledge, in definitive proxy or information statements incorporated by reference in Part III of this Form 10-K or any amendment to this Form 10-K. ☐
Indicate by check mark whether the registrant is a large accelerated filer, an accelerated filer, a non-accelerated filer, a smaller reporting company or an emerging growth company. See the definitions of “large accelerated filer,” “accelerated filer,” “smaller reporting company” and “emerging growth company” in Rule 12b-2 of the Exchange Act.
| Large accelerated filer ☒ | Accelerated filer ☐ | |
| Non-accelerated filer ☐ (Do not check if a smaller reporting company) |
Smaller reporting company ☐ | |
| Emerging growth company ☐ | ||
If an emerging growth company, indicate by check mark if the registrant has elected not to use the extended transition period for complying with any new or revised financial accounting standards provided pursuant to Section 13(a) of the Exchange Act. ☐
Indicate by check mark whether the registrant is a shell company (as defined in Rule 12b-2 of the Exchange Act). YES ☐ NO ☒
The aggregate market value of the voting stock held by non-affiliates of the registrant was $142,975,778,000 based on the number of shares held by non-affiliates of the registrant as of May 31, 2018, and based on the closing sale price of common stock as reported by the New York Stock Exchange on November 30, 2017, which is the last business day of the registrant’s most recently completed second fiscal quarter. This calculation does not reflect a determination that persons are affiliates for any other purposes.
Number of shares of common stock outstanding as of June 15, 2018: 3,981,155,000.
Documents Incorporated by Reference:
Portions of the registrant’s definitive proxy statement relating to its 2018 annual stockholders’ meeting are incorporated by reference into Part III of this Annual Report on Form 10-K where indicated.
Table of Contents
Index to Financial Statements
ORACLE CORPORATION
FISCAL YEAR 2018
FORM 10-K
ANNUAL REPORT
Table of Contents
Index to Financial Statements
Cautionary Note on Forward-Looking Statements
For purposes of this Annual Report, the terms “Oracle,” “we,” “us” and “our” refer to Oracle Corporation and its consolidated subsidiaries. This Annual Report on Form 10-K contains statements that are not historical in nature, are predictive in nature, or that depend upon or refer to future events or conditions or otherwise contain forward-looking statements within the meaning of Section 21 of the Securities Exchange Act of 1934, as amended, and the Private Securities Litigation Reform Act of 1995. These include, among other things, statements regarding:
| • | our expectations regarding the effects of the U.S. Tax Cuts and Jobs Act of 2017 on our tax position and ability to access and use cash and other balances held by certain of our foreign subsidiaries; |
| • | our expectation that we will continue to acquire companies, products, services and technologies to further our corporate strategy; |
| • | our belief that our acquisitions enhance the products and services that we can offer to customers, expand our customer base, provide greater scale to accelerate innovation, grow our revenues and earnings, and increase stockholder value; |
| • | our expectation that, on a constant currency basis, our total cloud and license revenues generally will continue to increase due to expected growth in our cloud services and our license support offerings, continued demand for our cloud license and on-premise license offerings, and contributions from acquisitions; |
| • | our belief that our Oracle Cloud Platform and Infrastructure offerings are large opportunities for us to expand our cloud and license business; |
| • | our beliefs regarding the marketing of our PaaS and IaaS offerings; |
| • | our expectation that we will continue to place significant strategic emphasis on growing our cloud offerings; |
| • | our intention that we will renew our cloud software as a service (SaaS) and cloud platform as a service (PaaS) and infrastructure as a service (IaaS) contracts and hardware contracts when they are eligible for renewal; |
| • | our expectation that our hardware business will have lower operating margins as a percentage of revenues than our cloud and license business; |
| • | our expectation that we will continue to make significant investments in research and development and related product opportunities, including those related to hardware products and services, and our belief that research and development efforts are essential to maintaining our competitive position; |
| • | our expectation that our international operations will continue to provide a significant portion of our total revenues and expenses; |
| • | our expectation that we will continue paying comparable cash dividends on a quarterly basis; |
| • | the sufficiency of our sources of funding for working capital, capital expenditures, contractual obligations, acquisitions, dividends, stock repurchases, debt repayments and other matters; |
| • | our belief that we have adequately provided under U.S. generally accepted accounting principles for outcomes related to our tax audits and that the final outcome of our tax related examinations, agreements or judicial proceedings will not have a material effect on our results of operations, and our belief that our net deferred tax assets will be realized in the foreseeable future; |
| • | our belief that the outcome of certain legal proceedings and claims to which we are a party will not, individually or in the aggregate, result in losses that are materially in excess of amounts already recognized, if any; |
| • | the possibility that certain legal proceedings to which we are a party could have a material impact on our future cash flows and results of operations; |
1
Table of Contents
Index to Financial Statements
| • | the timing and amount of our stock repurchases, including our expectation that the levels of our future stock repurchase activity may be modified in comparison to past periods in order to use available cash for other purposes; |
| • | our expectation that seasonal trends will continue in the future; |
| • | our expectations regarding the impact of recent accounting pronouncements on our consolidated financial statements, including our belief that there will be no material impact to our revenues or operating expenses upon adoption of Topic 606 (as defined below); |
| • | our expectation that, to the extent customers renew support contracts or cloud SaaS, PaaS and IaaS contracts from companies that we have acquired, we will recognize revenues for the full contracts’ values over the respective renewal periods; |
| • | our ability to predict quarterly hardware revenues; |
as well as other statements regarding our future operations, financial condition and prospects, and business strategies. Forward-looking statements may be preceded by, followed by or include the words “expects,” “anticipates,” “intends,” “plans,” “believes,” “seeks,” “strives,” “endeavors,” “estimates,” “will,” “should,” “is designed to” and similar expressions. We claim the protection of the safe harbor for forward-looking statements contained in the Private Securities Litigation Reform Act of 1995 for all forward-looking statements. We have based these forward-looking statements on our current expectations and projections about future events. These forward-looking statements are subject to risks, uncertainties and assumptions about our business that could affect our future results and could cause those results or other outcomes to differ materially from those expressed or implied in the forward-looking statements. Factors that might cause or contribute to such differences include, but are not limited to, those discussed in “Risk Factors” included elsewhere in this Annual Report and as may be updated in filings we make from time to time with the U.S. Securities and Exchange Commission (SEC), including our Quarterly Reports on Form 10-Q to be filed by us in our fiscal year 2019, which runs from June 1, 2018 to May 31, 2019.
We have no obligation to publicly update or revise any forward-looking statements, whether as a result of new information, future events or risks, except to the extent required by applicable securities laws. If we do update one or more forward-looking statements, no inference should be drawn that we will make additional updates with respect to those or other forward-looking statements. New information, future events or risks could cause the forward-looking events we discuss in this Annual Report not to occur. You should not place undue reliance on these forward-looking statements, which reflect our expectations only as of the date of this Annual Report.
2
Table of Contents
Index to Financial Statements
Oracle Corporation provides products and services that address all aspects of corporate information technology (IT) environments—applications, platform and infrastructure. Our applications, platform and infrastructure offerings are delivered to customers worldwide through a variety of flexible and interoperable IT deployment models, including cloud-based, on-premise, or hybrid, which enable customer choice and flexibility. We market and sell our offerings globally to businesses of many sizes, government agencies, educational institutions and resellers with a worldwide sales force positioned to offer the combinations that best meet customer needs.
Our Oracle Cloud offerings provide a comprehensive and fully integrated stack of applications, platform, compute, storage and networking services in all three primary layers of the cloud: Software as a Service (SaaS), Platform as a Service (PaaS) and Infrastructure as a Service (IaaS). Our Oracle Cloud SaaS, PaaS and IaaS offerings (collectively, “Oracle Cloud Services”) integrate the software, hardware and services on customers’ behalf in IT environments that we deploy, support and manage for the customer. Our integrated Oracle Cloud Services are designed to be rapidly deployable to enable customers shorter time to innovation; easily maintainable to reduce integration and testing work; connectable among differing deployment models to enable interchangeability and extendibility between IT environments; compatible to easily move workloads between the Oracle Cloud and other IT environments; cost-effective by requiring lower upfront customer investment; and secure, standards-based and reliable. We are a leader in the core technologies of cloud IT environments, including database and middleware software as well as enterprise applications, virtualization, clustering, large-scale systems management and related infrastructure. Our products and services are the building blocks of our Oracle Cloud Services, our partners’ cloud services and our customers’ cloud IT environments.
Our cloud license and on-premise license deployment model includes Oracle Applications, Oracle Database and Oracle Fusion Middleware software offerings, among others, which customers deploy utilizing IT infrastructure from the Oracle Cloud or their own cloud-based or on-premise IT environments. Substantially all customers, at their option, purchase license support contracts when they purchase a license. Our hardware products include Oracle Engineered Systems, servers, storage and industry-specific products, among others, and customers generally opt to purchase hardware support contracts when they make a hardware purchase. We also offer services to assist our customers and partners to maximize the performance of their Oracle purchases.
Providing choice and flexibility to our customers as to when and how they deploy our applications, platform and infrastructure technologies is an important element of our corporate strategy. We believe that offering customers broad, comprehensive, flexible and interoperable deployment models for our applications, platform and infrastructure technologies is important to our growth strategy and better addresses customer needs relative to our competitors, many of whom provide fewer offerings and more restrictive deployment models.
Our investments in, and innovation with respect to, our products and services that we offer through our cloud and license, hardware and services businesses are another important element of our corporate strategy. In fiscal 2018, 2017 and 2016, we invested $6.1 billion, $6.2 billion and $5.8 billion, respectively, in research and development to enhance our existing portfolio of offerings and products and to develop new technologies and services. We have a deep understanding as to how applications, platform and infrastructure technologies interact and function with one another. We focus our development efforts on improving the performance, security, operation and integration of our technologies to make them more cost-effective and easier to deploy, manage and maintain for our customers and to improve their computing performance relative to our competitors’ products. For example, we believe that Oracle applications and platform technologies, such as the Oracle Database, when combined with Oracle infrastructure technologies deliver improved performance at a lower cost relative to competing infrastructure technologies. After the initial purchase of Oracle products and services, our customers can continue to benefit from our research and development efforts and deep IT expertise by electing to purchase and renew Oracle support offerings for their license and hardware deployments, which may include product enhancements that we periodically deliver to our products, and by renewing their Oracle Cloud Services contracts with us.
3
Table of Contents
Index to Financial Statements
Our selective and active acquisition program is another important element of our corporate strategy. We believe that our acquisitions enhance the products and services that we can offer to customers, expand our customer base, provide greater scale to accelerate innovation, grow our revenues and earnings, and increase stockholder value. In recent years, we have invested billions of dollars to acquire a number of companies, products, services and technologies that add to, are complementary to, or have otherwise enhanced our existing offerings. We expect to continue to acquire companies, products, services and technologies to further our corporate strategy.
We have three businesses:
| • | our cloud and license business, which is comprised of a single operating segment and includes our Oracle Cloud Services offerings, cloud license and on-premise license offerings, and license support offerings, represented 82%, 80% and 78% of our total revenues in fiscal 2018, 2017 and 2016, respectively; |
| • | our hardware business, which is comprised of a single operating segment and includes our hardware products and related hardware support services offerings, represented 10%, 11% and 13% of our total revenues in fiscal 2018, 2017, and 2016, respectively; and |
| • | our services business, which is comprised of a single operating segment, represented 8% of our total revenues in fiscal 2018 and 9% of our total revenues in each of fiscal 2017 and 2016. |
Management’s Discussion and Analysis of Financial Condition and Results of Operations and Note 15 of Notes to Consolidated Financial Statements, both included elsewhere in this Annual Report, provide additional information related to our businesses and operating segments.
Oracle Corporation was incorporated in 2005 as a Delaware corporation and is the successor to operations originally begun in June 1977.
Applications, Platform and Infrastructure Technologies
Oracle’s comprehensive portfolio of applications, platform and infrastructure technologies is designed to address an organization’s IT environment needs including business process, infrastructure and applications development requirements, among others. Oracle applications, platform and infrastructure technologies are based upon industry standards and are designed to be enterprise-grade, reliable, scalable and secure. We offer our applications, platform and infrastructure offerings through our cloud and license, hardware and services businesses and deliver them through the Oracle Cloud, or through customer use of other IT environments including cloud-based, hybrid and on-premise. We believe our applications, platform and infrastructure offerings enable flexibility, interoperability, and choice to best meet customer IT needs.
Oracle License Support
Oracle license support offerings represent our largest revenue stream and are a part of our cloud and license business. Substantially all of our customers opt to purchase license support contracts when they purchase Oracle applications, platform and/or infrastructure licenses to run within the Oracle Cloud or other cloud-based and on-premise IT environments. Substantially all customers renew their license support contracts annually. Our license support contracts are generally priced as a percentage of the net fees paid by the customer to access the license and are typically one year in duration. We believe our license support offerings protect and enhance our customers’ current investments in Oracle applications, platform and infrastructure technologies because they provide proactive and personalized support services, including Oracle Lifetime Support and unspecified license enhancements and upgrades during the term of the support period.
Providing choice and flexibility to our customers as to when and how they deploy our applications, platform and infrastructure technologies is an important element of our corporate strategy. In recent periods, customer demand has increased for our Oracle Cloud Services. To address customer demand and enable customer choice, we have introduced certain programs for customers to pivot their applications, platform and infrastructure licenses and license support contracts to the Oracle Cloud for new deployments and to migrate to and expand with the Oracle Cloud for their existing workloads. We expect these trends to continue.
4
Table of Contents
Index to Financial Statements
Applications Technologies
Oracle applications technologies are marketed, sold and delivered through our cloud and license business. Our applications technologies consist of comprehensive cloud-based and license offerings including our Oracle Cloud SaaS offerings, which are available for customers as a subscription, and Oracle Applications offerings, which are available for customers to purchase as a license for use in cloud-based and on-premise IT environments with the option to purchase related license support. Regardless of the deployment model selected, our applications technologies are designed to reduce the risk, cost and complexity of our customers’ IT infrastructures, while supporting customer choice with flexible deployment models that readily enable performance, agility, compatibility and extendibility.
Our applications technologies are generally designed using industry standards-based architectures to manage and automate core business functions across the enterprise, as well as to help customers differentiate and innovate in those processes unique to their industries or organizations. We offer applications that are deployable to meet a number of business automation requirements across a broad range of industries. We also offer industry-specific applications through a focused strategy of investments in internal development and strategic acquisitions, which provide solutions to customers in communications, construction and engineering, financial services, health sciences, hospitality, manufacturing, public sectors, retail and utilities, among others.
Oracle Cloud Software as a Service (SaaS)
Our broad spectrum of SaaS offerings provides customers a choice of software applications that are delivered via a cloud-based IT environment that we host, manage and support. Our SaaS offerings are built upon open industry standards such as SQL, Java and HTML5 for easier application accessibility, integration and development. Our SaaS offerings include a broad suite of modular, next-generation cloud software applications that span core business functions including human capital management (HCM), enterprise resource planning (ERP), customer experience (CX), and supply chain management (SCM), among others. We also offer a number of cloud-based industry solutions to address specific customer needs within certain industries.
We believe that the comprehensiveness and breadth of our SaaS offerings provide greater benefit to our customers and differentiate us from many of our competitors that offer more limited or specialized applications. Our SaaS offerings are designed to support connected business processes in the cloud and are centered on a responsive and flexible business core. Our SaaS offerings are designed to deliver a secure data isolation architecture and flexible upgrades; self-service access controls for users; a Service-Oriented Architecture (SOA); built-in social, mobile and business insight capabilities; and a high performance, high availability infrastructure based on our infrastructure technologies, including Oracle Engineered Systems. These SaaS capabilities are designed to simplify IT environments, reduce time to implementation and risk, improve the user experience and enable customers to focus resources on business growth opportunities. Our SaaS offerings are designed to incorporate emerging technologies such as Internet-of-Things (IoT), Artificial Intelligence (AI) and Machine Learning (ML), blockchain and advances in the “human interface” and how users interact with our applications.
Our Oracle Cloud SaaS offerings include, among others:
| • | Oracle HCM Cloud, which is designed to help organizations find, grow and retain their talent, enable collaboration, provide complete workforce insights, increase operational efficiency, and enable users to connect to an integrated suite of HCM applications from any device; |
| • | Oracle ERP, which is designed to be a complete, global and integrated ERP solution to help organizations improve decision making and workforce productivity, and to optimize back office operations by utilizing a single data and security model with a common user interface. We also offer NetSuite ERP, which is a cloud-based ERP offering targeted at small and medium-sized organizations and is designed to run back-office operations and financial processes and includes financial management, revenue management and billing, inventory, supply chain and warehouse management capabilities, among others; |
| • | Oracle CX Cloud, which is designed to be a complete and integrated solution to help organizations deliver consistent and personalized customer experiences across their customer channels, touch points and interactions; |
5
Table of Contents
Index to Financial Statements
| • | Oracle SCM Cloud, which is designed to help organizations create, optimize and digitize their supply chains and innovate products quickly; and |
| • | Oracle Data Cloud, which is designed to enable organizations to leverage consumer data to inform and measure marketing strategies and programs. |
Oracle Applications
Customers have the ability to license Oracle Applications for use within the Oracle Cloud, or within their own cloud-based or on-premise IT environments. Oracle Applications are designed to manage and automate core business functions across the enterprise, including HCM; ERP; financial management and governance, risk and compliance; procurement; project portfolio management; SCM; business analytics and enterprise performance management; CX and customer relationship management; and industry-specific applications, among others.
As described above, we provide the option for customers to purchase license support contracts in connection with the purchase of Oracle Applications licenses.
Platform and Infrastructure Technologies
Oracle platform technologies are marketed, sold and delivered through our cloud and license business. Our comprehensive platform technologies including database, middleware and development tools are available through subscription to our Oracle Cloud PaaS offerings or by the purchase of a license. Our platform offerings include Oracle Database, the world’s most popular enterprise database, and Java, the computer industry’s most widely-used software development language, among others, and related license support at the customer’s option. Our platform technologies are designed to provide a cost-effective, standards-based, high-performance platform for developing, running, integrating, managing and extending business applications. Our customers are increasingly focused on developing innovations and reducing the total cost of their IT infrastructure and we believe that our platform technologies help them achieve this goal.
Our platform technologies are designed to accommodate demanding, mission-critical business environments using elastic clusters of middleware, database servers and storage. These elastic clusters are designed to scale incrementally as required to address our customers’ IT capacity requirements, satisfy their planning and procurement needs, support their business applications with a standardized platform architecture, reduce their risk of data loss and IT infrastructure downtime and efficiently utilize available IT resources to meet quality of service expectations. In addition to utilizing these tools for modernizing their businesses, our customers are looking to build new and innovative applications leveraging emerging technologies such as IoT chatbots and AI/ML. Today, Oracle delivers applied AI functionality as a part of its Autonomous Data Warehouse Cloud Service, which is designed to deliver simplified, fast and highly elastic support for data warehousing in the Oracle Cloud, eliminating manual configuration, tuning, and scaling tasks and allowing for streamlined operations, more efficient consumption of resources, and higher security and reliability. Our Cloud Platform technologies are designed with built-in automation at all levels to perform maintenance tasks so our customers can utilize their IT resources to focus on extracting more value from the data they currently manage.
Oracle infrastructure technologies provide cloud-based compute, storage and networking capabilities through our Oracle Cloud IaaS offerings. Oracle infrastructure technologies also include hardware and certain hardware-related software offerings such as Oracle Engineered Systems, servers, storage, industry-specific hardware, virtualization software, operating systems, management software and related hardware services including support at the customer’s option. We design our infrastructure technologies to work in customer environments that may include other Oracle or non-Oracle hardware or software components. Our flexible and open approach provides Oracle customers choice on how they utilize and deploy our infrastructure technologies: through the use of Oracle Cloud Platform’s IaaS offerings; in our customer’s data centers; or a hybrid combination of these two deployment models. We focus on the operation and integration of our infrastructure technologies to make them easier to deploy, extend, interconnect, manage and maintain for our customers and to improve computing performance relative to our competitors’ offerings. For example, we believe that Oracle applications and platform technologies when combined with Oracle infrastructure technologies deliver improved performance at a lower cost relative to competing infrastructure technologies. As another example,
6
Table of Contents
Index to Financial Statements
we design Oracle Engineered Systems to integrate multiple Oracle technology components to work together to deliver improved performance, availability, security and operational efficiency relative to our competitors’ products. These same Oracle technology components are tested together and supported together to streamline the Oracle Engineered System deployment and maintenance cycles. We also engineer our hardware products with virtualization and management capabilities to enable the rapid deployment and efficient management of cloud and other IT infrastructures.
Oracle Cloud-Based Platform and Infrastructure Offerings
We believe that our Oracle Cloud Platform and Infrastructure offerings are large opportunities for us to expand our cloud and license business. We believe that our customers increasingly recognize the value of access to cloud-based IaaS capabilities on both a standalone basis and including PaaS with Oracle Database, Oracle Fusion Middleware (Java, Container Platform, API Management, Integration, Developer Tools, Mobile, Analytics, Content and Experience, Security and Management), and open source including MySQL via a low cost, rapidly deployable, flexible and interoperable services model that Oracle manages and maintains on the customer’s behalf. We believe that we can market and sell our PaaS and IaaS offerings together to help customers migrate their extensive installed base of on-premise platform and infrastructure technologies to the Oracle Cloud while at the same time reaching a broader ecosystem of developers and partners. We also believe we can market our PaaS and IaaS services to small and medium-sized businesses and non-IT lines of business purchasers due to the highly available, low touch and low cost characteristics of the Oracle Cloud.
Oracle Cloud Platform as a Service (PaaS)
Oracle Cloud PaaS is designed to provide a broad suite of services to rapidly build, deploy, integrate, analyze, secure and manage all enterprise applications (customer facilities-based and cloud deployed) using a cloud-based IT model that we run, manage, and support on the behalf of the customer for a fee for a stated time period. Customers and partners utilize our open, standards-based PaaS offerings that are based upon Oracle Fusion Middleware including Java, open source, and the Oracle Database, together with tools for a variety of use cases across data management, applications development, integration, content and experience, business analytics, IT operations management and security. Our Oracle Cloud PaaS offerings include, among others, Data Management, Application Development, Integration, Business Analytics, Management and Security Cloud solutions.
Oracle Cloud Infrastructure as a Service (IaaS)
Oracle Cloud IaaS offerings are substantially marketed, sold and delivered through our cloud and license business and include our Oracle Cloud Infrastructure and Oracle Managed Cloud Services offerings. Oracle Cloud Infrastructure offerings are designed to deliver enterprise-grade compute, storage and networking services within the Oracle Cloud for a fee for a stated period of time, or on a pay-as-you-go basis for service at a specified rate. Customers use Oracle Cloud Infrastructure offerings to build and operate new cloud-native applications, and to move their existing workloads to the Oracle Cloud from their data centers or from other cloud-based IT environments, among other uses. By utilizing Oracle Cloud IaaS, customers leverage the Oracle Cloud for enterprise-grade, scalable, cost-effective, and secure infrastructure technologies that are designed to be rapidly deployable while reducing the amount of time and resources normally consumed by IT processes in their on-premise environments. We continue to invest in Oracle Cloud IaaS to expand the catalog of tools and services we provide to simplify the process of migrating workloads to the Oracle Cloud, as well as to provide customers with the ability to run workloads across on-premise IT environments and the Oracle Cloud in a hybrid deployment model. Our Oracle Cloud IaaS offerings include compute offerings such as bare metal servers and virtual machines, among others; storage offerings including block, object and archive storage, among others; and networking cloud offerings.
We also offer Oracle Managed Cloud Services which are designed to provide comprehensive software and hardware management, maintenance and security services for customer cloud-based, hybrid IT or other infrastructure for a fee for a stated term. Oracle Managed Cloud Services may be hosted at our Oracle data center facilities, select partner data centers or physically at our customer’s facilities.
7
Table of Contents
Index to Financial Statements
Oracle Cloud at Customer
Oracle Cloud at Customer is a direct response to barriers to public cloud adoption for businesses within certain regulated industries or jurisdictions. Customers are able to access certain SaaS, PaaS and IaaS capabilities of the Oracle Cloud in their own data centers, fully managed by Oracle. This allows customers to take advantage of the agility, innovation and subscription based pricing of Oracle Cloud Services while meeting data sovereignty, data residency, data protection and regulatory business policy requirements.
Other Oracle Platform and Infrastructure Offerings
Oracle Database
The Oracle Database is the world’s most popular enterprise database and is designed to enable reliable and secure storage, retrieval and manipulation of all forms of data. The Oracle Database is licensed throughout the world by businesses and organizations of different sizes for a multitude of purposes, including, among others: for use within the Oracle Cloud to deliver our Cloud SaaS and PaaS offerings; for use by a number of cloud-based vendors in offering their cloud services; for packaged and custom applications for transactions processing; and for data warehousing and business intelligence. The Oracle Database may be deployed within different IT environments including the Oracle Cloud, other cloud-based environments, on-premise data centers and related IT environments. Customers may elect to purchase license support for the Oracle Database at their option.
Oracle Database Enterprise Edition is available with a number of optional add-on products to address specific customer requirements. In addition to the Oracle Database, we also offer a portfolio of specialized database products to address particular customer requirements including MySQL, Oracle TimesTen In-Memory Database, Oracle Berkeley DB, and Oracle NoSQL Database.
Oracle Big Data
Big data generally refers to a massive amount of unstructured, streaming and structured data that is so large that it is difficult to process using traditional IT techniques. We offer big data solutions to complement and extend its applications, platform and infrastructure technologies. We believe that most businesses view big data as a potentially high-value source of business intelligence that can be used to gain new insights into their customers’ behaviors, to anticipate future demand more accurately, to align workforce deployment with business activity forecasts and to accelerate the pace of operations, among other benefits. We offer a broad portfolio of platform and infrastructure offerings to address an organization’s big data requirements including, among others, cloud-based services for data integration, data management, analytics and ML.
Oracle Fusion Middleware
We license our Oracle Fusion Middleware, which is a broad family of integrated application infrastructure software, for use in the Oracle Cloud, other cloud-based environments, on-premise data centers and related IT environments. These products are designed to form a reliable and scalable foundation on which customers can build, deploy, secure, access, extend and integrate business applications and automate their business processes. Built with our Java technology platform, Oracle Fusion Middleware products are designed to be flexible across different deployment environments—cloud, on-premise or hybrid—as a foundation for custom, packaged and composite applications thereby simplifying and reducing time to deployment. Oracle Fusion Middleware is designed to protect customers’ IT investments and work with both Oracle and non-Oracle database, middleware and applications software through its open architecture and adherence to industry standards. Specifically, Oracle Fusion Middleware is designed to enable customers to integrate Oracle and non-Oracle business applications, automate business processes, scale applications to meet customer demand, simplify security and compliance, manage lifecycles of documents and get actionable, targeted business intelligence. In addition, Oracle Fusion Middleware supports multiple development languages and tools, which enables developers to flexibly build and deploy web services, websites, portals and web-based applications across different IT environments.
8
Table of Contents
Index to Financial Statements
Among our other middleware offerings, we license a wide range of development tools, identity management and business analytics software for mobile computing development that are designed to address the needs of businesses that are increasingly focused on delivering mobile device applications to their customers. We also offer certain of these mobile development capabilities as a cloud service, including Oracle Mobile Cloud Service, among others.
Customers may elect to purchase license support, as described above, for Oracle Fusion Middleware licenses at their option.
Java
Java is the computer industry’s most widely-used software development language and is viewed as a global standard. We believe the Java programming language and platform together represent one of the most popular and powerful development environments in the world, one that is used by millions of developers globally to develop embedded applications, web content, enterprise software and games. Oracle Fusion Middleware software products and certain of our Oracle Applications are built using our Java technology platform, which we believe is a key advantage for our business. Customers may license the use of Java or access Java through Oracle Java Cloud Service.
Java is designed to enable developers to write software on a single platform and run it on many other different platforms, independent of operating system and hardware architecture. Java has been adopted by both independent software vendors (ISVs) that have built their products on Java and by enterprise organizations building custom applications or consuming Java-based ISV products.
Hardware Business
Our hardware business provides a broad selection of hardware products and related hardware support services for cloud-based IT environments, data centers and related IT environments.
Oracle Engineered Systems
Oracle Engineered Systems are core to our cloud-based and on-premise data center infrastructure offerings. Oracle Engineered Systems are pre-integrated products designed to integrate multiple Oracle technology components including database, storage, operating system or middleware software with server, storage and networking hardware and other technologies to work together to deliver improved performance, availability, security and operational efficiency relative to our competitors’ products; to be upgraded effectively and efficiently; and to simplify maintenance cycles by providing a single solution for software patching. We offer certain of our Oracle Engineered Systems, including Oracle Exadata Database Machine, among others, through flexible deployment options, including as a cloud service and as a cloud at customer service.
Servers
We offer a wide range of server products that are designed for mission-critical enterprise environments and are key components of our engineered systems offerings and cloud offerings. We have two families of server products: those based on the SPARC microprocessor, which are designed to be differentiated by their reliability, security and scalability; and those using microprocessors from Intel Corporation. By offering a range of server sizes and microprocessors, customers are offered the flexibility to choose the types of servers that they believe will be most appropriate and valuable for their particular IT environments. We believe the combination of Oracle server systems with Oracle software enhances customer ability to shift data and workloads between data center and cloud deployments based on business requirements.
Storage
Oracle storage products are engineered for the cloud and designed to securely store, manage, protect, and archive customers’ mission-critical data assets generated by any database or application. Oracle storage products combine flash, disk, tape and server technologies with optimized software and unique integrations with Oracle Database designed to offer greater performance and efficiency, and lower total cost relative to our
9
Table of Contents
Index to Financial Statements
competitors’ storage products. Certain of our storage products are offered as a cloud service and cloud at customer service. Our storage offerings include, among others, Oracle ZFS Storage Appliance, a unified storage system that combines network attached storage (NAS), storage area network (SAN) and object storage capabilities; Oracle’s Zero Data Loss Recovery Appliance that provides unique, recovery-focused data protection for Oracle Database; and Oracle’s StorageTek tape storage and automation product line which includes tape drives, tape libraries, mainframe virtualized tape libraries, media, and software packages that provide lifecycle data management and security for enterprise backup and archive requirements.
Industry-Specific Hardware Offerings
We offer hardware products and services designed for certain specific industries including our point-of-sale terminals and related hardware that are designed for managing businesses within the food and beverage, hotel and retail industries; and hardware products and services for communications networks including network signaling, policy control and subscriber data management solutions, and session border control technology, among others.
Operating Systems, Virtualization, Management and Other Hardware-Related Software
We offer a portfolio of operating systems, including Oracle Linux and Oracle Solaris, virtualization software including Oracle VM, and other hardware related software including development, management and file systems tools that are designed to optimize the performance, efficiency, and security of customers’ hardware products while providing customers with high levels of flexibility, reliability, and availability. We also offer a range of management technologies and products, including Oracle Enterprise Manager, that help customers build and efficiently operate complex IT environments, including both end users’ and service providers’ cloud environments.
Hardware Support
Our hardware support offerings provide customers with unspecified software updates for software components that are essential to the functionality of our hardware products and associated software products such as Oracle Solaris. These offerings can also include product repairs, maintenance services and technical support services. We continue to evolve hardware support processes that are intended to proactively identify and solve quality issues and to increase the amount of new and renewed hardware support contracts sold in connection with the sales of our hardware products. Hardware support contracts are generally priced as a percentage of the net hardware products fees.
Services
We offer services solutions to help customers and partners maximize the performance of their investments in Oracle applications, platform and infrastructure technologies. We believe that our services are differentiated based on our focus on Oracle technologies, extensive experience and broad sets of intellectual property and best practices. Our services business offers the following:
| • | consulting services, which are designed to help our customers and global system integrator partners more successfully architect and deploy our cloud and license offerings including IT strategy alignment, enterprise architecture planning and design, initial software implementation and integration, application development and integration services, security assessments and ongoing software enhancements and upgrades. We utilize a global, blended delivery model to optimize value for our customers and partners, consisting of consultants from local geographies, industry specialists and consultants from our global delivery and solution centers; |
| • | advanced customer support services, which are provided at customer facilities and remotely to enable increased performance and higher availability of their Oracle products; and |
| • | education services for Oracle’s cloud and license offerings, including training and certification programs that are offered to customers, partners and employees through a variety of formats including instructor-led classes, live virtual training, video-based training on demand, online learning subscriptions, private events and custom training. |
10
Table of Contents
Index to Financial Statements
Oracle Cloud Operations
Oracle Cloud Operations deliver our Oracle Cloud Services to customers through a secure, reliable, scalable, enterprise grade cloud infrastructure platform managed by our employees within a global network of data centers, which we refer to as the Oracle Cloud. Oracle Cloud Operations leverage automated software tools to enable the rapid delivery of the latest cloud technology capabilities to the Oracle Cloud as they become available. The Oracle Cloud enables secure and isolated cloud-based instances for each of our customers to access the functionality of our Oracle Cloud Services via a broad spectrum of devices.
Manufacturing
To produce our hardware products that we market and sell to third-party customers and that we utilize internally to deliver as a part of our Oracle Cloud operations, we rely on both our internal manufacturing operations as well as third-party manufacturing partners. Our internal manufacturing operations consist primarily of materials procurement, assembly, testing and quality control of our Oracle Engineered Systems and certain of our enterprise and data center servers and storage products. For all other manufacturing, we generally rely on third-party manufacturing partners to produce our hardware-related components and hardware products and we may involve our internal manufacturing operations in the final assembly, testing and quality control processes for these components and products. We distribute most of our hardware products either from our facilities or partner facilities. Our manufacturing processes are substantially based on standardization of components across product types, centralization of assembly and distribution centers and a “build-to-order” methodology in which products generally are built only after customers have placed firm orders. Production of our hardware products requires that we purchase materials, supplies, product subassemblies and full assemblies from a number of vendors. For most of our hardware products, we have existing alternate sources of supply or such sources are readily available. However, we do rely on sole sources for certain of our hardware products. As a result, we continue to evaluate potential risks of disruption to our supply chain operations. Refer to “Risk Factors” included in Item 1A within this Annual Report for additional discussion of the challenges we encounter with respect to the sources and availability of supplies for our products and the related risks to our business.
Sales and Marketing
We directly market and sell our cloud, license, hardware and services offerings to businesses of many sizes and in many industries, government agencies and educational institutions. We also market and sell our offerings through indirect channels. No single customer accounted for 10% or more of our total revenues in fiscal 2018, 2017 or 2016.
In the United States, our sales and services employees are based in our headquarters and in field offices throughout the country. Outside the United States, our international subsidiaries sell, support and service our offerings in their local countries as well as within other foreign countries where we do not operate through a direct sales subsidiary. Our geographic coverage allows us to draw on business and technical expertise from a global workforce, provides stability to our operations and revenue streams to offset geography specific economic trends and offers us an opportunity to take advantage of new markets for our offerings. Our international operations subject us to certain risks, which are more fully described in “Risk Factors” included in Item 1A of this Annual Report. A summary of our domestic and international revenues and long-lived assets is set forth in Note 15 of Notes to Consolidated Financial Statements included elsewhere in this Annual Report.
We also market our product offerings worldwide through indirect channels. The companies that comprise our indirect channel network are members of the Oracle Partner Network. The Oracle Partner Network is a global program that manages our business relationships with a large, broad-based network of companies, including independent software and hardware vendors, system integrators and resellers that deliver innovative solutions and services based upon our product offerings. By offering our partners access to our product offerings, educational information, technical services, marketing and sales support, the Oracle Partner Network program extends our market reach by providing our partners with the resources they need to be successful in delivering solutions to customers globally. The majority of our hardware products are sold through indirect channels including independent distributors and value-added resellers.
11
Table of Contents
Index to Financial Statements
Research and Development
We develop the substantial majority of our product offerings internally. In addition, we have extended our product offerings and intellectual property through acquisitions of businesses and technologies. We also purchase or license intellectual property rights in certain circumstances. Internal development allows us to maintain technical control over the design and development of our products. We have a number of United States and foreign patents and pending applications that relate to various aspects of our products and technology. While we believe that our patents have value, no single patent is essential to us or to any of our principal businesses. Research and development expenditures were $6.1 billion, $6.2 billion and $5.8 billion in fiscal 2018, 2017 and 2016, respectively, or 15% of total revenues in fiscal 2018 and 16% of total revenues in each of fiscal 2017 and 2016. Rapid technological advances in hardware and software development, evolving standards in computer hardware and software technology, changing customer needs and frequent new product introductions, offerings and enhancements characterize the markets in which we compete. We plan to continue to dedicate a significant amount of resources to research and development efforts to maintain and improve our current product and services offerings.
Employees
As of May 31, 2018, we employed approximately 137,000 full-time employees, including approximately 39,000 in sales and marketing, approximately 18,000 in our cloud services and license support operations, approximately 4,000 in hardware, approximately 24,000 in services, approximately 39,000 in research and development and approximately 13,000 in general and administrative positions. Of these employees, approximately 49,000 were employed in the United States and approximately 88,000 were employed internationally. None of our employees in the United States is represented by a labor union; however, in certain foreign subsidiaries, labor unions or workers’ councils represent some of our employees.
Seasonality and Cyclicality
Our quarterly revenues have historically been affected by a variety of seasonal factors, including the structure of our sales force incentive compensation plans, which are common in the technology industry. In each fiscal year, our total revenues and operating margins are typically highest in our fourth fiscal quarter and lowest in our first fiscal quarter. The operating margins of our businesses (in particular, our cloud and license business and hardware business) are generally affected by seasonal factors in a similar manner as our revenues as certain expenses within our cost structure are relatively fixed in the short term. See “Selected Quarterly Financial Data” in Item 7 of this Annual Report for a more complete description of the seasonality and cyclicality of our revenues, expenses and margins.
Competition
We face intense competition in all aspects of our business. The nature of the IT industry creates a competitive landscape that is constantly evolving as firms emerge, expand or are acquired, as technology evolves and as customer demands and competitive pressures otherwise change.
Our customers are demanding less complexity and lower total cost in the implementation, sourcing, integration and ongoing maintenance of their enterprise software and hardware. Our enterprise cloud license and on-premise license, and hardware offerings compete directly with certain offerings from some of the largest and most competitive companies in the world, including Amazon.com, Inc., Microsoft Corporation, International Business Machines Corporation (IBM), Intel Corporation, Cisco Systems, Inc., Adobe Systems Incorporated, Alphabet Inc. and SAP SE, as well as other companies like Hewlett-Packard Enterprise, salesforce.com, inc. and Workday, Inc. In addition, due to the low barriers to entry in many of our market segments, new technologies and new and growing competitors frequently emerge to challenge our offerings. Our competitors range from companies offering broad IT solutions across many of our lines of business to vendors providing point solutions, or offerings focused on a specific functionality, product area or industry. In addition, as we expand into new market segments, we face increased competition as we compete with existing competitors, as well as firms that may be partners in other areas of our business and other firms with whom we have not previously competed.
12
Table of Contents
Index to Financial Statements
Moreover, we or our competitors may take certain strategic actions—including acquisitions, partnerships and joint ventures, or repositioning of product lines—which invite even greater competition in one or more product offering categories.
Key competitive factors in each of the segments in which we currently compete and may compete in the future include: total cost of ownership, performance, scalability, reliability, security, functionality, efficiency, speed to production and quality of technical support. Our product and service sales (and the relative strength of our products and services versus those of our competitors) are also directly and indirectly affected by the following, among other things:
| • | the adoption of cloud-based IT offerings including SaaS, PaaS and IaaS offerings; |
| • | ease of deployment, use and maintenance of our products and services offerings; |
| • | compatibility between Oracle products and services deployed within local IT environments and public cloud IT environments, including our Oracle Cloud environments; |
| • | the adoption of commodity servers and microprocessors; |
| • | the broader “platform” competition between our industry standard Java technology platform and the .NET programming environment of Microsoft; |
| • | operating system competition among our Oracle Solaris and Linux operating systems, with alternatives including Microsoft’s Windows Server, and other UNIX and Linux operating systems; |
| • | the adoption of open source alternatives to commercial software by enterprise software customers; |
| • | products, features and functionality developed internally by customers and their IT staff; |
| • | products, features and functionality customized and implemented for customers by consultants, systems integrators or other third parties; and |
| • | attractiveness of offerings from business processing outsourcers. |
For more information about the competitive risks we face, refer to Item 1A. “Risk Factors” included elsewhere in this Annual Report.
Available Information
Our Annual Report on Form 10-K, Quarterly Reports on Form 10-Q, Current Reports on Form 8-K and amendments to those reports filed pursuant to Sections 13(a) and 15(d) of the Securities Exchange Act of 1934, as amended, are available, free of charge, on our Investor Relations website at www.oracle.com/investor as soon as reasonably practicable after we electronically file such material with, or furnish it to, the U.S. Securities and Exchange Commission. We use our Investor Relations website as a means of disclosing material non-public information. Accordingly, investors should monitor our Investor Relations website, in addition to following our press releases, SEC filings and public conference calls and webcasts. In addition, information regarding our environmental policy and global sustainability initiatives and solutions are also available on our website www.oracle.com/corporate/citizenship. The information posted on or accessible through our website is not incorporated into this Annual Report.
Executive Officers of the Registrant
Our executive officers are listed below.
| Name |
Office(s) | |
| Lawrence J. Ellison |
Chairman of the Board of Directors and Chief Technology Officer | |
| Safra A. Catz |
Chief Executive Officer and Director | |
| Mark V. Hurd |
Chief Executive Officer and Director | |
| Jeffrey O. Henley |
Vice Chairman of the Board of Directors | |
| Thomas Kurian |
President, Product Development | |
| Edward Screven |
Executive Vice President, Chief Corporate Architect | |
| Dorian E. Daley |
Executive Vice President and General Counsel | |
| William Corey West |
Executive Vice President, Corporate Controller and Chief Accounting Officer |
13
Table of Contents
Index to Financial Statements
Mr. Ellison, 73, has been our Chairman of the Board and Chief Technology Officer since September 2014. He served as our Chief Executive Officer from June 1977, when he founded Oracle, until September 2014. He has served as a Director since June 1977. He previously served as our Chairman of the Board from May 1995 to January 2004.
Ms. Catz, 56, has been our Chief Executive Officer since September 2014. She served as our President from January 2004 to September 2014, our Chief Financial Officer most recently from April 2011 until September 2014 and a Director since October 2001. She was previously our Chief Financial Officer from November 2005 until September 2008 and our Interim Chief Financial Officer from April 2005 until July 2005. Prior to being named our President, she held various other positions with us since joining Oracle in 1999. She currently serves as a director of The Walt Disney Company and she previously served as a director of HSBC Holdings plc.
Mr. Hurd, 61, has been our Chief Executive Officer since September 2014. He served as our President from September 2010 to September 2014 and a Director since September 2010. Prior to joining us, he served as Chairman of the Board of Directors of Hewlett-Packard Company from September 2006 to August 2010 and as Chief Executive Officer, President and a member of the Board of Directors of Hewlett-Packard Company from April 2005 to August 2010.
Mr. Henley, 73, has served as our Vice Chairman of the Board since September 2014. He previously served as our Chairman of the Board from January 2004 to September 2014 and has served as a Director since June 1995. He served as our Executive Vice President and Chief Financial Officer from March 1991 to July 2004.
Mr. Kurian, 51, has been our President, Product Development since January 2015. He served as our Executive Vice President, Product Development from July 2009 until January 2015. He served as our Senior Vice President of Development from February 2001 until July 2009. Mr. Kurian worked in Oracle Server Technologies as Vice President of Development from March 1999 until February 2001. He also held various other positions with us since joining Oracle in 1996.
Mr. Screven, 53, has been Executive Vice President, Chief Corporate Architect since May 2015. He served as our Senior Vice President, Chief Corporate Architect from November 2006 to April 2015 and as Vice President, Chief Corporate Architect from January 2003 to November 2006. He held various other positions with us since joining Oracle in 1986.
Ms. Daley, 59, has been our Executive Vice President and General Counsel since April 2015. She served as our Secretary from October 2007 until October 2017 and she was our Senior Vice President, General Counsel from October 2007 to April 2015. She served as our Vice President, Legal, Associate General Counsel and Assistant Secretary from June 2004 to October 2007, as Associate General Counsel and Assistant Secretary from October 2001 to June 2004 and as Associate General Counsel from February 2001 to October 2001. She held various other positions with us since joining Oracle’s Legal Department in 1992.
Mr. West, 56, has been our Executive Vice President, Corporate Controller and Chief Accounting Officer since April 2015. He served as our Senior Vice President, Corporate Controller and Chief Accounting Officer from February 2008 to April 2015 and served as our Vice President, Corporate Controller and Chief Accounting Officer from April 2007 to February 2008. His previous experience includes 14 years with Arthur Andersen LLP, most recently as a partner.
We operate in rapidly changing economic and technological environments that present numerous risks, many of which are driven by factors that we cannot control or predict. The following discussion, as well as our “Critical Accounting Policies and Estimates” discussion in Management’s Discussion and Analysis of Financial Condition and Results of Operations (Item 7), highlights some of these risks. The risks described below are not exhaustive and you should carefully consider these risks and uncertainties before investing in our securities.
Our Oracle Cloud strategy, including our Oracle Software as a Service (SaaS), Platform as a Service (PaaS), Infrastructure as a Service (IaaS) and Data as a Service (DaaS) offerings, may adversely affect our revenues and profitability. We provide our cloud and other offerings to customers worldwide via deployment models that best suit their needs, including via our cloud-based SaaS, PaaS, IaaS and DaaS offerings. As these business
14
Table of Contents
Index to Financial Statements
models continue to evolve, we may not be able to compete effectively, generate significant revenues or maintain the profitability of our cloud offerings. Additionally, the increasing prevalence of cloud and SaaS delivery models offered by us and our competitors may unfavorably impact the pricing of our cloud and license offerings. If we do not successfully execute our cloud computing strategy or anticipate the cloud computing needs of our customers, our reputation as a cloud services provider could be harmed and our revenues and profitability could decline.
As customer demand for our cloud offerings increases, we experience volatility in our reported revenues and operating results due to the differences in timing of revenue recognition between our cloud license and on-premise license, and hardware arrangements relative to our cloud offering arrangements. Customers generally purchase our cloud offerings on a subscription basis and revenues from these offerings are generally recognized ratably over the terms of the subscriptions. Consequently, any deterioration in sales activity associated with our cloud offerings may not be immediately observable in our consolidated statement of operations. This is in contrast to revenues associated with our cloud license and on-premise license arrangements which are generally recognized in full at the time of delivery of the related licenses. In addition, we incur certain expenses associated with the infrastructure and marketing of our cloud offerings in advance of our ability to recognize the revenues associated with these offerings.
We have also acquired a number of cloud computing companies, and the integration of these companies into our Oracle Cloud strategy may not be as efficient or scalable as anticipated, which could adversely affect our ability to fully realize the benefits anticipated from these acquisitions.
Our success depends upon our ability to develop new products and services, integrate acquired products and services and enhance our existing products and services. Rapid technological advances, changing delivery models and evolving standards in computer hardware and software development and communications infrastructure, changing and increasingly sophisticated customer needs and frequent new product introductions and enhancements characterize the industries in which we compete. If we are unable to develop new or sufficiently differentiated products and services, enhance and improve our product offerings and support services in a timely manner or position and price our products and services to meet demand, customers may not purchase or subscribe to our software, hardware or cloud offerings or renew software support, hardware support or cloud subscriptions contracts. Renewals of these contracts are important to the growth of our business. In addition, we cannot provide any assurance that the standards on which we choose to develop new products will allow us to compete effectively for business opportunities in emerging areas.
We have continued to refresh and release new offerings of our cloud products and services, including the launch of the Oracle Autonomous Data Warehouse Cloud Service in fiscal 2018. The Oracle Autonomous Data Warehouse Cloud Service offers automation based on machine learning and we have guaranteed, among other matters, that it will reduce customer downtime to less than 30 minutes a year and that Amazon Data Warehouse customers will see a significant cost reduction if they migrate their workloads to our offering. Machine learning and artificial intelligence are increasingly driving innovations in technology but if they fail to operate as anticipated or the Oracle Autonomous Warehouse Cloud Service or our other products do not perform as promised, our business and reputation may be harmed.
In addition, our business may be adversely affected if:
| • | we do not continue to develop and release new or enhanced products and services within the anticipated time frames; |
| • | there is a delay in market acceptance of new, enhanced or acquired product lines or services; |
| • | there are changes in information technology (IT) trends that we do not adequately anticipate or address with our product development efforts; |
| • | we do not timely optimize complementary product lines and services; or |
| • | we fail to adequately integrate, support or enhance acquired product lines or services. |
We might experience significant coding, manufacturing or configuration errors in our cloud, license and hardware offerings. Despite testing prior to the release and throughout the lifecycle of a product or service,
15
Table of Contents
Index to Financial Statements
our cloud, license and hardware offerings sometimes contain coding or manufacturing errors that can impact their function, performance and security, and result in other negative consequences. The detection and correction of any errors in released cloud, license or hardware offerings can be time consuming and costly. Errors in our cloud, license or hardware offerings could affect their ability to properly function or operate with other cloud, license or hardware offerings, could delay the development or release of new products or services or new versions of products or services, could create security vulnerabilities in our products or services, and could adversely affect market acceptance of our products or services. This includes third-party software products or services incorporated into our own. If we experience errors or delays in releasing our cloud, license or hardware offerings or new versions thereof, our sales could be affected and revenues could decline. In addition, we run Oracle’s business operations as well as cloud and other services that we offer to our customers on our products and networks. Therefore, any flaws could affect our ability to conduct our business operations and the operations of our customers. Enterprise customers rely on our cloud, license and hardware offerings and related services to run their businesses and errors in our cloud, license and hardware offerings and related services could expose us to product liability, performance and warranty claims as well as significant harm to our brand and reputation, which could impact our future sales.
If our security measures for our products and services are compromised and as a result, our data, our customers’ data or our IT systems are accessed improperly, made unavailable, or improperly modified, our products and services may be perceived as vulnerable, our brand and reputation could be damaged, the IT services we provide to our customers could be disrupted, and customers may stop using our products and services, all of which could reduce our revenue and earnings, increase our expenses and expose us to legal claims and regulatory actions. We are in the IT business, and our products and services, including our Oracle Cloud Services, store, retrieve, manipulate and manage our customers’ information and data, external data, as well as our own data. We have a reputation for secure and reliable product offerings and related services and we have invested a great deal of time and resources in protecting the integrity and security of our products, services and the internal and external data that we manage. At times, we encounter attempts by third parties (which may include individuals or groups of hackers and sophisticated organizations, such as state-sponsored organizations, nation states and individuals sponsored by them) to identify and exploit product and service vulnerabilities, penetrate or bypass our security measures, and gain unauthorized access to our or our customers’, partners’ and suppliers’ software, hardware and cloud offerings, networks and systems, any of which could lead to the compromise of personal information or the confidential information or data of Oracle or our customers. Computer hackers and others may be able to develop and deploy IT related viruses, worms, and other malicious software programs that could attack our networks, systems, products and services, exploit potential security vulnerabilities of our networks, systems, products and services, create system disruptions and cause shutdowns or denials of service. This is also true for third-party data, products or services incorporated into our own. Data may also be accessed or modified improperly as a result of customer, partner, employee or supplier error or malfeasance and third parties may attempt to fraudulently induce customers, partners, employees or suppliers into disclosing sensitive information such as user names, passwords or other information in order to gain access to our data, our customers’, suppliers’ or partners’ data or the IT systems of Oracle, our customers, suppliers or partners.
Security industry experts and government officials have warned about the risks of hackers and cyber-attacks targeting IT products and businesses. Although this is an industry-wide problem that affects software and hardware companies generally, it affects Oracle in particular because computer hackers tend to focus their efforts on the most prominent IT companies, and they may focus on Oracle because of our reputation for, and marketing efforts associated with, having secure products and services. These risks will increase as we continue to grow our cloud offerings and store and process increasingly large amounts of data, including personal information and our customers’ confidential information and data and other external data, and host or manage parts of our customers’ businesses in cloud-based IT environments, especially in customer sectors involving particularly sensitive data such as health sciences, financial services, retail, hospitality and the government. We also have an active acquisition program and have acquired a number of companies, products, services and technologies over the years. While we make significant efforts to address any IT security issues with respect to our acquired companies, we may still inherit such risks when we integrate these companies within Oracle.
16
Table of Contents
Index to Financial Statements
Because the techniques used to obtain unauthorized access to, or sabotage IT systems change frequently, grow more complex over time, and often are not recognized until launched against a target, we may be unable to anticipate or implement adequate measures to prevent against such techniques. Our internal IT systems continue to evolve and we are often early adapters of new technologies. However, our business policies and internal security controls may not keep pace with these changes as new threats emerge. In addition, we may not discover any security breach and loss of information for a significant period of time after the security breach.
We could suffer significant damage to our brand and reputation if a cyber-attack or other security incident were to allow unauthorized access to or modification of our customers’ or suppliers’ data, other external data, or our own data or our IT systems or if the services we provide to our customers were disrupted, or if our products or services are perceived as having security vulnerabilities. Customers could lose confidence in the security and reliability of our products and services, including our cloud offerings, and perceive them to be not secure. This could lead to fewer customers using our products and services and result in reduced revenue and earnings. The costs we would incur to address and fix these security incidents would increase our expenses. These types of security incidents could also lead to loss or destruction of information, inappropriate use of proprietary and sensitive data, lawsuits, indemnity obligations, regulatory investigations and financial penalties, and claims and increased legal liability, including in some cases contractual costs related to customer notification and fraud monitoring.
As illustrated by the Spectre and Meltdown threats, our products operate in conjunction with and are dependent on products and components across a broad ecosystem. If there is a security vulnerability in one of these components, and if there is a security exploit targeting it, we could face increased costs, liability claims, customer dissatisfaction, reduced revenue, or harm to our reputation or competitive position.
Our business practices with respect to data could give rise to operational interruption, liabilities or reputational harm as a result of governmental regulation, legal requirements or industry standards relating to consumer privacy and data protection. As regulatory focus on privacy issues continues to increase and worldwide laws and regulations concerning the handling of personal information expand and become more complex, potential risks related to data collection and use within our business will intensify. For example, the European Union (EU) and the United States (U.S.) formally entered into a new framework in July 2016 that provides a mechanism for companies to transfer data from EU member states to the U.S. This new framework, called the Privacy Shield, is intended to address shortcomings identified by the Court of Justice of the EU in the previous EU-U.S. Safe Harbor Framework, which the Court of Justice invalidated in October 2015. The Privacy Shield and other data transfer mechanisms are currently subject to challenges in European courts, which may lead to uncertainty about the legal basis for data transfers to the U.S. or interruption of such transfers. In the event any court blocks transfers to or from a particular jurisdiction on the basis that no transfer mechanisms are legally adequate, this could give rise to operational interruption in the performance of services for customers and internal processing of employee information, regulatory liabilities or reputational harm.
In addition, U.S. and foreign governments have enacted or are considering enacting legislation or regulations, or may in the near future interpret existing legislation or regulations, in a manner that could significantly impact our ability, as well as the ability of our customers, partners and data providers, to collect, augment, analyze, use, transfer and share personal and other information that is integral to certain services we provide. This could be true particularly in those jurisdictions where privacy laws or regulators take a broader view of how personal information is defined, therefore subjecting the handling of such data to heightened restrictions that may be obstructive to our operations and the operations of our customers, partners and data providers. This impact may be acute in countries that have passed or are considering passing legislation that requires data to remain localized “in country,” as this imposes financial costs on any service provider that is required to store data in jurisdictions not of its choosing and nonstandard operational processes that are difficult and costly to integrate with global processes.
Regulators globally are also imposing greater monetary fines for privacy violations. For example, in 2016, the EU adopted the General Data Protection Regulation (GDPR), which became effective in May 2018. The law establishes new requirements regarding the handling of personal data. Non-compliance with the GDPR may result in monetary penalties of up to 4% of worldwide revenue. The GDPR and other changes in laws or regulations associated with the enhanced protection of personal and other types of data could greatly increase
17
Table of Contents
Index to Financial Statements
the size of potential fines related to data protection and our cost of providing our products and services could result in changes to our business practices or even prevent us from offering certain services in jurisdictions in which we operate. Although we have implemented contracts, policies and procedures designed to ensure compliance with applicable laws and regulations, there can be no assurance that our employees, contractors, partners, data providers or agents will not violate such laws and regulations or our contracts, policies and procedures. Additionally, public perception and standards related to the privacy of personal information can shift rapidly, in ways that may affect our reputation or influence regulators to enact regulations and laws that may limit our ability to provide certain products.
We make statements about our use and disclosure of personal information through our privacy policy, information provided on our website and press statements. Any failure, or perceived failure, by us to comply with these public statements or with U.S. federal, state, or foreign laws and regulations, including laws and regulations regulating privacy, data security, or consumer protection, public perception, standards, self-regulatory requirements or legal obligations, could result in lost or restricted business, proceedings, actions or fines brought against us or levied by governmental entities or others, or could adversely affect our business and harm our reputation.
Economic, political and market conditions can adversely affect our business, results of operations and financial condition, including our revenue growth and profitability, which in turn could adversely affect our stock price. Our business is influenced by a range of factors that are beyond our control and that we have no comparative advantage in forecasting. These include:
| • | general economic and business conditions; |
| • | overall demand for enterprise cloud, license and hardware products and services; |
| • | governmental budgetary constraints or shifts in government spending priorities; and |
| • | general legal, regulatory and political developments. |
Macroeconomic developments like the developments associated with the United Kingdom’s vote to exit the EU or the occurrence of similar events in other countries that lead to uncertainty or instability in economic, political or market conditions could negatively affect our business, operating results, financial condition and outlook, which, in turn, could adversely affect our stock price. Any general weakening of, and related declining corporate confidence in, the global economy or the curtailment of government or corporate spending could cause current or potential customers to reduce or eliminate their IT budgets and spending, which could cause customers to delay, decrease or cancel purchases of our products and services or cause customers not to pay us or to delay paying us for previously purchased products and services.
In addition, international, regional or domestic political unrest and the related potential impact on global stability, terrorist attacks and the potential for other hostilities in various parts of the world, potential public health crises and natural disasters continue to contribute to a climate of economic and political uncertainty that could adversely affect our results of operations and financial condition, including our revenue growth and profitability. These factors generally have the strongest effect on our sales of cloud license and on-premise license, hardware and related services and, to a lesser extent, also may affect our renewal rates for license support and our subscription-based cloud offerings.
If we are unable to compete effectively, the results of operations and prospects for our business could be harmed. We face intense competition in all aspects of our business. The nature of the IT industry creates a competitive landscape that is constantly evolving as firms emerge, expand or are acquired, as technology evolves and as delivery models change. Many vendors spend amounts in excess of what Oracle spends to develop and market applications, platform and infrastructure technologies including databases, middleware products, application development tools, business applications, collaboration products and business intelligence products, among others, which compete with Oracle applications, platform and infrastructure offerings. Use of our competitors’ technologies may influence a customer’s purchasing decision or create an environment that makes it less efficient to utilize Oracle products and services. Our competition may also adopt business practices that provide customers access to competing products and services at a risk profile that we may not generally find acceptable, which may convince customers to purchase competitor products and services. We could lose
18
Table of Contents
Index to Financial Statements
customers if our competitors introduce new competitive products, add new functionality, acquire competitive products, reduce prices, better execute on their sales and marketing strategies, offer more flexible business practices or form strategic alliances with other companies. We may also face increasing competition from open source software initiatives in which competitors may provide software and intellectual property for free. Existing or new competitors could gain sales opportunities or customers at our expense.
Our hardware business competes with, among others, (1) systems manufacturers and resellers of systems based on our own microprocessors and operating systems and those of our competitors, (2) microprocessor/chip manufacturers, (3) providers of storage products, (4) certain industry-specific hardware manufacturers including those serving communications, hospitality and retail industries and (5) certain cloud providers that build their own IT infrastructures. Our hardware business causes us to compete with certain companies that historically have been partners. Some of these competitors may have more experience than we do in managing a hardware business. Certain of these competitors also compete very aggressively on price. A loss in our competitive position could result in lower revenues or profitability, which could adversely impact our ability to realize the revenue and profitability forecasts for our hardware business.
We may need to change our pricing models to compete successfully. The intense competition we face in the sales of our products and services and general economic and business conditions can put pressure on us to change our prices. If our competitors offer deep discounts on certain products or services or develop products that the marketplace considers more valuable, we may need to lower prices or offer other favorable terms in order to compete successfully. Any such changes may reduce margins and could adversely affect operating results. Additionally, the increasing prevalence of cloud delivery models offered by us and our competitors may unfavorably impact the pricing of our other cloud and license, hardware and services offerings, in particular our IaaS offerings, which could reduce our revenues and profitability. Our license support fees and hardware support fees are generally priced as a percentage of our net cloud license and on-premise license fees and net new hardware products fees, respectively. Our competitors may offer lower pricing on their support offerings, which could put pressure on us to further discount our offerings or support pricing.
We introduced Oracle Bring Your Own License (BYOL) to PaaS and Universal Credit Pricing in fiscal 2018 to simplify the way customers purchase and consume our cloud services. Oracle BYOL enables customers to maintain their existing software licenses for Oracle PaaS while expanding their platform technology footprint at a discounted price. Oracle Universal Credit Pricing provides a flexible model for customers to access Oracle PaaS and IaaS services on demand via a single contract. These changes and any future changes to our prices and pricing policies could cause our revenues to decline or be delayed as our sales force implements and our customers adjust to the new pricing policies. Some of our competitors may bundle products for promotional purposes or as a long-term pricing strategy, commit to large customer deployments at prices that are unprofitable, or provide guarantees of prices and product implementations. These practices could, over time, significantly constrain the prices that we can charge for certain of our products. If we do not adapt our pricing models to reflect changes in customer use of our products or changes in customer demand, our revenues could decrease. The increase in open source software distribution may also cause us to change our pricing models.
Our international sales and operations subject us to additional risks that can adversely affect our operating results. We derive a substantial portion of our revenues from, and have significant operations, outside of the U.S. Our international operations include cloud operations, cloud, software and hardware development, manufacturing, assembly, sales, customer support, consulting and other services and shared administrative service centers.
Compliance with international and U.S. laws and regulations that apply to our international operations increases our cost of doing business in foreign jurisdictions. These laws and regulations include U.S. laws and local laws which include data privacy requirements, labor relations laws, tax laws, foreign currency-related regulations, anti-competition regulations, prohibitions on payments to governmental officials, market access, import, export and general trade regulations, including but not limited to economic sanctions and embargos. Violations of these laws and regulations could result in fines and penalties, criminal sanctions against us, our officers or our employees, and prohibitions on the conduct of our business, including the loss of trade privileges. Any such violations could result in prohibitions on our ability to offer our products and services in one or more countries, could delay or prevent potential acquisitions and could also materially damage our
19
Table of Contents
Index to Financial Statements
reputation, our brand, our international expansion efforts, our ability to attract and retain employees, our business and our operating results. Compliance with these laws requires a significant amount of management attention and effort, which may divert management’s attention from running our business operations and could harm our ability to grow our business, or may increase our expenses as we engage specialized or other additional resources to assist us with our compliance efforts. Our success depends, in part, on our ability to anticipate these risks and manage these difficulties. We monitor our operations and investigate allegations of improprieties relating to transactions and the way in which such transactions are recorded. Where circumstances warrant, we provide information and report our findings to government authorities, but no assurance can be given that action will not be taken by such authorities.
We are also subject to a variety of other risks and challenges in managing an organization operating globally, including those related to:
| • | general economic conditions in each country or region; |
| • | fluctuations in currency exchange rates and related impacts to customer demand and our operating results; |
| • | difficulties in transferring funds from or converting currencies in certain countries that could lead to a devaluation of our net assets, in particular our cash assets, in that country’s currency; |
| • | regulatory changes, including government austerity measures in certain countries that we may not be able to sufficiently plan for or avoid that may unexpectedly impair bank deposits or other cash assets that we hold in these countries or that impose additional taxes that we may be required to pay in these countries; |
| • | political unrest, terrorism and the potential for other hostilities; |
| • | common local business behaviors that are in direct conflict with our business ethics, practices and conduct policies; |
| • | natural disasters; |
| • | the effects of climate change (such as sea level rise, drought, flooding, wildfires and increased storm sensitivity); |
| • | longer payment cycles and difficulties in collecting accounts receivable; |
| • | overlapping tax regimes; |
| • | public health risks, social risks and supporting infrastructure stability risks, particularly in areas in which we have significant operations; and |
| • | reduced protection for intellectual property rights in some countries. |
The variety of risks and challenges listed above could also disrupt or otherwise negatively impact the supply chain operations for our hardware business and the sales of our products and services in affected countries or regions.
As the majority shareholder of Oracle Financial Services Software Limited, a publicly traded company in India, and Oracle Corporation Japan, a publicly traded company in Japan, we are faced with several additional risks, including being subject to local securities regulations and being unable to exert full control that we would otherwise have if these entities were wholly-owned subsidiaries.
Acquisitions present many risks and we may not realize the financial and strategic goals that were contemplated at the time of a transaction. We continue to invest billions of dollars to acquire companies, products, services and technologies. We have a selective and active acquisition program and we expect to continue to make acquisitions in the future because acquisitions are an important element of our overall corporate strategy. Risks we may face in connection with our acquisition program include:
| • | our ongoing business may be disrupted and our management’s attention may be diverted by acquisition, transition or integration activities; |
20
Table of Contents
Index to Financial Statements
| • | we may have difficulties (1) managing an acquired company’s technologies or lines of business; (2) entering new markets where we have no or limited direct prior experience or where competitors may have stronger market positions; or (3) retaining key personnel from the acquired companies; |
| • | an acquisition may not further our business strategy as we expected, we may not integrate an acquired company or technology as successfully as we expected, we may impose our business practices or alter go-to-market strategies that adversely impact the acquired business or we may overpay for, or otherwise not realize the expected return on, our investments, which could adversely affect our business or operating results and potentially cause impairment to assets that we recorded as a part of an acquisition including intangible assets and goodwill; |
| • | our operating results or financial condition may be adversely impacted by (1) claims or liabilities that we assume from an acquired company or technology or that are otherwise related to an acquisition, including, among others, claims from government agencies, terminated employees, current or former customers, former stockholders or other third parties; (2) pre-existing contractual relationships of an acquired company that we would not have otherwise entered into, the termination or modification of which may be costly or disruptive to our business; (3) unfavorable revenue recognition or other accounting treatment as a result of an acquired company’s practices; and (4) intellectual property claims or disputes; |
| • | we may fail to identify or assess the magnitude of certain liabilities, shortcomings or other circumstances prior to acquiring a company or technology, which could result in unexpected litigation or regulatory exposure, unfavorable accounting treatment, unexpected increases in taxes due, a loss of anticipated tax benefits or other adverse effects on our business, operating results or financial condition; |
| • | we may not realize the anticipated increase in our revenues from an acquisition for a number of reasons, including if a larger than predicted number of customers decline to renew cloud-based subscription contracts or software or hardware support contracts, if we are unable to sell the acquired products or service offerings to our customer base, if acquired customers do not elect to purchase our technologies due to differing business practices or if contract models of an acquired company do not allow us to recognize revenues on a timely basis; |
| • | we may have difficulty incorporating acquired technologies, products, services and their related supply chain operations with our existing lines of business and supply chain infrastructure and maintaining uniform standards, architecture, controls, procedures and policies; |
| • | we may have multiple product lines or services offerings as a result of our acquisitions that are offered, priced and supported differently, which could cause customer confusion and delays; |
| • | we may have higher than anticipated costs in continuing support and development of acquired products or services, in general and administrative functions that support new business models, or in compliance with associated regulations that are more complicated than we had anticipated; |
| • | we may be unable to obtain timely approvals from, or may otherwise have certain limitations, restrictions, penalties or other sanctions imposed on us by worker councils or similar bodies under applicable employment laws as a result of an acquisition, which could adversely affect our integration plans in certain jurisdictions and potentially increase our integration and restructuring expenses; |
| • | we may be unable to obtain required approvals from governmental authorities under competition and antitrust laws on a timely basis, if at all, which could, among other things, delay or prevent us from completing a transaction, adversely affect our integration plans in certain jurisdictions, restrict our ability to realize the expected financial or strategic goals of an acquisition, or have other adverse effects on our current business and operations; |
| • | our use of cash to pay for acquisitions may limit other potential uses of our cash, including stock repurchases, dividend payments and retirement of outstanding indebtedness; |
21
Table of Contents
Index to Financial Statements
| • | we may significantly increase our interest expense, leverage and debt service requirements if we incur additional debt to pay for an acquisition and we may have to delay or not proceed with a substantial acquisition if we cannot obtain the necessary funding to complete the acquisition in a timely manner or on favorable terms; |
| • | to the extent that we issue a significant amount of equity securities in connection with future acquisitions, existing stockholders may be diluted and earnings per share may decrease; and |
| • | we may experience additional or unexpected changes in how we are required to account for our acquisitions pursuant to U.S. generally accepted accounting principles, including arrangements that we assume from an acquisition. |
The occurrence of any of these risks could have a material adverse effect on our business, results of operations, financial condition or cash flows, particularly in the case of a larger acquisition or several concurrent acquisitions.
Any failure to offer high-quality technical support services may adversely affect our relationships with our customers and our financial results. Our customers depend on our support organization to resolve technical issues relating to our applications, platform and infrastructure offerings. We may be unable to respond quickly enough to accommodate short-term increases in customer demand for support services. Increased customer demand for these services, without corresponding revenues, could increase costs and adversely affect our operating results. Any failure to maintain high-quality technical support, or a market perception that we do not maintain high-quality support, could adversely affect our reputation, our ability to sell our applications to existing and prospective customers, and our business, operating results, and financial position.
We may fail to achieve our financial forecasts due to inaccurate sales forecasts or other factors. Our revenues, particularly certain of our cloud license and on-premise license revenues and hardware revenues, are difficult to forecast. As a result, our quarterly operating results can fluctuate substantially.
For our Oracle Cloud Services, we may use conversion or renewal rates in our forecasts that differ materially from our actual conversion or renewal rates because this business is continuing to evolve and such rates may be unpredictable. For our license business, we use a “pipeline” system, a common industry practice, to forecast sales and trends in that business. Our sales personnel monitor the status of all proposals and estimate when a customer will make a purchase decision and the dollar amount of the sale. These estimates are aggregated periodically to generate a sales pipeline. Our pipeline estimates can prove to be unreliable both in a particular quarter and over a longer period of time, in part because the conversion rate or closure rate of the pipeline into contracts can be very difficult to estimate.
A reduction in the conversion rates, renewal rates, or in the pipeline itself, could cause us to plan or budget incorrectly and adversely affect our business or results of operations. In particular, a slowdown in IT spending or economic conditions generally can unexpectedly reduce the conversion rates and renewal rates in particular periods as purchasing decisions are delayed, reduced in amount or cancelled. The conversion rates can also be affected by the tendency of some of our customers to wait until the end of a fiscal period in the hope of obtaining more favorable terms, which can also impede our ability to negotiate, execute and deliver upon these contracts in a timely manner. In addition, for newly acquired companies, we have limited ability to predict how their pipelines will convert into sales or revenues for a number of quarters following the acquisition. Conversion rates and renewal rates post-acquisition may be quite different from the acquired companies’ historical conversion rates. Differences in conversion rates and renewal rates can also be affected by changes in business practices that we implement in our newly acquired companies. These changes may negatively affect customer behavior.
A substantial portion of our cloud license and on-premise license, and hardware contracts is completed in the latter part of a quarter and a significant percentage of these are larger orders. Because a significant portion of our cost structure is largely fixed in the short term, sales and revenue shortfalls tend to have a disproportionately negative impact on our profitability. The number of large cloud license and on-premise license transactions and, to a lesser extent, hardware products transactions increases the risk of fluctuations in our quarterly results because a delay in even a small number of these transactions could cause our quarterly sales, revenues and profitability to fall significantly short of our predictions.
22
Table of Contents
Index to Financial Statements
We may experience foreign currency gains and losses. Changes in currency exchange rates can adversely affect customer demand and our revenue and profitability. We conduct a significant number of transactions and hold cash in currencies other than the U.S. Dollar. Changes in the values of major foreign currencies, particularly the Euro, Japanese Yen and British Pound, relative to the U.S. Dollar can significantly affect our total assets, revenues, operating results and cash flows, which are reported in U.S. Dollars. In particular, the economic uncertainties relating to European sovereign and other debt obligations may cause the value of the Euro to fluctuate relative to the U.S. Dollar. Fluctuations in foreign currency rates, including the strengthening of the U.S. Dollar against the Euro and most other major international currencies, adversely affects our revenue growth in terms of the amounts that we report in U.S. Dollars after converting our foreign currency results into U.S. Dollars and in terms of actual demand for our products and services as certain of these products may become relatively more expensive for foreign currency-based enterprises to purchase. In addition, currency variations can adversely affect margins on sales of our products in countries outside of the U.S. Generally, our revenues and operating results are adversely affected when the dollar strengthens relative to other currencies and are positively affected when the dollar weakens. In addition, our reported assets generally are adversely affected when the dollar strengthens relative to other currencies as a portion of our consolidated cash and bank deposits, among other assets, are held in foreign currencies.
In addition, we incur foreign currency transaction gains and losses, primarily related to sublicense fees and other intercompany agreements among us and our subsidiaries that we expect to cash settle in the near term, which are charged against earnings in the period incurred. We have a program which primarily utilizes foreign currency forward contracts designed to offset the risks associated with certain foreign currency exposures. We may suspend the program from time to time. As a part of this program, we enter into foreign currency forward contracts so that increases or decreases in our foreign currency exposures are offset at least in part by gains or losses on the foreign currency forward contracts in an effort to mitigate the risks and volatility associated with our foreign currency transaction gains or losses. A large portion of our consolidated operations are international, and we expect that we will continue to realize gains or losses with respect to our foreign currency exposures, net of gains or losses from our foreign currency forward contracts. For example, we will experience foreign currency gains and losses in certain instances if it is not possible or cost-effective to hedge our foreign currency exposures, if our hedging efforts are ineffective, or should we suspend our foreign currency forward contract program. Our ultimate realized loss or gain with respect to currency fluctuations will generally depend on the size and type of cross-currency exposures that we enter into, the currency exchange rates associated with these exposures and changes in those rates, whether we have entered into foreign currency forward contracts to offset these exposures and other factors. All of these factors could materially impact our results of operations, financial position and cash flows.
We have incurred foreign currency losses associated with the devaluation of currencies in certain highly inflationary economies relative to the U.S. Dollar. We could incur future losses in emerging market countries where we do business should their currencies become designated as highly inflationary.
Our hardware revenues and profitability have declined and could continue to decline. Our hardware business may adversely affect our overall profitability. We may not achieve our estimated revenue, profit or other financial projections with respect to our hardware business in a timely manner or at all due to a number of factors, including:
| • | our changes in hardware strategies, offerings and technologies including the development marketing and sale of our own Oracle Cloud Services, which could adversely affect demand for our hardware products; |
| • | our hardware business has higher expenses as a percentage of revenues, and thus has been less profitable, than our cloud and license business; |
| • | our focus on our more profitable Oracle Engineered Systems, such as our Oracle Exadata Database Machine, and the de-emphasis of our lower profit margin commodity hardware products, which could adversely affect our hardware revenues because the lower profit products have historically constituted a larger portion of our hardware revenues; |
23
Table of Contents
Index to Financial Statements
| • | changes in strategies for the development and introduction of new versions or next generations of our hardware products, including the pace at which we offer new versions or next generations of our hardware products, and the related impacts from customers that may defer or delay purchases of existing hardware products and wait for these new releases, all of which could adversely affect our hardware revenues; |
| • | a greater risk of material charges that could adversely affect our operating results, such as potential write-downs and impairments of our inventories; higher warranty expenses than what we experience in our cloud and license and services businesses; and amortization and potential impairment of intangible assets associated with our hardware business; |
| • | the close connection between hardware products (which have a finite life) and customer demand for related hardware support in which hardware products that approach the end of their useful lives are less likely to have hardware support contracts renewed by customers; and |
| • | we may acquire hardware companies that are strategically important to us but (1) operate in hardware businesses with historically lower operating margins than our own; (2) have different legacy business practices and go-to-market strategies than our own that we may alter as a part of our integration efforts, which may significantly impact our estimated revenues and profits from the acquired company; (3) leverage different platforms or competing technologies that we may encounter difficulties in integrating; or (4) utilize unique manufacturing processes that affect our ability to scale these acquired products within our own manufacturing operations. |
Our hardware offerings are complex products, and if we cannot successfully manage this complexity, the results of our hardware business will suffer. Designing, developing, manufacturing and introducing new hardware products are complicated processes. The development process for our hardware products is uncertain and requires a high level of innovation. After the development phase, we must be able to forecast customer demand and manufacture new hardware products in sufficient volumes to meet this demand and do so in a cost-effective manner. Our “build-to-order” manufacturing model, in which our hardware products generally are not built until after customers place orders, may from time to time experience delays in delivering our hardware products to customers in a timely manner. These delays could cause our customers to purchase hardware products and services from our competitors. We must also manage new hardware product introductions and transitions to minimize the impact of customer delayed purchases of existing hardware products in anticipation of new hardware product releases. It is also possible that we could experience design or manufacturing flaws, which could delay or prevent the production of the components for which we have previously committed to pay or need to fulfill orders from customers and could also prevent the production of our hardware products or cause our hardware products to be returned, recalled or rejected resulting in lost revenues, increases in warranty costs or costs related to remediation efforts, damage to our reputation, penalties and litigation.
We depend on suppliers to design, develop, manufacture and deliver on a timely basis the necessary technologies and components for our hardware products, and there are some technologies and components that can only be purchased from a single vendor due to price, quality, technology, availability or other business constraints. As a result, our supply chain operations could be disrupted or negatively impacted by industry consolidation and component constraints or shortages, natural disasters, political unrest, port stoppages or other transportation disruptions or slowdowns, or other factors affecting the countries or regions where these single source component vendors are located or where the products are being shipped. We may be unable to purchase these items from the respective single vendors on acceptable terms or may experience significant shortages, delays or quality issues in the delivery of necessary technologies, parts or components from a particular vendor. If we had to find a new supplier for these technologies, parts and components, hardware product shipments could be delayed, which would adversely affect our hardware revenues. We could also experience fluctuations in component prices, which, if unanticipated, could negatively affect our hardware business cost structure. Additionally, we could experience changes in shipping and logistics of our hardware products, which could result in fluctuations in prices and negatively impact our hardware margins. These factors may make it difficult for us to plan and procure appropriate component inventory levels in a timely fashion to meet customer demand for our hardware products. Therefore, we may experience component inventory
24
Table of Contents
Index to Financial Statements
shortages, which may result in production delays or customers choosing to purchase fewer hardware products from us or hardware products from our competitors. We negotiate supply commitments with vendors early in the manufacturing process to ensure we have sufficient technologies and components for our hardware products to meet anticipated customer demand. We must also manage our levels of older component inventories used in our hardware products to minimize inventory write-offs or write-downs. If we have excess inventory, it may be necessary to write-down the inventory, which would adversely affect our operating results. If one or more of the risks described above occurs, our hardware business and related operating results could be materially and adversely affected.
We are susceptible to third-party manufacturing and logistics delays, which could result in the loss of sales and customers. We outsource the design, manufacturing, assembly and delivery of certain of our hardware products to a variety of companies, many of which are located outside the U.S. Our reliance on these third parties reduces our control over the manufacturing and delivery process, exposing us to risks, including reduced control over quality assurance, product costs, product supply and delivery delays as well as the political and economic uncertainties and natural disasters of the international locations where certain of these third-party manufacturers have facilities and operations. Some countries may raise national security concerns or impose market access restrictions based on location of manufacturing or sourcing. Any manufacturing disruption or logistics delays by these third parties could impair our ability to fulfill orders for these hardware products for extended periods of time. If we are unable to manage our relationships with these third parties effectively, or if these third parties experience delays, disruptions, capacity constraints, regulatory issues or quality control problems in their operations, or fail to meet our future requirements for timely delivery, our ability to ship and deliver certain of our hardware products to our customers could be impaired and our hardware business could be harmed.
We endeavor to continue simplifying our supply chain processes by reducing the number of third-party manufacturing partners and the number of locations where these third-party manufacturers build our hardware products. We therefore have become more dependent on a fewer number of these manufacturing partners and locations. If these partners experience production problems or delays or cannot meet our demand for products, we may not be able to find alternate manufacturing sources in a timely or cost-effective manner, if at all. If we are required to change third-party manufacturers, our ability to meet our scheduled hardware products deliveries to our customers could be adversely affected, which could cause the loss of sales and existing or potential customers, delayed revenue recognition or an increase in our hardware products expenses, all of which could adversely affect the margins of our hardware business.
These challenges and risks also exist when we acquire companies with hardware products and related supply chain operations. In some cases, we may be dependent, at least initially, on these acquired companies’ supply chain operations that we are less familiar with and thus we may be slower to adjust or react to these challenges and risks.
Our cloud and license, and hardware indirect sales channel could affect our future operating results. Our cloud and license, and hardware indirect channel network is comprised primarily of resellers, system integrators/implementers, consultants, education providers, internet service providers, network integrators and independent software vendors. Our relationships with these channel participants are important elements of our cloud, software and hardware marketing and sales efforts. Our financial results could be adversely affected if our contracts with channel participants were terminated, if our relationships with channel participants were to deteriorate, if any of our competitors enter into strategic relationships with or acquire a significant channel participant, if the financial condition or operations of our channel participants were to weaken or if the level of demand for our channel participants’ products and services were to decrease. There can be no assurance that we will be successful in maintaining, expanding or developing our relationships with channel participants. If we are not successful, we may lose sales opportunities, customers and revenues.
We may not be able to protect our intellectual property rights. We rely on copyright, trademark, patent and trade secret laws, confidentiality procedures, controls and contractual commitments to protect our intellectual property rights. Despite our efforts, these protections may be limited. Unauthorized third parties may try to copy or reverse engineer portions of our products or otherwise obtain and use our intellectual property. Any
25
Table of Contents
Index to Financial Statements
patents owned by us may be invalidated, circumvented or challenged. Any of our pending or future patent applications, whether or not being currently challenged, may not be issued with the scope of the claims we seek, if at all. In addition, the laws of some countries do not provide the same level of protection of our intellectual property rights as do the laws and courts of the U.S. If we cannot protect our intellectual property rights against unauthorized copying or use, or other misappropriation, we may not remain competitive.
Third parties have claimed, and in the future may claim, infringement or misuse of intellectual property rights and/or breach of license agreement provisions. We periodically receive notices from, or have lawsuits filed against us by, others claiming infringement or other misuse of their intellectual property rights and/or breach of our agreements with them. These third parties include entities that do not have the capabilities to design, manufacture, or distribute products or services or that acquire intellectual property like patents for the sole purpose of monetizing their acquired intellectual property through asserting claims of infringement and misuse. We expect to continue to receive such claims as:
| • | we continue to acquire companies and expand into new businesses; |
| • | the number of products and competitors in our industry segments grows; |
| • | the use and support of third-party code (including open source code) becomes more prevalent in the industry; |
| • | the volume of issued patents continues to increase; and |
| • | non-practicing entities continue to assert intellectual property infringement in our industry segments. |
Responding to any such claim, regardless of its validity, could:
| • | be time consuming, costly and result in litigation; |
| • | divert management’s time and attention from developing our business; |
| • | require us to pay monetary damages or enter into royalty and licensing agreements that we would not normally find acceptable; |
| • | require us to stop selling or to redesign certain of our products; |
| • | require us to release source code to third parties, possibly under open source license terms; |
| • | require us to satisfy indemnification obligations to our customers; or |
| • | otherwise adversely affect our business, results of operations, financial condition or cash flows. |
Our periodic workforce restructurings and reorganizations can be disruptive. We have in the past restructured or made other adjustments to our workforce, including our hardware employees and direct sales force, in response to management changes, product changes, performance issues, change in strategies, acquisitions and other internal and external considerations. In the past, these types of restructurings have resulted in increased restructuring costs, increased sales and marketing costs and temporary reduced productivity while the employees adjusted to their new roles and responsibilities. In addition, we may not achieve or sustain the expected growth or cost savings benefits of these restructurings, or may not do so within the expected timeframe. These effects could recur in connection with future acquisitions and other restructurings and our revenues and other results of operations could be negatively affected.
We may lose key employees or may be unable to hire enough qualified employees. We rely on hiring qualified employees and the continued service of our senior management, including our Chairman of the Board of Directors, Chief Technology Officer and founder, our Chief Executive Officers, other members of our executive team and other key employees. In the technology industry, there is substantial and continuous competition for highly skilled business, product development, technical and other personnel. We may also experience increased compensation costs that are not offset by either improved productivity or higher sales. We may not be successful in recruiting new personnel and in retaining and motivating existing personnel. With rare exceptions, we do not have long-term employment or non-competition agreements with our employees. Members of our senior management team have left Oracle over the years for a variety of reasons, and we cannot guarantee that there will not be additional departures, which may be disruptive to our operations.
26
Table of Contents
Index to Financial Statements
We continually focus on improving our cost structure by hiring personnel in countries where advanced technical expertise and other expertise are available at lower costs. When we make adjustments to our workforce, we may incur expenses associated with workforce reductions that delay the benefit of a more efficient workforce structure. We may also experience increased competition for employees in these countries as the trend toward globalization continues, which may affect our employee retention efforts and increase our expenses in an effort to offer a competitive compensation program. In addition, changes to immigration and labor law policies may adversely impact our access to technical and professional talent.
Our general compensation program includes restricted stock units, performance equity and stock options, which are important tools in attracting and retaining employees in our industry. If our stock price performs poorly, it may adversely affect our ability to retain or attract employees. We continually evaluate our compensation practices and consider changes from time to time, such as reducing the number of employees granted equity awards or the number of equity awards granted per employee and granting alternative forms of stock-based compensation, which may have an impact on our ability to retain employees and the amount of stock-based compensation expense that we record. Any changes in our compensation practices or those of our competitors could affect our ability to retain and motivate existing personnel and recruit new personnel.
Our sales to government clients expose us to business volatility and risks, including government budgeting cycles and appropriations, procurement regulations, governmental policy shifts, early termination of contracts, audits, investigations, sanctions and penalties. We derive revenues from contracts with the U.S. government, state and local governments, and foreign governments and are subject to procurement laws and regulations relating to the award, administration and performance of those contracts.
Governmental entities are variously pursuing policies that affect our ability to sell our products and services. Changes in government procurement policy, priorities, technology initiatives, and/or contract award criteria may negatively impact our potential for growth in the government sector.
We are also subject to early termination of our contracts. Many governmental entities have the right to terminate contracts at any time, without cause. For example, the U.S. federal government may terminate any of our government contracts and subcontracts at its convenience, or for default based on our performance.
U.S. federal contracts are subject to the congressional approval of appropriations to fund the expenditures under these contracts. Similarly, our contracts with U.S. state and local governments, foreign governments and their agencies are generally subject to government funding authorizations. Contracts may be terminated based upon a lack of appropriated funds.
There is increased pressure on governments and their agencies, both domestically and internationally, to reduce spending as governments continue to face significant deficit reduction pressures. This may adversely impact spending on government programs.
Government contracts laws and regulations impose certain risks, and contracts are generally subject to audits and investigations. If violations of law are found, they could result in civil and criminal penalties and administrative sanctions, including termination of contracts, refund of a portion of fees received, forfeiture of profits, suspension of payments, fines and suspensions or debarment from future government business.
We may not receive significant revenues from our current research and development efforts for several years, if at all. Developing our cloud and license, and hardware offerings is expensive and the investment in the development of these offerings often involves a long return on investment cycle. An important element of our corporate strategy is to continue to dedicate a significant amount of resources to research and development and related product and service opportunities both through internal investments and the acquisition of intellectual property from companies that we have acquired. Accelerated product and service introductions and short life cycles require high levels of expenditures for research and development that could adversely affect our operating results if not offset by revenue increases. We believe that we must continue to dedicate a significant amount of resources to our research and development efforts to maintain our competitive position. However, we do not expect to receive significant revenues from these investments for several years, if at all.
27
Table of Contents
Index to Financial Statements
Business disruptions could adversely affect our operating results. A significant portion of our critical business operations are concentrated in a few geographic areas, some of which include emerging market international locations that may be less stable relative to running such business operations solely within the U.S. We are a highly automated business and a disruption or failure of our systems and processes could cause delays in completing sales, providing services, including some of our cloud offerings, and enabling a seamless customer experience with respect to our customer facing back office processes. A major earthquake or fire, political, social or other disruption to infrastructure that supports or operations or other catastrophic event or the effects of climate change (such as increased storm severity, drought and pandemics) that results in the destruction or disruption of any of our critical business or IT systems could severely affect our ability to conduct normal business operations and, as a result, our future operating results could be materially and adversely affected.
Adverse litigation results could affect our business. We are subject to various legal proceedings. Litigation can be lengthy, expensive and disruptive to our operations, and can divert our management’s attention away from running our core business. The results of our litigation also cannot be predicted with certainty. An adverse decision could result in monetary damages or injunctive relief that could affect our business, operating results or financial condition. Additional information regarding certain of the lawsuits we are involved in is discussed under Note 17 of Notes to Consolidated Financial Statements included elsewhere in this Annual Report.
We may have exposure to additional tax liabilities. As a multinational corporation, we are subject to income taxes as well as non-income based taxes, in both the U.S. and various foreign jurisdictions. Significant uncertainties exist with respect to the amount of our tax liabilities, including those arising from potential changes in laws in the countries in which we do business and the possibility of adverse determinations with respect to the application of existing laws. Many judgments are required in determining our worldwide provision for income taxes and other tax liabilities, and we are regularly under audit by tax authorities, which often do not agree with positions taken by us on our tax returns. Any unfavorable resolution of these uncertainties may have a significant adverse impact on our tax rate.
Increasingly, countries around the world are actively considering or have enacted changes in relevant tax, accounting and other laws, regulations and interpretations. In particular, the recently enacted U.S. Tax Cuts and Jobs Act of 2017 (the Tax Act) significantly changed how corporations are taxed in the United States, which has had and we expect will continue to have a meaningful impact on our provision for income taxes. Due to the complexity involved in applying the provisions of the Tax Act, we made reasonable estimates of the effects and recorded provisional amounts in our financial statements for the year ended May 31, 2018. The U.S. Treasury Department and the Internal Revenue Service (IRS), and other standards-setting bodies may issue guidance on how the provisions of the Tax Act will be applied that is different from our interpretation. The Tax Act requires complex computations not previously required or produced, and significant judgments and assumptions in the interpretation of the law were made in producing our provisional estimates. As we complete our analyses, and interpret any additional guidance, we may adjust the provisional amounts we have recorded, and those adjustments may materially impact our provision for income taxes in the period in which the adjustments are made. We also anticipate that uncertainty in the application of the Tax Act to our ongoing operations as well as possible adverse future law changes attributable to changes in the U.S. political environment could have an adverse impact on our future tax rate. Other countries also continue to consider enacting new laws, including changes in withholding tax regimes and the imposition of taxes targeted at certain technology businesses (some of which may be made in response to the Tax Act), that could adversely affect us.
As a part of our income tax structure, there are many intercompany transactions and calculations made in the ordinary course of business where the ultimate tax determination is uncertain. Our intercompany transfer pricing has been and is currently being reviewed by the IRS and by foreign tax jurisdictions and will likely be subject to additional audits in the future. Although we have negotiated a number of agreements with certain taxing jurisdictions, these agreements do not cover substantial elements of our transfer pricing. In recent periods, transfer pricing audits in many foreign jurisdictions have become increasingly contentious. Similarly, certain jurisdictions are increasingly raising concerns about certain withholding tax matters under current law. In addition, our provision for income taxes could be adversely affected by shifts of earnings from jurisdictions or regimes that have relatively lower statutory tax rates to those in which the rates are relatively higher.
28
Table of Contents
Index to Financial Statements
We are also subject to non-income based taxes, such as payroll, sales, use, value-added, net worth, property and goods and services taxes, in both the United States and various foreign jurisdictions that have uncertain applicability to the businesses in which we are engaged. Although we believe that our income and non-income based tax estimates are reasonable, there is no assurance that the final determination of tax audits or tax disputes will not be different from what is reflected in our historical income tax provisions and accruals.
Charges to earnings resulting from acquisitions may adversely affect our operating results. Under business combination accounting standards pursuant to Accounting Standards Codification (ASC) 805, Business Combinations, we recognize the identifiable assets acquired, the liabilities assumed and any non-controlling interests in acquired companies generally at their acquisition date fair values and, in each case, separately from goodwill. Goodwill as of the acquisition date is measured as the excess amount of consideration transferred, which is also generally measured at fair value, and the net of the acquisition date amounts of the identifiable assets acquired and the liabilities assumed. Our estimates of fair value are based upon assumptions believed to be reasonable but which are inherently uncertain. After we complete an acquisition, the following factors could result in material charges and adversely affect our operating results and may adversely affect our cash flows:
| • | costs incurred to combine the operations of companies we acquire, such as transitional employee expenses and employee retention, redeployment or relocation expenses; |
| • | impairment of goodwill or impairment of intangible assets; |
| • | amortization of intangible assets acquired; |
| • | a reduction in the useful lives of intangible assets acquired; |
| • | identification of, or changes to, assumed contingent liabilities, both income tax and non-income tax related, after our final determination of the amounts for these contingencies or the conclusion of the measurement period (generally up to one year from the acquisition date), whichever comes first; |
| • | charges to our operating results to maintain certain duplicative pre-merger activities for an extended period of time or to maintain these activities for a period of time that is longer than we had anticipated, charges to eliminate certain duplicative pre-merger activities, and charges to restructure our operations or to reduce our cost structure; |
| • | charges to our operating results due to expenses incurred to effect the acquisition; and |
| • | charges to our operating results due to the expensing of certain stock awards assumed in an acquisition. |
Substantially all of these costs will be accounted for as expenses that will adversely impact our operating results for the periods in which those costs are incurred. Charges to our operating results in any given period could differ substantially from other periods based on the timing and size of our future acquisitions and the extent of integration activities. A more detailed discussion of our accounting for business combinations and other items is presented in the “Critical Accounting Policies and Estimates” section of Management’s Discussion and Analysis of Financial Condition and Results of Operations (Item 7) included elsewhere in this Annual Report.
There are risks associated with our outstanding and future indebtedness. As of May 31, 2018, we had an aggregate of $60.9 billion of outstanding indebtedness that will mature between calendar year 2018 and calendar year 2055 and we may incur additional indebtedness in the future. Our ability to pay interest and repay the principal for our indebtedness is dependent upon our ability to manage our business operations, generate sufficient cash flows to service such debt and the other factors discussed in this section. There can be no assurance that we will be able to manage any of these risks successfully.
We may also need to refinance a portion of our outstanding debt as it matures. There is a risk that we may not be able to refinance existing debt or that the terms of any refinancing may not be as favorable as the terms of our existing debt. Furthermore, if prevailing interest rates or other factors at the time of refinancing result in higher interest rates upon refinancing, then the interest expense relating to that refinanced indebtedness would increase. Should we incur future increases in interest expense, our ability to utilize certain of our foreign tax credits to reduce our U.S. federal income tax could be limited, which could unfavorably affect our provision for income taxes and effective tax rate. In addition, changes by any rating agency to our outlook or credit rating
29
Table of Contents
Index to Financial Statements
could negatively affect the value of both our debt and equity securities and increase the interest amounts we pay on certain outstanding or future debt. These risks could adversely affect our financial condition and results of operations.
Environmental and other related laws and regulations subject us to a number of risks and could result in significant liabilities and costs. Some of our cloud and hardware operations are subject to state, federal and international laws governing protection of the environment, proper handling and disposal of materials used for these products, human health and safety, the use of certain chemical substances and the labor practices of suppliers, as well as local testing and labelling requirements. Compliance with these environmental and other laws could increase our product design, development, procurement, manufacturing, delivery, cloud operations and administration costs, limit our ability to manage excess and obsolete non-compliant inventory, change our sales activities, or otherwise impact future financial results of our cloud and hardware businesses. Any violation of these laws can subject us to significant liability, including fines, penalties and possible prohibition of sales of our products and services into one or more states or countries and result in a material adverse effect on the financial condition or results of operations of our cloud and hardware businesses. Regulatory, market, and competitive pressures regarding the energy intensity and energy mix for our data center operations may also grow.
The U.S. Securities and Exchange Commission has adopted disclosure requirements for companies that use certain “conflict minerals” (tantalum, tin, tungsten and gold) in their products. Our supply chain is multi-tiered, global and highly complex. As a provider of hardware end products, we are several steps removed from the mining and smelting or refining of any conflict minerals in our supply chain. Accordingly, our ability to determine with certainty the origin and chain of custody of conflict minerals is limited. Our relationships with customers and suppliers could suffer if we are unable to describe our products as “conflict-free.” We may also face increased costs in complying with conflict minerals disclosure requirements.
A significant portion of our hardware revenues come from international sales. Environmental legislation, such as the EU Directive on Restriction of Hazardous Substances (RoHS), the EU Waste Electrical and Electronic Equipment Directive (WEEE Directive) and China’s regulation on Management Methods for Controlling Pollution Caused by Electronic Information Products, may increase our cost of doing business internationally and impact our hardware revenues from the EU, China and other countries with similar environmental legislation as we endeavor to comply with and implement these requirements. The cumulative impact of international environmental legislation could be significant.
Our stock price could become more volatile and your investment could lose value. All of the factors discussed in this section could affect our stock price. The timing of announcements in the public market regarding new products, product enhancements or technological advances by our competitors or us and any announcements by us of acquisitions, major transactions, or management changes could also affect our stock price. Changes in the amounts and frequency of share repurchases or dividends could adversely affect our stock price. Our stock price could also be affected by factors, some of which are beyond our control, including, among others: speculation in the press and the analyst community, changes in recommendations or earnings estimates by financial analysts, changes in investors’ or analysts’ valuation measures for our stock, earnings announcements where our financial results differ from our guidance or investors’ expectations, our credit ratings and market trends unrelated to our performance. A significant drop in our stock price could also expose us to the risk of securities class action lawsuits, which could result in substantial costs and divert management’s attention and resources, which could adversely affect our business.
We cannot guarantee that our stock repurchase program will be fully implemented or that it will enhance long-term stockholder value. In fiscal 2018, our Board of Directors approved expansions of our stock repurchase program totaling $24.0 billion. The repurchase program does not have an expiration date and we are not obligated to repurchase a specified number or dollar value of shares. Our repurchase program may be suspended or terminated at any time and, even if fully implemented, may not enhance long-term stockholder value.
30
Table of Contents
Index to Financial Statements
Item 1B. Unresolved Staff Comments
None.
Our properties consist of owned and leased office facilities for sales, support, research and development, services, manufacturing, cloud operations and administrative and other functions. Our headquarters facility consists of approximately 2.1 million square feet in Redwood City, California, substantially all of which we own. We also own or lease other facilities for current use consisting of approximately 26.8 million square feet in various other locations in the United States and abroad. Approximately 3.0 million square feet, or 10%, of our total owned and leased space is sublet or is being actively marketed for sublease or disposition. We lease our principal internal manufacturing facility for our hardware products in Hillsboro, Oregon. Our cloud operations deliver our Oracle Cloud Services through the use of global data centers including those that we own and operate and those that we utilize through colocation suppliers. We believe that our facilities are in good condition and suitable for the conduct of our business.
The material set forth in Note 14 (pertaining to information regarding contingencies related to our income taxes) and Note 17 (pertaining to information regarding legal contingencies) of Notes to Consolidated Financial Statements in Item 15 of this Annual Report on Form 10-K is incorporated herein by reference.
Item 4. Mine Safety Disclosures
Not applicable.
31
Table of Contents
Index to Financial Statements
| Item 5. | Market for Registrant’s Common Equity, Related Stockholder Matters and Issuer Purchases of Equity Securities |
Our common stock is traded on the New York Stock Exchange under the symbol “ORCL.” According to the records of our transfer agent, we had 9,575 stockholders of record as of May 31, 2018. The following table sets forth the low and high sale prices per share of our common stock, based on the last daily sale, in each of our last eight fiscal quarters.
| Fiscal 2018 | Fiscal 2017 | |||||||||||||||
| Low Sale
Price |
High Sale
Price |
Low Sale
Price |
High Sale
Price |
|||||||||||||
| Fourth Quarter |
$ | 44.79 | $ | 52.97 | $ | 42.44 | $ | 45.73 | ||||||||
| Third Quarter |
$ | 46.63 | $ | 52.75 | $ | 38.45 | $ | 43.17 | ||||||||
| Second Quarter |
$ | 47.92 | $ | 52.80 | $ | 37.93 | $ | 41.25 | ||||||||
| First Quarter |
$ | 44.68 | $ | 51.17 | $ | 38.44 | $ | 41.77 | ||||||||
We declared and paid cash dividends totaling $0.76 and $0.64 per outstanding common share over the course of fiscal 2018 and fiscal 2017, respectively.
In June 2018, our Board of Directors declared a quarterly cash dividend of $0.19 per share of our outstanding common stock payable on July 31, 2018 to stockholders of record as of the close of business on July 17, 2018. We currently expect to continue paying comparable cash dividends on a quarterly basis; however, future declarations of dividends and the establishment of future record and payment dates are subject to the final determination of our Board of Directors.
For equity compensation plan information, please refer to Item 12 in Part III of this Annual Report.
Stock Repurchase Program
Our Board of Directors has approved a program for us to repurchase shares of our common stock. On December 14, 2017 and February 2, 2018, we announced that our Board of Directors approved expansions of our stock repurchase program totaling $24.0 billion. As of May 31, 2018, approximately $17.8 billion remained available for stock repurchases pursuant to our stock repurchase program.
Our stock repurchase authorization does not have an expiration date and the pace of our repurchase activity will depend on factors such as our working capital needs, our cash requirements for acquisitions and dividend payments, our debt repayment obligations or repurchases of our debt, our stock price, and economic and market conditions. Our stock repurchases may be effected from time to time through open market purchases or pursuant to a Rule 10b5-1 plan. Our stock repurchase program may be accelerated, suspended, delayed or discontinued at any time.
The following table summarizes the stock repurchase activity for the three months ended May 31, 2018 and the approximate dollar value of shares that may yet be purchased pursuant to our stock repurchase program:
| (in millions, except per share amounts) |
Total Number of Shares Purchased |
Average Price Paid per Share |
Total Number of Shares Purchased as Part of Publicly Announced Program |
Approximate Dollar Value of Shares that May Yet Be Purchased Under the Program |
||||||||||||
| March 1, 2018—March 31, 2018 |
35.5 | $ | 48.68 | 35.5 | $ | 21,120.5 | ||||||||||
| April 1, 2018—April 30, 2018 |
33.8 | $ | 45.72 | 33.8 | $ | 19,576.4 | ||||||||||
| May 1, 2018—May 31, 2018 |
37.2 | $ | 46.46 | 37.2 | $ | 17,848.4 | ||||||||||
|
|
|
|
|
|||||||||||||
| Total |
106.5 | $ | 46.97 | 106.5 | ||||||||||||
|
|
|
|
|
|||||||||||||
32
Table of Contents
Index to Financial Statements
Stock Performance Graph and Cumulative Total Return
The graph below compares the cumulative total stockholder return on our common stock with the cumulative total return of the S&P 500 Index and the S&P Information Technology Index for each of the last five fiscal years ended May 31, 2018, assuming an investment of $100 at the beginning of such period and the reinvestment of any dividends. The comparisons in the graphs below are based upon historical data and are not indicative of, nor intended to forecast, future performance of our common stock.
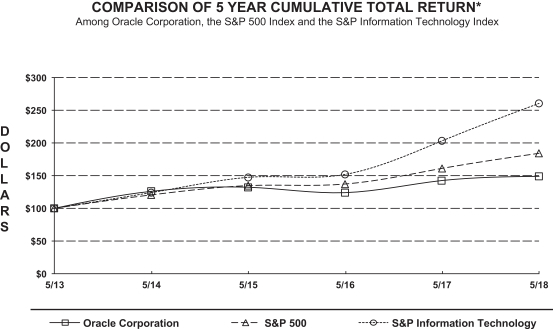
*$100 INVESTED ON MAY 31, 2013 IN STOCK OR
INDEX-INCLUDING REINVESTMENT OF DIVIDENDS
| 5/13 | 5/14 | 5/15 | 5/16 | 5/17 | 5/18 | |||||||||||||||||||
| Oracle Corporation |
100.0 | 126.1 | 132.1 | 124.0 | 142.3 | 148.8 | ||||||||||||||||||
| S&P 500 Index |
100.0 | 120.5 | 134.7 | 137.0 | 160.9 | 184.1 | ||||||||||||||||||
| S&P Information Technology Index |
100.0 | 123.9 | 147.2 | 151.8 | 203.1 | 260.4 | ||||||||||||||||||
33
COMPARISON OF 5 YEAR CUMULATIVE TOTAL RETURN” Among Oracle Corporation, the S&P 500 Index and the S&P Information Technology Index
Table of Contents
Index to Financial Statements
Item 6. Selected Financial Data
The following table sets forth selected financial data as of and for our last five fiscal years. This selected financial data should be read in conjunction with the consolidated financial statements and related notes included in Item 15 of this Annual Report. Over our last five fiscal years, we have acquired a number of companies, including NetSuite Inc. (NetSuite) in fiscal 2017 and MICROS Systems, Inc. in fiscal 2015, among others. The results of our acquired companies have been included in our consolidated financial statements since their respective dates of acquisition and have contributed to our revenues, income, earnings per share and total assets.
| As of and for the Year Ended May 31, | ||||||||||||||||||||
| (in millions, except per share amounts) |
2018 | 2017 | 2016 | 2015 | 2014 | |||||||||||||||
| Consolidated Statements of Operations Data: |
||||||||||||||||||||
| Total revenues |
$ | 39,831 | $ | 37,728 | $ | 37,047 | $ | 38,226 | $ | 38,275 | ||||||||||
| Operating income |
$ | 13,679 | $ | 12,710 | $ | 12,604 | $ | 13,871 | $ | 14,759 | ||||||||||
| Net income(1) |
$ | 3,825 | $ | 9,335 | $ | 8,901 | $ | 9,938 | $ | 10,955 | ||||||||||
| Earnings per share—diluted(1) |
$ | 0.90 | $ | 2.21 | $ | 2.07 | $ | 2.21 | $ | 2.38 | ||||||||||
| Diluted weighted average common shares outstanding |
4,238 | 4,217 | 4,305 | 4,503 | 4,604 | |||||||||||||||
| Cash dividends declared per common share |
$ | 0.76 | $ | 0.64 | $ | 0.60 | $ | 0.51 | $ | 0.48 | ||||||||||
| Consolidated Balance Sheets Data: |
||||||||||||||||||||
| Working capital(2) |
$ | 56,769 | $ | 50,337 | $ | 47,105 | $ | 47,314 | $ | 32,954 | ||||||||||
| Total assets(2) |
$ | 137,264 | $ | 134,991 | $ | 112,180 | $ | 110,903 | $ | 90,266 | ||||||||||
| Notes payable and other borrowings(3) |
$ | 60,619 | $ | 57,909 | $ | 43,855 | $ | 41,958 | $ | 24,097 | ||||||||||
| (1) | Our net income and diluted earnings per share were unfavorably impacted by a net charge of $7.0 billion during fiscal 2018 due to our preliminary assessment of the one-time effects of the U.S. Tax Cuts and Jobs Act of 2017 (the Tax Act). The more significant provisions of the Tax Act as applicable to us are described below under “Impacts of the U.S. Tax Cuts and Jobs Act of 2017”. |
| (2) | Total working capital and total assets sequentially increased in nearly all periods presented primarily due to the favorable impacts to our net current assets resulting from our net income generated during all periods presented and the issuances of long-term senior notes of $10.0 billion in fiscal 2018, $14.0 billion in fiscal 2017, $20.0 billion in fiscal 2015, and €2.0 billion and $3.0 billion in fiscal 2014. Our total assets were also favorably impacted by the issuance of $2.5 billion of short-term borrowings in fiscal 2018, and $3.8 billion of short-term borrowings in each of fiscal 2017 and 2016. These increases were partially offset by cash used for acquisitions, repurchases of our common stock and dividend payments made in all periods presented, repayments of certain of our senior notes in fiscal 2018, 2017, 2016 and 2015, and the repayment of $3.8 billion of short-term borrowings in each of fiscal 2018 and 2017. |
| (3) | Our notes payable and other borrowings, which represented the summation of our notes payable and other borrowings, current, and notes payable and other borrowings, non-current, as reported per our consolidated balance sheets as of the dates listed in the table above, increased between fiscal 2014 and fiscal 2018 primarily due to the fiscal 2018 issuance of long-term senior notes of $10.0 billion and short-term borrowings of $2.5 billion, the fiscal 2017 issuance of long-term senior notes of $14.0 billion and short-term borrowings of $3.8 billion, the fiscal 2016 issuance of $3.8 billion of short-term borrowings, the issuances of long-term senior notes of $20.0 billion in fiscal 2015, and €2.0 billion and $3.0 billion in fiscal 2014. See Note 7 of Notes to Consolidated Financial Statements included elsewhere in this Annual Report for additional information regarding our notes payable and other borrowings. |
34
Table of Contents
Index to Financial Statements
Item 7. Management’s Discussion and Analysis of Financial Condition and Results of Operations
We begin Management’s Discussion and Analysis of Financial Condition and Results of Operations with an overview of our businesses and significant trends. This overview is followed by a summary of our critical accounting policies and estimates that we believe are important to understanding the assumptions and judgments incorporated in our reported financial results. We then provide a more detailed analysis of our results of operations and financial condition.
Business Overview
Oracle Corporation provides products and services that address all aspects of corporate information technology (IT) environments—applications, platform and infrastructure. Our applications, platform and infrastructure offerings are delivered to customers worldwide through a variety of flexible and interoperable IT deployment models, including cloud-based, on-premise, or hybrid, which enable customer choice and flexibility. We market and sell our offerings globally to businesses of many sizes, government agencies, educational institutions and resellers with a worldwide sales force that is employed by our domestic and international subsidiaries and is positioned to offer the combinations that best meet customer needs.
We have three businesses: cloud and license; hardware; and services; each of which comprises a single operating segment. The descriptions set forth below as a part of Management’s Discussion and Analysis of Financial Condition and Results of Operations and the information contained within Note 15 of Notes to Consolidated Financial Statements included elsewhere in this Annual Report provide additional information related to our businesses and operating segments and align as to how our chief operating decision makers (CODMs), which include our Chief Executive Officers and Chief Technology Officer, view our operating results and allocate resources.
Cloud and License Business
Our cloud and license line of business, which represented 82%, 80% and 78% of our total revenues in fiscal 2018, 2017 and 2016, respectively, markets, sells and delivers a broad spectrum of applications, platform and infrastructure technologies through our cloud and license offerings.
Cloud services and license support revenues include:
| • | license support revenues, which is our largest revenues stream. Oracle license support grants rights to unspecified product upgrades and maintenance releases and patches released during the term of the support period, as well as technical support assistance. Substantially all of our customers opt to purchase license support contracts when they purchase Oracle applications, platform and/or infrastructure licenses and substantially all customers renew their license support contracts annually in order to continue to benefit from Oracle’s research and development investments that are utilized as a part of unspecified periodic license updates that may be released and that customers with current license support contracts are entitled to. Our license support contracts are generally priced as a percentage of the net fees paid by the customer to access the license, are generally billed in advance of the support services being performed and are generally recognized as revenues ratably as the support services are delivered over the contractual terms; and |
| • | cloud services revenues, which includes revenues from Oracle Cloud Software-as-a-Service (SaaS), Platform-as-a-Service (PaaS) and Infrastructure-as-a-Service (IaaS) offerings (collectively, Oracle Cloud Services), which deliver applications, platform and infrastructure technologies, respectively, via cloud-based deployment models that we develop functionality for, host, manage and support and that customers access by entering into a subscription agreement with us for a stated period. Our IaaS offerings also include Oracle Managed Cloud Services, which are designed to provide comprehensive software and hardware management, maintenance and security services for customer cloud-based, hybrid IT or other IT infrastructure for a fee for a stated term. The majority of our Oracle Cloud Services arrangements have durations of 12 to 36 months and are generally recognized as revenues ratably over the contractual period of the contract or, in the case of usage model contracts, as the cloud services are consumed. We strive to renew these cloud services contracts when they are eligible for renewal. |
35
Table of Contents
Index to Financial Statements
Cloud license and on-premise license revenues include revenues from the licensing of our software products including Oracle Applications, Oracle Database, Oracle Fusion Middleware and Java, among others which our customers use for cloud-based, on-premise and other IT environments. Our cloud license and on-premise license transactions are generally perpetual in nature and are generally recognized when unrestricted access to the license is granted to the customer provided all other revenue recognition criteria are met. The timing of a few large license transactions can substantially affect our quarterly license revenues, which is different than the typical revenue recognition pattern for our cloud services and license support revenues in which revenues are generally recognized ratably over the contractual periods. Cloud license and on-premise license customers have the option to purchase license support contracts, as described above.
Providing choice and flexibility to our customers as to when and how they deploy our applications, platform and infrastructure technologies is an important element of our corporate strategy. In recent periods, customer demand has increased for our Oracle Cloud Services. To address customer demand and enable customer choice, we have introduced certain programs for customers to pivot their applications, platform and infrastructure licenses and license support to the Oracle Cloud for new deployments and to migrate to and expand with the Oracle Cloud for their existing workloads. We expect these trends to continue.
Our cloud services revenues growth and our cloud license and on-premise license revenues growth are affected by the strength of general economic and business conditions, governmental budgetary constraints, the strategy for and competitive position of our offerings, our acquisitions, our ability to deliver and renew our cloud services contracts with our existing customers and foreign currency rate fluctuations. Our license support revenues growth is primarily influenced by three factors: (1) the continuity of substantially all of our license support customer contract base renewing their license support contracts and substantially all customers continuing to purchase license support contracts in connection with their purchase of a new license; (2) the pricing of license support contracts sold in connection with the sale of new licenses; and (3) the pricing of new licenses sold. Customers do so in order to benefit from Oracle’s research and development investments that are utilized as a part of unspecified periodic license updates that may be released and that customers with current license support contracts are entitled to.
On a constant currency basis, we expect that our total cloud and license revenues generally will continue to increase due to:
| • | expected growth in our cloud services and license support offerings, including the high percentage of customers that purchase and renew their license support contracts; |
| • | continued demand for our cloud license and on-premise license offerings; and |
| • | contributions from our acquisitions. |
We believe all of these factors should contribute to future growth in our cloud and license revenues, which should enable us to continue to make investments in research and development to develop and improve our cloud and license products and services.
Our cloud and license business’ margin has historically trended upward over the course of the four quarters within a particular fiscal year due to the historical upward trend of our cloud license and on-premise license revenues over those quarterly periods and because the majority of our costs for this business are generally fixed in the short term.
Hardware Business
Our hardware business, which represented 10%, 11% and 13% of our total revenues in fiscal 2018, 2017 and 2016, respectively, provides a broad selection of hardware products and hardware-related software products including Oracle Engineered Systems, servers, storage, industry-specific hardware, operating systems, virtualization, management and other hardware related software, and related hardware support. Hardware transactions are generally recognized as revenues upon delivery to the customer provided all other revenue recognition criteria are met. Our hardware business also offers related hardware support. We expect to make investments in research and development to improve existing hardware products and services and to develop new hardware products and services. The majority of our hardware products are sold through indirect channels,
36
Table of Contents
Index to Financial Statements
including independent distributors and value-added resellers. Our hardware support offerings provide customers with unspecified software updates for software components that are essential to the functionality of our hardware products and associated software products such as Oracle Solaris. Our hardware support offerings can also include product repairs, maintenance services and technical support services. Hardware support contracts are entered into at the option of the customer, are generally priced as a percentage of the net hardware products fees and are generally recognized as revenues ratably as the hardware support services are delivered over the contractual terms.
We generally expect our hardware business to have lower operating margins as a percentage of revenues than our cloud and license business due to the incremental costs we incur to produce and distribute these products and to provide support services, including direct materials and labor costs.
Our quarterly hardware revenues are difficult to predict. Our hardware revenues, cost of hardware and hardware operating margins that we report are affected by, among others: our ability to timely manufacture or deliver a few large hardware transactions; our strategy for and the position of our hardware products relative to competitor offerings; customer demand for competing offerings such as PaaS and IaaS; the strength of general economic and business conditions; governmental budgetary constraints; whether customers decide to purchase hardware support contracts at or in close proximity to the time of hardware product sale; the percentage of our hardware support contract customer base that renews its support contracts and the close association between hardware products, which have a finite life, and customer demand for related hardware support as hardware products age; customer decisions to either maintain or upgrade their existing hardware infrastructure to newly developed technologies that are available; certain of our acquisitions; and foreign currency rate fluctuations.
Services Business
Our services business helps customers and partners maximize the performance of their investments in Oracle applications, platform and infrastructure technologies. We believe that our services are differentiated based on our focus on Oracle technologies, extensive experience and broad sets of intellectual property and best practices. Our services offerings include consulting services, advanced support services and education services and represented 8% of our total revenues in fiscal 2018 and 9% of our total revenues in each of fiscal 2017 and 2016. Our services business has lower margins than our cloud and license and hardware businesses. Our services revenues are impacted by, among others: our strategy for, and the competitive position of, our services; customer demand for our cloud and license and hardware offerings and the associated services for these offerings; our strategic emphasis on growing our cloud revenues; certain of our acquisitions; general economic conditions; governmental budgetary constraints; personnel reductions in our customers’ IT departments; and tighter controls over discretionary spending.
Acquisitions
Our selective and active acquisition program is another important element of our corporate strategy. In recent years, we have invested billions of dollars to acquire a number of complementary companies, products, services and technologies, including NetSuite in fiscal 2017.
We expect to continue to acquire companies, products, services and technologies in furtherance of our corporate strategy. Note 2 of Notes to Consolidated Financial Statements included elsewhere in this Annual Report provides additional information related to our recent acquisitions.
We believe that we can fund our future acquisitions with our internally available cash, cash equivalents and marketable securities, cash generated from operations, additional borrowings or from the issuance of additional securities. We estimate the financial impact of any potential acquisition with regard to earnings, operating margin, cash flow and return on invested capital targets before deciding to move forward with an acquisition.
Critical Accounting Policies and Estimates
Our consolidated financial statements are prepared in accordance with U.S. generally accepted accounting principles (GAAP) as set forth in the Financial Accounting Standards Board’s (FASB) Accounting Standards
37
Table of Contents
Index to Financial Statements
Codification (ASC), and we consider the various staff accounting bulletins and other applicable guidance issued by the U.S. Securities and Exchange Commission (SEC). GAAP, as set forth within the ASC, requires us to make certain estimates, judgments and assumptions. We believe that the estimates, judgments and assumptions upon which we rely are reasonable based upon information available to us at the time that these estimates, judgments and assumptions are made. These estimates, judgments and assumptions can affect the reported amounts of assets and liabilities as of the date of the financial statements as well as the reported amounts of revenues and expenses during the periods presented. To the extent that there are differences between these estimates, judgments or assumptions and actual results, our financial statements will be affected. The accounting policies that reflect our more significant estimates, judgments and assumptions and which we believe are the most critical to aid in fully understanding and evaluating our reported financial results include:
| • | Revenue Recognition; |
| • | Business Combinations; |
| • | Goodwill and Intangible Assets—Impairment Assessments; |
| • | Accounting for Income Taxes; and |
| • | Legal and Other Contingencies. |
In many cases, the accounting treatment of a particular transaction is specifically dictated by GAAP and does not require management’s judgment in its application. There are also areas in which management’s judgment in selecting among available alternatives would not produce a materially different result. Our senior management has reviewed our critical accounting policies and related disclosures with the Finance and Audit Committee of the Board of Directors.
Revenue Recognition
Our sources of revenues include:
| • | cloud and license revenues, which include the sale of: cloud services and license support; and cloud license and on-premise licenses, which represent licenses purchased by customers for use in both cloud and on-premise deployments; |
| • | hardware revenues, which include the sale of hardware products including Oracle Engineered Systems, servers, storage, industry-specific hardware; and hardware support revenues; and |
| • | services revenues, which are earned from providing cloud-, license- and hardware-related services including consulting, advanced customer support and education services. |
Revenue Recognition for Cloud Services Offerings, Hardware Products, Hardware Support and Related Services (Non-software Elements)
Our revenue recognition policy for non-software deliverables including our cloud services offerings, hardware products, hardware support and related services is based upon the accounting guidance contained in ASC 605-25, Revenue Recognition, Multiple-Element Arrangements, and we exercise judgment and use estimates in connection with the determination of the amount of cloud services revenues, hardware products revenues, hardware support and related services revenues to be recognized in each accounting period.
Revenues from the sales of our non-software elements are recognized when: (1) persuasive evidence of an arrangement exists; (2) we deliver the products or services; (3) the sale price is fixed or determinable; and (4) collection is reasonably assured. Revenues that are not recognized at the time of sale because the foregoing conditions are not met are recognized when those conditions are subsequently met.
Revenues for our cloud services offerings sold on a subscription basis are generally recognized ratably over the contract term commencing with the date the service is made available to customers. Revenues for cloud services offerings sold on a usage basis are generally recognized as the customer consumes the service, provided all other revenue recognition criteria have been satisfied.
38
Table of Contents
Index to Financial Statements
Revenues from the sale of hardware products are generally recognized upon delivery of the hardware product to the customer provided all other revenue recognition criteria are satisfied. Hardware support contracts are entered into at the customer’s option and are recognized ratably over the contractual term of the arrangements, which is typically one year, provided all other revenue recognition criteria have been satisfied.
Revenue Recognition for Multiple-Element Arrangements—Cloud Services Offerings, Hardware Products, Hardware Support and Related Services (Non-software Arrangements)
We enter into arrangements with customers that purchase non-software related products and services from us at the same time, or within close proximity of one another (referred to as non-software multiple-element arrangements). Each element within a non-software multiple-element arrangement is accounted for as a separate unit of accounting provided the following criteria are met: the delivered products or services have value to the customer on a standalone basis; and for an arrangement that includes a general right of return relative to the delivered products or services, delivery or performance of the undelivered product or service is considered probable and is substantially controlled by us. We consider a deliverable to have standalone value if the product or service is sold separately by us or another vendor or could be resold by the customer. Further, our revenue arrangements generally do not include a general right of return relative to the delivered products. Where the aforementioned criteria for a separate unit of accounting are not met, the deliverable is combined with the undelivered element(s) and treated as a single unit of accounting for the purposes of allocation of the arrangement consideration and revenue recognition. For those units of accounting that include more than one deliverable but are treated as a single unit of accounting, we generally recognize revenues over the contractual period of the arrangement, or in the case of our cloud services offerings, we generally recognize revenues over the contractual term of the cloud services subscription. For the purposes of revenue classification of the elements that are accounted for as a single unit of accounting, we allocate revenue to the respective revenue line items within our consolidated statements of operations based on a rational and consistent methodology utilizing our best estimate of relative selling prices of such elements.
For our non-software multiple-element arrangements, we allocate revenue to each element based on a selling price hierarchy at the arrangement’s inception. The selling price for each element is based upon the following selling price hierarchy: vendor-specific objective evidence (VSOE) if available, third-party evidence (TPE) if VSOE is not available, or estimated selling price (ESP) if neither VSOE nor TPE are available (a description as to how we determine VSOE, TPE and ESP is provided below). If a tangible hardware product includes software, we determine whether the tangible hardware product and the software work together to deliver the product’s essential functionality and, if so, the entire product is treated as a non-software deliverable. The total arrangement consideration is allocated to each separate unit of accounting for each of the non-software deliverables using the relative selling prices of each unit based on the selling price hierarchy. We limit the amount of revenue recognized for delivered elements to an amount that is not contingent upon future delivery of additional products or services or meeting of any specified performance conditions.
When possible, we establish VSOE of selling price for deliverables in software and non-software multiple-element arrangements using the price charged for a deliverable when sold separately. TPE is established by evaluating similar and interchangeable competitor products or services in standalone arrangements with similarly situated customers. If we are unable to determine the selling price because VSOE or TPE does not exist, we determine ESP for the purposes of allocating the arrangement by reviewing historical transactions, including transactions whereby the deliverable was sold on a standalone basis and considering several other external and internal factors.
Revenue Recognition for Cloud License and On-Premise License and License Related Services (Software Elements)
The basis for our cloud license and on-premise license revenues and related services revenue recognition is substantially governed by the accounting guidance contained in ASC 985-605, Software-Revenue Recognition. We exercise judgment and use estimates in connection with the determination of the amount of cloud license and on-premise license revenues and related services revenues to be recognized in each accounting period.
39
Table of Contents
Index to Financial Statements
For license arrangements that do not require significant modification or customization of the underlying license, we recognize cloud license and on-premise license revenues when: (1) we enter into a legally binding arrangement with a customer for the license of software; (2) we deliver the products; (3) the sale price is fixed or determinable and free of contingencies or significant uncertainties; and (4) collection is probable. Revenues that are not recognized at the time of license sale because the foregoing conditions are not met, are generally recognized when those conditions are subsequently met.
The vast majority of our cloud license and on-premise license arrangements include license support contracts, which are entered into at the customer’s option. We recognize the related fees ratably over the term of the arrangement, typically one year. License support contracts provide customers with rights to unspecified software product upgrades, maintenance releases and patches released during the term of the support period and include internet access to technical content, as well as internet and telephone access to technical support personnel. License support contracts are generally priced as a percentage of the net cloud license and on-premise license fees and are generally invoiced in full at the beginning of the support term. Substantially all of our customers renew their license support contracts annually.
Revenue Recognition for Multiple-Element Arrangements—Cloud License and On-Premise License, Support and Related Services (Software Arrangements)
We often enter into arrangements with customers that purchase cloud licenses and on-premise licenses, license support and related services from us at the same time, or within close proximity of one another (referred to as software related multiple-element arrangements). For those software related multiple-element arrangements, we have applied the residual method to determine the amount of cloud license and on-premise license revenues to be recognized pursuant to ASC 985-605. Under the residual method, if VSOE exists for undelivered elements in a multiple-element arrangement, VSOE of the undelivered elements is deferred with the remaining portion of the arrangement consideration generally recognized upon delivery of the license. Where VSOE does not exist for the undelivered element in such arrangement, no revenue is recognized until the earlier of the point in time at which 1) VSOE has been established for such element; or 2) the element that does not have VSOE has been delivered.
Revenue Recognition for Multiple-Element Arrangements—Arrangements with Software and Non-software Elements
We also enter into multiple-element arrangements that may include a combination of our various software related and non-software related products and services offerings including cloud licenses and on-premise licenses, license support, cloud services offerings, hardware products, hardware support, consulting, advanced customer support services and education. In such arrangements, we first allocate the total arrangement consideration based on the relative selling prices of the software group of elements as a whole and the non-software group of elements. We then further allocate consideration within the software group to the respective elements within that group following the guidance in ASC 985-605 and our policies as described above. In addition, we allocate the consideration within the non-software group to each respective element within that group based on a selling price hierarchy at the arrangement’s inception as described above. After the arrangement consideration has been allocated to the software group of elements and non-software group of elements, we account for each respective element in the arrangement as described above and below.
Other Revenue Recognition Policies Applicable to Software and Non-software Elements
Many of our cloud license and on-premise license arrangements include consulting implementation services sold separately under consulting engagement contracts and are included as a part of our services business. Consulting revenues from these arrangements are generally accounted for separately from cloud license and on-premise license revenues because the arrangements qualify as services transactions as defined in ASC 985-605. The more significant factors considered in determining whether the revenues should be accounted for separately include the nature of services (i.e., consideration of whether the services are essential to the functionality of the licensed product), degree of risk, availability of services from other vendors, timing of payments and impact of milestones or acceptance criteria on the realizability of the license fee. Revenues for consulting services are generally recognized as the services are performed.
40
Table of Contents
Index to Financial Statements
If an arrangement contains multiple elements and does not qualify for separate accounting for the product and service transactions, then cloud license and on-premise license revenues and/or hardware products revenues, including the costs of hardware products, are generally recognized together with the services based on contract accounting using either the percentage-of-completion or completed-contract method.
We also evaluate arrangements with governmental entities containing “fiscal funding” or “termination for convenience” provisions, when such provisions are required by law, to determine the probability of possible cancellation. We consider multiple factors, including the history with the customer in similar transactions, the “essential use” of the license or hardware products and the planning, budgeting and approval processes undertaken by the governmental entity. If we determine upon execution of these arrangements that the likelihood of cancellation is remote, we then recognize revenues for such arrangements once all of the criteria described above have been met. If such a determination cannot be made, revenues are recognized upon the earlier of cash receipt or approval of the applicable funding provision by the governmental entity for such arrangements.
We assess whether fees are fixed or determinable at the time of sale and recognize revenues if all other revenue recognition requirements are met. Our standard payment terms are net 30 days. However, payment terms may vary based on the country in which the agreement is executed. We evaluate non-standard payment terms based on whether we have successful collection history on comparable arrangements (based upon similarity of customers, products, and arrangement economics) and, if so, generally conclude such payment terms are fixed and determinable and thereby satisfy the required criteria for revenue recognition.
While most of our arrangements for sales within our businesses include short-term payment terms, we have a standard practice of providing long-term financing to creditworthy customers primarily through our financing division. Since fiscal 1989, when our financing division was formed, we have established a history of collection, without concessions, on these receivables with payment terms that generally extend up to five years from the contract date. Provided all other revenue recognition criteria have been met, we recognize cloud license and on-premise license revenues and hardware products revenues for these arrangements upon delivery, net of any payment discounts from financing transactions. We have generally sold receivables financed through our financing division on a non-recourse basis to third-party financing institutions within 90 days of the contracts’ dates of execution and we classify the proceeds from these sales as cash flows from operating activities in our consolidated statements of cash flows. We account for the sales of these receivables as “true sales” as defined in ASC 860, Transfers and Servicing, as we are considered to have surrendered control of these financing receivables.
Our customers include several of our suppliers and, occasionally, we have purchased goods or services for our operations from these vendors at or about the same time that we have sold our products to these same companies (Concurrent Transactions). Cloud license and on-premise license agreements, sales of hardware or sales of services that occur within a common period from the date we have purchased goods or services from that same customer are reviewed for appropriate accounting treatment and disclosure. When we acquire goods or services from a customer, we negotiate the purchase separately from any sales transaction, at terms we consider to be at arm’s length and settle the purchase in cash. We recognize revenues from Concurrent Transactions if all of our revenue recognition criteria are met and the goods and services acquired are necessary for our current operations.
Business Combinations
We apply the provisions of ASC 805, Business Combinations, in accounting for our acquisitions. It requires us to recognize separately from goodwill the assets acquired and the liabilities assumed at the acquisition date fair values. Goodwill as of the acquisition date is measured as the excess of consideration transferred over the net of the acquisition date fair values of the assets acquired and the liabilities assumed. While we use our best estimates and assumptions to accurately value assets acquired and liabilities assumed at the acquisition date as well as any contingent consideration, where applicable, our estimates are inherently uncertain and subject to refinement. As a result, during the measurement period, which may be up to one year from the acquisition date, we record adjustments to the assets acquired and liabilities assumed with the corresponding offset to
41
Table of Contents
Index to Financial Statements
goodwill. Upon the conclusion of the measurement period or final determination of the values of assets acquired or liabilities assumed, whichever comes first, any subsequent adjustments are recorded to our consolidated statements of operations.
Accounting for business combinations requires our management to make significant estimates and assumptions, especially at the acquisition date, including our estimates for intangible assets, contractual obligations assumed, pre-acquisition contingencies and any contingent consideration, where applicable. Although we believe that the assumptions and estimates we have made in the past have been reasonable and appropriate, they are based in part on historical experience and information obtained from the management of the acquired companies and are inherently uncertain. Unanticipated events and circumstances may occur that may affect the accuracy or validity of such assumptions, estimates or actual results.
We estimate the fair values of our cloud services and license support, and hardware obligations assumed as part of an acquisition. The estimated fair values of these performance obligations are determined utilizing a cost build-up approach. The cost build-up approach determines fair value by estimating the costs related to fulfilling these assumed obligations plus a normal profit margin. The estimated costs to fulfill the assumed obligations are based on the historical direct costs related to providing the services including the correction of any errors in the products acquired. The sum of these costs and operating profit approximates, in theory, the amount that we would be required to pay a third party to assume the performance obligations. We do not include any costs associated with selling efforts or research and development or the related fulfillment margins on these costs. Profit associated with any selling efforts is excluded because the acquired entities would have concluded those selling efforts on the performance obligations prior to the acquisition date. We also do not include the estimated research and development costs in our fair value determinations, as these costs are not deemed to represent a legal obligation at the time of acquisition. As a result of our fair value estimates for these obligations, we did not recognize certain cloud services and license support revenue amounts and hardware revenue amounts that would have been otherwise recorded by the acquired businesses as independent entities upon delivery of the contractual obligations (refer to “Supplemental Disclosure Related to Certain Charges” below for further discussion). To the extent customers to which these contractual obligations pertain renew these contracts with us, we expect to recognize revenues for the full contracts’ values over the respective contracts’ renewal periods.
In connection with a business combination or other strategic initiative, we may estimate costs associated with restructuring plans committed to by our management. Restructuring costs are typically comprised of employee severance costs, costs of consolidating duplicate facilities and contract termination costs. Restructuring expenses are based upon plans that have been committed to by our management, but may be refined in subsequent periods. We account for costs to exit or restructure certain activities of an acquired company separately from the business combination pursuant to ASC 420, Exit or Disposal Cost Obligations. A liability for costs associated with an exit or disposal activity is recognized and measured at its fair value in our consolidated statement of operations in the period in which the liability is incurred. When estimating the fair value of facility restructuring activities, assumptions are applied regarding estimated sub-lease payments to be received, which can differ materially from actual results. This may require us to revise our initial estimates which may materially affect our results of operations and financial position in the period the revision is made.
For a given acquisition, we may identify certain pre-acquisition contingencies as of the acquisition date and may extend our review and evaluation of these pre-acquisition contingencies throughout the measurement period in order to obtain sufficient information to assess whether we include these contingencies as a part of the fair value estimates of assets acquired and liabilities assumed and, if so, to determine their estimated amounts.
If we cannot reasonably determine the fair value of a pre-acquisition contingency (non-income tax related) by the end of the measurement period, which is generally the case given the nature of such matters, we will recognize an asset or a liability for such pre-acquisition contingency if: (1) it is probable that an asset existed or a liability had been incurred at the acquisition date and (2) the amount of the asset or liability can be reasonably estimated. Subsequent to the measurement period, changes in our estimates of such contingencies will affect earnings and could have a material effect on our results of operations and financial position.
42
Table of Contents
Index to Financial Statements
In addition, uncertain tax positions and tax related valuation allowances assumed in connection with a business combination are initially estimated as of the acquisition date. We reevaluate these items quarterly based upon facts and circumstances that existed as of the acquisition date with any adjustments to our preliminary estimates being recorded to goodwill if identified within the measurement period. Subsequent to the measurement period or our final determination of the tax allowance’s or contingency’s estimated value, whichever comes first, changes to these uncertain tax positions and tax related valuation allowances will affect our provision for income taxes in our consolidated statement of operations and could have a material impact on our results of operations and financial position.
Goodwill and Intangible Assets—Impairment Assessments
We review goodwill for impairment annually and whenever events or changes in circumstances indicate its carrying value may not be recoverable in accordance with ASC 350, Intangibles—Goodwill and Other. According to ASC 350, we can opt to perform a qualitative assessment to test a reporting unit’s goodwill for impairment or we can directly perform the quantitative impairment test. Should the qualitative assessment be used for any given fiscal year, qualitative factors to consider include cost factors; financial performance; legal, regulatory, contractual, political, business, or other factors; entity specific factors; industry and market considerations, macroeconomic conditions, and other relevant events and factors affecting the reporting unit. If we determine that it is more likely than not that the fair value of the reporting unit is less than its carrying value, a quantitative test is then performed; otherwise, no further testing is required. For those reporting units tested using a quantitative approach, we compare the fair value of each reporting unit with the carrying amount of the reporting unit, including goodwill. If the estimated fair value of the reporting unit is less than the carrying amount of the reporting unit, goodwill impairment is recognized for the difference, limited to the amount of goodwill recognized for the reporting unit.
Determining the fair value of a reporting unit involves the use of significant estimates and assumptions. These estimates and assumptions include revenue growth rates and operating margins used to calculate projected future cash flows, risk-adjusted discount rates, future economic and market conditions and the determination of appropriate market comparables. We base our fair value estimates on assumptions which we believe to be reasonable but that are inherently uncertain. Actual future results may differ from those estimates. In addition, we make certain judgments and assumptions in allocating shared assets and liabilities to determine the carrying values for each of our reporting units.
Our most recent annual goodwill impairment analysis, which was performed on March 1, 2018, did not result in a goodwill impairment charge, nor did we recognize an impairment charge in fiscal 2017 or 2016.
We make judgments about the recoverability of purchased finite lived intangible assets whenever events or changes in circumstances indicate that impairment may exist. Each period we evaluate the estimated remaining useful lives of purchased intangible assets and whether events or changes in circumstances warrant a revision to the remaining periods of amortization. Recoverability of finite lived intangible assets is measured by comparison of the carrying amount of the asset to the future undiscounted cash flows the asset is expected to generate. If the asset is considered to be impaired, the amount of any impairment is measured as the difference between the carrying value and the fair value of the impaired asset.
Assumptions and estimates about future values and remaining useful lives of our intangible assets are complex and subjective. They can be affected by a variety of factors, including external factors such as industry and economic trends and internal factors such as changes in our business strategy and our internal forecasts. Although we believe that the historical assumptions and estimates we have made are reasonable and appropriate, different assumptions and estimates could materially impact our reported financial results. We did not recognize any intangible asset impairment charges in fiscal 2018, 2017 or 2016.
Accounting for Income Taxes
Significant judgment is required in determining our worldwide income tax provision. In the ordinary course of a global business, there are many transactions and calculations where the ultimate tax outcome is uncertain. Some of these uncertainties arise as a consequence of revenue sharing and cost reimbursement arrangements
43
Table of Contents
Index to Financial Statements
among related entities, the process of identifying items of revenues and expenses that qualify for preferential tax treatment and segregation of foreign and domestic earnings and expenses to avoid double taxation. Although we believe that our estimates are reasonable, the final tax outcome of these matters could be different from that which is reflected in our historical income tax provisions and accruals. Such differences could have a material effect on our income tax provision and net income in the period in which such determination is made.
On December 22, 2017 the U.S. Tax Cuts and Jobs Act of 2017 (the Tax Act), was signed into law. The net expense related to the enactment of the Tax Act has been accounted for during fiscal 2018 based on provisional estimates pursuant to the SEC Staff Accounting Bulletin No. 118. Subsequent adjustments, if any, will be accounted for in the period such adjustments are identified. The provisional estimates incorporate, among other factors, assumptions made based on interpretations of the Tax Act and existing tax laws and a range of historical and forecasted financial and tax-specific facts and information, including, without limitation, the amount of cash and other specified assets anticipated to be held by the company’s foreign subsidiaries on relevant dates and estimates of deferred tax balances during interim periods pending finalization of those balances.
We record a valuation allowance to reduce our deferred tax assets to the amount that is more likely than not to be realized. In order for us to realize our deferred tax assets, we must be able to generate sufficient taxable income in those jurisdictions where the deferred tax assets are located. We consider future growth, forecasted earnings, future taxable income, the mix of earnings in the jurisdictions in which we operate, historical earnings, taxable income in prior years, if carryback is permitted under the law and prudent and feasible tax planning strategies in determining the need for a valuation allowance. In the event we were to determine that we would not be able to realize all or part of our net deferred tax assets in the future, an adjustment to the deferred tax assets valuation allowance would be charged to earnings in the period in which we make such a determination, or goodwill would be adjusted at our final determination of the valuation allowance related to an acquisition within the measurement period. If we later determine that it is more likely than not that the net deferred tax assets would be realized, we would reverse the applicable portion of the previously provided valuation allowance as an adjustment to earnings at such time.
We record deferred tax assets for stock-based compensation awards that result in deductions on certain of our income tax returns based on the amount of stock-based compensation recognized and the fair values attributable to the vested portion of stock awards assumed in connection with a business combination at the statutory tax rates in the jurisdictions that we are able to recognize such tax deductions. The impacts of the actual tax deductions for stock-based awards that are realized in these jurisdictions are generally recognized to our consolidated statements of operations in the period that a restricted stock-based award vests or a stock option is exercised with any shortfall/windfall relative to the deferred tax asset established recorded as a discrete detriment/benefit to our provision for income taxes in this period. Such detriment/benefit can materially impact our reported effective tax rate for fiscal 2018 and prospective periods.
We calculate our current and deferred tax provision based on estimates and assumptions that could differ from the actual results reflected in income tax returns filed during the subsequent year. Adjustments based on filed returns are generally recorded in the period when the tax returns are filed and the global tax implications are known, which can materially impact our effective tax rate.
The amount of income tax we pay is subject to ongoing audits by federal, state and foreign tax authorities, which often result in proposed assessments. Our estimate of the potential outcome for any uncertain tax issue is highly judgmental. A description of our accounting policies associated with tax related contingencies assumed as a part of a business combination is provided under “Business Combinations” above. For those tax related contingencies that are not a part of a business combination, we account for these uncertain tax issues pursuant to ASC 740, Income Taxes, which contains a two-step approach to recognizing and measuring uncertain tax positions taken or expected to be taken in a tax return. The first step is to determine if the weight of available evidence indicates that it is more likely than not that the tax position will be sustained in an audit, including resolution of any related appeals or litigation processes. The second step is to measure the tax benefit as the largest amount that is more than 50% likely to be realized upon ultimate settlement. Although we believe that
44
Table of Contents
Index to Financial Statements
we have adequately reserved for our uncertain tax positions, no assurance can be given with respect to the final outcome of these matters. We adjust reserves for our uncertain tax positions due to changing facts and circumstances, such as the closing of a tax audit, judicial rulings, and refinement of estimates or realization of earnings or deductions that differ from our estimates. To the extent that the final outcome of these matters is different than the amounts recorded, such differences generally will impact our provision for income taxes in the period in which such a determination is made. Our provisions for income taxes include the impact of reserve provisions and changes to reserves that are considered appropriate and also include the related interest and penalties.
In addition, as a part of our accounting for business combinations, intangible assets are recognized at fair values and goodwill is measured as the excess of consideration transferred over the net estimated fair values of assets acquired. Impairment charges associated with goodwill are generally not tax deductible and will result in an increased effective income tax rate in the period that any impairment is recorded. Amortization expenses associated with acquired intangible assets are generally not tax deductible pursuant to our existing tax structure; however, deferred taxes have been recorded for non-deductible amortization expenses as a part of the accounting for business combinations. We have taken into account the allocation of these identified intangibles among different taxing jurisdictions, including those with nominal or zero percent tax rates, in establishing the related deferred tax liabilities.
Legal and Other Contingencies
We are currently involved in various claims and legal proceedings. Quarterly, we review the status of each significant matter and assess our potential financial exposure. A description of our accounting policies associated with contingencies assumed as a part of a business combination is provided under “Business Combinations” above. For legal and other contingencies that are not a part of a business combination, we accrue a liability for an estimated loss if the potential loss from any claim or legal proceeding is considered probable, and the amount can be reasonably estimated. Significant judgment is required in both the determination of probability and the determination as to whether the amount of an exposure is reasonably estimable. Because of uncertainties related to these matters, accruals are based only on the best information available at the time the accruals are made. As additional information becomes available, we reassess the potential liability related to our pending claims and litigation and may revise our estimates. Such revisions in the estimates of the potential liabilities could have a material impact on our results of operations and financial position.
Results of Operations
Impacts of the U.S. Tax Cuts and Jobs Act of 2017
The comparability of our operating results in fiscal 2018 compared to the corresponding prior year periods, and of our consolidated balance sheets as of May 31, 2018 relative to May 31, 2017, was impacted by the U.S. Tax Cuts and Jobs Act of 2017 (the Tax Act), which was signed into law on December 22, 2017. Effective January 1, 2018, the Tax Act reduces the U.S. federal corporate tax rate from 35% to 21%; creates a quasi-territorial tax system that a) generally allows, among other provisions, companies to repatriate certain foreign source earnings without incurring additional U.S. income tax for such earnings generated after December 31, 2017 and b) generally requires companies to pay a one-time transition tax on certain foreign subsidiary earnings generated prior to December 31, 2017 that, in substantial part, were previously tax deferred; creates new taxes on certain foreign sourced earnings; limits deductibility of certain future compensation arrangements to certain highly compensated employees; and provides tax incentives for the exportation of U.S. products to foreign jurisdictions and for the purchase of qualifying capital equipment, among other provisions.
Because we have a May 31 fiscal year end, our fiscal 2018 blended U.S. federal statutory tax rate was approximately 29%.
45
Table of Contents
Index to Financial Statements
During fiscal 2018, our provision for income taxes increased and our net income decreased, primarily as a result of the following items related to the enactment of the Tax Act:
| • | $7.8 billion of income tax expense, which we refined by a $166 million increase as of May 31, 2018 from our initial estimate made in our third quarter of fiscal 2018 in accordance with SEC Staff Accounting Bulletin No. 118 (SAB 118), related to the application of the one-time transition tax to certain foreign subsidiary earnings that were generated prior to December 31, 2017 and for which such expense was substantially recorded to non-current income taxes payable in our consolidated balance sheet and corresponds to the amount we currently expect to periodically settle over an eight year period as provided by the Tax Act; |
partially offset by:
| • | $820 million of income tax benefit, which we refined by a $76 million increase as of May 31, 2018 from our initial estimate made in our third quarter of fiscal 2018 in accordance with SAB 118, related to the remeasurement of our net deferred tax liabilities based on the rates at which they are expected to reverse in the future; and |
| • | the net favorable impacts of the Tax Act on our tax profile and effective tax rate beginning on January 1, 2018, which we generally expect will continue into future periods. |
The net expense related to the enactment of the Tax Act has been accounted for during fiscal 2018 based on provisional estimates pursuant to SAB 118. Subsequent adjustments, if any, will be accounted for in the period such adjustments are identified. The provisional estimates incorporate, among other factors, assumptions made based on interpretations of the Tax Act and existing tax laws and a range of historical financial and tax-specific facts and information, including among other items, the amount of cash and other specified assets and liabilities of the company and its foreign subsidiaries on relevant dates and estimates of deferred tax balances pending finalization of those balances.
We expect the enactment of the Tax Act to generally provide greater flexibility for us to access and utilize our cash, cash equivalent and marketable securities balances held by certain of our foreign subsidiaries as of January 1, 2018, as well as for prospective assets generated by these foreign subsidiaries’ future earnings and profits. We believe we have sufficient cash, cash equivalent and marketable securities balances, as well as access to other capital resources, if required, to settle the $7.8 billion one-time transition tax described above.
Impacts of Acquisitions
The comparability of our operating results in fiscal 2018 compared to fiscal 2017 and in fiscal 2017 compared to fiscal 2016 was impacted by our recent acquisitions, including our acquisition of NetSuite during the second quarter of fiscal 2017. In our discussion of changes in our results of operations from fiscal 2018 compared to fiscal 2017 and fiscal 2017 compared to fiscal 2016, we may qualitatively disclose the impact of our acquired products and services (for the one-year period subsequent to the acquisition date) to the growth in certain of our businesses’ revenues where such qualitative discussions would be meaningful for an understanding of the factors that influenced the changes in our results of operations. When material, we may also provide quantitative disclosures related to such acquired products and services. Expense contributions from our recent acquisitions for each of the respective period comparisons may not be separately identifiable due to the integration of these businesses into our existing operations, and/or were insignificant to our results of operations during the periods presented.
We caution readers that, while pre- and post-acquisition comparisons, as well as any quantified amounts themselves, may provide indications of general trends, any acquisition information that we provide has inherent limitations for the following reasons:
| • | any qualitative and quantitative disclosures cannot specifically address or quantify the substantial effects attributable to changes in business strategies, including our sales force integration efforts. We believe that if our acquired companies had operated independently and sales forces had not been integrated, the relative mix of products and services sold would have been different; and |
46
Table of Contents
Index to Financial Statements
| • | the amounts shown as cloud services and license support deferred revenues and hardware deferred revenues in our “Supplemental Disclosure Related to Certain Charges” (presented below) are not necessarily indicative of revenue improvements we will achieve upon contract renewals to the extent customers do not renew. |
Presentation of Operating Segment Results and Other Financial Information
In our results of operations discussion below, we provide an overview of our total consolidated revenues, total consolidated expenses and total consolidated operating margin, all of which are presented on a GAAP basis. We also present a GAAP-based discussion below for substantially all of the other expense items as presented in our consolidated statement of operations that are not directly attributable to our three businesses.
In addition, we discuss below the results of each our three businesses—cloud and license, hardware and services—which are our operating segments as defined pursuant to ASC 280, Segment Reporting. The financial reporting for our three businesses that is presented below is presented in a manner that is consistent with that used by our CODMs. Our operating segment presentation below reflects revenues, direct costs and sales and marketing expenses that correspond to and are directly attributable to each of our three businesses. We also utilize these inputs to calculate and present a segment margin for each business in the discussion below.
Consistent with our internal management reporting processes, the below operating segment presentation includes revenues adjustments related to cloud services and license support contracts and hardware contracts that would have otherwise been recorded by the acquired businesses as independent entities but were not recognized in our consolidated statements of operations for the periods presented due to business combination accounting requirements. Refer to “Supplemental Disclosure Related to Certain Charges” below for additional discussion of these items and Note 15 of Notes to Consolidated Financial Statements included elsewhere in this Annual Report for a reconciliation of the summations of our total operating segment revenues as presented in the discussion below to total revenues as presented per our consolidated statements of operations for all periods presented.
In addition, research and development expenses, general and administrative expenses, stock-based compensation expenses, amortization of intangible assets, certain other expense allocations, acquisition related and other expenses, restructuring expenses, interest expense, non-operating income, net and provision for income taxes are not attributed to our three operating segments because our management does not view the performance of our three businesses including such items and/or it is impractical to do so. Refer to “Supplemental Disclosure Related to Certain Charges” below for additional discussion of certain of these items and Note 15 of Notes to Consolidated Financial Statements included elsewhere in this Annual Report for a reconciliation of the summations of total segment margin as presented in the discussion below to total income before provision of income taxes as presented per our consolidated statements of operations for all periods presented.
Constant Currency Presentation
Our international operations have provided and are expected to continue to provide a significant portion of each of our businesses’ revenues and expenses. As a result, each businesses’ revenues and expenses and our total revenues and expenses will continue to be affected by changes in the U.S. Dollar against major international currencies. In order to provide a framework for assessing how our underlying businesses performed excluding the effects of foreign currency rate fluctuations, we compare the percent change in the results from one period to another period in this Annual Report using constant currency disclosure. To present this information, current and comparative prior period results for entities reporting in currencies other than U.S. Dollars are converted into U.S. Dollars at constant exchange rates (i.e., the rates in effect on May 31, 2017, which was the last day of our prior fiscal year) rather than the actual exchange rates in effect during the respective periods. For example, if an entity reporting in Euros had revenues of 1.0 million Euros from products sold on May 31, 2018 and 2017, our financial statements would reflect reported revenues of $1.16 million in fiscal 2018 (using 1.16 as the month-end average exchange rate for the period) and $1.11 million in fiscal 2017 (using 1.11 as the month-end average exchange rate for the period). The constant currency presentation,
47
Table of Contents
Index to Financial Statements
however, would translate the fiscal 2018 results using the fiscal 2017 exchange rate and indicate, in this example, no change in revenues during the period. In each of the tables below, we present the percent change based on actual, unrounded results in reported currency and in constant currency.
Total Revenues and Operating Expenses
| Year Ended May 31, | ||||||||||||||||||||||||||||
| Percent Change | Percent Change | |||||||||||||||||||||||||||
| (Dollars in millions) |
2018 | Actual | Constant | 2017 | Actual | Constant | 2016 | |||||||||||||||||||||
| Total Revenues by Geography: |
||||||||||||||||||||||||||||
| Americas |
$ | 22,088 | 5% | 5% | $ | 21,038 | 3% | 3% | $ | 20,466 | ||||||||||||||||||
| EMEA(1) |
11,410 | 7% | 1% | 10,630 | -2% | 2% | 10,881 | |||||||||||||||||||||
| Asia Pacific(2) |
6,333 | 4% | 3% | 6,060 | 6% | 4% | 5,700 | |||||||||||||||||||||
|
|
|
|
|
|
|
|||||||||||||||||||||||
| Total revenues |
39,831 | 6% | 3% | 37,728 | 2% | 3% | 37,047 | |||||||||||||||||||||
| Total Operating Expenses |
26,152 | 5% | 3% | 25,018 | 2% | 3% | 24,443 | |||||||||||||||||||||
|
|
|
|
|
|
|
|||||||||||||||||||||||
| Total Operating Margin |
$ | 13,679 | 8% | 5% | $ | 12,710 | 1% | 2% | $ | 12,604 | ||||||||||||||||||
|
|
|
|
|
|
|
|||||||||||||||||||||||
| Total Operating Margin % |
34% | 34% | 34% | |||||||||||||||||||||||||
| % Revenues by Geography: |
||||||||||||||||||||||||||||
| Americas |
55% | 56% | 55% | |||||||||||||||||||||||||
| EMEA |
29% | 28% | 29% | |||||||||||||||||||||||||
| Asia Pacific |
16% | 16% | 16% | |||||||||||||||||||||||||
| Total Revenues by Business: |
||||||||||||||||||||||||||||
| Cloud and license |
$ | 32,444 | 7% | 5% | $ | 30,218 | 4% | 5% | $ | 28,990 | ||||||||||||||||||
| Hardware |
3,993 | -4% | -6% | 4,152 | -11% | -10% | 4,668 | |||||||||||||||||||||
| Services |
3,394 | 1% | -1% | 3,358 | -1% | 1% | 3,389 | |||||||||||||||||||||
|
|
|
|
|
|
|
|||||||||||||||||||||||
| Total revenues |
$ | 39,831 | 6% | 3% | $ | 37,728 | 2% | 3% | $ | 37,047 | ||||||||||||||||||
|
|
|
|
|
|
|
|||||||||||||||||||||||
| % Revenues by Business: |
||||||||||||||||||||||||||||
| Cloud and license |
82% | 80% | 78% | |||||||||||||||||||||||||
| Hardware |
10% | 11% | 13% | |||||||||||||||||||||||||
| Services |
8% | 9% | 9% | |||||||||||||||||||||||||
| (1) | Comprised of Europe, the Middle East and Africa |
| (2) | The Asia Pacific region includes Japan |
Fiscal 2018 Compared to Fiscal 2017: Excluding the effects of currency rate fluctuations, our total revenues increased in fiscal 2018 primarily due to growth in our cloud and license revenues, partially offset by decreases in our hardware revenues and services revenues. The constant currency increase in our cloud and license revenues during fiscal 2018 was attributable to growth in our cloud services and license support revenues as customers purchased our applications, platform and infrastructure technologies via cloud and license deployment models and renewed their related contracts to continue to gain access to our latest technology and support services. To a lesser extent, our cloud and license revenues also increased due to revenue contributions from our recent acquisitions. The constant currency decrease in our hardware revenues during fiscal 2018 was due to the reduction in our hardware products revenues and hardware support revenues primarily due to the emphasis we placed on the marketing and sale of our cloud and license technologies. The constant currency decrease in our services revenues during fiscal 2018 was attributable to declines in our education and advanced customer support services revenues. In constant currency, the Americas, EMEA and Asia Pacific regions contributed 78%, 10% and 12%, respectively, to the growth in our fiscal 2018 total revenues.
Excluding the effects of currency rate fluctuations, our total operating expenses increased during fiscal 2018 primarily due to higher cloud services and license support expenses resulting primarily from increased headcount and infrastructure expenses to support the increases in our revenues; higher sales and marketing expenses related to our cloud and license business; increased stock-based compensation expenses; higher general and administrative expenses; increased restructuring expenses; and higher intangible asset amortization. These constant currency expense increases were partially offset by certain expense decreases in fiscal 2018, which primarily consisted of lower research and development expenses primarily related to lower
48
Table of Contents
Index to Financial Statements
employee expenses; and lower hardware products costs and a related decrease in hardware sales and marketing costs, both of which aligned to lower hardware revenues.
In constant currency, our total operating margin increased during fiscal 2018 primarily due to the increase in revenues and total operating margin as a percentage of total revenues remained flat.
Fiscal 2017 Compared to Fiscal 2016: Excluding the effects of foreign currency rate variations, our total revenues increased in fiscal 2017 due to growth in our cloud and license revenues and our services revenues, partially offset by a decrease in our hardware revenues. The constant currency increases in our cloud and license revenues during fiscal 2017 and constant currency decreases in our hardware revenues during fiscal 2017 were primarily attributable to similar reasons as noted above for the fiscal 2018 changes of each. The constant currency services revenues increase during fiscal 2017 was primarily attributable to certain acquisitions. In constant currency, the Americas region contributed 54%, the EMEA region contributed 24% and the Asia Pacific region contributed 22% to the growth in our total revenues during fiscal 2017.
Excluding the effects of foreign currency rate variations, our total operating expenses increased during fiscal 2017 relative to the prior year period due to higher sales and marketing and research and development expenses, which were primarily attributable to increased headcount and increased stock-based compensation expenses; and higher cloud services and license support expenses resulting primarily from increased headcount and infrastructure expenses to support the increase in our revenues. These constant currency expense increases were partially offset by certain expense decreases in fiscal 2017, primarily lower hardware expenses due to similar reasons noted for the fiscal 2018 decrease above and lower intangible asset amortization in fiscal 2017 due to certain of our intangible assets that became fully amortized.
In constant currency, our total operating margin increased in fiscal 2017 due to the increase in our total revenues while total operating margin as a percentage of revenues was flat.
Supplemental Disclosure Related to Certain Charges
To supplement our consolidated financial information, we believe that the following information is helpful to an overall understanding of our past financial performance and prospects for the future. You should review the introduction under “Impact of Acquisitions” (above) for a discussion of the inherent limitations in comparing pre- and post-acquisition information.
Our operating results reported pursuant to GAAP included the following business combination accounting adjustments and expenses related to acquisitions and certain other expense and income items that affected our GAAP net income:
| Year Ended May 31, | ||||||||||||
| (in millions) |
2018 | 2017 | 2016 | |||||||||
| Cloud services and license support deferred revenues(1) |
$ | 47 | $ | 171 | $ | 9 | ||||||
| Hardware deferred revenues(1) |
— | — | 1 | |||||||||
| Acquired deferred sales commissions amortization(2) |
(22 | ) | (46 | ) | — | |||||||
| Amortization of intangible assets(3) |
1,620 | 1,451 | 1,638 | |||||||||
| Acquisition related and other(4)(6) |
52 | 103 | 42 | |||||||||
| Restructuring(5) |
588 | 463 | 458 | |||||||||
| Stock-based compensation, operating segments(6) |
505 | 415 | 305 | |||||||||
| Stock-based compensation, R&D and G&A(6) |
1,101 | 900 | 729 | |||||||||
| Income tax effects(7) |
(1,433 | ) | (1,233 | ) | (846 | ) | ||||||
| Income tax reform(8) |
6,961 | — | — | |||||||||
|
|
|
|
|
|
|
|||||||
| $ | 9,419 | $ | 2,224 | $ | 2,336 | |||||||
|
|
|
|
|
|
|
|||||||
| (1) | In connection with our acquisitions, we have estimated the fair values of the cloud services and license support contracts and hardware contracts assumed. Due to our application of business combination accounting rules, we did not recognize the cloud services and license support revenue amounts and hardware revenue amounts as presented in the above table that would have otherwise been recorded by the acquired businesses as independent entities upon delivery of the contractual obligations. To the extent customers for which these contractual obligations pertain renew these contracts with us, we expect to recognize revenues for the full contracts’ values over the respective contracts’ renewal periods. |
49
Table of Contents
Index to Financial Statements
| (2) | Certain acquired companies capitalized sales commissions associated with subscription agreements and amortized these amounts over the related contractual terms. Business combination accounting rules generally require us to eliminate these acquired capitalized sales commissions balances as of the acquisition date and our post-combination GAAP sales and marketing expenses generally do not reflect the amortization of these acquired deferred sales commissions balances. This adjustment is intended to include, and thus reflect, the full amount of amortization related to such balances as though the acquired companies operated independently in the periods presented. |
| (3) | Represents the amortization of intangible assets, substantially all of which were acquired in connection with our acquisitions. As of May 31, 2018, estimated future amortization related to intangible assets was as follows (in millions): |
| Fiscal 2019 |
$ | 1,605 | ||
| Fiscal 2020 |
1,400 | |||
| Fiscal 2021 |
1,174 | |||
| Fiscal 2022 |
966 | |||
| Fiscal 2023 |
613 | |||
| Thereafter |
912 | |||
|
|
|
|||
| Total intangible assets, net |
$ | 6,670 | ||
|
|
|
| (4) | Acquisition related and other expenses primarily consist of personnel related costs and stock-based compensation expenses for transitional and certain other employees, integration related professional services, certain business combination adjustments including certain adjustments after the measurement period has ended and certain other operating items, net. |
| (5) | Restructuring expenses during fiscal 2018 and 2017 primarily related to employee severance in connection with our Fiscal 2017 Oracle Restructuring Plan (2017 Restructuring Plan). Restructuring expenses during fiscal 2016 primarily related to costs incurred pursuant to our Fiscal 2015 Restructuring Plan (2015 Restructuring Plan) and our Fiscal 2013 Oracle Restructuring Plan (2013 Restructuring Plan). Additional information regarding certain of our restructuring plans is provided in the discussion below under “Restructuring Expenses” and in Note 8 of Notes to Consolidated Financial Statements included elsewhere in this Annual Report. |
| (6) | Stock-based compensation was included in the following operating expense line items of our consolidated statements of operations (in millions): |
| Year Ended May 31, | ||||||||||||
| 2018 | 2017 | 2016 | ||||||||||
| Cloud services and license support |
$ | 82 | $ | 54 | $ | 44 | ||||||
| Hardware |
10 | 11 | 12 | |||||||||
| Services |
52 | 44 | 29 | |||||||||
| Sales and marketing |
361 | 306 | 220 | |||||||||
|
|
|
|
|
|
|
|||||||
| Stock-based compensation, operating segments |
505 | 415 | 305 | |||||||||
| Research and development |
921 | 770 | 609 | |||||||||
| General and administrative |
180 | 130 | 120 | |||||||||
| Acquisition related and other |
1 | 35 | 3 | |||||||||
|
|
|
|
|
|
|
|||||||
| Total stock-based compensation |
$ | 1,607 | $ | 1,350 | $ | 1,037 | ||||||
|
|
|
|
|
|
|
|||||||
| Stock-based compensation included in acquisition related and other expenses resulted from unvested stock options and restricted stock-based awards assumed from acquisitions whose vesting was accelerated generally upon termination of the employees pursuant to the terms of those stock options and restricted stock-based awards. |
| (7) | For fiscal 2018, the applicable jurisdictional tax rates applied to our income before provision for income taxes after adjusting for the effects of the items within the table above, excluding income tax reform (see footnote (8) below), resulted in an effective tax rate of 21.1%, which represented our effective tax rate as derived per our consolidated statements of operations, primarily due to the exclusion of stock-based compensation expense and acquisition related items, including the tax effects of amortization of intangible assets. The income tax effects presented for fiscal 2017 and 2016 were calculated reflecting effective tax rates of 22.8% and 23.2%, respectively, which represented our effective tax rates as derived per our consolidated statements of operations, primarily due to the net tax effects of acquisition related items, including the tax effects of amortization of intangible assets, and the net tax effects of stock-based compensation. |
| (8) | The income tax reform adjustments for fiscal 2018 presented in the table above were due to the our enactment of the Tax Act (refer to “Impacts of the U.S. Tax Cuts and Jobs Act of 2017” above for additional discussion), which increased our GAAP provision for income taxes during fiscal 2018. |
Cloud and License Business
Our cloud and license business engages in the sale, marketing and delivery of our applications, platform and infrastructure technologies through various deployment models including license support offerings; Oracle
50
Table of Contents
Index to Financial Statements
Cloud Services offerings; and cloud license and on-premise license offerings. License support revenues are typically generated through the sale of license support contracts related to cloud license and on-premise licenses purchased by our customers at their option and are generally recognized as revenues ratably over the contractual term. Our Oracle Cloud Services offerings deliver certain of our applications, platform and infrastructure technologies on a subscription basis via cloud-based deployment models that we host, manage and support, and revenues are generally recognized over the subscription period. Cloud license and on-premise license revenues represent fees earned from granting customers licenses, generally on a perpetual basis, to use our database and middleware and our applications software products within cloud and on-premise IT environments and are generally recognized as revenues when unrestricted access to the license is granted, provided all other revenue recognition criteria are met. We continue to place significant emphasis, both domestically and internationally, on direct sales through our own sales force. We also continue to market our offerings through indirect channels. Costs associated with our cloud and license business are included in cloud services and license support expenses, and sales and marketing expenses. These costs are largely personnel and infrastructure related including the cost of providing our cloud services and license support offerings, salaries and commissions earned by our sales force for the sale of our cloud and license offerings, and marketing program costs.
| Year Ended May 31, | ||||||||||||||||||||||||||||
| Percent Change | Percent Change | |||||||||||||||||||||||||||
| (Dollars in millions) |
2018 | Actual | Constant | 2017 | Actual | Constant | 2016 | |||||||||||||||||||||
| Cloud and License Revenues: |
||||||||||||||||||||||||||||
| Americas(1) |
$ | 18,472 | 6% | 6% | $ | 17,395 | 6% | 6% | $ | 16,344 | ||||||||||||||||||
| EMEA(1) |
9,164 | 9% | 3% | 8,422 | -1% | 4% | 8,475 | |||||||||||||||||||||
| Asia Pacific(1) |
4,855 | 6% | 4% | 4,572 | 9% | 7% | 4,178 | |||||||||||||||||||||
|
|
|
|
|
|
|
|||||||||||||||||||||||
| Total revenues(1) |
32,491 | 7% | 5% | 30,389 | 5% | 6% | 28,997 | |||||||||||||||||||||
| Expenses: |
||||||||||||||||||||||||||||
| Cloud services and license support(2) |
3,447 | 20% | 18% | 2,885 | 13% | 15% | 2,545 | |||||||||||||||||||||
| Sales and marketing(2) |
7,219 | 5% | 3% | 6,886 | 5% | 6% | 6,570 | |||||||||||||||||||||
|
|
|
|
|
|
|
|||||||||||||||||||||||
| Total expenses(2) |
10,666 | 9% | 7% | 9,771 | 7% | 8% | 9,115 | |||||||||||||||||||||
|
|
|
|
|
|
|
|||||||||||||||||||||||
| Total Margin |
$ | 21,825 | 6% | 4% | $ | 20,618 | 4% | 5% | $ | 19,882 | ||||||||||||||||||
|
|
|
|
|
|
|
|||||||||||||||||||||||
| Total Margin % |
67% | 68% | 69% | |||||||||||||||||||||||||
| % Revenues by Geography: |
||||||||||||||||||||||||||||
| Americas |
57% | 57% | 56% | |||||||||||||||||||||||||
| EMEA |
28% | 28% | 29% | |||||||||||||||||||||||||
| Asia Pacific |
15% | 15% | 15% | |||||||||||||||||||||||||
| Revenues by Offerings: |
||||||||||||||||||||||||||||
| Cloud services and license support(1) |
$ | 26,301 | 10% | 7% | $ | 23,971 | 10% | 11% | $ | 21,721 | ||||||||||||||||||
| Cloud license and on-premise license |
6,190 | -4% | -5% | 6,418 | -12% | -11% | 7,276 | |||||||||||||||||||||
|
|
|
|
|
|
|
|||||||||||||||||||||||
| Total revenues(1) |
$ | 32,491 | 7% | 5% | $ | 30,389 | 5% | 6% | $ | 28,997 | ||||||||||||||||||
|
|
|
|
|
|
|
|||||||||||||||||||||||
| Revenues by Ecosystem: |
||||||||||||||||||||||||||||
| Applications revenues(1) |
$ | 11,113 | 10% | 8% | $ | 10,098 | 8% | 9% | $ | 9,353 | ||||||||||||||||||
| Platform and infrastructure revenues(1) |
21,378 | 5% | 3% | 20,291 | 3% | 4% | 19,644 | |||||||||||||||||||||
|
|
|
|
|
|
|
|||||||||||||||||||||||
| Total revenues(1) |
$ | 32,491 | 7% | 5% | $ | 30,389 | 5% | 6% | $ | 28,997 | ||||||||||||||||||
|
|
|
|
|
|
|
|||||||||||||||||||||||
| (1) | Includes cloud services and license support revenue adjustments related to certain cloud services and license support contracts that would have otherwise been recorded as revenues by the acquired businesses as independent entities but were not recognized in our GAAP-based consolidated statements of operations for the periods presented due to business combination accounting requirements. Such revenue adjustments were included in our operating segment results for purposes of reporting to and review by our CODMs. See “Presentation of Operating Segment Results and Other Financial Information” above for additional information. |
| (2) | Excludes stock-based compensation and certain expense allocations. Also excludes amortization of intangible assets and certain other GAAP-based expenses, which were not allocated to our operating segment results for purposes of reporting to and review by our CODMs, as further described under “Presentation of Operating Segment Results and Other Financial Information” above. |
Fiscal 2018 Compared to Fiscal 2017: Excluding the effects of currency rate fluctuations, total revenues from our cloud and license business increased in fiscal 2018 due to growth in our cloud services and license support revenues and revenue contributions from our recent acquisitions. The increases in our constant currency cloud
51
Table of Contents
Index to Financial Statements
services and license support revenues during fiscal 2018 were primarily due to the purchase and renewal of our cloud-based services and license support services, and due to contributions from our recent acquisitions. These revenues increases were partially offset by decreases in our cloud license and on-premise license revenues during fiscal 2018. In constant currency, our total applications revenues and total platform and infrastructure revenues grew during fiscal 2018 as customers continued to deploy our applications, platform and infrastructure technologies through a wide array of different deployment models that we offer that enable customer choice. In constant currency, the Americas region contributed 71%, the EMEA region contributed 15% and Asia Pacific region contributed 14% of the constant currency revenues growth for this business during fiscal 2018.
In constant currency, total cloud and license expenses increased in fiscal 2018 primarily due to higher cloud services and license support expenses and higher sales and marketing expenses, both of which increased primarily due to higher employee related expenses from higher headcount. In addition, our constant currency cloud services and license support expenses increased during fiscal 2018 due to higher technology infrastructure expenses that supported the growth in our revenues.
Excluding the effects of currency rate fluctuations, our cloud and license segment’s total margin increased during fiscal 2018 primarily due to the increase in revenues for this segment while total margin as a percentage of revenues decreased slightly due to expenses growth for this segment.
Fiscal 2017 Compared to Fiscal 2016: Excluding the effects of currency rate fluctuations, total revenues, total expenses and total margin from our cloud and license business each increased in fiscal 2017 relative to fiscal 2016 due to similar reasons as noted above for the increases in fiscal 2018 relative to fiscal 2017. During fiscal 2017, the Americas, EMEA and Asia Pacific regions contributed 63%, 20% and 17%, respectively, of the constant currency revenues growth for this business.
Excluding the effects of currency rate fluctuations, our cloud and license business’ total margin as a percentage of revenues decreased in fiscal 2017 as our total expenses grew at a faster rate than our total revenues for this business.
52
Table of Contents
Index to Financial Statements
Hardware Business
Our hardware business’ revenues are generated from the sales of our Oracle Engineered Systems, server, storage, and industry-specific hardware products that are generally recognized as revenues upon delivery to the customer, provided all other revenue recognition criteria are met. Our hardware business also earns revenues from the sale of hardware support contracts purchased by our customers at their option and are generally recognized as revenues ratably as the hardware support services are delivered over the contractual term. The majority of our hardware products are sold through indirect channels such as independent distributors and value-added resellers and we also market and sell our hardware products through our direct sales force. Operating expenses associated with our hardware business include the cost of hardware products, which consists of expenses for materials and labor used to produce these products by our internal manufacturing operations or by third-party manufacturers, warranty expenses and the impact of periodic changes in inventory valuation, including the impact of inventory determined to be excess and obsolete; the cost of materials used to repair customer products; the cost of labor and infrastructure to provide support services; and sales and marketing expenses, which are largely personnel related and include variable compensation earned by our sales force for the sales of our hardware offerings.
| Year Ended May 31, | ||||||||||||||||||||||||||||
| Percent Change | Percent Change | |||||||||||||||||||||||||||
| (Dollars in millions) |
2018 | Actual | Constant | 2017 | Actual | Constant | 2016 | |||||||||||||||||||||
| Hardware Revenues: |
||||||||||||||||||||||||||||
| Americas(1) |
$ | 2,001 | -4% | -4% | $ | 2,089 | -13% | -13% | $ | 2,405 | ||||||||||||||||||
| EMEA(1) |
1,201 | -2% | -7% | 1,221 | -11% | -7% | 1,377 | |||||||||||||||||||||
| Asia Pacific(1) |
791 | -6% | -9% | 842 | -5% | -6% | 887 | |||||||||||||||||||||
|
|
|
|
|
|
|
|||||||||||||||||||||||
| Total revenues(1) |
3,993 | -4% | -6% | 4,152 | -11% | -10% | 4,669 | |||||||||||||||||||||
| Expenses: |
||||||||||||||||||||||||||||
| Hardware products and support(2) |
1,551 | -4% | -7% | 1,623 | -20% | -19% | 2,031 | |||||||||||||||||||||
| Sales and marketing(2) |
635 | -23% | -25% | 820 | -5% | -4% | 867 | |||||||||||||||||||||
|
|
|
|
|
|
|
|||||||||||||||||||||||
| Total expenses(2) |
2,186 | -11% | -13% | 2,443 | -16% | -15% | 2,898 | |||||||||||||||||||||
|
|
|
|
|
|
|
|||||||||||||||||||||||
| Total Margin |
$ | 1,807 | 6% | 4% | $ | 1,709 | -4% | -2% | $ | 1,771 | ||||||||||||||||||
|
|
|
|
|
|
|
|||||||||||||||||||||||
| Total Margin % |
45% | 41% | 38% | |||||||||||||||||||||||||
| % Revenues by Geography: |
||||||||||||||||||||||||||||
| Americas |
50% | 51% | 52% | |||||||||||||||||||||||||
| EMEA |
30% | 29% | 29% | |||||||||||||||||||||||||
| Asia Pacific |
20% | 20% | 19% | |||||||||||||||||||||||||
| (1) | Includes hardware revenue adjustments related to certain hardware contracts that would have otherwise been recorded as revenues by the acquired businesses as independent entities but were not recognized in our GAAP-based consolidated statements of operations for the periods presented due to business combination accounting requirements. Such revenue adjustments were included in our operating segment results for purposes of reporting to and review by our CODMs. See “Presentation of Operating Segment Results and Other Financial Information” above for additional information. |
| (2) | Excludes stock-based compensation and certain expense allocations. Also excludes amortization of intangible assets and certain other GAAP-based expenses, which were not allocated to our operating segment results for purposes of reporting to and review by our CODMs, as further described under “Presentation of Operating Segments and Other Financial Information” above. |
Excluding the effects of currency rate fluctuations, total hardware revenues decreased in fiscal 2018 and 2017, each relative to the corresponding prior year period, due to lower hardware products revenues and, to a lesser extent, lower hardware support revenues. The decreases in hardware products revenues in both fiscal 2018 and 2017, each relative to the corresponding prior year period, were primarily attributable to our continued emphasis on the marketing and sale of our cloud-based infrastructure technologies, which resulted in reduced sales volumes of certain of our hardware product lines and also impacted the volume of customers that purchased hardware support contracts.
Excluding the effects of currency rate fluctuations, total hardware expenses decreased in fiscal 2018 and 2017, each relative to the corresponding prior year period, primarily due to lower hardware products costs and lower employee related expenses, which aligned to lower hardware revenues.
53
Table of Contents
Index to Financial Statements
In constant currency, total margin and total margin as percentage of revenues for our hardware segment increased during fiscal 2018 and 2017, each relative to the corresponding prior year period, due to expense decreases in each of these periods.
Services Business
We offer services to customers and partners to help to maximize the performance of their investments in Oracle applications, platform and infrastructure technologies. Services revenues are generally recognized as the services are performed. The cost of providing our services consists primarily of personnel related expenses, technology infrastructure expenditures, facilities expenses and external contractor expenses.
| Year Ended May 31, | ||||||||||||||||||||||||||||
| Percent Change | Percent Change | |||||||||||||||||||||||||||
| (Dollars in millions) |
2018 | Actual | Constant | 2017 | Actual | Constant | 2016 | |||||||||||||||||||||
| Services Revenues: |
||||||||||||||||||||||||||||
| Americas |
$ | 1,653 | -4% | -4% | $ | 1,725 | 0% | 0% | $ | 1,728 | ||||||||||||||||||
| EMEA |
1,046 | 6% | 0% | 987 | -4% | 2% | 1,028 | |||||||||||||||||||||
| Asia Pacific |
695 | 7% | 5% | 646 | 2% | 0% | 635 | |||||||||||||||||||||
|
|
|
|
|
|
|
|||||||||||||||||||||||
| Total revenues |
3,394 | 1% | -1% | 3,358 | -1% | 0% | 3,391 | |||||||||||||||||||||
| Total Expenses(1) |
2,739 | 3% | 0% | 2,668 | 1% | 3% | 2,634 | |||||||||||||||||||||
|
|
|
|
|
|
|
|||||||||||||||||||||||
| Total Margin |
$ | 655 | -5% | -6% | $ | 690 | -9% | -7% | $ | 757 | ||||||||||||||||||
|
|
|
|
|
|
|
|||||||||||||||||||||||
| Total Margin % |
19% | 21% | 22% | |||||||||||||||||||||||||
| % Revenues by Geography: |
||||||||||||||||||||||||||||
| Americas |
49% | 51% | 51% | |||||||||||||||||||||||||
| EMEA |
31% | 30% | 30% | |||||||||||||||||||||||||
| Asia Pacific |
20% | 19% | 19% | |||||||||||||||||||||||||
| (1) | Excludes stock-based compensation and certain expense allocations. Also excludes amortization of intangible assets and certain other GAAP-based expenses, which were not allocated to our operating segment results for purposes of reporting to and review by our CODMs, as further described under “Presentation of Operating Segments and Other Financial Information” above. |
Fiscal 2018 Compared to Fiscal 2017: Excluding the effects of currency rate fluctuations, our total services revenues decreased during fiscal 2018 due primarily to revenue declines in our advanced customer services and education revenues. Constant currency decreases in our services revenues in the Americas region were partially offset by a constant currency services revenues increase in the Asia Pacific region, while services revenues in the EMEA region were flat.
In constant currency, total services expenses were flat during fiscal 2018. Total margin and total margin as a percentage of total services revenues decreased in fiscal 2018 due to the revenue decreases for this segment.
Fiscal 2017 Compared to Fiscal 2016: Excluding the effects of currency rate fluctuations, our total services revenues were flat in fiscal 2017. Constant currency increases in our consulting revenues during fiscal 2017, which were primarily attributable to our recent acquisitions, were substantially offset by constant currency decreases in our education revenues. On a constant currency basis, modest services revenues growth in the EMEA region during fiscal 2017 was offset by services revenues declines in the Asia Pacific region, while the Americas region was flat.
In constant currency, total services margin and total margin as a percentage of total services revenues decreased and total services expenses increased during fiscal 2017, primarily due to an increase in expenses associated with our consulting offerings, primarily higher consulting expense contributions from our recent acquisitions.
54
Table of Contents
Index to Financial Statements
Research and Development Expenses: Research and development expenses consist primarily of personnel related expenditures. We intend to continue to invest significantly in our research and development efforts because, in our judgment, they are essential to maintaining our competitive position.
| Year Ended May 31, | ||||||||||||||||||||||||||||
| Percent Change | Percent Change | |||||||||||||||||||||||||||
| (Dollars in millions) |
2018 | Actual | Constant | 2017 | Actual | Constant | 2016 | |||||||||||||||||||||
| Research and development(1) |
$ | 5,170 | -4% | -5% | $ | 5,389 | 4% | 5% | $ | 5,178 | ||||||||||||||||||
| Stock-based compensation |
921 | 20% | 20% | 770 | 26% | 26% | 609 | |||||||||||||||||||||
|
|
|
|
|
|
|
|||||||||||||||||||||||
| Total expenses |
$ | 6,091 | -1% | -2% | $ | 6,159 | 6% | 7% | $ | 5,787 | ||||||||||||||||||
|
|
|
|
|
|
|
|||||||||||||||||||||||
| % of Total Revenues |
15% | 16% | 16% | |||||||||||||||||||||||||
| (1) | Excluding stock-based compensation |
Fiscal 2018 Compared to Fiscal 2017: On a constant currency basis, total research and development expenses decreased during fiscal 2018, primarily due to lower fiscal 2018 employee related expenses related to lower headcount resulting from the restructuring of certain of our research and development operations during fiscal 2018. These fiscal 2018 cost savings were partially offset by investments in the development of our cloud-based offerings and by higher stock-based compensation during fiscal 2018.
Fiscal 2017 Compared to Fiscal 2016: On a constant currency basis, total research and development expenses increased in fiscal 2017, primarily due to increased employee related expenses and higher stock-based compensation.
General and Administrative Expenses: General and administrative expenses primarily consist of personnel related expenditures for IT, finance, legal and human resources support functions.
| Year Ended May 31, | ||||||||||||||||||||||||||||
| Percent Change | Percent Change | |||||||||||||||||||||||||||
| (Dollars in millions) |
2018 | Actual | Constant | 2017 | Actual | Constant | 2016 | |||||||||||||||||||||
| General and administrative(1) |
$ | 1,109 | 6% | 4% | $ | 1,046 | 1% | 3% | $ | 1,035 | ||||||||||||||||||
| Stock-based compensation |
180 | 38% | 38% | 130 | 9% | 9% | 120 | |||||||||||||||||||||
|
|
|
|
|
|
|
|||||||||||||||||||||||
| Total expenses |
$ | 1,289 | 10% | 8% | $ | 1,176 | 2% | 3% | $ | 1,155 | ||||||||||||||||||
|
|
|
|
|
|
|
|||||||||||||||||||||||
| % of Total Revenues |
3% | 3% | 3% | |||||||||||||||||||||||||
| (1) | Excluding stock-based compensation |
Fiscal 2018 Compared to Fiscal 2017: Excluding the effects of currency rate fluctuations, total general and administrative expenses increased in fiscal 2018 due to increased employee related expenses from increased headcount and higher stock-based compensation.
Fiscal 2017 Compared to Fiscal 2016: Excluding the effects of currency rate fluctuations, total general and administrative expenses increased in fiscal 2017 primarily due to similar reasons noted above, which were partially offset by lower professional services expenses that were primarily legal related.
55
Table of Contents
Index to Financial Statements
Acquisition Related and Other Expenses: Acquisition related and other expenses consist of personnel related costs and stock-based compensation for transitional and certain other employees, integration related professional services, and certain business combination adjustments including certain adjustments after the measurement period has ended and certain other operating items, net. Stock-based compensation expenses included in acquisition related and other expenses resulted from unvested restricted stock-based awards and stock options assumed from acquisitions whereby vesting was accelerated generally upon termination of the employees pursuant to the original terms of those restricted stock-based awards and stock options.
| Year Ended May 31, | ||||||||||||||||||||||||||||
| Percent Change | Percent Change | |||||||||||||||||||||||||||
| (Dollars in millions) |
2018 | Actual | Constant | 2017 | Actual | Constant | 2016 | |||||||||||||||||||||
| Transitional and other employee related costs |
$ | 48 | 15% | 13% | $ | 41 | -10% | -8% | $ | 45 | ||||||||||||||||||
| Stock-based compensation |
1 | -98% | -98% | 35 | 1,046% | 1,046% | 3 | |||||||||||||||||||||
| Professional fees and other, net |
3 | -90% | -90% | 33 | 238% | 243% | 10 | |||||||||||||||||||||
| Business combination adjustments, net |
— | 100% | 100% | (6 | ) | 62% | 56% | (16 | ) | |||||||||||||||||||
|
|
|
|
|
|
|
|||||||||||||||||||||||
| Total acquisition related and other expenses |
$ | 52 | -50% | -50% | $ | 103 | 145% | 147% | $ | 42 | ||||||||||||||||||
|
|
|
|
|
|
|
|||||||||||||||||||||||
Fiscal 2018 Compared to Fiscal 2017: On a constant currency basis, acquisition related and other expenses decreased in fiscal 2018 primarily due to lower stock-based compensation expenses and were also offset by certain benefits we recorded to professional fees and other, net during fiscal 2018.
Fiscal 2017 Compared to Fiscal 2016: On a constant currency basis, acquisition related and other expenses increased in fiscal 2017 primarily due to higher stock-based compensation expenses as a result of our acquisition of NetSuite and higher professional fees. In addition, we recognized an acquisition related benefit of $19 million in fiscal 2016, which decreased acquisition related and other expenses during this period.
Amortization of Intangible Assets: Substantially all of our intangible assets were acquired through our business combinations. We amortize our intangible assets over, and monitor the appropriateness of, the estimated useful lives of these assets. We also periodically review these intangible assets for potential impairment based upon relevant facts and circumstances. Note 6 of Notes to Consolidated Financial Statements included elsewhere in this Annual Report has additional information regarding our intangible assets and related amortization.
| Year Ended May 31, | ||||||||||||||||||||||||||||
| Percent Change | Percent Change | |||||||||||||||||||||||||||
| (Dollars in millions) |
2018 | Actual | Constant | 2017 | Actual | Constant | 2016 | |||||||||||||||||||||
| Developed technology |
$ | 758 | 15% | 15% | $ | 660 | 18% | 18% | $ | 559 | ||||||||||||||||||
| Cloud services and license support agreements and related relationships |
731 | 40% | 40% | 524 | -14% | -14% | 606 | |||||||||||||||||||||
| Other |
131 | -51% | -51% | 267 | -44% | -44% | 473 | |||||||||||||||||||||
|
|
|
|
|
|
|
|||||||||||||||||||||||
| Total amortization of intangible assets |
$ | 1,620 | 12% | 12% | $ | 1,451 | -11% | -11% | $ | 1,638 | ||||||||||||||||||
|
|
|
|
|
|
|
|||||||||||||||||||||||
Fiscal 2018 Compared to Fiscal 2017: Amortization of intangible assets increased in fiscal 2018 due to additional amortization from intangible assets that we acquired in connection with our acquisitions, primarily our acquisition of NetSuite.
Fiscal 2017 Compared to Fiscal 2016: Amortization of intangible assets decreased in fiscal 2017 due to a reduction in expenses associated with certain of our intangible assets that became fully amortized, partially offset by additional amortization from intangible assets that we acquired in connection with our acquisitions made in fiscal 2017, including those associated with our acquisition of NetSuite.
Restructuring Expenses: Restructuring expenses resulted from the execution of management approved restructuring plans that were generally developed to improve our cost structure and/or operations, often in conjunction with our acquisition integration strategies. Restructuring expenses consist of employee severance costs and may also include charges for duplicate facilities and other contract termination costs to improve our
56
Table of Contents
Index to Financial Statements
cost structure prospectively. For additional information regarding our restructuring plans, see Note 8 of Notes to Consolidated Financial Statements included in our Annual Report.
| Year Ended May 31, | ||||||||||||||||||||||||||||
| Percent Change | Percent Change | |||||||||||||||||||||||||||
| (Dollars in millions) |
2018 | Actual | Constant | 2017 | Actual | Constant | 2016 | |||||||||||||||||||||
| Restructuring expenses |
$ | 588 | 27% | 22% | $ | 463 | 1% | 4% | $ | 458 | ||||||||||||||||||
|
|
|
|
|
|
|
|||||||||||||||||||||||
Restructuring expenses in fiscal 2018 and fiscal 2017 primarily related to our 2017 Restructuring Plan which is substantially complete. Restructuring expenses in fiscal 2016 primarily related to our 2015 Restructuring Plan which is complete. Our management approved, committed to and initiated these plans in order to restructure and further improve efficiencies in our operations. We may incur additional restructuring expenses in future periods due to the initiation of new restructuring plans or from changes in estimated costs associated with existing restructuring plans.
The majority of the initiatives undertaken by our 2017 Restructuring Plan were effected to implement our continued move toward developing, marketing and selling our cloud-based offerings. These initiatives impacted certain of our sales and marketing and research and development operations. Cost savings realized pursuant to our 2017 Restructuring Plan initiatives were primarily offset by investments in resources and geographies that address the development, marketing and sale of our cloud-based offerings as customer preferences pivot to the Oracle Cloud.
Interest Expense:
| Year Ended May 31, | ||||||||||||||||||||||||||||
| Percent Change | Percent Change | |||||||||||||||||||||||||||
| (Dollars in millions) |
2018 | Actual | Constant | 2017 | Actual | Constant | 2016 | |||||||||||||||||||||
| Interest expense |
$ | 2,025 | 13% | 13% | $ | 1,798 | 23% | 23% | $ | 1,467 | ||||||||||||||||||
|
|
|
|
|
|
|
|||||||||||||||||||||||
Fiscal 2018 Compared to Fiscal 2017: Interest expense increased in fiscal 2018 primarily due to higher average borrowings resulting from our issuance of $10.0 billion of senior notes in November 2017, which was partially offset by a reduction in interest expense resulting from the maturity and repayment of $6.0 billion of senior notes in fiscal 2018. See Recent Financing Activities below and Note 7 of Notes to Consolidated Financial Statements included elsewhere in this Annual Report for additional information regarding our borrowings.
Fiscal 2017 Compared to Fiscal 2016: Interest expense increased in fiscal 2017 primarily due to higher average borrowings resulting from our issuance of $14.0 billion of senior notes in July 2016. This increase in interest expense during fiscal 2017 was partially offset by a reduction in interest expense resulting from the maturity and repayment of $2.0 billion of senior notes in January 2016.
Non-Operating Income, net: Non-operating income, net consists primarily of interest income, net foreign currency exchange gains (losses), the noncontrolling interests in the net profits of our majority-owned subsidiaries (primarily Oracle Financial Services Software Limited and Oracle Corporation Japan) and net other income (losses), including net realized gains and losses related to all of our investments and net unrealized gains and losses related to the small portion of our investment portfolio that we classify as trading.
| Year Ended May 31, | ||||||||||||||||||||||||||||
| Percent Change | Percent Change | |||||||||||||||||||||||||||
| (Dollars in millions) |
2018 | Actual | Constant | 2017 | Actual | Constant | 2016 | |||||||||||||||||||||
| Interest income |
$ | 1,201 | 50% | 49% | $ | 802 | 49% | 50% | $ | 538 | ||||||||||||||||||
| Foreign currency losses, net |
(74 | ) | -51% | -58% | (152 | ) | 38% | 49% | (110 | ) | ||||||||||||||||||
| Noncontrolling interests in income |
(135 | ) | 14% | 14% | (118 | ) | 2% | 2% | (116 | ) | ||||||||||||||||||
| Other income (loss), net |
245 | 237% | 237% | 73 | 1,136% | 1,145% | (7 | ) | ||||||||||||||||||||
|
|
|
|
|
|
|
|||||||||||||||||||||||
| Total non-operating income, net |
$ | 1,237 | 105% | 106% | $ | 605 | 98% | 96% | $ | 305 | ||||||||||||||||||
|
|
|
|
|
|
|
|||||||||||||||||||||||
57
Table of Contents
Index to Financial Statements
Fiscal 2018 Compared to Fiscal 2017: On a constant currency basis, our non-operating income, net for fiscal 2018 increased primarily due to higher interest income in fiscal 2018 resulting from higher cash, cash equivalent and short-term investment balances and higher interest rates, lower foreign currency losses in fiscal 2018, and an increase in other income, net in fiscal 2018 related to higher net realized gains on the sale of certain marketable securities.
Fiscal 2017 Compared to Fiscal 2016: On a constant currency basis, our non-operating income, net for fiscal 2017 increased primarily due to higher interest income resulting from higher cash, cash equivalent and short-term investment balances and higher interest rates. In addition, we incurred higher other income, net during fiscal 2017 related to investment gains for our deferred compensation plan investments that we held and classified as trading in comparison to net losses for such investments during fiscal 2016. The aforementioned favorable movements in non-operating income, net during fiscal 2017 were partially offset by higher foreign currency losses, net during fiscal 2017.
Provision for Income Taxes: Our effective tax rates for each of the periods presented were the result of the mix of income earned in various tax jurisdictions that apply a broad range of income tax rates. In fiscal 2018, the Tax Act was signed into law. The more significant provisions of the Tax Act as applicable to us are described above under “Impacts of the U.S. Tax Cuts and Jobs Act of 2017”. Our provision for income taxes for the fiscal 2018 presented varied from the 21% U.S. statutory rate imposed by the Tax Act due primarily to the January 1, 2018 effective date of the Tax Act, the impacts of the Tax Act upon adoption, state taxes, the U.S. research and development tax credit, settlements with tax authorities, the tax effects of stock-based compensation, and the U.S. domestic production activity deduction. Prior to the January 1, 2018 effective date of the Tax Act, our provision for income taxes historically differed from the tax computed at the previous U.S. federal statutory income tax rate due primarily to certain earnings considered as indefinitely reinvested in foreign operations, state taxes, the U.S. research and development tax credit, settlements with tax authorities, the tax effects of stock-based compensation and the U.S. domestic production activity deduction. Future effective tax rates could be adversely affected by an unfavorable shift of earnings weighted to jurisdictions with higher tax rates, by unfavorable changes in tax laws and regulations, by adverse rulings in tax related litigation, or by shortfalls in stock-based compensation realized by employees relative to stock-based compensation that was recorded for book purposes, among others.
| Year Ended May 31, | ||||||||||||||||||||||||||||
| Percent Change | Percent Change | |||||||||||||||||||||||||||
| (Dollars in millions) |
2018 | Actual | Constant | 2017 | Actual | Constant | 2016 | |||||||||||||||||||||
| Provision for income taxes |
$ | 9,066 | 315% | 315% | $ | 2,182 | -14% | -15% | $ | 2,541 | ||||||||||||||||||
|
|
|
|
|
|
|
|||||||||||||||||||||||
| Effective tax rate |
70.3% | 18.9% | 22.2% | |||||||||||||||||||||||||
Fiscal 2018 Compared to Fiscal 2017: Provision for income taxes increased in fiscal 2018, relative to fiscal 2017, primarily due to the net unfavorable impacts due to our initial accounting for the enactment of the Tax Act on January 1, 2018 (refer to “Impacts of the U.S. Tax Cuts and Jobs Act of 2017” above for additional information) and, to a lesser extent, by the tax effect of higher income before provision for income taxes (determined after taking into account the net favorable impact of the Tax Act on our tax profile) during fiscal 2018; an unfavorable shift in jurisdiction mix of earnings in fiscal 2018; and a decrease in unrecognized tax benefits due to settlements with tax authorities and other events during fiscal 2018. These unfavorable impacts to our provision for income taxes were partially offset by higher fiscal 2018 realized excess tax benefits related to stock-based compensation expense.
Fiscal 2017 Compared to Fiscal 2016: Provision for income taxes in fiscal 2017 decreased relative to fiscal 2016 primarily due to the favorable impact of excess tax benefits recognized in fiscal 2017 that related to stock-based compensation, which were recorded as a benefit to provision for income taxes in fiscal 2017, in comparison to fiscal 2016 when such benefits were recognized as an increase to additional paid in capital. To a lesser extent, the provision for income taxes in fiscal 2017 also benefited from a favorable jurisdictional mix of earnings, as well as net favorable changes in fiscal 2017 relating to unrecognized tax benefits from audit settlements, statute of limitation releases, and other events.
58
Table of Contents
Index to Financial Statements
Liquidity and Capital Resources
| As of May 31, | ||||||||||||||||||||
| (Dollars in millions) |
2018 | Change | 2017 | Change | 2016 | |||||||||||||||
| Working capital |
$ | 56,769 | 13% | $ | 50,337 | 7% | $ | 47,105 | ||||||||||||
| Cash, cash equivalents and marketable securities |
$ | 67,261 | 2% | $ | 66,078 | 18% | $ | 56,125 | ||||||||||||
Working capital: The increase in working capital as of May 31, 2018 in comparison to May 31, 2017 was primarily due to our issuance of $10.0 billion of long-term senior notes in November 2017 (refer to Recent Financing Activities Below for additional information), the favorable impacts to our net current assets resulting from our net income during fiscal 2018 and cash proceeds from stock option exercises. These favorable working capital movements were partially offset by cash used for repurchases of our common stock, cash used to pay dividends to our stockholders, cash used for capital expenditures and cash used for acquisitions in fiscal 2018.
The increase in working capital as of May 31, 2017 in comparison to May 31, 2016 was primarily due to our issuance of $14.0 billion of long-term senior notes in July 2016, the favorable impacts to our net current assets resulting from our net income during fiscal 2017 and cash proceeds from stock option exercises. These favorable working capital movements were partially offset by cash used for acquisitions, including $9.0 billion of net cash used for our acquisition of NetSuite in the second quarter of fiscal 2017, cash used for repurchases of our common stock, cash used to pay dividends to our stockholders and cash used for capital expenditures.
Our working capital may be impacted by some or all of the aforementioned factors in future periods, the amounts and timing of which are variable.
Cash, cash equivalents and marketable securities: Cash and cash equivalents primarily consist of deposits held at major banks, Tier-1 commercial paper and other securities with original maturities of 90 days or less. Marketable securities consist of Tier-1 commercial paper debt securities, corporate debt securities and certain other securities. The increase in cash, cash equivalents and marketable securities at May 31, 2018 in comparison to May 31, 2017 was primarily due to the issuance of $12.5 billion of cash inflows from fiscal 2018 debt issuances (refer to Recent Financing Activities Below for additional information), cash inflows generated by our operations and cash inflows from stock option exercises. These cash inflows were partially offset by certain fiscal 2018 cash outflows, primarily $11.3 billion of repurchases of our common stock, the repayment of $9.8 billion of borrowings, payments of cash dividends to our stockholders and cash used for capital expenditures.
As a result of the enactment of the Tax Act on January 1, 2018, we expect greater flexibility in accessing and utilizing our cash, cash equivalent and marketable securities balances held by certain of our foreign subsidiaries, as well as prospective assets generated by these foreign subsidiaries’ future earnings and profits. We believe we have sufficient cash, cash equivalent and marketable securities balances and access to additional capital resources, if required, to settle the $7.8 billion one-time transition tax described under “Impacts of the U.S. Tax Cuts and Jobs Act of 2017” above.
The amount of cash, cash equivalents and marketable securities that we report in U.S. Dollars for a significant portion of the cash, cash equivalents and marketable securities balances held by our foreign subsidiaries is subject to translation adjustments caused by changes in foreign currency exchange rates as of the end of each respective reporting period (the offset to which is substantially recorded to accumulated other comprehensive loss in our consolidated balance sheets and is also presented as a line item in our consolidated statements of comprehensive income included elsewhere in this Annual Report). As the U.S. Dollar generally weakened against certain major international currencies during fiscal 2018, the amount of cash, cash equivalents and marketable securities that we reported in U.S. Dollars for these subsidiaries increased on a net basis as of May 31, 2018 relative to what we would have reported using constant currency rates from our May 31, 2017 balance sheet date.
The increase in cash, cash equivalents and marketable securities at May 31, 2017 in comparison to May 31, 2016 was primarily due to cash inflows generated by our operations during fiscal 2017, $13.6 billion of net cash inflows from fiscal 2017 debt issuances, net of debt repayments, and cash inflows from fiscal 2017 stock option
59
Table of Contents
Index to Financial Statements
exercises. These fiscal 2017 cash inflows were partially offset by certain fiscal 2017 cash outflows, primarily acquisitions, including our acquisition of NetSuite, repurchases of our common stock, payments of cash dividends to our stockholders, and cash used for capital expenditures. Additionally, our reported cash, cash equivalents and marketable securities balances as of May 31, 2017 decreased on a net basis in comparison to May 31, 2016 as the U.S. Dollar generally strengthened in comparison to most major international currencies during fiscal 2017.
| Year Ended May 31, | ||||||||||||||||||||
| (Dollars in millions) |
2018 | Change | 2017 | Change | 2016 | |||||||||||||||
| Net cash provided by operating activities |
$ | 15,386 | 9% | $ | 14,126 | 3% | $ | 13,685 | ||||||||||||
| Net cash used for investing activities |
$ | (5,625 | ) | -74% | $ | (21,494 | ) | 317% | $ | (5,154 | ) | |||||||||
| Net cash (used for) provided by financing activities |
$ | (9,982 | ) | 210% | $ | 9,086 | -191% | $ | (9,980 | ) | ||||||||||
Cash flows from operating activities: Our largest source of operating cash flows is cash collections from our customers following the purchase and renewal of their license support agreements. Payments from customers for these support agreements are generally received near the beginning of the contracts’ terms, which are generally one year in length. Over the course of a fiscal year, we also have historically generated cash from the sales of new licenses, cloud services, hardware offerings and services. Our primary uses of cash from operating activities are for employee related expenditures, material and manufacturing costs related to the production of our hardware products, taxes and leased facilities.
Fiscal 2018 Compared to Fiscal 2017: Net cash provided by operating activities increased during fiscal 2018 primarily due to higher net income after adjusting for the one-time income tax accounting effects of our adoption of the Tax Act (refer to “Impacts of the U.S. Tax Cuts and Jobs Act of 2017” for additional discussion).
Fiscal 2017 Compared to Fiscal 2016: Net cash provided by operating activities increased during fiscal 2017 primarily due to the cash favorable effects of higher net income in fiscal 2017 in relation to fiscal 2016.
Cash flows from investing activities: The changes in cash flows from investing activities primarily relate to our acquisitions, the timing of our purchases, maturities and sales of our investments in marketable debt securities and investments in capital and other assets, including certain intangible assets, to support our growth.
Fiscal 2018 Compared to Fiscal 2017: Net cash used for investing activities decreased in fiscal 2018 relative to fiscal 2017 primarily due to a decrease in net cash used for acquisitions, net of cash acquired, and a decrease in cash used to purchase marketable securities and other investments, net of proceeds received from sales and maturities.
Fiscal 2017 Compared to Fiscal 2016: Net cash used for investing activities increased in fiscal 2017 relative to fiscal 2016 primarily due to an increase in cash used for acquisitions, net of cash acquired in fiscal 2017, an increase in cash used to purchase marketable securities and other investments (net of proceeds received from sales and maturities) in fiscal 2017 and increased capital expenditures primarily related to our fiscal 2017 real estate purchases and investments in equipment to support our infrastructure to deliver our cloud services.
Cash flows from financing activities: The changes in cash flows from financing activities primarily relate to borrowings and repayments related to our debt instruments as well as stock repurchases, dividend payments and net proceeds related to employee stock programs.
Fiscal 2018 Compared to Fiscal 2017: Net cash used for financing activities in fiscal 2018 was $10.0 billion in comparison to net cash provided by financing activities of $9.1 billion during fiscal 2017. The increase in cash used for financing activities during fiscal 2018 was primarily due to increased stock repurchase activity in fiscal 2018 (we used $11.3 billion in fiscal 2018 for stock repurchases in comparison to $3.6 billion in fiscal 2017) and debt related cash flows for which we had $2.6 billion of cash inflows from borrowings, net of repayments, in fiscal 2018 in comparison to $13.6 billion of cash inflows from borrowings, net of repayments, in fiscal 2017.
Fiscal 2017 Compared to Fiscal 2016: Net cash provided by financing activities in fiscal 2017 was $9.1 billion in comparison to net cash used for financing activities of $10.0 billion during fiscal 2016. The change in financing activities cash flows during fiscal 2017 in comparison to fiscal 2016 was primarily related to borrowing activities,
60
Table of Contents
Index to Financial Statements
net of debt repayments and stock repurchase activity. We received $13.6 billion of net cash inflows from borrowing activities during fiscal 2017 in comparison to $1.8 billion of net cash inflows from fiscal 2016 borrowing activities. In addition, we significantly reduced our stock repurchase activity in fiscal 2017, using $3.6 billion, in comparison to fiscal 2016 when we used $10.4 billion.
Free cash flow: To supplement our statements of cash flows presented on a GAAP basis, we use non-GAAP measures of cash flows on a trailing 4-quarter basis to analyze cash flows generated from our operations. We believe that free cash flow is also useful as one of the bases for comparing our performance with our competitors. The presentation of non-GAAP free cash flow is not meant to be considered in isolation or as an alternative to net income as an indicator of our performance, or as an alternative to cash flows from operating activities as a measure of liquidity. We calculate free cash flow as follows:
| Year Ended May 31, | ||||||||||||||||||||
| (Dollars in millions) |
2018 | Change | 2017 | Change | 2016 | |||||||||||||||
| Net cash provided by operating activities |
$ | 15,386 | 9% | $ | 14,126 | 3% | $ | 13,685 | ||||||||||||
| Capital expenditures |
(1,736 | ) | -14% | (2,021 | ) | 70% | (1,189 | ) | ||||||||||||
|
|
|
|
|
|
|
|||||||||||||||
| Free cash flow |
$ | 13,650 | 13% | $ | 12,105 | -3% | $ | 12,496 | ||||||||||||
|
|
|
|
|
|
|
|||||||||||||||
| Net income |
$ | 3,825 | $ | 9,335 | $ | 8,901 | ||||||||||||||
|
|
|
|
|
|
|
|||||||||||||||
| Free cash flow as percent of net income |
357% | 130% | 140% | |||||||||||||||||
Long-Term Customer Financing: We offer certain of our customers the option to acquire licenses, cloud services, hardware and services offerings through separate long-term payment contracts. We generally sell these contracts that we have financed for our customers on a non-recourse basis to financial institutions within 90 days of the contracts’ dates of execution. We generally record the transfers of amounts due from customers to financial institutions as sales of financing receivables because we are considered to have surrendered control of these financing receivables. We financed $1.5 billion in fiscal 2018, $912 million in 2017 and $1.2 billion in fiscal 2016, respectively, or approximately 24%, 14% and 16% of our cloud license and on-premise license revenues in fiscal 2018, 2017 and 2016, respectively.
Recent Financing Activities:
Cash Dividends: In fiscal 2018, we declared and paid cash dividends of $0.76 per share that totaled $3.1 billion. In June 2018, our Board of Directors declared a quarterly cash dividend of $0.19 per share of our outstanding common stock payable on July 31, 2018 to stockholders of record as of the close of business on July 17, 2018. Future declarations of dividends and the establishment of future record and payment dates are subject to the final determination of our Board of Directors.
Swap Agreements: In May 2018, we entered into certain cross-currency interest rate swap agreements to manage the foreign currency exchange risk and interest rate risk associated with our €750 million of 3.125% senior notes due July 2025 (July 2025 Notes) by effectively converting the fixed-rate, Euro denominated July 2025 Notes, including the annual interest payments and the payment of principal at maturity, to variable-rate, U.S. Dollar denominated debt. The economic effect of the swap agreement was to eliminate the uncertainty of the principal balance in U.S. Dollars associated with the July 2025 Notes by fixing the principal amount of the July 2025 Notes at $868 million and modify the related fixed interest obligations so that the interest payable on these notes became variable based on LIBOR. As of May 31, 2018, our July 2025 Notes had an effective interest rate of 5.17% after considering the effects of the aforementioned cross-currency interest rate swap arrangement. We are accounting for these cross-currency interest rate swap agreements as fair value hedges pursuant to ASC 815, Derivatives and Hedging (ASC 815).
In April 2018, we entered into certain interest rate swap agreements that have the economic effect of modifying the fixed interest obligations associated with our $1.5 billion of 6.50% senior notes due April 2038 (April 2038 Notes), so that the interest payable on these notes became variable based on LIBOR. As of May 31, 2018, our April 2038 Notes had effective interest rates of 5.65% after considering the effects of the aforementioned interest rate swap arrangements. We are accounting for these interest rate swap agreements as fair value hedges pursuant to ASC 815.
61
Table of Contents
Index to Financial Statements
Additional details regarding our senior notes and related interest rate swap agreements are included in Notes 7 and 10 of Notes to Consolidated Financial Statements, included elsewhere in this Annual Report.
Revolving Credit Agreements: In May 2018, we entered into three revolving credit agreements with JPMorgan Chase Bank, N.A., as initial lender and administrative agent (the 2018 Credit Agreements) and borrowed $2.5 billion pursuant to these agreements. The 2018 Credit Agreements provided us with short-term borrowings for working capital and other general corporate purposes. Interest for the 2018 Credit Agreements is based on either (1) a LIBOR-based formula or (2) the Base Rate formula, each as set forth in the 2018 Credit Agreements. The borrowings are due and payable on June 28, 2018, which is the termination date of the 2018 Credit Agreements. Additional details regarding the 2018 Credit Agreements are included in Note 7 of Notes to Consolidated Financial Statements included elsewhere in this Annual Report.
Common Stock Repurchase Program: Our Board of Directors has approved a program for us to repurchase shares of our common stock. During fiscal 2018, our Board of Directors approved expansions of our stock repurchase program totaling $24.0 billion. As of May 31, 2018, approximately $17.8 billion remained available for stock repurchases pursuant to our stock repurchase program. We repurchased 238.0 million shares for $11.5 billion, 85.6 million shares for $3.5 billion, and 271.9 million shares for $10.4 billion in fiscal 2018, 2017 and 2016, respectively. Our stock repurchase authorization does not have an expiration date and the pace of our repurchase activity will depend on factors such as our working capital needs, our cash requirements for acquisitions and dividend payments, our debt repayment obligations or repurchases of our debt, our stock price, and economic and market conditions. Our stock repurchases may be effected from time to time through open market purchases and pursuant to a Rule 10b5-1 plan. Our stock repurchase program may be accelerated, suspended, delayed or discontinued at any time.
Senior Notes: In November 2017, we issued $10.0 billion of senior notes comprised of the following:
| • | $1.25 billion of 2.625% senior notes due February 2023; |
| • | $2.00 billion of 2.95% senior notes due November 2024; |
| • | $2.75 billion of 3.25% senior notes due November 2027; |
| • | $1.75 billion of 3.80% senior notes due November 2037; and |
| • | $2.25 billion of 4.00% senior notes due November 2047. |
We issued the senior notes for general corporate purposes, which may include stock repurchases, payment of cash dividends on our common stock, repayment of indebtedness and future acquisitions. Additionally, in fiscal 2018, we repaid $3.5 billion of senior notes pursuant to their terms. Additional details regarding our senior notes are included in Note 7 of Notes to Consolidated Financial Statements included elsewhere in this Annual Report.
Contractual Obligations: The contractual obligations presented in the table below represent our estimates of future payments under our fixed contractual obligations and commitments. Changes in our business needs, cancellation provisions, changing interest rates and other factors may result in actual payments differing from these estimates. We cannot provide certainty regarding the timing and amounts of payments. We have presented below a summary of the most significant assumptions used in preparing this information within the context of our consolidated financial position, results of operations and cash flows. The following is a summary of certain of our contractual obligations as of May 31, 2018:
| Year Ending May 31, | ||||||||||||||||||||||||||||
| (Dollars in millions) |
Total | 2019 | 2020 | 2021 | 2022 | 2023 | Thereafter | |||||||||||||||||||||
| Principal payments on borrowings(1) |
$ | 60,927 | $ | 4,500 | $ | 4,500 | $ | 2,446 | $ | 8,250 | $ | 3,750 | $ | 37,481 | ||||||||||||||
| Interest payments on borrowings(1) |
26,959 | 1,938 | 1,805 | 1,732 | 1,629 | 1,492 | 18,363 | |||||||||||||||||||||
| Operating leases(2) |
1,639 | 377 | 314 | 248 | 184 | 144 | 372 | |||||||||||||||||||||
| Purchase obligations and other(3) |
1,375 | 757 | 291 | 189 | 114 | 24 | — | |||||||||||||||||||||
|
|
|
|
|
|
|
|
|
|
|
|
|
|
|
|||||||||||||||
| Total contractual obligations |
$ | 90,900 | $ | 7,572 | $ | 6,910 | $ | 4,615 | $ | 10,177 | $ | 5,410 | $ | 56,216 | ||||||||||||||
|
|
|
|
|
|
|
|
|
|
|
|
|
|
|
|||||||||||||||
62
Table of Contents
Index to Financial Statements
| (1) | Represents the principal balances and interest payments to be paid in connection with our senior notes and other borrowings outstanding as of May 31, 2018 after considering: |
| • | certain interest rate swap agreements for certain series of senior notes that have the economic effect of modifying the fixed-interest obligations associated with these senior notes so that they effectively became variable pursuant to a LIBOR-based index. Interest payments on these senior notes have been presented in the table above after consideration of these fixed to variable interest rate swap agreements based upon the interest rates applicable as of May 31, 2018 and are subject to change in future periods; |
| • | interest payments on our floating-rate senior notes that are based upon the interest rates applicable to the senior notes as of May 31, 2018 and are subject to change in future periods; |
| • | certain cross-currency swap agreements for our €1.25 billion 2.25% senior notes due 2021 that have the economic effect of converting our fixed-rate, Euro-denominated debt, including annual interest payments and the payment of principal at maturity, to a fixed-rate, U.S. Dollar-denominated debt with a fixed annual interest rate. Principal and interest payments for these senior notes were calculated and presented in the table above based on the terms of these cross-currency swap agreements; and |
| • | certain cross-currency interest rate swap agreements for our €750 million 3.125% senior notes due July 2025 that have the economic effect of converting our fixed-rate, Euro-denominated debt, including annual interest payments and the payment of principal at maturity, to a variable-rate, U.S. Dollar-denominated debt. Principal and interest payments for these senior notes were calculated and presented in the table above based on the terms of these cross-currency interest rate swap agreements. |
| Refer to Notes 7 and 10 of Notes to Consolidated Financial Statements included elsewhere in this Annual Report for additional information related to our notes payable and other borrowings and related derivative agreements. |
| (2) | Primarily represents leases of facilities and includes future minimum rent payments for facilities that we have vacated pursuant to our restructuring and merger integration activities. We have approximately $61 million in facility obligations, net of estimated sublease income, for certain vacated locations in accrued restructuring on our consolidated balance sheet at May 31, 2018. |
| (3) | Primarily represents amounts associated with agreements that are enforceable and legally binding and specify terms, including: fixed or minimum quantities to be purchased; fixed, minimum or variable price provisions; and the approximate timing of the payment. We utilize several external manufacturers to manufacture sub-assemblies for our hardware products and to perform final assembly and testing of finished hardware products. We also obtain individual hardware components for our products from a variety of individual suppliers based on projected demand information. Such purchase commitments are based on our forecasted component and manufacturing requirements and typically provide for fulfillment within agreed upon lead-times and/or commercially standard lead-times for the particular part or product and have been included in the amount presented in the above contractual obligations table. Routine arrangements for other materials and goods that are not related to our external manufacturers and certain other suppliers and that are entered into in the ordinary course of business are not included in the amounts presented above, as they are generally entered into in order to secure pricing or other negotiated terms and are difficult to quantify in a meaningful way. |
As of May 31, 2018, we had $6.6 billion of gross unrecognized income tax benefits, including related interest and penalties, recorded on our consolidated balance sheet, and all such obligations have been excluded from the contractual obligations table above due to the uncertainty as to when they might be settled. We cannot make a reasonably reliable estimate of the period in which the remainder of our unrecognized income tax benefits will be settled or released with the relevant tax authorities, although we believe it is reasonably possible that certain of these liabilities could be settled or released during fiscal 2019. We are involved in claims and legal proceedings. All such claims and obligations have been excluded from the contractual obligations table above due to the uncertainty of claims and legal proceedings and associated estimates and assumptions, all of which are inherently unpredictable and many aspects of which are out of our control. Notes 14 and 17 of Notes to Consolidated Financial Statements included elsewhere in this Annual Report includes additional information regarding these contingencies.
We believe that our current cash, cash equivalents and marketable securities and cash generated from operations will be sufficient to meet our working capital, capital expenditures and contractual obligation requirements, including the $7.8 billion one-time transition tax described under “Impacts of the U.S. Tax Cuts and Jobs Act of 2017” above. In addition, we believe that we could fund our future acquisitions, dividend payments and repurchases of common stock or debt with our internally available cash, cash equivalents and marketable securities, cash generated from operations, additional borrowings or from the issuance of additional securities.
Off-Balance Sheet Arrangements: We do not have any off-balance sheet arrangements that have or are reasonably likely to have a current or future effect on our financial condition, changes in financial condition, revenues or expenses, results of operations, liquidity, capital expenditures or capital resources that are material to investors.
63
Table of Contents
Index to Financial Statements
Selected Quarterly Financial Data
Quarterly revenues, expenses and operating income have historically been affected by a variety of seasonal factors, including the structure of sales force incentive compensation plans. In addition, our European operations generally provide lower revenues in our first fiscal quarter because of the reduced economic activity in Europe during the summer. These seasonal factors are common in the technology industry. These factors have historically caused a decrease in our first quarter revenues as compared to revenues in the immediately preceding fourth quarter, which historically has been our highest revenue quarter within a particular fiscal year. Similarly, the operating income of our business is affected by seasonal factors in a similar manner as our revenues (in particular, our cloud and license business and hardware business) as certain expenses within our cost structure are relatively fixed in the short term. We expect these trends to continue in fiscal 2019.
The following tables set forth selected unaudited quarterly information for our last eight fiscal quarters. We believe that all necessary adjustments, which consisted only of normal recurring adjustments, have been included in the amounts stated below to present fairly the results of such periods when read in conjunction with the consolidated financial statements and related notes included elsewhere in this Annual Report. The sum of the quarterly financial information may vary from annual data due to rounding.
| Fiscal 2018 Quarter Ended (Unaudited) | ||||||||||||||||
| (in millions, except per share amounts) |
August 31 | November 30 | February 28 | May 31 | ||||||||||||
| Revenues |
$ | 9,187 | $ | 9,621 | $ | 9,771 | $ | 11,251 | ||||||||
| Gross profit |
$ | 7,254 | $ | 7,656 | $ | 7,769 | $ | 9,071 | ||||||||
| Operating income |
$ | 2,821 | $ | 3,069 | $ | 3,410 | $ | 4,380 | ||||||||
| Net income (loss) |
$ | 2,210 | $ | 2,233 | $ | (4,024 | ) | $ | 3,408 | |||||||
| Earnings (loss) per share—basic |
$ | 0.53 | $ | 0.54 | $ | (0.98 | ) | $ | 0.84 | |||||||
| Earnings (loss) per share—diluted |
$ | 0.52 | $ | 0.52 | $ | (0.98 | ) | $ | 0.82 | |||||||
| Fiscal 2017 Quarter Ended (Unaudited) | ||||||||||||||||
| (in millions, except per share amounts) |
August 31 | November 30 | February 28 | May 31 | ||||||||||||
| Revenues |
$ | 8,595 | $ | 9,035 | $ | 9,205 | $ | 10,892 | ||||||||
| Gross profit |
$ | 6,819 | $ | 7,237 | $ | 7,314 | $ | 8,889 | ||||||||
| Operating income |
$ | 2,641 | $ | 3,037 | $ | 2,959 | $ | 4,073 | ||||||||
| Net income |
$ | 1,832 | $ | 2,032 | $ | 2,239 | $ | 3,231 | ||||||||
| Earnings per share—basic |
$ | 0.44 | $ | 0.50 | $ | 0.55 | $ | 0.78 | ||||||||
| Earnings per share—diluted |
$ | 0.43 | $ | 0.48 | $ | 0.53 | $ | 0.76 | ||||||||
Restricted Stock-Based Awards and Stock Options
Our stock-based compensation program is a key component of the compensation package we provide to attract and retain certain of our talented employees and align their interests with the interests of existing stockholders.
We recognize that restricted stock-based awards and stock options dilute existing stockholders and have sought to control the number of stock-based awards granted while providing competitive compensation packages. Consistent with these dual goals, our cumulative potential dilution since June 1, 2015 has been a weighted-average annualized rate of 1.7% per year. The potential dilution percentage is calculated as the average annualized new restricted stock-based awards or stock options granted and assumed, net of restricted stock-based awards and stock options forfeited by employees leaving the company, divided by the weighted-average outstanding shares during the calculation period. This maximum potential dilution will only result if all restricted stock-based awards vest and stock options are exercised. Of the outstanding stock options at May 31, 2018, which generally have a ten-year exercise period, approximately 19% have exercise prices higher than the market price of our common stock on such date. In recent years, our stock repurchase program has more than offset the dilutive effect of our stock-based compensation program. However, we may modify the levels of our stock repurchases in the future depending on a number of factors, including the amount of cash we have available for acquisitions, to pay dividends, to repay or repurchase indebtedness or for other purposes. At May 31, 2018, the maximum potential dilution from all outstanding restricted stock-based awards and
64
Table of Contents
Index to Financial Statements
unexercised stock options, regardless of when granted and regardless of whether vested or unvested and including stock options where the strike price is higher than the market price as of such date, was 9.8%.
During fiscal 2018, the Compensation Committee of the Board of Directors reviewed and approved the annual organization-wide stock-based award grants to selected employees, all stock-based award grants to executive officers and any individual grant of restricted stock units of 62,500 or greater. Each member of a separate executive officer committee, referred to as the Plan Committee, was allocated a fiscal 2018 equity budget that could be used throughout the fiscal year to grant equity within his or her organization, subject to certain limitations established by the Compensation Committee.
Restricted stock-based award and stock option activity from June 1, 2015 through May 31, 2018 is summarized as follows (shares in millions):
| Restricted stock-based awards and stock options outstanding at May 31, 2015 |
441 | |||
| Restricted stock-based awards and stock options granted |
240 | |||
| Restricted stock-based awards and stock options assumed |
17 | |||
| Restricted stock-based awards vested and issued and stock options exercised |
(260 | ) | ||
| Forfeitures, cancellations and other, net |
(45 | ) | ||
|
|
|
|||
| Restricted stock-based awards and stock options outstanding at May 31, 2018 |
393 | |||
|
|
|
|||
| Weighted-average annualized restricted stock-based awards and stock options granted and assumed, net of forfeitures and cancellations |
70 | |||
| Weighted-average annualized stock repurchases |
(199 | ) | ||
| Shares outstanding at May 31, 2018 |
3,997 | |||
| Basic weighted-average shares outstanding from June 1, 2015 through May 31, 2018 |
4,152 | |||
| Restricted stock-based awards and stock options outstanding as a percent of shares outstanding at May 31, 2018 |
9.8% | |||
| Total restricted stock-based awards and in the money stock options outstanding (based on the closing price of our common stock on the last trading day of fiscal 2018) as a percent of shares outstanding at May 31, 2018 |
8.4% | |||
| Weighted-average annualized restricted stock-based awards and stock options granted and assumed, net of forfeitures and cancellations and before stock repurchases, as a percent of weighted-average shares outstanding from June 1, 2015 through May 31, 2018 |
1.7% | |||
| Weighted-average annualized restricted stock-based awards and stock options granted and assumed, net of forfeitures and cancellations and after stock repurchases, as a percent of weighted-average shares outstanding from June 1, 2015 through May 31, 2018 |
-3.1% |
Our Compensation Committee approves the annual organization-wide stock-based award grants to certain employees. These annual stock-based award grants are generally made during the ten business day period following the second trading day after the announcement of our fiscal fourth quarter earnings report.
Recent Accounting Pronouncements
For information with respect to recent accounting pronouncements, if any, and the impact of these pronouncements on our consolidated financial statements, if any, see Note 1 of Notes to Consolidated Financial Statements included elsewhere in this Annual Report.
Item 7A. Quantitative and Qualitative Disclosures About Market Risk
Cash, Cash Equivalents, Marketable Securities and Interest Income Risk
Cash, cash equivalents, and marketable securities were $67.3 billion and $66.1 billion as of May 31, 2018 and 2017, respectively. Our bank deposits and time deposits are generally held with large, diverse financial institutions worldwide with high investment-grade credit ratings or financial institutions that meet investment-grade ratings criteria, which we believe mitigates credit risk and certain other risks. In addition, as of May 31, 2018, substantially all of our marketable securities were high quality with approximately 26% having maturity dates within one year and 74% having maturity dates within one to five years (a description of our marketable securities held is included in Notes 3 and 4 of Notes to Consolidated Financial Statements included elsewhere in this Annual Report and “Liquidity and Capital Resources” above). We held a mix of both fixed and floating-rate debt securities. Fixed rate securities may have their market value adversely impacted as interest rates increase,
65
Table of Contents
Index to Financial Statements
while floating rate securities may produce less income than expected if interest rates fall. Due in part to these factors, our future investment income may vary due to changes in interest rates or we may realize losses if we are forced to sell securities that decline in market value due to changes in interest rates. However because we classify our debt securities as “available for sale,” no gains or losses are recognized due to changes in interest rates unless such securities are sold prior to maturity or declines in fair value are determined to be other-than-temporary. The fair values of our fixed-rate debt securities are impacted by interest rate movements and if interest rates would have been higher by 50 basis points as of May 31, 2018 and 2017 we estimate the change would have decreased the fair values of our marketable securities holdings by $308 million and $348 million, respectively. Substantially all of our marketable securities are designated as available-for-sale. We generally do not use our investments for trading purposes.
Changes in the overall level of interest rates affect the interest income that is generated from our cash, cash equivalents and marketable securities. For fiscal 2018 and 2017, total interest income was $1.2 billion and $802 million, respectively, with our cash, cash equivalents and marketable securities investments yielding an average 1.73% and 1.47%, respectively, on a worldwide basis.
Interest Expense Risk
Interest Expense Risk—Interest Rate Swap Agreements and Cross-Currency Interest Rate Swap Agreements
Our total borrowings were $60.9 billion as of May 31, 2018, consisting of $56.9 billion of fixed-rate borrowings, $1.2 billion of floating-rate borrowings (Floating-Rate Notes) and $2.8 billion of other borrowings, primarily under the 2018 Credit Agreements. We have entered into certain interest rate swap agreements that have the economic effect of modifying the fixed-interest obligations associated with our $1.5 billion of 2.375% senior notes due January 2019 (January 2019 Notes), our $2.0 billion of 2.25% senior notes due October 2019 (October 2019 Notes), our $1.5 billion of 2.80% senior notes due July 2021 (July 2021 Notes), and our April 2038 Notes, so that the interest payable on these senior notes effectively became variable based on LIBOR. We have also entered into cross-currency interest rate swap agreements to manage the foreign currency exchange rate risk associated with our July 2025 Notes by effectively converting the fixed-rate, Euro denominated debt, including the annual interest payments and the payment of principal at maturity, to variable-rate, U.S. Dollar denominated debt based on LIBOR. The critical terms of the swap agreements match the critical terms of the January 2019 Notes, October 2019 Notes, July 2021 Notes, April 2038 Notes and July 2025 Notes that the swap agreements pertain to, including the notional amounts and maturity dates. We do not use these swap arrangements for trading purposes. We are accounting for these swap agreements as fair value hedges pursuant to ASC 815, Derivatives and Hedging (ASC 815). The fair values of these fixed to variable interest rate swap agreements as of May 31, 2018 and 2017 were a $26 million net loss and a $40 million gain, respectively. We estimate that the changes in the fair values of these swap agreements during fiscal 2018 and 2017 were primarily attributable to an increase in forward interest rate prices. If LIBOR-based interest rates would have been higher by 100 basis points as of May 31, 2018 and 2017, the change would have decreased the fair values of the fixed to variable swap agreements by $315 million and $153 million, respectively.
By issuing the Floating-Rate Notes and by entering into the aforementioned swap arrangements, we have assumed risks associated with variable interest rates based upon LIBOR. Changes in the overall level of interest rates affect the interest expense that we recognize in our consolidated statements of operations. An interest rate risk sensitivity analysis is used to measure interest rate risk by computing estimated changes in cash flows as a result of assumed changes in market interest rates. As of May 31, 2018 and 2017, if LIBOR-based interest rates would have been higher by 100 basis points, the change would have increased our interest expense annually by approximately $86 million and $73 million, respectively, as it relates to our fixed to variable interest rate swap agreements and floating-rate borrowings. Additional details regarding our senior notes and related swap agreements are included in Notes 7 and 10 of Notes to Consolidated Financial Statements included elsewhere in this Annual Report.
66
Table of Contents
Index to Financial Statements
Currency Risk
Foreign Currency Transaction Risk—Foreign Currency Forward Contracts
We transact business in various foreign currencies and have established a program that primarily utilizes foreign currency forward contracts to offset the risks associated with the effects of certain foreign currency exposures. Under this program, our strategy is to enter into foreign currency forward contracts so that increases or decreases in our foreign currency exposures are offset by gains or losses on the foreign currency forward contracts in order to mitigate the risks and volatility associated with our foreign currency transactions. We may suspend this program from time to time. Our foreign currency exposures typically arise from intercompany sublicense fees, intercompany loans and other intercompany transactions. Our foreign currency forward contracts are generally short-term in duration.
Neither do we use these foreign currency forward contracts for trading purposes nor do we designate these forward contracts as hedging instruments pursuant to ASC 815. Accordingly, we record the fair values of these contracts as of the end of our reporting period to our consolidated balance sheet with changes in fair values recorded to our consolidated statement of operations. Given the short duration of the forward contracts, amounts recorded generally are not significant. The balance sheet classification for the fair values of these forward contracts is prepaid expenses and other current assets for forward contracts in an unrealized gain position and other current liabilities for forward contracts in an unrealized loss position. The statement of operations classification for changes in fair values of these forward contracts is non-operating income, net for both realized and unrealized gains and losses.
We expect that we will continue to realize gains or losses with respect to our foreign currency exposures, net of gains or losses from our foreign currency forward contracts. Our ultimate realized gain or loss with respect to foreign currency exposures will generally depend on the size and type of cross-currency transactions that we enter into, the currency exchange rates associated with these exposures and changes in those rates, the net realized gain or loss on our foreign currency forward contracts and other factors. The notional amounts of the forward contracts we held to purchase U.S. Dollars in exchange for other major international currencies were $3.4 billion as of each of May 31, 2018 and 2017 and the notional amounts of forward contracts we held to sell U.S. Dollars in exchange for other major international currencies were $1.4 billion as of each of May 31, 2018 and 2017. The fair values of our outstanding foreign currency forward contracts were nominal at May 31, 2018 and 2017. Net foreign exchange transaction losses included in non-operating income, net in the accompanying consolidated statements of operations were $74 million, $152 million and $110 million in fiscal 2018, 2017 and 2016, respectively. As a large portion of our consolidated operations are international, we could experience additional foreign currency volatility in the future, the amounts and timing of which are unknown.
Foreign Currency Translation Risk—Impact on Cash, Cash Equivalents and Marketable Securities
Fluctuations in foreign currencies impact the amount of total assets and liabilities that we report for our foreign subsidiaries upon the translation of these amounts into U.S. Dollars. In particular, the amount of cash, cash equivalents and marketable securities that we report in U.S. Dollars for a significant portion of the cash held by these subsidiaries is subject to translation variance caused by changes in foreign currency exchange rates as of the end of each respective reporting period (the offset to which is substantially recorded to accumulated other comprehensive loss on our consolidated balance sheets and is also presented as a line item in our consolidated statements of comprehensive income included elsewhere in this Annual Report).
As the U.S. Dollar fluctuated against certain international currencies as of the end of fiscal 2018, the amount of cash, cash equivalents and marketable securities that we reported in U.S. Dollars for foreign subsidiaries that hold international currencies as of May 31, 2018 increased relative to what we would have reported using a constant currency rate from May 31, 2017. As reported in our consolidated statements of cash flows, the estimated effects of exchange rate changes on our reported cash and cash equivalents balances in U.S. Dollars was an increase of $57 million for fiscal 2018, and decreases of $86 million and $115 million in fiscal 2017 and 2016, respectively. If overall foreign currency exchange rates in comparison to the U.S. Dollar uniformly would have been weaker by 10% as of May 31, 2018 and May 31, 2017 the amount of cash, cash equivalents and marketable securities we would report in U.S. Dollars would have decreased by approximately $555 million and $518 million, respectively, assuming constant foreign currency cash, cash equivalents and marketable securities balances.
67
Table of Contents
Index to Financial Statements
Item 8. Financial Statements and Supplementary Data
The response to this item is submitted as a separate section of this Annual Report. See Part IV, Item 15.
Item 9. Changes In and Disagreements with Accountants on Accounting and Financial Disclosure
None.
Item 9A. Controls and Procedures
Evaluation of Disclosure Controls and Procedures
As of the end of the period covered by this Annual Report on Form 10-K, we carried out an evaluation under the supervision and with the participation of our Disclosure Committee and our management, including our Principal Executive Officers (one of whom is our Principal Financial Officer), of the effectiveness of the design and operation of our disclosure controls and procedures pursuant to Exchange Act Rules 13a-15(e) and 15d-15(e).
Based on our management’s evaluation (with the participation of our Principal Executive Officers, one of whom is our Principal Financial Officer), as of the end of the period covered by this report, our Principal Executive Officers have concluded that our disclosure controls and procedures were effective as of May 31, 2018 to provide reasonable assurance that information required to be disclosed by us in reports that we file or submit under the Exchange Act is (i) recorded, processed, summarized and reported within the time periods specified in the SEC rules and forms and (ii) accumulated and communicated to our management, including our Principal Executive Officers (one of whom is our Principal Financial Officer) as appropriate to allow timely decisions regarding required disclosure.
Management’s Report on Internal Control over Financial Reporting
Our management is responsible for establishing and maintaining adequate internal control over financial reporting, as such term is defined in Exchange Act Rules 13a-15(f) and 15d-15(f). Under the supervision and with the participation of our management, including our Principal Executive Officers (one of whom is our Principal Financial Officer), we conducted an evaluation of the effectiveness of our internal control over financial reporting as of May 31, 2018 based on the guidelines established in Internal Control—Integrated Framework issued by the Committee of Sponsoring Organizations of the Treadway Commission’s 2013 framework. Our internal control over financial reporting includes policies and procedures that provide reasonable assurance regarding the reliability of financial reporting and the preparation of financial statements for external reporting purposes in accordance with U.S. GAAP.
Based on the results of our evaluation, our management concluded that our internal control over financial reporting was effective as of May 31, 2018. We reviewed the results of management’s assessment with our Finance and Audit Committee.
The effectiveness of our internal control over financial reporting as of May 31, 2018 has been audited by Ernst & Young LLP, an independent registered public accounting firm, as stated in their report which is included in Part IV, Item 15 of this Annual Report.
Changes in Internal Control over Financial Reporting
There were no changes in our internal control over financial reporting identified in connection with the evaluation required by paragraph (d) of Exchange Act Rules 13a-15 or 15d-15 that occurred during our last fiscal quarter that have materially affected, or are reasonably likely to materially affect, our internal control over financial reporting.
Inherent Limitations on Effectiveness of Controls
Our management, including our Principal Executive Officers (one of whom is our Principal Financial Officer), believes that our disclosure controls and procedures and internal control over financial reporting are designed
68
Table of Contents
Index to Financial Statements
to provide reasonable assurance of achieving their objectives and are effective at the reasonable assurance level. However, our management does not expect that our disclosure controls and procedures or our internal control over financial reporting will prevent all errors and all fraud. A control system, no matter how well conceived and operated, can provide only reasonable, not absolute, assurance that the objectives of the control system are met. Further, the design of a control system must reflect the fact that there are resource constraints and the benefits of controls must be considered relative to their costs. Because of the inherent limitations in all control systems, no evaluation of controls can provide absolute assurance that all control issues and instances of fraud, if any, have been detected. These inherent limitations include the realities that judgments in decision-making can be faulty and that breakdowns can occur because of a simple error or mistake. Additionally, controls can be circumvented by the individual acts of some persons, by collusion of two or more people or by management override of the controls. The design of any system of controls also is based in part upon certain assumptions about the likelihood of future events and there can be no assurance that any design will succeed in achieving its stated goals under all potential future conditions; over time, controls may become inadequate because of changes in conditions, or the degree of compliance with policies or procedures may deteriorate. Because of the inherent limitations in a cost-effective control system, misstatements due to error or fraud may occur and not be detected.
None.
69
Table of Contents
Index to Financial Statements
| Item 10. | Directors, Executive Officers and Corporate Governance |
Pursuant to General Instruction G(3) of Form 10-K, the information required by this item relating to our executive officers is included under the caption “Executive Officers of the Registrant” in Part I of this Annual Report.
The other information required by this Item 10 is incorporated by reference from the information contained in our Proxy Statement to be filed with the U.S. Securities and Exchange Commission in connection with the solicitation of proxies for our 2018 Annual Meeting of Stockholders (2018 Proxy Statement) under the sections entitled “Board of Directors—Nominees for Directors,” “Board of Directors—Committees, Membership and Meetings,” “Board of Directors—Committees, Membership and Meetings—The Finance and Audit Committee,” “Corporate Governance—Employee Matters—Code of Conduct,” and “Section 16(a) Beneficial Ownership Reporting Compliance.”
| Item 11. | Executive Compensation |
The information required by this Item 11 is incorporated by reference from the information to be contained in our 2018 Proxy Statement under the sections entitled “Board of Directors—Committees, Membership and Meetings—The Compensation Committee—Compensation Committee Interlocks and Insider Participation,” “Board of Directors—Director Compensation,” and “Executive Compensation.”
| Item 12. | Security Ownership of Certain Beneficial Owners and Management and Related Stockholder Matters |
The information required by this Item 12 is incorporated herein by reference from the information to be contained in our 2018 Proxy Statement under the sections entitled “Security Ownership of Certain Beneficial Owners and Management” and “Executive Compensation—Equity Compensation Plan Information.”
| Item 13. | Certain Relationships and Related Transactions, and Director Independence |
The information required by this Item 13 is incorporated herein by reference from the information to be contained in our 2018 Proxy Statement under the sections entitled “Corporate Governance—Board of Directors and Director Independence” and “Transactions with Related Persons.”
| Item 14. | Principal Accounting Fees and Services |
The information required by this Item 14 is incorporated herein by reference from the information to be contained in our 2018 Proxy Statement under the section entitled “Ratification of Selection of Independent Registered Public Accounting Firm.”
70
Table of Contents
Index to Financial Statements
Item 15. Exhibits and Financial Statement Schedules
The following financial statements are filed as a part of this report:
| Page | ||||
| 72 | ||||
| Consolidated Financial Statements: |
||||
| 74 | ||||
| Statements of Operations for the years ended May 31, 2018, 2017 and 2016 |
75 | |||
| Statements of Comprehensive Income for the years ended May 31, 2018, 2017 and 2016 |
76 | |||
| Statements of Equity for the years ended May 31, 2018, 2017 and 2016 |
77 | |||
| Statements of Cash Flows for the years ended May 31, 2018, 2017 and 2016 |
78 | |||
| 79 | ||||
| 2. Financial Statement Schedules |
||||
| The following financial statement schedule is filed as a part of this report: |
||||
| Page | ||||
| 124 | ||||
All other schedules are omitted because they are not required or the required information is shown in the financial statements or notes thereto.
(b) Exhibits
The information required by this Item is set forth in the Index of Exhibits that is after Item 16 of this Annual Report.
71
Table of Contents
Index to Financial Statements
Report of Independent Registered Public Accounting Firm
To the Stockholders and the Board of Directors of Oracle Corporation
Opinion on the Financial Statements
We have audited the accompanying consolidated balance sheets of Oracle Corporation (the Company) as of May 31, 2018 and 2017, the related consolidated statements of operations, comprehensive income, equity and cash flows for each of the three years in the period ended May 31, 2018, and the related notes and the financial statement schedule listed in the Index at Item 15(a)2 (collectively referred to as the “financial statements”). In our opinion, the financial statements present fairly, in all material respects, the consolidated financial position of the Company at May 31, 2018 and 2017, and the consolidated results of its operations and its cash flows for each of the three years in the period ended May 31, 2018, in conformity with U.S. generally accepted accounting principles.
We also have audited, in accordance with the standards of the Public Company Accounting Oversight Board (United States) (PCAOB), the Company’s internal control over financial reporting as of May 31, 2018, based on criteria established in Internal Control-Integrated Framework issued by the Committee of Sponsoring Organizations of the Treadway Commission (2013 framework) and our report dated June 22, 2018 expressed an unqualified opinion thereon.
Basis for Opinion
These financial statements are the responsibility of the Company’s management. Our responsibility is to express an opinion on the Company’s financial statements based on our audits. We are a public accounting firm registered with the PCAOB and are required to be independent with respect to the Company in accordance with the U.S. federal securities laws and the applicable rules and regulations of the Securities and Exchange Commission and the PCAOB. We conducted our audits in accordance with the standards of the PCAOB. Those standards require that we plan and perform the audit to obtain reasonable assurance about whether the financial statements are free of material misstatement, whether due to error or fraud. Our audits included performing procedures to assess the risks of material misstatement of the financial statements, whether due to error or fraud, and performing procedures that respond to those risks. Such procedures included examining, on a test basis, evidence regarding the amounts and disclosures in the financial statements. Our audits also included evaluating the accounting principles used and significant estimates made by management, as well as evaluating the overall presentation of the financial statements. We believe that our audits provide a reasonable basis for our opinion.
/s/ Ernst & Young LLP
We have served as the Company’s auditor since 2002.
San Jose, California
June 22, 2018
72
Table of Contents
Index to Financial Statements
Report of Independent Registered Public Accounting Firm
To the Stockholders and the Board of Directors of Oracle Corporation
Opinion on Internal Control over Financial Reporting
We have audited Oracle Corporation’s internal control over financial reporting as of May 31, 2018, based on criteria established in Internal Control—Integrated Framework issued by the Committee of Sponsoring Organizations of the Treadway (2013 framework)(the COSO criteria). In our opinion, Oracle Corporation (the Company) maintained, in all material respects, effective internal control over financial reporting as of May 31, 2018, based on the COSO criteria.
We also have audited, in accordance with the standards of the Public Company Accounting Oversight Board (United States) (PCAOB), the consolidated balance sheets of the Company as of May 31, 2018 and 2017, and the related consolidated statements of operations, comprehensive income, equity, and cash flows for each of the three years in the period ended May 31, 2018, and the related notes and the financial statement schedule listed in the Index at Item 15(a)2 and our report June 22, 2018 expressed an unqualified opinion thereon.
Basis for Opinion
The Company’s management is responsible for maintaining effective internal control over financial reporting and for its assessment of the effectiveness of internal control over financial reporting included in the accompanying Management’s Report on Internal Control Over Financial Reporting. Our responsibility is to express an opinion on the Company’s internal control over financial reporting based on our audit. We are a public accounting firm registered with the PCAOB and are required to be independent with respect to the Company in accordance with the U.S. federal securities laws and the applicable rules and regulations of the Securities and Exchange Commission and the PCAOB.
We conducted our audit in accordance with the standards of the PCAOB. Those standards require that we plan and perform the audit to obtain reasonable assurance about whether effective internal control over financial reporting was maintained in all material respects.
Our audit included obtaining an understanding of internal control over financial reporting, assessing the risk that a material weakness exists, testing and evaluating the design and operating effectiveness of internal control based on the assessed risk, and performing such other procedures as we considered necessary in the circumstances. We believe that our audit provides a reasonable basis for our opinion.
Definition and Limitations of Internal Control Over Financial Reporting
A company’s internal control over financial reporting is a process designed to provide reasonable assurance regarding the reliability of financial reporting and the preparation of financial statements for external purposes in accordance with generally accepted accounting principles. A company’s internal control over financial reporting includes those policies and procedures that (1) pertain to the maintenance of records that, in reasonable detail, accurately and fairly reflect the transactions and dispositions of the assets of the company; (2) provide reasonable assurance that transactions are recorded as necessary to permit preparation of financial statements in accordance with generally accepted accounting principles, and that receipts and expenditures of the company are being made only in accordance with authorizations of management and directors of the company; and (3) provide reasonable assurance regarding prevention or timely detection of unauthorized acquisition, use, or disposition of the company’s assets that could have a material effect on the financial statements.
Because of its inherent limitations, internal control over financial reporting may not prevent or detect misstatements. Also, projections of any evaluation of effectiveness to future periods are subject to the risk that controls may become inadequate because of changes in conditions, or that the degree of compliance with the policies or procedures may deteriorate.
/s/ Ernst & Young LLP
San Jose, California
June 22, 2018
73
Table of Contents
Index to Financial Statements
CONSOLIDATED BALANCE SHEETS
As of May 31, 2018 and 2017
| May 31, | ||||||||
| (in millions, except per share data) |
2018 | 2017 | ||||||
| ASSETS | ||||||||
| Current assets: |
||||||||
| Cash and cash equivalents |
$ | 21,620 | $ | 21,784 | ||||
| Marketable securities |
45,641 | 44,294 | ||||||
| Trade receivables, net of allowances for doubtful accounts of $370 and $319 as of May 31, 2018 and May 31, 2017, respectively |
5,279 | 5,300 | ||||||
| Prepaid expenses and other current assets |
3,424 | 3,137 | ||||||
|
|
|
|
|
|||||
| Total current assets |
75,964 | 74,515 | ||||||
|
|
|
|
|
|||||
| Non-current assets: |
||||||||
| Property, plant and equipment, net |
5,897 | 5,315 | ||||||
| Intangible assets, net |
6,670 | 7,679 | ||||||
| Goodwill, net |
43,755 | 43,045 | ||||||
| Deferred tax assets |
1,491 | 1,143 | ||||||
| Other non-current assets |
3,487 | 3,294 | ||||||
|
|
|
|
|
|||||
| Total non-current assets |
61,300 | 60,476 | ||||||
|
|
|
|
|
|||||
| Total assets |
$ | 137,264 | $ | 134,991 | ||||
|
|
|
|
|
|||||
| LIABILITIES AND EQUITY | ||||||||
| Current liabilities: |
||||||||
| Notes payable and other borrowings, current |
$ | 4,491 | $ | 9,797 | ||||
| Accounts payable |
529 | 599 | ||||||
| Accrued compensation and related benefits |
1,789 | 1,966 | ||||||
| Deferred revenues |
8,429 | 8,233 | ||||||
| Other current liabilities |
3,957 | 3,583 | ||||||
|
|
|
|
|
|||||
| Total current liabilities |
19,195 | 24,178 | ||||||
|
|
|
|
|
|||||
| Non-current liabilities: |
||||||||
| Notes payable and other borrowings, non-current |
56,128 | 48,112 | ||||||
| Income taxes payable |
13,422 | 5,681 | ||||||
| Other non-current liabilities |
2,295 | 2,774 | ||||||
|
|
|
|
|
|||||
| Total non-current liabilities |
71,845 | 56,567 | ||||||
|
|
|
|
|
|||||
| Commitments and contingencies |
||||||||
| Oracle Corporation stockholders’ equity: |
||||||||
| Preferred stock, $0.01 par value—authorized: 1.0 shares; outstanding: none |
— | — | ||||||
| Common stock, $0.01 par value and additional paid in capital—authorized: 11,000 shares; outstanding: 3,997 shares and 4,137 shares as of May 31, 2018 and May 31, 2017, respectively |
28,950 | 27,065 | ||||||
| Retained earnings |
18,412 | 27,598 | ||||||
| Accumulated other comprehensive loss |
(1,636 | ) | (803 | ) | ||||
|
|
|
|
|
|||||
| Total Oracle Corporation stockholders’ equity |
45,726 | 53,860 | ||||||
| Noncontrolling interests |
498 | 386 | ||||||
|
|
|
|
|
|||||
| Total equity |
46,224 | 54,246 | ||||||
|
|
|
|
|
|||||
| Total liabilities and equity |
$ | 137,264 | $ | 134,991 | ||||
|
|
|
|
|
|||||
See notes to consolidated financial statements.
74
Table of Contents
Index to Financial Statements
CONSOLIDATED STATEMENTS OF OPERATIONS
For the Years Ended May 31, 2018, 2017 and 2016
| Year Ended May 31, | ||||||||||||
| (in millions, except per share data) |
2018 | 2017 | 2016 | |||||||||
| Revenues: |
||||||||||||
| Cloud services and license support |
$ | 26,254 | $ | 23,800 | $ | 21,714 | ||||||
| Cloud license and on-premise license |
6,190 | 6,418 | 7,276 | |||||||||
| Hardware |
3,993 | 4,152 | 4,668 | |||||||||
| Services |
3,394 | 3,358 | 3,389 | |||||||||
|
|
|
|
|
|
|
|||||||
| Total revenues |
39,831 | 37,728 | 37,047 | |||||||||
|
|
|
|
|
|
|
|||||||
| Operating expenses: |
||||||||||||
| Cloud services and license support(1) |
3,612 | 3,015 | 2,664 | |||||||||
| Hardware(1) |
1,581 | 1,653 | 2,064 | |||||||||
| Services(1) |
2,888 | 2,801 | 2,751 | |||||||||
| Sales and marketing(1) |
8,431 | 8,197 | 7,884 | |||||||||
| Research and development |
6,091 | 6,159 | 5,787 | |||||||||
| General and administrative |
1,289 | 1,176 | 1,155 | |||||||||
| Amortization of intangible assets |
1,620 | 1,451 | 1,638 | |||||||||
| Acquisition related and other |
52 | 103 | 42 | |||||||||
| Restructuring |
588 | 463 | 458 | |||||||||
|
|
|
|
|
|
|
|||||||
| Total operating expenses |
26,152 | 25,018 | 24,443 | |||||||||
|
|
|
|
|
|
|
|||||||
| Operating income |
13,679 | 12,710 | 12,604 | |||||||||
|
|
|
|
|
|
|
|||||||
| Interest expense |
(2,025 | ) | (1,798 | ) | (1,467 | ) | ||||||
| Non-operating income, net |
1,237 | 605 | 305 | |||||||||
|
|
|
|
|
|
|
|||||||
| Income before provision for income taxes |
12,891 | 11,517 | 11,442 | |||||||||
|
|
|
|
|
|
|
|||||||
| Provision for income taxes |
9,066 | 2,182 | 2,541 | |||||||||
|
|
|
|
|
|
|
|||||||
| Net income |
$ | 3,825 | $ | 9,335 | $ | 8,901 | ||||||
|
|
|
|
|
|
|
|||||||
| Earnings per share: |
||||||||||||
| Basic |
$ | 0.93 | $ | 2.27 | $ | 2.11 | ||||||
|
|
|
|
|
|
|
|||||||
| Diluted |
$ | 0.90 | $ | 2.21 | $ | 2.07 | ||||||
|
|
|
|
|
|
|
|||||||
| Weighted average common shares outstanding: |
||||||||||||
| Basic |
4,121 | 4,115 | 4,221 | |||||||||
|
|
|
|
|
|
|
|||||||
| Diluted |
4,238 | 4,217 | 4,305 | |||||||||
|
|
|
|
|
|
|
|||||||
| Dividends declared per common share |
$ | 0.76 | $ | 0.64 | $ | 0.60 | ||||||
|
|
|
|
|
|
|
|||||||
| (1) | Exclusive of amortization of intangible assets, which is shown separately. |
See notes to consolidated financial statements.
75
Table of Contents
Index to Financial Statements
CONSOLIDATED STATEMENTS OF COMPREHENSIVE INCOME
For the Years Ended May 31, 2018, 2017 and 2016
| Year Ended May 31, | ||||||||||||
| (in millions) |
2018 | 2017 | 2016 | |||||||||
| Net income |
$ | 3,825 | $ | 9,335 | $ | 8,901 | ||||||
| Other comprehensive (loss) income, net of tax: |
||||||||||||
| Net foreign currency translation (losses) gains |
(295 | ) | 99 | 73 | ||||||||
| Net unrealized gains (losses) on defined benefit plans |
34 | (102 | ) | 50 | ||||||||
| Net unrealized (losses) gains on marketable securities |
(609 | ) | (9 | ) | 72 | |||||||
| Net unrealized gains (losses) on cash flow hedges |
37 | 25 | (15 | ) | ||||||||
|
|
|
|
|
|
|
|||||||
| Total other comprehensive (loss) income, net |
(833 | ) | 13 | 180 | ||||||||
|
|
|
|
|
|
|
|||||||
| Comprehensive income |
$ | 2,992 | $ | 9,348 | $ | 9,081 | ||||||
|
|
|
|
|
|
|
|||||||
See notes to consolidated financial statements.
76
Table of Contents
Index to Financial Statements
CONSOLIDATED STATEMENTS OF EQUITY
For the Years Ended May 31, 2018, 2017 and 2016
| Common Stock and Additional Paid in Capital |
Retained Earnings |
Accumulated Other Comprehensive Loss |
Total Oracle Corporation Stockholders’ Equity |
Noncontrolling Interests |
Total Equity |
|||||||||||||||||||||||
| (in millions) |
Number of Shares |
Amount | ||||||||||||||||||||||||||
| Balances as of May 31, 2015 |
4,343 | $ | 23,156 | $ | 26,503 | $ | (996 | ) | $ | 48,663 | $ | 435 | $ | 49,098 | ||||||||||||||
| Common stock issued under stock-based compensation plans | 60 | 1,304 | — | — | 1,304 | — | 1,304 | |||||||||||||||||||||
| Common stock issued under stock purchase plans |
3 | 121 | — | — | 121 | — | 121 | |||||||||||||||||||||
| Assumption of stock-based compensation plan awards in connection with acquisitions |
— | 1 | — | — | 1 | — | 1 | |||||||||||||||||||||
| Stock-based compensation |
— | 1,037 | — | — | 1,037 | — | 1,037 | |||||||||||||||||||||
| Repurchase of common stock |
(272 | ) | (1,464 | ) | (8,975 | ) | — | (10,439 | ) | — | (10,439 | ) | ||||||||||||||||
| Shares repurchased for tax withholdings upon vesting of restricted stock-based awards |
(3 | ) | (89 | ) | — | — | (89 | ) | — | (89 | ) | |||||||||||||||||
| Cash dividends declared ($0.60 per share) |
— | — | (2,541 | ) | — | (2,541 | ) | — | (2,541 | ) | ||||||||||||||||||
| Tax benefit from stock plans |
— | 141 | — | — | 141 | — | 141 | |||||||||||||||||||||
| Other, net |
— | 10 | — | — | 10 | 9 | 19 | |||||||||||||||||||||
| Distributions to noncontrolling interests |
— | — | — | — | — | (85 | ) | (85 | ) | |||||||||||||||||||
| Other comprehensive income, net |
— | — | — | 180 | 180 | 26 | 206 | |||||||||||||||||||||
| Net income |
— | — | 8,901 | — | 8,901 | 116 | 9,017 | |||||||||||||||||||||
|
|
|
|
|
|
|
|
|
|
|
|
|
|
|
|||||||||||||||
| Balances as of May 31, 2016 |
4,131 | 24,217 | 23,888 | (816 | ) | 47,289 | 501 | 47,790 | ||||||||||||||||||||
| Common stock issued under stock-based compensation plans | 95 | 2,063 | — | — | 2,063 | — | 2,063 | |||||||||||||||||||||
| Common stock issued under stock purchase plans |
3 | 118 | — | — | 118 | — | 118 | |||||||||||||||||||||
| Assumption of stock-based compensation plan awards in connection with acquisitions |
— | 90 | — | — | 90 | — | 90 | |||||||||||||||||||||
| Stock-based compensation |
— | 1,350 | — | — | 1,350 | — | 1,350 | |||||||||||||||||||||
| Repurchase of common stock |
(86 | ) | (504 | ) | (2,988 | ) | — | (3,492 | ) | — | (3,492 | ) | ||||||||||||||||
| Shares repurchased for tax withholdings upon vesting of restricted stock-based awards |
(6 | ) | (283 | ) | — | — | (283 | ) | — | (283 | ) | |||||||||||||||||
| Cash dividends declared ($0.64 per share) |
— | — | (2,631 | ) | — | (2,631 | ) | — | (2,631 | ) | ||||||||||||||||||
| Other, net |
— | 14 | (6 | ) | — | 8 | 11 | 19 | ||||||||||||||||||||
| Distributions to noncontrolling interests |
— | — | — | — | — | (258 | ) | (258 | ) | |||||||||||||||||||
| Other comprehensive income, net |
— | — | — | 13 | 13 | 14 | 27 | |||||||||||||||||||||
| Net income |
— | — | 9,335 | — | 9,335 | 118 | 9,453 | |||||||||||||||||||||
|
|
|
|
|
|
|
|
|
|
|
|
|
|
|
|||||||||||||||
| Balances as of May 31, 2017 |
4,137 | 27,065 | 27,598 | (803 | ) | 53,860 | 386 | 54,246 | ||||||||||||||||||||
| Common stock issued under stock-based compensation plans | 105 | 2,277 | — | — | 2,277 | — | 2,277 | |||||||||||||||||||||
| Common stock issued under stock purchase plans |
3 | 125 | — | — | 125 | — | 125 | |||||||||||||||||||||
| Assumption of stock-based compensation plan awards in connection with acquisitions |
— | 3 | — | — | 3 | — | 3 | |||||||||||||||||||||
| Stock-based compensation |
— | 1,607 | — | — | 1,607 | — | 1,607 | |||||||||||||||||||||
| Repurchase of common stock |
(238 | ) | (1,632 | ) | (9,871 | ) | — | (11,503 | ) | — | (11,503 | ) | ||||||||||||||||
| Shares repurchased for tax withholdings upon vesting of restricted stock-based awards |
(10 | ) | (506 | ) | — | — | (506 | ) | — | (506 | ) | |||||||||||||||||
| Cash dividends declared ($0.76 per share) |
— | — | (3,140 | ) | — | (3,140 | ) | — | (3,140 | ) | ||||||||||||||||||
| Other, net |
— | 11 | — | — | 11 | 11 | 22 | |||||||||||||||||||||
| Distributions to noncontrolling interests |
— | — | — | — | — | (34 | ) | (34 | ) | |||||||||||||||||||
| Other comprehensive loss, net |
— | — | — | (833 | ) | (833 | ) | — | (833 | ) | ||||||||||||||||||
| Net income |
— | — | 3,825 | — | 3,825 | 135 | 3,960 | |||||||||||||||||||||
|
|
|
|
|
|
|
|
|
|
|
|
|
|
|
|||||||||||||||
| Balances as of May 31, 2018 |
3,997 | $ | 28,950 | $ | 18,412 | $ | (1,636 | ) | $ | 45,726 | $ | 498 | $ | 46,224 | ||||||||||||||
|
|
|
|
|
|
|
|
|
|
|
|
|
|
|
|||||||||||||||
See notes to consolidated financial statements.
77
Table of Contents
Index to Financial Statements
CONSOLIDATED STATEMENTS OF CASH FLOWS
For the Years Ended May 31, 2018, 2017 and 2016
| Year Ended May 31, | ||||||||||||
| (in millions) |
2018 | 2017 | 2016 | |||||||||
| Cash flows from operating activities: |
||||||||||||
| Net income |
$ | 3,825 | $ | 9,335 | $ | 8,901 | ||||||
| Adjustments to reconcile net income to net cash provided by operating activities: |
||||||||||||
| Depreciation |
1,165 | 1,000 | 871 | |||||||||
| Amortization of intangible assets |
1,620 | 1,451 | 1,638 | |||||||||
| Allowances for doubtful accounts receivable |
146 | 129 | 130 | |||||||||
| Deferred income taxes |
(611 | ) | (486 | ) | (105 | ) | ||||||
| Stock-based compensation |
1,607 | 1,350 | 1,037 | |||||||||
| Other, net |
(26 | ) | 123 | 143 | ||||||||
| Changes in operating assets and liabilities, net of effects from acquisitions: |
||||||||||||
| (Increase) decrease in trade receivables, net |
(117 | ) | 18 | 96 | ||||||||
| Increase in prepaid expenses and other assets |
(276 | ) | (24 | ) | (2 | ) | ||||||
| Decrease in accounts payable and other liabilities |
(264 | ) | (37 | ) | (13 | ) | ||||||
| Increase in income taxes payable |
8,143 | 732 | 313 | |||||||||
| Increase in deferred revenues |
174 | 535 | 676 | |||||||||
|
|
|
|
|
|
|
|||||||
| Net cash provided by operating activities |
15,386 | 14,126 | 13,685 | |||||||||
|
|
|
|
|
|
|
|||||||
| Cash flows from investing activities: |
||||||||||||
| Purchases of marketable securities and other investments |
(25,282 | ) | (25,867 | ) | (24,562 | ) | ||||||
| Proceeds from maturities and sales of marketable securities and other investments |
23,117 | 17,615 | 21,247 | |||||||||
| Acquisitions, net of cash acquired |
(1,724 | ) | (11,221 | ) | (650 | ) | ||||||
| Capital expenditures |
(1,736 | ) | (2,021 | ) | (1,189 | ) | ||||||
|
|
|
|
|
|
|
|||||||
| Net cash used for investing activities |
(5,625 | ) | (21,494 | ) | (5,154 | ) | ||||||
|
|
|
|
|
|
|
|||||||
| Cash flows from financing activities: |
||||||||||||
| Payments for repurchases of common stock |
(11,347 | ) | (3,561 | ) | (10,440 | ) | ||||||
| Proceeds from issuances of common stock |
2,402 | 2,181 | 1,425 | |||||||||
| Shares repurchased for tax withholdings upon vesting of restricted stock-based awards |
(506 | ) | (283 | ) | (89 | ) | ||||||
| Payments of dividends to stockholders |
(3,140 | ) | (2,631 | ) | (2,541 | ) | ||||||
| Proceeds from borrowings, net of issuance costs |
12,443 | 17,732 | 3,750 | |||||||||
| Repayments of borrowings |
(9,800 | ) | (4,094 | ) | (2,000 | ) | ||||||
| Distributions to noncontrolling interests |
(34 | ) | (258 | ) | (85 | ) | ||||||
|
|
|
|
|
|
|
|||||||
| Net cash (used for) provided by financing activities |
(9,982 | ) | 9,086 | (9,980 | ) | |||||||
|
|
|
|
|
|
|
|||||||
| Effect of exchange rate changes on cash and cash equivalents |
57 | (86 | ) | (115 | ) | |||||||
|
|
|
|
|
|
|
|||||||
| Net (decrease) increase in cash and cash equivalents |
(164 | ) | 1,632 | (1,564 | ) | |||||||
| Cash and cash equivalents at beginning of period |
21,784 | 20,152 | 21,716 | |||||||||
|
|
|
|
|
|
|
|||||||
| Cash and cash equivalents at end of period |
$ | 21,620 | $ | 21,784 | $ | 20,152 | ||||||
|
|
|
|
|
|
|
|||||||
| Non-cash investing and financing transactions: |
||||||||||||
| Fair values of restricted stock-based awards and stock options assumed in connection with acquisitions |
$ | 3 | $ | 90 | $ | 1 | ||||||
| Change in unsettled repurchases of common stock |
$ | 154 | $ | (69 | ) | $ | (1 | ) | ||||
| Change in unsettled investment purchases |
$ | (303 | ) | $ | 73 | $ | (112 | ) | ||||
| Supplemental schedule of cash flow data: |
||||||||||||
| Cash paid for income taxes |
$ | 1,562 | $ | 1,983 | $ | 2,331 | ||||||
| Cash paid for interest |
$ | 1,910 | $ | 1,612 | $ | 1,616 | ||||||
See notes to consolidated financial statements.
78
Table of Contents
Index to Financial Statements
NOTES TO CONSOLIDATED FINANCIAL STATEMENTS
May 31, 2018
| 1. | ORGANIZATION AND SIGNIFICANT ACCOUNTING POLICIES |
Oracle Corporation provides products and services that address all aspects of corporate information technology (IT) environments—applications, platform and infrastructure. Our applications, platform and infrastructure offerings are delivered to customers worldwide through a variety of flexible and interoperable IT deployment models, including cloud-based, on-premise, or hybrid, which enable customer choice and flexibility. Our Oracle Cloud offerings provide a comprehensive and fully integrated stack of applications, platform, compute, storage and networking services in all three primary layers of the cloud: Software as a Service (SaaS), Platform as a Service (PaaS) and Infrastructure as a Service (IaaS). Our Oracle Cloud SaaS, PaaS and IaaS offerings (collectively, “Oracle Cloud Services”) integrate the software, hardware and services on customers’ behalf in IT environments that we deploy, support and manage for the customer. We offer our customers the option to deploy our comprehensive set of cloud offerings including Oracle Cloud Services or to purchase our software and hardware products and related services to manage their own cloud-based or on-premise IT environments. Customers that purchase our software products may elect to purchase license support contracts, which provide our customers with rights to unspecified license upgrades and maintenance releases issued during the support period as well as technical support assistance. Customers that purchase our hardware products may elect to purchase hardware support contracts, which provide customers with software updates and can include product repairs, maintenance services, and technical support services. We also offer customers a broad set of services offerings that are designed to improve customer utilization of their investments in Oracle applications, platform and infrastructure technologies.
Oracle Corporation conducts business globally and was incorporated in 2005 as a Delaware corporation and is the successor to operations originally begun in June 1977.
Basis of Financial Statements
The consolidated financial statements included our accounts and the accounts of our wholly- and majority-owned subsidiaries. Noncontrolling interest positions of certain of our consolidated entities are reported as a separate component of consolidated equity from the equity attributable to Oracle’s stockholders for all periods presented. The noncontrolling interests in our net income were not significant to our consolidated results for the periods presented and therefore have been included as a component of non-operating income, net in our consolidated statements of operations. Intercompany transactions and balances have been eliminated. Certain other prior year balances have been reclassified to conform to the current year presentation. Such reclassifications did not affect total revenues, operating income or net income.
In fiscal 2018, we adopted Accounting Standards Update (ASU) No. 2017-04, Intangibles-Goodwill and Other (Topic 350): Simplifying the Test for Goodwill Impairment (ASU 2017-04). The ASU simplifies the accounting for goodwill impairment by removing Step 2 of the goodwill impairment test. Under the legacy guidance, Step 2 of the goodwill impairment test required entities to calculate the implied fair value of goodwill in the same manner as the amount of goodwill recognized in a business combination by assigning the fair value of a reporting unit to all of the assets and liabilities of the reporting unit. The carrying value in excess of the implied fair value was recognized as goodwill impairment. Under the new standard, goodwill impairment is recognized as the carrying value in excess of the reporting unit’s fair value, limited to the total amount of goodwill allocated to the reporting unit. ASU 2017-04 did not have a material impact on our consolidated financial statements.
Impacts of the U.S. Tax Cuts and Jobs Act of 2017
The comparability of our operating results in fiscal 2018 compared to the corresponding prior year periods, and of our consolidated balance sheets as of May 31, 2018 relative to May 31, 2017, was impacted by the U.S. Tax Cuts and Jobs Act of 2017 (the Tax Act), which was signed into law on December 22, 2017. Effective January 1, 2018, the Tax Act reduces the U.S. federal corporate tax rate from 35% to 21%; creates a quasi-territorial tax
79
Table of Contents
Index to Financial Statements
ORACLE CORPORATION
NOTES TO CONSOLIDATED FINANCIAL STATEMENTS—(Continued)
May 31, 2018
system that a) generally allows, among other provisions, companies to repatriate certain foreign source earnings without incurring additional U.S. income tax for such earnings generated after December 31, 2017 and b) generally requires companies to pay a one-time transition tax on certain foreign subsidiary earnings generated prior to December 31, 2017 that, in substantial part, were previously tax deferred; creates new taxes on certain foreign sourced earnings; limits deductibility of certain future compensation arrangements to certain highly compensated employees; and provides tax incentives for the exportation of U.S. products to foreign jurisdictions and for the purchase of qualifying capital equipment, among other provisions.
Because we have a May 31 fiscal year end, our fiscal 2018 blended U.S. federal statutory tax rate was approximately 29%.
During fiscal 2018, our provision for income taxes increased and our net income decreased, primarily as a result of the following items related to the enactment of the Tax Act:
| • | $7.8 billion of income tax expense, which we refined by a $166 million increase as of May 31, 2018 from our initial estimate made in our third quarter of fiscal 2018 in accordance with U.S. Securities and Exchange Commission (SEC) Staff Accounting Bulletin No. 118 (SAB 118), related to the application of the one-time transition tax to certain foreign subsidiary earnings that were generated prior to December 31, 2017 and for which such expense was substantially recorded to non-current income taxes payable in our consolidated balance sheet and corresponds to the amount we currently expect to periodically settle over an eight year period as provided by the Tax Act; |
partially offset by:
| • | $820 million of income tax benefit, which we refined by a $76 million increase as of May 31, 2018 from our initial estimate made in our third quarter of fiscal 2018 in accordance with SAB 118, related to the remeasurement of our net deferred tax liabilities based on the rates at which they are expected to reverse in the future; and |
| • | the net favorable impacts of the Tax Act on our tax profile and effective tax rate beginning on January 1, 2018, which we generally expect will continue into future periods. |
The net expense related to the enactment of the Tax Act has been accounted for during fiscal 2018 based on provisional estimates pursuant to SAB 118. Subsequent adjustments, if any, will be accounted for in the period such adjustments are identified. The provisional estimates incorporate, among other factors, assumptions made based on interpretations of the Tax Act and existing tax laws and a range of historical financial and tax-specific facts and information, including among other items, the amount of cash and other specified assets and liabilities of the company and its foreign subsidiaries on relevant dates and estimates of deferred tax balances pending finalization of those balances.
Use of Estimates
Our consolidated financial statements are prepared in accordance with U.S. generally accepted accounting principles (GAAP) as set forth in the Financial Accounting Standards Board’s (FASB) Accounting Standards Codification (ASC), and we consider the various staff accounting bulletins and other applicable guidance issued by the SEC. These accounting principles require us to make certain estimates, judgments and assumptions. We believe that the estimates, judgments and assumptions upon which we rely are reasonable based upon information available to us at the time that these estimates, judgments and assumptions are made. These estimates, judgments and assumptions can affect the reported amounts of assets and liabilities as of the date of the financial statements as well as the reported amounts of revenues and expenses during the periods presented. To the extent that there are differences between these estimates, judgments or assumptions and actual results, our consolidated financial statements will be affected. In many cases, the accounting treatment of a particular transaction is specifically dictated by GAAP and does not require management’s judgment in its
80
Table of Contents
Index to Financial Statements
ORACLE CORPORATION
NOTES TO CONSOLIDATED FINANCIAL STATEMENTS—(Continued)
May 31, 2018
application. There are also areas in which management’s judgment in selecting among available alternatives would not produce a materially different result.
Revenue Recognition
Our sources of revenues include:
| • | cloud and license revenues, which include the sale of: cloud services and license support; and cloud license and on-premise licenses, which represent licenses purchased by customers for use in both cloud and on-premise deployments; |
| • | hardware revenues, which include the sale of hardware products including Oracle Engineered Systems, servers, and storage products, and industry-specific hardware; and hardware support revenues; and |
| • | services revenues, which are earned from providing cloud-, license- and hardware-related services including consulting, advanced customer support and education services. |
Revenue Recognition for Cloud Services Offerings, Hardware Products, Hardware Support and Related Services (Non-software Elements)
Our revenue recognition policy for non-software deliverables including our cloud services offerings, hardware products, hardware support and related services is based upon the accounting guidance contained in ASC 605-25, Revenue Recognition, Multiple-Element Arrangements, and we exercise judgment and use estimates in connection with the determination of the amount of cloud services revenues, hardware products revenues, hardware support and related services revenues to be recognized in each accounting period.
Revenues from the sales of our non-software elements are recognized when: (1) persuasive evidence of an arrangement exists; (2) we deliver the products or services; (3) the sale price is fixed or determinable; and (4) collection is reasonably assured. Revenues that are not recognized at the time of sale because the foregoing conditions are not met are recognized when those conditions are subsequently met.
Revenues for our cloud services offerings sold on a subscription basis are generally recognized ratably over the contract term commencing with the date the service is made available to customers. Revenues for cloud services offerings sold on a usage basis are generally recognized as the customer consumes the service, provided all other revenue recognition criteria have been satisfied.
Revenues from the sale of hardware products are generally recognized upon delivery of the hardware product to the customer provided all other revenue recognition criteria are satisfied. Hardware support contracts are entered into at the customer’s option and are recognized ratably over the contractual term of the arrangements, which is typically one year, provided all other revenue recognition criteria have been satisfied.
Revenue Recognition for Multiple-Element Arrangements—Cloud Services Offerings, Hardware Products, Hardware Support and Related Services (Non-software Arrangements)
We enter into arrangements with customers that purchase non-software related products and services from us at the same time, or within close proximity of one another (referred to as non-software multiple-element arrangements). Each element within a non-software multiple-element arrangement is accounted for as a separate unit of accounting provided the following criteria are met: the delivered products or services have value to the customer on a standalone basis; and for an arrangement that includes a general right of return relative to the delivered products or services, delivery or performance of the undelivered product or service is considered probable and is substantially controlled by us. We consider a deliverable to have standalone value if the product or service is sold separately by us or another vendor or could be resold by the customer. Further, our revenue arrangements generally do not include a general right of return relative to the delivered products.
81
Table of Contents
Index to Financial Statements
ORACLE CORPORATION
NOTES TO CONSOLIDATED FINANCIAL STATEMENTS—(Continued)
May 31, 2018
Where the aforementioned criteria for a separate unit of accounting are not met, the deliverable is combined with the undelivered element(s) and treated as a single unit of accounting for the purposes of allocation of the arrangement consideration and revenue recognition. For those units of accounting that include more than one deliverable but are treated as a single unit of accounting, we generally recognize revenues over the contractual period of the arrangement, or in the case of our cloud services offerings, we generally recognize revenues over the contractual term of the cloud services subscription. For the purposes of revenue classification of the elements that are accounted for as a single unit of accounting, we allocate revenue to the respective revenue line items within our consolidated statements of operations based on a rational and consistent methodology utilizing our best estimate of relative selling prices of such elements.
For our non-software multiple-element arrangements, we allocate revenue to each element based on a selling price hierarchy at the arrangement’s inception. The selling price for each element is based upon the following selling price hierarchy: vendor-specific objective evidence (VSOE) if available, third-party evidence (TPE) if VSOE is not available, or estimated selling price (ESP) if neither VSOE nor TPE are available (a description as to how we determine VSOE, TPE and ESP is provided below). If a tangible hardware product includes software, we determine whether the tangible hardware product and the software work together to deliver the product’s essential functionality and, if so, the entire product is treated as a non-software deliverable. The total arrangement consideration is allocated to each separate unit of accounting for each of the non-software deliverables using the relative selling prices of each unit based on the selling price hierarchy. We limit the amount of revenue recognized for delivered elements to an amount that is not contingent upon future delivery of additional products or services or meeting of any specified performance conditions.
When possible, we establish VSOE of selling price for deliverables in software and non-software multiple-element arrangements using the price charged for a deliverable when sold separately. TPE is established by evaluating similar and interchangeable competitor products or services in standalone arrangements with similarly situated customers. If we are unable to determine the selling price because VSOE or TPE does not exist, we determine ESP for the purposes of allocating the arrangement by reviewing historical transactions, including transactions whereby the deliverable was sold on a standalone basis and considering several other external and internal factors.
Revenue Recognition for Cloud License and On-Premise License and License Related Services (Software Elements)
The basis for our cloud license and on-premise license revenues and related services revenue recognition is substantially governed by the accounting guidance contained in ASC 985-605, Software-Revenue Recognition. We exercise judgment and use estimates in connection with the determination of the amount of cloud license and on-premise license revenues and related services revenues to be recognized in each accounting period.
For license arrangements that do not require significant modification or customization of the underlying license, we recognize cloud license and on-premise license revenues when: (1) we enter into a legally binding arrangement with a customer for the license of software; (2) we deliver the products; (3) the sale price is fixed or determinable and free of contingencies or significant uncertainties; and (4) collection is probable. Revenues that are not recognized at the time of license sale because the foregoing conditions are not met, are generally recognized when those conditions are subsequently met.
The vast majority of our cloud license and on-premise license arrangements include license support contracts, which are entered into at the customer’s option. We recognize the related fees ratably over the term of the arrangement, typically one year. License support contracts provide customers with rights to unspecified software product upgrades, maintenance releases and patches released during the term of the support period and include internet access to technical content, as well as internet and telephone access to technical support personnel. License support contracts are generally priced as a percentage of the net cloud license and
82
Table of Contents
Index to Financial Statements
ORACLE CORPORATION
NOTES TO CONSOLIDATED FINANCIAL STATEMENTS—(Continued)
May 31, 2018
on-premise license fees and are generally invoiced in full at the beginning of the support term. Substantially all of our customers renew their license support contracts annually.
Revenue Recognition for Multiple-Element Arrangements—Cloud License and On-Premise License, Support and Related Services (Software Arrangements)
We often enter into arrangements with customers that purchase cloud licenses and on-premise licenses, license support and related services from us at the same time, or within close proximity of one another (referred to as software related multiple-element arrangements). For those software related multiple-element arrangements, we have applied the residual method to determine the amount of cloud license and on-premise license revenues to be recognized pursuant to ASC 985-605. Under the residual method, if VSOE exists for undelivered elements in a multiple-element arrangement, VSOE of the undelivered elements is deferred with the remaining portion of the arrangement consideration generally recognized upon delivery of the license. Where VSOE does not exist for the undelivered element in such arrangement, no revenue is recognized until the earlier of the point in time at which 1) VSOE has been established for such element; or 2) the element that does not have VSOE has been delivered.
Revenue Recognition for Multiple-Element Arrangements—Arrangements with Software and Non-software Elements
We also enter into multiple-element arrangements that may include a combination of our various software related and non-software related products and services offerings including cloud licenses and on-premise licenses, license support, cloud services offerings, hardware products, hardware support, consulting, advanced customer support services and education. In such arrangements, we first allocate the total arrangement consideration based on the relative selling prices of the software group of elements as a whole and the non-software group of elements. We then further allocate consideration within the software group to the respective elements within that group following the guidance in ASC 985-605 and our policies as described above. In addition, we allocate the consideration within the non-software group to each respective element within that group based on a selling price hierarchy at the arrangement’s inception as described above. After the arrangement consideration has been allocated to the software group of elements and non-software group of elements, we account for each respective element in the arrangement as described above and below.
Other Revenue Recognition Policies Applicable to Software and Non-software Elements
Many of our cloud license and on-premise license arrangements include consulting implementation services sold separately under consulting engagement contracts and are included as a part of our services business. Consulting revenues from these arrangements are generally accounted for separately from cloud license and on-premise license revenues because the arrangements qualify as services transactions as defined in ASC 985-605. The more significant factors considered in determining whether the revenues should be accounted for separately include the nature of services (i.e., consideration of whether the services are essential to the functionality of the licensed product), degree of risk, availability of services from other vendors, timing of payments and impact of milestones or acceptance criteria on the realizability of the license fee. Revenues for consulting services are generally recognized as the services are performed.
If an arrangement contains multiple elements and does not qualify for separate accounting for the product and service transactions, then cloud license and on-premise license revenues and/or hardware products revenues, including the costs of hardware products, are generally recognized together with the services based on contract accounting using either the percentage-of-completion or completed-contract method.
We also evaluate arrangements with governmental entities containing “fiscal funding” or “termination for convenience” provisions, when such provisions are required by law, to determine the probability of possible
83
Table of Contents
Index to Financial Statements
ORACLE CORPORATION
NOTES TO CONSOLIDATED FINANCIAL STATEMENTS—(Continued)
May 31, 2018
cancellation. We consider multiple factors, including the history with the customer in similar transactions, the “essential use” of the license or hardware products and the planning, budgeting and approval processes undertaken by the governmental entity. If we determine upon execution of these arrangements that the likelihood of cancellation is remote, we then recognize revenues for such arrangements once all of the criteria described above have been met. If such a determination cannot be made, revenues are recognized upon the earlier of cash receipt or approval of the applicable funding provision by the governmental entity for such arrangements.
We assess whether fees are fixed or determinable at the time of sale and recognize revenues if all other revenue recognition requirements are met. Our standard payment terms are net 30 days. However, payment terms may vary based on the country in which the agreement is executed. We evaluate non-standard payment terms based on whether we have successful collection history on comparable arrangements (based upon similarity of customers, products, and arrangement economics) and, if so, generally conclude such payment terms are fixed and determinable and thereby satisfy the required criteria for revenue recognition.
While most of our arrangements for sales within our businesses include short-term payment terms, we have a standard practice of providing long-term financing to creditworthy customers primarily through our financing division. Since fiscal 1989, when our financing division was formed, we have established a history of collection, without concessions, on these receivables with payment terms that generally extend up to five years from the contract date. Provided all other revenue recognition criteria have been met, we recognize cloud license and on-premise license revenues and hardware products revenues for these arrangements upon delivery, net of any payment discounts from financing transactions. We have generally sold receivables financed through our financing division on a non-recourse basis to third-party financing institutions within 90 days of the contracts’ dates of execution and we classify the proceeds from these sales as cash flows from operating activities in our consolidated statements of cash flows. We account for the sales of these receivables as “true sales” as defined in ASC 860, Transfers and Servicing, as we are considered to have surrendered control of these financing receivables.
Our customers include several of our suppliers and, occasionally, we have purchased goods or services for our operations from these vendors at or about the same time that we have sold our products to these same companies (Concurrent Transactions). License agreements, sales of hardware or sales of services that occur within a common time period from the date we have purchased goods or services from that same customer are reviewed for appropriate accounting treatment and disclosure. When we acquire goods or services from a customer, we negotiate the purchase separately from any sales transaction, at terms we consider to be at arm’s length and settle the purchase in cash. We recognize revenues from Concurrent Transactions if all of our revenue recognition criteria are met and the goods and services acquired are necessary for our current operations.
Business Combinations
We apply the provisions of ASC 805, Business Combinations, in accounting for our acquisitions. ASC 805 requires us to recognize separately from goodwill the assets acquired and the liabilities assumed at the acquisition date fair values. Goodwill as of the acquisition date is measured as the excess of consideration transferred over the net of the acquisition date fair values of the assets acquired and the liabilities assumed. While we use our best estimates and assumptions to accurately value assets acquired and liabilities assumed at the acquisition date as well as any contingent consideration, where applicable, our estimates are inherently uncertain and subject to refinement. As a result, during the measurement period, which may be up to one year from the acquisition date, we record adjustments to the assets acquired and liabilities assumed with the corresponding offset to goodwill. Upon the conclusion of the measurement period or final determination of the values of assets acquired or liabilities assumed, whichever comes first, any subsequent adjustments are recorded to our consolidated statements of operations.
84
Table of Contents
Index to Financial Statements
ORACLE CORPORATION
NOTES TO CONSOLIDATED FINANCIAL STATEMENTS—(Continued)
May 31, 2018
Costs to exit or restructure certain activities of an acquired company or our internal operations are accounted for as termination and exit costs pursuant to ASC 420, Exit or Disposal Cost Obligations, and are accounted for separately from the business combination. A liability for costs associated with an exit or disposal activity is recognized and measured at its fair value in our consolidated statement of operations in the period in which the liability is incurred. When estimating the fair value of facility restructuring activities, assumptions are applied regarding estimated sub-lease payments to be received, which can differ materially from actual results. This may require us to revise our initial estimates which may materially affect our results of operations and financial position in the period the revision is made.
For a given acquisition, we may identify certain pre-acquisition contingencies as of the acquisition date and may extend our review and evaluation of these pre-acquisition contingencies throughout the measurement period in order to obtain sufficient information to assess whether we include these contingencies as a part of the fair value estimates of assets acquired and liabilities assumed and, if so, to determine their estimated amounts.
If we cannot reasonably determine the fair value of a pre-acquisition contingency (non-income tax related) by the end of the measurement period, which is generally the case given the nature of such matters, we will recognize an asset or a liability for such pre-acquisition contingency if: (1) it is probable that an asset existed or a liability had been incurred at the acquisition date and (2) the amount of the asset or liability can be reasonably estimated. Subsequent to the measurement period, changes in our estimates of such contingencies will affect earnings and could have a material effect on our results of operations and financial position.
In addition, uncertain tax positions and tax related valuation allowances assumed in connection with a business combination are initially estimated as of the acquisition date. We reevaluate these items quarterly based upon facts and circumstances that existed as of the acquisition date with any adjustments to our preliminary estimates being recorded to goodwill if identified within the measurement period. Subsequent to the measurement period or our final determination of the tax allowance’s or contingency’s estimated value, whichever comes first, changes to these uncertain tax positions and tax related valuation allowances will affect our provision for income taxes in our consolidated statement of operations and could have a material impact on our results of operations and financial position.
Marketable and Non-Marketable Securities
In accordance with ASC 320, Investments—Debt and Equity Securities, and based on our intentions regarding these instruments, we classify substantially all of our marketable debt and equity securities as available-for-sale. Marketable debt and equity securities classified as available-for-sale are reported at fair value, with all unrealized gains (losses) reflected net of tax in stockholders’ equity on our consolidated balance sheets, and as a line item in our consolidated statements of comprehensive income. If we determine that an investment has an other than temporary decline in fair value, we recognize the investment loss in non-operating income, net in the accompanying consolidated statements of operations. We periodically evaluate our investments to determine if impairment charges are required. Substantially all of our marketable debt and equity investments are classified as current based on the nature of the investments and their availability for use in current operations.
We hold investments in certain non-marketable equity securities in which we do not have a controlling interest or significant influence. These equity securities are recorded at cost and included in other non-current assets in the accompanying consolidated balance sheets. If based on the terms of our ownership of these non-marketable securities, we determine that we exercise significant influence on the entity to which these non-marketable securities relate, we apply the requirements of ASC 323, Investments—Equity Method and Joint Ventures, to account for such investments. Our non-marketable securities are subject to periodic impairment reviews.
85
Table of Contents
Index to Financial Statements
ORACLE CORPORATION
NOTES TO CONSOLIDATED FINANCIAL STATEMENTS—(Continued)
May 31, 2018
Fair Values of Financial Instruments
We apply the provisions of ASC 820, Fair Value Measurement (ASC 820), to our assets and liabilities that we are required to measure at fair value pursuant to other accounting standards, including our investments in marketable debt and equity securities and our derivative financial instruments.
The additional disclosures regarding our fair value measurements are included in Note 4.
Allowances for Doubtful Accounts
We record allowances for doubtful accounts based upon a specific review of all significant outstanding invoices. For those invoices not specifically reviewed, provisions are provided at differing rates, based upon the age of the receivable, the collection history associated with the geographic region that the receivable was recorded in and current economic trends. We write-off a receivable and charge it against its recorded allowance when we have exhausted our collection efforts without success.
Concentrations of Risk
Financial instruments that are potentially subject to concentrations of credit risk consist primarily of cash and cash equivalents, marketable securities, derivatives and trade receivables. Our cash and cash equivalents are generally held with large, diverse financial institutions worldwide to reduce the amount of exposure to any single financial institution. Investment policies have been implemented that limit purchases of marketable debt securities to investment-grade securities. Our derivative contracts are transacted with various financial institutions with high credit standings and any exposure to counterparty credit-related losses in these contracts is largely mitigated with collateral security agreements that provide for collateral to be received or posted when the net fair values of these contracts fluctuate from contractually established thresholds. We generally do not require collateral to secure accounts receivable. The risk with respect to trade receivables is mitigated by credit evaluations we perform on our customers, the short duration of our payment terms for the significant majority of our customer contracts and by the diversification of our customer base. No single customer accounted for 10% or more of our total revenues in fiscal 2018, 2017 or 2016.
We outsource the manufacturing, assembly and delivery of certain of our hardware products to a variety of companies, many of which are located outside the United States. Further, we have simplified our supply chain processes by reducing the number of third-party manufacturing partners and the number of locations where these third-party manufacturers build our hardware products. Any inability of these third-party manufacturing partners to deliver the contracted services for our hardware products could adversely impact future operating results of our hardware business.
Inventories
Inventories are stated at the lower of cost or net realizable value. Cost is computed using standard cost, which approximates actual cost, on a first-in, first-out basis. We evaluate our ending inventories for estimated excess quantities and obsolescence. This evaluation includes analysis of sales levels by product and projections of future demand within specific time horizons (generally six to nine months). Inventories in excess of future demand are written down and charged to hardware expenses. In addition, we assess the impact of changing technology to our inventories and we write down inventories that are considered obsolete. At the point of loss recognition, a new, lower-cost basis for that inventory is established, and subsequent changes in facts and circumstances do not result in the restoration or increase in that newly established cost basis. Inventories are included in prepaid expenses and other current assets in our consolidated balance sheets and totaled $398 million and $300 million at May 31, 2018 and 2017, respectively.
86
Table of Contents
Index to Financial Statements
ORACLE CORPORATION
NOTES TO CONSOLIDATED FINANCIAL STATEMENTS—(Continued)
May 31, 2018
Other Receivables
Other receivables represent value-added tax and sales tax receivables associated with the sale of our products and services to third parties. Other receivables are included in prepaid expenses and other current assets in our consolidated balance sheets and totaled $802 million and $794 million at May 31, 2018 and 2017, respectively.
Deferred Sales Commissions
We defer sales commission expenses associated with our cloud SaaS, PaaS and IaaS offerings, and recognize the related expenses over the non-cancelable terms of the related contracts, which are typically one to three years. The current portion of the deferred sales commissions balances are included in prepaid expenses and other current assets and the non-current portion of the deferred sales commissions balances are included in other assets as of May 31, 2018 and 2017. Amortization of deferred sales commissions is included as a component of sales and marketing expenses in our consolidated statements of operations.
Property, Plant and Equipment
Property, plant and equipment are stated at the lower of cost or realizable value, net of accumulated depreciation. Depreciation is computed using the straight-line method based on estimated useful lives of the assets, which range from one to 40 years. Leasehold improvements are amortized over the lesser of the estimated useful lives of the improvements or the lease terms, as appropriate. Property, plant and equipment are periodically reviewed for impairment whenever events or changes in circumstances indicate that the carrying amount of an asset may not be recoverable. We did not recognize any significant property impairment charges in fiscal 2018, 2017 or 2016.
Goodwill, Intangible Assets and Impairment Assessments
Goodwill represents the excess of the purchase price in a business combination over the fair value of net tangible and intangible assets acquired. Intangible assets that are not considered to have an indefinite useful life are amortized over their useful lives, which generally range from one to 10 years. Each period we evaluate the estimated remaining useful lives of purchased intangible assets and whether events or changes in circumstances warrant a revision to the remaining periods of amortization.
The carrying amounts of our goodwill and intangible assets are periodically reviewed for impairment (at least annually for goodwill and indefinite lived intangible assets) and whenever events or changes in circumstances indicate that the carrying value of these assets may not be recoverable. When goodwill is assessed for impairment, we have the option to perform an assessment of qualitative factors of impairment (optional assessment) prior to necessitating a quantitative impairment test. Should the optional assessment be used for any given fiscal year, qualitative factors to consider include cost factors; financial performance; legal, regulatory, contractual, political, business, or other factors; entity specific factors; industry and market considerations, macroeconomic conditions, and other relevant events and factors affecting the reporting unit. If we determine that it is more likely than not that the fair value of the reporting unit is less than its carrying value, a quantitative test is then performed. Otherwise, no further testing is required. For those reporting units tested using a quantitative approach, we compare the fair value of each reporting unit with the carrying amount of the reporting unit, including goodwill. To determine the fair value of each reporting unit we utilize estimates, judgments and assumptions including estimated future cash flows the reporting unit is expected to generate on a discounted basis, future economic and market conditions, and market comparable of peer companies, among others. If the estimated fair value of the reporting unit is less than the carrying amount of the reporting unit, impairment is recognized for the difference, limited to the amount of goodwill recognized for the reporting unit. We did not recognize any goodwill impairment charges in fiscal 2018, 2017 or 2016.
Recoverability of finite lived intangible assets is measured by comparison of the carrying amount of the asset to the future undiscounted cash flows the asset is expected to generate. Recoverability of indefinite lived
87
Table of Contents
Index to Financial Statements
ORACLE CORPORATION
NOTES TO CONSOLIDATED FINANCIAL STATEMENTS—(Continued)
May 31, 2018
intangible assets is measured by comparison of the carrying amount of the asset to its fair value. If the asset is considered to be impaired, the amount of any impairment is measured as the difference between the carrying value and the fair value of the impaired asset. We did not recognize any intangible asset impairment charges in fiscal 2018, 2017 or 2016.
Derivative Financial Instruments
During fiscal 2018, 2017 and 2016, we used derivative and non-derivative financial instruments to manage foreign currency and interest rate risks (see Note 10 below for additional information). We account for these instruments in accordance with ASC 815, Derivatives and Hedging (ASC 815), which requires that every derivative instrument be recorded on the balance sheet as either an asset or liability measured at its fair value as of the reporting date. ASC 815 also requires that changes in our derivatives’ fair values be recognized in earnings, unless specific hedge accounting and documentation criteria are met (i.e., the instruments are accounted for as hedges).
The accounting for changes in the fair value of a derivative depends on the intended use of the derivative and the resulting designation. For a derivative instrument designated as a fair value hedge, loss or gain attributable to the risk being hedged is recognized in earnings in the period of change with a corresponding offset recorded to the item for which the risk is being hedged. For a derivative instrument designated as a cash flow hedge, each reporting period we record the change in fair value on the effective portion of the derivative to accumulated other comprehensive loss in our consolidated balance sheets, and an amount is reclassified out of accumulated other comprehensive loss into earnings to offset the earnings impact that is attributable to the risk being hedged. For the non-derivative financial instrument that was designated as a net investment hedge for our investments in certain of our international subsidiaries, the change on account of remeasurement of the effective portion for each reporting period was recorded to accumulated other comprehensive loss in our consolidated balance sheets until the net investment is sold, at which time the amounts are reclassified from accumulated other comprehensive loss to non-operating income, net.
We perform the effectiveness testing of our aforementioned designated hedges on a quarterly basis and material changes in ineffective portions of the derivatives, if any, are recognized immediately in earnings.
Legal and Other Contingencies
We are currently involved in various claims and legal proceedings. Quarterly, we review the status of each significant matter and assess our potential financial exposure. Descriptions of our accounting policies associated with contingencies assumed as a part of a business combination are provided under “Business Combinations” above. For legal and other contingencies that are not a part of a business combination or related to income taxes, we accrue a liability for an estimated loss if the potential loss from any claim or legal proceeding is considered probable, and the amount can be reasonably estimated. Note 17 below provides additional information regarding certain of our legal contingencies.
Shipping and Handling Costs
Our shipping and handling costs for hardware products sales are included in hardware expenses for all periods presented.
Foreign Currency
We transact business in various foreign currencies. In general, the functional currency of a foreign operation is the local country’s currency. Consequently, revenues and expenses of operations outside the United States are translated into U.S. Dollars using weighted-average exchange rates while assets and liabilities of operations outside the United States are translated into U.S. Dollars using exchange rates at the balance sheet dates. The
88
Table of Contents
Index to Financial Statements
ORACLE CORPORATION
NOTES TO CONSOLIDATED FINANCIAL STATEMENTS—(Continued)
May 31, 2018
effects of foreign currency translation adjustments are included in stockholders’ equity as a component of accumulated other comprehensive loss in the accompanying consolidated balance sheets and related periodic movements are summarized as a line item in our consolidated statements of comprehensive income. Net foreign exchange transaction losses included in non-operating income, net in the accompanying consolidated statements of operations were $74 million, $152 million and $110 million in fiscal 2018, 2017 and 2016, respectively.
Stock-Based Compensation
We account for share-based payments to employees, including grants of service-based restricted stock awards, performance-based restricted stock awards (PSUs), service-based employee stock options, performance-based stock options (PSOs), and purchases under employee stock purchase plans in accordance with ASC 718, Compensation—Stock Compensation, which requires that share-based payments (to the extent they are compensatory) be recognized in our consolidated statements of operations based on their fair values. We account for forfeitures of stock-based awards as they occur.
For our service-based stock awards, we recognize stock-based compensation expense on a straight-line basis over the service period of the award, which is generally four years.
For our PSUs and PSOs, we recognize stock-based compensation expense on a straight-line basis over the longer of the derived, explicit or implicit service period (which is the period of time expected for the performance condition to be satisfied). During our interim and annual reporting periods, stock-based compensation expense is recorded based on expected attainment of performance targets. Changes in our estimates of the expected attainment of performance targets that result in a change in the number of shares that are expected to vest, or changes in our estimates of implicit service periods may cause the amount of stock-based compensation expense that we record for each interim reporting period to vary. Any changes in estimates that impact our expectation of the number of shares that are expected to vest are reflected in the amount of stock-based compensation expense that we recognize for each PSU or PSO tranche on a cumulative catch up basis during each interim reporting period in which such estimates are altered. Changes in estimate of the implicit service period are recognized prospectively.
We record deferred tax assets for stock-based compensation awards that result in deductions on certain of our income tax returns based on the amount of stock-based compensation recognized and the fair values attributable to the vested portion of stock awards assumed in connection with a business combination at the statutory tax rates in the jurisdictions that we are able to recognize such tax deductions. The impacts of the actual tax deductions for stock-based awards that are realized in these jurisdictions are generally recognized in the reporting period that a restricted stock-based award vests or a stock option is exercised with any shortfall/windfall relative to the deferred tax asset established recorded as a discrete detriment/benefit to our provision for income taxes in such period.
Advertising
All advertising costs are expensed as incurred. Advertising expenses, which were included within sales and marketing expenses, were $138 million, $95 million and $68 million in fiscal 2018, 2017 and 2016, respectively.
Research and Development and Software Development Costs
All research and development costs are expensed as incurred.
Software development costs required to be capitalized under ASC 985-20, Costs of Software to be Sold, Leased or Marketed, and under ASC 350-40, Internal-Use Software, were not material to our consolidated financial statements in fiscal 2018, 2017 and 2016.
89
Table of Contents
Index to Financial Statements
ORACLE CORPORATION
NOTES TO CONSOLIDATED FINANCIAL STATEMENTS—(Continued)
May 31, 2018
Acquisition Related and Other Expenses
Acquisition related and other expenses consist of personnel related costs and stock-based compensation for transitional and certain other employees, integration related professional services, and certain business combination adjustments including certain adjustments after the measurement period has ended and certain other operating items, net.
| Year Ended May 31, | ||||||||||||
| (in millions) |
2018 | 2017 | 2016 | |||||||||
| Transitional and other employee related costs |
$ | 48 | $ | 41 | $ | 45 | ||||||
| Stock-based compensation |
1 | 35 | 3 | |||||||||
| Professional fees and other, net |
3 | 33 | 10 | |||||||||
| Business combination adjustments, net |
— | (6 | ) | (16 | ) | |||||||
|
|
|
|
|
|
|
|||||||
| Total acquisition related and other expenses |
$ | 52 | $ | 103 | $ | 42 | ||||||
|
|
|
|
|
|
|
|||||||
Non-Operating Income, net
Non-operating income, net consists primarily of interest income, net foreign currency exchange gains (losses), the noncontrolling interests in the net profits of our majority-owned subsidiaries (primarily Oracle Financial Services Software Limited and Oracle Corporation Japan) and net other income (losses), including net realized gains and losses related to all of our investments and net unrealized gains and losses related to the small portion of our investment portfolio that we classify as trading.
| Year Ended May 31, | ||||||||||||
| (in millions) |
2018 | 2017 | 2016 | |||||||||
| Interest income |
$ | 1,201 | $ | 802 | $ | 538 | ||||||
| Foreign currency losses, net |
(74 | ) | (152 | ) | (110 | ) | ||||||
| Noncontrolling interests in income |
(135 | ) | (118 | ) | (116 | ) | ||||||
| Other income (loss), net |
245 | 73 | (7 | ) | ||||||||
|
|
|
|
|
|
|
|||||||
| Total non-operating income, net |
$ | 1,237 | $ | 605 | $ | 305 | ||||||
|
|
|
|
|
|
|
|||||||
Income Taxes
We account for income taxes in accordance with ASC 740, Income Taxes (ASC 740). Deferred income taxes are recorded for the expected tax consequences of temporary differences between the tax bases of assets and liabilities for financial reporting purposes and amounts recognized for income tax purposes. We record a valuation allowance to reduce our deferred tax assets to the amount of future tax benefit that is more likely than not to be realized.
A two-step approach is applied pursuant to ASC 740 in the recognition and measurement of uncertain tax positions taken or expected to be taken in a tax return. The first step is to determine if the weight of available evidence indicates that it is more likely than not that the tax position will be sustained in an audit, including resolution of any related appeals or litigation processes. The second step is to measure the tax benefit as the largest amount that is more than 50% likely to be realized upon ultimate settlement. We recognize interest and penalties related to uncertain tax positions in our provision for income taxes line of our consolidated statements of operations.
A description of our accounting policies associated with tax related contingencies and valuation allowances assumed as a part of a business combination is provided under “Business Combinations” above.
90
Table of Contents
Index to Financial Statements
ORACLE CORPORATION
NOTES TO CONSOLIDATED FINANCIAL STATEMENTS—(Continued)
May 31, 2018
Recent Accounting Pronouncements
Comprehensive Income: In February 2018, the FASB issued ASU 2018-02, Income Statement—Reporting Comprehensive Income (Topic 220): Reclassification of Certain Tax Effects from Accumulated Other Comprehensive Income (ASU 2018-02), which allows companies to reclassify stranded tax effects resulting from the Tax Act, from accumulated other comprehensive income to retained earnings. The guidance also requires certain new disclosures regardless of the election. ASU 2018-02 is effective for us in the first quarter of fiscal 2020, and earlier adoption is permitted. We are currently evaluating the impact of our pending adoption of ASU 2018-02 on our consolidated financial statements.
Derivatives and Hedging: In August 2017, the FASB issued ASU 2017-12, Derivatives and Hedging (Topic 815): Targeted Improvements to Accounting for Hedging Activities (ASU 2017-12), which amends and simplifies existing guidance in order to allow companies to more accurately present the economic effects of risk management activities in the financial statements. ASU 2017-12 is effective for us in the first quarter of fiscal 2020, and earlier adoption is permitted. We are currently evaluating the impact of our pending adoption of ASU 2017-12 on our consolidated financial statements.
Retirement Benefits: In March 2017, the FASB issued ASU 2017-07, Compensation—Retirement Benefits (Topic 715): Improving the Presentation of Net Periodic Pension Cost and Net Periodic Postretirement Benefit Cost (ASU 2017-07), which provides guidance on the capitalization, presentation and disclosure of net benefit costs. ASU 2017-07 is effective for us in the first quarter of fiscal 2019. We currently do not expect that our pending adoption of ASU 2017-07 will have a material effect on our consolidated financial statements.
Income Taxes: In October 2016, the FASB issued ASU 2016-16, Income Taxes (Topic 740): Intra-Entity Transfers of Assets Other Than Inventory (ASU 2016-16), which changes the timing of when certain intercompany transactions are recognized within the provision for income taxes. ASU 2016-16 is effective for us in our first quarter of fiscal 2019 on a modified retrospective basis, and earlier adoption is permitted. We currently do not expect that our pending adoption of ASU 2016-16 will have a material effect on our consolidated financial statements.
Financial Instruments: In June 2016, the FASB issued ASU 2016-13, Financial Instruments—Credit Losses (Topic 326): Measurement of Credit Losses on Financial Instruments (ASU 2016-13), which requires measurement and recognition of expected credit losses for financial assets held. ASU 2016-13 is effective for us in our first quarter of fiscal 2021, and earlier adoption is permitted beginning in the first quarter of fiscal 2020. We are currently evaluating the impact of our pending adoption of ASU 2016-13 on our consolidated financial statements.
In January 2016, the FASB issued ASU 2016-01, Financial Instruments—Overall (Subtopic 825-10): Recognition and Measurement of Financial Assets and Financial Liabilities (ASU 2016-01), which addresses certain aspects of recognition, measurement, presentation, and disclosure of financial instruments. ASU 2016-01 is effective for us in our first quarter of fiscal 2019, and earlier adoption is not permitted except for certain provisions. We currently do not expect that our pending adoption of ASU 2016-01 will have a material effect on our consolidated financial statements.
Leases: In February 2016, the FASB issued ASU 2016-02, Leases (Topic 842) and issued subsequent amendments to the initial guidance in September 2017 within ASU 2017-13 (collectively, Topic 842). Topic 842 requires companies to generally recognize on the balance sheet operating and financing lease liabilities and corresponding right-of-use assets. Topic 842 is effective for us in our first quarter of fiscal 2020 on a modified retrospective basis, and earlier adoption is permitted. We are currently evaluating the impact of our pending adoption of Topic 842 on our consolidated financial statements. We currently expect that most of our operating lease commitments will be subject to the new standard and recognized as operating lease liabilities and right-of-use assets upon our adoption of Topic 842, which will increase our total assets and total liabilities that we report relative to such amounts prior to adoption.
91
Table of Contents
Index to Financial Statements
ORACLE CORPORATION
NOTES TO CONSOLIDATED FINANCIAL STATEMENTS—(Continued)
May 31, 2018
Revenue Recognition: In May 2014, the FASB issued ASU No. 2014-09, Revenue from Contracts with Customers, Topic 606 and subsequent amendments to the initial guidance: ASU 2015-14, ASU 2016-08, ASU 2016-10, ASU 2016-12, ASU 2016-20, ASU 2017-10, ASU 2017-13 and ASU 2017-14, (collectively, Topic 606), which is effective for us in our first quarter of fiscal 2019. Topic 606 supersedes nearly all existing revenue recognition guidance under GAAP. The core principle of Topic 606 is to recognize revenues when promised goods or services are transferred to customers in an amount that reflects the consideration that is expected to be received for those goods or services. Topic 606 defines a five-step process to achieve this core principle and, in doing so, it is possible more judgment and estimates may be required within the revenue recognition process than are required under existing GAAP, including identifying performance obligations in the contract, estimating the amount of variable consideration to include in the transaction price and allocating the transaction price to each separate performance obligation, among others. Topic 606 also provides guidance on the recognition of costs related to obtaining customer contracts, which will result in additional costs that will be capitalized. We will adopt the requirements of the new standard as of June 1, 2018, utilizing the full retrospective method of transition and will adjust our consolidated financial statements from amounts previously reported for the fiscal 2018 and 2017 periods. We do not believe there will be a material impact to our revenues or operating expenses upon adoption of Topic 606. We are continuing to evaluate the impact related to our pending adoption of Topic 606 and our preliminary assessments are subject to change.
| 2. | ACQUISITIONS |
Fiscal 2018 Acquisitions
Acquisition of Aconex Limited
On March 28, 2018, we completed our acquisition of Aconex Limited (Aconex), a provider of cloud-based collaboration software for construction projects. We have included the financial results of Aconex in our consolidated financial statements from the date of acquisition. These results were not individually material to our consolidated financial statements. The total preliminary purchase price for Aconex was approximately $1.2 billion, which consisted of approximately $1.2 billion in cash and $1 million for the fair values of stock options and restricted stock-based awards assumed. In connection with the Aconex acquisition, we have preliminarily recorded $32 million of net tangible assets and $368 million of identifiable intangible assets based on their estimated fair values, and $832 million of residual goodwill. Goodwill generated from our acquisition of Aconex was primarily attributable to synergies expected to arise after the acquisition and is not expected to be tax deductible.
Other Fiscal 2018 Acquisitions
During fiscal 2018, we acquired certain other companies and purchased certain technology and development assets primarily to expand our products and services offerings. These acquisitions were not significant individually or in the aggregate.
Fiscal 2017 Acquisitions
Acquisition of NetSuite Inc., a Related Party
On November 7, 2016, we completed our acquisition of NetSuite Inc. (NetSuite), a provider of cloud-based enterprise resource planning (ERP) software and related applications and a related party to Oracle. We acquired NetSuite to, among other things, expand our cloud software as a service offerings with a complementary set of cloud ERP and related cloud software applications for customers.
Lawrence J. Ellison, Oracle’s Chairman of the Board and Chief Technology Officer and Oracle’s largest stockholder, was an affiliate of NetSuite’s largest stockholder, NetSuite Restricted Holdings LLC (a single
92
Table of Contents
Index to Financial Statements
ORACLE CORPORATION
NOTES TO CONSOLIDATED FINANCIAL STATEMENTS—(Continued)
May 31, 2018
member LLC investment entity whose interests are beneficially owned by a trust controlled by Mr. Ellison), which owned approximately 40% of the issued and outstanding NetSuite Shares immediately prior to the conclusion of the merger.
The total purchase price for NetSuite was approximately $9.1 billion, which consisted of approximately $9.0 billion in cash and $78 million for the fair values of restricted stock-based awards and stock options assumed. In allocating the purchase price based on estimated fair values, we recorded approximately $6.7 billion of goodwill, $3.2 billion of identifiable intangible assets and $763 million of net tangible liabilities. Goodwill generated from our acquisition of NetSuite was primarily attributable to synergies expected to arise after the acquisition and was not tax deductible.
Other Fiscal 2017 Acquisitions
During fiscal 2017, we acquired certain companies and purchased certain technology and development assets primarily to expand our products and services offerings. These acquisitions were not individually or in the aggregate significant. We have included the financial results of the acquired companies in our consolidated financial statements from their respective acquisition dates, and the results from each of these companies were not individually material to our consolidated financial statements. In the aggregate, the total purchase price for these acquisitions was approximately $3.0 billion, which consisted of $3.0 billion in cash and $13 million for the fair values of restricted stock-based awards and stock options assumed. Based on their estimated fair values, we recorded $243 million of net tangible assets and $948 million of identifiable intangible assets and $1.8 billion of residual goodwill related to our fiscal 2017 acquisitions.
Fiscal 2016 Acquisitions
During fiscal 2016, we acquired certain companies and purchased certain technology and development assets primarily to expand our products and services offerings. These acquisitions were not significant individually or in the aggregate.
Unaudited Pro Forma Financial Information
The unaudited pro forma financial information in the table below summarizes the combined results of operations for Oracle, NetSuite, Aconex and certain other companies that we acquired since the beginning of fiscal 2017 that were considered relevant for the purposes of unaudited pro forma financial information disclosure as if the companies were combined as of the beginning of fiscal 2017. The unaudited pro forma financial information for all periods presented included the business combination accounting effects resulting from these acquisitions, including amortization charges from acquired intangible assets (certain of which are preliminary), stock-based compensation charges for unvested restricted stock-based awards and stock options assumed, if any, and the related tax effects as though the aforementioned companies were combined as of the beginning of fiscal 2017. The unaudited pro forma financial information as presented below is for informational purposes only and is not necessarily indicative of the results of operations that would have been achieved if the acquisitions had taken place at the beginning of fiscal 2017.
The unaudited pro forma financial information for fiscal 2018 combined the historical results of Oracle for fiscal 2018 and the historical results of Aconex for the twelve month period ended December 31, 2017 (adjusted due to differences in reporting periods and considering the date we acquired Aconex) and certain other companies that we acquired since the beginning of fiscal 2018 based upon their respective previous reporting periods and the dates these companies were acquired by us, and the effects of the pro forma adjustments listed above.
The unaudited pro forma financial information for fiscal 2017 combined the historical results of Oracle for fiscal 2017, the historical results of NetSuite for the six month period ended September 30, 2016 (adjusted due to differences in reporting periods and considering the date we acquired NetSuite) and the historical results of
93
Table of Contents
Index to Financial Statements
ORACLE CORPORATION
NOTES TO CONSOLIDATED FINANCIAL STATEMENTS—(Continued)
May 31, 2018
Aconex and certain other companies that we acquired since the beginning of fiscal 2017 based upon their respective previous reporting periods and the dates these companies were acquired by us, and the effects of the pro forma adjustments listed above. The unaudited pro forma financial information was as follows:
| Year Ended May 31, | ||||||||
| (in millions, except per share data) |
2018 | 2017 | ||||||
| Total revenues |
$ | 39,977 | $ | 38,416 | ||||
| Net income |
$ | 3,738 | $ | 8,825 | ||||
| Basic earnings per share |
$ | 0.91 | $ | 2.14 | ||||
| Diluted earnings per share |
$ | 0.88 | $ | 2.09 | ||||
| 3. | CASH, CASH EQUIVALENTS AND MARKETABLE SECURITIES |
Cash and cash equivalents primarily consist of deposits held at major banks, Tier-1 commercial paper and other securities with original maturities of 90 days or less. Marketable securities consist of Tier-1 commercial paper debt securities, corporate debt securities and certain other securities.
The amortized principal amounts of our cash, cash equivalents and marketable securities approximated their fair values at May 31, 2018 and 2017. We use the specific identification method to determine any realized gains or losses from the sale of our marketable securities classified as available-for-sale. Such realized gains and losses were insignificant for fiscal 2018, 2017 and 2016. The following table summarizes the components of our cash equivalents and marketable securities held, substantially all of which were classified as available-for-sale:
| May 31, | ||||||||
| (in millions) |
2018 | 2017 | ||||||
| Corporate debt securities and other |
$ | 44,302 | $ | 41,618 | ||||
| Commercial paper debt securities |
1,647 | 5,053 | ||||||
| Money market funds |
6,500 | 3,302 | ||||||
|
|
|
|
|
|||||
| Total investments |
$ | 52,449 | $ | 49,973 | ||||
|
|
|
|
|
|||||
| Investments classified as cash equivalents |
$ | 6,808 | $ | 5,679 | ||||
|
|
|
|
|
|||||
| Investments classified as marketable securities |
$ | 45,641 | $ | 44,294 | ||||
|
|
|
|
|
|||||
As of May 31, 2018 and 2017, approximately 26% and 32%, respectively, of our marketable securities investments mature within one year and 74% and 68%, respectively, mature within one to five years. Our investment portfolio is subject to market risk due to changes in interest rates. As described above, we limit purchases of marketable debt securities to investment-grade securities, which have high credit ratings and also limit the amount of credit exposure to any one issuer. As stated in our investment policy, we are averse to principal loss and seek to preserve our invested funds by limiting default risk and market risk.
Restricted cash that was included within cash and cash equivalents as presented within our consolidated balance sheets as of May 31, 2018 and 2017 and our consolidated statements of cash flows for the years ended May 31, 2018, 2017 and 2016 was nominal.
| 4. | FAIR VALUE MEASUREMENTS |
We perform fair value measurements in accordance with ASC 820. ASC 820 defines fair value as the price that would be received from selling an asset or paid to transfer a liability in an orderly transaction between market participants at the measurement date. When determining the fair value measurements for assets and liabilities required to be recorded at their fair values, we consider the principal or most advantageous market in which we would transact and consider assumptions that market participants would use when pricing the assets or liabilities, such as inherent risk, transfer restrictions and risk of nonperformance.
94
Table of Contents
Index to Financial Statements
ORACLE CORPORATION
NOTES TO CONSOLIDATED FINANCIAL STATEMENTS—(Continued)
May 31, 2018
ASC 820 establishes a fair value hierarchy that requires an entity to maximize the use of observable inputs and minimize the use of unobservable inputs when measuring fair value. An asset’s or a liability’s categorization within the fair value hierarchy is based upon the lowest level of input that is significant to the fair value measurement. ASC 820 establishes three levels of inputs that may be used to measure fair value:
| • | Level 1: quoted prices in active markets for identical assets or liabilities; |
| • | Level 2: inputs other than Level 1 that are observable, either directly or indirectly, such as quoted prices in active markets for similar assets or liabilities, quoted prices for identical or similar assets or liabilities in markets that are not active, or other inputs that are observable or can be corroborated by observable market data for substantially the full term of the assets or liabilities; or |
| • | Level 3: unobservable inputs that are supported by little or no market activity and that are significant to the fair values of the assets or liabilities. |
Assets and Liabilities Measured at Fair Value on a Recurring Basis
Our assets and liabilities measured at fair value on a recurring basis, excluding accrued interest components, consisted of the following (Level 1 and Level 2 inputs are defined above):
| May 31, 2018 | May 31, 2017 | |||||||||||||||||||||||
| Fair Value Measurements Using Input Types |
Fair Value Measurements Using Input Types |
|||||||||||||||||||||||
| (in millions) |
Level 1 | Level 2 | Total | Level 1 | Level 2 | Total | ||||||||||||||||||
| Assets: |
||||||||||||||||||||||||
| Corporate debt securities and other |
$ | 223 | $ | 44,079 | $ | 44,302 | $ | 580 | $ | 41,038 | $ | 41,618 | ||||||||||||
| Commercial paper debt securities |
— | 1,647 | 1,647 | — | 5,053 | 5,053 | ||||||||||||||||||
| Money market funds |
6,500 | — | 6,500 | 3,302 | — | 3,302 | ||||||||||||||||||
| Derivative financial instruments |
— | 29 | 29 | — | 40 | 40 | ||||||||||||||||||
|
|
|
|
|
|
|
|
|
|
|
|
|
|||||||||||||
| Total assets |
$ | 6,723 | $ | 45,755 | $ | 52,478 | $ | 3,882 | $ | 46,131 | $ | 50,013 | ||||||||||||
|
|
|
|
|
|
|
|
|
|
|
|
|
|||||||||||||
| Liabilities: |
||||||||||||||||||||||||
| Derivative financial instruments |
$ | — | $ | 158 | $ | 158 | $ | — | $ | 191 | $ | 191 | ||||||||||||
|
|
|
|
|
|
|
|
|
|
|
|
|
|||||||||||||
Our valuation techniques used to measure the fair values of our marketable securities that were classified as Level 1 in the table above were derived from quoted market prices and active markets for these instruments that exist. Our valuation techniques used to measure the fair values of Level 2 instruments listed in the table above, the counterparties to which have high credit ratings, were derived from the following: non-binding market consensus prices that were corroborated by observable market data, quoted market prices for similar instruments, or pricing models, such as discounted cash flow techniques, with all significant inputs derived from or corroborated by observable market data including LIBOR-based yield curves, among others.
Based on the trading prices of the $58.0 billion and $54.0 billion of senior notes and the related fair value hedges that we had outstanding as of May 31, 2018 and 2017, respectively, the estimated fair values of the senior notes and the related fair value hedges using Level 2 inputs at May 31, 2018 and 2017 were $59.0 billion and $56.5 billion, respectively.
95
Table of Contents
Index to Financial Statements
ORACLE CORPORATION
NOTES TO CONSOLIDATED FINANCIAL STATEMENTS—(Continued)
May 31, 2018
| 5. | PROPERTY, PLANT AND EQUIPMENT |
Property, plant and equipment, net consisted of the following:
| Estimated Useful Life |
May 31, | |||||||||||
| (Dollars in millions) |
2018 | 2017 | ||||||||||
| Computer, network, machinery and equipment |
1-5 years | $ | 6,156 | $ | 5,112 | |||||||
| Buildings and improvements |
1-40 years | 3,893 | 3,466 | |||||||||
| Furniture, fixtures and other |
5-15 years | 662 | 651 | |||||||||
| Land |
— | 868 | 830 | |||||||||
| Construction in progress |
— | 229 | 235 | |||||||||
|
|
|
|
|
|||||||||
| Total property, plant and equipment |
1-40 years | 11,808 | 10,294 | |||||||||
| Accumulated depreciation |
(5,911 | ) | (4,979 | ) | ||||||||
|
|
|
|
|
|||||||||
| Total property, plant and equipment, net |
$ | 5,897 | $ | 5,315 | ||||||||
|
|
|
|
|
|||||||||
| 6. | INTANGIBLE ASSETS AND GOODWILL |
The changes in intangible assets for fiscal 2018 and the net book value of intangible assets as of May 31, 2018 and 2017 were as follows:
| Intangible Assets, Gross | Accumulated Amortization | Intangible Assets, Net | Weighted Average Useful Life(1) | |||||||||||||||||||||||||||||||||||||||
| (Dollars in millions) |
May 31, 2017 |
Additions | Retirements | May 31, 2018 |
May 31, 2017 |
Expense | Retirements | May 31, 2018 |
May 31, 2017 |
May 31, 2018 |
||||||||||||||||||||||||||||||||
| Developed technology |
$ | 5,397 | $ | 153 | $ | (241 | ) | $ | 5,309 | $ | (2,295 | ) | $ | (758 | ) | $ | 239 | $ | (2,814 | ) | $ | 3,102 | $ | 2,495 | 3 years | |||||||||||||||||
| Cloud services and license support agreements and related relationships |
5,670 | 423 | (94 | ) | 5,999 | (1,648 | ) | (731 | ) | 94 | (2,285 | ) | 4,022 | 3,714 | 5 years | |||||||||||||||||||||||||||
| Other |
1,998 | 37 | (413 | ) | 1,622 | (1,443 | ) | (131 | ) | 413 | (1,161 | ) | 555 | 461 | 5 years | |||||||||||||||||||||||||||
|
|
|
|
|
|
|
|
|
|
|
|
|
|
|
|
|
|
|
|
|
|||||||||||||||||||||||
| Total intangible assets, net |
$ | 13,065 | $ | 613 | $ | (748 | ) | $ | 12,930 | $ | (5,386 | ) | $ | (1,620 | ) | $ | 746 | $ | (6,260 | ) | $ | 7,679 | $ | 6,670 | 4 years | |||||||||||||||||
|
|
|
|
|
|
|
|
|
|
|
|
|
|
|
|
|
|
|
|
|
|||||||||||||||||||||||
| (1) | Represents weighted-average useful lives of intangible assets acquired during fiscal 2018. |
Total amortization expense related to our intangible assets was $1.6 billion, $1.5 billion and $1.6 billion in fiscal 2018, 2017 and 2016, respectively. As of May 31, 2018, estimated future amortization expenses related to intangible assets were as follows (in millions):
| Fiscal 2019 |
$ | 1,605 | ||
| Fiscal 2020 |
1,400 | |||
| Fiscal 2021 |
1,174 | |||
| Fiscal 2022 |
966 | |||
| Fiscal 2023 |
613 | |||
| Thereafter |
912 | |||
|
|
|
|||
| Total intangible assets, net |
$ | 6,670 | ||
|
|
|
96
Table of Contents
Index to Financial Statements
ORACLE CORPORATION
NOTES TO CONSOLIDATED FINANCIAL STATEMENTS—(Continued)
May 31, 2018
The changes in the carrying amounts of goodwill, net, which is generally not deductible for tax purposes, for our operating segments for fiscal 2018 and 2017 were as follows:
| (in millions) |
Cloud and License |
Hardware | Services | Total Goodwill, net | ||||||||||||
| Balances as of May 31, 2016 |
$ | 30,336 | $ | 2,367 | $ | 1,887 | $ | 34,590 | ||||||||
| Goodwill from acquisitions |
8,543 | — | — | 8,543 | ||||||||||||
| Goodwill adjustments, net(1) |
(88 | ) | — | — | (88 | ) | ||||||||||
|
|
|
|
|
|
|
|
|
|||||||||
| Balances as of May 31, 2017 |
38,791 | 2,367 | 1,887 | 43,045 | ||||||||||||
|
|
|
|
|
|
|
|
|
|||||||||
| Goodwill from acquisitions |
1,052 | — | — | 1,052 | ||||||||||||
| Goodwill adjustments, net(1) |
(243 | ) | — | (99 | ) | (342 | ) | |||||||||
|
|
|
|
|
|
|
|
|
|||||||||
| Balances as of May 31, 2018 |
$ | 39,600 | $ | 2,367 | $ | 1,788 | $ | 43,755 | ||||||||
|
|
|
|
|
|
|
|
|
|||||||||
| (1) | Pursuant to our business combinations accounting policy, we recorded goodwill adjustments for the effects on goodwill of changes to net assets acquired during the period that such a change is identified, provided that any such change is within the measurement period (up to one year from the date of the acquisition). Amounts also include any changes in goodwill balances for the periods presented that resulted from foreign currency translations. |
97
Table of Contents
Index to Financial Statements
ORACLE CORPORATION
NOTES TO CONSOLIDATED FINANCIAL STATEMENTS—(Continued)
May 31, 2018
| 7. | NOTES PAYABLE AND OTHER BORROWINGS |
Notes payable and other borrowings consisted of the following:
| May 31, 2018 | May 31, 2017 | |||||||||||||||||
| (Dollars in millions) |
Date of Issuance |
Amount | Effective Interest Rate |
Amount | Effective Interest Rate |
|||||||||||||
| Fixed-rate senior notes: |
||||||||||||||||||
| $2,500, 1.20%, due October 2017 |
October 2012 | $ | — | N.A. | $ | 2,500 | 1.24% | |||||||||||
| $2,500, 5.75%, due April 2018 |
April 2008 | — | N.A. | 2,500 | 5.76% | |||||||||||||
| $1,500, 2.375%, due January 2019(1) |
July 2013 | 1,500 | 2.44% | 1,500 | 2.44% | |||||||||||||
| $1,750, 5.00%, due July 2019 |
July 2009 | 1,750 | 5.05% | 1,750 | 5.05% | |||||||||||||
| $2,000, 2.25%, due October 2019(1) |
July 2014 | 2,000 | 2.27% | 2,000 | 2.27% | |||||||||||||
| $1,000, 3.875%, due July 2020 |
July 2010 | 1,000 | 3.93% | 1,000 | 3.93% | |||||||||||||
| €1,250, 2.25%, due January 2021(2)(3) |
July 2013 | 1,446 | 2.33% | 1,395 | 2.33% | |||||||||||||
| $1,500, 2.80%, due July 2021(1) |
July 2014 | 1,500 | 2.82% | 1,500 | 2.82% | |||||||||||||
| $4,250, 1.90%, due September 2021(5) |
July 2016 | 4,250 | 1.94% | 4,250 | 1.94% | |||||||||||||
| $2,500, 2.50%, due May 2022 |
May 2015 | 2,500 | 2.56% | 2,500 | 2.56% | |||||||||||||
| $2,500, 2.50%, due October 2022 |
October 2012 | 2,500 | 2.51% | 2,500 | 2.51% | |||||||||||||
| $1,250, 2.625%, due February 2023(6) |
November 2017 | 1,250 | 2.64% | — | N.A. | |||||||||||||
| $1,000, 3.625%, due July 2023 |
July 2013 | 1,000 | 3.73% | 1,000 | 3.73% | |||||||||||||
| $2,500, 2.40%, due September 2023(5) |
July 2016 | 2,500 | 2.40% | 2,500 | 2.40% | |||||||||||||
| $2,000, 3.40%, due July 2024 |
July 2014 | 2,000 | 3.43% | 2,000 | 3.43% | |||||||||||||
| $2,000, 2.95%, due November 2024(6) |
November 2017 | 2,000 | 2.98% | — | N.A. | |||||||||||||
| $2,500, 2.95%, due May 2025 |
May 2015 | 2,500 | 3.00% | 2,500 | 3.00% | |||||||||||||
| €750, 3.125%, due July 2025(2)(4) |
July 2013 | 868 | 3.17% | 837 | 3.17% | |||||||||||||
| $3,000, 2.65%, due July 2026(5) |
July 2016 | 3,000 | 2.69% | 3,000 | 2.69% | |||||||||||||
| $2,750, 3.25%, due November 2027(6) |
November 2017 | 2,750 | 3.26% | — | N.A. | |||||||||||||
| $500, 3.25%, due May 2030 |
May 2015 | 500 | 3.30% | 500 | 3.30% | |||||||||||||
| $1,750, 4.30%, due July 2034 |
July 2014 | 1,750 | 4.30% | 1,750 | 4.30% | |||||||||||||
| $1,250, 3.90%, due May 2035 |
May 2015 | 1,250 | 3.95% | 1,250 | 3.95% | |||||||||||||
| $1,250, 3.85%, due July 2036(5) |
July 2016 | 1,250 | 3.85% | 1,250 | 3.85% | |||||||||||||
| $1,750, 3.80%, due November 2037(6) |
November 2017 | 1,750 | 3.83% | — | N.A. | |||||||||||||
| $1,250, 6.50%, due April 2038(1) |
April 2008 | 1,250 | 6.52% | 1,250 | 6.52% | |||||||||||||
| $1,250, 6.125%, due July 2039 |
July 2009 | 1,250 | 6.19% | 1,250 | 6.19% | |||||||||||||
| $2,250, 5.375%, due July 2040 |
July 2010 | 2,250 | 5.45% | 2,250 | 5.45% | |||||||||||||
| $1,000, 4.50%, due July 2044 |
July 2014 | 1,000 | 4.50% | 1,000 | 4.50% | |||||||||||||
| $2,000, 4.125%, due May 2045 |
May 2015 | 2,000 | 4.15% | 2,000 | 4.15% | |||||||||||||
| $3,000, 4.00%, due July 2046(5) |
July 2016 | 3,000 | 4.00% | 3,000 | 4.00% | |||||||||||||
| $2,250, 4.00%, due November 2047(6) |
November 2017 | 2,250 | 4.03% | — | N.A. | |||||||||||||
| $1,250, 4.375%, due May 2055 |
May 2015 | 1,250 | 4.40% | 1,250 | 4.40% | |||||||||||||
| Floating-rate senior notes: |
||||||||||||||||||
| $1,000, three-month LIBOR plus 0.20%, due July 2017 |
July 2014 | — | N.A. | 1,000 | 1.35% | |||||||||||||
| $500, three-month LIBOR plus 0.58%, due January 2019 |
July 2013 | 500 | 2.93% | 500 | 1.74% | |||||||||||||
| $750, three-month LIBOR plus 0.51%, due October 2019 |
July 2014 | 750 | 2.84% | 750 | 1.67% | |||||||||||||
| Revolving credit agreements and other borrowings: |
||||||||||||||||||
| $3,800, LIBOR plus 0.50%, due June 2017 |
May 2017 | — | N.A. | 3,800 | 1.54% | |||||||||||||
| $2,500, LIBOR plus 0.50%, due June 2018 |
May 2018 | 2,500 | 2.48% | — | N.A. | |||||||||||||
| Other borrowings due August 2025 |
November 2016 | 113 | 3.53% | 113 | 3.53% | |||||||||||||
|
|
|
|
|
|||||||||||||||
| Total senior notes and other borrowings |
$ | 60,927 | $ | 58,145 | ||||||||||||||
|
|
|
|
|
|||||||||||||||
| Unamortized discount/issuance costs |
(282 | ) | (276 | ) | ||||||||||||||
| Hedge accounting fair value adjustments(1) |
(26 | ) | 40 | |||||||||||||||
|
|
|
|
|
|||||||||||||||
| Total notes payable and other borrowings |
$ | 60,619 | $ | 57,909 | ||||||||||||||
|
|
|
|
|
|||||||||||||||
| Notes payable and other borrowings, current |
$ | 4,491 | $ | 9,797 | ||||||||||||||
|
|
|
|
|
|||||||||||||||
| Notes payable and other borrowings, non-current |
$ | 56,128 | $ | 48,112 | ||||||||||||||
|
|
|
|
|
|||||||||||||||
98
Table of Contents
Index to Financial Statements
ORACLE CORPORATION
NOTES TO CONSOLIDATED FINANCIAL STATEMENTS—(Continued)
May 31, 2018
| (1) | We have entered into certain interest rate swap agreements that have the economic effects of modifying the fixed-interest obligations associated with the 2.375% senior notes due January 2019 (January 2019 Notes), the 2.25% senior notes due October 2019 (October 2019 Notes), the 2.80% senior notes due July 2021 (July 2021 Notes), and the 6.50% senior notes due April 2038 (April 2038 Notes) so that the interest payable on these notes effectively became variable based on LIBOR. The effective interest rates after consideration of these fixed to variable interest rate swap agreements were 3.00% and 1.81%, respectively, for the January 2019 Notes, 2.81% and 1.64%, respectively, for the October 2019 Notes, and 2.96% and 1.79%, respectively, for the July 2021 Notes as of May 31, 2018 and 2017, respectively. The effective interest rate as of May 31, 2018 after consideration of the fixed to variable interest rate swap agreements was 5.65% for the April 2038 Notes. Refer to Notes 1 and 10 for a description of our accounting for fair value hedges. |
| (2) | In July 2013, we issued €2.0 billion of fixed-rate senior notes comprised of €1.25 billion of 2.25% senior notes due January 2021 (January 2021 Notes) and €750 million of 3.125% senior notes due July 2025 (July 2025 Notes, and together with the January 2021 Notes, the Euro Notes). Principal and unamortized discount/issuance costs for the Euro Notes in the table above were calculated using foreign currency exchange rates as of May 31, 2018 and May 31, 2017, respectively. The Euro Notes are registered and trade on the New York Stock Exchange. |
| (3) | In connection with the issuance of the January 2021 Notes, we entered into certain cross-currency swap agreements that have the economic effect of converting our fixed-rate, Euro-denominated debt, including annual interest payments and the payment of principal at maturity, to a fixed-rate, U.S. Dollar-denominated debt of $1.6 billion with a fixed annual interest rate of 3.53% (see Note 10 for additional information). |
| (4) | We designated the July 2025 Notes as a net investment hedge of our investments in certain of our international subsidiaries that use the Euro as their functional currency in order to reduce the volatility in stockholders’ equity caused by the changes in foreign currency exchange rates of the Euro with respect to the U.S. Dollar in connection with the issuance of the July 2025 Notes. In our fourth quarter of fiscal 2018 we de-designated the 2025 Notes as a net investment hedge and entered into certain cross-currency interest rate swap agreements that have the economic effect of converting our fixed-rate, Euro-denominated debt, including annual interest payments and the payment of principal at maturity, to a variable-rate, U.S. Dollar-denominated debt of $0.9 billion based on LIBOR. The effective interest rate as of May 31, 2018 after consideration of the cross-currency interest rate swap agreements was 5.17% for the July 2025 Notes. Refer to Notes 1 and 10 for a description of our accounting for fair value hedges. |
| (5) | In July 2016, we issued $14.0 billion of senior notes for general corporate purposes, which may include stock repurchases, payment of cash dividends on our common stock and repayment of indebtedness and future acquisitions. The interest is payable semi-annually. We may redeem some or all of the senior notes of each series prior to their maturity, subject to certain restrictions, and the payment of an applicable make-whole premium in certain instances. |
| (6) | In November 2017, we issued $10.0 billion of senior notes for general corporate purposes, which may include stock repurchases, payment of cash dividends on our common stock and repayment of indebtedness and future acquisitions. The interest is payable semi-annually. We may redeem some or all of the senior notes of each series prior to their maturity, subject to certain restrictions, and the payment of an applicable make-whole premium in certain instances. |
Future principal payments (adjusted for the effects of the cross-currency swap agreements associated with the January 2021 Notes and July 2025 Notes) for all of our borrowings at May 31, 2018 were as follows (in millions):
| Fiscal 2019 |
$ | 4,500 | ||
| Fiscal 2020 |
4,500 | |||
| Fiscal 2021 |
2,446 | |||
| Fiscal 2022 |
8,250 | |||
| Fiscal 2023 |
3,750 | |||
| Thereafter |
37,481 | |||
|
|
|
|||
| Total |
$ | 60,927 | ||
|
|
|
Senior Notes
Interest is payable semi-annually for the senior notes listed in the above table except for the Euro Notes for which interest is payable annually and the floating-rate senior notes for which interest is payable quarterly. We may redeem some or all of the senior notes of each series prior to their maturity, subject to certain restrictions, and the payment of an applicable make-whole premium in certain instances except for the floating-rate senior notes which may not be redeemed prior to their maturity.
99
Table of Contents
Index to Financial Statements
ORACLE CORPORATION
NOTES TO CONSOLIDATED FINANCIAL STATEMENTS—(Continued)
May 31, 2018
The senior notes rank pari passu with any other notes we may issue in the future pursuant to our commercial paper program (see additional discussion regarding our commercial paper program below) and all existing and future unsecured senior indebtedness of Oracle Corporation. All existing and future liabilities of the subsidiaries of Oracle Corporation are or will be effectively senior to the senior notes and any future issuances of commercial paper notes. We were in compliance with all debt-related covenants at May 31, 2018.
Revolving Credit Agreements
In May 2018, we entered into three revolving credit agreements with JPMorgan Chase Bank, N.A., as initial lender and administrative agent (the 2018 Credit Agreements) and borrowed $2.5 billion pursuant to these agreements. The 2018 Credit Agreements provided us with short-term borrowings for working capital and other general corporate purposes. Interest for the 2018 Credit Agreements is based on either (1) a LIBOR-based formula or (2) the Base Rate formula, as set forth in the 2018 Credit Agreements. The borrowings are due and payable on June 28, 2018, which is the termination date of the 2018 Credit Agreements.
In May 2017, we borrowed $3.8 billion pursuant to four revolving credit agreements with JPMorgan Chase Bank, N.A., as initial lender and administrative agent (the 2017 Credit Agreements). In June 2017, we repaid the $3.8 billion and the 2017 Credit Agreements expired pursuant to their terms.
In May 2016, we borrowed $3.8 billion pursuant to three revolving credit agreements with JPMorgan Chase Bank, N.A., as initial lender and administrative agent (the 2016 Credit Agreements). In June 2016, we repaid the $3.8 billion and the 2016 Credit Agreements expired pursuant to their terms.
In April 2013, we entered into a $3.0 billion Revolving Credit Agreement with Wells Fargo Bank, N.A., Bank of America, N.A., BNP Paribas, JPMorgan Chase Bank, N.A. and certain other lenders (the 2013 Credit Agreement). The 2013 Credit Agreement provided for an unsecured 5-year revolving credit facility to be used for general corporate purposes including back-stopping any commercial paper notes that we may issue. In April 2018, the 2013 Credit Agreement expired. No amounts were outstanding as of the expiration date nor as of May 31, 2017.
Commercial Paper Program and Commercial Paper Notes
In April 2013, pursuant to our existing $3.0 billion commercial paper program which allows us to issue and sell unsecured short-term promissory notes pursuant to a private placement exemption from the registration requirements under federal and state securities laws, we entered into new dealer agreements with various banks and a new Issuing and Paying Agency Agreement with JP Morgan Chase Bank, N.A (JP Morgan). Effective on December 22, 2014, Deutsche Bank Trust Companies Americas became the Successor Issuing and Paying Agent replacing JP Morgan. Since that time, we have entered into new dealer agreements with additional banks. As of May 31, 2018 and 2017, we did not have any outstanding commercial paper notes.
Other Borrowings Activities
In connection with our acquisition of NetSuite in the second quarter of fiscal 2017 (see Note 2 above), we assumed $310 million par value of legacy NetSuite convertible notes (NetSuite Debt), which had a fair value of $342 million as of the acquisition date. In December 2016, we repurchased and settled for cash substantially all of the NetSuite Debt.
In the second quarter of fiscal 2017, we assumed $113 million of debt that bears interest at 3.53% and matures in August 2025 in connection with our acquisition of certain land and buildings.
| 8. | RESTRUCTURING ACTIVITIES |
Fiscal 2017 Oracle Restructuring Plan
During the first quarter of fiscal 2017, our management approved, committed to and initiated plans to restructure and further improve efficiencies in our operations due to our recent acquisitions and certain other
100
Table of Contents
Index to Financial Statements
ORACLE CORPORATION
NOTES TO CONSOLIDATED FINANCIAL STATEMENTS—(Continued)
May 31, 2018
operational activities (2017 Restructuring Plan). Restructuring costs associated with the 2017 Restructuring Plan were recorded to the restructuring expense line item within our consolidated statements of operations as they were incurred. We recorded $601 million and $486 million of restructuring expenses in connection with the 2017 Restructuring Plan in fiscal 2018 and 2017, respectively. Actions pursuant to the 2017 Restructuring Plan were substantially complete as of May 31, 2018.
Fiscal 2015 Oracle Restructuring Plan
During the second quarter of fiscal 2015, our management approved, committed to and initiated plans to restructure and further improve efficiencies in our operations due to our acquisition of MICROS Systems, Inc. and certain other operational activities (2015 Restructuring Plan). Restructuring costs associated with the 2015 Restructuring Plan were recorded to the restructuring expense line item within our consolidated statements of operations as they were incurred. We recorded $462 million of restructuring expenses in connection with the 2015 Restructuring Plan in fiscal 2016. Actions pursuant to the 2015 Restructuring Plan were substantially complete as of May 31, 2016.
Summary of All Plans
Fiscal 2018 Activity
| Accrued May 31, 2017(2) |
Year Ended May 31, 2018 | Accrued May 31, 2018(2) |
||||||||||||||||||||||
| (in millions) |
Initial Costs(3) |
Adj. to Cost(4) |
Cash Payments |
Others(5) | ||||||||||||||||||||
| Fiscal 2017 Oracle Restructuring Plan(1) |
||||||||||||||||||||||||
| Cloud and license |
$ | 85 | $ | 156 | $ | (12 | ) | $ | (150 | ) | $ | 3 | $ | 82 | ||||||||||
| Hardware |
31 | 167 | (15 | ) | (122 | ) | — | 61 | ||||||||||||||||
| Services |
25 | 48 | (4 | ) | (54 | ) | 1 | 16 | ||||||||||||||||
| Other(6) |
44 | 267 | (6 | ) | (208 | ) | (7 | ) | 90 | |||||||||||||||
|
|
|
|
|
|
|
|
|
|
|
|
|
|||||||||||||
| Total Fiscal 2017 Oracle Restructuring Plan |
$ | 185 | $ | 638 | $ | (37 | ) | $ | (534 | ) | $ | (3 | ) | $ | 249 | |||||||||
|
|
|
|
|
|
|
|
|
|
|
|
|
|||||||||||||
| Total other restructuring plans(7) |
$ | 79 | $ | 1 | $ | (14 | ) | $ | (37 | ) | $ | 4 | $ | 33 | ||||||||||
|
|
|
|
|
|
|
|
|
|
|
|
|
|||||||||||||
| Total restructuring plans |
$ | 264 | $ | 639 | $ | (51 | ) | $ | (571 | ) | $ | 1 | $ | 282 | ||||||||||
|
|
|
|
|
|
|
|
|
|
|
|
|
|||||||||||||
Fiscal 2017 Activity
| Accrued May 31, 2016 |
Year Ended May 31, 2017 | Accrued May 31, 2017(2) |
||||||||||||||||||||||
| (in millions) |
Initial Costs(3) |
Adj. to Cost(4) |
Cash Payments |
Others(5) | ||||||||||||||||||||
| Fiscal 2017 Oracle Restructuring Plan(1) |
||||||||||||||||||||||||
| Cloud and license |
$ | — | $ | 184 | $ | (6 | ) | $ | (100 | ) | $ | 7 | $ | 85 | ||||||||||
| Hardware |
— | 91 | (3 | ) | (57 | ) | — | 31 | ||||||||||||||||
| Services |
— | 59 | (1 | ) | (34 | ) | 1 | 25 | ||||||||||||||||
| Other(6) |
— | 166 | (4 | ) | (118 | ) | — | 44 | ||||||||||||||||
|
|
|
|
|
|
|
|
|
|
|
|
|
|||||||||||||
| Total Fiscal 2017 Oracle Restructuring Plan |
$ | — | $ | 500 | $ | (14 | ) | $ | (309 | ) | $ | 8 | $ | 185 | ||||||||||
|
|
|
|
|
|
|
|
|
|
|
|
|
|||||||||||||
| Total other restructuring plans(7) |
$ | 283 | $ | 8 | $ | (31 | ) | $ | (169 | ) | $ | (12 | ) | $ | 79 | |||||||||
|
|
|
|
|
|
|
|
|
|
|
|
|
|||||||||||||
| Total restructuring plans |
$ | 283 | $ | 508 | $ | (45 | ) | $ | (478 | ) | $ | (4 | ) | $ | 264 | |||||||||
|
|
|
|
|
|
|
|
|
|
|
|
|
|||||||||||||
101
Table of Contents
Index to Financial Statements
ORACLE CORPORATION
NOTES TO CONSOLIDATED FINANCIAL STATEMENTS—(Continued)
May 31, 2018
Fiscal 2016 Activity
| Accrued May 31, 2015 |
Year Ended May 31, 2016 | Accrued May 31, 2016 |
||||||||||||||||||||||
| (in millions) |
Initial Costs(3) |
Adj. to Cost(4) |
Cash Payments |
Others(5) | ||||||||||||||||||||
| Fiscal 2015 Oracle Restructuring Plan(1) |
||||||||||||||||||||||||
| Cloud and license |
$ | 16 | $ | 263 | $ | (8 | ) | $ | (129 | ) | $ | 4 | $ | 146 | ||||||||||
| Hardware |
6 | 67 | (8 | ) | (43 | ) | 1 | 23 | ||||||||||||||||
| Services |
9 | 44 | (4 | ) | (35 | ) | — | 14 | ||||||||||||||||
| Other(6) |
5 | 108 | — | (56 | ) | (2 | ) | 55 | ||||||||||||||||
|
|
|
|
|
|
|
|
|
|
|
|
|
|||||||||||||
| Total Fiscal 2015 Oracle Restructuring Plan |
$ | 36 | $ | 482 | $ | (20 | ) | $ | (263 | ) | $ | 3 | $ | 238 | ||||||||||
|
|
|
|
|
|
|
|
|
|
|
|
|
|||||||||||||
| Total other restructuring plans(7) |
$ | 84 | $ | 2 | $ | (6 | ) | $ | (27 | ) | $ | (8 | ) | $ | 45 | |||||||||
|
|
|
|
|
|
|
|
|
|
|
|
|
|||||||||||||
| Total restructuring plans |
$ | 120 | $ | 484 | $ | (26 | ) | $ | (290 | ) | $ | (5 | ) | $ | 283 | |||||||||
|
|
|
|
|
|
|
|
|
|
|
|
|
|||||||||||||
| (1) | Restructuring costs recorded for individual line items primarily related to employee severance costs. |
| (2) | The balances at May 31, 2018 and 2017 included $257 million and $242 million, respectively, recorded in other current liabilities and $25 million and $22 million, respectively, recorded in other non-current liabilities. |
| (3) | Costs recorded for the respective restructuring plans during the periods presented. |
| (4) | All plan adjustments were changes in estimates whereby increases and decreases in costs were generally recorded to operating expenses in the period of adjustments. |
| (5) | Represents foreign currency translation and certain other adjustments. |
| (6) | Represents employee related severance costs for functions that are not included within our operating segments and certain facilities related restructuring costs. |
| (7) | Other restructuring plans presented in the tables above included condensed information for certain Oracle-based plans and other plans associated with certain of our acquisitions whereby we continued to make cash outlays to settle obligations under these plans during the periods presented but for which the periodic impact to our consolidated statements of operations was not significant. |
| 9. | DEFERRED REVENUES |
Deferred revenues consisted of the following:
| May 31, | ||||||||
| (in millions) |
2018 | 2017 | ||||||
| Cloud services and license support |
$ | 7,292 | $ | 7,144 | ||||
| Hardware |
645 | 640 | ||||||
| Services |
437 | 382 | ||||||
| Cloud license and on-premise license |
55 | 67 | ||||||
|
|
|
|
|
|||||
| Deferred revenues, current |
8,429 | 8,233 | ||||||
| Deferred revenues, non-current (in other non-current liabilities) |
625 | 602 | ||||||
|
|
|
|
|
|||||
| Total deferred revenues |
$ | 9,054 | $ | 8,835 | ||||
|
|
|
|
|
|||||
Deferred cloud services and license support revenues and deferred hardware revenues substantially represent customer payments made in advance for cloud or support contracts that are typically billed in advance with corresponding revenues generally being recognized ratably over the contractual periods. Deferred services revenues include prepayments for our services business and revenues for these services are generally recognized as the services are performed. Deferred new cloud license and on-premise license revenues typically resulted from customer payments that relate to undelivered products or specified enhancements, customer-
102
Table of Contents
Index to Financial Statements
ORACLE CORPORATION
NOTES TO CONSOLIDATED FINANCIAL STATEMENTS—(Continued)
May 31, 2018
specific acceptance provisions, time-based license arrangements and license transactions that cannot be separated from undelivered consulting or other services.
In connection with our acquisitions, we have estimated the fair values of the cloud services and license support, and hardware obligations, among others, assumed from our acquired companies. We generally have estimated the fair values of these obligations assumed using a cost build-up approach. The cost build-up approach determines fair value by estimating the costs related to fulfilling the obligations plus a normal profit margin. The sum of the costs and operating profit approximates, in theory, the amount that we would be required to pay a third party to assume these acquired obligations. These aforementioned fair value adjustments recorded for obligations assumed from our acquisitions reduced the cloud services and license support and hardware deferred revenues balances that we recorded as liabilities from these acquisitions and also reduced the resulting revenues that we recognized or will recognize over the terms of the acquired obligations during the post-combination periods.
| 10. | DERIVATIVE FINANCIAL INSTRUMENTS |
Fair Value Hedges—Interest Rate Swap Agreements and Cross-Currency Interest Rate Swap Agreements
In May 2018, we entered into certain cross-currency interest rate swap agreements to manage the foreign currency exchange rate risk associated with our July 2025 Notes by effectively converting the fixed-rate, Euro denominated 2025 Notes, including the annual interest payments and the payment of principal at maturity, to variable-rate, U.S. Dollar denominated debt based on LIBOR. In April 2018, we entered into certain interest rate swap agreements that have the economic effect of modifying the fixed-interest obligations associated with our April 2038 Notes so that the interest payable on these senior notes effectively became variable based on LIBOR. In July 2014, we entered into certain interest rate swap agreements that have the economic effect of modifying the fixed-interest obligations associated with our October 2019 Notes and our July 2021 Notes so that the interest payable on these senior notes effectively became variable based on LIBOR. In July 2013, we entered into certain interest rate swap agreements that have the economic effect of modifying the fixed-interest obligations associated with our January 2019 Notes so that the interest payable on these senior notes effectively became variable based on LIBOR. The critical terms of the swap agreements match the critical terms of the July 2025 Notes, April 2038 Notes, October 2019 Notes, July 2021 Notes and the January 2019 Notes that the swap agreements pertain to, including the notional amounts and maturity dates.
We have designated the aforementioned swap agreements as qualifying hedging instruments and are accounting for them as fair value hedges pursuant to ASC 815. These transactions are characterized as fair value hedges for financial accounting purposes because they protect us against changes in the fair values of certain of our fixed-rate borrowings due to benchmark interest rate movements. The changes in fair values of these swap agreements are recognized as interest expense in our consolidated statements of operations with the corresponding amounts included in other assets or other non-current liabilities in our consolidated balance sheets. The amount of net gain (loss) attributable to the risk being hedged is recognized as interest expense in our consolidated statements of operations with the corresponding amount included in notes payable, non-current. The periodic interest settlements for the swap agreements for the July 2025 Notes, April 2038 Notes, October 2019 Notes, July 2021 Notes and the January 2019 Notes are recorded as interest expense and are included as a part of cash flows from operating activities.
We do not use any swap agreements for trading purposes.
Cash Flow Hedges—Cross-Currency Swap Agreements
In connection with the issuance of the January 2021 Notes, we entered into certain cross-currency swap agreements to manage the related foreign currency exchange risk by effectively converting the fixed-rate, Euro-denominated January 2021 Notes, including the annual interest payments and the payment of principal at
103
Table of Contents
Index to Financial Statements
ORACLE CORPORATION
NOTES TO CONSOLIDATED FINANCIAL STATEMENTS—(Continued)
May 31, 2018
maturity, to fixed-rate, U.S. Dollar-denominated debt. The economic effect of the swap agreements was to eliminate the uncertainty of the cash flows in U.S. Dollars associated with the January 2021 Notes by fixing the principal amount of the January 2021 Notes at $1.6 billion with a fixed annual interest rate of 3.53%. We have designated these cross-currency swap agreements as qualifying hedging instruments and are accounting for these as cash flow hedges pursuant to ASC 815. The critical terms of the cross-currency swap agreements correspond to the January 2021 Notes including the annual interest payments being hedged, and the cross-currency swap agreements mature at the same time as the January 2021 Notes.
We used the hypothetical derivative method to measure the effectiveness of our cross-currency swap agreements. The fair values of these cross-currency swap agreements are recognized as other assets or other non-current liabilities in our consolidated balance sheets. The effective portions of the changes in fair values of these cross-currency swap agreements are reported in accumulated other comprehensive loss in our consolidated balance sheets and an amount is reclassified out of accumulated other comprehensive loss into non-operating income, net in the same period that the carrying values of the Euro-denominated January 2021 Notes are remeasured and the interest expense is recognized. The ineffective portion of the unrealized gains and losses on these cross-currency swaps, if any, are recorded immediately to non-operating income, net. We evaluate the effectiveness of our cross-currency swap agreements on a quarterly basis. We did not record any ineffectiveness for fiscal 2018, 2017 or 2016. The cash flows related to the cross-currency swap agreements that pertain to the periodic interest settlements are classified as operating activities and the cash flows that pertain to the principal balance are classified as financing activities.
We do not use any cross-currency swap agreements for trading purposes.
Net Investment Hedge—Foreign Currency Borrowings
In July 2013, we designated our July 2025 Notes as a net investment hedge of our investments in certain of our international subsidiaries that use the Euro as their functional currency in order to reduce the volatility in stockholders’ equity caused by the changes in foreign currency exchange rates of the Euro with respect to the U.S. Dollar. We used the spot method to measure the effectiveness of our net investment hedge. Under this method, for each reporting period, the change in the carrying value of the Euro-denominated July 2025 Notes due to remeasurement of the effective portion is reported in accumulated other comprehensive loss in our consolidated balance sheet and the remaining change in the carrying value of the ineffective portion, if any, was recognized in non-operating income, net in our consolidated statements of operations. We evaluated the effectiveness of our net investment hedge at the beginning of every quarter. We did not record any ineffectiveness for fiscal 2018, 2017 or 2016. In the fourth quarter of fiscal 2018, we de-designated the July 2025 Notes as a net investment hedge, and as noted above, we entered into cross-currency interest rate swap agreements to manage the foreign currency exchange risk associated with our July 2025 Notes by effectively converting the fixed-rate, Euro denominated debt, including the annual interest payments and the payment of principal at maturity, to variable-rate, U.S. Dollar denominated debt.
Foreign Currency Forward Contracts Not Designated as Hedges
We transact business in various foreign currencies and have established a program that primarily utilizes foreign currency forward contracts to offset the risks associated with the effects of certain foreign currency exposures. Under this program, our strategy is to enter into foreign currency forward contracts so that increases or decreases in our foreign currency exposures are offset by gains or losses on the foreign currency forward contracts in order to mitigate the risks and volatility associated with our foreign currency transactions. We may suspend this program from time to time. Our foreign currency exposures typically arise from intercompany sublicense fees, intercompany loans and other intercompany transactions that are generally expected to be cash settled in the near term. Our foreign currency forward contracts are generally short-term in duration. Our ultimate realized gain or loss with respect to currency fluctuations will generally depend on the size and type of
104
Table of Contents
Index to Financial Statements
ORACLE CORPORATION
NOTES TO CONSOLIDATED FINANCIAL STATEMENTS—(Continued)
May 31, 2018
cross-currency exposures that we enter into, the currency exchange rates associated with these exposures and changes in those rates, the net realized and unrealized gains or losses on foreign currency forward contracts to offset these exposures and other factors.
Neither do we use these foreign currency forward contracts for trading purposes nor do we designate these forward contracts as hedging instruments pursuant to ASC 815. Accordingly, we recorded the fair values of these contracts as of the end of each reporting period to our consolidated balance sheets with changes in fair values recorded to our consolidated statements of operations. The balance sheet classification for the fair values of these forward contracts is prepaid expenses and other current assets for forward contracts in an unrealized gain position and other current liabilities for forward contracts in an unrealized loss position. The statement of operations classification for changes in fair values of these forward contracts is non-operating income, net, for both realized and unrealized gains and losses.
The notional amounts of the forward contracts we held to purchase U.S. Dollars in exchange for other major international currencies was $3.4 billion as of each of May 31, 2018 and 2017 and the notional amounts of forward contracts we held to sell U.S. Dollars in exchange for other major international currencies was $1.4 billion as of each of May 31, 2018 and 2017. The fair values of our outstanding foreign currency forward contracts were nominal at May 31, 2018 and 2017. The cash flows related to these foreign currency contracts are classified as operating activities. Net gains or losses related to these forward contracts are included in non-operating income, net.
The effects of derivative and non-derivative instruments designated as hedges on certain of our consolidated financial statements were as follows as of or for each of the respective periods presented below (amounts presented exclude any income tax effects):
Fair Values of Derivative and Non-Derivative Instruments Designated as Hedges in Consolidated Balance Sheets
| Fair Value as of May 31, | ||||||||||
| (in millions) |
Balance Sheet Location |
2018 | 2017 | |||||||
| Interest rate swap agreements designated as fair value hedges |
Other current liabilities | $ | (7 | ) | $ | — | ||||
|
|
|
|
|
|||||||
| Interest rate swap agreements designated as fair value hedges |
Other non-current assets | $ | 29 | $ | 40 | |||||
|
|
|
|
|
|||||||
| Interest rate swap agreements designated as fair value hedges |
Other non-current liabilities | $ | (48 | ) | $ | — | ||||
|
|
|
|
|
|||||||
| Cross-currency swap agreements designated as cash flow hedges |
Other non-current liabilities | $ | (103 | ) | $ | (191 | ) | |||
|
|
|
|
|
|||||||
| Foreign currency borrowings designated as net investment hedge |
Notes payable, non-current | $ | — | $ | (980 | ) | ||||
|
|
|
|
|
|||||||
Effects of Derivative and Non-Derivative Instruments Designated as Hedges on Income and Other Comprehensive Income (OCI) or Loss (OCL)
| Amount of Gain (Loss) Recognized in Accumulated OCI or OCL (Effective Portion) |
||||||||||||
| Year Ended May 31, | ||||||||||||
| (in millions) |
2018 | 2017 | 2016 | |||||||||
| Cross-currency swap agreements designated as cash flow hedges |
$ | 88 | $ | 27 | $ | 26 | ||||||
|
|
|
|
|
|
|
|||||||
| Foreign currency borrowings designated as net investment hedge |
$ | (30 | ) | $ | (1 | ) | $ | (25 | ) | |||
|
|
|
|
|
|
|
|||||||
105
Table of Contents
Index to Financial Statements
ORACLE CORPORATION
NOTES TO CONSOLIDATED FINANCIAL STATEMENTS—(Continued)
May 31, 2018
| Amount of Gain (Loss) Reclassified from Accumulated
OCI |
||||||||||||||
| Year Ended May 31, | ||||||||||||||
| (in millions) |
Location |
2018 | 2017 | 2016 | ||||||||||
| Cross-currency swap agreements designated as cash flow hedges |
Non-operating income (expense), net | $ | 51 | $ | 2 | $ | 41 | |||||||
|
|
|
|
|
|
|
|||||||||
| Amount of Gain (Loss) Recognized in Income on Derivative |
||||||||||||||
| Year Ended May 31, | ||||||||||||||
| (in millions) |
Location |
2018 | 2017 | 2016 | ||||||||||
| Interest rate swap agreements designated as fair value hedges |
Interest expense |
$ | (66 | ) | $ | (82 | ) | $ | 48 | |||||
|
|
|
|
|
|
|
|||||||||
| Amount of Gain (Loss) on Hedged Item Recognized
in |
||||||||||||||
| Year Ended May 31, | ||||||||||||||
| (in millions) |
Location |
2018 | 2017 | 2016 | ||||||||||
| Interest rate swap agreements designated as fair value hedges |
Interest expense |
$ | 66 | $ | 82 | $ | (48 | ) | ||||||
|
|
|
|
|
|
|
|||||||||
| 11. | COMMITMENTS AND CERTAIN CONTINGENCIES |
Lease Commitments
We lease certain facilities, furniture and equipment under operating leases. As of May 31, 2018, future minimum annual operating lease payments and future minimum payments to be received from non-cancelable subleases were as follows:
| (in millions) |
||||
| Fiscal 2019 |
$ | 377 | ||
| Fiscal 2020 |
314 | |||
| Fiscal 2021 |
248 | |||
| Fiscal 2022 |
184 | |||
| Fiscal 2023 |
144 | |||
| Thereafter |
372 | |||
|
|
|
|||
| Future minimum operating lease payments |
1,639 | |||
| Less: minimum payments to be received from non-cancelable subleases |
(29 | ) | ||
|
|
|
|||
| Total future minimum operating lease payments, net |
$ | 1,610 | ||
|
|
|
|||
Lease commitments included future minimum rent payments for facilities that we have vacated pursuant to our restructuring and merger integration activities, as discussed in Note 8. We have approximately $61 million in facility obligations, net of estimated sublease income and other costs, in accrued restructuring for these locations in our consolidated balance sheet at May 31, 2018.
Rent expense was $292 million, $273 million and $283 million for fiscal 2018, 2017 and 2016, respectively, net of sublease income of approximately $104 million, $87 million and $45 million for fiscal 2018, 2017 and 2016, respectively. Certain lease agreements contain renewal options providing for extensions of the lease terms.
Unconditional Obligations
In the ordinary course of business, we enter into certain unconditional purchase obligations with our suppliers, which are agreements that are enforceable and legally binding and specify terms, including: fixed or minimum
106
Table of Contents
Index to Financial Statements
ORACLE CORPORATION
NOTES TO CONSOLIDATED FINANCIAL STATEMENTS—(Continued)
May 31, 2018
quantities to be purchased; fixed, minimum or variable price provisions; and the approximate timing of the payment. We utilize several external manufacturers to manufacture sub-assemblies for our hardware products and to perform final assembly and testing of finished hardware products. We also obtain individual components for our hardware products from a variety of individual suppliers based on projected demand information. Such purchase commitments are based on our forecasted component and manufacturing requirements and typically provide for fulfillment within agreed upon lead-times and/or commercially standard lead-times for the particular part or product and have been included in the amounts below. Routine arrangements for other materials and goods that are not related to our external manufacturers and certain other suppliers and that are entered into in the ordinary course of business are not included in the amounts below, as they are generally entered into in order to secure pricing or other negotiated terms and are difficult to quantify in a meaningful way.
As of May 31, 2018, our unconditional purchase and certain other obligations were as follows (in millions):
| Fiscal 2019 |
$ | 757 | ||
| Fiscal 2020 |
291 | |||
| Fiscal 2021 |
189 | |||
| Fiscal 2022 |
114 | |||
| Fiscal 2023 |
24 | |||
|
|
|
|||
| Total |
$ | 1,375 | ||
|
|
|
As described in Notes 7 and 10 above, as of May 31, 2018 we have senior notes and other borrowings of $60.9 billion that mature at various future dates and derivative financial instruments outstanding that we leverage to manage certain risks and exposures.
Guarantees
Our cloud, license and hardware sales agreements generally include certain provisions for indemnifying customers against liabilities if our products infringe a third party’s intellectual property rights. To date, we have not incurred any material costs as a result of such indemnifications and have not accrued any material liabilities related to such obligations in our consolidated financial statements. Certain of our sales agreements also include provisions indemnifying customers against liabilities in the event we breach confidentiality or service level requirements. It is not possible to determine the maximum potential amount under these indemnification agreements due to our limited and infrequent history of prior indemnification claims and the unique facts and circumstances involved in each particular agreement.
Our Oracle Cloud Services agreements generally include a warranty that the cloud services will be performed in all material respects as defined in the agreement during the service period. Our license and hardware agreements also generally include a warranty that our products will substantially operate as described in the applicable program documentation for a period of one year after delivery. We also warrant that services we perform will be provided in a manner consistent with industry standards for a period of 90 days from performance of the services.
We occasionally are required, for various reasons, to enter into financial guarantees with third parties in the ordinary course of our business including, among others, guarantees related to taxes, import licenses and letters of credit on behalf of parties with whom we conduct business. Such agreements have not had a material effect on our results of operations, financial position or cash flows.
107
Table of Contents
Index to Financial Statements
ORACLE CORPORATION
NOTES TO CONSOLIDATED FINANCIAL STATEMENTS—(Continued)
May 31, 2018
In connection with certain litigation, we posted certain court-mandated surety bonds with a court and entered into related indemnification agreements with each of the surety bond issuing companies. Additional information is provided in Note 17 below.
| 12. | STOCKHOLDERS’ EQUITY |
Common Stock Repurchases
Our Board of Directors has approved a program for us to repurchase shares of our common stock. During fiscal 2018, our Board of Directors approved expansions of our stock repurchase program totaling $24.0 billion. As of May 31, 2018, approximately $17.8 billion remained available for stock repurchases pursuant to our stock repurchase program. We repurchased 238.0 million shares for $11.5 billion (including 3.8 million shares for $180 million that were repurchased but not settled), 85.6 million shares for $3.5 billion and 271.9 million shares for $10.4 billion in fiscal 2018, 2017 and 2016, respectively, under the stock repurchase program.
Our stock repurchase authorization does not have an expiration date and the pace of our repurchase activity will depend on factors such as our working capital needs, our cash requirements for acquisitions and dividend payments, our debt repayment obligations or repurchases of our debt, our stock price, and economic and market conditions. Our stock repurchases may be effected from time to time through open market purchases and pursuant to a Rule 10b5-1 plan. Our stock repurchase program may be accelerated, suspended, delayed or discontinued at any time.
Dividends on Common Stock
During fiscal 2018, 2017 and 2016, our Board of Directors declared cash dividends of $0.76, $0.64 and $0.60 per share of our outstanding common stock, respectively, which we paid during the same period.
In June 2018, our Board of Directors declared a quarterly cash dividend of $0.19 per share of our outstanding common stock. The dividend is payable on July 31, 2018 to stockholders of record as of the close of business on July 17, 2018. Future declarations of dividends and the establishment of future record and payment dates are subject to the final determination of our Board of Directors.
Accumulated Other Comprehensive Loss
The following table summarizes, as of each balance sheet date, the components of our accumulated other comprehensive loss, net of income taxes:
| May 31, | ||||||||
| (in millions) |
2018 | 2017 | ||||||
| Foreign currency translation losses and other, net |
$ | (974 | ) | $ | (679 | ) | ||
| Unrealized losses on defined benefit plans, net |
(322 | ) | (356 | ) | ||||
| Unrealized (losses) gains on marketable securities, net |
(422 | ) | 187 | |||||
| Unrealized gains on cash flow hedges, net |
82 | 45 | ||||||
|
|
|
|
|
|||||
| Total accumulated other comprehensive loss |
$ | (1,636 | ) | $ | (803 | ) | ||
|
|
|
|
|
|||||
108
Table of Contents
Index to Financial Statements
ORACLE CORPORATION
NOTES TO CONSOLIDATED FINANCIAL STATEMENTS—(Continued)
May 31, 2018
| 13. | EMPLOYEE BENEFIT PLANS |
Stock-Based Compensation Plans
Stock Plans
In fiscal 2001, we adopted the 2000 Long-Term Equity Incentive Plan, which provides for the issuance of long-term performance awards, including restricted stock-based awards, non-qualified stock options and incentive stock options, as well as stock purchase rights and stock appreciation rights, to our eligible employees, officers and directors who are also employees or consultants, independent consultants and advisers.
| • | In fiscal 2011, our stockholders, upon the recommendation of our Board of Directors (the Board), approved the adoption of the Amended and Restated 2000 Long-Term Equity Incentive Plan (the 2000 Plan), which extended the termination date of the 2000 Plan by 10 years and increased the number of authorized shares of stock that may be issued by 388,313,015 shares. |
| • | In fiscal 2014, our stockholders, upon the recommendation of the Board, approved a further increase in the number of authorized shares of stock that may be issued under the 2000 Plan by 305,000,000 shares. Under the terms of the 2000 Plan, long-term full value awards are granted in the form of restricted stock units (RSUs) and performance stock units (PSUs). For each share granted as a full value award under the 2000 Plan, an equivalent of 2.5 shares is deducted from our pool of shares available for grant. |
| • | In fiscal 2018, our stockholders, upon the recommendation of the Board, approved a further increase in the number of authorized shares of stock that may be issued under the 2000 Plan by 330,000,000 shares, and approved material terms of the performance goals under which PSUs and performance-based stock options (PSOs) could be granted. |
As of May 31, 2018, the 2000 Plan had 83 million unvested RSUs outstanding, 3 million unvested PSUs outstanding, 69 million PSOs outstanding and service-based stock options (SOs) to purchase 231 million shares of common stock outstanding of which 197 million shares were vested. As of May 31, 2018, approximately 376 million shares of common stock were available for future awards under the 2000 Plan. To date, we have not issued any stock purchase rights or stock appreciation rights under the 2000 Plan.
The vesting schedule for all awards grated under the 2000 Plan are established by the Compensation Committee of the Board of Directors. RSUs generally require vesting 25% annually over four years. The vesting schedule for PSUs currently requires achieving performance targets and providing service over four fiscal years. SOs are granted at not less than fair market value, become exercisable generally 25% annually over four years under our current practice, and generally expire 10 years from the date of grant. PSOs granted to four of our executive officers in fiscal 2018 consist of seven numerically equivalent vesting tranches that potentially may vest. One tranche vests solely on attainment of a market-based metric. The remaining six tranches require the attainment of both a performance metric and a market capitalization metric. In each case, the market-based metric, performance metrics and market capitalization metrics may be achieved at any time during a five year performance period, assuming continued employment and service through the date the Compensation Committee of the Board of Directors certifies that performance has been achieved. The PSOs have contractual lives of eight years in comparison to the typical ten year contractual lives for SOs. For the six tranches of the PSOs with both performance and market conditions, stock-based compensation expense is to be recognized once each vesting tranche becomes probable of achievement over the longer of the estimated implicit service period or derived service. We have preliminarily estimated service periods for those tranches that have been deemed probable of achievement to be approximately three to five years. Stock-based compensation for the market-based tranche will be recognized using the derived service period for the market-based metric achievement, which we have initially estimated to be approximately three years.
109
Table of Contents
Index to Financial Statements
ORACLE CORPORATION
NOTES TO CONSOLIDATED FINANCIAL STATEMENTS—(Continued)
May 31, 2018
In fiscal 1993, the Board adopted the 1993 Directors’ Stock Plan (the Directors’ Plan), which provides for the issuance of RSUs and other stock-based awards, including non-qualified stock options, to non-employee directors. The Directors’ Plan has from time to time been amended and restated. Under the terms of the Directors’ Plan, 10 million shares of common stock are reserved for issuance (including a fiscal 2013 amendment to increase the number of shares of our common stock reserved for issuance by 2 million shares). In prior years, we granted stock options at not less than fair market value, that vest over four years, and expire no more than 10 years from the date of grant. The Directors’ Plan was most recently amended on April 29, 2016 and permits the Compensation Committee of the Board to determine the amount and form of automatic grants of stock awards to each non-employee director upon first becoming a director and thereafter on an annual basis, as well as automatic nondiscretionary grants for chairing certain Board committees, subject to certain stockholder approved limitations set forth in the Directors’ Plan. As of May 31, 2018, approximately 109,000 unvested RSUs and stock options to purchase approximately 1 million shares of common stock (of which approximately 1 million were vested) were outstanding under the Directors’ Plan. As of May 31, 2018, approximately 1 million shares were available for future stock awards under this plan.
In connection with certain of our acquisitions, we assumed certain outstanding restricted stock-based awards and stock options under each acquired company’s respective stock plans, or we substituted substantially similar awards under the 2000 Plan. These restricted stock-based awards and stock options assumed or substituted generally retain all of the rights, terms and conditions of the respective plans under which they were originally granted. As of May 31, 2018, approximately 3 million shares of restricted stock-based awards and stock options to purchase 3 million shares of common stock were outstanding under these plans.
The following table summarizes restricted stock-based award activity, including service based awards and performance-based awards, granted pursuant to Oracle-based stock plans and stock plans assumed from our acquisitions for our last three fiscal years ended May 31, 2018:
| Restricted Stock-Based Awards Outstanding | ||||||||
| (in millions, except fair value) |
Number of Shares |
Weighted-Average Grant Date Fair Value |
||||||
| Balance, May 31, 2015 |
28 | $ | 40.63 | |||||
| Granted |
34 | $ | 38.50 | |||||
| Vested and Issued |
(7 | ) | $ | 40.39 | ||||
| Canceled |
(3 | ) | $ | 39.73 | ||||
|
|
|
|||||||
| Balance, May 31, 2016 |
52 | $ | 39.29 | |||||
| Granted |
42 | $ | 39.40 | |||||
| Assumed |
14 | $ | 37.83 | |||||
| Vested and Issued |
(18 | ) | $ | 40.39 | ||||
| Canceled |
(7 | ) | $ | 39.73 | ||||
|
|
|
|||||||
| Balance, May 31, 2017 |
83 | $ | 39.18 | |||||
| Granted |
44 | $ | 47.42 | |||||
| Vested and Issued |
(27 | ) | $ | 39.10 | ||||
| Canceled |
(11 | ) | $ | 41.97 | ||||
|
|
|
|||||||
| Balance, May 31, 2018 |
89 | $ | 42.93 | |||||
|
|
|
|||||||
The total grant date fair value of restricted stock-based awards that were vested and issued in fiscal 2018, 2017 and 2016 was $1.0 billion, $715 million and $261 million, respectively. As of May 31, 2018, total unrecognized stock-based compensation expense related to non-vested restricted stock-based awards was $2.5 billion and is expected to be recognized over the remaining weighted-average vesting period of 2.70 years.
In each of fiscal 2017 and 2016, 2 million PSUs were granted which vest upon the attainment of certain performance metrics and service-based vesting. Based upon actual attainment relative to the “target”
110
Table of Contents
Index to Financial Statements
ORACLE CORPORATION
NOTES TO CONSOLIDATED FINANCIAL STATEMENTS—(Continued)
May 31, 2018
performance metric, certain participants have the ability to be issued up to 150% of the target number of PSUs originally granted, or to be issued no PSUs at all. In fiscal 2018, 2.4 million PSUs vested and 1.6 million PSUs remained outstanding as of May 31, 2018.
The following table summarizes stock option activity, including SOs and PSOs, and includes awards granted pursuant to the 2000 Plan and stock plans assumed from our acquisitions for our last three fiscal years ended May 31, 2018:
| Options Outstanding | ||||||||
| (in millions, except exercise price) |
Shares Under Stock Option |
Weighted-Average Exercise Price |
||||||
| Balance, May 31, 2015 |
413 | $ | 28.64 | |||||
| Granted(1) |
25 | $ | 40.34 | |||||
| Assumed |
1 | $ | 4.97 | |||||
| Exercised |
(53 | ) | $ | 25.13 | ||||
| Canceled |
(11 | ) | $ | 35.19 | ||||
|
|
|
|||||||
| Balance, May 31, 2016 |
375 | $ | 29.66 | |||||
| Granted(1) |
18 | $ | 40.90 | |||||
| Assumed |
2 | $ | 13.06 | |||||
| Exercised |
(77 | ) | $ | 26.65 | ||||
| Canceled |
(6 | ) | $ | 36.28 | ||||
|
|
|
|||||||
| Balance, May 31, 2017 |
312 | $ | 29.02 | |||||
| Granted(2) |
77 | $ | 50.95 | |||||
| Exercised |
(78 | ) | $ | 28.78 | ||||
| Canceled |
(7 | ) | $ | 45.70 | ||||
|
|
|
|||||||
| Balance, May 31, 2018 |
304 | $ | 36.11 | |||||
|
|
|
|||||||
| (1) | 7 million SOs were granted in total during each of fiscal 2017 and 2016 to our Chief Executive Officers and Chief Technology Officer and have contractual lives of five years versus the ten-year contractual lives for most of the other SOs granted. |
| (2) | Awards granted in fiscal 2018 included 69 million PSOs granted in total to our Chief Executive Officers, Chief Technology Officer, and President, Product Development, the contractual terms of which are described in greater detail above. |
Stock options outstanding that have vested and that are expected to vest as of May 31, 2018 were as follows:
| Outstanding Stock Options (in millions) |
Weighted- Average Exercise Price |
Weighted- Average Remaining Contract Term (in years) |
Aggregate Intrinsic Value(1) (in millions) |
|||||||||||||
| Vested |
201 | $ | 30.06 | 3.89 | $ | 3,344 | ||||||||||
| Expected to vest(2) |
60 | $ | 45.91 | 6.90 | 202 | |||||||||||
|
|
|
|
|
|||||||||||||
| Total |
261 | $ | 33.74 | 4.59 | $ | 3,546 | ||||||||||
|
|
|
|
|
|||||||||||||
| (1) | The aggregate intrinsic value was calculated based on the gross difference between our closing stock price on the last trading day of fiscal 2018 of $46.72 and the exercise prices for all “in-the-money” options outstanding, excluding tax effects. |
| (2) | The unrecognized compensation expense calculated under the fair value method for shares expected to vest (unvested shares net of expected forfeitures) as of May 31, 2018 was approximately $375 million and is expected to be recognized over a weighted-average period of 3.33 years. Approximately 43 million shares outstanding as of May 31, 2018 were not expected to vest. |
Stock-Based Compensation Expense and Valuations of Stock Awards
We estimated the fair values of our restricted stock-based awards that are solely subject to service-based vesting requirements based upon their market values as of the grant dates, discounted for the present values of expected dividends.
111
Table of Contents
Index to Financial Statements
ORACLE CORPORATION
NOTES TO CONSOLIDATED FINANCIAL STATEMENTS—(Continued)
May 31, 2018
The fair values of our PSUs were also measured based upon their market values as of their respective grant dates, discounted for the present values of expected dividends. The vesting conditions and related terms of our PSUs were communicated to each participating employee as of their respective grant dates and included attainment metrics that were defined, fixed and based upon consistent U.S. GAAP metrics or internal metrics that are defined, fixed and consistently determined, and that require the employee to render service. Therefore, these awards met the performance-based award classification criteria as defined within ASC 718.
We estimated the fair values of our stock options that were solely subject to service-based vesting requirements using the Black-Scholes-Merton option-pricing model, which was developed for use in estimating the fair values of stock options. Option valuation models, including the Black-Scholes-Merton option-pricing model, require the input of assumptions, including stock price volatility. Changes in the input assumptions can affect the fair value estimates and ultimately how much we recognize as stock-based compensation expense. The fair values of our stock options were estimated at the grant dates or at the acquisition dates for options assumed in a business combination. The weighted-average input assumptions used and resulting fair values of our stock options were as follows for fiscal 2018, 2017 and 2016:
| Year Ended May 31, | ||||||||||||
| 2018 | 2017 | 2016 | ||||||||||
| Expected life (in years) |
4.7 | 4.8 | 4.8 | |||||||||
| Risk-free interest rate |
2.0% | 1.0% | 1.6% | |||||||||
| Volatility |
22% | 23% | 24% | |||||||||
| Dividend yield |
1.5% | 1.5% | 1.5% | |||||||||
| Weighted-average fair value per share |
$ | 9.34 | $ | 8.18 | $ | 8.49 | ||||||
The expected life input is based on historical exercise patterns and post-vesting termination behavior, the risk-free interest rate input is based on U.S. Treasury instruments, the annualized dividend yield input is based on the per share dividend declared by the Board and the volatility input is calculated based on the implied volatility of our publicly traded options.
We estimated the fair values of the PSOs issued during fiscal 2018 using a Monte Carlo simulation approach as of the grant date with the following assumptions: risk-free interest rate of 2.14%, expected term of 7 years, expected volatility of 22.44% and dividend yield of 1.49%. Stock-based compensation expense is included in the following operating expense line items in our consolidated statements of operations:
| Year Ended May 31, | ||||||||||||
| (in millions) |
2018 | 2017 | 2016 | |||||||||
| Cloud services and license support |
$ | 82 | $ | 54 | $ | 44 | ||||||
| Hardware |
10 | 11 | 12 | |||||||||
| Services |
52 | 44 | 29 | |||||||||
| Sales and marketing |
361 | 306 | 220 | |||||||||
| Research and development |
921 | 770 | 609 | |||||||||
| General and administrative |
180 | 130 | 120 | |||||||||
| Acquisition related and other |
1 | 35 | 3 | |||||||||
|
|
|
|
|
|
|
|||||||
| Total stock-based compensation |
1,607 | 1,350 | 1,037 | |||||||||
|
|
|
|
|
|
|
|||||||
| Estimated income tax benefit included in provision for income taxes |
(451 | ) | (423 | ) | (322 | ) | ||||||
|
|
|
|
|
|
|
|||||||
| Total stock-based compensation, net of estimated income tax benefit |
$ | 1,156 | $ | 927 | $ | 715 | ||||||
|
|
|
|
|
|
|
|||||||
112
Table of Contents
Index to Financial Statements
ORACLE CORPORATION
NOTES TO CONSOLIDATED FINANCIAL STATEMENTS—(Continued)
May 31, 2018
Tax Benefits from Exercises of Stock Options and Vesting of Restricted Stock-Based Awards
Total cash received as a result of option exercises was approximately $2.3 billion, $2.1 billion and $1.3 billion for fiscal 2018, 2017 and 2016, respectively. The total aggregate intrinsic value of restricted stock-based awards that vested and were issued and stock options that were exercised was $3.0 billion, $2.0 billion and $1.0 billion for fiscal 2018, 2017 and 2016, respectively. In connection with the vesting and issuance of restricted stock-based awards and stock options that were exercised, the tax benefits realized by us were $860 million, $614 million and $311 million for fiscal 2018, 2017 and 2016, respectively.
Employee Stock Purchase Plan
We have an Employee Stock Purchase Plan (Purchase Plan) that allows employees to purchase shares of common stock at a price per share that is 95% of the fair market value of Oracle stock as of the end of the semi-annual option period. As of May 31, 2018, 48 million shares were reserved for future issuances under the Purchase Plan. We issued 3 million shares in each of fiscal 2018, 2017 and 2016, respectively, under the Purchase Plan.
Defined Contribution and Other Postretirement Plans
We offer various defined contribution plans for our U.S. and non-U.S. employees. Total defined contribution plan expense was $384 million, $366 million and $387 million for fiscal 2018, 2017 and 2016, respectively. The number of plan participants in our benefit plans has generally increased in recent years as we have hired additional employees and assumed eligible employees from our acquisitions.
In the United States, regular employees can participate in the Oracle Corporation 401(k) Savings and Investment Plan (Oracle 401(k) Plan). Participants can generally contribute up to 40% of their eligible compensation on a per-pay-period basis as defined by the Oracle 401(k) Plan document or by the section 402(g) limit as defined by the U.S. Internal Revenue Service (IRS). We match a portion of employee contributions, currently 50% up to 6% of compensation each pay period, subject to maximum aggregate matching amounts. Our contributions to the Oracle 401(k) Plan, net of forfeitures, were $151 million, $157 million and $153 million in fiscal 2018, 2017 and 2016, respectively.
We also offer non-qualified deferred compensation plans to certain employees whereby they may defer a portion of their annual base and/or variable compensation until retirement or a date specified by the employee in accordance with the plans. Deferred compensation plan assets and liabilities were each approximately $555 million as of May 31, 2018 and were each approximately $487 million as of May 31, 2017 and were presented in other assets and other non-current liabilities in the accompanying consolidated balance sheets.
We sponsor certain defined benefit pension plans that are offered primarily by certain of our foreign subsidiaries. Many of these plans were assumed through our acquisitions or are required by local regulatory requirements. We may deposit funds for these plans with insurance companies, third-party trustees, or into government-managed accounts consistent with local regulatory requirements, as applicable. Our total defined benefit plan pension expenses were $102 million, $85 million and $95 million for fiscal 2018, 2017 and 2016, respectively. The aggregate projected benefit obligation and aggregate net liability (funded status) of our defined benefit plans as of May 31, 2018 was $1.1 billion and $711 million, respectively, and as of May 31, 2017 was $1.1 billion and $712 million, respectively.
| 14. | INCOME TAXES |
Our effective tax rates for each of the periods presented are the result of the mix of income earned in various tax jurisdictions that apply a broad range of income tax rates. In the third quarter of fiscal 2018 the Tax Act was signed into law. The more significant provisions of the Tax Act as applicable to us are described in Note 1 above under “Impacts of the U.S. Tax Cuts and Jobs Act of 2017”. Our provision for income taxes for fiscal 2018 varied from the 21% U.S. statutory rate imposed by the Tax Act due primarily to the January 1, 2018 effective date of
113
Table of Contents
Index to Financial Statements
ORACLE CORPORATION
NOTES TO CONSOLIDATED FINANCIAL STATEMENTS—(Continued)
May 31, 2018
the Tax Act, the impacts of the Tax Act upon adoption, state taxes, the U.S. research and development tax credit, settlements with tax authorities, the tax effects of stock-based compensation and the U.S. domestic production activity deduction. Prior to the January 1, 2018 effective date of the Tax Act, our provision for income taxes historically differed from the tax computed at the previous U.S. federal statutory income tax rate due primarily to certain earnings considered as indefinitely reinvested in foreign operations, state taxes, the U.S. research and development tax credit, settlements with tax authorities, the tax effects of stock-based compensation and the U.S. domestic production activity deduction.
The following is a geographical breakdown of income before the provision for income taxes:
| Year Ended May 31, | ||||||||||||
| (in millions) |
2018 | 2017 | 2016 | |||||||||
| Domestic |
$ | 3,816 | $ | 3,533 | $ | 4,033 | ||||||
| Foreign |
9,075 | 7,984 | 7,409 | |||||||||
|
|
|
|
|
|
|
|||||||
| Income before provision for income taxes |
$ | 12,891 | $ | 11,517 | $ | 11,442 | ||||||
|
|
|
|
|
|
|
|||||||
The provision for income taxes consisted of the following:
| Year Ended May 31, | ||||||||||||
| (Dollars in millions) |
2018 | 2017 | 2016 | |||||||||
| Current provision: |
||||||||||||
| Federal |
$ | 8,329 | $ | 936 | $ | 1,301 | ||||||
| State |
264 | 257 | 271 | |||||||||
| Foreign |
1,084 | 1,475 | 1,074 | |||||||||
|
|
|
|
|
|
|
|||||||
| Total current provision |
$ | 9,677 | $ | 2,668 | $ | 2,646 | ||||||
|
|
|
|
|
|
|
|||||||
| Deferred benefit: |
||||||||||||
| Federal |
$ | (614 | ) | $ | (201 | ) | $ | (123 | ) | |||
| State |
(13 | ) | (36 | ) | (21 | ) | ||||||
| Foreign |
16 | (249 | ) | 39 | ||||||||
|
|
|
|
|
|
|
|||||||
| Total deferred benefit |
$ | (611 | ) | $ | (486 | ) | $ | (105 | ) | |||
|
|
|
|
|
|
|
|||||||
| Total provision for income taxes |
$ | 9,066 | $ | 2,182 | $ | 2,541 | ||||||
|
|
|
|
|
|
|
|||||||
| Effective income tax rate |
70.3% | 18.9% | 22.2% | |||||||||
114
Table of Contents
Index to Financial Statements
ORACLE CORPORATION
NOTES TO CONSOLIDATED FINANCIAL STATEMENTS—(Continued)
May 31, 2018
The provision for income taxes differed from the amount computed by applying the federal statutory rate to our income before provision for income taxes as follows:
| Year Ended May 31, | ||||||||||||
| (in millions) |
2018 | 2017 | 2016 | |||||||||
| U.S. federal statutory tax rate |
29.2% | 35.0% | 35.0% | |||||||||
| Tax provision at statutory rate |
$ | 3,765 | $ | 4,031 | $ | 4,005 | ||||||
| Impact of the Tax Act of 2017 |
||||||||||||
| One-time transition tax |
7,781 | — | — | |||||||||
| Deferred tax effects |
(820 | ) | — | — | ||||||||
| Foreign earnings at other than United States rates |
(1,006 | ) | (1,299 | ) | (1,284 | ) | ||||||
| State tax expense, net of federal benefit |
155 | 150 | 176 | |||||||||
| Settlements and releases from judicial decisions and statute expirations, net |
(252 | ) | (189 | ) | (150 | ) | ||||||
| Domestic production activity deduction |
(87 | ) | (119 | ) | (155 | ) | ||||||
| Stock-based compensation |
(302 | ) | (149 | ) | 74 | |||||||
| Other, net |
(168 | ) | (243 | ) | (125 | ) | ||||||
|
|
|
|
|
|
|
|||||||
| Total provision for income taxes |
$ | 9,066 | $ | 2,182 | $ | 2,541 | ||||||
|
|
|
|
|
|
|
|||||||
We recorded a provisional adjustment to our U.S. deferred income taxes as of May 31, 2018 to reflect the reduction in the U.S statutory tax rate from 35% to 21% resulting from the Tax Act. The components of our deferred tax liabilities and assets were as follows:
| May 31, | ||||||||
| (in millions) |
2018 | 2017 | ||||||
| Deferred tax liabilities: |
||||||||
| Unrealized gain on stock |
$ | (78 | ) | $ | (130 | ) | ||
| Acquired intangible assets |
(1,254 | ) | (2,502 | ) | ||||
| Unremitted earnings |
— | (1,515 | ) | |||||
| Depreciation and amortization |
(158 | ) | (180 | ) | ||||
| Other |
(48 | ) | (23 | ) | ||||
|
|
|
|
|
|||||
| Total deferred tax liabilities |
$ | (1,538 | ) | $ | (4,350 | ) | ||
|
|
|
|
|
|||||
| Deferred tax assets: |
||||||||
| Accruals and allowances |
$ | 567 | $ | 532 | ||||
| Employee compensation and benefits |
789 | 1,251 | ||||||
| Differences in timing of revenue recognition |
310 | 385 | ||||||
| Tax credit and net operating loss carryforwards |
2,614 | 4,029 | ||||||
|
|
|
|
|
|||||
| Total deferred tax assets |
$ | 4,280 | $ | 6,197 | ||||
|
|
|
|
|
|||||
| Valuation allowance |
(1,308 | ) | (1,164 | ) | ||||
|
|
|
|
|
|||||
| Net deferred tax assets |
$ | 1,434 | $ | 683 | ||||
|
|
|
|
|
|||||
| Recorded as: |
||||||||
| Non-current deferred tax assets |
$ | 1,491 | $ | 1,143 | ||||
| Non-current deferred tax liabilities (in other non-current liabilities) |
(57 | ) | (460 | ) | ||||
|
|
|
|
|
|||||
| Net deferred tax assets |
$ | 1,434 | $ | 683 | ||||
|
|
|
|
|
|||||
We provide for taxes on the undistributed earnings and the other outside basis temporary differences of foreign subsidiaries unless they are considered indefinitely reinvested outside the United States. At May 31, 2018, the
115
Table of Contents
Index to Financial Statements
ORACLE CORPORATION
NOTES TO CONSOLIDATED FINANCIAL STATEMENTS—(Continued)
May 31, 2018
amount of temporary differences related to other outside basis temporary differences of investments in foreign subsidiaries upon which United States income taxes have not been provided was approximately $7.9 billion. If the other outside basis differences were recognized in a taxable transaction, they would generate foreign tax credits that would reduce the federal tax liability associated with the foreign dividend or the otherwise taxable transaction. At May 31, 2018, assuming a full utilization of the foreign tax credits, the potential net deferred tax liability associated with these other outside basis temporary differences would be approximately $1.5 billion.
Our net deferred tax assets were $1.4 billion and $683 million as of May 31, 2018 and 2017, respectively. We believe that it is more likely than not that the net deferred tax assets will be realized in the foreseeable future. Realization of our net deferred tax assets is dependent upon our generation of sufficient taxable income in future years in appropriate tax jurisdictions to obtain benefit from the reversal of temporary differences, net operating loss carryforwards and tax credit carryforwards. The amount of net deferred tax assets considered realizable is subject to adjustment in future periods if estimates of future taxable income change.
The valuation allowance was $1.3 billion and $1.2 billion at each of May 31, 2018 and 2017, respectively. Substantially all of the valuation allowances as of May 31, 2018 and 2017 related to tax assets established in purchase accounting. Any subsequent reduction of that portion of the valuation allowance and the recognition of the associated tax benefits associated with our acquisitions will be recorded to our provision for income taxes subsequent to our final determination of the valuation allowance or the conclusion of the measurement period (as defined above), whichever comes first.
At May 31, 2018, we had federal net operating loss carryforwards of approximately $806 million, which are subject to limitation on their utilization. Approximately $802 million of these federal net operating losses expire in various years between fiscal 2019 and fiscal 2036. An immaterial amount of these federal net operating losses are not currently subject to expiration dates. We had state net operating loss carryforwards of approximately $2.4 billion at May 31, 2018, which expire between fiscal 2019 and fiscal 2036 and are subject to limitations on their utilization. We had total foreign net operating loss carryforwards of approximately $1.8 billion at May 31, 2018, which are subject to limitations on their utilization. Approximately $1.8 billion of these foreign net operating losses are not currently subject to expiration dates. The remainder of the foreign net operating losses, approximately $92 million, expire between fiscal 2019 and fiscal 2035. We had tax credit carryforwards of approximately $893 million at May 31, 2018, which are subject to limitations on their utilization. Approximately $738 million of these tax credit carryforwards are not currently subject to expiration dates. The remainder of the tax credit carryforwards, approximately $155 million, expire in various years between fiscal 2019 and fiscal 2038.
We classify our unrecognized tax benefits as either current or non-current income taxes payable in the accompanying consolidated balance sheets. The aggregate changes in the balance of our gross unrecognized tax benefits, including acquisitions, were as follows:
| Year Ended May 31, | ||||||||||||
| (in millions) |
2018 | 2017 | 2016 | |||||||||
| Gross unrecognized tax benefits as of June 1 |
$ | 4,919 | $ | 4,561 | $ | 4,038 | ||||||
| Increases related to tax positions from prior fiscal years |
200 | 128 | 350 | |||||||||
| Decreases related to tax positions from prior fiscal years |
(65 | ) | (218 | ) | (111 | ) | ||||||
| Increases related to tax positions taken during current fiscal year |
833 | 595 | 461 | |||||||||
| Settlements with tax authorities |
(42 | ) | (85 | ) | (73 | ) | ||||||
| Lapses of statutes of limitation |
(273 | ) | (47 | ) | (73 | ) | ||||||
| Cumulative translation adjustments and other, net |
13 | (15 | ) | (31 | ) | |||||||
|
|
|
|
|
|
|
|||||||
| Total gross unrecognized tax benefits as of May 31 |
$ | 5,585 | $ | 4,919 | $ | 4,561 | ||||||
|
|
|
|
|
|
|
|||||||
116
Table of Contents
Index to Financial Statements
ORACLE CORPORATION
NOTES TO CONSOLIDATED FINANCIAL STATEMENTS—(Continued)
May 31, 2018
As of May 31, 2018, 2017 and 2016, $4.2 billion, $3.4 billion and $3.1 billion, respectively, of unrecognized tax benefits would affect our effective tax rate if recognized. We recognized interest and penalties related to uncertain tax positions in our provision for income taxes line of our consolidated statements of operations of $127 million, $125 million and $26 million during fiscal 2018, 2017 and 2016, respectively. Interest and penalties accrued as of May 31, 2018 and 2017 were $992 million and $885 million, respectively.
Domestically, U.S. federal and state taxing authorities are currently examining income tax returns of Oracle and various acquired entities for years through fiscal 2017. Many issues are at an advanced stage in the examination process, the most significant of which include the deductibility of certain royalty payments, transfer pricing, extraterritorial income exemptions, domestic production activity, foreign tax credits, and research and development credits taken. With all of these domestic audit issues considered in the aggregate, we believe that it was reasonably possible that, as of May 31, 2018, the gross unrecognized tax benefits related to these audits could decrease (whether by payment, release, or a combination of both) in the next 12 months by as much as $665 million ($611 million net of offsetting tax benefits). Our U.S. federal income tax returns have been examined for all years prior to fiscal 2007 and we are no longer subject to audit for those periods. Our U.S. state income tax returns, with some exceptions, have been examined for all years prior to fiscal 2004, and we are no longer subject to audit for those periods.
Internationally, tax authorities for numerous non-U.S. jurisdictions are also examining returns affecting our unrecognized tax benefits. We believe that it was reasonably possible that, as of May 31, 2018, the gross unrecognized tax benefits, could decrease (whether by payment, release, or a combination of both) by as much as $162 million ($68 million net of offsetting tax benefits) in the next 12 months, related primarily to transfer pricing. With some exceptions, we are generally no longer subject to tax examinations in non-U.S. jurisdictions for years prior to fiscal 1997.
We believe that we have adequately provided under GAAP for outcomes related to our tax audits. However, there can be no assurances as to the possible outcomes or any related financial statement effect thereof. On July 27, 2015, in Altera Corp. v. Commissioner, the U.S. Tax Court issued an opinion related to the treatment of stock-based compensation expense in an intercompany cost-sharing arrangement. At this time, the U.S. Department of the Treasury has not withdrawn the requirement to include stock-based compensation from its regulations. We have reviewed this case and its impact on Oracle and concluded that no adjustment to the consolidated financial statements is appropriate at this time. We will continue to monitor ongoing developments and potential impacts to our consolidated financial statements.
We are under audit by the IRS and various other domestic and foreign tax authorities with regards to income tax and indirect tax matters and are involved in various challenges and litigation in a number of countries, including, in particular, Australia, Brazil, Canada, India, Indonesia, Korea, Mexico, Spain and the United Kingdom, where the amounts under controversy are significant. In some, although not all cases, we have reserved for potential adjustments to our provision for income taxes and accrual of indirect taxes that may result from examinations by, or any negotiated agreements with, these tax authorities or final outcomes in judicial proceedings, and we believe that the final outcome of these examinations, agreements or judicial proceedings will not have a material effect on our results of operations. If events occur which indicate payment of these amounts is unnecessary, the reversal of the liabilities would result in the recognition of benefits in the period we determine the liabilities are no longer necessary. If our estimates of the federal, state, and foreign income tax liabilities and indirect tax liabilities are less than the ultimate assessment, it could result in a further charge to expense.
| 15. | SEGMENT INFORMATION |
ASC 280, Segment Reporting, establishes standards for reporting information about operating segments. Operating segments are defined as components of an enterprise about which separate financial information is
117
Table of Contents
Index to Financial Statements
ORACLE CORPORATION
NOTES TO CONSOLIDATED FINANCIAL STATEMENTS—(Continued)
May 31, 2018
available that is evaluated regularly by the chief operating decision maker, or decision-making group, in deciding how to allocate resources and in assessing performance. Our chief operating decision makers (CODMs) are our Chief Executive Officers and Chief Technology Officer. We are organized by line of business and geographically. While our CODMs evaluate results in a number of different ways, the line of business management structure is the primary basis for which the allocation of resources and financial results are assessed. The footnote information below presents the financial information provided to our CODMs for their review and assists our CODMs with evaluating the company’s performance and allocating company resources.
We have three businesses—cloud and license, hardware and services—each of which are comprised of a single operating segment.
Our cloud and license business engages in the sale, marketing and delivery of our applications, platform and infrastructure technologies through various deployment models including license support offerings; Oracle Cloud Services offerings; and cloud license and on-premise license offerings. License support revenues are typically generated through the sale of license support contracts related to cloud license and on-premise licenses purchased by our customers at their option and are generally recognized as revenues ratably over the contractual term. Our Oracle Cloud Services offerings deliver certain of our applications, platform and infrastructure technologies on a subscription basis via cloud-based deployment models that we host, manage and support and revenues generally are recognized over the subscription period. Cloud license and on-premise license revenues represent fees earned from granting customers licenses, generally on a perpetual basis, to use our database and middleware and our applications software products within cloud and on-premise IT environments and are generally recognized as revenues when unrestricted access to the license is granted, provided all other revenue recognition criteria are met.
Our hardware business provides Oracle Engineered Systems, servers, storage, industry-specific hardware, operating systems, virtualization, management and other hardware-related software to support diverse IT environments. Our hardware business also includes hardware support, which provides customers with software updates for the software components that are essential to the functionality of the hardware products, such as Oracle Solaris and certain other software, and can include product repairs, maintenance services and technical support services.
Our services business provides services to customers and partners to help maximize the performance of their investments in Oracle applications, platform and infrastructure technologies.
We do not track our assets for each business. Consequently, it is not practical to show assets by operating segment.
118
Table of Contents
Index to Financial Statements
ORACLE CORPORATION
NOTES TO CONSOLIDATED FINANCIAL STATEMENTS—(Continued)
May 31, 2018
The following table presents summary results for each of our three businesses for each of fiscal 2018, 2017 and 2016:
| Year Ended May 31, | ||||||||||||
| (in millions) |
2018 | 2017 | 2016 | |||||||||
| Cloud and license: |
||||||||||||
| Revenues(1) |
$ | 32,491 | $ | 30,389 | $ | 28,997 | ||||||
| Cloud services and license support expenses |
3,447 | 2,885 | 2,545 | |||||||||
| Sales and marketing expenses |
7,219 | 6,886 | 6,570 | |||||||||
|
|
|
|
|
|
|
|||||||
| Margin(2) |
$ | 21,825 | $ | 20,618 | $ | 19,882 | ||||||
|
|
|
|
|
|
|
|||||||
| Hardware: |
||||||||||||
| Revenues(1) |
$ | 3,993 | $ | 4,152 | $ | 4,669 | ||||||
| Hardware products and support expenses |
1,551 | 1,623 | 2,031 | |||||||||
| Sales and marketing expenses |
635 | 820 | 867 | |||||||||
|
|
|
|
|
|
|
|||||||
| Margin(2) |
$ | 1,807 | $ | 1,709 | $ | 1,771 | ||||||
|
|
|
|
|
|
|
|||||||
| Services: |
||||||||||||
| Revenues |
$ | 3,394 | $ | 3,358 | $ | 3,391 | ||||||
| Services expenses |
2,739 | 2,668 | 2,634 | |||||||||
|
|
|
|
|
|
|
|||||||
| Margin(2) |
$ | 655 | $ | 690 | $ | 757 | ||||||
|
|
|
|
|
|
|
|||||||
| Totals: |
||||||||||||
| Revenues(1) |
$ | 39,878 | $ | 37,899 | $ | 37,057 | ||||||
| Expenses |
15,591 | 14,882 | 14,647 | |||||||||
|
|
|
|
|
|
|
|||||||
| Margin(2) |
$ | 24,287 | $ | 23,017 | $ | 22,410 | ||||||
|
|
|
|
|
|
|
|||||||
| (1) | Cloud and license revenues and hardware revenues presented for management reporting included revenues related to cloud and license obligations and hardware obligations that would have otherwise been recorded by the acquired businesses as independent entities but were not recognized in our consolidated statements of operations for the periods presented due to business combination accounting requirements. See Note 9 for an explanation of these adjustments and the table below for a reconciliation of our total operating segment revenues to our total revenues as reported in our consolidated statements of operations. |
| (2) | The margins reported reflect only the direct controllable costs of each line of business and do not include allocations of product development, general and administrative and certain other allocable expenses. Additionally, the margins reported above do not reflect amortization of intangible assets, acquisition related and other expenses, restructuring expenses, stock-based compensation, interest expense or certain other non-operating income, net. Refer to the table below for a reconciliation of our total margin for operating segments to our income before provision for income taxes as reported in our consolidated statements of operations. |
119
Table of Contents
Index to Financial Statements
ORACLE CORPORATION
NOTES TO CONSOLIDATED FINANCIAL STATEMENTS—(Continued)
May 31, 2018
The following table reconciles total operating segment revenues to total revenues as well as total operating segment margin to income before provision for income taxes:
| Year Ended May 31, | ||||||||||||
| (in millions) |
2018 | 2017 | 2016 | |||||||||
| Total revenues for operating segments |
$ | 39,878 | $ | 37,899 | $ | 37,057 | ||||||
| Cloud and license revenues(1) |
(47 | ) | (171 | ) | (9 | ) | ||||||
| Hardware revenues(1) |
— | — | (1 | ) | ||||||||
|
|
|
|
|
|
|
|||||||
| Total revenues |
$ | 39,831 | $ | 37,728 | $ | 37,047 | ||||||
|
|
|
|
|
|
|
|||||||
| Total margin for operating segments |
$ | 24,287 | $ | 23,017 | $ | 22,410 | ||||||
| Cloud and license revenues(1) |
(47 | ) | (171 | ) | (9 | ) | ||||||
| Hardware revenues(1) |
— | — | (1 | ) | ||||||||
| Research and development |
(6,091 | ) | (6,159 | ) | (5,787 | ) | ||||||
| General and administrative |
(1,289 | ) | (1,176 | ) | (1,155 | ) | ||||||
| Amortization of intangible assets |
(1,620 | ) | (1,451 | ) | (1,638 | ) | ||||||
| Acquisition related and other |
(52 | ) | (103 | ) | (42 | ) | ||||||
| Restructuring |
(588 | ) | (463 | ) | (458 | ) | ||||||
| Stock-based compensation for operating segments |
(505 | ) | (415 | ) | (305 | ) | ||||||
| Expense allocations and other, net |
(416 | ) | (369 | ) | (411 | ) | ||||||
| Interest expense |
(2,025 | ) | (1,798 | ) | (1,467 | ) | ||||||
| Non-operating income, net |
1,237 | 605 | 305 | |||||||||
|
|
|
|
|
|
|
|||||||
| Income before provision for income taxes |
$ | 12,891 | $ | 11,517 | $ | 11,442 | ||||||
|
|
|
|
|
|
|
|||||||
| (1) | Cloud and license revenues and hardware revenues presented for management reporting included revenues related to cloud and license obligations and hardware obligations that would have otherwise been recorded by the acquired businesses as independent entities but were not recognized in our consolidated statements of operations for the periods presented due to business combination accounting requirements. See Note 9 for an explanation of these adjustments and this table for a reconciliation of our total operating segment revenues to our total revenues as reported in our consolidated statements of operations. |
Geographic Information
Disclosed in the table below is geographic information for each country that comprised greater than three percent of our total revenues for any of fiscal 2018, 2017 or 2016.
| As of and for the Year Ended May 31, | ||||||||||||||||||||||||
| 2018 | 2017 | 2016 | ||||||||||||||||||||||
| (in millions) |
Revenues | Long- Lived Assets(1) |
Revenues | Long- Lived Assets(1) |
Revenues | Long- Lived Assets(1) |
||||||||||||||||||
| United States |
$ | 19,077 | $ | 4,976 | $ | 17,770 | $ | 4,680 | $ | 17,264 | $ | 3,646 | ||||||||||||
| United Kingdom |
2,172 | 510 | 1,999 | 402 | 2,349 | 334 | ||||||||||||||||||
| Japan |
1,693 | 388 | 1,618 | 380 | 1,465 | 375 | ||||||||||||||||||
| Germany |
1,375 | 179 | 1,417 | 116 | 1,438 | 40 | ||||||||||||||||||
| Canada |
1,143 | 78 | 1,102 | 60 | 1,096 | 44 | ||||||||||||||||||
| Other countries |
14,371 | 1,223 | 13,822 | 1,090 | 13,435 | 989 | ||||||||||||||||||
|
|
|
|
|
|
|
|
|
|
|
|
|
|||||||||||||
| Total |
$ | 39,831 | $ | 7,354 | $ | 37,728 | $ | 6,728 | $ | 37,047 | $ | 5,428 | ||||||||||||
|
|
|
|
|
|
|
|
|
|
|
|
|
|||||||||||||
| (1) | Long-lived assets exclude goodwill, intangible assets, equity investments and deferred taxes, which are not allocated to specific geographic locations as it is impracticable to do so. |
120
Table of Contents
Index to Financial Statements
ORACLE CORPORATION
NOTES TO CONSOLIDATED FINANCIAL STATEMENTS—(Continued)
May 31, 2018
| 16. | EARNINGS PER SHARE |
Basic earnings per share is computed by dividing net income for the period by the weighted-average number of common shares outstanding during the period. Diluted earnings per share is computed by dividing net income for the period by the weighted-average number of common shares outstanding during the period, plus the dilutive effect of outstanding restricted stock-based awards, stock options, and shares issuable under the employee stock purchase plan using the treasury stock method. The following table sets forth the computation of basic and diluted earnings per share:
| Year Ended May 31, | ||||||||||||
| (in millions, except per share data) |
2018 | 2017 | 2016 | |||||||||
| Net income |
$ | 3,825 | $ | 9,335 | $ | 8,901 | ||||||
|
|
|
|
|
|
|
|||||||
| Weighted average common shares outstanding |
4,121 | 4,115 | 4,221 | |||||||||
| Dilutive effect of employee stock plans |
117 | 102 | 84 | |||||||||
|
|
|
|
|
|
|
|||||||
| Dilutive weighted average common shares outstanding |
4,238 | 4,217 | 4,305 | |||||||||
|
|
|
|
|
|
|
|||||||
| Basic earnings per share |
$ | 0.93 | $ | 2.27 | $ | 2.11 | ||||||
| Diluted earnings per share |
$ | 0.90 | $ | 2.21 | $ | 2.07 | ||||||
| Shares subject to anti-dilutive restricted stock-based awards and stock options excluded from calculation(1) |
64 | 74 | 63 | |||||||||
| (1) | These weighted shares relate to anti-dilutive restricted stock-based awards and stock options as calculated using the treasury stock method and contingently issuable shares under PSO and PSU agreements. Such shares could be dilutive in the future. See Note 13 for information regarding the exercise prices of our outstanding, unexercised stock options. |
| 17. | LEGAL PROCEEDINGS |
Hewlett-Packard Company Litigation
On June 15, 2011, Hewlett-Packard Company, now Hewlett Packard Enterprise Company (HP), filed a complaint in the California Superior Court, County of Santa Clara against Oracle Corporation alleging numerous causes of action including breach of contract, breach of the covenant of good faith and fair dealing, defamation, intentional interference with prospective economic advantage, and violation of the California Unfair Business Practices Act. The complaint alleged that when Oracle announced on March 22 and 23, 2011 that it would no longer develop future versions of its software to run on HP’s Itanium-based servers, it breached a settlement agreement signed on September 20, 2010 between HP and Mark Hurd (the Hurd Settlement Agreement), who is our Chief Executive Officer and was both HP’s former chief executive officer and chairman of HP’s board of directors. HP sought a judicial declaration of the parties’ rights and obligations under the Hurd Settlement Agreement and other equitable and monetary relief.
Oracle answered the complaint and filed a cross-complaint, which was amended on December 2, 2011. The amended cross-complaint alleged claims including violation of the Lanham Act. Oracle alleged that HP had secretly agreed to pay Intel to continue to develop and manufacture the Itanium microprocessor, and had misrepresented to customers that the Itanium microprocessor had a long roadmap, among other claims. Oracle sought equitable rescission of the Hurd Settlement Agreement, and other equitable and monetary relief.
The court bifurcated the trial and tried HP’s causes of action for declaratory relief and promissory estoppel without a jury in June 2012. The court issued a final statement of decision on August 28, 2012, finding that the Hurd Settlement Agreement required Oracle to continue to develop certain of its software products for use on HP’s Itanium-based servers and to port such products at no cost to HP for as long as HP sells those servers (the Phase One Ruling). A jury trial began on May 23, 2016. On June 30, 2016, the jury returned a verdict in favor of HP on its claims for breach of contract and breach of the implied covenant of good faith and fair dealing and
121
Table of Contents
Index to Financial Statements
ORACLE CORPORATION
NOTES TO CONSOLIDATED FINANCIAL STATEMENTS—(Continued)
May 31, 2018
against Oracle on its claim for violation of the Lanham Act (the Phase Two Jury Verdict). The jury awarded HP damages in the amount of $3.0 billion, and HP is entitled to post-judgment interest on this award. On August 30, 2016, the court denied HP’s motion for pre-judgment interest. Judgment was entered on October 20, 2016. Oracle posted certain court-mandated surety bonds with the court in order to proceed with its motion for a new trial and entered into related indemnification agreements with each of the surety bond issuing companies. Oracle filed a motion for a new trial on November 14, 2016, which was denied.
Oracle filed its notice of appeal on January 17, 2017, specifying that it was appealing the trial court’s Phase One Ruling and Phase Two Jury Verdict. On February 2, 2017, HP filed a notice of appeal of the trial court’s denial of pre-judgment interest. No amounts have been paid or recorded to our results of operations either prior to or subsequent to the Phase One Ruling or Phase Two Jury Verdict. We continue to believe that we have meritorious defenses against HP’s claims, and we intend to present these defenses to the appellate court. Among the arguments we expect to make on appeal are the following: the trial court misapplied fundamental principles of contract law and misinterpreted the Hurd Settlement Agreement, including by disregarding the context of the Hurd Settlement Agreement and the evidence of the parties’ mutual intentions; that HP’s breach of contract claim should fail as a matter of law because HP does not claim and did not prove that Oracle failed to deliver any software under the trial court’s interpretation of the contract; that awarding HP both damages for breach of the Hurd Settlement Agreement and specific performance of that agreement constitutes an improper double recovery; and that the damages award is excessive, unsupported by the evidence, and contrary to law. We cannot currently estimate a reasonably possible range of loss for this action due to the complexities and uncertainty surrounding the appeal process and the nature of the claims. Litigation is inherently unpredictable, and the outcome of the appeal process related to this action is uncertain. It is possible that the resolution of this action could have a material impact to our future cash flows and results of operations.
Derivative Litigation
On May 3, 2017, a stockholder derivative lawsuit was filed in the Court of Chancery of the State of Delaware. The derivative suit is brought by an alleged stockholder of Oracle, purportedly on Oracle’s behalf, against Oracle, our Chairman of the Board of Directors and Chief Technology Officer in his capacities as a director, officer and an alleged controlling stockholder, one of our Chief Executive Officers (who is also a director), three other directors, and Oracle as a nominal defendant. Plaintiff alleges that the defendants breached their fiduciary duties by causing Oracle to agree to purchase NetSuite Inc. (NetSuite) at an excessive price. Plaintiff seeks declaratory relief, an order rescinding or reforming the NetSuite transaction, unspecified monetary damages (including interest), attorneys’ fees and costs, and disgorgement of various unspecified profits, fees, compensation, and benefits.
On July 18, 2017, a second stockholder derivative lawsuit was filed in the Court of Chancery of the State of Delaware, brought by another alleged stockholder of Oracle, purportedly on Oracle’s behalf. The suit is brought against all current members and one former member of our Board of Directors, and Oracle as a nominal defendant. Plaintiff alleges that the defendants breached their fiduciary duties by causing Oracle to agree to purchase NetSuite at an excessive price. Plaintiff seeks declaratory relief, unspecified monetary damages (including interest), and attorneys’ fees and costs.
On August 9, 2017, the court consolidated the two derivative cases. In a September 7, 2017 order, the court appointed plaintiff’s counsel in the second case as lead plaintiffs’ counsel and designated the July 18, 2017 complaint as the operative complaint. The defendants filed a motion to dismiss on October 27, 2017, and after briefing and argument, the court denied this motion on March 19, 2018. The parties stipulated that all of the individual defendants, except for our Chief Technology Officer and one of our Chief Executive Officers, should be dismissed from this case without prejudice, and on March 28, 2018, the court approved this stipulation. On May 4, 2018, the remaining defendants answered plaintiff’s complaint.
122
Table of Contents
Index to Financial Statements
ORACLE CORPORATION
NOTES TO CONSOLIDATED FINANCIAL STATEMENTS—(Continued)
May 31, 2018
On May 4, 2018, the Board of Directors established a Special Litigation Committee (the SLC) to investigate the allegations in this derivative action. Three outside directors serve on the SLC.
While Oracle continues to evaluate these claims, we do not believe this litigation will have a material impact on our financial position or results of operations.
Other Litigation
We are party to various other legal proceedings and claims, either asserted or unasserted, which arise in the ordinary course of business, including proceedings and claims that relate to acquisitions we have completed or to companies we have acquired or are attempting to acquire. While the outcome of these matters cannot be predicted with certainty, we do not believe that the outcome of any of these matters, individually or in the aggregate, will result in losses that are materially in excess of amounts already recognized, if any.
123
Table of Contents
Index to Financial Statements
ORACLE CORPORATION
VALUATION AND QUALIFYING ACCOUNTS
| (in millions) |
Beginning Balance |
Additions Charged to Operations or Other Accounts |
Write-offs | Translation Adjustments and Other |
Ending Balance |
|||||||||||||||
| Allowances for Doubtful Trade Receivables |
||||||||||||||||||||
| Year Ended: |
||||||||||||||||||||
| May 31, 2016 |
$ | 285 | $ | 130 | $ | (90 | ) | $ | 2 | $ | 327 | |||||||||
|
|
|
|
|
|
|
|
|
|
|
|||||||||||
| May 31, 2017 |
$ | 327 | $ | 129 | $ | (138 | ) | $ | 1 | $ | 319 | |||||||||
|
|
|
|
|
|
|
|
|
|
|
|||||||||||
| May 31, 2018 |
$ | 319 | $ | 146 | $ | (98 | ) | $ | 3 | $ | 370 | |||||||||
|
|
|
|
|
|
|
|
|
|
|
|||||||||||
None.
124
Table of Contents
Index to Financial Statements
ORACLE CORPORATION
INDEX OF EXHIBITS
The following exhibits are filed herewith or are incorporated by reference to exhibits previously filed with the U.S. Securities and Exchange Commission.
| Exhibit No. |
Exhibit Description |
Incorporated by Reference | ||||||||||
| Form | File No. | Exhibit | Filing Date | Filed By | ||||||||
| 2.01 | 8-K | 001-35992 | 99.1 | 8/1/16 | Oracle Corporation | |||||||
| 3.01 | 8-K 12G3 |
000-51788 | 3.01 | 2/6/06 | Oracle Corporation | |||||||
| 3.02 | 8-K | 001-35992 | 3.02 | 6/16/16 | Oracle Corporation | |||||||
| 4.01 | S-3 ASR |
333-166643 | 4.04 | 5/7/10 | Oracle Corporation | |||||||
| 4.02 | Indenture dated January 13, 2006, among Ozark Holding Inc., Oracle Corporation and Citibank, N.A. |
8-K | 000-14376 | 10.34 | 1/20/06 | Oracle Systems Corporation | ||||||
| 4.03 | S-3 ASR |
333-142796 | 4.3 | 5/10/07 | Oracle Corporation | |||||||
| 4.04 | 8-K | 000-51788 | 4.09 | 4/8/08 | Oracle Corporation | |||||||
| 4.05 | 8-K | 000-51788 | 4.08 | 7/8/09 | Oracle Corporation | |||||||
| 4.06 | 10-Q | 000-51788 | 4.08 | 9/20/10 | Oracle Corporation | |||||||
| 4.07 | S-4 | 333-176405 | 4.5 | 8/19/11 | Oracle Corporation | |||||||
| 4.08 | 8-K | 000-51788 | 4.10 | 10/25/12 | Oracle Corporation | |||||||
| 4.09 | 8-K | 001-35992 | 4.11 | 7/10/13 | Oracle Corporation | |||||||
| 4.10 | 8-K | 001-35992 | 4.12 | 7/16/13 | Oracle Corporation | |||||||
| 4.11 | 8-K | 001-35992 | 4.13 | 7/8/14 | Oracle Corporation | |||||||
125
Table of Contents
Index to Financial Statements
| Exhibit No. |
Exhibit Description |
Incorporated by Reference | ||||||||||
| Form | File No. | Exhibit | Filing Date | Filed By | ||||||||
| 4.12 | 8-K | 001-35992 | 4.13 | 5/5/15 | Oracle Corporation | |||||||
| 4.13 | 8-K | 001-35992 | 4.1 | 7/7/16 | Oracle Corporation | |||||||
| 4.14 | 8-K | 001-35992 | 4.1 | 11/9/17 | Oracle Corporation | |||||||
| 10.01* | Oracle Corporation Deferred Compensation Plan, as amended and restated as of July 1, 2015 |
10-Q | 001-35992 | 10.01 | 9/18/15 | Oracle Corporation | ||||||
| 10.02* | 10-K | 000-51788 | 10.02 | 7/1/10 | Oracle Corporation | |||||||
| 10.03* | 10-K | 001-35992 | 10.03 | 6/22/16 | Oracle Corporation | |||||||
| 10.04* | Amended and Restated 2000 Long-Term Equity Incentive Plan, as approved on November 15, 2017 |
8-K | 001-35992 | 10.04 | 11/17/17 | Oracle Corporation | ||||||
| 10.05* | 10-Q | 001-35992 | 10.05 | 9/18/17 | Oracle Corporation | |||||||
| 10.06* | 10-K | 001-35992 | 10.06 | 06/25/15 | Oracle Corporation | |||||||
| 10.07* | Form of Indemnity Agreement for Directors and Executive Officers |
10-Q | 000-51788 | 10.07 | 12/23/11 | Oracle Corporation | ||||||
| 10.08* | 8-K | 000-51788 | 10.28 | 9/8/10 | Oracle Corporation | |||||||
| 10.09* | 8-K | 000-51788 | 10.29 | 10/13/10 | Oracle Corporation | |||||||
| 10.10 | 8-K | 000-51788 | 10.14 | 4/26/13 | Oracle Corporation | |||||||
| 10.11* | 10-Q | 001-35992 | 10.15 | 9/18/15 | Oracle Corporation | |||||||
| 10.12* | 10-Q | 001-35992 | 10.16 | 9/23/14 | Oracle Corporation | |||||||
126
Table of Contents
Index to Financial Statements
| Exhibit No. |
Exhibit Description |
Incorporated by Reference | ||||||||||
| Form | File No. | Exhibit | Filing Date | Filed By | ||||||||
| 10.13* | 10-K | 001-35992 | 10.17 | 06/25/15 | Oracle Corporation | |||||||
| 10.14* | 10-Q | 001-35992 | 10.16 | 9/18/17 | Oracle Corporation | |||||||
| 10.15* | 10-Q | 001-35992 | 10.17 | 9/18/17 | Oracle Corporation | |||||||
| 12.01‡ | ||||||||||||
| 21.01‡ | ||||||||||||
| 23.01‡ | ||||||||||||
| 31.01‡ | Rule 13a-14(a)/15d-14(a) Certification of Principal Executive Officer |
|||||||||||
| 31.02‡ | Rule 13a-14(a)/15d-14(a) Certification of Principal Executive and Financial Officer |
|||||||||||
| 32.01† | Section 1350 Certification of Principal Executive Officers and Principal Financial Officer |
|||||||||||
| 101‡ | Interactive Data Files Pursuant to Rule 405 of Regulation S-T: (1) Consolidated Balance Sheets as of May 31, 2018 and 2016, (2) Consolidated Statements of Operations for the years ended May 31, 2018, 2017 and 2016, (3) Consolidated Statements of Comprehensive Income for the years ended May 31, 2018, 2017 and 2016, (4) Consolidated Statements of Equity for the years ended May 31, 2018, 2017 and 2016, (5) Consolidated Statements of Cash Flows for the years ended May 31, 2018, 2017 and 2016, (6) Notes to Consolidated Financial Statements and (7) Financial Statement Schedule II |
|||||||||||
| * | Indicates management contract or compensatory plan or arrangement. |
| ‡ | Filed herewith. |
| † | Furnished herewith. |
127
Table of Contents
Index to Financial Statements
Pursuant to the requirements of Section 13 or 15(d) of the Securities Exchange Act of 1934, the registrant has duly caused this report to be signed on its behalf by the undersigned, thereunto duly authorized.
| ORACLE CORPORATION | ||||||
| Date: June 22, 2018 |
By: |
/S/ SAFRA A. CATZ | ||||
| Safra A. Catz | ||||||
| Chief Executive Officer and Director | ||||||
| (Principal Executive and Financial Officer) | ||||||
| Date: June 22, 2018 |
By: |
/S/ MARK V. HURD | ||||
| Mark V. Hurd | ||||||
| Chief Executive Officer and Director | ||||||
| (Principal Executive Officer) | ||||||
Pursuant to the requirements of the Securities Exchange Act of 1934, this report has been signed by the following persons on behalf of the Registrant and in the capacities and on the date indicated.
| Name |
Title |
Date | ||
| /S/ SAFRA A. CATZ Safra A. Catz |
Chief Executive Officer and Director (Principal Executive and Financial Officer) | June 22, 2018 | ||
| /S/ MARK V. HURD Mark V. Hurd |
Chief Executive Officer and Director (Principal Executive Officer) | June 22, 2018 | ||
| /S/ WILLIAM COREY WEST William Corey West |
Executive Vice President, Corporate Controller and Chief Accounting Officer (Principal Accounting Officer) | June 22, 2018 | ||
| /S/ LAWRENCE J. ELLISON Lawrence J. Ellison |
Chairman of the Board of Directors and Chief Technology Officer | June 22, 2018 | ||
| /S/ JEFFREY O. HENLEY Jeffrey O. Henley |
Vice Chairman of the Board of Directors | June 22, 2018 | ||
| /S/ JEFFREY S. BERG Jeffrey S. Berg |
Director |
June 22, 2018 | ||
| /S/ MICHAEL J. BOSKIN Michael J. Boskin |
Director |
June 22, 2018 | ||
| /S/ BRUCE R. CHIZEN Bruce R. Chizen |
Director |
June 22, 2018 | ||
| /S/ GEORGE H. CONRADES George H. Conrades |
Director |
June 22, 2018 | ||
| /S/ HECTOR GARCIA-MOLINA Hector Garcia-Molina |
Director |
June 22, 2018 | ||
| /S/ RENÉE J. JAMES Renée J. James |
Director |
June 22, 2018 | ||
128
Table of Contents
Index to Financial Statements
| Name |
Title |
Date | ||
|
/S/ CHARLES W. MOORMAN IV Charles W. Moorman IV |
Director |
June 22, 2018 | ||
| /S/ LEON E. PANETTA Leon E. Panetta |
Director |
June 22, 2018 | ||
| /S/ WILLIAM G. PARRETT William G. Parrett |
Director |
June 22, 2018 | ||
| /S/ NAOMI O. SELIGMAN Naomi O. Seligman |
Director |
June 22, 2018 | ||
129