Attached files
| file | filename |
|---|---|
| 8-K - FORM 8-K - VICI PROPERTIES INC. | d593387d8k.htm |
| EX-99.1 - EXHIBIT 99.1 - VICI PROPERTIES INC. | d593387dex991.htm |
| EX-10.1 - EXHIBIT 10.1 - VICI PROPERTIES INC. | d593387dex101.htm |
| EX-2.1 - EXHIBIT 2.1 - VICI PROPERTIES INC. | d593387dex21.htm |
Margaritaville Resort Casino transaction OVERVIEW June 19, 2018 Exhibit 99.2
Disclaimers Forward-Looking Statements This presentation contains forward-looking statements within the meaning of the federal securities laws. You can identify these statements by our use of the words “assumes,” “believes,” “estimates,” “expects,” “guidance,” “intends,” “plans,” “projects,” and similar expressions that do not relate to historical matters. All statements other than statements of historical fact are forward-looking statements. You should exercise caution in interpreting and relying on forward-looking statements because they involve known and unknown risks, uncertainties, and other factors which are, in some cases, beyond the Company’s control and could materially affect actual results, performance, or achievements. Among those risks, uncertainties and other factors are risks that the acquisition of the Margaritaville Resort Casino may not be consummated on the terms or timeframe described herein, or at all; the ability of the parties to satisfy the conditions set forth in the definitive transaction documents, including the ability to receive, or delays in obtaining, the regulatory approvals required to consummate the transactions; the terms on which the Company finances the transaction, including the source of funds used to finance such transaction; disruptions to the real property and operations of the Margaritaville Resort Casino during the pendency of the closing; risks that the Company may not achieve the benefits contemplated by the acquisition of the real estate assets (including any expected accretion or the amount of any future rent payments); and risks that not all potential risks and liabilities have been identified in the due diligence. Additional important factors that may affect the Company’s business, results of operations and financial position are described from time to time in the Company’s Annual Report on Form 10-K for the year ended December 31, 2017, Quarterly Reports on Form 10-Q and the Company’s other filings with the Securities and Exchange Commission. The Company does not undertake any obligation to update or revise any forward-looking statement, whether as a result of new information, future events, or otherwise, except as may be required by applicable law. Market and Industry Data This presentation contains estimates and information concerning the Company’s industry, including market position, rent growth and rent coverage of the Company’s peers, that are based on industry publications, reports and peer company public filings. This information involves a number of assumptions and limitations, and you are cautioned not to rely on or give undue weight to this information. The Company has not independently verified the accuracy or completeness of the data contained in these industry publications, reports or filings. The industry in which the Company operates is subject to a high degree of uncertainty and risk due to variety of factors, including those described in the “Risk Factors” section of the Company’s public filings with the SEC. Penn National Gaming Information The Company makes no representation as to the accuracy or completeness of the information regarding Penn National Gaming, Inc. (“Penn National”) included in this presentation. The historical audited and unaudited financial statements of Penn National, as the parent and guarantor of Margaritaville Bossier City, the Company’s lessee, have been filed with the SEC. Non-GAAP Financial Measures This presentation includes reference to Funds From Operations (“FFO”), Adjusted Funds From Operations (“AFFO”) and Adjusted EBITDA, which are not required by, or presented in accordance with, generally accepted accounting principles in the United States (“GAAP”). These are non-GAAP financial measures and should not be construed as alternatives to net income or as an indicator of operating performance (as determined in accordance with GAAP). The Company believes FFO, AFFO and Adjusted EBITDA provide a meaningful perspective of the underlying operating performance of our business. FFO is a non-GAAP financial measure that is considered a supplemental measure for the real estate industry and a supplement to GAAP measures. Consistent with the definition used by The National Association of Real Estate Investment Trusts (“NAREIT”), the Company defines FFO as net income (or loss) (computed in accordance with GAAP) excluding gains (or losses) from sales of property plus real estate depreciation. AFFO is a non-GAAP measure that is used as a supplemental operating measure to evaluate the Company’s operating performance. The Company calculates AFFO by adding or subtracting from FFO direct financing lease adjustments, transaction costs incurred in connection with the acquisition of real estate investments, non-cash stock-based compensation expense, amortization of debt issuance costs and original issue discount, other non-cash interest expense, non-real estate depreciation (which is comprised of the depreciation related to our golf course operations), impairment charges on non-real estate assets, amortization of capitalized leasing costs and debt extinguishment gains and losses. Because not all companies calculate FFO, AFFO and Adjusted EBITDA in the same way as the Company and other companies may not perform such calculations, those measures as used by other companies may not be consistent with the way the Company calculates such measures and should not be considered as alternative measures of operating income or net income. The presentation of these measures does not replace the presentation of the Company’s financial results in accordance with GAAP.
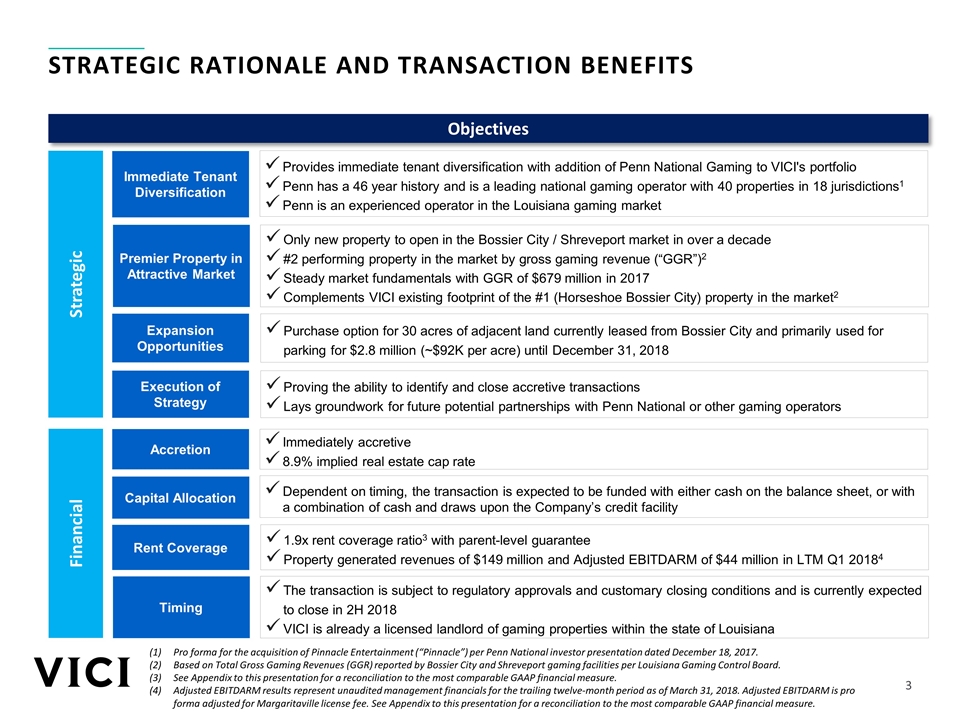
Premier Property in Attractive Market Only new property to open in the Bossier City / Shreveport market in over a decade #2 performing property in the market by gross gaming revenue (“GGR”)2 Steady market fundamentals with GGR of $679 million in 2017 Complements VICI existing footprint of the #1 (Horseshoe Bossier City) property in the market2 Strategic Rationale and transaction benefits Strategic Financial Capital Allocation Proving the ability to identify and close accretive transactions Lays groundwork for future potential partnerships with Penn National or other gaming operators Accretion Execution of Strategy Dependent on timing, the transaction is expected to be funded with either cash on the balance sheet, or with a combination of cash and draws upon the Company’s credit facility Expansion Opportunities Immediate Tenant Diversification Immediately accretive 8.9% implied real estate cap rate Purchase option for 30 acres of adjacent land currently leased from Bossier City and primarily used for parking for $2.8 million (~$92K per acre) until December 31, 2018 Provides immediate tenant diversification with addition of Penn National Gaming to VICI's portfolio Penn has a 46 year history and is a leading national gaming operator with 40 properties in 18 jurisdictions1 Penn is an experienced operator in the Louisiana gaming market Objectives Rent Coverage Pro forma for the acquisition of Pinnacle Entertainment (“Pinnacle”) per Penn National investor presentation dated December 18, 2017. Based on Total Gross Gaming Revenues (GGR) reported by Bossier City and Shreveport gaming facilities per Louisiana Gaming Control Board. See Appendix to this presentation for a reconciliation to the most comparable GAAP financial measure. Adjusted EBITDARM results represent unaudited management financials for the trailing twelve-month period as of March 31, 2018. Adjusted EBITDARM is pro forma adjusted for Margaritaville license fee. See Appendix to this presentation for a reconciliation to the most comparable GAAP financial measure. Timing The transaction is subject to regulatory approvals and customary closing conditions and is currently expected to close in 2H 2018 VICI is already a licensed landlord of gaming properties within the state of Louisiana 1.9x rent coverage ratio3 with parent-level guarantee Property generated revenues of $149 million and Adjusted EBITDARM of $44 million in LTM Q1 20184
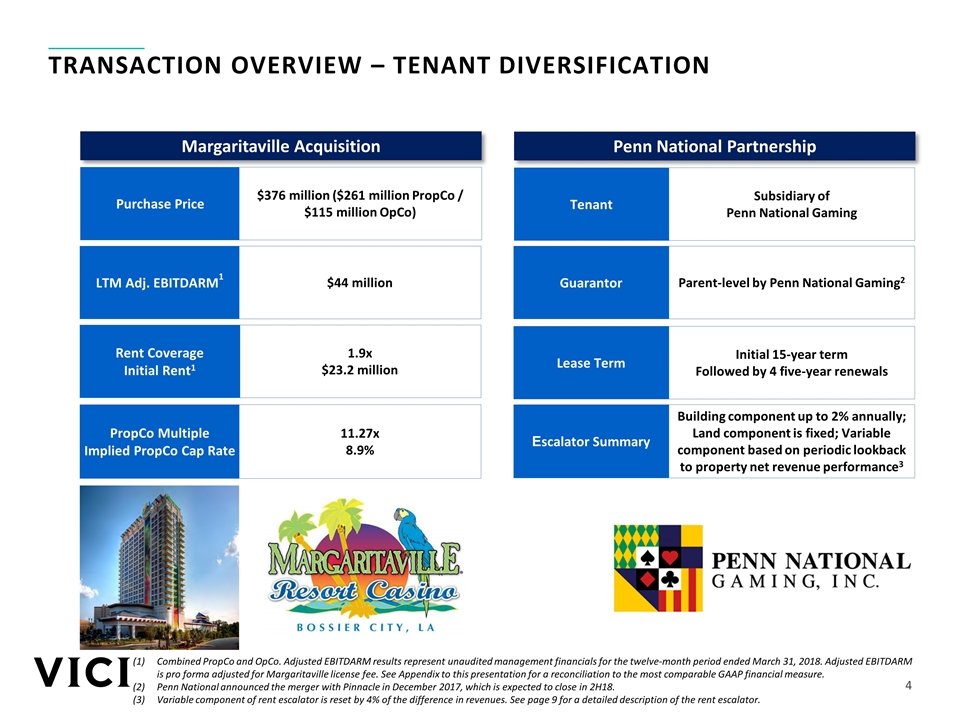
Transaction overview – Tenant Diversification PropCo Multiple Implied PropCo Cap Rate 11.27x 8.9% LTM Adj. EBITDARM1 $44 million 1.9x $23.2 million Tenant Subsidiary of Penn National Gaming Escalator Summary Building component up to 2% annually; Land component is fixed; Variable component based on periodic lookback to property net revenue performance3 Lease Term Initial 15-year term Followed by 4 five-year renewals Purchase Price $376 million ($261 million PropCo / $115 million OpCo) Guarantor Margaritaville Acquisition Penn National Partnership Combined PropCo and OpCo. Adjusted EBITDARM results represent unaudited management financials for the twelve-month period ended March 31, 2018. Adjusted EBITDARM is pro forma adjusted for Margaritaville license fee. See Appendix to this presentation for a reconciliation to the most comparable GAAP financial measure. Penn National announced the merger with Pinnacle in December 2017, which is expected to close in 2H18. Variable component of rent escalator is reset by 4% of the difference in revenues. See page 9 for a detailed description of the rent escalator. Rent Coverage Initial Rent1 Parent-level by Penn National Gaming2
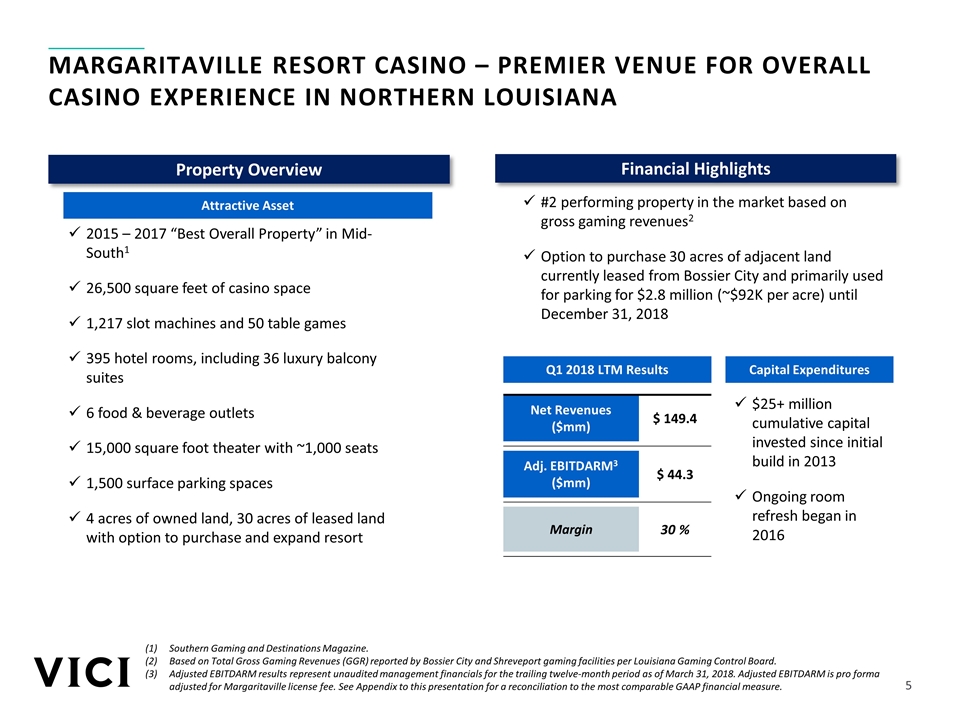
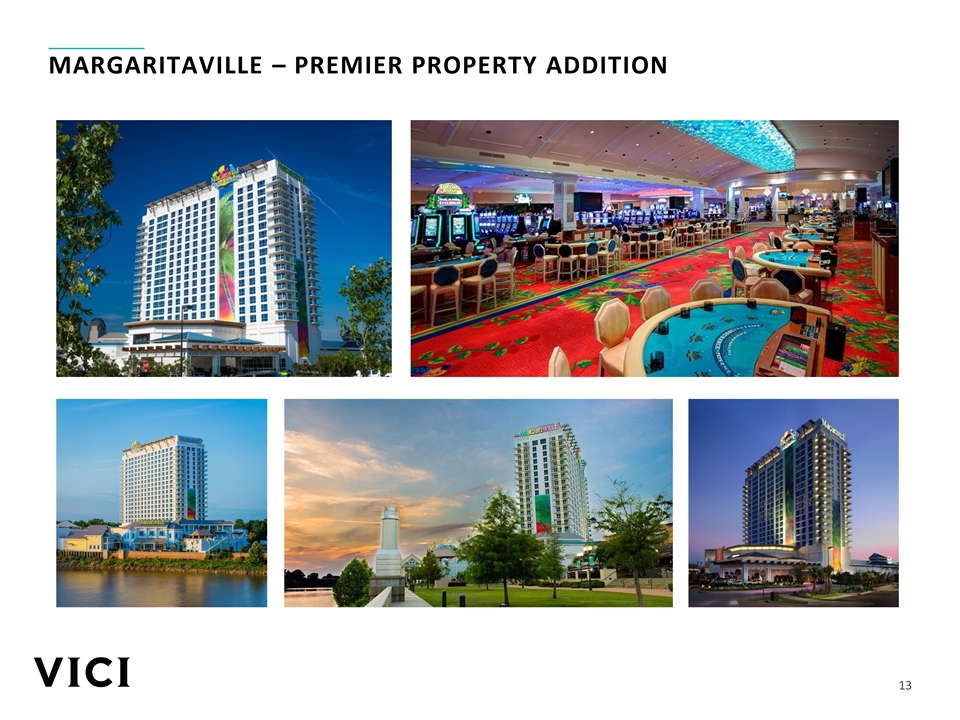
#2 performing property in the market based on gross gaming revenues2 Option to purchase 30 acres of adjacent land currently leased from Bossier City and primarily used for parking for $2.8 million (~$92K per acre) until December 31, 2018 MARGARITAVILLE Resort Casino – PREMIER VENUE FOR OVERALL CASINO EXPERIENCE IN NORTHERN LOUISIANA Financial Highlights Property Overview 2015 – 2017 “Best Overall Property” in Mid-South1 26,500 square feet of casino space 1,217 slot machines and 50 table games 395 hotel rooms, including 36 luxury balcony suites 6 food & beverage outlets 15,000 square foot theater with ~1,000 seats 1,500 surface parking spaces 4 acres of owned land, 30 acres of leased land with option to purchase and expand resort Attractive Asset Capital Expenditures $25+ million cumulative capital invested since initial build in 2013 Ongoing room refresh began in 2016 Southern Gaming and Destinations Magazine. Based on Total Gross Gaming Revenues (GGR) reported by Bossier City and Shreveport gaming facilities per Louisiana Gaming Control Board. Adjusted EBITDARM results represent unaudited management financials for the trailing twelve-month period as of March 31, 2018. Adjusted EBITDARM is pro forma adjusted for Margaritaville license fee. See Appendix to this presentation for a reconciliation to the most comparable GAAP financial measure. Q1 2018 LTM Results Net Revenues ($mm) $ 149.4 Adj. EBITDARM3 ($mm) $ 44.3 Margin 30 %
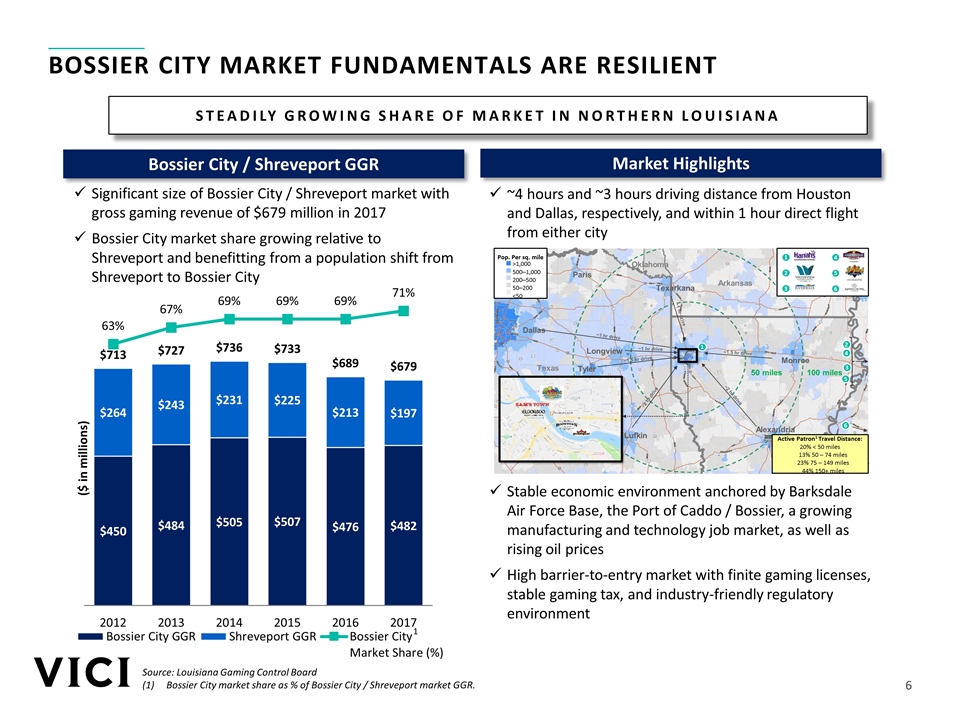
BOSSIER CITY MARKET FUNDAMENTALS are resilient STEADILY GROWING SHARE OF MARKET IN NORTHERN LOUISIANA Market Highlights Bossier City / Shreveport GGR ~4 hours and ~3 hours driving distance from Houston and Dallas, respectively, and within 1 hour direct flight from either city Stable economic environment anchored by Barksdale Air Force Base, the Port of Caddo / Bossier, a growing manufacturing and technology job market, as well as rising oil prices High barrier-to-entry market with finite gaming licenses, stable gaming tax, and industry-friendly regulatory environment Source: Louisiana Gaming Control Board Bossier City market share as % of Bossier City / Shreveport market GGR. 1 100 miles 50 miles TEXAS Arkansas Dallas Longview Lufkin Alexandria Paris Monroe Oklahoma Tyler Texas Texarkana Pop. Per sq. mile >1,000 500–1,000 200–500 50–200 <50 1 2 1 4 2 5 3 6 4 3 5 6 Active Patron1 Travel Distance: 20% < 50 miles 13% 50 – 74 miles 23% 75 – 149 miles 44% 150+ miles Significant size of Bossier City / Shreveport market with gross gaming revenue of $679 million in 2017 Bossier City market share growing relative to Shreveport and benefitting from a population shift from Shreveport to Bossier City
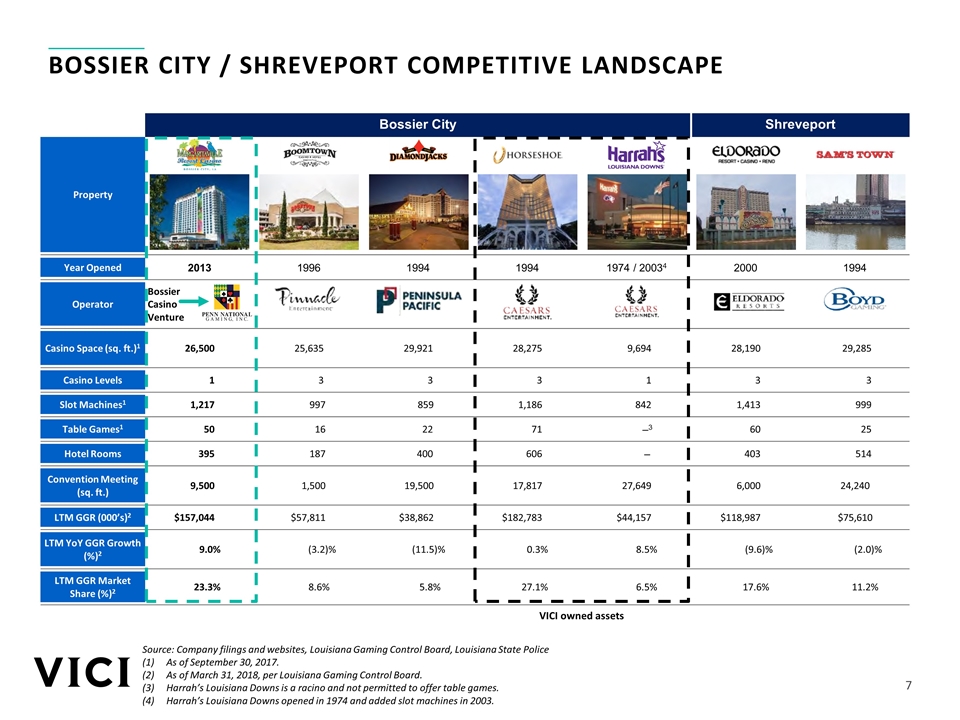
BOSSIER CITY / Shreveport competitive landscape Source: Company filings and websites, Louisiana Gaming Control Board, Louisiana State Police As of September 30, 2017. As of March 31, 2018, per Louisiana Gaming Control Board. Harrah’s Louisiana Downs is a racino and not permitted to offer table games. Harrah’s Louisiana Downs opened in 1974 and added slot machines in 2003. Bossier City Shreveport Property Year Opened 2013 1996 1994 1994 1974 / 20034 2000 1994 Operator Bossier Casino Venture Casino Space (sq. ft.)1 26,500 25,635 29,921 28,275 9,694 28,190 29,285 Casino Levels 1 3 3 3 1 3 3 Slot Machines1 1,217 997 859 1,186 842 1,413 999 Table Games1 50 16 22 71 –3 60 25 Hotel Rooms 395 187 400 606 – 403 514 Convention Meeting (sq. ft.) 9,500 1,500 19,500 17,817 27,649 6,000 24,240 LTM GGR (000’s)2 $157,044 $57,811 $38,862 $182,783 $44,157 $118,987 $75,610 LTM YoY GGR Growth (%)2 9.0% (3.2)% (11.5)% 0.3% 8.5% (9.6)% (2.0)% LTM GGR Market Share (%)2 23.3% 8.6% 5.8% 27.1% 6.5% 17.6% 11.2% VICI owned assets
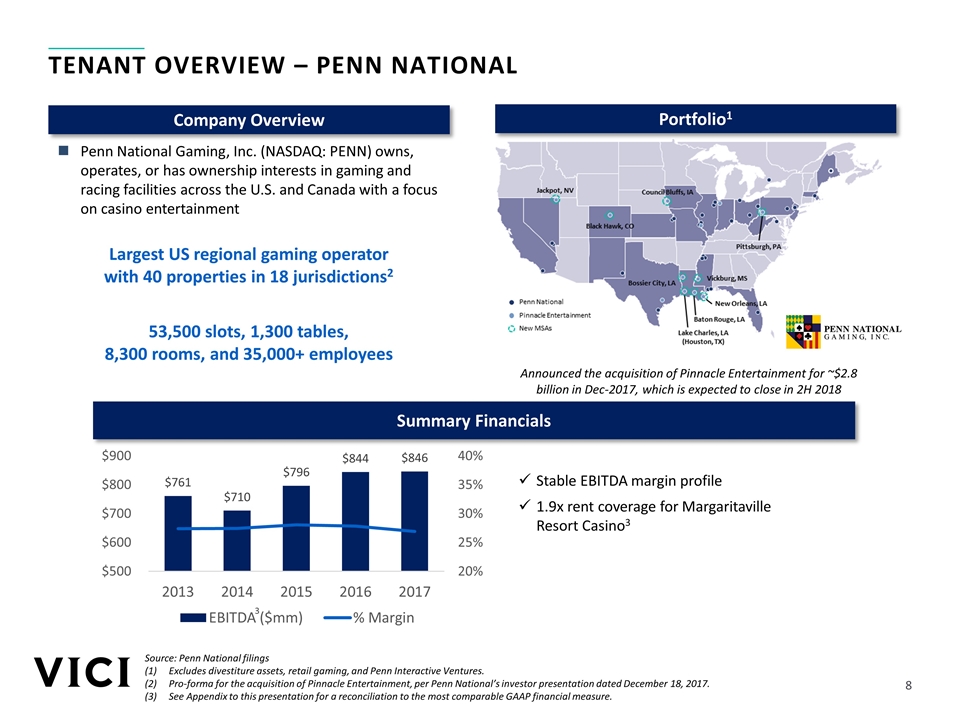
Penn National Gaming, Inc. (NASDAQ: PENN) owns, operates, or has ownership interests in gaming and racing facilities across the U.S. and Canada with a focus on casino entertainment Largest US regional gaming operator with 40 properties in 18 jurisdictions2 53,500 slots, 1,300 tables, 8,300 rooms, and 35,000+ employees Tenant overview – penn national Portfolio1 Company Overview Summary Financials Source: Penn National filings Excludes divestiture assets, retail gaming, and Penn Interactive Ventures. Pro-forma for the acquisition of Pinnacle Entertainment, per Penn National’s investor presentation dated December 18, 2017. See Appendix to this presentation for a reconciliation to the most comparable GAAP financial measure. Stable EBITDA margin profile 1.9x rent coverage for Margaritaville Resort Casino3 Announced the acquisition of Pinnacle Entertainment for ~$2.8 billion in Dec-2017, which is expected to close in 2H 2018 3
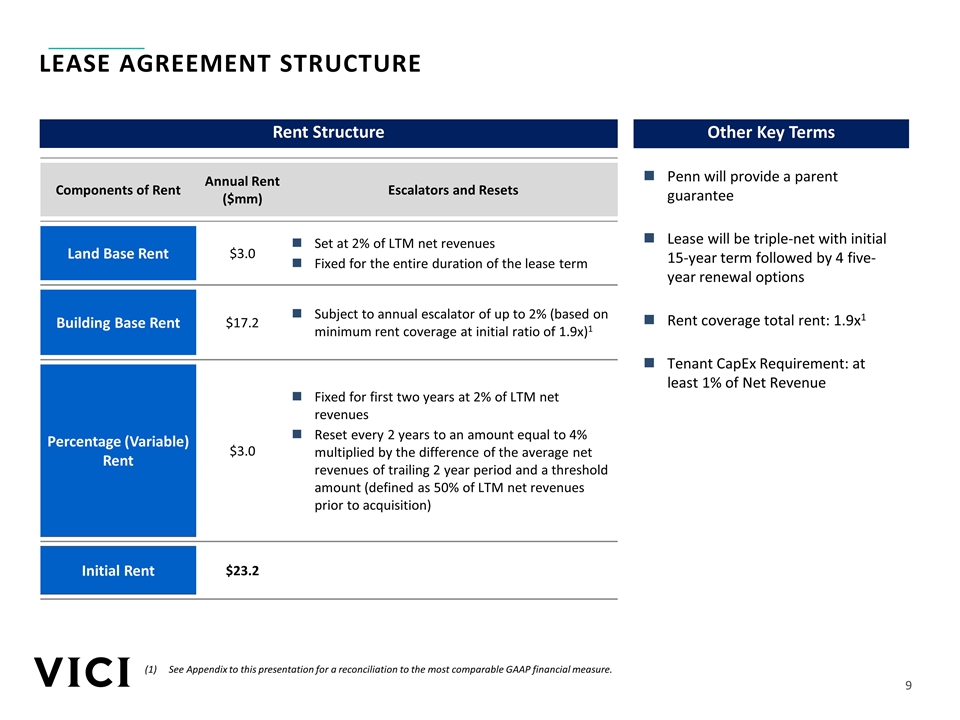
Lease agreement structure Corporate Rent Coverage Ratio expected to be [13.X]x2 Components of Rent Annual Rent ($mm) Escalators and Resets Land Base Rent $3.0 Set at 2% of LTM net revenues Fixed for the entire duration of the lease term Building Base Rent $17.2 Subject to annual escalator of up to 2% (based on minimum rent coverage at initial ratio of 1.9x)1 Percentage (Variable) Rent $3.0 Fixed for first two years at 2% of LTM net revenues Reset every 2 years to an amount equal to 4% multiplied by the difference of the average net revenues of trailing 2 year period and a threshold amount (defined as 50% of LTM net revenues prior to acquisition) Initial Rent $23.2 Penn will provide a parent guarantee Lease will be triple-net with initial 15-year term followed by 4 five-year renewal options Rent coverage total rent: 1.9x1 Tenant CapEx Requirement: at least 1% of Net Revenue Other Key Terms Rent Structure See Appendix to this presentation for a reconciliation to the most comparable GAAP financial measure.
Appendix
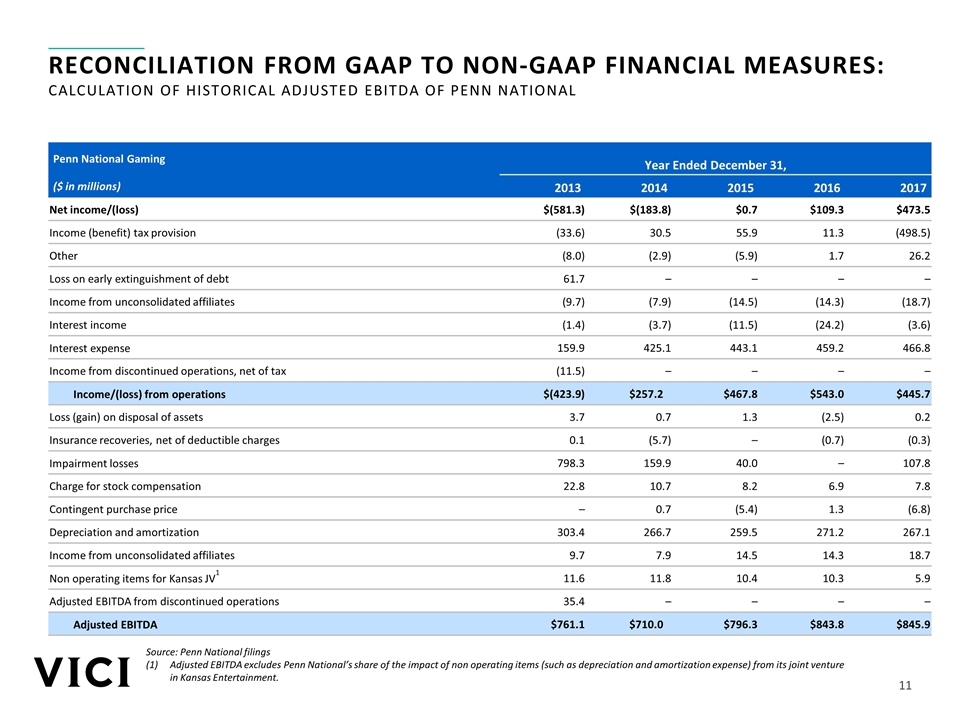
Corporate Rent Coverage Ratio expected to be [13.X]x2 Reconciliation from GAAP to non-gaap FINANCIAL measures: CALCULATION of HISTORICAL Adjusted EBITDA of Penn National Penn National Gaming Year Ended December 31, ($ in millions) 2013 2014 2015 2016 2017 Net income/(loss) $(581.3) $(183.8) $0.7 $109.3 $473.5 Income (benefit) tax provision (33.6) 30.5 55.9 11.3 (498.5) Other (8.0) (2.9) (5.9) 1.7 26.2 Loss on early extinguishment of debt 61.7 – – – – Income from unconsolidated affiliates (9.7) (7.9) (14.5) (14.3) (18.7) Interest income (1.4) (3.7) (11.5) (24.2) (3.6) Interest expense 159.9 425.1 443.1 459.2 466.8 Income from discontinued operations, net of tax (11.5) – – – – Income/(loss) from operations $(423.9) $257.2 $467.8 $543.0 $445.7 Loss (gain) on disposal of assets 3.7 0.7 1.3 (2.5) 0.2 Insurance recoveries, net of deductible charges 0.1 (5.7) – (0.7) (0.3) Impairment losses 798.3 159.9 40.0 – 107.8 Charge for stock compensation 22.8 10.7 8.2 6.9 7.8 Contingent purchase price – 0.7 (5.4) 1.3 (6.8) Depreciation and amortization 303.4 266.7 259.5 271.2 267.1 Income from unconsolidated affiliates 9.7 7.9 14.5 14.3 18.7 Non operating items for Kansas JV1 11.6 11.8 10.4 10.3 5.9 Adjusted EBITDA from discontinued operations 35.4 – – – – Adjusted EBITDA $761.1 $710.0 $796.3 $843.8 $845.9 Source: Penn National filings Adjusted EBITDA excludes Penn National’s share of the impact of non operating items (such as depreciation and amortization expense) from its joint venture in Kansas Entertainment.
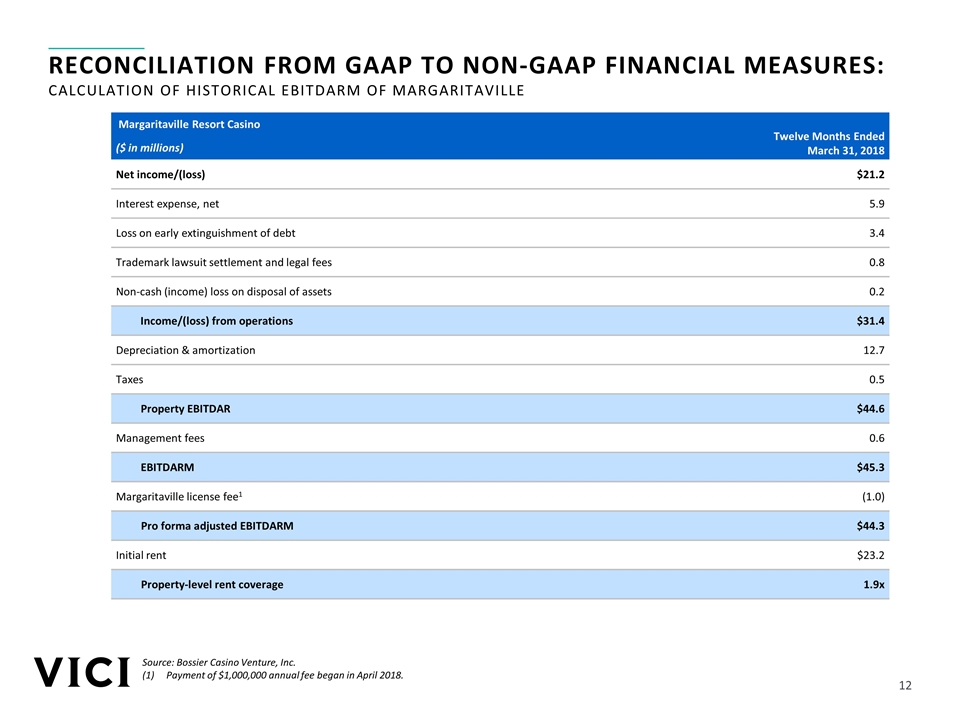
Source: Bossier Casino Venture, Inc. Payment of $1,000,000 annual fee began in April 2018. Corporate Rent Coverage Ratio expected to be [13.X]x2 Margaritaville Resort Casino Twelve Months Ended March 31, 2018 ($ in millions) Net income/(loss) $21.2 Interest expense, net 5.9 Loss on early extinguishment of debt 3.4 Trademark lawsuit settlement and legal fees 0.8 Non-cash (income) loss on disposal of assets 0.2 Income/(loss) from operations $31.4 Depreciation & amortization 12.7 Taxes 0.5 Property EBITDAR $44.6 Management fees 0.6 EBITDARM $45.3 Margaritaville license fee1 (1.0) Pro forma adjusted EBITDARM $44.3 Initial rent $23.2 Property-level rent coverage 1.9x Reconciliation from GAAP to non-gaap FINANCIAL measures: CALCULATION of HISTORICAL EBITDARM of Margaritaville
Corporate Rent Coverage Ratio expected to be [13.X]x2 Margaritaville – Premier Property Addition
