Attached files
| file | filename |
|---|---|
| 8-K - 8-K - RAYMOND JAMES FINANCIAL INC | a8-k_2q18shareholdersletter.htm |

CLIENT FIRST. INTEGRITY. INDEPENDENCE. CONSERVATISM. 2018 SECOND QUARTER
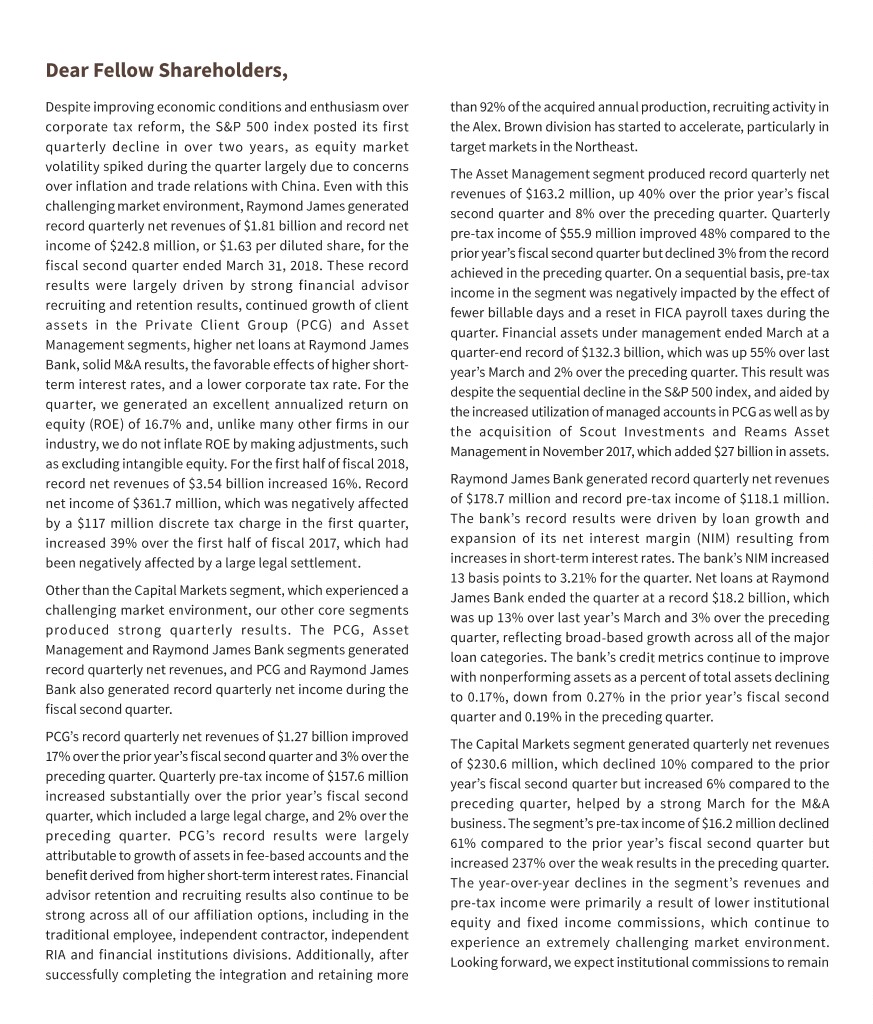
Dear Fellow Shareholders, Despite improving economic conditions and enthusiasm over than 92% of the acquired annual production, recruiting activity in corporate tax reform, the S&P 500 index posted its first the Alex. Brown division has started to accelerate, particularly in quarterly decline in over two years, as equity market target markets in the Northeast. volatility spiked during the quarter largely due to concerns The Asset Management segment produced record quarterly net over inflation and trade relations with China. Even with this revenues of $163.2 million, up 40% over the prior year’s fiscal challenging market environment, Raymond James generated second quarter and 8% over the preceding quarter. Quarterly record quarterly net revenues of $1.81 billion and record net pre-tax income of $55.9 million improved 48% compared to the income of $242.8 million, or $1.63 per diluted share, for the prior year’s fiscal second quarter but declined 3% from the record fiscal second quarter ended March 31, 2018. These record achieved in the preceding quarter. On a sequential basis, pre-tax results were largely driven by strong financial advisor income in the segment was negatively impacted by the effect of recruiting and retention results, continued growth of client fewer billable days and a reset in FICA payroll taxes during the assets in the Private Client Group (PCG) and Asset quarter. Financial assets under management ended March at a Management segments, higher net loans at Raymond James quarter-end record of $132.3 billion, which was up 55% over last Bank, solid M&A results, the favorable effects of higher short- year’s March and 2% over the preceding quarter. This result was term interest rates, and a lower corporate tax rate. For the despite the sequential decline in the S&P 500 index, and aided by quarter, we generated an excellent annualized return on the increased utilization of managed accounts in PCG as well as by equity (ROE) of 16.7% and, unlike many other firms in our the acquisition of Scout Investments and Reams Asset industry, we do not inflate ROE by making adjustments, such Management in November 2017, which added $27 billion in assets. as excluding intangible equity. For the first half of fiscal 2018, record net revenues of $3.54 billion increased 16%. Record Raymond James Bank generated record quarterly net revenues net income of $361.7 million, which was negatively affected of $178.7 million and record pre-tax income of $118.1 million. by a $117 million discrete tax charge in the first quarter, The bank’s record results were driven by loan growth and increased 39% over the first half of fiscal 2017, which had expansion of its net interest margin (NIM) resulting from been negatively affected by a large legal settlement. increases in short-term interest rates. The bank’s NIM increased 13 basis points to 3.21% for the quarter. Net loans at Raymond Other than the Capital Markets segment, which experienced a James Bank ended the quarter at a record $18.2 billion, which challenging market environment, our other core segments was up 13% over last year’s March and 3% over the preceding produced strong quarterly results. The PCG, Asset quarter, reflecting broad-based growth across all of the major Management and Raymond James Bank segments generated loan categories. The bank’s credit metrics continue to improve record quarterly net revenues, and PCG and Raymond James with nonperforming assets as a percent of total assets declining Bank also generated record quarterly net income during the to 0.17%, down from 0.27% in the prior year’s fiscal second fiscal second quarter. quarter and 0.19% in the preceding quarter. PCG’s record quarterly net revenues of $1.27 billion improved The Capital Markets segment generated quarterly net revenues 17% over the prior year’s fiscal second quarter and 3% over the of $230.6 million, which declined 10% compared to the prior preceding quarter. Quarterly pre-tax income of $157.6 million year’s fiscal second quarter but increased 6% compared to the increased substantially over the prior year’s fiscal second preceding quarter, helped by a strong March for the M&A quarter, which included a large legal charge, and 2% over the business. The segment’s pre-tax income of $16.2 million declined preceding quarter. PCG’s record results were largely 61% compared to the prior year’s fiscal second quarter but attributable to growth of assets in fee-based accounts and the increased 237% over the weak results in the preceding quarter. benefit derived from higher short-term interest rates. Financial The year-over-year declines in the segment’s revenues and advisor retention and recruiting results also continue to be pre-tax income were primarily a result of lower institutional strong across all of our affiliation options, including in the equity and fixed income commissions, which continue to traditional employee, independent contractor, independent experience an extremely challenging market environment. RIA and financial institutions divisions. Additionally, after Looking forward, we expect institutional commissions to remain successfully completing the integration and retaining more
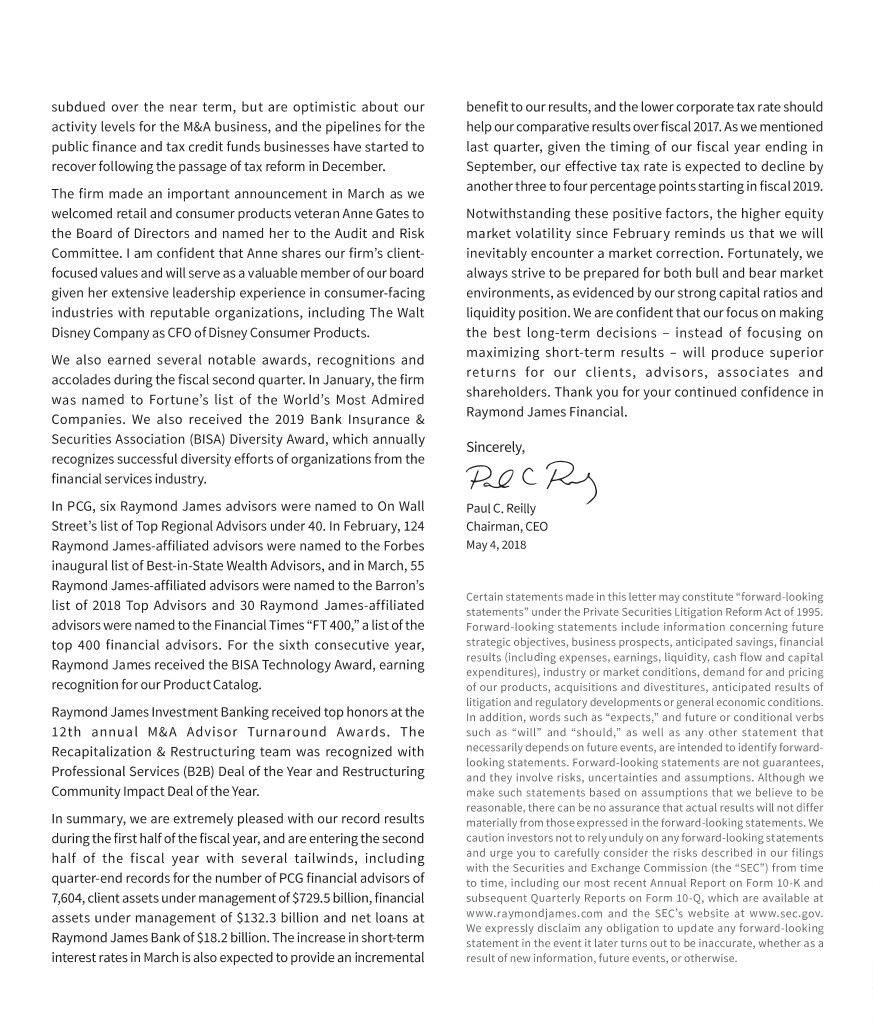
subdued over the near term, but are optimistic about our benefit to our results, and the lower corporate tax rate should activity levels for the M&A business, and the pipelines for the help our comparative results over fiscal 2017. As we mentioned public finance and tax credit funds businesses have started to last quarter, given the timing of our fiscal year ending in recover following the passage of tax reform in December. September, our effective tax rate is expected to decline by another three to four percentage points starting in fiscal 2019. The firm made an important announcement in March as we welcomed retail and consumer products veteran Anne Gates to Notwithstanding these positive factors, the higher equity the Board of Directors and named her to the Audit and Risk market volatility since February reminds us that we will Committee. I am confident that Anne shares our firm’s client- inevitably encounter a market correction. Fortunately, we focused values and will serve as a valuable member of our board always strive to be prepared for both bull and bear market given her extensive leadership experience in consumer-facing environments, as evidenced by our strong capital ratios and industries with reputable organizations, including The Walt liquidity position. We are confident that our focus on making Disney Company as CFO of Disney Consumer Products. the best long-term decisions – instead of focusing on maximizing short-term results – will produce superior We also earned several notable awards, recognitions and returns for our clients, advisors, associates and accolades during the fiscal second quarter. In January, the firm shareholders. Thank you for your continued confidence in was named to Fortune’s list of the World’s Most Admired Raymond James Financial. Companies. We also received the 2019 Bank Insurance & Securities Association (BISA) Diversity Award, which annually Sincerely, recognizes successful diversity efforts of organizations from the financial services industry. In PCG, six Raymond James advisors were named to On Wall Paul C. Reilly Street’s list of Top Regional Advisors under 40. In February, 124 Chairman, CEO Raymond James-affiliated advisors were named to the Forbes May 4, 2018 inaugural list of Best-in-State Wealth Advisors, and in March, 55 Raymond James-affiliated advisors were named to the Barron’s Certain statements made in this letter may constitute “forward-looking list of 2018 Top Advisors and 30 Raymond James-affiliated statements” under the Private Securities Litigation Reform Act of 1995. advisors were named to the Financial Times “FT 400,” a list of the Forward-looking statements include information concerning future top 400 financial advisors. For the sixth consecutive year, strategic objectives, business prospects, anticipated savings, financial results (including expenses, earnings, liquidity, cash flow and capital Raymond James received the BISA Technology Award, earning expenditures), industry or market conditions, demand for and pricing recognition for our Product Catalog. of our products, acquisitions and divestitures, anticipated results of litigation and regulatory developments or general economic conditions. Raymond James Investment Banking received top honors at the In addition, words such as “expects,” and future or conditional verbs 12th annual M&A Advisor Turnaround Awards. The such as “will” and “should,” as well as any other statement that Recapitalization & Restructuring team was recognized with necessarily depends on future events, are intended to identify forward- looking statements. Forward-looking statements are not guarantees, Professional Services (B2B) Deal of the Year and Restructuring and they involve risks, uncertainties and assumptions. Although we Community Impact Deal of the Year. make such statements based on assumptions that we believe to be reasonable, there can be no assurance that actual results will not differ In summary, we are extremely pleased with our record results materially from those expressed in the forward-looking statements. We during the first half of the fiscal year, and are entering the second caution investors not to rely unduly on any forward-looking statements half of the fiscal year with several tailwinds, including and urge you to carefully consider the risks described in our filings with the Securities and Exchange Commission (the “SEC”) from time quarter-end records for the number of PCG financial advisors of to time, including our most recent Annual Report on Form 10-K and 7,604, client assets under management of $729.5 billion, financial subsequent Quarterly Reports on Form 10-Q, which are available at assets under management of $132.3 billion and net loans at www.raymondjames.com and the SEC’s website at www.sec.gov. We expressly disclaim any obligation to update any forward-looking Raymond James Bank of $18.2 billion. The increase in short-term statement in the event it later turns out to be inaccurate, whether as a interest rates in March is also expected to provide an incremental result of new information, future events, or otherwise.
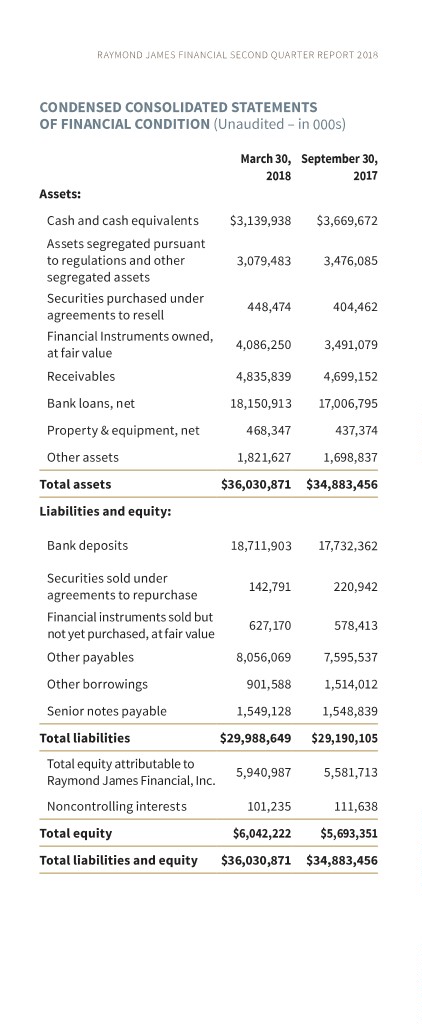
RAYMOND JAMES FINANCIAL SECOND QUARTER REPORT 2018 CONDENSED CONSOLIDATED STATEMENTS OF FINANCIAL CONDITION (Unaudited – in 000s) March 30, September 30, 2018 2017 Assets: Cash and cash equivalents $3,139,938 $3,669,672 Assets segregated pursuant to regulations and other 3,079,483 3,476,085 segregated assets Securities purchased under 448,474 404,462 agreements to resell Financial Instruments owned, 4,086,250 3,491,079 at fair value Receivables 4,835,839 4,699,152 Bank loans, net 18,150,913 17,006,795 Property & equipment, net 468,347 437,374 Other assets 1,821,627 1,698,837 Total assets $36,030,871 $34,883,456 Liabilities and equity: Bank deposits 18,711,903 17,732,362 Securities sold under 142,791 220,942 agreements to repurchase Financial instruments sold but 627,170 578,413 not yet purchased, at fair value Other payables 8,056,069 7,595,537 Other borrowings 901,588 1,514,012 Senior notes payable 1,549,128 1,548,839 Total liabilities $29,988,649 $29,190,105 Total equity attributable to 5,940,987 5,581,713 Raymond James Financial, Inc. Noncontrolling interests 101,235 111,638 Total equity $6,042,222 $5,693,351 Total liabilities and equity $36,030,871 $34,883,456
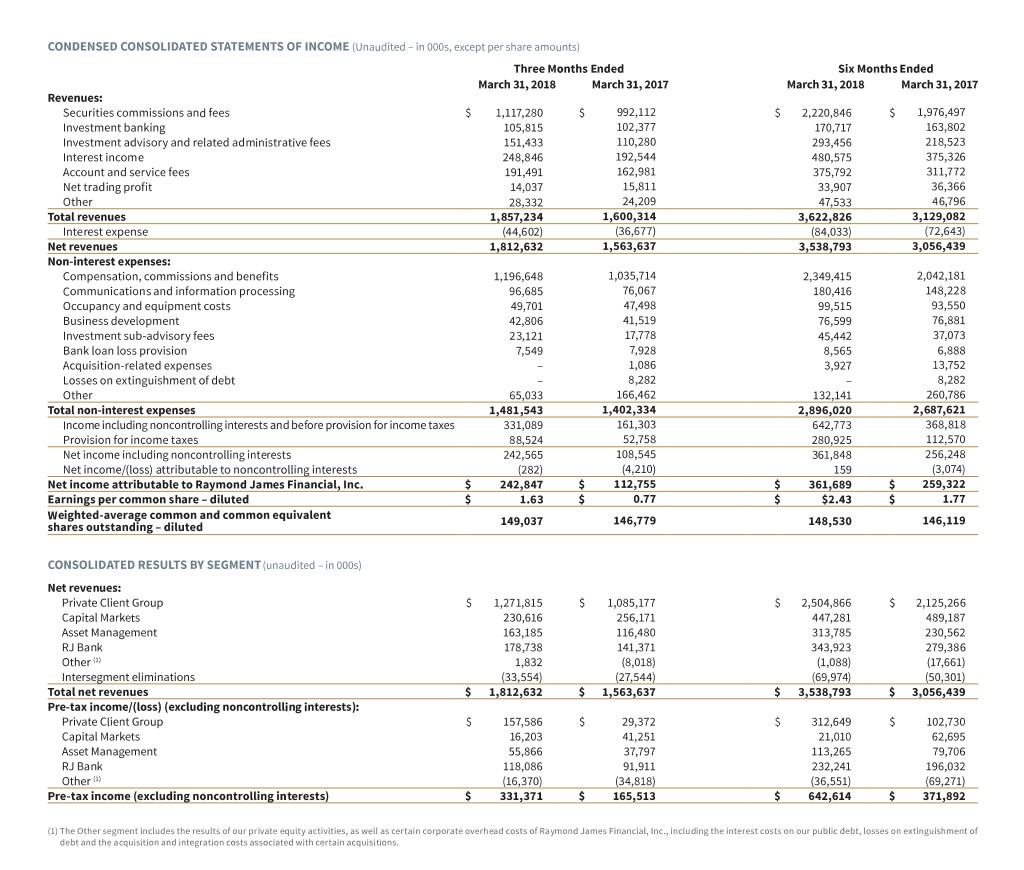
CONDENSED CONSOLIDATED STATEMENTS OF INCOME (Unaudited – in 000s, except per share amounts) Three Months Ended Six Months Ended March 31, 2018 March 31, 2017 March 31, 2018 March 31, 2017 Revenues: Securities commissions and fees $ 1,117,280 $ 992,112 $ 2,220,846 $ 1,976,497 Investment banking 105,815 102,377 170,717 163,802 Investment advisory and related administrative fees 151,433 110,280 293,456 218,523 Interest income 248,846 192,544 480,575 375,326 Account and service fees 191,491 162,981 375,792 311,772 Net trading profit 14,037 15,811 33,907 36,366 Other 28,332 24,209 47,533 46,796 Total revenues 1,857,234 1,600,314 3,622,826 3,129,082 Interest expense (44,602) (36,677) (84,033) (72,643) Net revenues 1,812,632 1,563,637 3,538,793 3,056,439 Non-interest expenses: Compensation, commissions and benefits 1,196,648 1,035,714 2,349,415 2,042,181 Communications and information processing 96,685 76,067 180,416 148,228 Occupancy and equipment costs 49,701 47,498 99,515 93,550 Business development 42,806 41,519 76,599 76,881 Investment sub-advisory fees 23,121 17,778 45,442 37,073 Bank loan loss provision 7,549 7,928 8,565 6,888 Acquisition-related expenses – 1,086 3,927 13,752 Losses on extinguishment of debt – 8,282 – 8,282 Other 65,033 166,462 132,141 260,786 Total non-interest expenses 1,481,543 1,402,334 2,896,020 2,687,621 Income including noncontrolling interests and before provision for income taxes 331,089 161,303 642,773 368,818 Provision for income taxes 88,524 52,758 280,925 112,570 Net income including noncontrolling interests 242,565 108,545 361,848 256,248 Net income/(loss) attributable to noncontrolling interests (282) (4,210) 159 (3,074) Net income attributable to Raymond James Financial, Inc. $ 242,847 $ 112,755 $ 361,689 $ 259,322 Earnings per common share – diluted $ 1.63 $ 0.77 $ $2.43 $ 1.77 Weighted-average common and common equivalent 146,779 146,119 shares outstanding – diluted 149,037 148,530 CONSOLIDATED RESULTS BY SEGMENT (unaudited – in 000s) Net revenues: Private Client Group $ 1,271,815 $ 1,085,177 $ 2,504,866 $ 2,125,266 Capital Markets 230,616 256,171 447,281 489,187 Asset Management 163,185 116,480 313,785 230,562 RJ Bank 178,738 141,371 343,923 279,386 Other (1) 1,832 (8,018) (1,088) (17,661) Intersegment eliminations (33,554) (27,544) (69,974) (50,301) Total net revenues $ 1,812,632 $ 1,563,637 $ 3,538,793 $ 3,056,439 Pre-tax income/(loss) (excluding noncontrolling interests): Private Client Group $ 157,586 $ 29,372 $ 312,649 $ 102,730 Capital Markets 16,203 41,251 21,010 62,695 Asset Management 55,866 37,797 113,265 79,706 RJ Bank 118,086 91,911 232,241 196,032 Other (1) (16,370) (34,818) (36,551) (69,271) Pre-tax income (excluding noncontrolling interests) $ 331,371 $ 165,513 $ 642,614 $ 371,892 (1) The Other segment includes the results of our private equity activities, as well as certain corporate overhead costs of Raymond James Financial, Inc., including the interest costs on our public debt, losses on extinguishment of debt and the acquisition and integration costs associated with certain acquisitions.
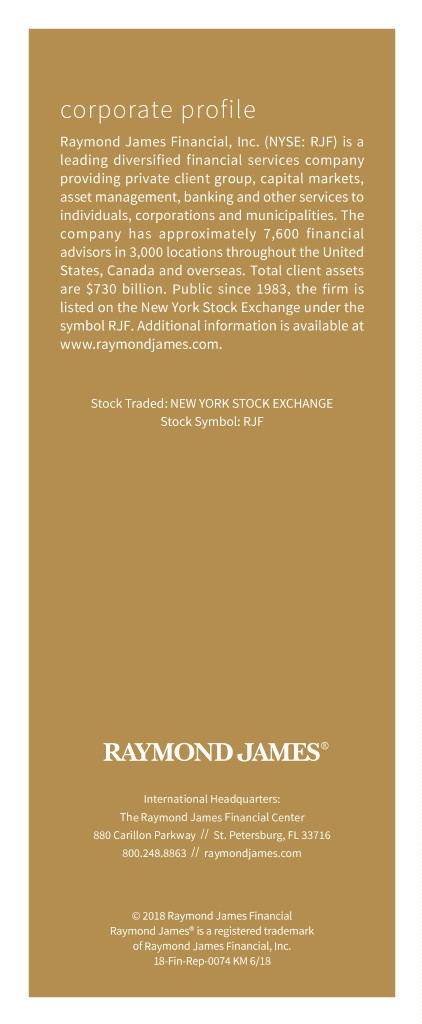
corporate profile Raymond James Financial, Inc. (NYSE: RJF) is a leading diversified financial services company providing private client group, capital markets, asset management, banking and other services to individuals, corporations and municipalities. The company has approximately 7,600 financial advisors in 3,000 locations throughout the United States, Canada and overseas. Total client assets are $730 billion. Public since 1983, the firm is listed on the New York Stock Exchange under the symbol RJF. Additional information is available at www.raymondjames.com. Stock Traded: NEW YORK STOCK EXCHANGE Stock Symbol: RJF International Headquarters: The Raymond James Financial Center 880 Carillon Parkway // St. Petersburg, FL 33716 800.248.8863 // raymondjames.com © 2018 Raymond James Financial Raymond James® is a registered trademark of Raymond James Financial, Inc. 18-Fin-Rep-0074 KM 6/18
