Attached files
| file | filename |
|---|---|
| 8-K - 8-K - Freshpet, Inc. | frpt-8k_20180606.htm |

Investor Presentation: June 2018 Exhibit 99.1
Forward Looking Statements This presentation contains “forward-looking” statements that involve risks, uncertainties and assumptions. If the risks or uncertainties ever materialize or the assumptions prove incorrect, the Company’s results may differ materially from those expressed or implied by such forward-looking statements. All statements other than statements of historical fact could be deemed forward-looking, including, but not limited to, the Company’s intentions, beliefs or current expectations concerning, among other things, the Company’s results of operations, financial condition, liquidity, prospects, growth, strategies and the industry in which we operate and any statements of assumptions underlying any of the foregoing. These statements are based on estimates and information available to us at the time of this presentation and are not guarantees of future performance. These forward-looking statements are based on certain assumptions and are subject to risks and uncertainties, including those described in the “Risk Factors” section and elsewhere in the preliminary prospectus for this offering. You should read the prospectus, including the Risk Factors set forth therein and the documents that the Company has filed as exhibits to the registration statement, of which the prospectus is a part, completely and with the understanding that if any such risks or uncertainties materialize or if any of the relevant assumptions prove incorrect, the Company’s actual results could differ materially from the results expressed or implied by these forward-looking statements. Except as required by law we assume no obligation to update these forward-looking statements publicly, or to update the reasons why actual results could differ materially from those anticipated in the forward-looking statements, even if new information becomes available in the future. Non-GAAP Disclosure This presentation contains certain non-GAAP financial measures such as EBITDA and adjusted EBITDA among others. While the company believes these non-GAAP financial measures provide useful information for investors, the presentation of this information is not intended to be considered in isolation or as a substitute for the financial information presented in accordance with GAAP. Please refer to the Company’s earnings press releases for a reconciliation of non-GAAP financial measures to the most comparable measures prepared in accordance with GAAP. Safe Harbor

This page intentionally left blank.
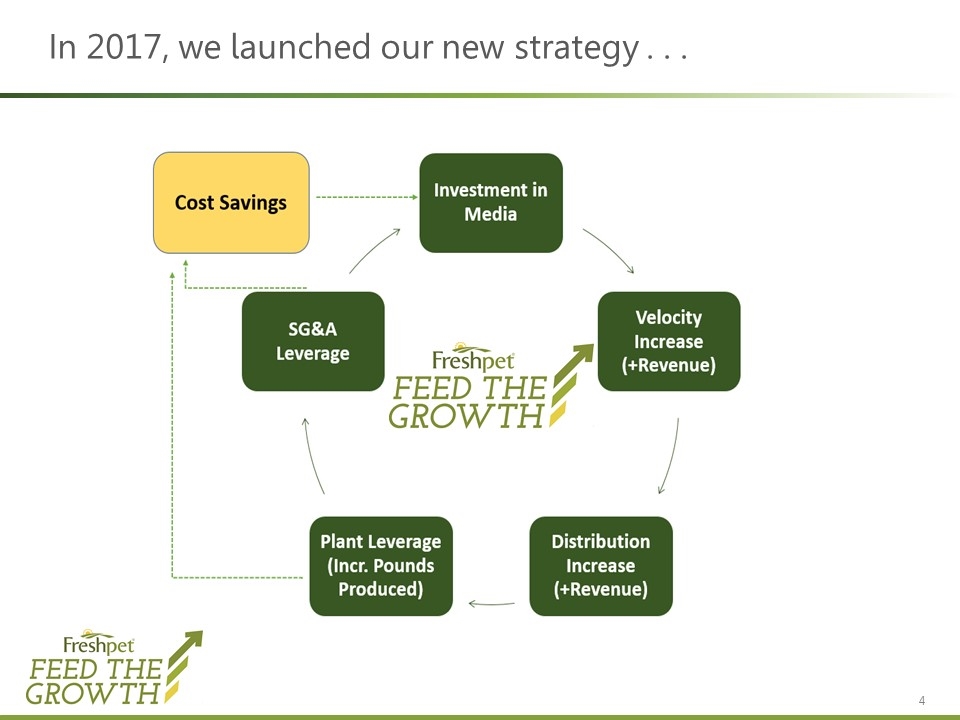
In 2017, we launched our new strategy . . .
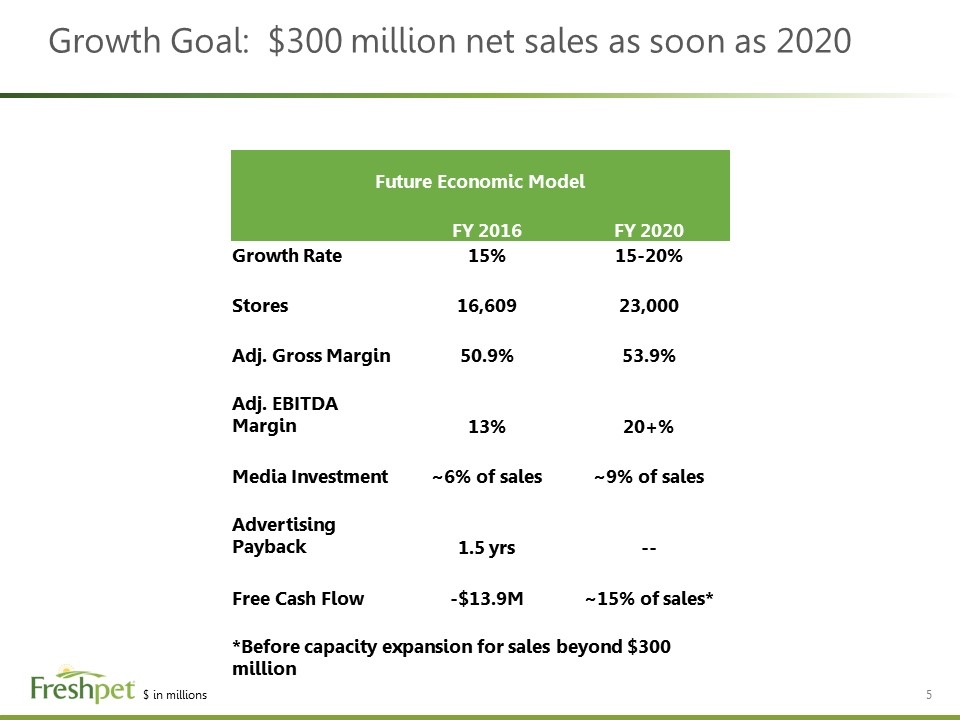
Growth Goal: $300 million net sales as soon as 2020 Future Economic Model FY 2016 FY 2020 Growth Rate 15% 15-20% Stores 16,609 23,000 Adj. Gross Margin 50.9% 53.9% Adj. EBITDA Margin 13% 20+% Media Investment ~6% of sales ~9% of sales Advertising Payback 1.5 yrs -- Free Cash Flow -$13.9M ~15% of sales* *Before capacity expansion for sales beyond $300 million $ in millions
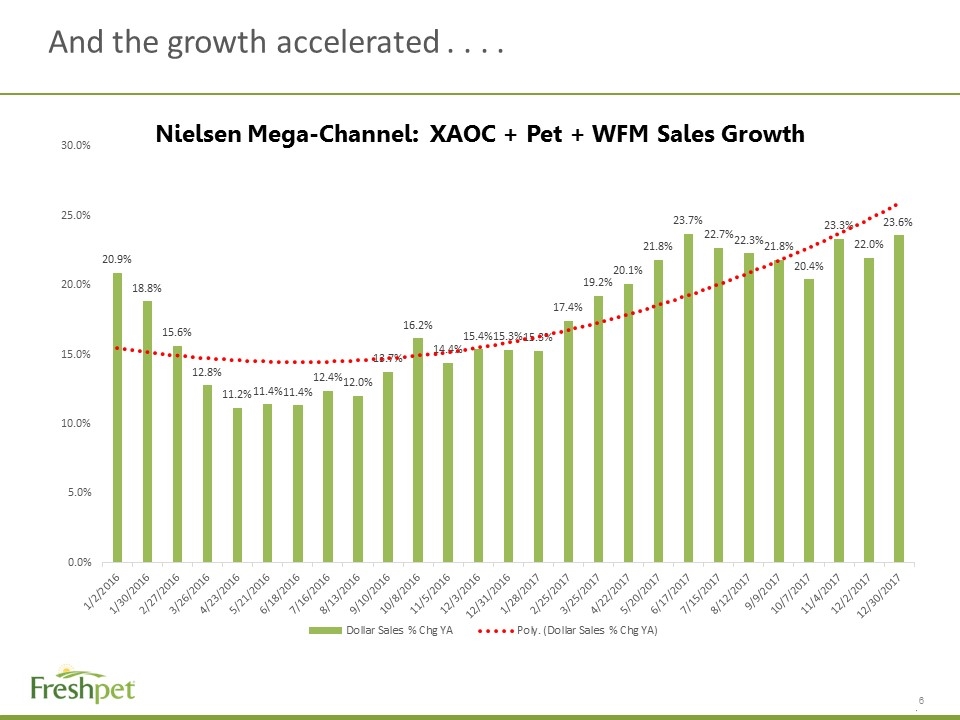
And the growth accelerated . . . . Nielsen Mega-Channel: XAOC + Pet + WFM Sales Growth
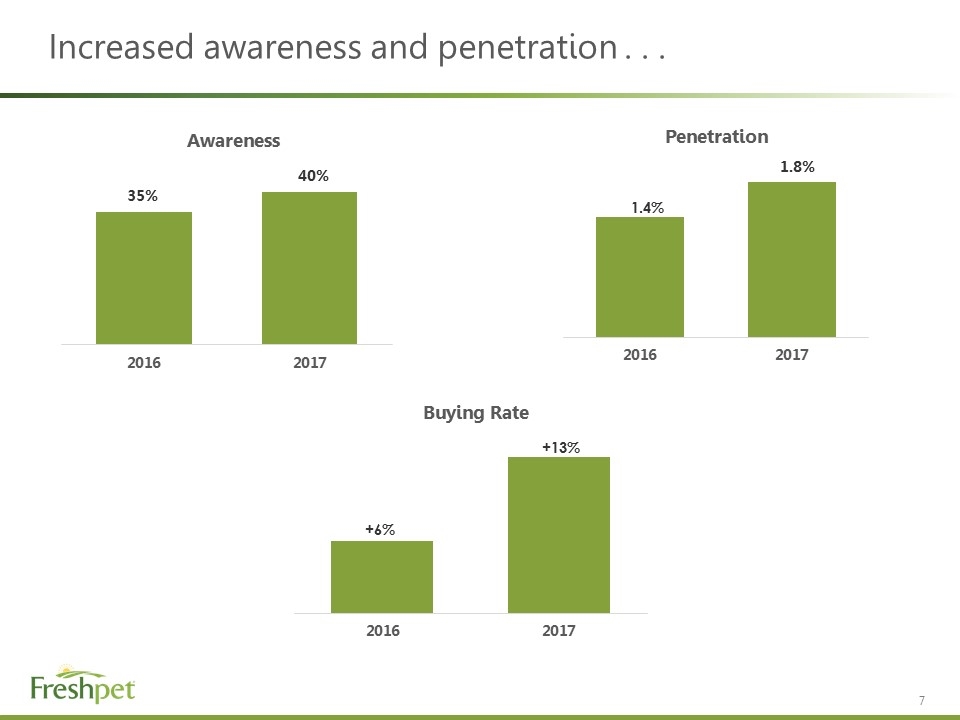
Increased awareness and penetration . . . 1.4%
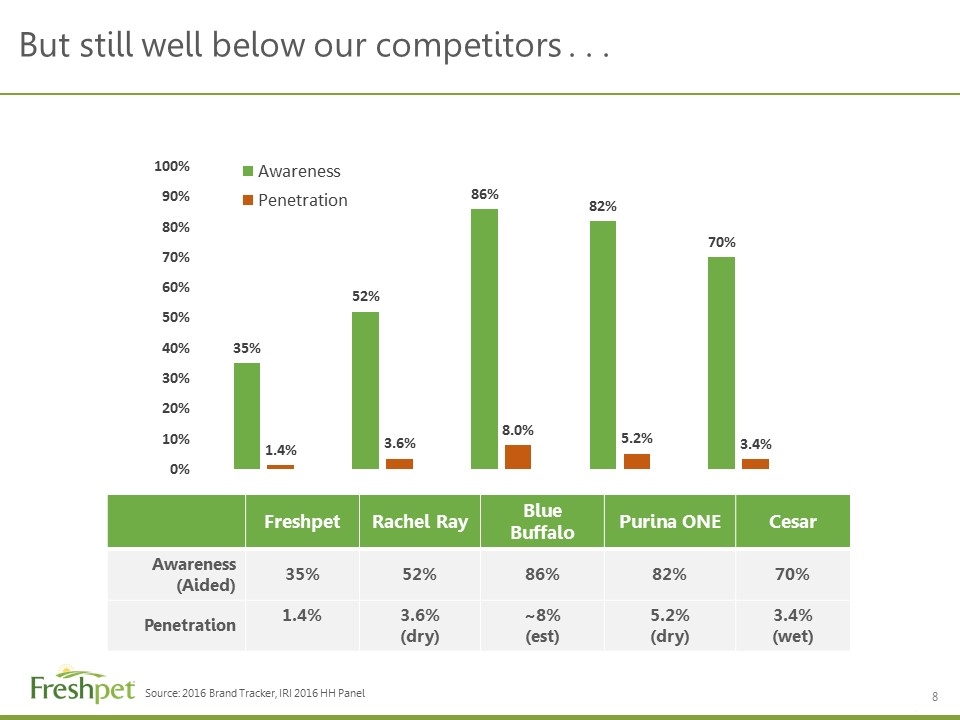
Freshpet Rachel Ray Blue Buffalo Purina ONE Cesar Awareness (Aided) 35% 52% 86% 82% 70% Penetration 1.4% 3.6% (dry) ~8% (est) 5.2% (dry) 3.4% (wet) But still well below our competitors . . . Source: 2016 Brand Tracker, IRI 2016 HH Panel
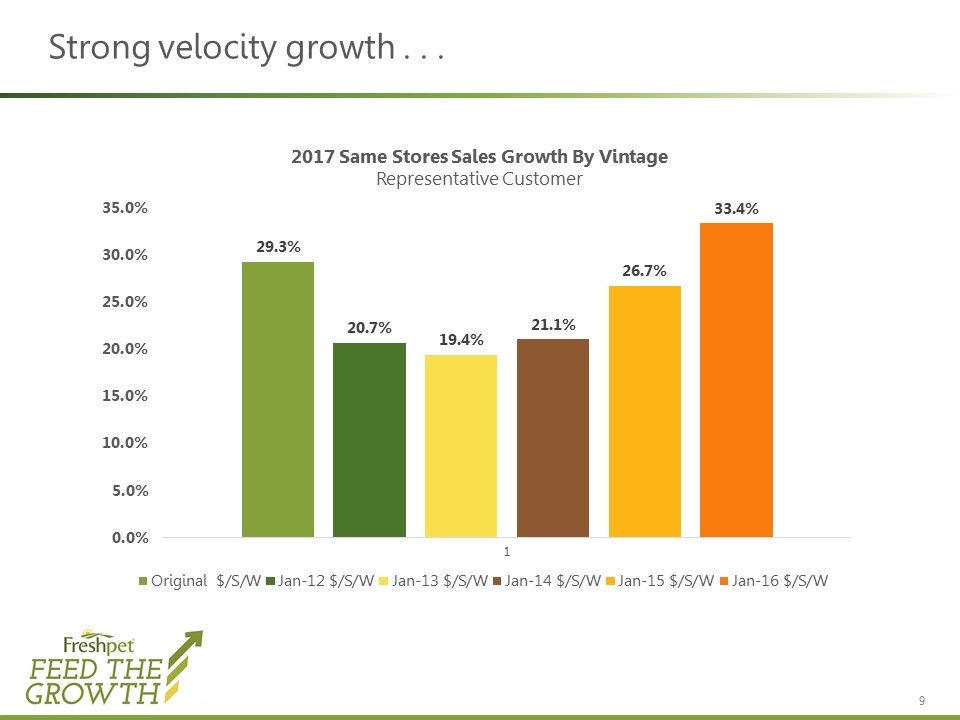
Strong velocity growth . . .
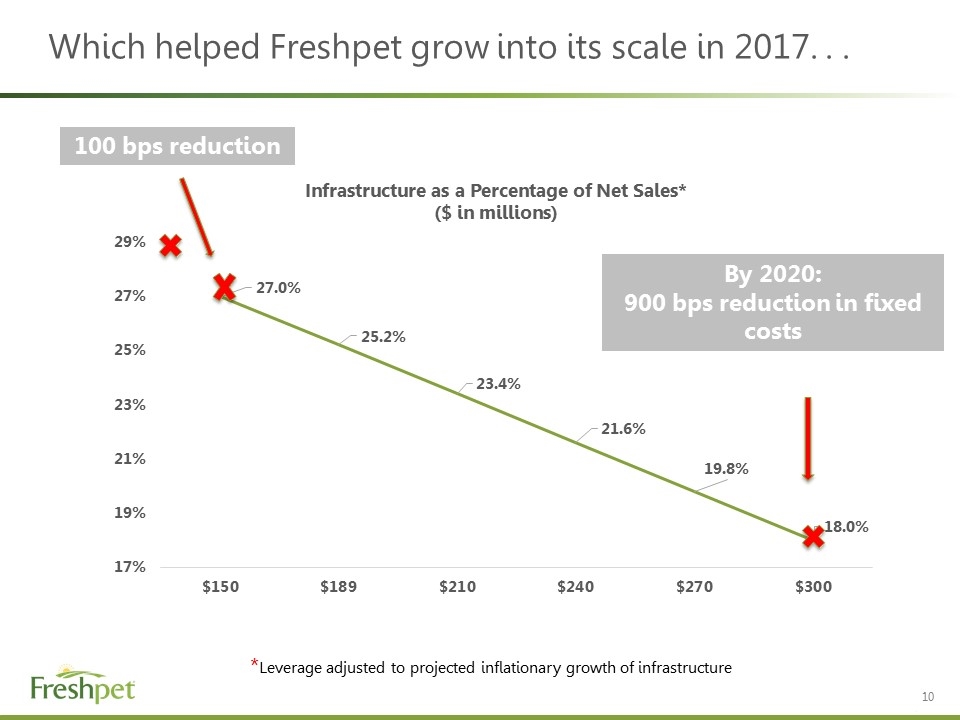
Which helped Freshpet grow into its scale in 2017. . . 100 bps reduction *Leverage adjusted to projected inflationary growth of infrastructure By 2020: 900 bps reduction in fixed costs
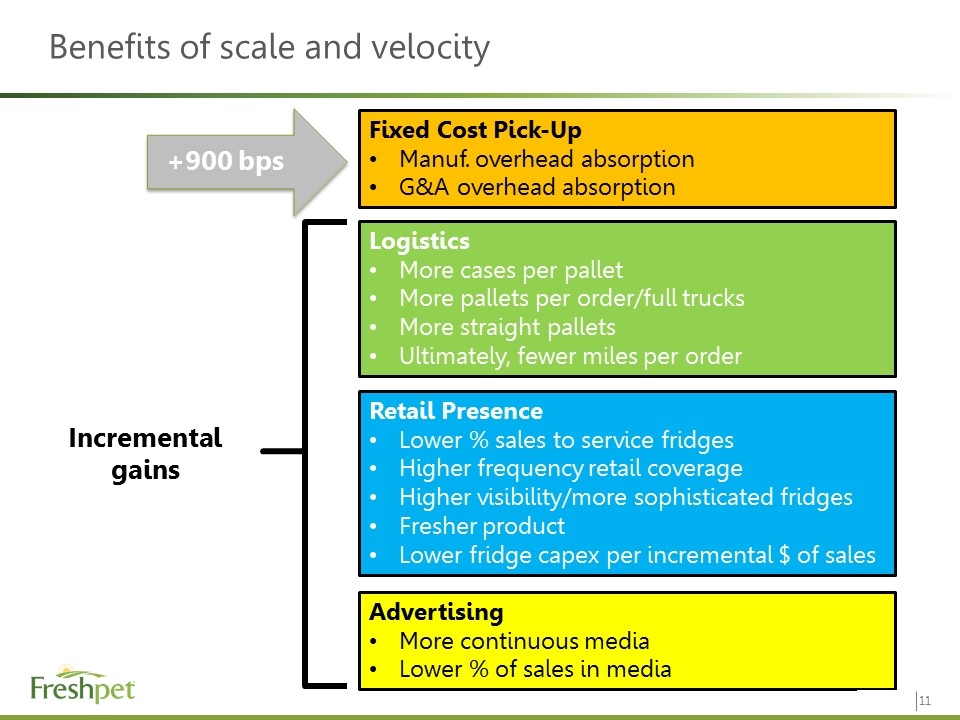
Benefits of scale and velocity Fixed Cost Pick-Up Manuf. overhead absorption G&A overhead absorption Logistics More cases per pallet More pallets per order/full trucks More straight pallets Ultimately, fewer miles per order Retail Presence Lower % sales to service fridges Higher frequency retail coverage Higher visibility/more sophisticated fridges Fresher product Lower fridge capex per incremental $ of sales Advertising More continuous media Lower % of sales in media +900 bps Incremental gains
YEAR II: Bigger and Faster
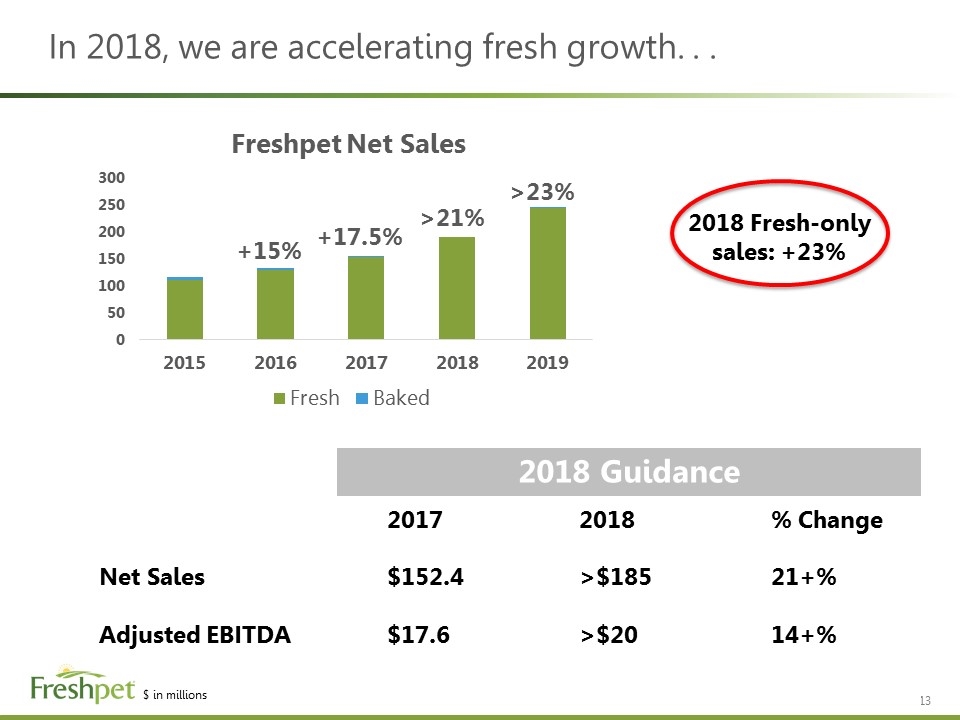
In 2018, we are accelerating fresh growth. . . +15% +17.5% >21% >23% 2018 Fresh-only sales: +23% 20172018% Change Net Sales$152.4>$18521+% Adjusted EBITDA$17.6>$2014+% 2018 Guidance $ in millions
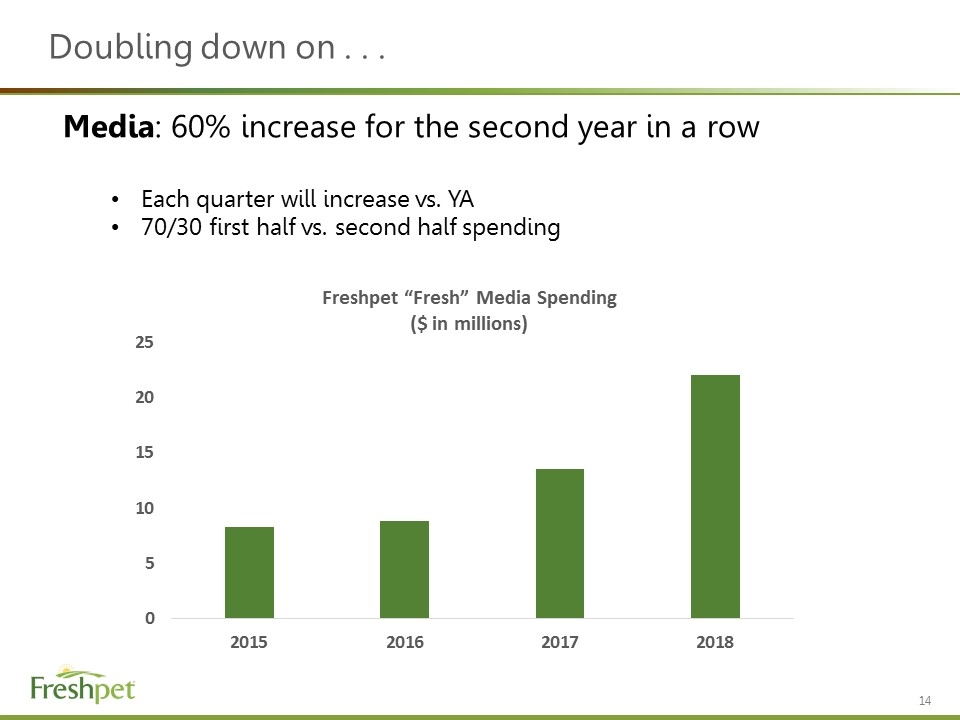
Doubling down on . . . Media: 60% increase for the second year in a row Each quarter will increase vs. YA 70/30 first half vs. second half spending
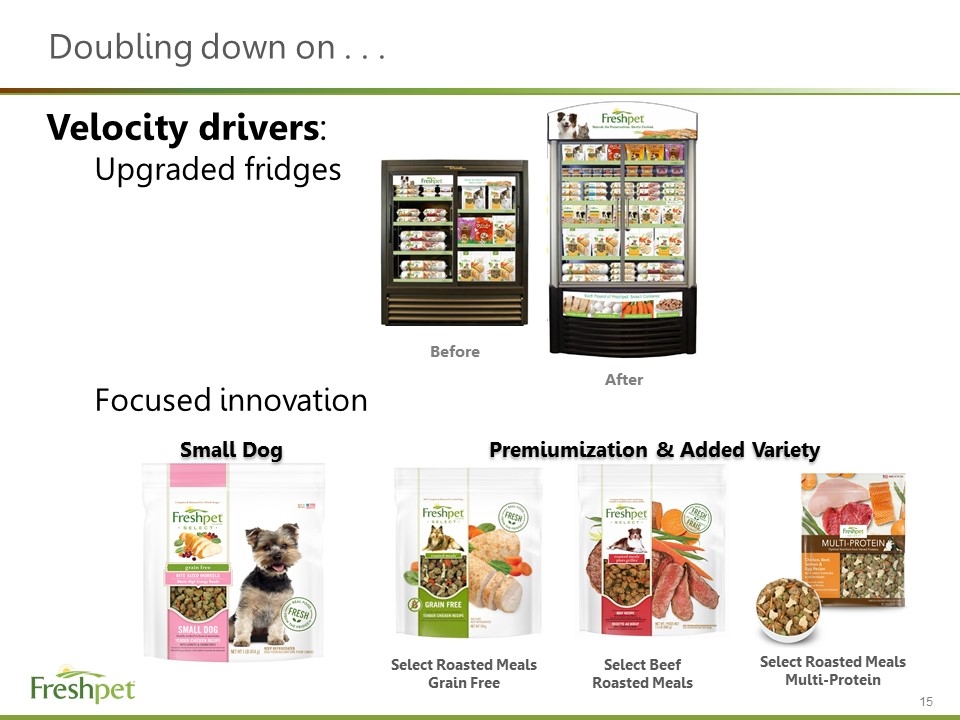
Doubling down on . . . Velocity drivers: Upgraded fridges Focused innovation Premiumization & Added Variety Select Roasted Meals Grain Free Select Roasted Meals Multi-Protein Select Beef Roasted Meals Small Dog After Before
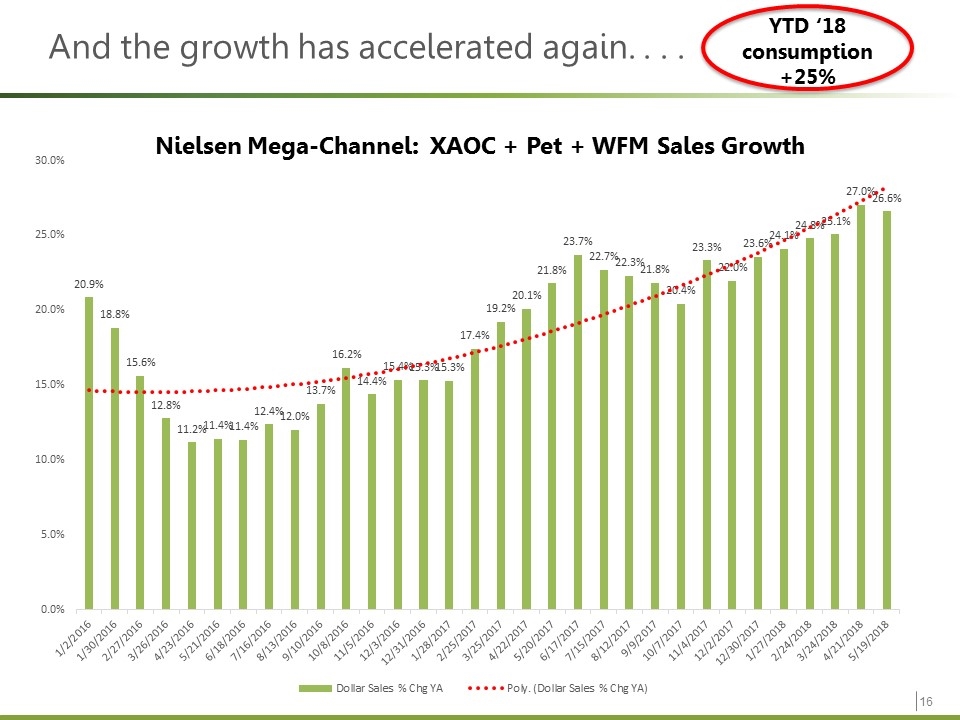
And the growth has accelerated again. . . . YTD ‘18 consumption +25% Nielsen Mega-Channel: XAOC + Pet + WFM Sales Growth
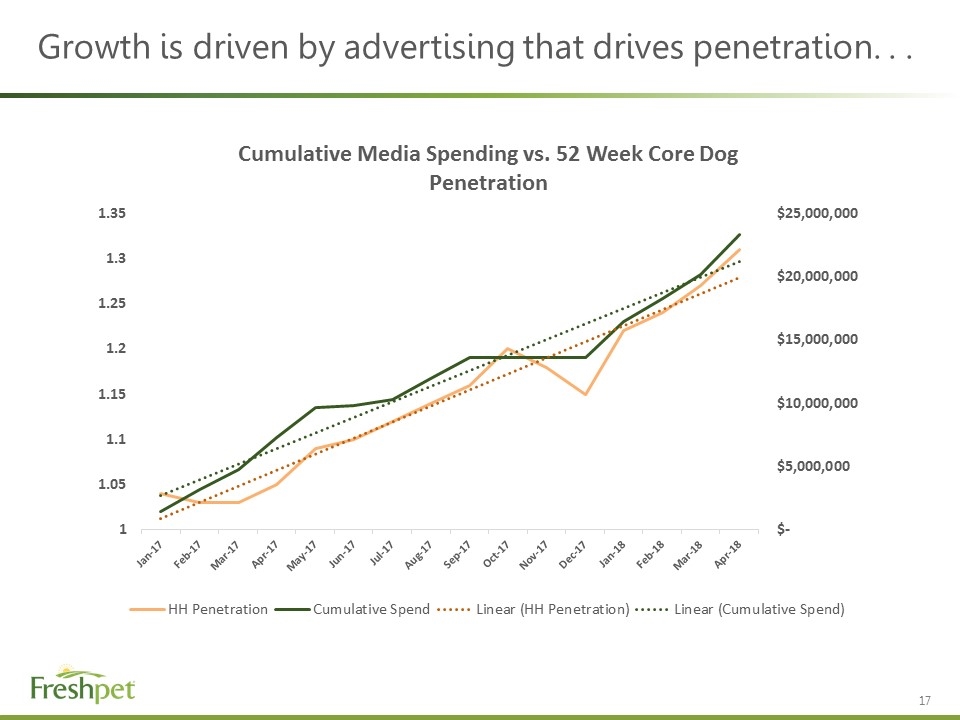
Growth is driven by advertising that drives penetration. . .
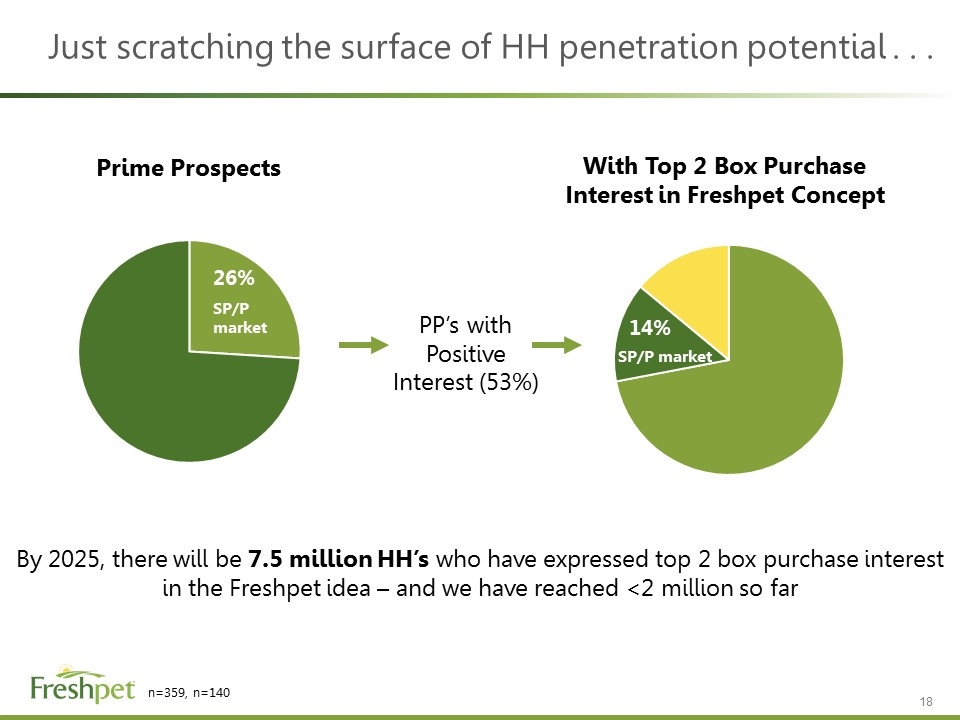
Just scratching the surface of HH penetration potential . . . By 2025, there will be 7.5 million HH’s who have expressed top 2 box purchase interest in the Freshpet idea – and we have reached <2 million so far Prime Prospects With Top 2 Box Purchase Interest in Freshpet Concept PP’s with Positive Interest (53%) n=359, n=140 SP/P market SP/P market
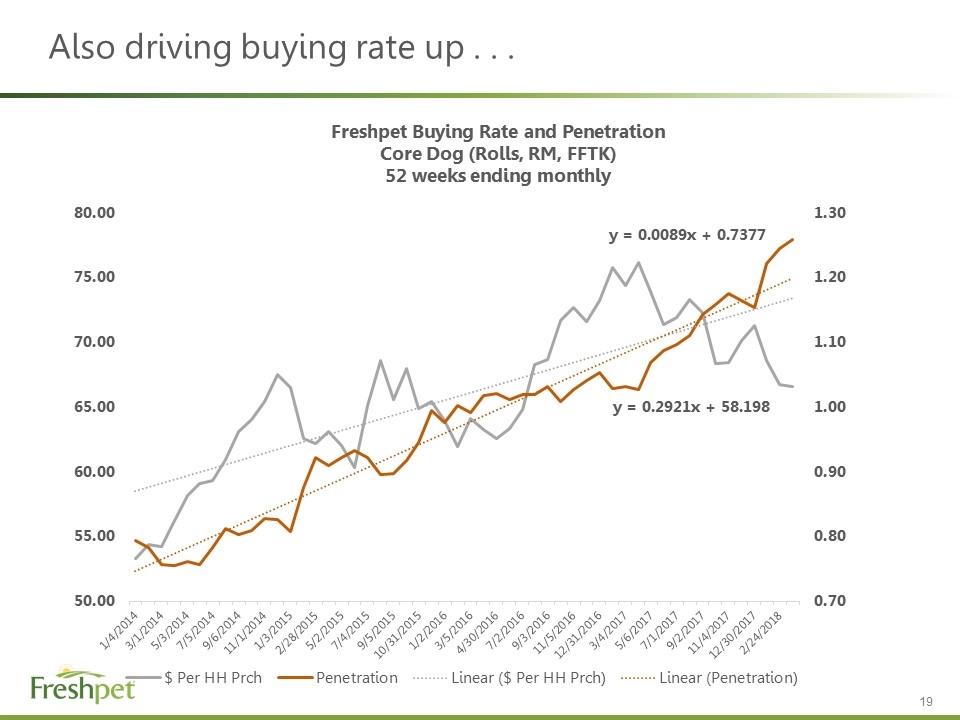
Also driving buying rate up . . .
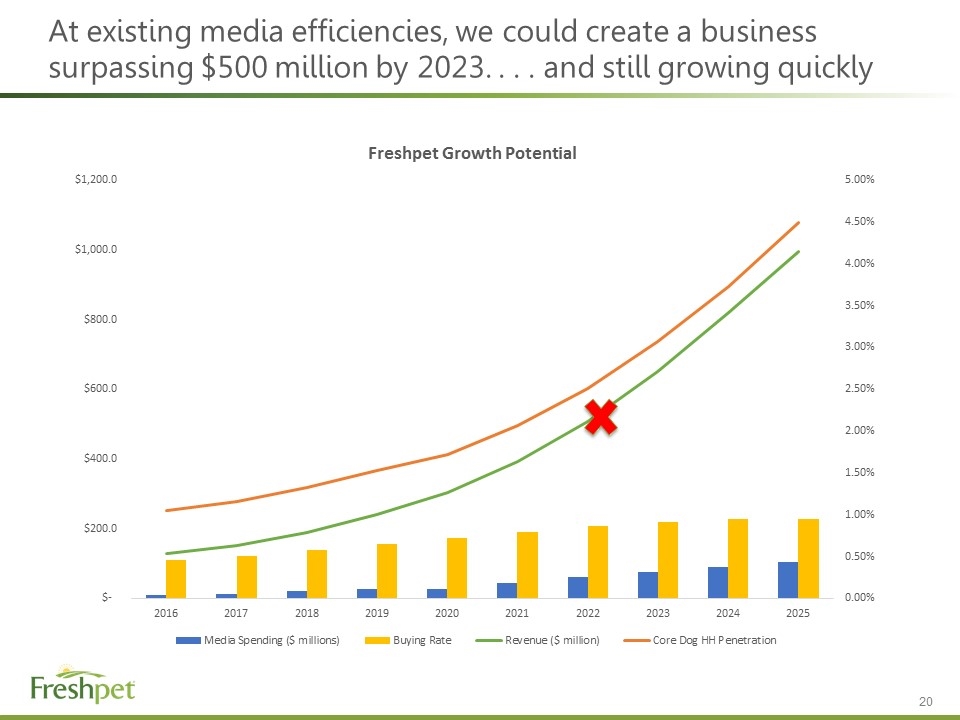
At existing media efficiencies, we could create a business surpassing $500 million by 2023. . . . and still growing quickly
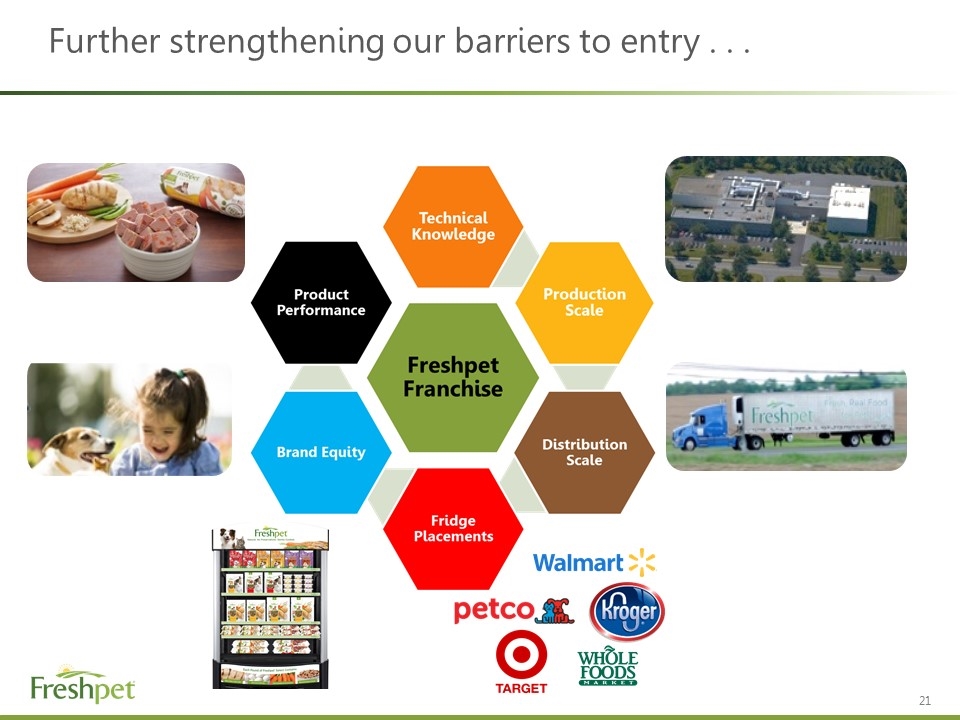
Further strengthening our barriers to entry . . .
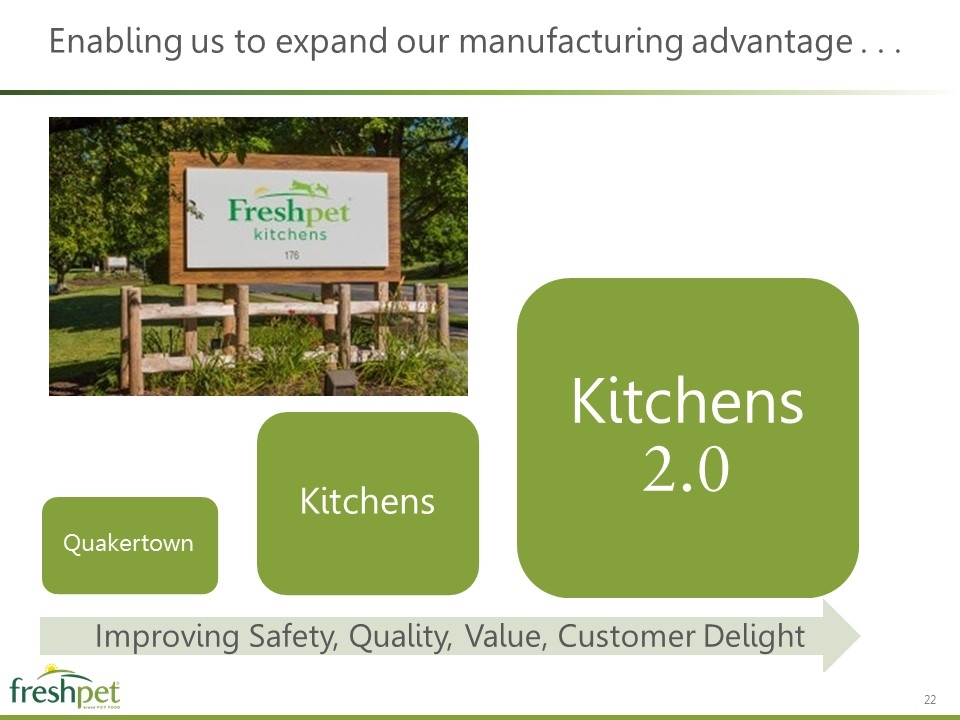
Enabling us to expand our manufacturing advantage . . . Improving Safety, Quality, Value, Customer Delight 22 Quakertown Kitchens Kitchens 2.0
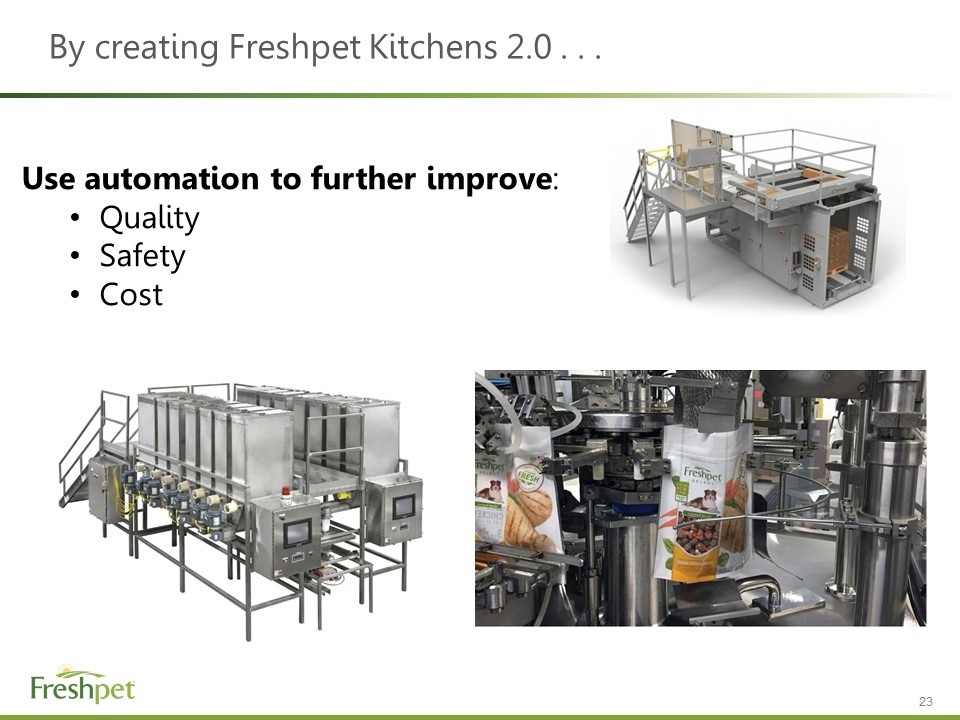
By creating Freshpet Kitchens 2.0 . . . Use automation to further improve: Quality Safety Cost
Kitchens 2.0 plan will deliver . . . Efficient use of capital: Payback in <2 years Strengthened manufacturing expertise advantage: Increased automation delivers improved quality, safety and lower cost – improving gross margins Continued focus on existing gross margin improvement goals: We will not let Kitchens 2.0 work dilute our near term gross margin improvement efforts
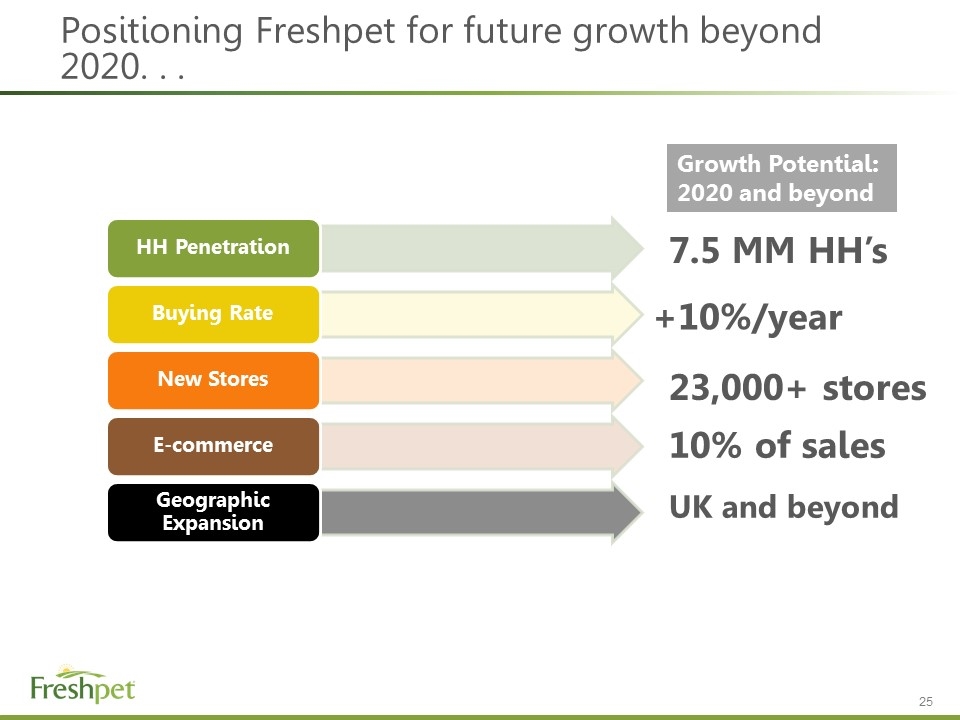
Positioning Freshpet for future growth beyond 2020. . . 7.5 MM HH’s +10%/year 10% of sales UK and beyond 23,000+ stores Growth Potential: 2020 and beyond HH Penetration Buying Rate New Stores Geographic Expansion E-commerce

Delighting pet parents, pets, shareholders and employees . . .
