Attached files
| file | filename |
|---|---|
| 8-K - 8-K - CubeSmart | a18-14753_18k.htm |
Safe Harbor Statement The forward-looking statements contained in this presentation are subject to various risks and known and unknown uncertainties. Although the Company believes the expectations reflected in such forward-looking statements are based on reasonable assumptions, there can be no assurance that the Company's expectations will be achieved. Factors which could cause the Company's actual results, performance, or achievements to differ significantly from the results, performance, or achievements expressed or implied by such statements are set forth under the captions "Item 1A. Risk Factors" and "Forward-Looking Statements" in our annual report on Form 10-K and in our quarterly reports on Form 10-Q and described from time to time in the Company's filings with the SEC. Forward-looking statements are not guarantees of performance. For forward-looking statements herein, the Company claims the protection of the safe harbor for forward-looking statements contained in the Private Securities Litigation Reform Act of1995. The Company assumes no obligation to update or supplement forward-looking statements that become untrue because of subsequent events. UseofNon-G Financial easures This presentation contains certain non-GAAP financial measures. The definitions of these terms, the reasons for their use, and reconciliations to the most directly comparable GAAP measures are included in our Earnings Release as well as the Non-GAAP Financial Measures section under the caption "Management's Discussion and Analysis of Financial Condition and Results of Operations" (or similar captions) in our quarterly reports on Forms 10-Q and 10-K, and described from time to time in the Company's filings with the SEC.
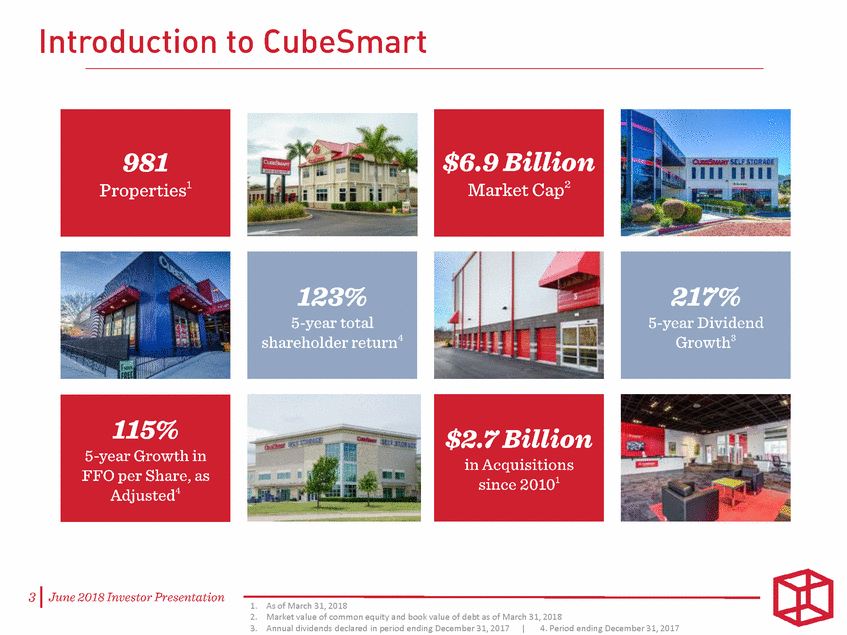
115% 5-year Growth in FFO per Share, as Adjusted4 31 June 2018 Investor Presentation 1. As of March 31, 2018 $6.9 Billion MarketCap2
41 June 2018 Investor Presentation
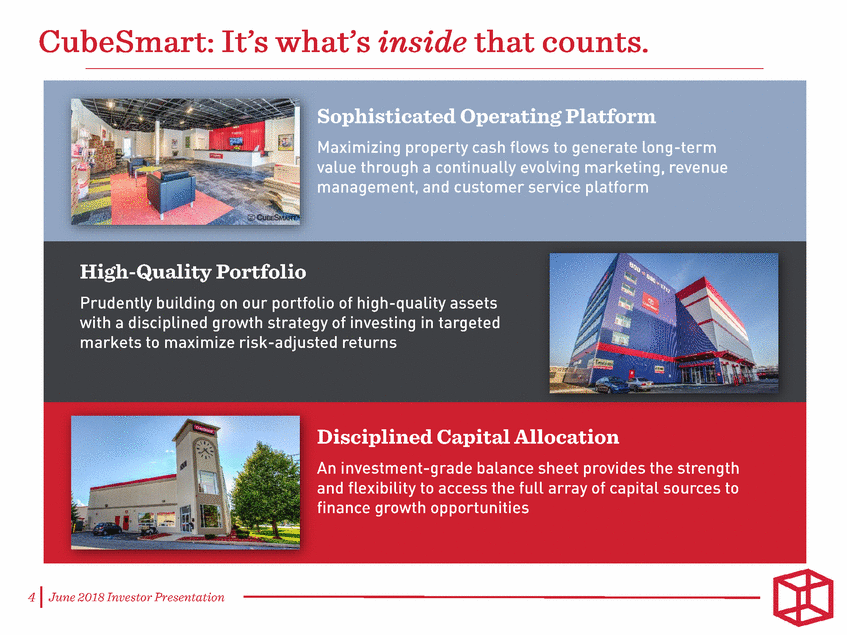
Integrated strategy to maximize customer acquisition and retention Customer Value Revenue Management Proprietary systems and processes dynamically inform pricing decisions to achieve the ultimate goal of revenue maximization Customer Service Strategic investments in people, training, and technology help to better meet customer needs and exceed expectations of the storage experience
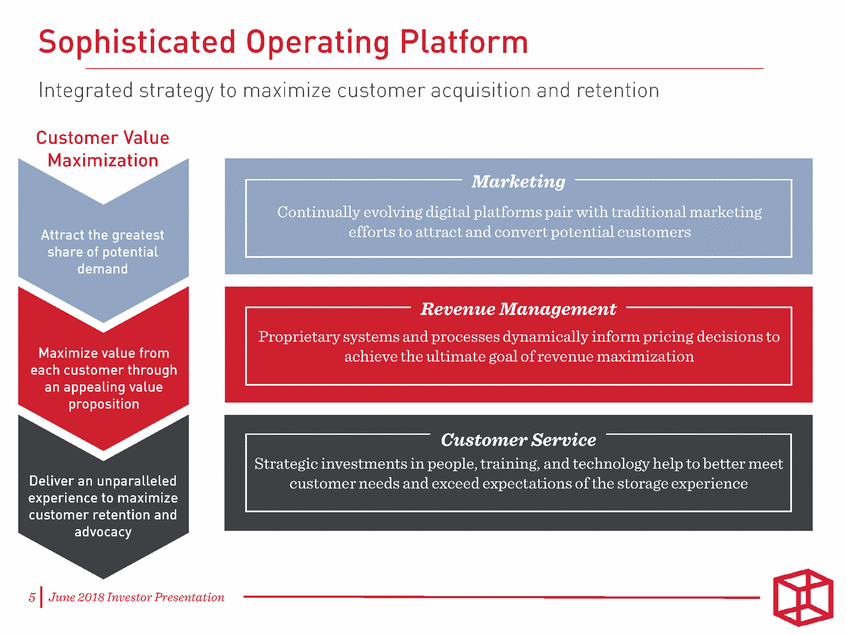
Integrated approach across all channels drives customers through the funnel Maximize value from each customer through an appealing value proposition Deliver an unparalleled experience to encourage retention and advocacy
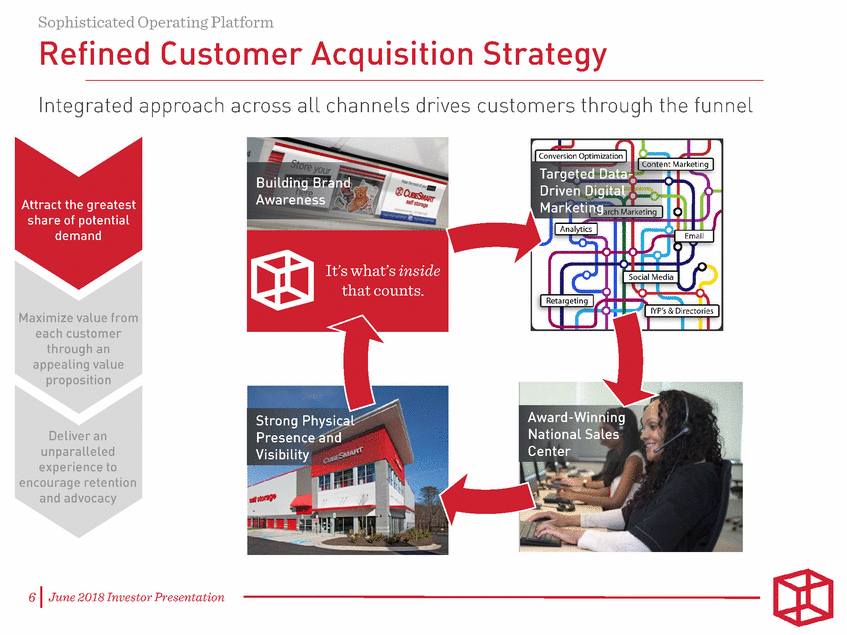
Multi-faceted approach to dynamically manage supply/demand balance Attract the greatest share of potential demand Deliver an unparalleled experience to encourage retention and advocacy Demand Forecast/Revenue Optimization Price optimization requires consideration of a multi-dimensional demand landscape & ever-changing capacity constraints Maximizing the efficiency of our available space through dynamic inventory management, prioritization, & cube conversions to create optimalcube availability Cube Mix & Inventory Management Balance between Pricing & Discounting Goalof providing the most compelling offer that maximizes long term customer value Dynamic in-place rate increase strategies Leverage customer stickiness to maximize long-term revenue from each customer Existing Customer Rate Increases
• • • • • •
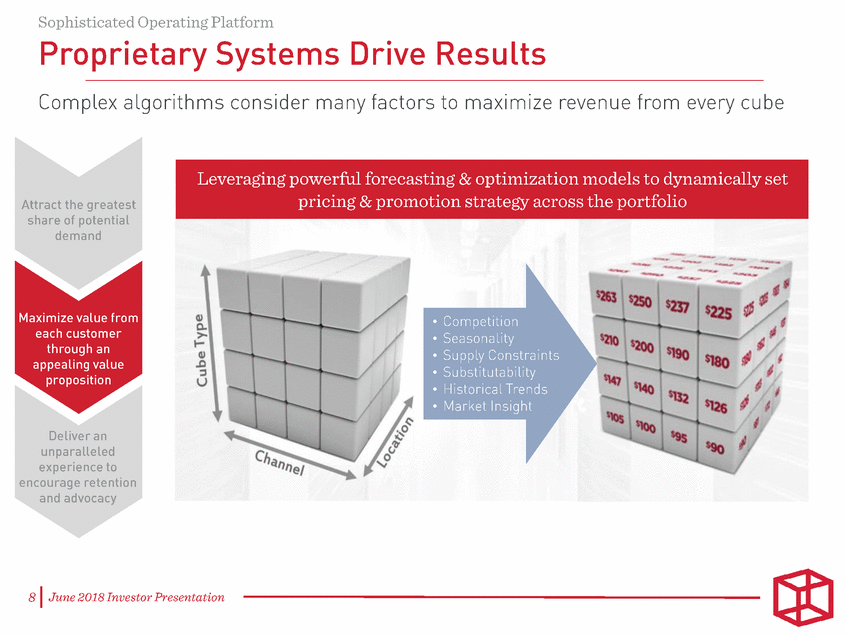
Striving to fulfill our mission of simplifying our customers· organizational challenges .. Attract the greatest share of potential demand Maximize value from each customer through an appealing value proposition SingleEnterprising DownsizingMovingSenior SamRemarried Renovating SoniaErik Dave MaryRyanRita "As a single "Our business "We Lived in our "At the end of"When my wife "People thought I"I didn't realize woman, safety isn't big enough family home for our move, we passed, I could was crazy to how much is criticalto for a warehouse,34 years, and sowere tired. The barely imagine marry a woman additional me. I don't but we have did my full last thing we Life withoutwith three girls, stress would want to definitely workshop, my wanted was to her, let alone when I have three come with navigate long, outgrown the wife's lamp have to jump finding a boys already. Part building an dark hallwayshome office. We collection, and through hoops storage unit to of making us one addition. My by myself. Ineed a place everything in to get our extra care for my family means house feels need bright where we can between. things in things. But, Imaking some like it's in lights, open access our Moving to astorage. Lucky was grateful detours to the shambles at areas, and supplies without house without a for us, we got that storage unit while the moment. above all, Ia hassle." basement was squared away CubeSmart our households But, at least I need to feel incredibly in record time made things merge. I like that know the safe." stressful. Weat CubeSmart, easy for me they have a family important needed the and before we and were very feel, too. Theythings are experts at knew it, we kind to me greet all of us byclean and safe, CubeSmart to were back throughout the name, which is and in a secure help us solve home whole impressive, since spot at er puzzle. us.
Award-Winning Service Culture Attract the greatest share of potential demand Maximize value from each customer through an appealing value proposition 10 IJune 2018 Investor Presentation
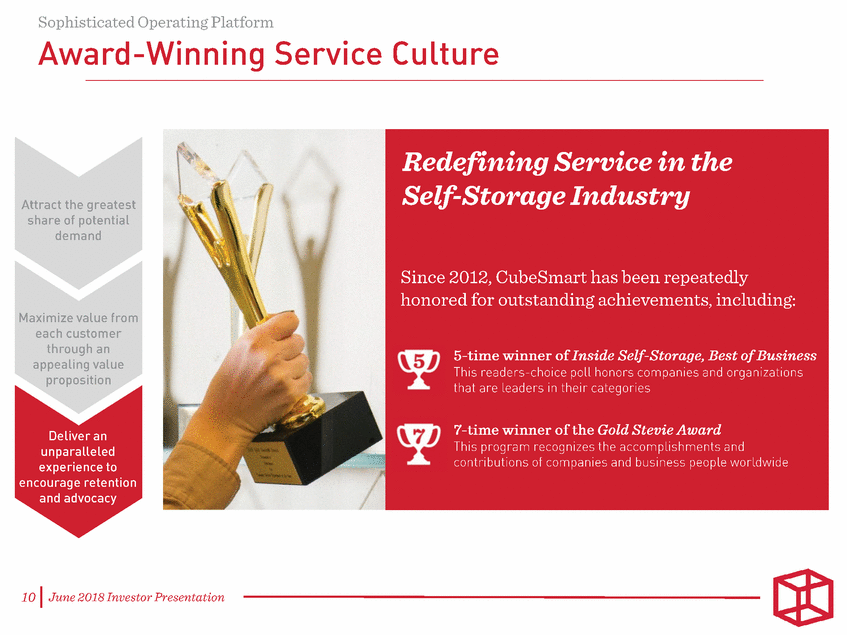
Third-Party Owners Continually Choose CubeSmart Owners repeatedly trust their investments to the CubeSmart platform investments Third-Party Managed Properties 600 500 400 300 200 100 0 1 2009 2010 2011 2012 2013 2014 2015 2016 2017 2018
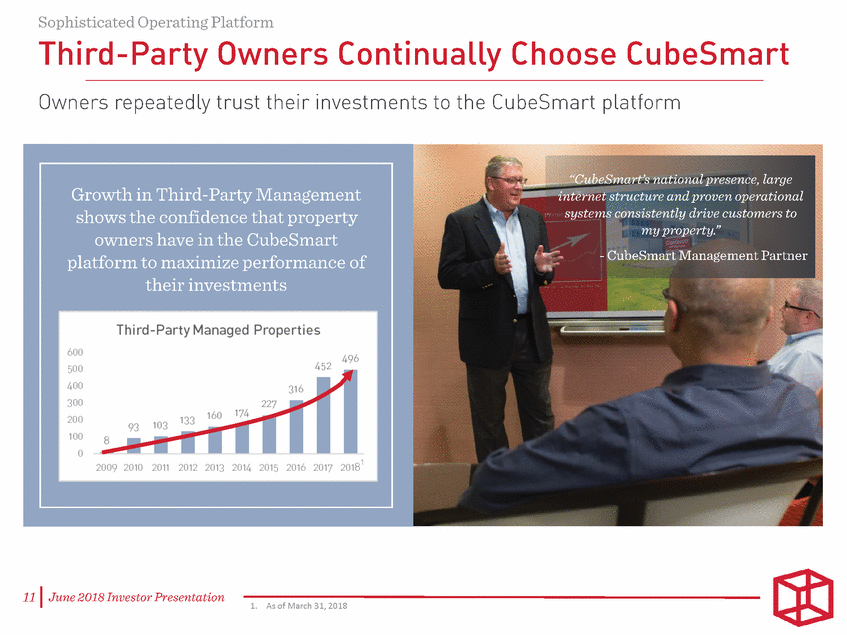
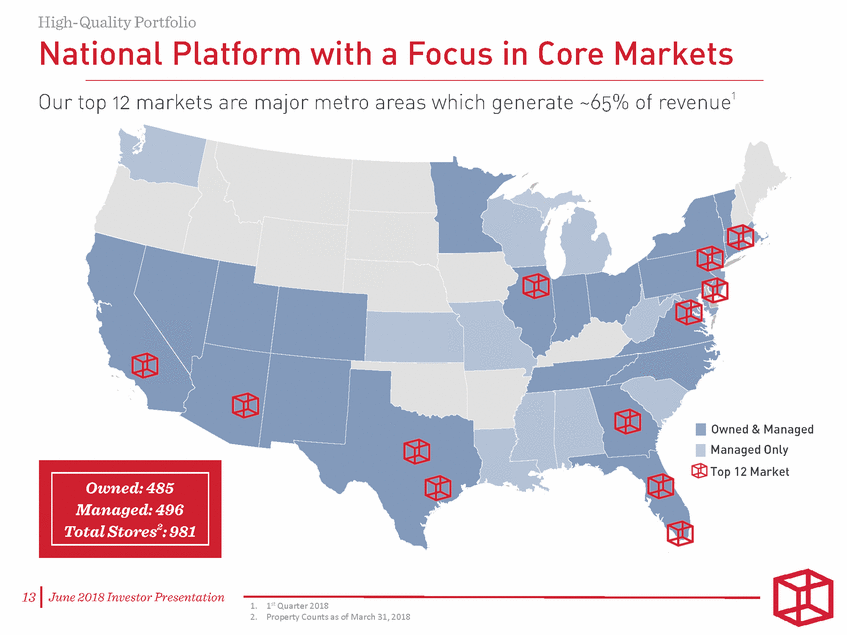
National Platform with a Focus in Core Markets Our top 12 markets are major metro areas which generate 65°/o of revenue1 • Owned & Managed Managed Only ® Top 12 Market 131 June 2018 Investor Presentation 1. P' Quarter 2018
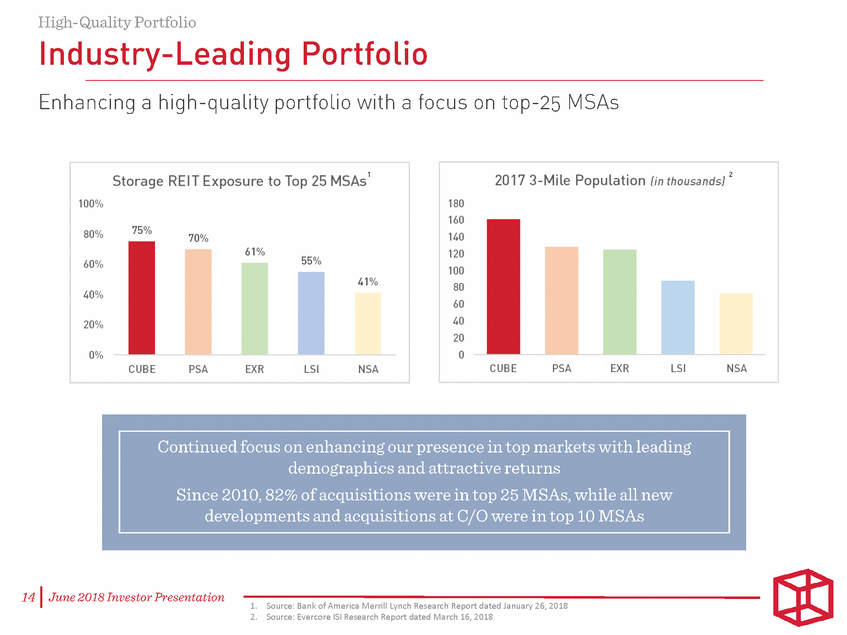
Enhancing a high-quality portfolio with a focus on top-25 MSAs 1 100%180 160 2017 3-Mile Population fin thousands) 2 70% 140 61%120 60%55% 40% 100 41% 80 60 20%40 20 0% 0 CUBEPSA EXRLSINSA CUBEPSA EXR LSINSA Continued focus on enhancing our presence in top markets with leading demographics and attractive returns Since 2010, 82% of acquisitions were in top 25 MSAs, while all new developments and acquisitions at C/0 were in top 10 MSAs
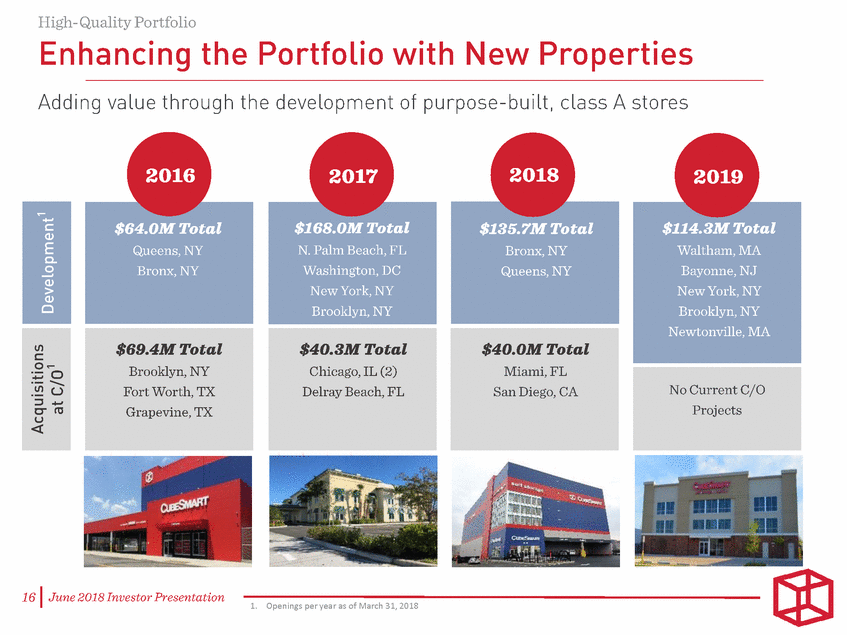
Adding value through the development of purpose-built, class A stores N. Palm Beach, F NewiYork, NIYi NewiYork, Ni¥1 Vl c: o...-·- ......... -u ::J ..... e-re u <.( $69.4M Total Brooklyn, NY Fort Worth, TX Grapevine, TX $40.8M Total Chicago, IL (2) Delray Beach, FL $40.0M Total Miami,FL San Diego, CA Newtonville, M No Current C/0 Projects 161 June 2018 Investor Presentation 1. Openings per year as of March 31, 2018
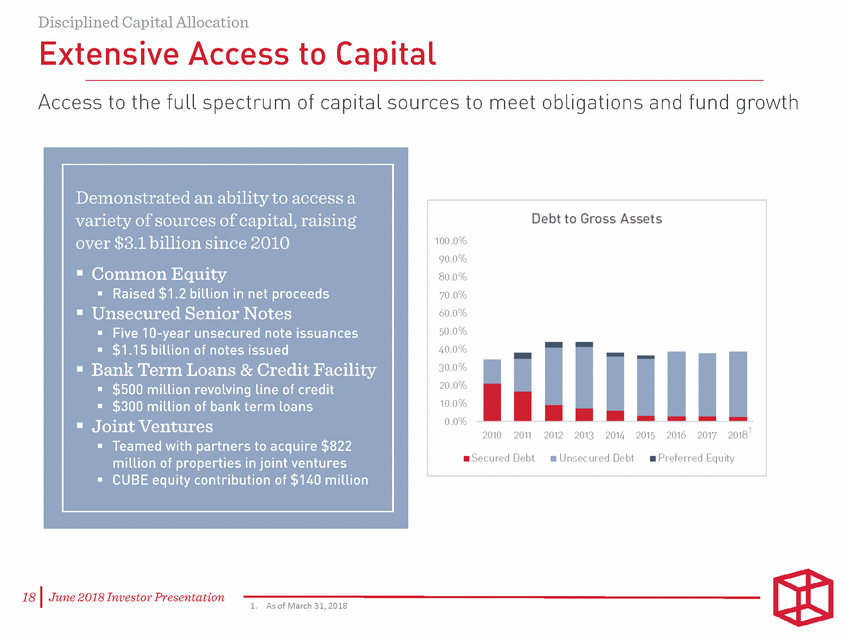
Disciplined Capital Allocation Extensive Access to Capital Access to the full spectrum of capital sources to meet obligations and fund growth Demonstrated an ability to access a variety of sources of capital, raising over $3.1billion since 2010 • Common Equity • Raised $1.2 billion in net proceeds • Unsecured Senior Notes • Five 10-year unsecured note issuances • $1.15 billion of notes issued • Bank Term Loans & Credit Facility • $500 million revolving line of credit • $300 million of bank term loans • Joint Ventures • Teamed with partners to acquire $822 100.0% 900% 80.0% 70.0% 600% 50 O% 40.0% 30 0% 20.0% 10.0% 0.0% Debt to Gross Assets 20102011 2012 2013 2014 2015 2016 2017 20181 million of properties in joint ventures • CUBE equity contribution of $140 million •Secured Debt • Unsecured Debt • Preferred Equity
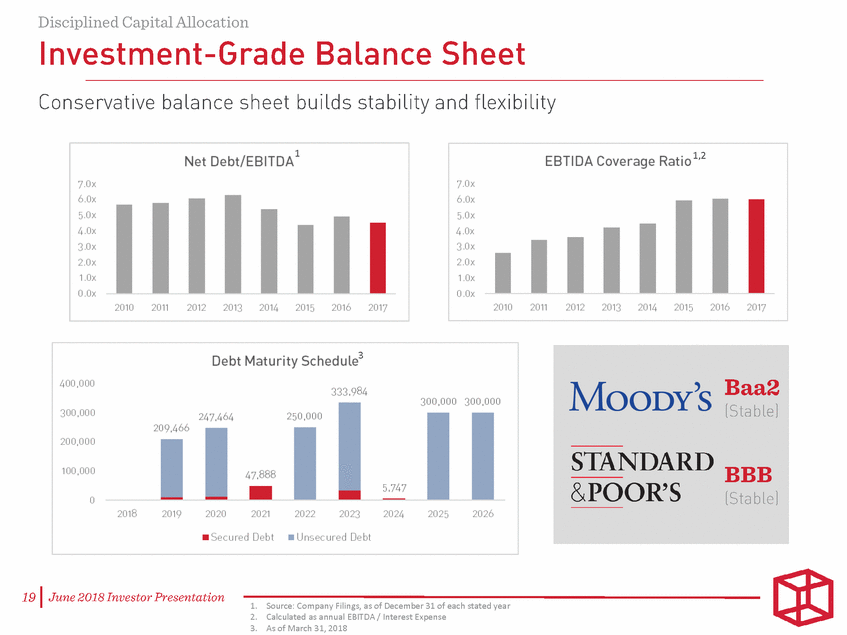
11,2 3
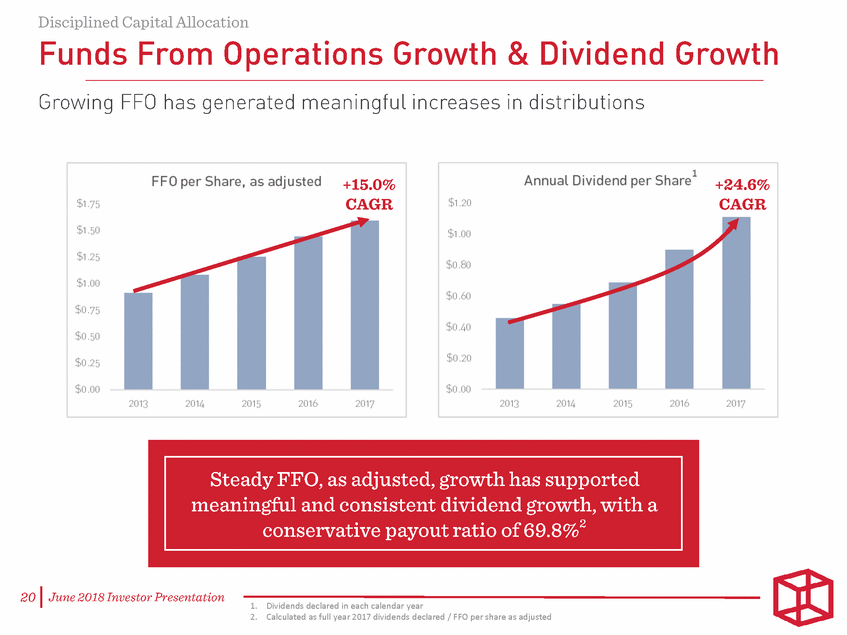
Disciplined Capital Allocation Funds From Operations Growth & Dividend Growth Growing FFO has generated meaningful increases in distributions $1.75 $1.50 $1.25 $1.00 I $0.75 $0.50 1 $o.25 FFO per Share, as adjusted +15.0% CAGR$1.20 $1.00 $0.80 $0.60 $0.40 $0.20 1 AnnualDividend per Share +24.6% CAGR $0.00 2013 2014 2015 2016 2017 $0.00 2013 20142015 2016 2017 Steady FFO, as adjusted, growth has supported meaningful and consistent dividend growth, with a conservative payout ratio o£69.8%2 20 IJune 2018 Investor Presentation 1. Dividends declared in each calendar year 2. Calculated as full year 2017 dividends declared I FFO per share as adjusted
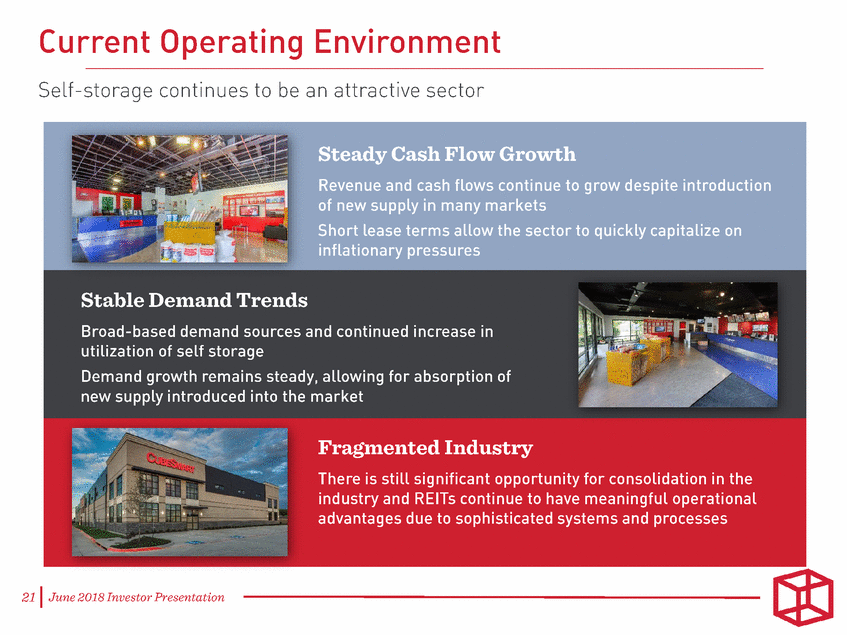
Current Operating Environment Self-storage continues to be an attractive sector 21 IJune 2018 Investor Presentation
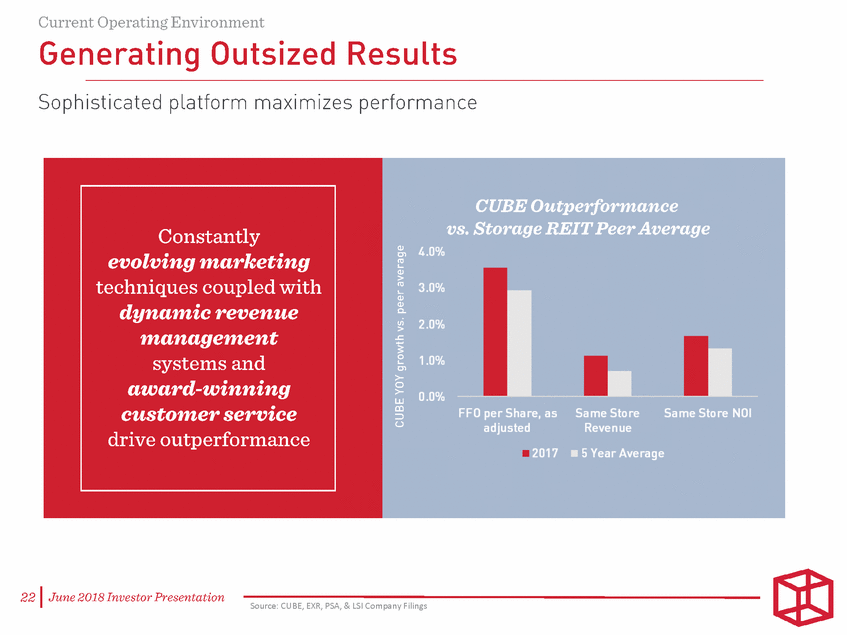
Sophisticated platform maximizes performance Constantly evolving marketing techniques coupled with dynamic revenue management systems and award-winning customer service drive outperformance I'' I'' I'' I I'. • I 221 June 2018 Investor Presentation Source: CUBE, EXR, PSA,& LSI Company Filings
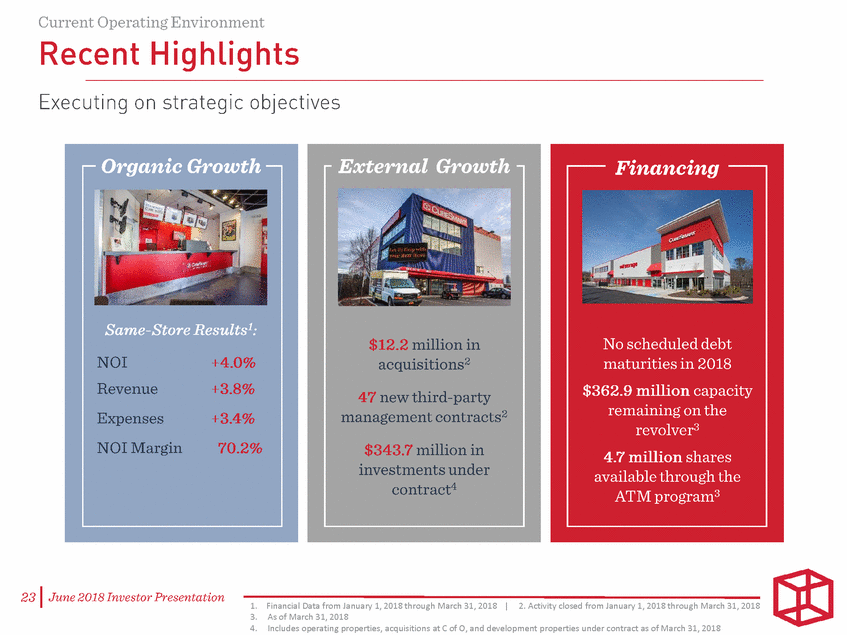
Executing on strategic objectives NOI +4.0% $12.2 million in acquisitions2 Revenue Expenses +3.8% +3.4% 47 new third-party management contracts2 NOIMargin 70.2% $343.7 million in investments under contract4 231 June 2018 Investor Presentation 1. Financial Data from January 1,2018through March 31, 2018 I 2. Activity closed from January 1, 2018 through March 31,2018
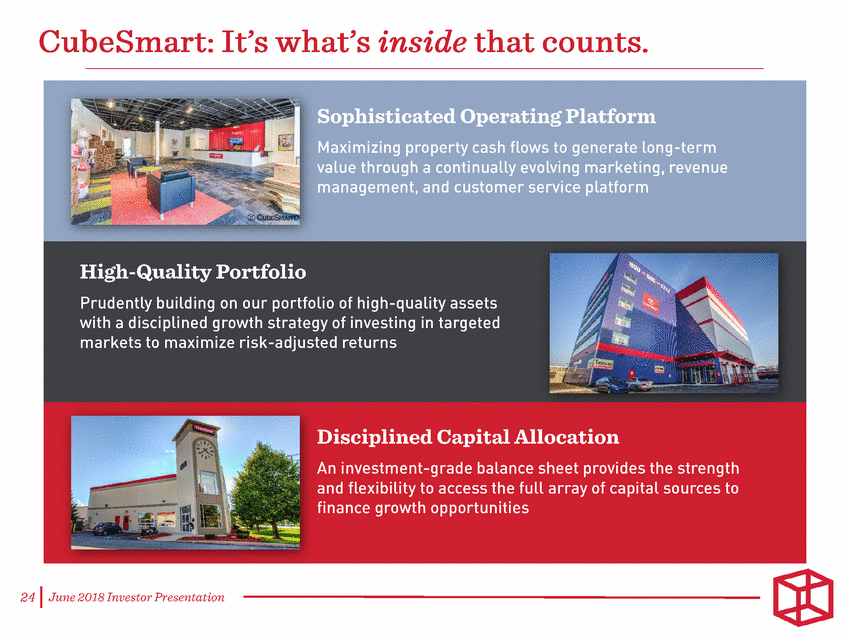
CubeSmart: It's what's inside that counts. 241 June 2018 Investor Presentation
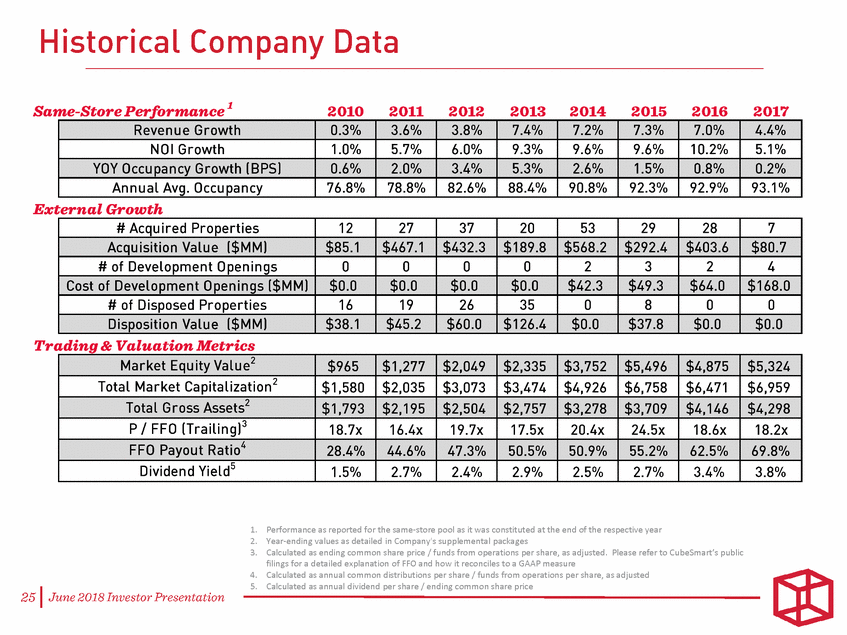
1. Performance as reported for the same-store pool as it was constituted at the end of the respective year 2. Year-ending values as detailed in Company's supplemental packages 3. Calculated as ending common share price / funds from operations per share, as adjusted. Please refer to CubeSmart’s public filings for a detailed explanation of FFO and how it reconciles to a GAAP measure 4. Calculated as annual common distributions per share / funds from operations per share, as adjusted 5. Calculated as annual dividend per share / ending common share price
[LOGO]
