Attached files
| file | filename |
|---|---|
| 8-K - 8-K - BUCKEYE PARTNERS, L.P. | a18-14864_18k.htm |
© Copyright 2018 Buckeye Partners, L.P. This presentation contains “forward-looking statements” that we believe to be reasonable as of the date of this presentation. These statements, which include any statement that does not relate strictly to historical facts, use terms such as “anticipate,” “assume,” “believe,” “estimate,” “expect,” “forecast,” “intend,” “plan,” “position,” “potential,” “predict,” “project,” or “strategy” or the negative connotation or other variations of such terms or other similar terminology. In particular, statements, expressed or implied, regarding future results of operations or ability to generate sales, income or cash flow, to make acquisitions, or to make distributions to unitholders are forward-looking statements. These forward-looking statements are based on management’s current plans, expectations, estimates, assumptions and beliefs concerning future events impacting Buckeye Partners, L.P. (the “Partnership”, “Buckeye” or “BPL”) and therefore involve a number of risks and uncertainties, many of which are beyond management’s control. Although the Partnership believes that its expectations stated in this presentation are based on reasonable assumptions, actual results may differ materially from those expressed or implied in the forward-looking statements. The factors listed in the “Risk Factors” sections of, as well as any other cautionary language in, the Partnership’s public filings with the Securities and Exchange Commission, provide examples of risks, uncertainties and events that may cause the Partnership’s actual results to differ materially from the expectations it describes in its forward-looking statements. Each forward-looking statement speaks only as of the date of this presentation, and the Partnership undertakes no obligation to update or revise any forward-looking statement. Reconciliations of non-GAAP measures to their most directly comparable GAAP measures are included in this presentation. The numerator of our estimated coverage ratio is estimated distributable cash flow, which is a non-GAAP financial measure. We cannot provide a reconciliation of estimated distributable cash flow to estimated GAAP net income, which is the GAAP financial measure most directly comparable to distributable cash flow, without unreasonable efforts due to the inherent difficulty and impracticality of quantifying certain amounts that would be required to calculate GAAP net income, such as unrealized gains and losses on derivatives marked to market and potential changes in estimates for certain contingent liabilities. These amounts that would require unreasonable effort to quantify could be significant, such that the amount of projected net income would vary substantially from the amount of projected distributable cash flow. LEGAL NOTICE / FORWARD-LOOKING STATEMENTS 2
SAFETY COMMITMENT Think Safe, Work Safe, Leave Safe – L.I.V.E. Safe Triple Threat: Hurricanes Harvey, Irma and Maria Our employees’ commitment to Buckeye’s culture of safety is what saved lives and protected our communities and assets Buckeye Emergency Response Organization Three Category 4 hurricanes hit our facilities Impacted the Bahamas, Puerto Rico, Florida and South Texas Our assets incurred minimal damage and there were no environmental impacts All of our employees and their families were safe and sustained no injuries © Copyright 2018 Buckeye Partners, L.P. Facility Response Team Incident Management Team Crisis Management Team Buckeye Universal Communication System 3

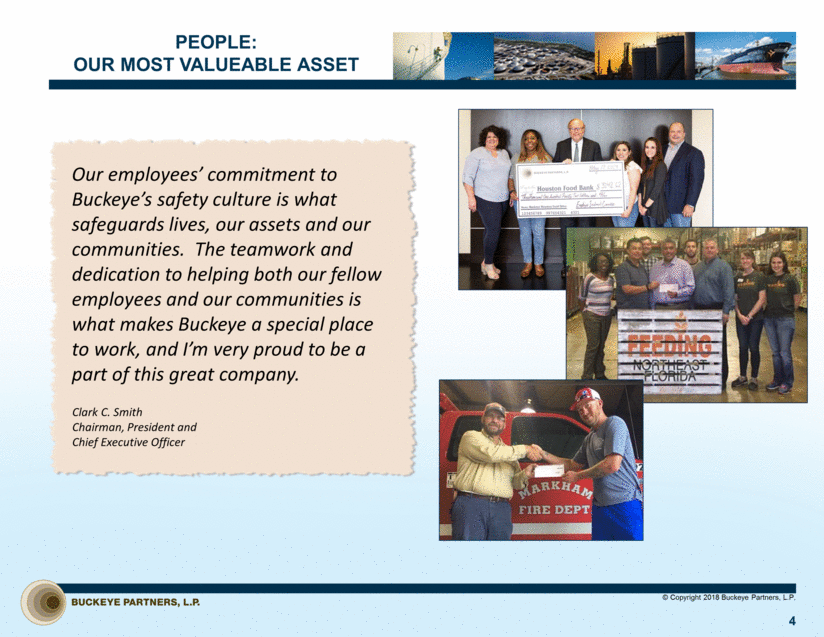
© Copyright 2018 Buckeye Partners, L.P. PEOPLE: OUR MOST VALUEABLE ASSET Our employees’ commitment to Buckeye’s safety culture is what safeguards lives, our assets and our communities. The teamwork and dedication to helping both our fellow employees and our communities is what makes Buckeye a special place to work, and I’m very proud to be a part of this great company. Clark C. Smith Chairman, President and Chief Executive Officer 4
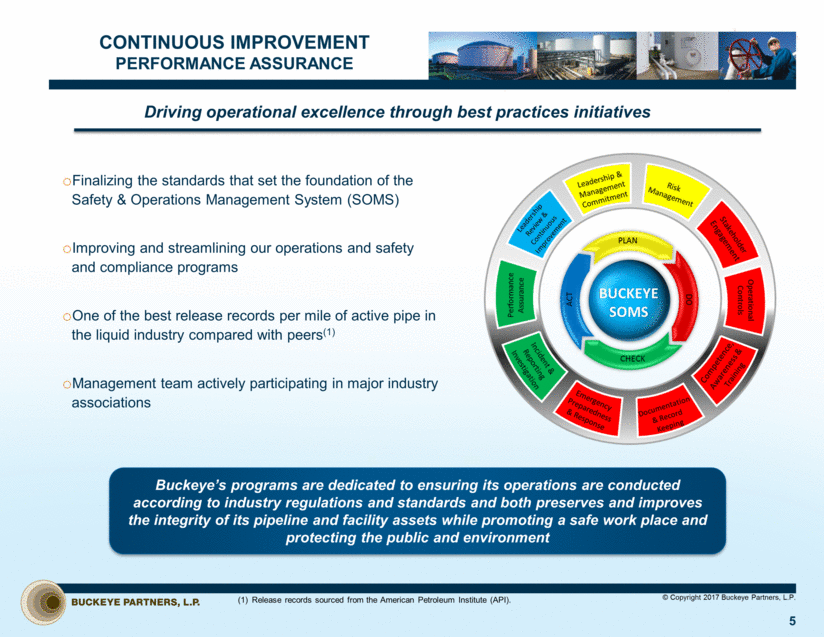
CONTINUOUS IMPROVEMENT PERFORMANCE ASSURANCE 5 © Copyright 2017 Buckeye Partners, L.P. Finalizing the standards that set the foundation of the Safety & Operations Management System (SOMS) Improving and streamlining our operations and safety and compliance programs One of the best release records per mile of active pipe in the liquid industry compared with peers(1) Management team actively participating in major industry associations Buckeye’s programs are dedicated to ensuring its operations are conducted according to industry regulations and standards and both preserves and improves the integrity of its pipeline and facility assets while promoting a safe work place and protecting the public and environment Driving operational excellence through best practices initiatives Release records sourced from the American Petroleum Institute (API).
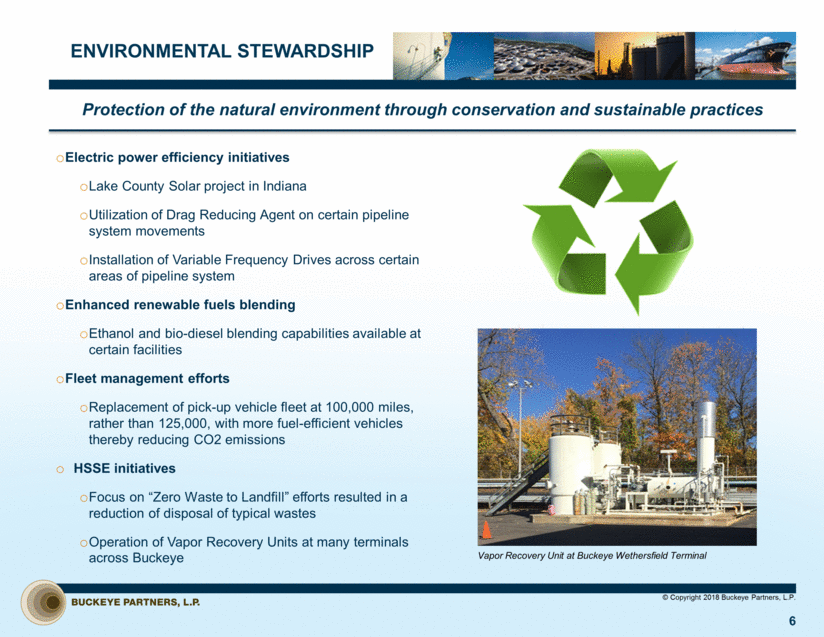
ENVIRONMENTAL STEWARDSHIP 6 Protection of the natural environment through conservation and sustainable practices © Copyright 2018 Buckeye Partners, L.P. Electric power efficiency initiatives Lake County Solar project in Indiana Utilization of Drag Reducing Agent on certain pipeline system movements Installation of Variable Frequency Drives across certain areas of pipeline system Enhanced renewable fuels blending Ethanol and bio-diesel blending capabilities available at certain facilities Fleet management efforts Replacement of pick-up vehicle fleet at 100,000 miles, rather than 125,000, with more fuel-efficient vehicles thereby reducing CO2 emissions HSSE initiatives Focus on “Zero Waste to Landfill” efforts resulted in a reduction of disposal of typical wastes Operation of Vapor Recovery Units at many terminals across Buckeye Vapor Recovery Unit at Buckeye Wethersfield Terminal
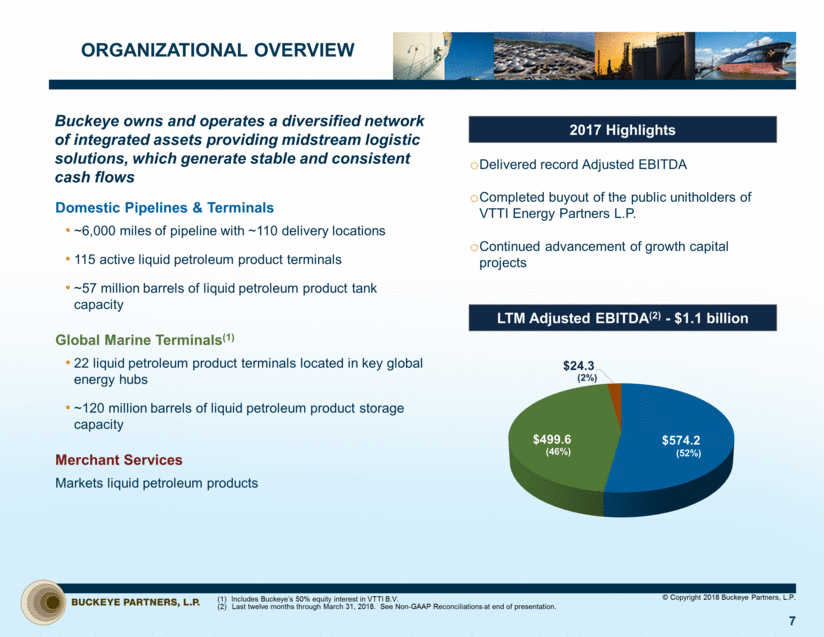
ORGANIZATIONAL OVERVIEW Domestic Pipelines & Terminals ~6,000 miles of pipeline with ~110 delivery locations 115 active liquid petroleum product terminals ~57 million barrels of liquid petroleum product tank capacity Global Marine Terminals(1) 22 liquid petroleum product terminals located in key global energy hubs ~120 million barrels of liquid petroleum product storage capacity Merchant Services Markets liquid petroleum products Buckeye owns and operates a diversified network of integrated assets providing midstream logistic solutions, which generate stable and consistent cash flows Delivered record Adjusted EBITDA Completed buyout of the public unitholders of VTTI Energy Partners L.P. Continued advancement of growth capital projects © Copyright 2018 Buckeye Partners, L.P. 7 Includes Buckeye’s 50% equity interest in VTTI B.V. Last twelve months through March 31, 2018. See Non-GAAP Reconciliations at end of presentation. LTM Adjusted EBITDA(2) - $1.1 billion (2%) (46%) (52%) 2017 Highlights $574.2 $499.6 $24.3
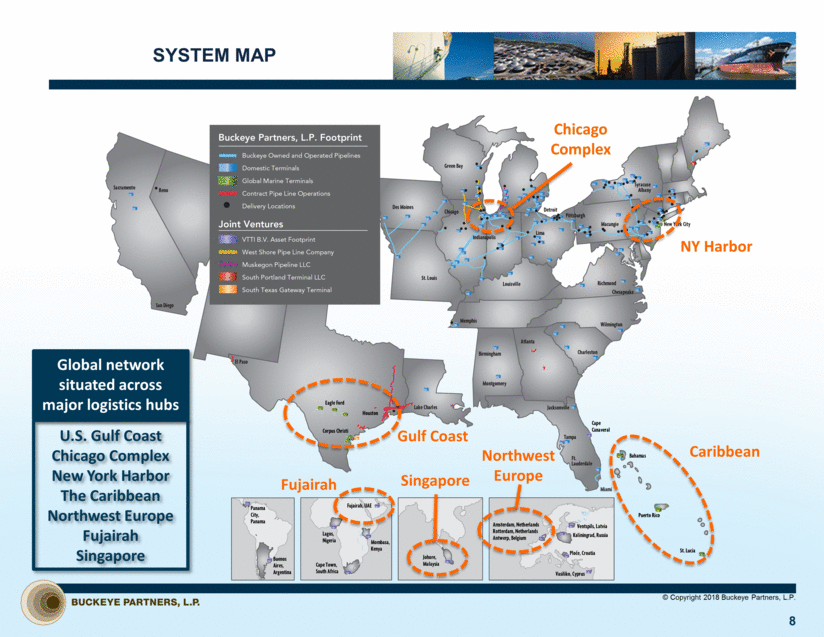
SYSTEM MAP 8 © Copyright 2018 Buckeye Partners, L.P. Chicago Complex NY Harbor Caribbean Gulf Coast Global network situated across major logistics hubs U.S. Gulf Coast Chicago Complex New York Harbor The Caribbean Northwest Europe Fujairah Singapore Fujairah Singapore Northwest Europe
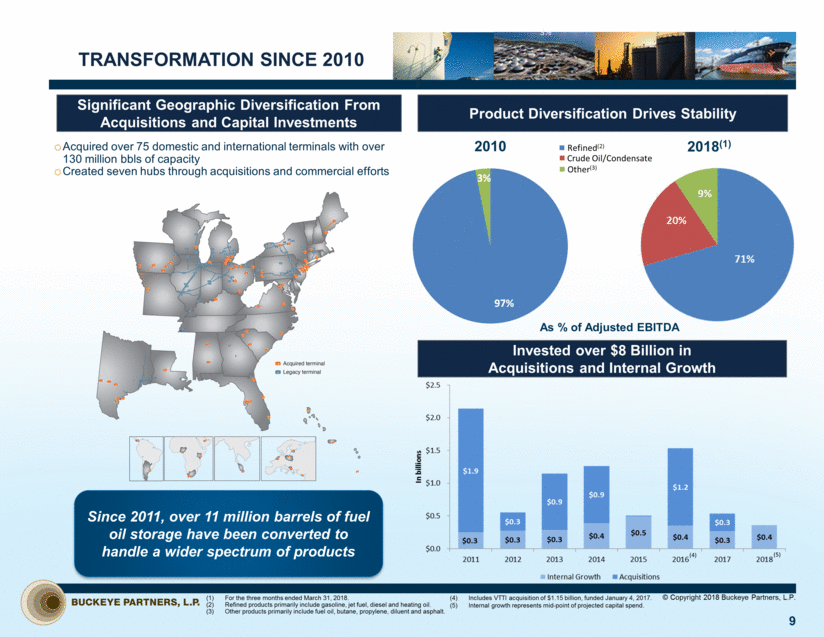
Acquired over 75 domestic and international terminals with over 130 million bbls of capacity Created seven hubs through acquisitions and commercial efforts TRANSFORMATION SINCE 2010 9 © Copyright 2018 Buckeye Partners, L.P. (4) Significant Geographic Diversification From Acquisitions and Capital Investments Invested over $8 Billion in Acquisitions and Internal Growth Product Diversification Drives Stability Since 2011, over 11 million barrels of fuel oil storage have been converted to handle a wider spectrum of products (5) For the three months ended March 31, 2018. Refined products primarily include gasoline, jet fuel, diesel and heating oil. Other products primarily include fuel oil, butane, propylene, diluent and asphalt. 3% Refined(2) Crude Oil/Condensate Other(3) 2010 2018(1) Includes VTTI acquisition of $1.15 billion, funded January 4, 2017. Internal growth represents mid-point of projected capital spend. As % of Adjusted EBITDA 97% 3%
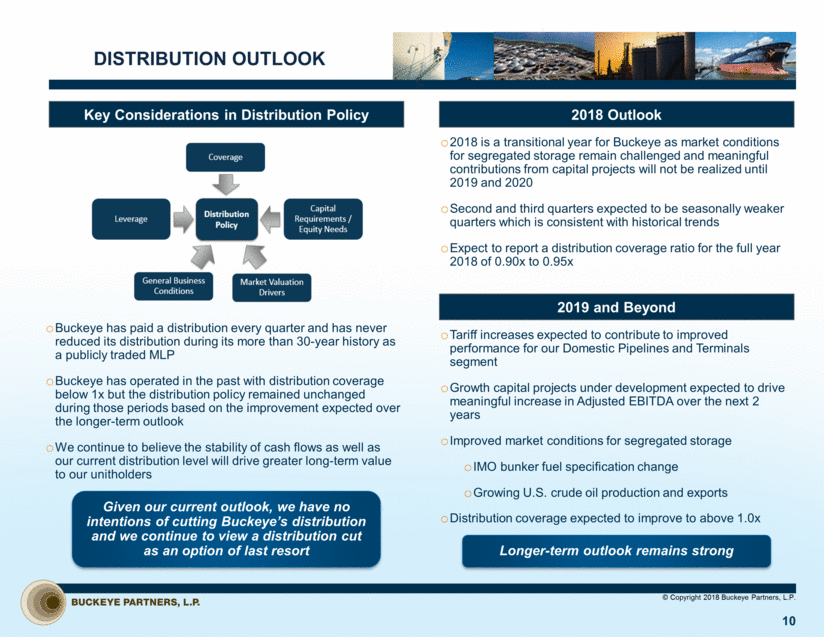
Buckeye has paid a distribution every quarter and has never reduced its distribution during its more than 30-year history as a publicly traded MLP Buckeye has operated in the past with distribution coverage below 1x but the distribution policy remained unchanged during those periods based on the improvement expected over the longer-term outlook We continue to believe the stability of cash flows as well as our current distribution level will drive greater long-term value to our unitholders DISTRIBUTION OUTLOOK 10 © Copyright 2018 Buckeye Partners, L.P. Key Considerations in Distribution Policy 2018 Outlook 2018 is a transitional year for Buckeye as market conditions for segregated storage remain challenged and meaningful contributions from capital projects will not be realized until 2019 and 2020 Second and third quarters expected to be seasonally weaker quarters which is consistent with historical trends Expect to report a distribution coverage ratio for the full year 2018 of 0.90x to 0.95x Given our current outlook, we have no intentions of cutting Buckeye’s distribution and we continue to view a distribution cut as an option of last resort 2019 and Beyond Tariff increases expected to contribute to improved performance for our Domestic Pipelines and Terminals segment Growth capital projects under development expected to drive meaningful increase in Adjusted EBITDA over the next 2 years Improved market conditions for segregated storage IMO bunker fuel specification change Growing U.S. crude oil production and exports Distribution coverage expected to improve to above 1.0x Longer-term outlook remains strong
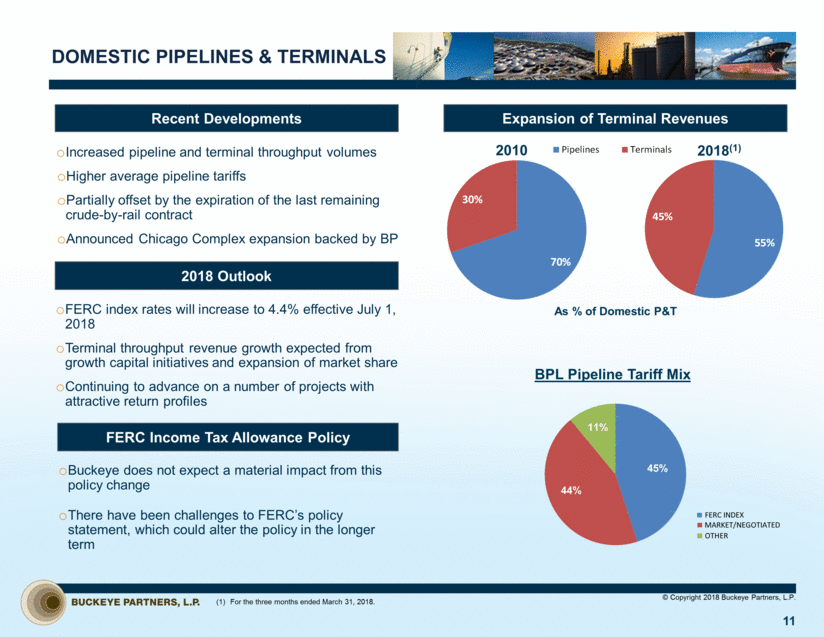
FERC index rates will increase to 4.4% effective July 1, 2018 Terminal throughput revenue growth expected from growth capital initiatives and expansion of market share Continuing to advance on a number of projects with attractive return profiles DOMESTIC PIPELINES & TERMINALS 11 Increased pipeline and terminal throughput volumes Higher average pipeline tariffs Partially offset by the expiration of the last remaining crude-by-rail contract Announced Chicago Complex expansion backed by BP For the three months ended March 31, 2018. © Copyright 2018 Buckeye Partners, L.P. FERC INDEX MARKET/NEGOTIATED OTHER Recent Developments Expansion of Terminal Revenues 2010 2018(1) FERC Income Tax Allowance Policy Buckeye does not expect a material impact from this policy change There have been challenges to FERC’s policy statement, which could alter the policy in the longer term 2018 Outlook As % of Domestic P&T BPL Pipeline Tariff Mix 55% 45% 70% 30% 35% 65% Pipelines Terminals 45% 44% 11%
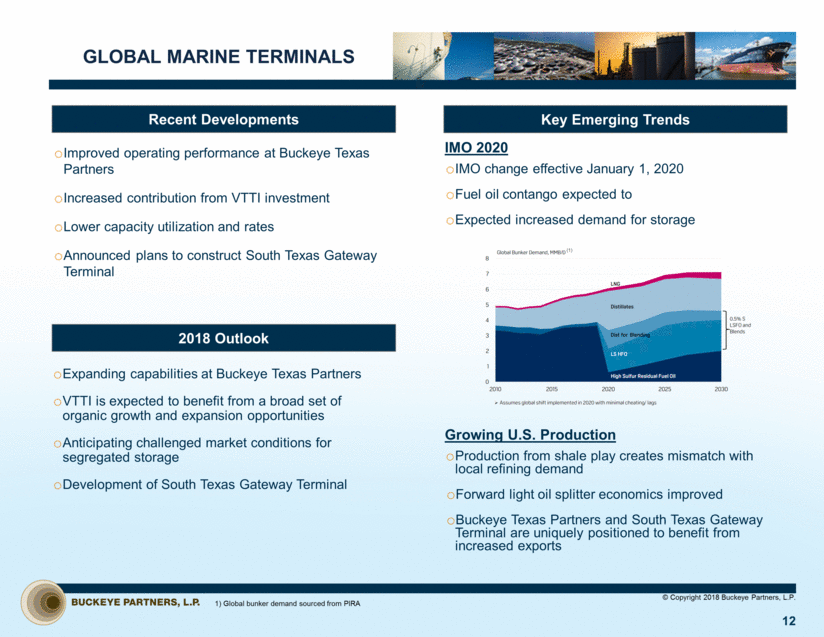
Expanding capabilities at Buckeye Texas Partners VTTI is expected to benefit from a broad set of organic growth and expansion opportunities Anticipating challenged market conditions for segregated storage Development of South Texas Gateway Terminal GLOBAL MARINE TERMINALS 12 Improved operating performance at Buckeye Texas Partners Increased contribution from VTTI investment Lower capacity utilization and rates Announced plans to construct South Texas Gateway Terminal © Copyright 2018 Buckeye Partners, L.P. IMO change effective January 1, 2020 Fuel oil contango expected to Expected increased demand for storage Production from shale play creates mismatch with local refining demand Forward light oil splitter economics improved Buckeye Texas Partners and South Texas Gateway Terminal are uniquely positioned to benefit from increased exports Recent Developments 2018 Outlook Key Emerging Trends 1) Global bunker demand sourced from PIRA (1) IMO 2020 Growing U.S. Production
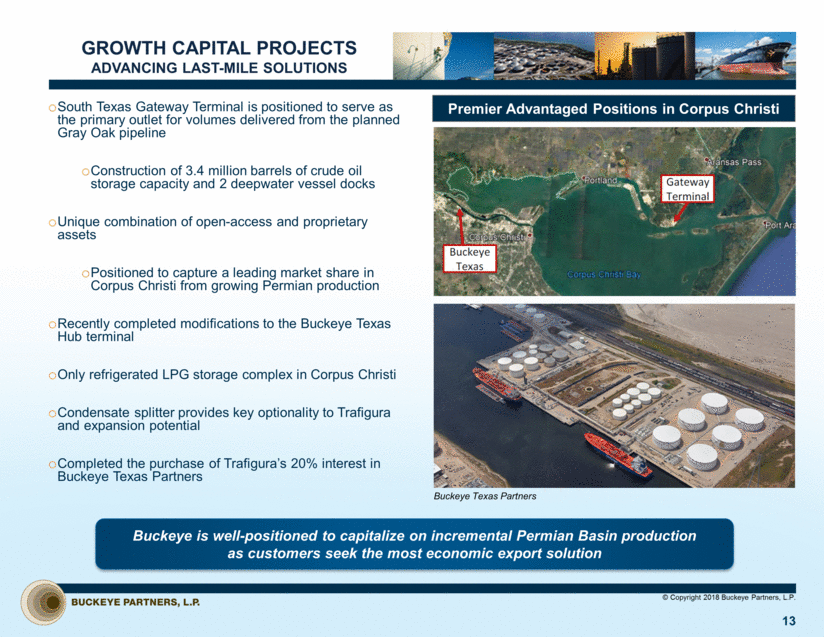
13 © Copyright 2018 Buckeye Partners, L.P. South Texas Gateway Terminal is positioned to serve as the primary outlet for volumes delivered from the planned Gray Oak pipeline Construction of 3.4 million barrels of crude oil storage capacity and 2 deepwater vessel docks Unique combination of open-access and proprietary assets Positioned to capture a leading market share in Corpus Christi from growing Permian production Recently completed modifications to the Buckeye Texas Hub terminal Only refrigerated LPG storage complex in Corpus Christi Condensate splitter provides key optionality to Trafigura and expansion potential Completed the purchase of Trafigura’s 20% interest in Buckeye Texas Partners GROWTH CAPITAL PROJECTS ADVANCING LAST-MILE SOLUTIONS Premier Advantaged Positions in Corpus Christi Buckeye Texas Partners Buckeye is well-positioned to capitalize on incremental Permian Basin production as customers seek the most economic export solution
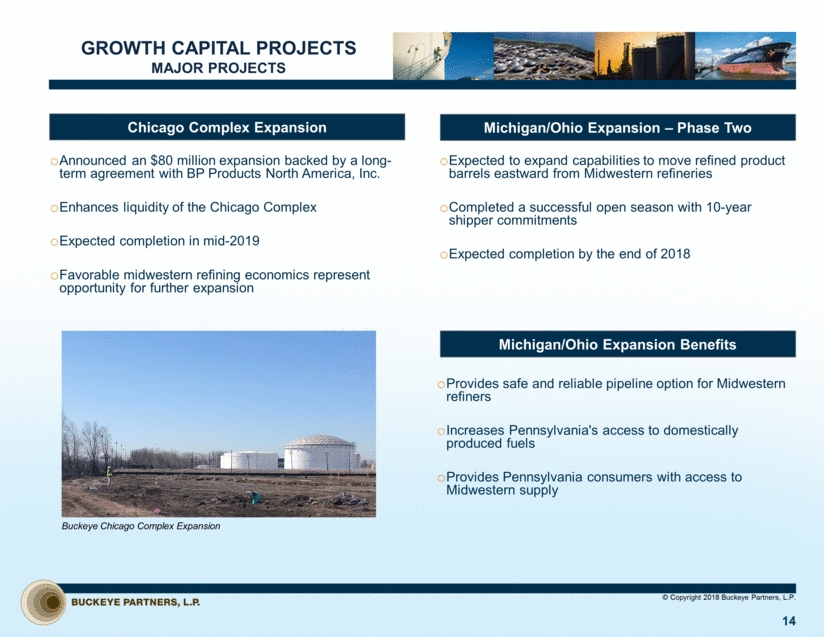
GROWTH CAPITAL PROJECTS MAJOR PROJECTS 14 © Copyright 2018 Buckeye Partners, L.P. Expected to expand capabilities to move refined product barrels eastward from Midwestern refineries Completed a successful open season with 10-year shipper commitments Expected completion by the end of 2018 Announced an $80 million expansion backed by a long-term agreement with BP Products North America, Inc. Enhances liquidity of the Chicago Complex Expected completion in mid-2019 Favorable midwestern refining economics represent opportunity for further expansion Michigan/Ohio Expansion – Phase Two Chicago Complex Expansion Provides safe and reliable pipeline option for Midwestern refiners Increases Pennsylvania's access to domestically produced fuels Provides Pennsylvania consumers with access to Midwestern supply Michigan/Ohio Expansion Benefits Buckeye Chicago Complex Expansion
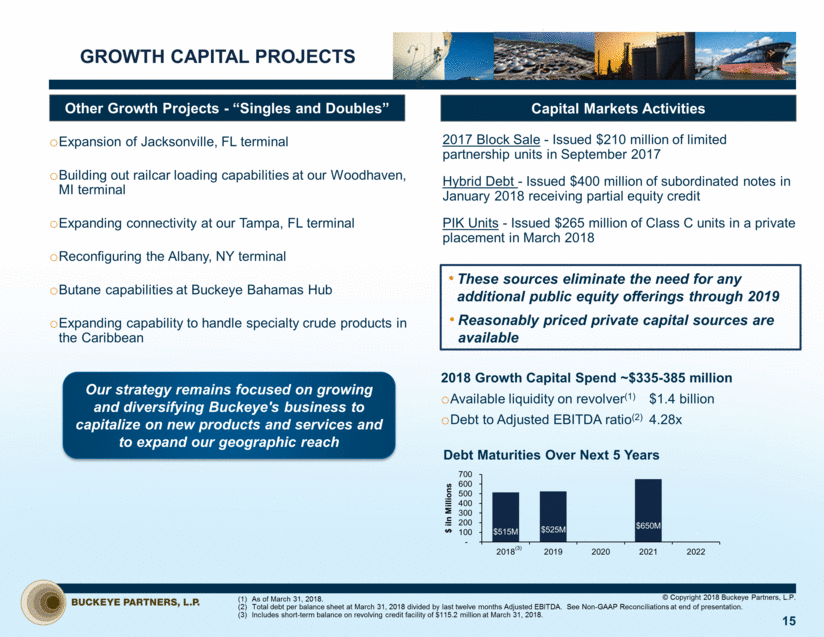
GROWTH CAPITAL PROJECTS 15 © Copyright 2018 Buckeye Partners, L.P. Expansion of Jacksonville, FL terminal Building out railcar loading capabilities at our Woodhaven, MI terminal Expanding connectivity at our Tampa, FL terminal Reconfiguring the Albany, NY terminal Butane capabilities at Buckeye Bahamas Hub Expanding capability to handle specialty crude products in the Caribbean Our strategy remains focused on growing and diversifying Buckeye's business to capitalize on new products and services and to expand our geographic reach 2018 Growth Capital Spend ~$335-385 million Available liquidity on revolver(1) $1.4 billion Debt to Adjusted EBITDA ratio(2) 4.28x As of March 31, 2018. Total debt per balance sheet at March 31, 2018 divided by last twelve months Adjusted EBITDA. See Non-GAAP Reconciliations at end of presentation. Includes short-term balance on revolving credit facility of $115.2 million at March 31, 2018. Other Growth Projects - “Singles and Doubles” Capital Markets Activities 2017 Block Sale - Issued $210 million of limited partnership units in September 2017 Hybrid Debt - Issued $400 million of subordinated notes in January 2018 receiving partial equity credit PIK Units - Issued $265 million of Class C units in a private placement in March 2018 Debt Maturities Over Next 5 Years (3) These sources eliminate the need for any additional public equity offerings through 2019 Reasonably priced private capital sources are available $515M $525M $650M - - 100 200 300 400 500 600 700 2018 2019 2020 2021 2022 $ iIn Millions
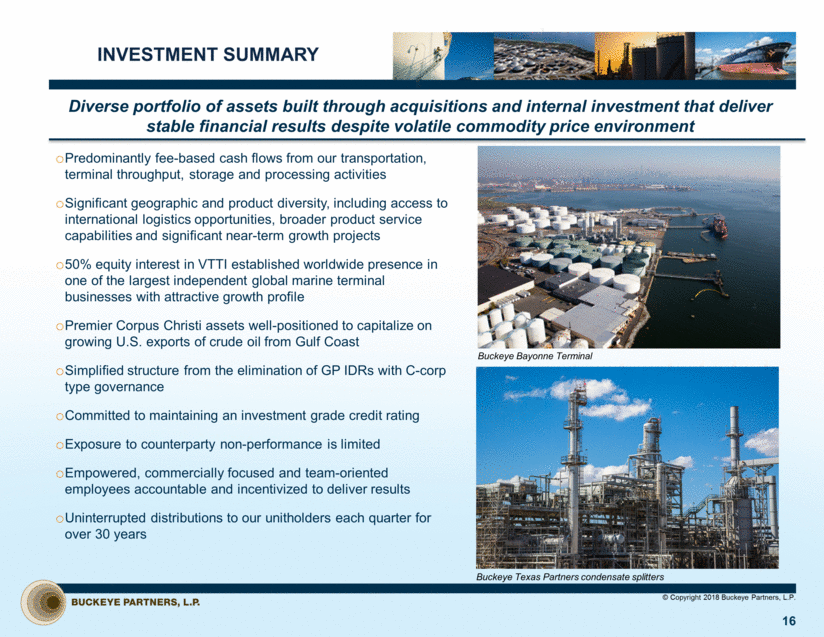
INVESTMENT SUMMARY 16 Buckeye Texas Partners condensate splitters Diverse portfolio of assets built through acquisitions and internal investment that deliver stable financial results despite volatile commodity price environment Predominantly fee-based cash flows from our transportation, terminal throughput, storage and processing activities Significant geographic and product diversity, including access to international logistics opportunities, broader product service capabilities and significant near-term growth projects 50% equity interest in VTTI established worldwide presence in one of the largest independent global marine terminal businesses with attractive growth profile Premier Corpus Christi assets well-positioned to capitalize on growing U.S. exports of crude oil from Gulf Coast Simplified structure from the elimination of GP IDRs with C-corp type governance Committed to maintaining an investment grade credit rating Exposure to counterparty non-performance is limited Empowered, commercially focused and team-oriented employees accountable and incentivized to deliver results Uninterrupted distributions to our unitholders each quarter for over 30 years © Copyright 2018 Buckeye Partners, L.P. Buckeye Bayonne Terminal
APPENDIX
FINANCIAL PERFORMANCE 2014 amounts represent Adjusted EBITDA from continuing operations and exclude the Natural Gas Storage business, which was divested in the fourth quarter of 2014. Last twelve months through March 31, 2018. See Non-GAAP Reconciliations at end of presentation. Distributable cash flow divided by cash distributions declared for the respective periods. © Copyright 2018 Buckeye Partners, L.P. Adjusted EBITDA (in millions)(1)(2) Cash Distribution Coverage Ratio(1)(2)(3) Debt to Adjusted EBITDA Ratio(2) Cash Distributions per Unit – Declared(2) 18
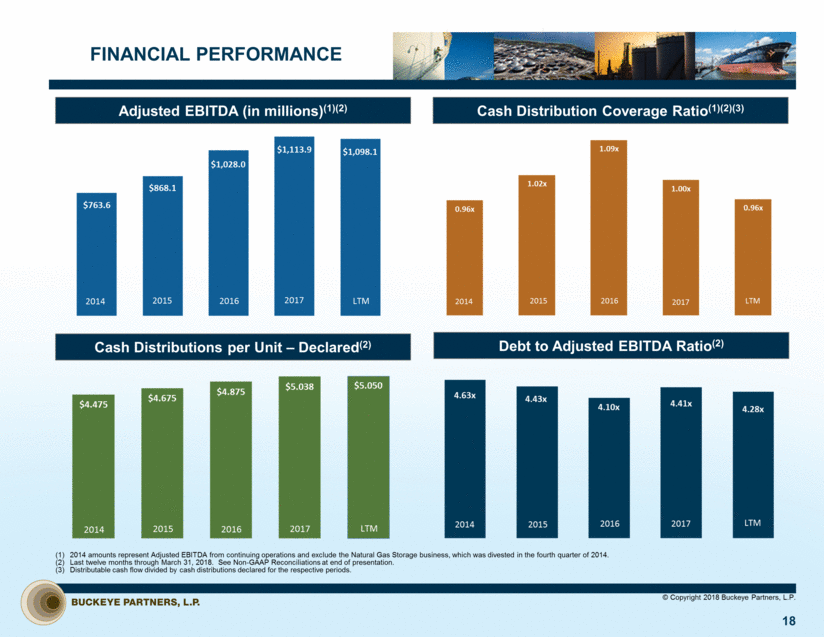
NON-GAAP RECONCILIATIONS(1) In millions, except ratios Amounts may not recalculate exactly due to rounding. Last twelve months through March 31, 2018. 2014 amounts exclude the Natural Gas Storage business, which was divested in the fourth quarter of 2014. Adjusted EBITDA by segment reflects adjustments to prior period information to conform to the current business segments as a result of changes to our operating structure in December 2015. Net income in 2014 and 2015 excludes losses from Discontinued Operations. Represents costs incurred at our BBH facility in the Bahamas, Yabucoa Terminal in Puerto Rico, Corpus Christi facilities in Texas, and certain terminals in Florida, as a result of hurricanes which occurred in 2016 and 2017, consisting of operating expenses and write-offs of damaged long-lived assets, net of insurance recoveries. © Copyright 2018 Buckeye Partners, L.P. The calculation of our proportionate share of the reconciling items used to derive these VTTI performance metrics is based upon our 50% equity interest in VTTI, prior to adjustments related to noncontrolling interests in several of its subsidiaries and partnerships, which are immaterial. Represents cash distributions declared for LP Units and for distribution equivalent rights with respect to certain unit-based compensation awards (“DERs”) outstanding as of each respective period. Amount for 2018 reflects estimated cash distributions for LP Units and DERs for the quarter ended March 31, 2018. 19 2014 2015 2016 2017 LTM (2) Adjusted EBITDA (3)(4) : Domestic Pipelines & Terminals $532.1 $522.2 $568.4 $573.0 $574.2 Global Marine Terminals 239.6 323.9 427.2 512.8 499.6 Merchant Services (8.1) 22.0 32.4 28.1 24.3 Adjusted EBITDA $763.6 $868.1 $1,028.0 $1,113.9 $1,098.1 Reconciliation of Net Income to Adjusted EBITDA and Distributable Cash Flow (3) : Net income (5) $334.5 $438.4 $548.7 $493.7 $484.4 Less: Net income attributable to non-controlling interests (1.9) (0.3) (13.1) (14.9) (16.8) Net income attributable to Buckeye Partners, L.P. 332.6 438.1 535.6 478.8 467.6 Add: Interest and debt expense 171.2 171.3 194.9 225.6 228.8 Income tax expense 0.5 0.9 1.5 0.9 1.1 Depreciation and amortization 196.4 221.3 254.7 269.2 267.9 Non-cash unit-based compensation expense 21.0 29.3 33.3 30.3 30.3 Acquisition and transition expense 13.0 3.1 8.2 4.2 3.5 Litigation contingency reserve 40.0 15.2 - - - Hurricane-related costs, net of recoveries (6) - - 16.8 5.8 4.0 Proportionate share of Adjusted EBITDA for the equity method investment in VTTI - - - 126.6 132.6 Less: Amortization of unfavorable storage contracts (11.1) (11.1) (6.0) - - Gains on property damage recoveries - - (5.7) (4.6) (18.7) Gain on sale of ammonia pipeline - - (5.3) - - Earnings from the equity method investment in VTTI (7) - - - (22.9) (18.9) Adjusted EBITDA $763.6 $868.1 $1,028.0 $1,113.9 $1,098.1 Less: Interest and debt expense, excluding amortization of deferred financing costs, debt discounts and other (156.7) (154.5) (178.1) (208.4) (212.1) Income tax (expense) benefit, excluding non-cash taxes (0.7) (1.6) 0.3 (0.3) (0.5) Maintenance capital expenditures (79.4) (99.6) (129.7) (144.0) (139.7) Proportionate share of VTTI’s interest expense, current income tax expense, realized foreign currency derivative gains and losses and maintenance capital expenditures - - - (43.9) (46.7) Add: Hurricane-related maintenance capital expenditures - - 6.1 14.6 11.1 Distributable cash flow $526.8 $612.4 $726.6 $731.9 $710.4 Distributions for coverage ratio (8) $549.5 $603.2 $664.2 $728.7 $739.2 Coverage Ratio 0.96x 1.02x 1.09x 1.00x 0.96x Reconciliation of Debt to Adjusted EBITDA Ratio: Line of credit $166.0 $111.5 - 252.2 $115.2 Long-term debt 3,368.6 3,732.8 4,217.7 4,658.3 4,587.9 Total debt $3,534.6 $3,844.3 $4,217.7 $4,910.5 $4,703.1 Adjusted EBITDA $763.6 $868.1 $1,028.0 $1,113.9 $1,098.1 Debt to Adjusted EBITDA Ratio 4.63x 4.43x 4.10x 4.41x 4.28x
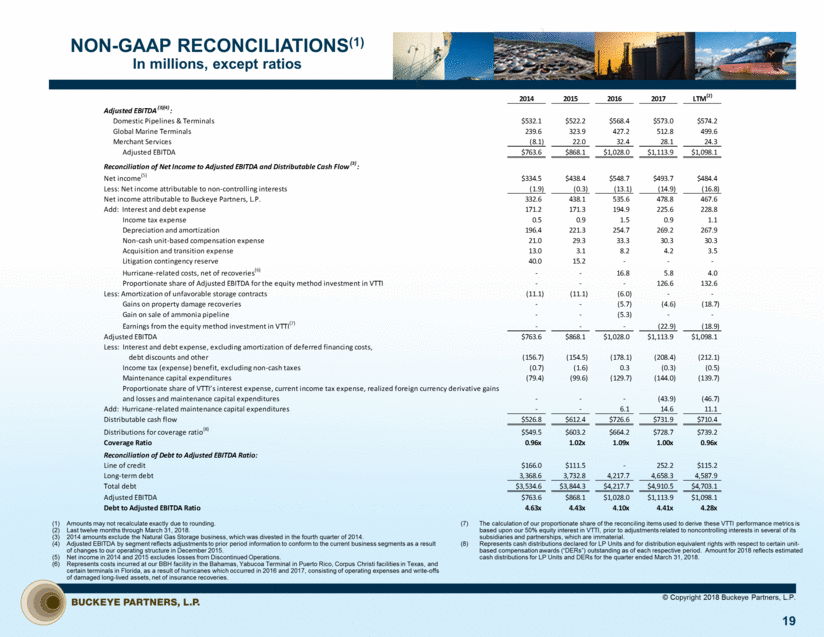
© Copyright 2018 Buckeye Partners, L.P. Adjusted EBITDA and distributable cash flow are measures not defined by accounting principles generally accepted in the United States of America (“GAAP”). We define Adjusted EBITDA as earnings before interest expense, income taxes, depreciation and amortization, further adjusted to exclude certain non-cash items, such as non-cash compensation expense; transaction, transition, and integration costs associated with acquisitions; certain gains and losses on foreign currency transactions and foreign currency derivative financial instruments, as applicable; and certain other operating expense or income items, reflected in net income, that we do not believe are indicative of our core operating performance results and business outlook, such as hurricane-related costs, gains and losses on property damage recoveries, and gains and losses on asset sales. We define distributable cash flow as Adjusted EBITDA less cash interest expense, cash income tax expense, and maintenance capital expenditures, that are incurred to maintain the operating, safety, and/or earnings capacity of our existing assets, plus or minus realized gains or losses on certain foreign currency derivative financial instruments, as applicable. These definitions of Adjusted EBITDA and distributable cash flow are also applied to our proportionate share in the Adjusted EBITDA and distributable cash flow of significant equity method investments, such as that in VTTI, B.V. (“VTTI”), and are not applied to our less significant equity method investments. The calculation of our proportionate share of the reconciling items used to derive these VTTI performance metrics is based upon our 50% equity interest in VTTI, prior to adjustments related to noncontrolling interests in several of its subsidiaries and partnerships, which are immaterial. These adjustments include gains and losses on foreign currency derivative financial instruments used to hedge VTTI’s United States dollar denominated distributions which are excluded from Adjusted EBITDA and included in distributable cash flow when realized. Adjusted EBITDA and distributable cash flow are non-GAAP financial measures that are used by our senior management, including our Chief Executive Officer, to assess the operating performance of our business and optimize resource allocation. We use Adjusted EBITDA as a primary measure to: (i) evaluate our consolidated operating performance and the operating performance of our business segments; (ii) allocate resources and capital to business segments; (iii) evaluate the viability of proposed projects; and (iv) determine overall rates of return on alternative investment opportunities. We use distributable cash flow as a performance metric to compare cash-generating performance of Buckeye from period to period and to compare the cash-generating performance for specific periods to the cash distributions (if any) that are expected to be paid to our unitholders. Distributable cash flow is not intended to be a liquidity measure. Buckeye believes that investors benefit from having access to the same financial measures used by senior management and that these measures are useful to investors because they aid in comparing Buckeye’s operating performance with that of other companies with similar operations. The Adjusted EBITDA and distributable cash flow data presented by Buckeye may not be comparable to similarly titled measures at other companies because these items may be defined differently by other companies. Please see the attached reconciliations of each of Adjusted EBITDA and distributable cash flow to net income. © Copyright 2018 Buckeye Partners, L.P. NON-GAAP FINANCIAL MEASURES 20