Attached files
| file | filename |
|---|---|
| 8-K - FORM 8-K - American Finance Trust, Inc | tv495905_8k.htm |
Exhibit 99.1
AMERICAN FINANCE TRUST 1 st Quarter 2018 Investor Presentation

2 The management team is continuing to execute on its strategy to increase the Company’s earnings and improve the portfolio’s overall quality, while maintaining an efficient capital structure AFIN continues to execute its property level and corporate level initiatives to enhance shareholder value Executive Summary (1) Excluding closing costs (2) Additional detail on leasing activity on page 7 (3) Portfolio net leverage was calculated using the following formula: (total debt – cash and cash equivalents) ÷ by real estate assets at cost » The Company has executed a significant number of property acquisitions and dispositions throughout the first quarter of 2018 ▪ Acquired 24 properties in Q1 ‘18 for an aggregate contract price of $44 million (1) ▪ Sold six properties in Q1 ’18, consisting of one BB&T/American Express office property and five SunTrust properties for an aggregate contract price of $63 million (1) » The Company has executed a significant number of leases in the first quarter of 2018 (2) » AFIN is well positioned to finance its growth initiatives and has a strong liquidity position ▪ AFIN’s Credit Facility was upsized to $415 million in April 2018, and $203 million was available for future borrowings following the closing ▪ AFIN’s cash balance was $71 million as of March 31, 2018 ▪ Portfolio net leverage of 37.4% (3) net debt to real estate assets at cost as of March 31, 2018 » Net Asset Value: On March 20, 2018, the Company’s independent directors unanimously approved an estimated per - share net asset value (“Estimated Per - Share NAV”) equal to $23.56 as of December 31, 2017 » On May 22, 2018, the Company announced that the REIT engaged BMO Capital Markets Corp. to provide strategic advice to the REI T related to its potential positioning in the public markets
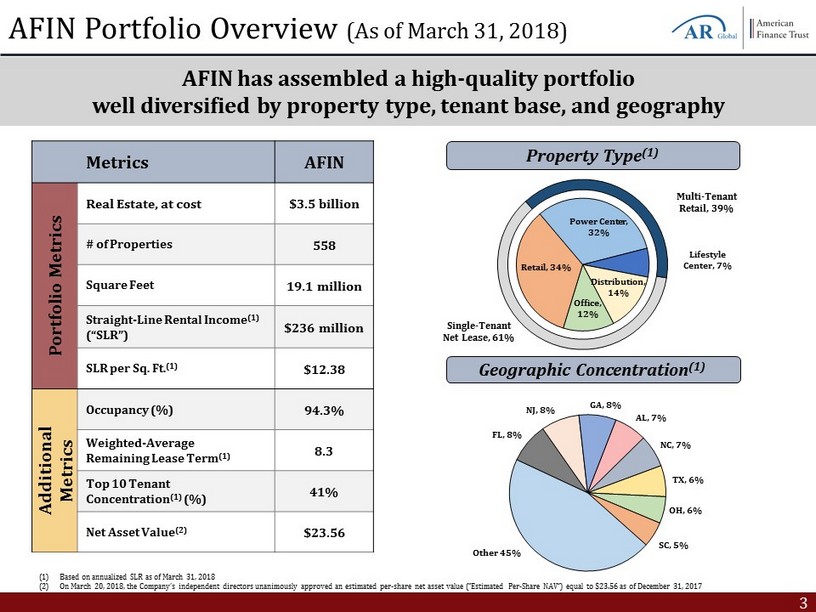
3 Retail, 34% Power Center , 32% Lifestyle Center , 7% Distribution , 14% Office , 12% AFIN Portfolio Overview (As of March 31, 2018) AFIN has assembled a high - quality portfolio well diversified by property type, tenant base, and geography (1) Based on annualized SLR as of March 31, 2018 (2) On March 20, 2018, the Company’s independent directors unanimously approved an estimated per - share net asset value (“Estimated P er - Share NAV”) equal to $23.56 as of December 31, 2017 Metrics AFIN Portfolio Metrics Real Estate, at cost $3.5 billion # of Properties 558 Square Feet 19.1 million Straight - Line Rental Income (1) (“SLR”) $236 million SLR per Sq. Ft. (1) $12.38 Additional Metrics Occupancy (%) 94.3% Weighted - Average Remaining Lease Term (1) 8.3 Top 10 Tenant Concentration (1) (%) 41% Net Asset Value (2) $23.56 Geographic Concentration (1) FL , 8% NJ , 8% GA , 8% AL , 7% NC , 7% TX , 6% OH , 6% SC , 5% Other 45% Property Type (1) Single - Tenant Net Lease, 61% Multi - Tenant Retail, 39%

4 AFIN Portfolio (As of March 31, 2018) Portfolio Lease Expiration Schedule (1) Top Tenant Overview (1) 1.1% 5.6% 5.9% 7.1% 4.6% 9.4% 6.0% 7.0% 6.6% 14.3% 32.1% 0% 5% 10% 15% 20% 25% 30% 35% 2018 2019 2020 2021 2022 2023 2024 2025 2026 2027 Thereafter Portfolio weighted - average lease term of 8.3 years (1) (1) Based on annualized SLR as of March 31, 2018. Remaining Tenants 9% 7% 5% 4% 3% 3% 3% 2% 2% 2% 59% 0% 10% 20% 30% 40% 50% 60% 70%
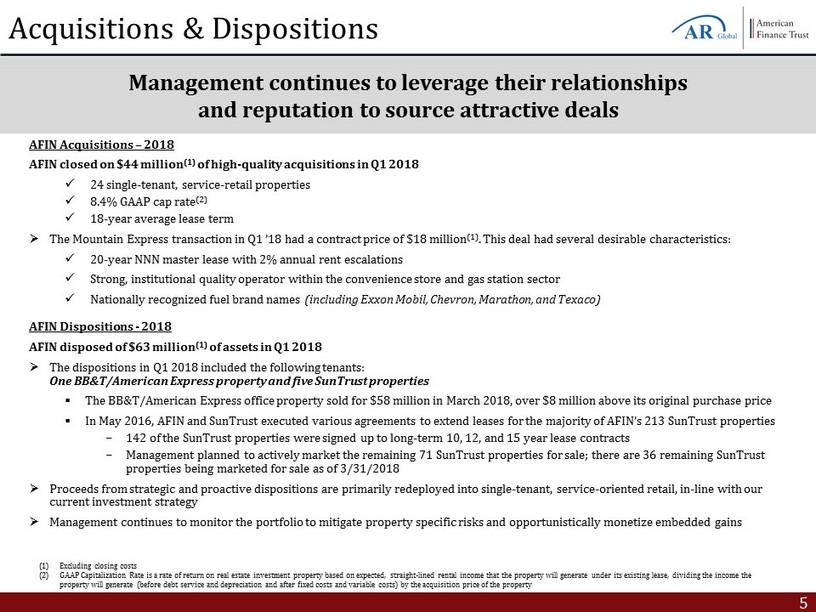
5 AFIN Acquisitions – 2018 AFIN closed on $44 million (1) of high - quality acquisitions in Q1 2018 x 24 single - tenant, service - retail properties x 8.4% GAAP cap rate (2) x 18 - year average lease term » The Mountain Express transaction in Q1 ’18 had a contract price of $18 million (1) . This deal had several desirable characteristics: x 20 - year NNN master lease with 2% annual rent escalations x Strong, institutional quality operator within the convenience store and gas station sector x Nationally recognized fuel brand names (including Exxon Mobil, Chevron, Marathon, and Texaco) AFIN Dispositions - 2018 AFIN disposed of $63 million (1) of assets in Q1 2018 » The dispositions in Q1 2018 included the following tenants: One BB&T/American Express property and five SunTrust properties ▪ The BB&T/American Express office property sold for $58 million in March 2018, over $8 million above its original purchase pri ce ▪ In May 2016, AFIN and SunTrust executed various agreements to extend leases for the majority of AFIN’s 213 SunTrust propertie s − 142 of the SunTrust properties were signed up to long - term 10, 12, and 15 year lease contracts − Management planned to actively market the remaining 71 SunTrust properties for sale; there are 36 remaining SunTrust properties being marketed for sale as of 3/31/2018 » Proceeds from strategic and proactive dispositions are primarily redeployed into single - tenant, service - oriented retail, in - line with our current investment strategy » Management continues to monitor the portfolio to mitigate property specific risks and opportunistically monetize embedded gai ns Acquisitions & Dispositions Management continues to leverage their relationships and reputation to source attractive deals (1) Excluding closing costs (2) GAAP Capitalization Rate is a rate of return on real estate investment property based on expected, straight - lined rental income that the property will generate under its existing lease, dividing the income the property will generate (before debt service and depreciation and after fixed costs and variable costs) by the acquisition pri ce of the property
6 Market Conditions Market Overview » Management will continue to evaluate both the single - tenant net lease and multi - tenant retail markets to grow AFIN’s high quality portfolio, with a specific focus on acquiring single - tenant, service - retail net lease assets » Current real estate market conditions are advantageous for AFIN, and the Company will continue to seek assets that provide shareholders with stability, growth and yield » AFIN will continue to leverage its reputation as an all cash buyer and expects to benefit from its strong pipeline of both on and off market transactions » AFIN has a conservative leverage profile, with net debt to total real estate assets at 37.4% (1) , and along with its upsized $415 million Credit Facility (2) , the Company has significant liquidity to help finance its operational and growth initiatives AFIN is well capitalized and able to take advantage of favorable buying opportunities (1) Portfolio net leverage was calculated using the following formula: (total debt – cash and cash equivalents) ÷ by real estate assets at cost. (2) The credit facility had $$203 million available for future borrowings following closing in April 2018.

7 Asset Management Capabilities AFIN remains focused on its leasing and asset management initiatives to further drive occupancy and increase cash flow » The leasing team successfully executed new and renewal leases as well as lease amendments for AFIN properties » AFIN’s net leasing activity (1) totaled nearly 300 thousand square feet in Q1 2018 Single - Tenant AFIN’s single - tenant portfolio has zero upcoming lease maturities in 2018 and 2019 (2) » SunTrust disposition plan for non - renewal properties remains on track, with five additional SunTrust properties sold in Q1 2018 » Limited lease maturity profile in the upcoming years, with only one single - tenant property having a lease maturity between 2018 and 2020 Multi - Tenant AFIN’s advisor has been working diligently in partnership with Lincoln Property Company (“Lincoln”) to ensure proper oversight of AFIN’s multi - tenant portfolio » AFIN’s advisor and Lincoln collaborate to perform ongoing reviews of the multi - tenant portfolio and communicate with top tenant relationships, especially those with near to mid - term lease rollover (1) Net leasing activity is calculated as new leases plus lease renewals/amendments less lease terminations. (2) Does not include 36 SunTrust properties which had lease terms that had expired as of March 31, 2018.
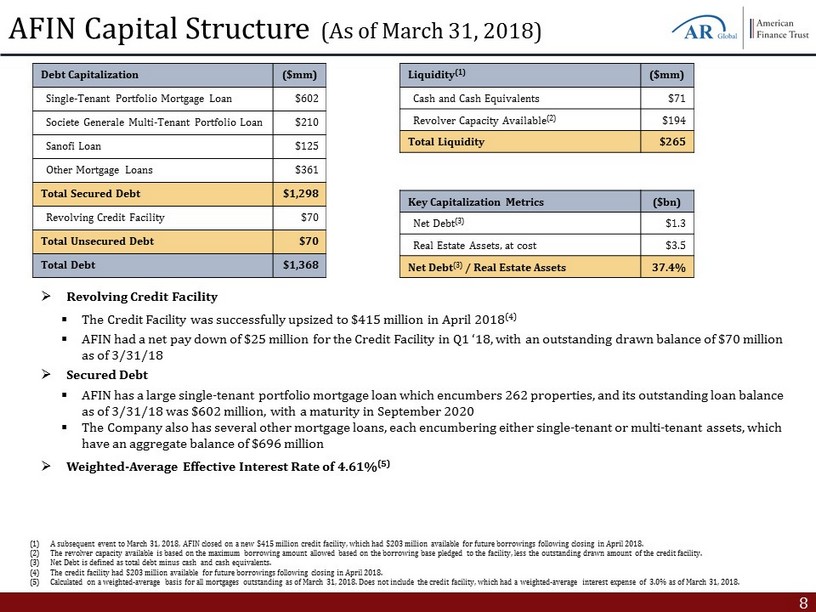
8 » Revolving Credit Facility ▪ The Credit Facility was successfully upsized to $415 million in April 2018 (4) ▪ AFIN had a net pay down of $25 million for the Credit Facility in Q1 ‘18, with an outstanding drawn balance of $70 million as of 3/31/18 » Secured Debt ▪ AFIN has a large single - tenant portfolio mortgage loan which encumbers 262 properties, and its outstanding loan balance as of 3/31/18 was $602 million, with a maturity in September 2020 ▪ The Company also has several other mortgage loans, each encumbering either single - tenant or multi - tenant assets, which have an aggregate balance of $696 million » Weighted - Average Effective Interest Rate of 4.61 % (5) AFIN Capital Structure (As of March 31, 2018) Debt Capitalization ($mm) Single - Tenant Portfolio Mortgage Loan $602 Societe Generale Multi - Tenant Portfolio Loan $210 Sanofi Loan $125 Other Mortgage Loans $361 Total Secured Debt $1,298 Revolving Credit Facility $70 Total Unsecured Debt $70 Total Debt $1,368 Liquidity (1) ($mm) Cash and Cash Equivalents $71 Revolver Capacity Available (2) $194 Total Liquidity $265 Key Capitalization Metrics ($bn) Net Debt (3) $1.3 Real Estate Assets, at cost $3.5 Net Debt (3) / Real Estate Assets 37.4% (1) A subsequent event to March 31, 2018, AFIN closed on a new $415 million credit facility, which had $203 million available for fu ture borrowings following closing in April 2018 . (2) The revolver capacity available is based on the maximum borrowing amount allowed based on the borrowing base pledged to the f aci lity, less the outstanding drawn amount of the credit facility. (3) Net Debt is defined as total debt minus cash and cash equivalents. (4) The credit facility had $203 million available for future borrowings following closing in April 2018. (5) Calculated on a weighted - average basis for all mortgages outstanding as of March 31, 2018. Does not include the credit facility, which had a weighted - average interest expense of 3.0% as of March 31, 2018.

9 Experienced Management Michael Weil Chief Executive Officer, President and Chairman of the Board of Directors ▪ Founding partner of AR Global ▪ Previously served as Senior VP of sales and leasing for American Financial Realty Trust (“AFRT”) ▪ Served as president of the Board of Directors of the Real Estate Investment Securities Association (“REISA”) Jason Slear Senior Vice President of Real Estate Acquisitions and Dispositions ▪ Responsible for sourcing, negotiating, and closing AR Global's real estate acquisitions and dispositions ▪ Formerly east coast territory director for AFRT where he was responsible for the disposition and leasing activity for a porti on of AFRT's 37.3 million square foot portfolio Michael Ead Managing Director and Counsel ▪ Joined AR Global as Assistant General Counsel in June 2013 ▪ Formerly worked at Proskauer Rose LLP for 9 years, practicing commercial real estate law, and representing clients in the acquisition, disposition, financing and leasing of properties throughout the United States and Puerto Rico Zachary Pomerantz Senior Vice President of Asset Management ▪ Former Asset Manager for New York REIT (“NYRT”), a nearly 2.0 million square foot portfolio of New York City properties ▪ Previously worked at ProMed Properties, Swig Equities, Tishman Speyer and Mall Properties Katie Kurtz Chief Financial Officer, Treasurer and Secretary ▪ Previously served as chief accounting officer at Carlyle GMS Finance, Inc., The Carlyle Group’s business development company, Director of Finance and Controller for New Mountain Finance Corporation, and Controller at Solar Capital Ltd ▪ Ms. Kurtz began her career at PricewaterhouseCoopers, LLP ▪ Ms. Kurtz is a certified public accountant in New York State

10 Forward - Looking Statements & Risk Factors Certain statements made in this presentation are “forward - looking statements” (as defined in Section 21 E of the Exchange Act), which reflect the expectations of the Company regarding future events . The forward - looking statements involve a number of risks, uncertainties and other factors that could cause actual results to differ materially from those contained in the forward - looking statements . Such forward - looking statements include, but are not limited to, market and other expectations, objectives, and intentions, as well as any other statements that are not historical facts . Our potential risks and uncertainties are presented in the section titled “Item 1 A . Risk Factors” disclosed in our Annual Report on Form 10 - K for the year ended December 31 , 2017 and our Quarterly Reports on Form 10 - Q filed from time to time . We disclaim any obligation to update and revise statements contained in these materials to reflect change assumptions, the occurrence of unanticipated events or changes to future operating results over time, unless required by law . The following are some of the risks and uncertainties relating to us, although not all risks and uncertainties, that could cause our actual results to differ materially from those presented in our forward - looking statements : • The anticipated benefits from the merger with American Realty Capital - Retail Centers of America, Inc. (“RCA”) may not be reali zed or may take longer to realize than expected. • All of our executive officers are also officers, managers, employees or holders of a direct or indirect controlling interest in the Advisor or other entities under common control with AR Global Investments, LLC (the successor business to AR Capital, LLC, “AR Global”). As a result, our exe cut ive officers, the Advisor and its affiliates face conflicts of interest, including significant conflicts created by the Advisor’s compensation arrangements wi th us and other investment programs advised by affiliates of AR Global and conflicts in allocating time among these entities and us, which could negativ ely impact our operating results. • Although we have announced our intention to list our common stock on an exchange at a time yet to be determined, there can be no assurance that our common stock will be listed or of the price at which our common stock may trade. No public market currently exists, or may ev er exist, for shares of our common stock and shares of our common stock are, and may continue to be, illiquid. • Lincoln Retail REIT Services, LLC (“Lincoln”) and its affiliates, which provide services to the Advisor in connection with ou r r etail portfolio, faces conflicts of interest in allocating its employees’ time between providing real estate - related services to the Advisor and other programs and activities in which they are presently involved or may be involved in the future. • The performance of our retail portfolio is linked to the market for retail space generally and factors that may impact our re tai l tenants, such as the increasing use of the Internet by retailers and consumers. • We depend on tenants for our rental revenue and, accordingly, our rental revenue is dependent upon the success and economic v iab ility of our tenants. • We have not generated, and in the future may not generate, operating cash flows sufficient to fund all of the distributions w e p ay our stockholders, and, as such, we may be forced to fund distributions from other sources, including borrowings, which may not be available on favorabl e t erms, or at all. • We may be unable to pay or maintain cash distributions at the current rate or increase distributions over time. • We are obligated to pay fees, which may be substantial, to the Advisor and its affiliates. • We are subject to risks associated with any dislocation or liquidity disruptions that may exist or occur in the credit market s o f the United States of America. • We may fail to continue to qualify to be treated as a real estate investment trust for U.S. federal income tax purposes (“REI T”) , which would result in higher taxes, may adversely affect our operations and would reduce the value of an investment in our common stock and our cash avail abl e for distributions. • We may be deemed by regulators to be an investment company under the Investment Company Act of 1940, as amended (the “Investm ent Company Act”), and thus subject to regulation under the Investment Company Act.

AmericanFinanceTrust.com ▪ For account information, including balances and the status of submitted paperwork, please call us at (866) 902 - 0063 ▪ Financial Advisors may view client accounts, statements and tax forms at www.dstvision.com ▪ Shareholders may access their accounts at www.ar - global.com