Attached files
| file | filename |
|---|---|
| EX-31.1 - EX-31.1 - MULTI COLOR Corp | d482675dex311.htm |
| EX-32.2 - EX-32.2 - MULTI COLOR Corp | d482675dex322.htm |
| EX-32.1 - EX-32.1 - MULTI COLOR Corp | d482675dex321.htm |
| EX-31.2 - EX-31.2 - MULTI COLOR Corp | d482675dex312.htm |
| EX-23 - EX-23 - MULTI COLOR Corp | d482675dex23.htm |
| EX-21 - EX-21 - MULTI COLOR Corp | d482675dex21.htm |
UNITED STATES
SECURITIES AND EXCHANGE COMMISSION
Washington, D.C. 20549
FORM 10-K
| ☒ | ANNUAL REPORT PURSUANT TO SECTION 13 OR 15(d) OF THE SECURITIES EXCHANGE ACT OF 1934 |
For the fiscal year ended March 31, 2018
OR
| ☐ | TRANSITION REPORT PURSUANT TO SECTION 13 OR 15(d) OF THE SECURITIES EXCHANGE ACT OF 1934 |
Commission File Number 0-16148
MULTI-COLOR CORPORATION
| Incorporated in the State of Ohio |
IRS Employer Identification Number 31-1125853 | |
| 4053 Clough Woods Dr. Batavia, OH 45103 |
Name of Each Exchange on Which Registered NASDAQ Global Select Market | |
| (Address of principal executive offices) | ||
(513) 381-1480
Securities registered pursuant to Section 12(b) of the Act: Common Stock, no par value
Securities registered pursuant to Section 12(g) of the Act: None
Indicate by check mark if the registrant is a well-known seasoned issuer, as defined in Rule 405 of the Securities Act. Yes ☒ No ☐
Indicate by check mark if the registrant is not required to file reports pursuant to Section 13 or 15(d) of the Act. Yes ☐ No ☒
Indicate by check mark whether the registrant (1) has filed all reports required to be filed by Section 13 or 15(d) of the Securities Exchange Act of 1934 during the preceding 12 months (or for such shorter period that the registrant was required to file such reports), and (2) has been subject to such filing requirements for the past 90 days. Yes ☒ No ☐
Indicate by check mark whether the registrant has submitted electronically and posted on its corporate Website, if any, every Interactive Data File required to be submitted and posted pursuant to Rule 405 of Regulation S-T during the preceding 12 months (or for such shorter period that the registrant was required to submit and post such files). Yes ☒ No ☐
Indicate by check mark if disclosure of delinquent filers pursuant to Item 405 of Regulation S-K is not contained herein, and will not be contained, to the best of the registrant’s knowledge, in definitive proxy or information statements incorporated by reference in Part III of this Form 10-K or any amendment to this Form 10-K . ☒
Indicate by check mark whether the registrant is a large accelerated filer, an accelerated filer, a non-accelerated filer, or a smaller reporting company. See the definitions of “large accelerated filer,” ”accelerated filer” and “smaller reporting company” in Rule 12b-2 of the Exchange Act.
| Large accelerated filer | ☒ | Accelerated filer | ☐ | |||
| Non-accelerated filer | ☐ | Smaller reporting company | ☐ | |||
| Emerging growth company | ☐ | |||||
If an emerging growth company, indicate by check mark if the registrant has elected not to use the extended transition period for complying with any new or revised financial accounting standards provided pursuant to Section 13(a) of the Exchange Act. ☐
Indicate by check mark whether the registrant is a shell company (as defined in Rule 12b-2 of the Act). Yes ☐ No ☒
The aggregate market value of the voting and non-voting common equity held by non-affiliates was approximately $1,138,856,200 based upon the closing price of $81.95 per share of Common Stock on the NASDAQ Global Select Market as of September 29, 2017, the last business day of the registrant’s most recently completed second fiscal quarter.
As of April 30, 2018, 20,454,965 shares of no par value Common Stock were outstanding.
DOCUMENTS INCORPORATED BY REFERENCE
Portions of the registrant’s proxy statement to be filed pursuant to Regulation 14A of the Exchange Act for its 2018 Annual Meeting of Shareholders to be held on August 8, 2018 are incorporated by reference into Part III of this Form 10-K.
Table of Contents
| Part I |
Page | |||||||||||
| Item 1 | - | 4 | ||||||||||
| Item 1A | - | 8 | ||||||||||
| Item 1B | - | 14 | ||||||||||
| Item 2 | - | 15 | ||||||||||
| Item 3 | - | 17 | ||||||||||
| Item 4 | - | 17 | ||||||||||
| Part II |
||||||||||||
| Item 5 | - | 18 | ||||||||||
| Item 6 | - | 20 | ||||||||||
| Item 7 | - | Management’s Discussion and Analysis of Financial Condition and Results of Operations |
21 | |||||||||
| Item 7A | - | 31 | ||||||||||
| Item 8 | - | 32 | ||||||||||
| Item 9 | - | Changes in and Disagreements with Accountants on Accounting and Financial Disclosure |
71 | |||||||||
| Item 9A | - | 72 | ||||||||||
| Item 9B | - | 72 | ||||||||||
| Part III |
||||||||||||
| Item 10 | - | 73 | ||||||||||
| Item 11 | - | 73 | ||||||||||
| Item 12 | - | Security Ownership of Certain Beneficial Owners and Management and Related Stockholder Matters |
73 | |||||||||
| Item 13 | - | Certain Relationships and Related Transactions, and Director Independence |
73 | |||||||||
| Item 14 | - | 73 | ||||||||||
| Part IV |
||||||||||||
| Item 15 | - | 73 | ||||||||||
| Item 16 | - | 75 | ||||||||||
2
FORWARD-LOOKING STATEMENTS
This report contains certain statements that are not historical facts that constitute forward-looking statements within the meaning of the Private Securities Litigation Reform Act of 1995, and that are intended to be covered by the safe harbors created by that Act. All statements contained in this Form 10-K other than statements of historical fact are forward-looking statements. Forward-looking statements include statements regarding our future financial position, business strategy, budgets, projected costs, plans and objectives of management for future operations. The words “may,” “continue,” “estimate,” “intend,” “plan,” “will,” “believe,” “project,” “expect,” “anticipate” and similar expressions (as well as the negative versions thereof) may identify forward-looking statements, but the absence of these words does not necessarily mean that a statement is not forward-looking. With respect to the forward-looking statements, we claim the protection of the safe harbor for forward-looking statements contained in the Private Securities Litigation Reform Act of 1995. Reliance should not be placed on forward-looking statements because they involve known and unknown risks, uncertainties and other factors which may cause actual results, performance or achievements to differ materially from those expressed or implied. Such forward-looking statements speak only as of the date made. The Company undertakes no obligation to update any forward-looking statements to reflect events or circumstances after the date on which they are made.
Statements concerning expected financial performance, on-going business strategies, and possible future actions which the Company intends to pursue in order to achieve strategic objectives constitute forward-looking information. Implementation of these strategies and the achievement of such financial performance are each subject to numerous conditions, uncertainties and risk factors, including those contained in Item 1A in “Risk Factors.” Factors which could cause actual performance by the Company to differ materially from these forward-looking statements include, without limitation: factors discussed in conjunction with a forward-looking statement; changes in global economic and business conditions; changes in business strategies or plans; raw material cost pressures; availability of raw materials; availability to pass raw material cost increases to our customers; interruption of business operations; changes in, or the failure to comply with, government regulations, legal proceedings and developments, including, but not limited to, tax law changes; acceptance of new product offerings, services and technologies; new developments in packaging; our ability to effectively manage our growth and execute our long-term strategy; our ability to manage foreign operations and the risks involved with them, including compliance with applicable anti-corruption laws; currency exchange rate fluctuations; our ability to manage global political uncertainty; terrorism and political unrest; increases in general interest rate levels and credit market volatility affecting our interest costs; competition within our industry; our ability to consummate and successfully integrate acquisitions; our ability to recognize the benefits of acquisitions, including potential synergies and cost savings; failure of an acquisition or acquired company to achieve its plans and objectives generally; risk that proposed or consummated acquisitions may disrupt operations or pose difficulties in employee retention or otherwise affect financial or operating results; risk that some of our goodwill may be or later become impaired; the success and financial condition of our significant customers; dependence on information technology; our ability to market new products; our ability to maintain an effective system of internal control; ongoing claims, lawsuits and governmental proceedings, including environmental proceedings; availability, terms and developments of capital and credit; dependence on key personnel; quality of management; our ability to protect our intellectual property and the potential for intellectual property litigation; employee benefit costs; and risk associated with significant leverage. The Company undertakes no obligation to publicly update or revise any forward-looking statements, whether as a result of new information, future events or otherwise.
3
PART I
| ITEM 1. | BUSINESS |
(In thousands, except for statistical data)
OVERVIEW
Multi-Color Corporation (Multi-Color, MCC, we, us, our or the Company), headquartered near Cincinnati, Ohio, is a leader in global label solutions supporting a number of the world’s most prominent brands including leading producers of home & personal care, wine & spirits, food & beverage, healthcare and specialty consumer products. MCC serves international brand owners in the North American, Latin American, EMEA (Europe, Middle East and Africa) and Asia Pacific regions with a comprehensive range of the latest label technologies in Pressure Sensitive, Cut and Stack, In-Mold, Shrink Sleeve, Heat Transfer, Roll Fed, and Aluminum Labels.
The Company was incorporated in 1985, succeeding the predecessor business. Our corporate offices are located at 4053 Clough Woods Drive, Batavia, Ohio 45103 and our telephone number is (513) 381-1480.
Our common stock, no par value, is listed on the NASDAQ Global Select Market under the symbol “LABL”. See “Item 5 – Market for Registrant’s Common Equity, Related Stockholder Matters and Issuer Purchases of Equity Securities.” We maintain a website (www.mcclabel.com), which includes additional information about the Company. The website includes corporate governance information for our shareholders and our Code of Ethics can be found under the corporate governance section. Information on the website is not part of this Form 10-K. Shareholders can also obtain on and through our website, free of charge, our annual report on Form 10-K, quarterly reports on Form 10-Q, current reports on Form 8-K and any amendments to those reports filed or furnished pursuant to Section 13(a) or 15(d) of the Securities Exchange Act of 1934 as soon as reasonably practicable after the Company electronically files such materials with or furnishes such materials to the Securities and Exchange Commission (SEC). Any of these documents may be read and copied at the SEC’s Public Reference Room at 100 F Street NE, Washington, D.C. 20549. Information regarding the operation of the SEC Public Reference Room may be obtained by calling 1-800-SEC-0330. The Company’s filed documents may also be accessed via the SEC Internet site at http://www.sec.gov.
References to 2018, 2017 and 2016 are for the fiscal years ended March 31, 2018, 2017 and 2016, respectively.
PRODUCTS AND SERVICES
The Company provides a wide range of products for the packaging needs of our customers and is one of the world’s largest producers of high quality pressure sensitive, in-mold and heat transfer labels and a major manufacturer of cut and stack, roll fed, aluminum and shrink sleeve labels. The Company also provides a full complement of print methods including rotogravure, lithographic, flexographic, digital and a combination of flexographic and screen printing, plus in-house pre-press services.
Pressure Sensitive Labels:
Pressure sensitive labels adhere to a surface with pressure. The label typically consists of four elements – a substrate, which may include paper, foil or plastic; an adhesive, which may be permanent or removable; a release coating; and a backing material to protect the adhesive against premature contact with other surfaces. The release coating and protective backing are removed prior to application to the container, exposing the adhesive, and the label is pressed or rolled into place. Innovative features of this product include promotional neckbands, peel-away coupons, resealable labels, see-through window graphics, and holographic foil enhancements to cold and hot foil stamping.
Pressure sensitive labels are the largest category of the overall label market and provide an extremely versatile, low-cost application that is able to produce sharp, bright colors in a wide variety of applications. We are one of the world’s largest producers of high quality pressure sensitive labels and this market represents a significant growth opportunity for us.
In-Mold Labels (IML):
The in-mold label process applies a label to a plastic container as the container is being formed in the mold cavity. The finished IML product is a finely detailed label that performs consistently well for plastic container manufacturers and adds marketing value and product security for consumer product companies.
Each component of the IML production process requires a special expertise for success. The components include the substrate (the base material for the label), inks, overcoats, varnishes and adhesives. We believe we are unique in the industry in that we manufacture IMLs on rotogravure, flexographic and lithographic printing presses. There are several critical characteristics of a successful IML: the material needs a proper coefficient of friction so that the finished label is easily and consistently picked up and applied to the injection or blow-molded container, the substrate must be able to hold the label’s inks, including metallics and fluorescents, overlay varnishes and adhesives and the material must be able to lay smoothly, without wrinkle or bulge, when applied to a very hot, just molded plastic container that will quickly shrink, along with the label, as its temperature falls. We continually search for alternate substrates to be used in the IML process in order to improve label performance and capabilities, as well as to reduce substrate costs. Technical innovations in this area include the use of peel-away IML coupons and scented and holographic labels.
4
Heat Transfer Labels (HTL):
HTL are reverse printed and transferred from a special release liner onto the container using heat and pressure. The labels are a composition of inks and lacquers tailored to the customer’s specific needs. These labels are printed and then shipped to blow molders and/or contract decorators who transfer the labels to the containers. Once applied, the labels are permanently adhered to the container. The graphics capabilities include fine vignettes, metallic and thermochromatic inks, as well as the patented “frost”, giving an acid-etch appearance.
Therimage™ is our pioneer heat transfer label technology developed primarily for applications involving plastic containers serving the home & personal care and food & beverage consumer markets. Our Clear ADvantage™ brand enables us to provide premium graphics on both glass and plastic containers facilitating the highly sought after “no label” look for the health and beauty aid, beverage, personal care, household chemical and promotional markets. Our “ink only” and flameless HTL technology have increased our capabilities in this area. Flameless technology enables us to provide a solution to customers who want to remove open flames from their operations, which are normally required to pre-treat and post-treat containers for Therimage™ and Clear ADvantage™ products. Flameless technology has applications in all the aforementioned markets.
Cut and Stack:
Cut and stack labels are adhered to containers using an adhesive applied during the labeling process. These labels are an attractive and cost-effective choice for high volume applications. These labels can be produced on a wide variety of substrates and accommodate a comprehensive range of embellishments including foil stamping, embossing, metallics and unique varnish finishes.
Our innovations within cut and stack labels include peel-away promotional labels, thermochromics, holographics and metalized films. We also offer promotional products such as scratch-off coupons and static-clings.
Roll Fed:
Roll fed labels can be applied to any type of container and offer customers optimum space for brand presentation at a competitive price. Our roll fed labels are highly resistant to tearing and moisture and can be printed in brilliant colors with a wide range of special effects using thermochromic inks and interactive technologies.
Shrink Sleeve Labels:
Shrink sleeve labels are produced in colorful, cutting edge styles and materials. The labels are manufactured as sleeves, slid over glass or plastic bottles and then heated to conform precisely to the contours of the container. This label type is increasingly popular with consumer goods companies such as beverage manufacturers as it allows for product differentiation as well as having a 360-degree label and tamper resistant features. Demand in other end-markets (including the food and personal care markets) continues to grow, broadening the market opportunities for shrink sleeve labels as a whole.
Aluminum Labels:
Fully printable and equipped for embossing, our aluminum labels let our customers’ products shine with premium shelf impact while providing tamper evidence protection. The aluminum product range includes elegant neck labels that effortlessly adapt to the bottleneck shape and can be customized with embossing and de-embossing and a variety of ink effects. Also available in aluminum are Smart Top can lid labels. Smart Top labels are designed to maximize branding and messaging. They also provide the added benefit of protection against dust and germs and are fully recyclable.
Graphic Services:
We provide graphics and pre-press services for our customers at all of our manufacturing locations. These services include the conversion of customer digital files and artwork into proofs, production of print layouts and printing plates, and product mock ups and samples for market research.
As a result of these capabilities, we are able to go from concept to printed label, thus increasing our customers’ speed to market and further enhancing our value proposition.
RESEARCH AND DEVELOPMENT
Our product leadership group focuses on research and development, product commercialization and technical service support. The group includes chemical, packaging and field engineers who are responsible for developing and commercializing innovative label and application solutions. Technical service personnel also assist customers and manufacturers in improving container and label performance. The services provided by this group differentiate us from many of our competitors and drive our selection for the most challenging projects.
Our research and development expenditures were $5,834, $5,274 and $5,520 in 2018, 2017 and 2016, respectively.
5
SALES AND MARKETING
We provide a complete line of label solutions and a variety of pre-press activities. Our vision is to be the premier global resource for decorating solutions. We sell to a broad range of home & personal care, wine & spirits, food & beverage, healthcare and specialty consumer product companies located in the North American, Latin American, EMEA (Europe, Middle East and Africa) and Asia Pacific regions. Our sales strategy is a consultative selling approach. Our sales organization reviews the requirements of the container and offers a number of alternative decorating methods. Our customers view us as an expert source of materials, methods and technologies with the ability to offer the most cost-effective solution.
We have continued to make progress in expanding our customer base and portfolio of products, pre-press activities and manufacturing locations throughout the world. During 2018, 2017 and 2016, sales to major customers (those exceeding 10% of the Company’s net revenues in one or more of the periods presented) approximated 14%, 17% and 17%, respectively, of the Company’s consolidated net revenues. All of these sales were made to The Procter & Gamble Company. In fiscal 2018, we entered the German label market with the acquisition of GEWA Etiketten GmbH located in Bingen am Rhein, Germany, which specializes in producing pressure sensitive labels for the wine & spirits market. Our fiscal 2018 acquisition of Constantia Labels expanded our presence in Germany and gave us entrance into the Belgian, Romanian and Vietnamese label markets. We also entered the Tanzanian label market in fiscal 2018 with the acquisition of TP Label Limited, the labels business of Tanzania Printers Limited (Tanzania Printers), and TP Kenya Limited (collectively, “TP Label”), which is located in Dar es Salaam, Tanzania with a sales and distribution center located in Nairobi, Kenya. TP Label is primarily a pressure sensitive and cut and stack business, serving customers in the food & beverage market. We also entered the New Zealand wine & spirits market in fiscal year 2018 with a start-up operating in Auckland, New Zealand.
In fiscal 2016, we entered the Southeast Asian label market with the acquisition of Super Label, which specializes in labels for home & personal care, food & beverage and specialty consumer product industries. We also entered the Spanish wine & spirits market in fiscal 2016 with a start-up operating in La Rioja, Spain.
PRODUCTION AND QUALITY
To guarantee consistent quality results, all of our label decorating services are backed by aggressively implemented and administered quality programs and qualified technical support staff. Our quality assurance program ensures excellence in every label.
Multi-Color’s comprehensive range of printing technologies facilitates our ability to respond quickly and effectively to changing customer needs. Our current printing technologies include rotogravure, lithographic, flexographic, digital and a combination of flexographic and screen printing. Pre-press technology offerings include color separations, color management programs and in-house platemaking and tooling.
Our manufacturing operations involve complex processes and utilize factory automation to produce a consistent, high quality label. We employ state of the art technologies, including digital platemaking and automated vision inspection systems complemented by a robust systemic quality management system.
EMPLOYEES
As of March 31, 2018, we employ over 8,400 associates across more than 70 operations globally.
RAW MATERIALS
Common to the printing industry, we purchase proprietary products from a number of raw material suppliers. To prevent potential disruptions to our manufacturing facilities, we have developed relationships with more than one supply source for each of our critical raw materials. Our raw material suppliers are major corporations with successful historical performance. Although we intend to prevent any long-term business interruption due to our inability to obtain raw materials, there could be short-term manufacturing disruptions during the vendor qualification period for any new raw material source.
ACQUISITIONS
We are continually in pursuit of selective acquisitions that will contribute to our growth. We believe that acquisitions are a method of increasing our presence in existing markets, expanding into new markets, gaining new customers and product offerings and improving operating efficiencies through economies of scale. Through acquisitions, we intend to broaden our revenue stream by expanding our lines of innovative label solutions, offering a variety of technical and graphic services and fulfilling the specific needs and requirements of our customers. The printing and packaging industry is highly fragmented and offers many opportunities for acquisitions.
On October 31, 2017, the Company completed its acquisition pursuant to the Sale and Purchase Agreement (as amended) with Constantia Flexibles Germany GmbH, Constantia Flexibles International GmbH, Constantia Flexibles Group GmbH and GPC Holdings B.V. (collectively, “Constantia Flexibles”), acquiring 100% of the Labels Division of Constantia Flexibles (“Constantia Labels”). Constantia Labels, headquartered in Vienna, Austria, is a leader in label solutions serving the food, beverage and consumer packaging goods industries.
On October 11, 2017, the Company acquired 100% of TP Label Limited, the labels business of Tanzania Printers Limited (Tanzania Printers), and TP Kenya Limited (collectively, “TP Label”), which is located in Dar es Salaam, Tanzania with a sales and distribution center
6
located in Nairobi, Kenya. TP Label is primarily a pressure sensitive and cut and stack label business, serving customers in the food & beverage market.
On August 3, 2017, the Company acquired 100% of GEWA Etiketten GmbH (GEWA). GEWA is located in Bingen am Rhein, Germany and specializes in producing pressure sensitive labels for the wine & spirits market.
On January 3, 2017, the Company acquired Graphix Labels and Packaging Pty Ltd. (Graphix). Graphix is located in Melbourne, Victoria, Australia and specializes in producing labels for both the food & beverage and wine & spirits markets. In January 2017, the Company acquired an additional 67.6% of the common shares of Gironde Imprimerie Publicité (GIP). The Company acquired 30% of GIP as part of the Barat acquisition in fiscal 2016. GIP is located in the Bordeaux region of France and specializes in producing labels for the wine & spirits market.
On July 6, 2016, the Company acquired Industria Litografica Alessandrina S.r.l. (I.L.A.), which is located in the Piedmont region of Italy and specializes in producing premium self-adhesive and wet glue labels primarily for the wine & spirits market and also services the food industry.
On July 1, 2016, the Company acquired Italstereo Resin Labels S.r.l. (Italstereo), which is located near Lucca, Italy and specializes in producing pressure sensitive adhesive resin coated labels, seals and emblems.
On January 4, 2016, the Company acquired Cashin Print and System Label, which are located in Castlebar, Ireland and Roscommon, Ireland, respectively. The businesses supply multinational customers in Ireland, the United Kingdom and Continental Europe and provide Multi-Color with the opportunity to supply a broader product range to a larger customer base, especially in the healthcare market.
On October 1, 2015, the Company acquired Supa Stik Labels (Supa Stik), which is located in Perth, West Australia and services the local wine, food & beverage and healthcare label markets.
On August 11, 2015, the Company acquired 90% of the shares of Super Label based in Kuala Lumpur, Malaysia, which was publicly listed on the Malaysian stock exchange. During the second and third quarters of fiscal 2016, the Company acquired the remaining shares and delisted Super Label. Super Label has operations in Malaysia, Indonesia, the Philippines, Thailand and China and produces home & personal care, food & beverage and specialty consumer products labels. This acquisition expanded our presence in China and gave us access to new label markets in Southeast Asia.
On May 4, 2015, the Company acquired Barat Group (Barat) based in Bordeaux, France. Barat operates four manufacturing facilities in Bordeaux and Burgundy, France, and the acquisition gave the Company access to the label market in the Bordeaux wine region and expands our presence in Burgundy.
On May 1, 2015, the Company acquired Mr. Labels in Brisbane, Queensland Australia, which provides labels primarily to food and beverage customers.
See Note 16 to our consolidated financial statements for geographic information relating to our net revenues and long-lived assets. See Note 3 to our consolidated financial statements for further information regarding acquisitions.
COMPETITION
We have a large number of competitors in the pressure sensitive, cut and stack and roll fed label markets and several competitors in each of the IML, shrink sleeve, HTL and aluminum label markets. Some of these competitors in the pressure sensitive and cut and stack label markets have greater financial and other resources than us. The competitors in IML, shrink sleeve and HTL markets are either private companies or subsidiaries of public companies and we cannot assess the financial resources of these organizations. We could be adversely affected should a competitor develop labels similar or technologically superior to our labels. We believe competition is principally dependent upon product performance, service, pricing, technical support and innovation.
PATENTS AND LICENSES
We own a number of patents and patent applications that relate to the products and services we offer to our customers. Although these patents are important to us, we are not dependent upon any one patent. We believe that these patents, collectively, along with our ability to be a single source provider of many packaging needs, provide us with a competitive advantage over our competition. The expiration or unenforceability of any one of our patents would not have a material adverse effect on us.
REGULATION
Our operations are subject to regulation by federal, state and foreign environmental protection agencies. To ensure ongoing compliance with these requirements, we have implemented an internal compliance program. Additionally, we continue to make capital investments to maintain compliance with these environmental regulations and to improve our existing equipment. However, there can be no assurances that these regulations will not require expenditures beyond those that are currently anticipated.
In the U.S., the Food and Drug Administration regulates the raw materials used in labels for various products. These regulations apply to the consumer product companies for which we produce labels. We use materials specified by the consumer product companies in producing labels.
7
| ITEM 1A. | RISK FACTORS |
(In thousands, except for statistical data)
In addition to the other information set forth in this report, the following factors could materially affect the Company’s business, financial condition, cash flows or future results. Any one of these factors could cause the Company’s actual results to vary materially from recent results or from anticipated future results. The risks described below are not the only risks facing the Company. Additional risks and uncertainties not currently known to us or that we currently deem to be immaterial also may materially adversely affect the Company’s business, financial condition and/or operating results.
Risks Relating to Our Business
Raw material cost increases or shortages could adversely affect our results of operations and cash flows.
As a member of the print industry, our sales and profitability are dependent upon the availability and cost of various raw materials, which are subject to price fluctuations, and the ability to control the fluctuating costs of raw materials, pass on any price increases to our customers or find suitable alternative suppliers. If we are unable to effectively manage these costs or improve our operating efficiencies, or if adverse developments arise concerning certain key raw material vendors, such as disruptions in their productions or lack of availability of the raw materials we need from them, or our relationships with them, our profit margin may decline, especially if the inflationary conditions that have occurred in these markets in the recent past continue to occur.
We face risks related to interruption of our operations and lack of redundancy.
Our production facilities, websites, transaction processing systems, network infrastructure, supply chain and customer service operations may be vulnerable to interruptions, including by cyber-attack, and we do not have redundancies in all cases to carry on these operations in the event of an interruption. Specifically, the long-term shutdown of our printing presses or malfunctions experienced with our presses could negatively impact our ability to fulfill customers’ orders and on-time delivery needs and adversely impact our operating results and cash flows. We have not identified alternatives to all of our facilities, systems, supply chains and infrastructure, including production, to serve us in the event of an interruption, and if we were to find alternatives, they may not be able to meet our requirements on commercially acceptable terms or at all. In addition, we are dependent in part on third parties for the implementation and maintenance of certain aspects of our communications and production systems, and because many of the causes of system interruptions or interruptions of the production process may be outside of our control, we may not be able to remedy such interruptions in a timely manner, or at all. Any interruptions that cause any of our websites to be unavailable, reduce our order fulfillment performance or interfere with our manufacturing, technology or customer service operations could result in lost revenue, increased costs, negative publicity, damage to our reputation and brand, and an adverse effect on our business and results of operations.
Building redundancies into our infrastructure, systems and supply chain to mitigate these risks may require us to commit substantial financial, operational and technical resources, in some cases before the volume of our business increases with no assurance that our revenues will increase.
Various laws and governmental regulations applicable to a manufacturer or distributor of consumer products may adversely affect our business, results of operations and financial condition.
Our business is subject to numerous federal, state, provincial, local and foreign laws and regulations, including laws and regulations with respect to labor and employment, product safety, including regulations enforced by the United States Consumer Products Safety Commission, import and export activities, the Internet and e-commerce, antitrust issues, taxes, chemical usage, air emissions, wastewater and storm water discharges and the generation, handling, storage, transportation, treatment and disposal of waste materials, including hazardous materials. We routinely incur costs in complying with these regulations and, if we fail to comply, could incur significant penalties.
Although we believe that we are in substantial compliance with all applicable laws and regulations, because legal requirements frequently change and are subject to interpretation, we are unable to predict the ultimate cost of compliance or the consequences of non-compliance with these requirements, or the effect on our operations, any of which may be significant. If we fail to comply with applicable laws and regulations, we may be subject to criminal sanctions or civil remedies, including fines, injunctions, or prohibitions on importing or exporting. A failure to comply with applicable laws and regulations, or concerns about product safety, also may lead to a recall or post-manufacture repair of selected products, resulting in the rejection of our products by our customers and consumers, lost sales, increased customer service and support costs, and costly litigation. In addition, failure to comply with environmental requirements could require us to shut down one or more of our facilities. There is risk that any claims or liabilities, including product liability claims, relating to such noncompliance may exceed, or fall outside the scope of, our insurance coverage. Laws and regulations at the state, federal and international levels frequently change and the cost of compliance cannot be precisely estimated. Any changes in regulations, the imposition of additional regulations, or the enactment of any new governmental legislation that impacts employment/labor, trade, health care, tax, environmental or other business issues could have an adverse impact on our financial condition and results of operations.
Changes in applicable tax regulations could adversely affect our financial results.
The Company is subject to taxation in the U.S. and numerous foreign jurisdictions. On December 22, 2017, the U.S. government enacted comprehensive tax legislation commonly referred to as the Tax Cuts and Jobs Act (the “Tax Act”). The changes included in the Tax Act
8
are broad and complex. The final transition impact of the Tax Act may differ from the estimates provided elsewhere in this report, possibly materially, due to, among other things, changes in interpretations of the Tax Act, any legislative action to address questions that arise because of the Tax Act, any changes in accounting standards for income taxes or related interpretations in response to the Tax Act, or any updates or changes to estimates the Company has utilized to calculate the transition impact, including impact from changes to current year earnings estimates and foreign exchange rates of foreign subsidiaries. The U.S. Securities and Exchange Commission has issued rules that would allow for a measurement period of up to one year after the enactment date of the Tax Act to finalize the recording of the related tax impact.
As this and other tax regulations change and as there are updates or changes to our estimates of the transition impact, our financial results could be adversely impacted.
We must be able to continue to effectively manage our growth, including our recent acquisitions, and to execute our long-term growth strategy.
We have experienced significant and steady growth over the last several years. Our growth, in particular our recent acquisitions, combined with the geographical separation of our operations, has placed, and will continue to place, a strain on our management, administrative and operational infrastructure. Our ability to manage our operations and anticipated growth will require us to continue to refine our operational, financial and management controls, human resource policies, reporting systems and procedures in the locations in which we operate. In addition, our expectations regarding the earnings, operating cash flow, capital expenditures and liabilities resulting from acquisitions recently completed are based on information currently available to us and may prove to be incorrect. We may not be able to implement improvements to our management information and control systems in an efficient or timely manner and may discover deficiencies in existing systems and controls. If we are unable to realize any of the anticipated benefits of an acquisition or manage expected future expansion, or if our long-term growth strategy is not successful, our ability to provide a high-quality customer experience could be harmed, which would damage our reputation and brand and substantially harm our business and results of operations. In addition, projections made by us in connection with forming our long-term growth strategy are inherently uncertain and based on assumptions and judgments by management that may be flawed or based on information about our business and markets that may change in the future, many of which are beyond our reasonable control. These and various other factors may cause our actual results to differ materially from our projections.
We are subject to risks associated with our international operations, including compliance with applicable U.S. and foreign anti-corruption laws and regulations such as the U.S. Foreign Corrupt Practices Act, the U.K. Bribery Act of 2010 and other applicable anti-corruption laws, which may increase the cost of doing business in international jurisdictions.
We have operations in the North American, Latin American, EMEA (Europe, Middle East and Africa) and Asia Pacific regions and we intend to continue expansion of our international operations. As a result, our business is exposed to risks inherent in foreign operations. If we fail to adequately address the challenges and risks associated with our international expansion and acquisition strategy, we may encounter difficulties implementing our strategy, which could impede our growth or harm our operating results. These risks, which can vary substantially by jurisdiction, include the difficulties associated with managing an organization with operations in multiple countries, compliance with differing laws and regulations (including the U.S. Foreign Corrupt Practices Act, the U.K. Bribery Act of 2010 and local laws prohibiting payments to government officials and other corrupt practices, tax laws, regulations and rates), enforcing agreements and collecting receivables through foreign legal systems. Although we have implemented policies and procedures designed to ensure compliance with these laws, there can be no assurance that our employees, contractors and agents will not take actions in violation of our policies, particularly as we expand our operations through organic growth and acquisitions. Any such violations could subject us to civil or criminal penalties, including material fines or prohibitions on our ability to offer our products in one or more countries, and could also materially damage our reputation, brand, international expansion efforts, business and operating results. Additional risks include the potential for restrictive actions by foreign governments, changes in economic conditions in each market, foreign customers who may have longer payment cycles than customers in the United States, the impact of economic, political and social instability of those countries in which we operate and acts of nature, such as typhoons, tsunamis, or earthquakes. The overall volatility of the economic environment has increased the risk of disruption and losses resulting from hyper-inflation, currency devaluation and tax or regulatory changes in certain countries in which we have operations. Approximately 55% of our sales were derived from our foreign operations (based on the country from which the product was shipped) during fiscal 2018.
We also face the challenges and uncertainties associated with operating in developing markets, which may subject us to a relatively high risk of political and social instability and economic volatility, all of which are enhanced, in many cases, by uncertainties as to how local law is applied and enforced, including in areas most relevant to commercial transactions and foreign investment.
Currency exchange rate fluctuations could have an adverse effect on our revenue, cash flows and financial results.
Because we conduct a significant portion of our business outside the United States, our revenues and earnings and the value of our foreign net assets are affected by fluctuations in foreign currency exchange rates, which may favorably or adversely affect reported earnings and net assets. Currency exchange rates fluctuate in response to, among other things, changes in local, regional or global economic conditions, the imposition of currency exchange restrictions and unexpected changes in regulatory or taxation environments. Fluctuations in currency exchange rates may affect the Company’s operating performance by impacting revenues and expenses outside of the United States due to fluctuations in currencies other than the U.S. Dollar or where the Company translates into U.S. Dollars for financial reporting purposes the assets and liabilities of its foreign operations conducted in local currencies.
9
We have risks related to continued uncertain global economic conditions and volatility in the credit markets.
At times, domestic and international financial markets have experienced extreme disruption, including, among other things, extreme volatility in stock prices and severely diminished liquidity and credit availability. These developments and the related severe domestic and international economic downturns could adversely impact our business and financial condition in a number of ways, including effects beyond those that were experienced in previous recessions in the United States and foreign economies.
Global economic conditions also affect our customers’ businesses and the markets they serve, as well as our suppliers. Because a significant part of our business relies on our customers’ spending, a prolonged downturn in the global economy and an uncertain economic outlook could reduce the demand for printing and related services that we provide to these customers. Economic weakness and constrained advertising spending have resulted, and may in the future result, in decreased revenue, operating margin, earnings and growth rates and difficulty in managing inventory levels and collecting accounts receivable. We also have experienced, and expect to experience in the future, operating margin declines in certain businesses, reflecting the effect of items such as competitive pricing pressures and inventory write-downs. Economic downturns may also result in restructuring actions and associated expenses and impairment of long-lived assets, including goodwill and other intangibles. Uncertainty about future economic conditions makes it difficult for us to forecast operating results and to make decisions about future investments.
Finally, economic downturns may affect one or more of our lenders’ ability to fund future draws on our Credit Facility or our ability to access the capital markets or obtain new financing arrangements that are favorable to us. In such an event, our liquidity could be severely constrained with an adverse impact on our ability to operate our businesses. Our ability to meet the financial covenants in the Credit Facility may also be affected by events beyond our control, including a deterioration of economic and industry conditions, which could negatively affect our earnings. If it is determined we are not in compliance with these financial covenants, the lenders under the Credit Facility will be entitled to take certain actions, including acceleration of all amounts due under the facility. If the lenders take such action, we may be forced to amend the terms of the credit agreement, obtain a waiver or find alternative sources of capital. Obtaining new financing arrangements or amending our existing one may result in significantly higher fees and ongoing interest costs as compared to those in our current arrangement.
Competition in our industry could limit our ability to retain current customers and attract new customers.
The markets for our products and services are highly competitive and constantly evolving. We compete primarily based on the level and quality of customer service, technological leadership, product performance and price and the inability to successfully overcome competition in our business could have a material adverse impact on our operating results and cash flows. Some of our competitors have greater financial and other resources than us. We could face competitive pressure as a result of any of the following: our ability to continue to improve our product and service offerings and keep pace with and integrate technological advances and industry evolutions; new products developed by our competitors that are of superior quality, fit our customers’ needs better or have lower prices; patents obtained or developed by competitors; consolidation of our competitors; pricing pressures; loss of proprietary supplies of certain materials; decrease in the utilization of labels. The inability to successfully identify, develop and sell new or improved products and to overcome competition in our business could have a material adverse impact on our operating results and cash flows.
Our business growth strategy involves the potential for significant acquisitions, which involve risks and difficulties in integrating potential acquisitions and may adversely affect our business, results of operations and financial condition.
All acquisitions involve inherent uncertainties, which may include, among other things, our ability to:
| • | successfully identify targets for acquisition; |
| • | negotiate reasonable terms; |
| • | properly perform due diligence and determine all the significant risks associated with a particular acquisition; |
| • | properly evaluate target company management capabilities; and |
| • | successfully transition the acquired company into our business and achieve the desired performance. |
We may acquire businesses with unknown liabilities, contingent liabilities, or internal control deficiencies. We have plans and procedures to conduct reviews of potential acquisition candidates for compliance with applicable regulations and laws prior to acquisition. Despite these efforts, realization of any of these liabilities or deficiencies may increase our expenses, adversely affect our financial position through the initiation, pendency or outcome of litigation or otherwise, or cause us to fail to meet our public financial reporting obligations.
We have a history of making acquisitions and, over the past several years, have invested, and in the future may continue to invest, a substantial amount of capital in acquisitions. We continue to evaluate potential acquisition opportunities to support, strengthen and grow our business. Although we have completed many acquisitions, there can be no assurance that we will be able to locate suitable acquisition candidates, acquire possible acquisition candidates, acquire such candidates on commercially reasonable terms, or integrate acquired businesses successfully in the future. In addition, any governmental review or investigation of our proposed acquisitions, such as by the Federal Trade Commission, may impede, limit or prevent us from proceeding with an acquisition. Future acquisitions may require us to incur additional debt and contingent liabilities, which may adversely affect our business, results of operations and financial condition. The process of integrating acquired businesses into our existing operations may result in operating, contract and supply chain difficulties, such
10
as the failure to retain customers or management personnel. Such difficulties may divert significant financial, operational and managerial resources from our existing operations, and make it more difficult to achieve our operating and strategic objectives.
We have a significant amount of goodwill and other intangible assets on our balance sheet that are subject to periodic impairment evaluations; an impairment of our goodwill or other intangible assets may have a material adverse impact on our financial condition and results of operations.
When we acquire a business, a portion of the purchase price of the acquisition may be allocated to goodwill and other identifiable intangible assets. The amount of the purchase price which is allocated to goodwill is the excess of the purchase price over the fair value of the net identifiable tangible assets acquired. As of March 31, 2018, we had $1,776,867 of goodwill and intangible assets, the value of which depends on a number of factors, including earnings growth, market capitalization and the overall success of our business. Accounting standards require us to test goodwill for impairment annually, and more frequently when events or changes in circumstances indicate impairment may exist.
There can be no assurance that reviews of our goodwill and other intangible assets will not result in impairment charges. Although it does not affect cash flow, an impairment charge does have the effect of decreasing our earnings, assets and shareholders’ equity. Future events may occur that could adversely affect the value of our assets and require future impairment charges. Such events may include, but are not limited to, poor operating results, strategic decisions made in response to changes in economic and competitive conditions, the impact of a deteriorating economic environment and decreases in our market capitalization due to a decline in the trading price of our common stock.
During the early years of an acquisition, the risk of impairment to goodwill and intangible assets is naturally higher. This is because the fair values of these assets align very closely with what we recently paid to acquire the reporting units to which these assets are assigned. This means the difference between the carrying value of the reporting unit and its fair value (typically referred to as “headroom”) is naturally smaller at the time of acquisition. Until this headroom grows over time (due to business growth or lower carrying value of the reporting unit due to natural amortization, etc.), a relatively small decrease in reporting unit fair value can trigger an impairment. That fair value is affected by actual business performance but is also determined by the market (usually reflected in the value of our common stock). As a consequence, sometimes even with favorable business performance, the market alone can drive an impairment condition if general business valuations decline significantly. When impairment charges are triggered, they tend to be material due to the sheer size of the assets involved.
Our debt instruments impose operating and financial restrictions on us and, in the event of a default, would have a material adverse impact on our business and results of operations.
As of March 31, 2018, our consolidated indebtedness, including current maturities of long-term indebtedness, was $1,627,854 which could have important consequences including the following:
| • | Increasing our vulnerability to global economic and industry conditions; |
| • | Requiring a substantial portion of cash flows from operating activities to be dedicated to the payment of principal and interest on our indebtedness and, as a result, reducing our ability to use our cash flows to fund our operations and capital expenditures, pay dividends, capitalize on future business opportunities and expand our business; |
| • | Exposing us to the risk of increased interest expense as certain of our borrowings are at variable rates of interest; |
| • | Limiting our ability to obtain additional financing for working capital, capital expenditures, additional acquisitions and other business purposes; and |
| • | Limiting our flexibility to adjust to changing market conditions and react to competitive pressures. |
We may be able to incur additional indebtedness in the future, subject to the restrictions contained in our credit agreements. If new indebtedness is added to our current debt levels, the related risks that we now face could intensify.
Our debt instruments contain covenants that limit our flexibility in operating our business.
The agreements governing our indebtedness contain various covenants that may adversely affect our ability to operate our business. Among other things, these covenants limit our ability to incur additional indebtedness, dispose of assets, incur guarantee obligations, make restricted payments, create liens, make equity or debt investments, change the business conducted by the Company and its subsidiaries, and engage in certain transactions with affiliates.
The agreements governing our indebtedness also require that (i) the consolidated secured net leverage ratio as of the last day of any
fiscal quarter of the Company shall not exceed 4.50 to 1.00 for the fiscal quarters ended during the period of March 31, 2017 through, and including June 30, 2019 and (ii) the consolidated secured net leverage ratio as of the last day of any fiscal quarter of the Company shall not exceed 4.25 to 1.00 for the fiscal quarters ended during the period of September 30, 2019 and thereafter.
Our ability to meet the financial ratios and tests contained in our credit agreement and other debt arrangements, and otherwise comply with debt covenants may be affected by various events, including those that may be beyond our control. Accordingly, we may not be able
11
to continue to meet those ratios, tests and covenants. A significant breach of any of these covenants, ratios, tests or restrictions, as applicable, could result in an event of default under our debt arrangements, which would allow our lenders to declare all amounts outstanding to be immediately due and payable. If the lenders were to accelerate the payment of our indebtedness, our assets may not be sufficient to repay in full the indebtedness and any other indebtedness that would become due as a result of any acceleration. Further, as a result of any breach and during any cure period or negotiations to resolve a breach or expected breach, our lenders may refuse to make further loans, which would materially affect our liquidity and results of operations.
In the event we were to fall out of compliance with one or more of our debt covenants in the future, we may not be successful in amending our debt arrangements or obtaining waivers for any such non-compliance. Even if we are successful in entering into an amendment or waiver, we could incur substantial costs in doing so. It is also possible that any amendments to our debt instruments or any restructured debt could impose covenants and financial ratios more restrictive than under our current facility. Any of the foregoing events could have a material adverse impact on our business and results of operations, and there can be no assurance that we would be able to obtain the necessary waivers or amendments on commercially reasonable terms, or at all.
We rely on several large customers and the loss of one of these customers would have a material adverse impact on our operating results and cash flows.
For the fiscal year ended March 31, 2018, one customer accounted for approximately 14% of our consolidated sales and our top twenty-five customers accounted for approximately 43% of our consolidated sales. While we maintain sales contracts with certain of our largest customers, such contracts do not impose minimum purchase or volume requirements and these contracts require renewal on a regular basis in the ordinary course of business. Any termination of a business relationship with, or a significant sustained reduction in business received from, one or more of our largest customers could have a material adverse effect on our revenues and results of operations. The volume and type of services we provide all of our customers may vary from year to year and could be reduced if a customer were to change its outsourcing or print procurement strategy. We cannot guarantee that these contracts will be successfully renewed in the future. The loss or substantial reduction in business of any of our major customers could have a material adverse impact on our operating results and cash flows.
We are highly dependent on information technology. If our systems fail or are unreliable our operations may be adversely impacted.
The efficient operation of our business depends on our information technology infrastructure and our management information systems. In addition, production technology in the printing industry has continued to evolve specifically related to the pre-press component of production. Our information technology infrastructure and/or our management information systems are vulnerable to damage or interruption from natural or man-made disasters, terrorist attacks, computer viruses or hackers, power loss, or other computer systems, Internet telecommunications or data network failures. Any significant breakdown, virus or destruction could negatively impact our business. We also periodically upgrade and install new systems, which if installed or programmed incorrectly, could cause significant disruptions. If a disruption occurs, we could incur losses and costs for interruption of our operations.
We are involved on an ongoing basis in claims, lawsuits, and governmental proceedings relating to our operations, including environmental, commercial transactions, and other matters.
The ultimate outcome of these claims, lawsuits, and governmental proceedings cannot be predicted with certainty, but could have a material adverse effect on our financial condition, results of operations, and cash flow. We are also involved in other possible claims, including product and general liability, workers compensation and employment-related matters, some of which may be of a material nature or may be resolved in a manner that has a material adverse effect on our financial condition, results of operations, and cash flow. While we maintain insurance for certain of these exposures, the policies in place are high-deductible policies resulting in our assuming exposure for a layer of coverage with respect to such claims.
We cannot predict our future capital needs and any limits on our ability to raise capital in the future could prevent further growth.
We may in the future be required to raise capital through public or private financing or other arrangements. Such financing may not be available on acceptable terms, or at all, and our failure to raise capital when needed could harm our business. Additional equity financing may be dilutive to the holders of our common stock, and debt financing, if available, may involve restrictive covenants and could reduce our profitability. In addition, we may experience operational difficulties and delays due to working capital restrictions. If we cannot raise funds on acceptable terms, we may have to delay or scale back our growth plans and may not be able to effectively manage competitive pressures.
We depend on key personnel, and we may not be able to operate and grow our business effectively if we lose their services or are unable to attract qualified personnel in the future.
We are dependent upon the efforts of our senior management team. The success of our business is heavily dependent on our ability to retain our current management and to attract and retain qualified personnel in the future. Competition for senior management personnel is intense, and we may not be able to retain our personnel. We enter into employment agreements with certain key personnel: our Executive Chairman, Chief Executive Officer and President, Chief Operating Officer-Consumer Product Goods, Chief Operating Officer-Food & Beverage, Chief Operating Officer-Wine & Spirits and Chief Financial Officer. These individuals may not continue in their present capacity with us for any particular period of time. Outside of the implementation of succession plans and executive transitions done in the normal course of business, the loss of the services of one or more members of our senior management team could require the remaining executive
12
officers to divert immediate and substantial attention to seeking a replacement and would disrupt our business and impede our ability to execute our business strategy. Any inability to find a replacement for a departing executive officer on a timely basis could adversely affect our ability to operate and grow our business.
If we are unable to adequately protect our intellectual property, we may lose some of our competitive advantage.
Our success is determined in part by our ability to obtain United States and foreign patent protection for our technology and to preserve our trade secrets. Our ability to compete and the ability of our business to grow could suffer if our intellectual property rights are not adequately protected. There can be no assurance that our patent applications will result in patents being issued or that current or additional patents will afford protection against competitors. We rely on a combination of patents, copyrights, trademarks and trade secret protection and contractual rights to establish and protect our intellectual property. Failure of our patents, copyrights, trademarks and trade secret protection, non-disclosure agreements and other measures to provide protection of our technology and our intellectual property rights could enable our competitors to more effectively compete with us and have an adverse effect on our business, financial condition and results of operations. In addition, our trade secrets and proprietary know-how may otherwise become known or be independently discovered by others. No guarantee can be given that others will not independently develop substantially equivalent proprietary information or techniques, or otherwise gain access to our proprietary technology.
We could become involved in intellectual property litigation, which is costly and could cause us to lose our intellectual property rights or subject us to liability.
Although we have received patents with respect to certain technologies of ours, there can be no assurance that these patents will afford us any meaningful protection. Although we believe that our use of the technology and products we developed and other trade secrets used in our operations do not infringe upon the rights of others, our use of the technology and trade secrets we developed may infringe upon the patents or intellectual property rights of others. In the event of infringement, we could, under certain circumstances, be required to obtain a license or modify aspects of the technology and trade secrets we developed or refrain from using the same. We may not have the necessary financial resources to defend an infringement claim made against us or be able to successfully terminate any infringement in a timely manner, upon acceptable terms and conditions or at all. Moreover, if the patents, technology or trade secrets we developed or use in our business are deemed to infringe upon the rights of others, we could, under certain circumstances, become liable for damages, which could have a material adverse effect on us and our financial condition. As we continue to market our products, we could encounter patent barriers that are not known today. Furthermore, third parties may assert that our intellectual property rights are invalid, which could result in significant expenditures by us to refute such assertions. If we become involved in litigation, we could lose our proprietary rights, be subject to damages and incur substantial unexpected operating expenses. Intellectual property litigation is expensive and time-consuming, even if the claims are subsequently proven unfounded, and could divert management’s attention from our business. If there is a successful claim of infringement, we may not be able to develop non-infringing technology or enter into royalty or license agreements on acceptable terms, if at all. If we are unsuccessful in defending claims that our intellectual property rights are invalid, we may not be able to enter into royalty or license agreements on acceptable terms, if at all. This could prohibit us from providing our products and services to customers, which could have a material adverse effect on us and our financial condition.
Employee benefit costs, including increasing health care costs for our employees may adversely affect our business, results of operations and financial condition.
We seek to provide competitive employee benefit programs to our employees. Employee benefit costs, such as U.S. healthcare costs of our eligible and participating employees, may increase significantly at a rate that is difficult to forecast, in part because we are unable to determine the impact that U.S. federal healthcare legislation may have on our employer-sponsored medical plans. Higher employee benefit costs could have an adverse effect on our business, results of operations and financial condition.
We provide health care and other benefits to our employees. In recent years, costs for health care have increased more rapidly than general inflation in the U.S. economy. If this trend in health care costs continues, our cost to provide such benefits could increase, adversely impacting our profitability. Changes to health care regulations in the U.S. may also increase the cost to us of providing such benefits.
Risks Relating to Our Common Stock
Our operating results fluctuate from quarter to quarter.
Our quarterly operating results have fluctuated in the past and may fluctuate in the future as a result of a variety of factors, many of which are outside of our control, including:
| • | timing of the completion of particular projects or orders; |
| • | material reduction, postponement or cancellation of major projects, or the loss of a major client; |
| • | timing and amount of new business; |
| • | differences in order flows; |
| • | sensitivity to the effects of changing economic conditions on our clients’ businesses; |
13
| • | the strength of the consumer products industry; |
| • | the relative mix of different types of work with differing margins; |
| • | costs relating to expansion or reduction of operations, including costs to integrate current and any future acquisitions; |
| • | changes in interest costs, foreign currency exchange rates and tax rates; and |
| • | costs associated with compliance with legal and regulatory requirements. |
Because of this, we may be unable to adjust spending on fixed costs, such as building and equipment leases, depreciation and personnel costs, quickly enough to offset any revenue shortfall and our operating results could be adversely affected. Due to these factors or other unanticipated events, our financial and operating results in any one quarter may not be a reliable indicator of our future performance.
If we fail to comply with U.S. public company reporting obligations or to maintain adequate internal controls over financial reporting, our business, results of operations and financial condition could be adversely affected.
As a U.S. public company, we are required to comply with the periodic reporting obligations of the Securities Exchange Act of 1934, including preparing annual reports, quarterly reports and current reports. We are also subject to certain of the provisions of the Sarbanes-Oxley Act of 2002 and Dodd-Frank Act which, among other things, require enhanced disclosure of business, financial, compensation and governance information. Our failure to prepare and disclose this information in a timely manner could subject us to penalties under federal securities laws, expose us to lawsuits, and restrict our ability to access financing. We may identify areas requiring improvement with respect to our internal control over financial reporting, which may require us to design enhanced processes and controls to address any additional issues identified. This could result in significant delays and cost to us and require us to divert substantial resources, including management time, from other activities. If we fail to maintain the adequacy of our internal controls, we may not be able to ensure that we can conclude on an ongoing basis that we have effective internal control over financial reporting. Moreover, effective internal controls are necessary for us to produce reliable financial reports and are important to help prevent fraud.
Certain provisions of Ohio law and our Articles of Incorporation and Code of Regulations may deter takeover attempts, which may limit the opportunity of our shareholders to sell their shares at a favorable price, and may make it more difficult for our shareholders to remove our Board of Directors and management.
Provisions in our Amended Articles of Incorporation and Amended and Restated Code of Regulations may have the effect of delaying or preventing a change of control or changes in our management. These provisions include the following:
| • | advance notice requirements for shareholders proposals and nominations; |
| • | the right of the board of directors to elect a director to fill a vacancy created by the expansion of the board of directors or due to the resignation or departure of an existing board member; |
| • | the prohibition of cumulative voting in the election of directors, which would otherwise allow less than a majority of shareholders to elect director candidates; and |
| • | limitations on the removal of directors. |
In addition, because we are incorporated in Ohio, we are governed by the provisions of Section 1704 of the Ohio Revised Code. These provisions may prohibit large shareholders, particularly those owning 10% or more of our outstanding voting stock, from merging or combining with us. These provisions in our Articles of Incorporation and Code of Regulations and under Ohio law could discourage potential takeover attempts, could reduce the price that investors are willing to pay for our common shares in the future and could potentially result in the market price being lower than it would without these provisions.
Although no preferred shares were outstanding as of March 31, 2018 and although we have no present plans to issue any preferred shares, our Articles of Incorporation authorize the Board of Directors to issue up to 1,000 preferred shares. The preferred shares may be issued in one or more series, the terms of which will be determined at the time of issuance by our Board of Directors without further action by the shareholders. These terms may include voting rights, including the right to vote as a series on particular matters, preferences as to dividends and liquidation, conversion rights, redemption rights and sinking fund provisions. The issuance of any preferred shares could diminish the rights of holders of our common shares and, therefore, could reduce the value of our common shares. In addition, specific rights granted to future holders of preferred shares could be used to restrict our ability to merge with, or sell assets to, a third party. The ability of our Board of Directors to issue preferred shares and the foregoing anti-takeover provisions may prevent or frustrate attempts by a third party to acquire control of the Company, even if some of our shareholders consider such change of control to be beneficial.
| ITEM 1B. | UNRESOLVED STAFF COMMENTS |
None.
14
| ITEM 2. | PROPERTIES |
As of March 31, 2018, the Company owned and leased the following 72 manufacturing facilities:
| Location |
Approximate Square Feet |
Owned/Leased | ||||
| United States: |
||||||
| Napa, California |
150,125 | Leased | ||||
| Scottsburg, Indiana |
120,500 | Owned | ||||
| Elkton, Kentucky |
43,000 | Leased | ||||
| Asheville, North Carolina |
53,500 | Leased | ||||
| Omaha, Nebraska |
31,000 | Leased | ||||
| Fulton, New York |
106,692 | Leased | ||||
| Batavia, Ohio |
277,730 | Owned | ||||
| Mason, Ohio |
72,000 | Leased | ||||
| Norwood, Ohio |
313,322 | Owned | ||||
| York, Pennsylvania |
160,000 | Leased | ||||
| Clarksville, Tennessee |
189,300 | Leased | ||||
| Chesapeake, Virginia |
49,885 | Leased | ||||
| Green Bay, Wisconsin |
39,600 | Owned | ||||
| International: |
||||||
| Mendoza, Argentina |
10,273 | Leased | ||||
| Adelaide, Australia |
65,246 | Leased | ||||
| Brisbane, Australia |
42,744 | Leased | ||||
| Barossa, Australia |
25,306 | Leased | ||||
| Griffith, Australia |
21,775 | Leased | ||||
| Melbourne, Australia |
21,653 | Leased | ||||
| Notting Hill, Australia |
16,404 | Leased | ||||
| Perth, Australia |
22,184 | Leased | ||||
| Maldegem, Belgium (2) |
264,598 | Leased | ||||
| Cowansville, Canada |
30,000 | Leased | ||||
| Montreal, Canada |
51,650 | Leased | ||||
| Santiago, Chile |
150,610 | Leased | ||||
| Guangzhou, China |
43,056 | Leased | ||||
| Jiangsu, China |
24,757 | Leased | ||||
| Daventry, England |
34,059 | Owned /Leased | ||||
| Ablis, France |
104,119 | Owned | ||||
| Libourne, France |
39,934 | Owned | ||||
| Montagny, France |
20,000 | Leased | ||||
| Nantes, France (2) |
325,436 | Owned | ||||
| Port-Sainte-Foy, France |
22,690 | Leased | ||||
| Reyrieux, France |
48,868 | Leased | ||||
| Saint Emilion, France |
35,112 | Leased | ||||
| Vittel, France |
104,442 | Owned | ||||
15
| Location |
Approximate Square Feet |
Owned/Leased | ||||
| International continued: |
||||||
| Bingen am Rhein, Germany (2) |
105,397 | Leased | ||||
| Heilbad Heiligenstadt, Germany |
175,666 | Owned | ||||
| Münden, Germany |
100,118 | Owned | ||||
| Bekasi, Indonesia |
33,799 | Leased | ||||
| Jakarta, Indonesia |
27,771 | Owned | ||||
| Castlebar, Ireland |
42,722 | Leased | ||||
| Drogheda, Ireland |
53,529 | Owned | ||||
| Roscommon, Ireland |
12,109 | Leased | ||||
| Alessandria, Italy |
45,500 | Owned | ||||
| Florence, Italy |
23,681 | Leased | ||||
| Lucca, Italy (2) |
134,179 | Leased | ||||
| Balakong, Malaysia |
16,000 | Leased | ||||
| Kuala Lumpur, Malaysia |
42,468 | Owned /Leased | ||||
| Penang, Malaysia |
70,808 | Owned | ||||
| Rawang, Malaysia |
60,010 | Leased | ||||
| Guadalajara, Mexico |
82,990 | Leased | ||||
| Monterrey, Mexico |
155,269 | Owned /Leased | ||||
| Auckland, New Zealand |
18,773 | Leased | ||||
| Manila, Philippines |
21,722 | Leased | ||||
| Warsaw, Poland |
61,657 | Leased | ||||
| Cluj Napoca, Romania |
63,103 | Leased | ||||
| Glasgow, Scotland |
43,196 | Owned | ||||
| Johannesburg, South Africa |
21,148 | Leased | ||||
| Paarl, South Africa |
114,343 | Owned | ||||
| Pinetown, South Africa |
17,297 | Leased | ||||
| Haro, Spain |
21,528 | Leased | ||||
| Bevaix, Switzerland |
15,069 | Leased | ||||
| Dar es Salaam, Tanzania (2) |
20,796 | Leased | ||||
| Bangkok, Thailand |
50,470 | Owned | ||||
| Ho Chi Minh, Viet Nam |
27,396 | Leased | ||||
| Cwmbran, Wales |
61,569 | Leased | ||||
All of the Company’s properties are in good condition, well maintained and adequate for our intended uses.
On October 31, 2017, the Company completed its acquisition pursuant to the Sale and Purchase Agreement (as amended) with Constantia Flexibles Germany GmbH, Constantia Flexibles International GmbH, Constantia Flexibles Group GmbH and GPC Holdings B.V. (collectively, “Constantia Flexibles”), acquiring 100% of the Labels Division of Constantia Flexibles (“Constantia Labels”). As a result of the acquisition, the Company acquired 24 manufacturing facilities across 14 countries, with major operations across Europe, Asia and North America.
During the three months ended September 30, 2017, the Company announced plans to consolidate our manufacturing facility located in Merignac, France into our existing facility in Libourne, France. The transition was substantially completed in the third quarter of fiscal 2018 and the facility was sold during the fourth quarter of fiscal 2018.
On July 3, 2017, the Company sold its 60% controlling interest in its Southeast Asian durables business to its minority shareholders, which included manufacturing facilities in Guangzhou, China and Kuala Lumpur, Malaysia.
16
During the three months ended June 30, 2017, the Company announced plans to close our manufacturing facility located in Dormans, France. Production at the facility ceased during the first quarter of fiscal 2018 and the facility was sold during the fourth quarter of fiscal 2018.
During the three months ended March 31, 2016, the Company began the process to consolidate our two manufacturing facilities located in Glasgow, Scotland into one facility. The transition was substantially completed in the fourth quarter of fiscal 2017.
On January 19, 2016, the Company announced plans to consolidate our manufacturing facility located in Sonoma, California, into the Napa, California facility. The transition was substantially completed in the third quarter of fiscal 2017.
On November 1, 2015, the Company announced plans to consolidate our manufacturing facility located in Dublin, Ireland into the Drogheda, Ireland facility. The consolidation was substantially completed in the first quarter of fiscal 2017.
| ITEM 3. | LEGAL PROCEEDINGS |
The Company is subject to various legal claims and contingencies that arise out of the normal course of business, including claims related to commercial transactions, product liability, health and safety, taxes, environmental matters, employee matters and other matters. Litigation is subject to numerous uncertainties and the outcome of individual claims and contingencies is not predictable. It is possible that some legal matters for which reserves have or have not been established could result in an unfavorable outcome for the Company.
| ITEM 4. | MINE SAFETY DISCLOSURES |
Not Applicable.
17
PART II
| ITEM 5. | MARKET FOR REGISTRANT’S COMMON EQUITY, RELATED STOCKHOLDER MATTERS AND ISSUER PURCHASES OF EQUITY SECURITIES |
Our shares trade on the NASDAQ Global Select Market under the symbol LABL. The following table sets forth the high and low closing sales prices of our common stock (“Common Stock”) as reported on the NASDAQ Global Select Market during fiscal years 2018 and 2017. Our stock is thinly traded and accordingly, the prices below may not be indicative of prices at which a large number of shares can be traded or reflective of prices that would prevail in a more active market.
| Quarter Ended |
High | Low | Dividend Per Share | |||||||||
| March 31, 2018 |
$ | 84.05 | $ | 63.35 | $ | 0.05 | ||||||
| December 31, 2017 |
$ | 85.40 | $ | 71.40 | $ | 0.05 | ||||||
| September 30, 2017 |
$ | 82.60 | $ | 75.40 | $ | 0.05 | ||||||
| June 30, 2017 |
$ | 87.50 | $ | 67.70 | $ | 0.05 | ||||||
| March 31, 2017 |
$ | 81.15 | $ | 69.55 | $ | 0.05 | ||||||
| December 31, 2016 |
$ | 78.90 | $ | 63.80 | $ | 0.05 | ||||||
| September 30, 2016 |
$ | 69.57 | $ | 62.41 | $ | 0.05 | ||||||
| June 30, 2016 |
$ | 64.05 | $ | 50.38 | $ | 0.05 | ||||||
As of April 30, 2018, there were approximately 240 shareholders of record of the Common Stock.
Beginning in and since the fourth quarter of the fiscal year ended March 31, 2005, we have paid a quarterly dividend of $0.05 per common share.
18
FIVE YEAR PERFORMANCE GRAPH
The following performance graph compares Multi-Color’s cumulative annual total shareholder return from March 31, 2013 through March 31, 2018, to that of the NASDAQ Market Index, a broad market index, and the Morningstar Packaging & Containers Index (“Morningstar Packaging & Containers”), an index of 58 printing and packaging industry peer companies. The graph assumes that the value of the investment in the common stock and each index was $100 on March 31, 2013, and that all dividends were reinvested. Stock price performances shown in the graph are not indicative of future price performances.
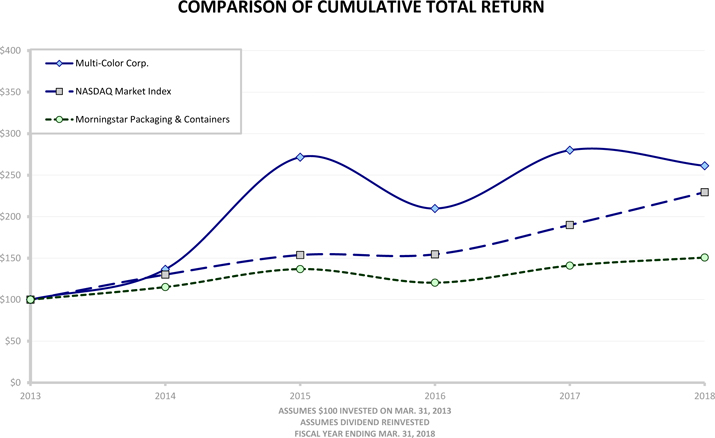
| Company/Market/Peer Group | 3/31/2013 | 3/31/2014 | 3/31/2015 | 3/31/2016 | 3/31/2017 | 3/31/2018 | ||||||||||||||||||
| Multi-Color Corporation |
$ | 100.00 | $ | 136.55 | $ | 271.67 | $ | 209.79 | $ | 280.02 | $ | 261.21 | ||||||||||||
| NASDAQ Market Index |
$ | 100.00 | $ | 130.18 | $ | 153.76 | $ | 154.62 | $ | 189.99 | $ | 229.43 | ||||||||||||
| Morningstar Packaging & Containers |
$ | 100.00 | $ | 115.20 | $ | 136.85 | $ | 120.45 | $ | 140.98 | $ | 150.76 | ||||||||||||
19
| ITEM 6. | SELECTED FINANCIAL DATA |
(In thousands, except per share data)
| Year Ended March 31, | ||||||||||||||||||||
| 2018 (1) | 2017 (2) | 2016 (3) | 2015 (4) | 2014 (5) | ||||||||||||||||
| Net revenues |
$ | 1,300,912 | $ | 923,295 | $ | 870,825 | $ | 810,772 | $ | 706,432 | ||||||||||
| Gross profit |
246,600 | 196,809 | 181,626 | 173,274 | 132,057 | |||||||||||||||
| Operating income |
115,580 | 110,966 | 94,428 | 96,912 | 60,123 | |||||||||||||||
| Net income attributable to Multi-Color Corporation |
71,951 | 60,996 | 47,739 | 45,716 | 28,224 | |||||||||||||||
|
|
|
|
|
|
|
|
|
|
|
|||||||||||
| Basic earnings per common share |
$ | 3.91 | $ | 3.61 | $ | 2.85 | $ | 2.75 | $ | 1.73 | ||||||||||
| Diluted earnings per common share |
$ | 3.87 | $ | 3.58 | $ | 2.82 | $ | 2.71 | $ | 1.70 | ||||||||||
|
|
|
|
|
|
|
|
|
|
|
|||||||||||
| Weighted average shares and equivalents outstanding – basic |
18,421 | 16,879 | 16,750 | 16,623 | 16,342 | |||||||||||||||
| Weighted average shares and equivalents outstanding – diluted |
18,583 | 17,024 | 16,952 | 16,877 | 16,599 | |||||||||||||||
|
|
|
|
|
|
|
|
|
|
|
|||||||||||
| Dividends per common share |
$ | 0.20 | $ | 0.20 | $ | 0.20 | $ | 0.20 | $ | 0.20 | ||||||||||
| Dividends paid |
4,024 | 3,876 | 3,351 | 3,302 | 3,276 | |||||||||||||||
|
|
|
|
|
|
|
|
|
|
|
|||||||||||
| Net working capital |
$ | 273,956 | $ | 109,420 | $ | 111,100 | $ | 99,951 | $ | 56,993 | ||||||||||
| Total assets |
2,902,976 | 1,091,990 | 1,070,066 | 927,371 | 964,466 | |||||||||||||||
| Current portion of long-term debt |
20,864 | 2,093 | 1,573 | 2,947 | 42,648 | |||||||||||||||
| Long-term debt |
1,577,821 | 479,408 | 504,706 | 455,583 | 435,554 | |||||||||||||||
| Total stockholders’ equity |
760,373 | 381,820 | 342,632 | 289,473 | 297,747 | |||||||||||||||
| (1) | Fiscal 2018 results include $1,419 ($945 after-tax) in costs related to the closure of our manufacturing facilities located in Merignac and Dormans, France and Norway, Michigan. Results include $19,901 ($15,267 after tax) of acquisition and integration expenses, of which $18,857 related to the Constantia Labels acquisition. |
| (2) | Fiscal 2017 results include $921 ($706 after-tax) in costs related to the closure of our manufacturing facilities located in the following: Glasgow, Scotland; Sonoma, California; Greensboro, North Carolina; Dublin, Ireland; Norway, Michigan and Watertown, Wisconsin. |
| (3) | Fiscal 2016 results include $5,200 ($3,708 after-tax) in costs related to the closure of our manufacturing facilities located in the following: Glasgow, Scotland; Sonoma, California; Greensboro, North Carolina; Dublin, Ireland; Norway, Michigan and Watertown, Wisconsin; and a sales office located near Toronto, Canada. |
| (4) | Fiscal 2015 results include a $951 impairment of goodwill related to the finalization of the fiscal 2014 annual impairment test for our Latin America Wine & Spirits reporting unit and $7,399 ($4,533 after-tax) in costs primarily related to the closure of our manufacturing facilities located in Norway, Michigan and Watertown, Wisconsin. |
| (5) | Fiscal 2014 results include a $13,475 impairment of goodwill related to our Latin America Wine & Spirits reporting unit, $1,166 ($737 after-tax) in costs related to the consolidation of our manufacturing facilities located in El Dorado Hills, California into the Napa, California facility, $1,116 ($781 after-tax) of integration expenses related to the Labelmakers Wine Division acquisition and other income of $3,800 ($3,800 after-tax) from settlement of a legal claim. |
Refer to Item 7, “Management’s Discussion and Analysis of Financial Condition and Results of Operations” for a discussion of the impact of acquisitions completed during recent fiscal years that would impact the comparability of the selected financial data above. During fiscal 2018, we acquired GEWA with manufacturing plants in Germany; TP Label, which has manufacturing plants in Tanzania; and Constantia Labels, which has manufacturing plants across 14 countries, with major operations across Europe, Asia and North America. During fiscal 2017, we acquired Italstereo and I.L.A., which have manufacturing plants in Italy; Graphix, which has a manufacturing plant in Australia; and GIP, which has a manufacturing plant in France. During fiscal 2016, we acquired Mr. Labels and Supa Stik, which have manufacturing plants in Australia; Barat Group, which has manufacturing plants in France; Super Label, which has manufacturing plants in Malaysia, Indonesia, the Philippines, Thailand, and China; and System Label and Cashin Print, which have manufacturing plants in Ireland. During fiscal 2015, we acquired Multiprint Labels Limited and New Era Packaging, which have manufacturing plants in Ireland, and Multi Labels Ltd., which has a manufacturing plant in England. During fiscal 2014, we acquired Imprimerie Champenoise, Labelmakers Wine Division, Flexo Print S.A. De C.V., Gern & Cie SA, John Watson & Company Limited and the DI-NA-CAL label business, which have manufacturing plants in France, Australia, Mexico, Switzerland, Scotland and the U.S., respectively.
20
| ITEM 7. | MANAGEMENT’S DISCUSSION AND ANALYSIS OF FINANCIAL CONDITION AND RESULTS OF OPERATIONS |
Information included in this Annual Report on Form 10-K contains certain forward-looking statements that involve potential risks and uncertainties. Multi-Color Corporation’s future results could differ materially from those discussed herein. Factors that could cause or contribute to such differences include, but are not limited to, those discussed herein and those discussed in Part 1, Item 1A “Risk Factors.” Readers are cautioned not to place undue reliance on these forward-looking statements that speak only as of the date thereof.
Refer to “Forward-Looking Statements” following the index in this Form 10-K. In the discussion that follows, all amounts are in thousands (both tables and text), except per share data and percentages.
Following is a discussion and analysis of the financial statements and other statistical data that management believes will enhance the understanding of the Company’s financial condition and results of operations.
RESULTS OF OPERATIONS
The following table shows for the periods indicated, certain components of Multi-Color’s consolidated statements of income as a percentage of net revenues.
| Percentage of Net Revenues | ||||||||||||
| 2018 | 2017 | 2016 | ||||||||||
| Net revenues |
100.0 | % | 100.0 | % | 100.0 | % | ||||||
| Cost of revenues |
81.0 | % | 78.7 | % | 79.1 | % | ||||||
|
|
|
|
|
|
|
|||||||
| Gross profit |
19.0 | % | 21.3 | % | 20.9 | % | ||||||
| Selling, general and administrative expenses |
10.0 | % | 9.2 | % | 9.4 | % | ||||||
| Facility closure expenses |
0.1 | % | 0.1 | % | 0.6 | % | ||||||
|
|
|
|
|
|
|
|||||||
| Operating income |
8.9 | % | 12.0 | % | 10.9 | % | ||||||
| Interest expense |
4.2 | % | 2.8 | % | 3.0 | % | ||||||
| Other expense (income), net |
0.6 | % | (0.3 | %) | 0.2 | % | ||||||
|
|
|
|
|
|
|
|||||||
| Income before income taxes |
4.1 | % | 9.5 | % | 7.7 | % | ||||||
| Income tax expense |
(1.4 | %) | 2.9 | % | 2.2 | % | ||||||
|
|
|
|
|
|
|
|||||||
| Net income attributable to Multi-Color Corporation |
5.5 | % | 6.6 | % | 5.5 | % | ||||||
|
|
|
|
|
|
|
|||||||
EXECUTIVE SUMMARY
We provide a complete line of innovative decorative label solutions and offer a variety of technical and graphic services to our customers based on their specific needs and requirements. Our customers include a wide range of consumer product companies, and we supply labels for many of the world’s best-known brands and products, including home & personal care, wine & spirits, food & beverage, healthcare and specialty consumer products.
During fiscal 2018, the Company had net revenues of $1,300,912 compared to $923,295 in the prior year, an increase of 41% or $377,617. Acquisitions occurring after the beginning of fiscal 2017 accounted for a 35% increase in revenues. Organic revenues increased 4%. Foreign exchange rates, primarily driven by appreciation of the Euro, led to a 2% increase in revenues year over year.
Gross profit increased 25% or $49,791 compared to the prior year. Acquisitions occurring after the beginning of fiscal 2017, net of divestitures, contributed $41,589 to the gross profit increase. Gross margins were 19% and 21% in fiscal 2018 and fiscal 2017, respectively.
The label markets we serve exist in a competitive environment amidst price pressures. We continually search for ways to reduce our costs through improved production and labor efficiencies, reduced substrate waste, new substrate options and lower substrate pricing.
Operating income increased 4% or $4,614 compared to the prior year primarily due to increased revenues. Acquisitions occurring after the beginning of fiscal 2017, net of divestitures, contributed $17,702 to operating income in fiscal 2018. Operating income in fiscal 2018 was impacted by inventory purchase accounting charges of $6,284 and acquisition and integration expenses of $19,901, primarily related to the Constantia Labels acquisition. Operating income in fiscal 2018 also includes $1,419 of expenses primarily related to consolidation of our manufacturing facilities in Merignac, France into our plant in Libourne, France and the closure of our plant in Dormans, France.
Other expense was $7,851 compared to other income of $2,735 in the prior year. Other expense in the current year primarily relates to foreign currency gains and losses on acquisition-related items, including derivatives and related debt and a loss on the sale of the Southeast Asian durables business. Other income in the prior year primarily related to supplemental purchase price adjustments and a gain on the purchase of a business.
During 2018, 2017 and 2016, sales to major customers approximated 14%, 17% and 17%, respectively, of the Company’s consolidated net revenues. All were made to The Procter & Gamble Company.
21
Our vision is global leadership in premium label solutions. We currently serve customers located across the globe. We continue to monitor and analyze new trends in the packaging and consumer products industries to ensure that we are providing appropriate services and products to our customers. Certain factors that influence our business include consumer spending, new product introductions, new packaging technologies and demographics.
Our primary objective for fiscal 2019 is to continue to improve organic growth rates for both revenue and earnings. We expect growth to come from improved performance in our operations and continued integration of our recent acquisitions. We continue to invest in additional and more productive capacity throughout our business to support operational efficiency and organic growth.
COMPARISON OF FISCAL YEARS ENDED MARCH 31, 2018 AND MARCH 31, 2017
Net Revenues
| 2018 | 2017 | $ Change |
% Change |
|||||||||||||
| Net revenues |
$ | 1,300,912 | $ | 923,295 | $ | 377,617 | 41 | % | ||||||||
Net revenues increased 41% or $377,617 in fiscal 2018 compared to the prior year. Acquisitions occurring after the beginning of fiscal 2017, net of divestitures, accounted for a 35% increase in revenues. Increased revenues globally led by North America contributed to an organic revenue increase of 4% and foreign exchange rates, primarily driven by appreciation of the Euro, led to a 2% increase in revenues year over year.
Cost of Revenues and Gross Profit
| 2018 | 2017 | $ Change |
% Change |
|||||||||||||
| Cost of revenues |
$ | 1,054,312 | $ | 726,486 | $ | 327,826 | 45 | % | ||||||||
| % of Net revenues |
81.0 | % | 78.7 | % | ||||||||||||
| Gross profit |
$ | 246,600 | $ | 196,809 | $ | 49,791 | 25 | % | ||||||||
| % of Net revenues |
19.0 | % | 21.3 | % | ||||||||||||
Cost of revenues increased 45% or $327,826 compared to the prior year. Acquisitions occurring after the beginning of fiscal 2017, net of divestitures, contributed 39% or $284,211, as did the unfavorable impact of foreign exchange rates of 2% or $13,399. Organic revenue growth increased cost of revenues by 4% or $30,216.
Gross profit increased 25% or $49,791 compared to the prior year. Acquisitions occurring after the beginning of fiscal 2017, net of divestitures, and favorable foreign exchange contributed $41,589 and $3,442, respectively, to the increase. Gross margins were 19.0% of net revenues for the current year compared to 21.3% in the prior year. Increased volumes and improved operating performance, predominantly in Europe, contributed to organic margin improvement of $4,760 compared to the prior year.
Selling, General and Administrative (SG&A) Expenses and Facility Closure Expenses
| 2018 | 2017 | $ Change |
% Change |
|||||||||||||
| Selling, general and administrative expenses |
$ | 129,601 | $ | 84,922 | $ | 44,679 | 53 | % | ||||||||
| % of Net revenues |
10.0 | % | 9.2 | % | ||||||||||||
| Facility closure expenses |
$ | 1,419 | $ | 921 | $ | 498 | 54 | % | ||||||||
| % of Net revenues |
0.1 | % | 0.1 | % | ||||||||||||
SG&A expenses increased 53% or $44,679 compared to the prior year. Acquisitions occurring after the beginning of fiscal 2017, net of divestitures, and unfavorable foreign exchange contributed $23,887 and $1,470, respectively, to the increase. In the current year, the Company incurred $19,901 of acquisition and integration expenses compared to $1,101 in the prior year. Acquisition and integration
22
expenses in fiscal 2018 include $18,858 related to the Constantia Labels acquisition. The remaining increase of $522 primarily relates to compensation expenses.
Facility closure expenses increased 54% or $498 compared to the prior year. These expenses primarily relate to consolidation of facilities in certain locations into other existing facilities. In fiscal 2018, these expenses primarily relate to the consolidation of our manufacturing facilities in Merignac, France into Libourne, France ($1,115) and the closure of our facility in Dormans, France ($260), and the consolidation of our plants in Norway, Michigan and Watertown, Wisconsin ($44). In the prior year, facility closure expenses related to the consolidation of the facilities in Dublin, Ireland ($355) and Glasgow, Scotland ($262), as well as the consolidation of the plants in Norway, Michigan and Watertown, Wisconsin ($133), Greensboro, North Carolina ($119), and Sonoma, California ($52).
Interest Expense and Other (Income) Expense, Net
| 2018 | 2017 | $ Change |
% Change |
|||||||||||||
| Interest expense |
$ | 54,027 | $ | 25,488 | $ | 28,539 | 112 | % | ||||||||
| Other (income) expense, net |
$ | 7,851 | $ | (2,735 | ) | $ | 10,586 | 387 | % | |||||||
Interest expense increased 112% or $28,539 compared to the prior year, primarily due to the increase in debt borrowings to finance the acquisition of Constantia Labels. The Company paid $2,194 in interest on loans prior to the acquisition and $4,587 in fees to access unused bridge loans necessary to secure financing for the acquisition, which contributed to the increase. The Company also wrote off unamortized deferred debt fees related to the prior credit agreement upon execution of the New Credit Agreement in the amount of $660.
Other expense was $7,851 compared to income of $2,735 in the prior year. Additional costs in the current year include, $6,478 of net foreign currency losses for the acquisition and structuring of Constantia Labels, the unfavorable impact of the release of a $1,124 foreign indemnification receivable in the current year period, for which an offsetting tax liability was also relieved reducing the current year effective tax rate and gains and losses on foreign exchange, and $512 of loss on the sale of the Southeast Asian Durables business. In the prior year period, adjustments were made to other income to reconcile certain supplemental purchase price accruals to management’s estimate of the liability for $887; and a gain of $690 was recorded to state Multi-Color’s 30% investment in Gironde Imprimerie Publicité at its fair value upon purchase of an additional 67.6% in the company (97.6% owned at March 31, 2017).
Income Tax Expense
| 2018 | 2017 | $ Change |
% Change |
|||||||||||||
| Income tax expense (benefit) |
$ | (18,195 | ) | $ | 26,848 | $ | (45,043 | ) | (168 | %) | ||||||
Income tax was a benefit of $18,195 in fiscal 2018 compared to expense of $26,848 in the prior year. The income tax benefit was primarily the result of tax rate changes enacted during the period in the U.S. and Belgium, which resulted in net benefits of $18,268 and $15,164, respectively. Tax expense was also impacted by discrete items recognized in the current period that decreased tax expense, including the release of a tax liability related to a foreign indemnification receivable related to previous acquisitions for $1,124, for which there was an offsetting impact in other expense and other discrete items. In addition, the Company adopted a new accounting standard to simplify share based payments during the current period, which decreased tax expense $1,462 compared to the prior year.
COMPARISON OF FISCAL YEARS ENDED MARCH 31, 2017 AND MARCH 31, 2016
Net Revenues
| 2017 | 2016 | $ Change |
% Change |
|||||||||||||
| Net revenues |
$ | 923,295 | $ | 870,825 | $ | 52,470 | 6 | % | ||||||||
Net revenues increased 6% to $923,295 from $870,825 in the prior year. Acquisitions occurring after the beginning of fiscal 2016 accounted for a 5% increase in revenues and organic revenues increased 3%. Foreign exchange rates, primarily driven by depreciation of the British pound and the Mexican peso, led to a 2% decrease in revenues year over year.
23
Cost of Revenues and Gross Profit
| 2017 | 2016 | $ Change |
% Change |
|||||||||||||
| Cost of revenues |
$ | 726,486 | $ | 689,199 | $ | 37,287 | 5 | % | ||||||||
| % of Net revenues |
78.7 | % | 79.1 | % | ||||||||||||
| Gross profit |
$ | 196,809 | $ | 181,626 | $ | 15,183 | 8 | % | ||||||||
| % of Net revenues |
21.3 | % | 20.9 | % | ||||||||||||
Cost of revenues increased 5% or $37,287 compared to the prior year. Acquisitions occurring after the beginning of fiscal 2016 contributed 4% or $33,448, partially offset by the favorable impact of foreign exchange rates of 2% or $14,110. Organic revenue growth increased cost of revenues by $17,949.
Gross profit increased 8% or $15,183 compared to the prior year. Acquisitions occurring after the beginning of fiscal 2016 contributed $9,876 to gross profit, partially offset by the effect of unfavorable foreign exchange rates of $1,168. Gross margins were 21.3% of net revenues for the current year compared to 20.9% in the prior year. Higher sales volumes in our core markets globally and improved operating efficiencies, primarily in North America, increased margins and led to $6,475 of organic margin improvement compared to the prior year.
Selling, General and Administrative (SG&A) Expenses and Facility Closure Expenses
| 2017 | 2016 | $ Change |
% Change |
|||||||||||||
| Selling, general and administrative expenses |
$ | 84,922 | $ | 81,998 | $ | 2,924 | 4 | % | ||||||||
| % of Net revenues |
9.2 | % | 9.4 | % | ||||||||||||
| Facility closure expenses |
$ | 921 | $ | 5,200 | $ | (4,279 | ) | (82 | %) | |||||||
| % of Net revenues |
0.1 | % | 0.6 | % | ||||||||||||
SG&A expenses increased 4% or $2,924 compared to the prior year. Acquisitions occurring after the beginning of fiscal 2016 contributed $4,853 to the increase, partially offset by a decrease of $911 due to the favorable impact of foreign exchange rates. In the current year, the Company incurred $1,101 of acquisition and integration expenses compared to $3,683 in the prior year. The remaining increase primarily relates to increases in compensation costs including internal compliance resources and increased incentive accruals related to company performance in fiscal 2017.
Facility closure expenses were $921 in the current year compared to $5,200 in the prior year. These expenses relate to consolidation of facilities in certain locations into other existing facilities, primarily related to the consolidation of our manufacturing facilities in Dublin, Ireland ($355), the consolidation of our manufacturing facilities in Glasgow, Scotland ($262), the consolidation of our plants in Norway, Michigan and Watertown, Wisconsin ($133), Sonoma, California ($52), and Greensboro, North Carolina ($119) into existing facilities. In the prior year, facility closure expenses related to the consolidation of the facilities in Dublin ($1,476) and Glasgow ($597), as well as the consolidation of the plants in Norway, Michigan and Watertown, Wisconsin ($632), Greensboro, North Carolina ($2,247), and Sonoma, California ($220) and closure of a sales office in Toronto, Canada ($28).
Interest Expense and Other (Income) Expense, Net
| 2017 | 2016 | $ Change |
% Change |
|||||||||||||
| Interest expense |
$ | 25,488 | $ | 25,751 | $ | (263 | ) | (1 | %) | |||||||
| Other (income) expense, net |
$ | (2,735 | ) | $ | 1,867 | $ | (4,602 | ) | 246 | % | ||||||
Other income was $2,735 compared to expense of $1,867 in the prior year. During the current year, adjustments were made to other income for $887 to reconcile certain supplemental purchase price accruals to management’s current estimate of the liability. Additionally, an adjustment was made to other income for $690 to state MCC’s 30% investment in Gironde Imprimerie Publicité (GIP) at its fair value
24
upon purchase of an additional 67.6% ownership in the company (97.6% owned at March 31, 2017). The remaining change in other income primarily relates to the favorable impact of gains and losses on foreign exchange compared to unfavorable foreign exchange resulting from re-measurement of equipment and other payables from certain currencies into functional currencies in the prior year.
Income Tax Expense
| 2017 | 2016 | $ Change |
% Change |
|||||||||||||
| Income tax expense |
$ | 26,848 | $ | 18,981 | $ | 7,867 | 41 | % | ||||||||
The Company’s effective tax rate was 30% in fiscal 2017 compared to 28% in the prior year. The tax rate for fiscal 2016 was impacted by the release of valuation allowances on deferred tax assets held in certain foreign jurisdictions and other discrete items that reduced tax expense compared to the current year.
Liquidity and Capital Resources
Summary of Cash Flows
Net cash provided by operating activities was $56,907 in 2018 compared to $107,210 in the same period of the prior year. Net income adjusted for non-cash expenses consisting primarily of depreciation, amortization and deferred income taxes was $118,555 in the current year compared to $109,097 in the same period of the prior year. The $9,458 increase from 2017 to 2018 in net income adjusted for non-cash expenses was primarily driven by a 17% increase in net income from $61,365 in 2017 to $71,897 in 2018. Our use of operating assets and liabilities of $61,648 in the current year increased from a use of $1,887 in the prior year.
Net cash provided by operating activities was $107,210 in 2017 and $99,401 in 2016. Net income adjusted for non-cash expenses consisting primarily of depreciation and amortization, goodwill impairment, facility closure expenses related to impairment loss on fixed assets and changes in deferred taxes was $109,097 in 2017 compared to $98,936 in 2016. The $10,161 increase from 2016 to 2017 in net income adjusted for non-cash expenses was primarily driven by a 28% increase in net income from $47,829 in 2016 to $61,365 in 2017. Our net usage from operating assets and liabilities of $1,887 in 2017 decreased from our net source of $465 in 2016.
Net cash used in investing activities was $1,080,331 in 2018, $73,635 in 2017, and $135,032 in 2016 of which $1,024,644, $28,839 and $103,245 was used for acquisitions in those years, respectively, including the Constantia Labels acquisition in 2018. The remaining net usages of $55,687 in 2018, $44,796 in 2017, and $31,787 in 2016 were capital expenditure related, primarily for the purchase of presses, net of various sales.
Net cash provided by financing activities in fiscal 2018 was $1,060,089, which included $1,098,907 of net debt borrowings, $26,669 in debt issuance costs, dividends paid of $4,024 and $2,572 of proceeds from the issuance of common stock. Dividends paid included $3,741 to shareholders of Multi-Color Corporation and $279 to the minority shareholders of our 60% owned legal entity in Malaysia, which was sold in the second quarter of fiscal 2018. Cash provided by financing activities also included $10,697 in deferred payments related to the Italstereo, Supa Stik, GIP and TP Label acquisitions.
Net cash used in financing activities in fiscal 2017 was $33,641, which included $31,467 of net debt payments and $4,000 of proceeds from various stock transactions, offset by $1,784 in deferred payments related to the Mr. Labels and Flexo Print acquisitions and dividends paid of $3,876. Dividends paid include $3,378 to shareholders of Multi-Color Corporation and $498 to the minority shareholders of our 60% owned legal entity in Malaysia.
Net cash provided by financing activities in fiscal 2016 was $45,200, which included $44,997 of net debt borrowings (primarily used to finance acquisitions) and $4,713 of proceeds from various stock transactions, offset by $1,141 in deferred payments related to the Monroe Etiquette and Multiprint acquisitions and dividends paid of $3,351.
Capital Resources
In conjunction with the Constantia Labels acquisition, effective October 31, 2017 the Company entered into a credit agreement (the “New Credit Agreement”) with various lenders. The New Credit Agreement replaced the Company’s previous credit agreement and consists of (i) a senior secured first lien term loan A facility (the “Term Loan A Facility”) in an aggregate principal amount of $150,000 with a five year maturity, (ii) a senior secured first lien term loan B facility (the “Term Loan B Facility”) in an aggregate principal amount of $500,000 with a seven year maturity, and (iii) a senior secured first lien revolving credit facility (the “Revolving Credit Facility”) in an aggregate principal amount up to $400,000, comprised of a $360,000 U.S. revolving credit facility (the “U.S. Revolving Credit Facility“) and a $40,000 U.S. Dollar equivalent Australian sub-facility (the “Australian Revolving Sub-Facility”), each with a five year maturity.
The New Credit Agreement contains customary mandatory and optional prepayment provisions and customary events of default. The New Credit Agreement’s Term Loan A Facility, Term Loan B Facility and U.S. Revolving Credit Facility (together, the “U.S. facilities”) are guaranteed by substantially all of the Company’s direct and indirect wholly owned domestic subsidiaries, and such guarantors pledged substantially all their assets as collateral to secure the U.S. facilities. The Australian Revolving Sub-Facility is secured by substantially all of the assets of the Australian borrower and its direct and indirect subsidiaries.
25
The New Credit Agreement can be used for working capital, capital expenditures and other corporate purposes and to fund permitted acquisitions (as defined in the New Credit Agreement). Loans under the New Credit Agreement bear interest at variable rates plus a margin, based on the Company’s consolidated secured net leverage ratio. The weighted average interest rate on borrowings under the U.S. Revolving Credit Facility was 4.42% at March 31, 2018. The interest rates on borrowings under the Term Loan A Facility, Term Loan B Facility and Australian Revolving Sub-Facility were 4.13% at March 31, 2018.
The New Credit Agreement contains customary representations and warranties as well as customary negative and affirmative covenants, which require the Company to maintain the following financial covenants at the end of each quarter: (i) the consolidated secured net leverage ratio as of the last day of any fiscal quarter of the Company shall not exceed 4.50 to 1.00 for the fiscal quarters ended during the period of March 31, 2017 through, and including June 30, 2019 and (ii) the consolidated secured net leverage ratio as of the last day of any fiscal quarter of the Company shall not exceed 4.25 to 1.00 for the fiscal quarters ended during the period of September 30, 2019 and thereafter.
The New Credit Agreement, the indenture governing the 4.875% Senior Notes (the “4.875% Senior Notes Indenture”) and the indenture governing the 6.125% Senior Notes (the “6.125% Senior Notes Indenture” and together with the 4.875% Senior Notes Indenture, the “Indentures”) limit the Company’s ability to incur additional indebtedness. Additional covenants contained in the New Credit Agreement and the Indentures, among other things, restrict the ability of the Company to dispose of assets, incur guarantee obligations, make restricted payments, create liens, make equity or debt investments, change the business conducted by the Company and its subsidiaries, and engage in certain transactions with affiliates. Under the New Credit Agreement and the Indentures, certain changes in control of the Company could result in the occurrence of an Event of Default. In addition, the New Credit Agreement limits the ability of the Company to modify terms of the Indentures. As of March 31, 2018, the Company was in compliance with the covenants in the New Credit Agreement and the Indentures.
Available borrowings under the U.S. Revolving Credit Facility and Australian Revolving Sub-Facility were $302,179 and $6,967, respectively, at March 31, 2018. The Company also has various other uncommitted lines of credit available at March 31, 2018 in the aggregate amount of $22,319.
The $600,000 aggregate principal amount of 4.875% Senior Notes due 2025 (the “4.875% Senior Notes”) were issued in October 2017 to fund the acquisition of Constantia Labels. The 4.875% Senior Notes are unsecured senior obligations of the Company. Interest is payable on the 4.875% Senior Notes on May 1st and November 1st of each year beginning May 1, 2018 until the maturity date of November 1, 2025. The Company’s obligations under the 4.875% Senior Notes are guaranteed by certain of the Company’s existing direct and indirect wholly-owned domestic subsidiaries.
The $250,000 aggregate principal amount of 6.125% Senior Notes due 2022 (the “6.125% Senior Notes”) were issued in November 2014. The 6.125% Senior Notes are unsecured senior obligations of the Company. Interest is payable on the 6.125% Senior Notes on June 1st and December 1st of each year beginning June 1, 2015 until the maturity date of December 1, 2022. The Company’s obligations under the 6.125% Senior Notes are guaranteed by certain of the Company’s existing direct and indirect wholly-owned domestic subsidiaries.
Contractual Obligations
The following table summarizes the Company’s contractual obligations as of March 31, 2018:
| Total | Year 1 | Year 2 | Year 3 | Year 4 | Year 5 | More than 5 years |
||||||||||||||||||||||
| Long-term debt |
$ | 1,591,567 | $ | 16,673 | $ | 12,690 | $ | 12,651 | $ | 12,634 | $ | 463,169 | $ | 1,073,750 | ||||||||||||||
| Capital leases |
36,288 | 4,191 | 3,619 | 3,196 | 2,204 | 2,040 | 21,038 | |||||||||||||||||||||
| Interest on long-term debt (1) |
436,570 | 72,662 | 71,941 | 71,916 | 69,736 | 61,082 | 89,233 | |||||||||||||||||||||
| Rent due under operating leases |
85,526 | 23,538 | 18,705 | 11,873 | 9,874 | 7,228 | 14,308 | |||||||||||||||||||||
| Unconditional purchase obligations |
28,145 | 27,359 | 476 | 206 | 91 | 13 | — | |||||||||||||||||||||
| Pension obligations |
382 | 9 | 15 | 22 | 29 | 37 | 270 | |||||||||||||||||||||
| Unrecognized tax benefits (2) |
— | — | — | — | — | — | — | |||||||||||||||||||||
| Contingent liability acquired |
1,433 | — | — | 1,433 | — | — | — | |||||||||||||||||||||
| Deferred purchase price |
25,725 | 10,027 | 2,142 | 5,176 | 1,232 | 7,148 | — | |||||||||||||||||||||
|
|
|
|
|
|
|
|
|
|
|
|
|
|
|
|||||||||||||||
| Total contractual obligations |
$ | 2,205,636 | $ | 154,459 | $ | 109,588 | $ | 106,473 | $ | 95,800 | $ | 540,717 | $ | 1,198,599 | ||||||||||||||
|
|
|
|
|
|
|
|
|
|
|
|
|
|
|
|||||||||||||||
| (1) | Interest on floating rate debt was estimated using projected forward London Interbank Offered Rate (LIBOR) and Bank Bill Swap Bid Rates (BBSY) rates as of March 31, 2018. |
| (2) | The table excludes $7,038 in liabilities related to unrecognized tax benefits as the timing and extent of such payments are not determinable. |
We do not have any off-balance sheet arrangements as of March 31, 2018.
26
Recent Acquisitions
On October 31, 2017, the Company completed its acquisition pursuant to the Sale and Purchase Agreement (as amended) with Constantia Flexibles Germany GmbH, Constantia Flexibles International GmbH, Constantia Flexibles Group GmbH and GPC Holdings B.V. (collectively, “Constantia Flexibles”), acquiring 100% of the Labels Division of Constantia Flexibles (“Constantia Labels”), for $1,299,403 less net cash acquired of $16,115. In addition, the purchase price includes future performance based earnouts with a total fair value of $9,026 and deferred payments of $3,901, estimated as of the acquisition date. Constantia Labels, headquartered in Vienna, Austria, is a leader in label solutions serving the food, beverage and consumer packaging goods industries. Constantia Labels has approximately 2,800 employees globally and 24 production plants across 14 countries, with major operations across Europe, Asia and North America. The acquisition included a 75% controlling interest in certain label operations in South Africa.
On October 11, 2017, the Company acquired 100% of TP Label Limited, the labels business of Tanzania Printers Limited (Tanzania Printers), and TP Kenya Limited (collectively, “TP Label”), which is located in Dar es Salaam, Tanzania with a sales and distribution center located in Nairobi, Kenya, for $15,929 less net cash acquired of $397. The purchase price included $9,557, which was retained by MCC at closing and was used to repay the indebtedness of TP Label Limited and Tanzania Printers during the three months ended March 31, 2018. The purchase price also included an indemnification holdback of $1,593 to fund certain potential obligations of the sellers with respect to the transaction, which is deferred for one year after the closing date. TP Label is primarily a pressure sensitive and cut and stack label business, serving customers in the food and beverage market.
On August 3, 2017, the Company acquired 100% of GEWA Etiketten GmbH (GEWA), including the remaining 2.4% of the common shares of GIP (see below), for $21,846 plus net debt assumed of $5,228. Upon closing, $2,185 of the purchase price was deposited into an escrow account and is to be released to the seller on the 18-month anniversary of the closing date in accordance with the purchase agreement. The escrow amount is to fund certain potential indemnification obligations of the seller with respect to the transaction. GEWA is located in Bingen am Rhein, Germany and specializes in producing pressure sensitive labels for the wine and spirits market.
On January 3, 2017, the Company acquired 100% of Graphix Labels and Packaging Pty Ltd. (Graphix) for $17,261. The purchase price included $1,631 that is deferred for two years after the closing date. Graphix is located in Melbourne, Victoria, Australia and specializes in producing labels for both the food & beverage and wine & spirits markets.
In January 2017, the Company acquired an additional 67.6% of the common shares of GIP for $2,084 plus net debt assumed of $862. The purchase price included a deferred payment of $208 that was paid during the three months ended March 31, 2018. The Company acquired 30% of GIP as part of the Barat acquisition in fiscal 2016. Immediately prior to obtaining a controlling interest in GIP, the Company recognized a gain of $690 as a result of re-measuring our equity interest to its fair value of $771 based on the most recent share activity. In August 2017, the Company acquired the remaining 2.4% of the common shares of GIP in conjunction with the GEWA acquisition (see above). GIP is located in the Bordeaux region of France and specializes in producing labels for the wine & spirits market.
On July 6, 2016, the Company acquired 100% of Industria Litografica Alessandrina S.r.l. (I.L.A.) for $6,301 plus net debt assumed of $3,547. The purchase price included $819 that is deferred for three years after the closing date. I.L.A. is located in the Piedmont region of Italy and specializes in production of premium self-adhesive and wet glue labels primarily for the wine & spirits market and also services the food industry.
On July 1, 2016, the Company acquired 100% of Italstereo Resin Labels S.r.l. (Italstereo) for $3,342 less net cash acquired of $181. The purchase price included a deferred payment of $201 that was paid in the three months ended September 30, 2017 and a deferred payment of $133 that is due two years after the closing date. Italstereo is located near Lucca, Italy and specializes in producing pressure sensitive adhesive resin coated labels, seals and emblems.
On January 4, 2016, the Company acquired 100% of Cashin Print for $17,487 less net cash acquired of $135 and 100% of System Label for $11,665 less net cash acquired of $2,025. Cashin Print and System Label are located in Castlebar, Ireland and Roscommon, Ireland, respectively. The purchase prices for Cashin Print and System Label included $1,411 and $1,571, respectively, for purchase price adjustments, which were paid to the sellers during the three months ended June 30, 2016. In addition, the purchase prices for Cashin Print and System Label include deferred payments of $3,317 and $1,011, respectively. The deferred payment for Cashin Print will be paid during the fourth quarter of fiscal 2019. System Label is currently not forecasted to make the required performance threshold. During the third quarter of fiscal 2017, the long-term liabilities related to these deferred payments were reduced based on management’s current estimate of the future payout and $887 was recorded in other income in the consolidated statements of income. The acquired businesses supply multinational customers in Ireland, the United Kingdom and Continental Europe and provide Multi-Color with the opportunity to supply a broader product range to a larger customer base, especially in the healthcare market.
On October 1, 2015, the Company acquired 100% of Supa Stik Labels (Supa Stik) for $6,787 less net cash acquired of $977. Supa Stik is located in Perth, West Australia and services the local wine, food & beverage and healthcare label markets. The purchase price included $622 that was paid in the third quarter of fiscal 2018.
On August 11, 2015, the Company acquired 90% of the shares of Super Label based in Kuala Lumpur, Malaysia, which was publicly listed on the Malaysian stock exchange. During the second and third quarters of fiscal 2016, the Company acquired the remaining shares and delisted Super Label. The total purchase price was $39,782 less net cash acquired of $6,035. Super Label had operations in Malaysia, Indonesia, the Philippines, Thailand, and China and produced home & personal care, food & beverage and specialty consumer products labels. This acquisition expanded our presence in China and gave us access to new label markets in Southeast Asia. The acquisition
27
included an 80% controlling interest in the label operations in Indonesia and a 60% controlling interest in certain legal entities in Malaysia and China (the Southeast Asian durables business). During the third quarter of fiscal 2017, the Company acquired the remaining shares of the label operations in Indonesia for $514. On July 3, 2017, the Company sold its 60% controlling interest in its Southeast Asian durables business to its minority shareholders for $3,620 in net cash proceeds. The Company recognized a loss of $512 on the sale of the business, which was recognized in other expense in the consolidated statements of income.
On May 4, 2015, the Company acquired 100% of Barat Group (Barat) based in Bordeaux, France for $49,973 less net cash acquired of $746. Barat operated four manufacturing facilities in Bordeaux and Burgundy, France, and the acquisition gave the Company access to the label market in the Bordeaux wine region and expanded our presence in Burgundy.
On May 1, 2015, the Company acquired 100% of Mr. Labels in Brisbane, Queensland Australia for $2,110. The purchase price included $196 that was deferred until the first anniversary of the closing date, which was paid during the first quarter of fiscal 2017. Mr. Labels provides labels primarily to food and beverage customers.
Inflation
We do not believe that our operations have been materially affected by inflation. Inflationary price increases for raw materials could adversely impact our sales and profitability in the future.
Critical Accounting Policies and Estimates
The preparation of consolidated financial statements requires us to make estimates and judgments that affect the reported amounts of assets, liabilities, revenue and expenses. We continually evaluate our estimates, including, but not limited to, those related to revenue recognition, bad debts, inventories and any related reserves, income taxes, fixed assets, goodwill and intangible assets. We base our estimates on historical experience and on various other assumptions believed to be reasonable under the facts and circumstances. Actual results may differ from these estimates under different assumptions or conditions.
We believe the following critical accounting policies impact the more significant judgments and estimates used in the preparation of our consolidated financial statements. Additionally, our senior management has reviewed the critical accounting policies and estimates with the Board of Directors’ Audit and Finance Committee. For a more detailed discussion of the application of these and other accounting policies, refer to Note 2 of the consolidated financial statements.
Business Combinations
The Company allocates the purchase price of its acquisitions to the assets acquired and liabilities assumed based upon their respective fair values at the acquisition date. The Company reports in its consolidated financial statements provisional amounts for the items for which accounting is incomplete. Goodwill is adjusted for any changes to provisional amounts made within the measurement period. The Company utilizes management estimates and an independent third-party valuation firm to assist in determining the fair values of assets acquired and liabilities assumed. Such estimates and valuations require the Company to make significant assumptions, including projections of future events and operating performance.
Goodwill and Other Acquired Intangible Assets
Impairment reviews comparing fair value to carrying value are highly judgmental and involve the use of significant estimates and assumptions, which determine whether there is potential impairment and the amount of any impairment charge recorded. Fair value assessments involve estimates of discounted cash flows that are dependent upon discount rates and long-term assumptions regarding future sales and margin trends, market conditions, cash flow and multiples of revenue and earnings before interest, taxes, depreciation and amortization (“EBITDA”). Actual results may differ from these estimates. Fair value measurements used in the impairment reviews of goodwill and intangible assets are Level 3 measurements. See further information about our policy for fair value measurements within this section below.
Goodwill. Goodwill is not amortized and is tested for impairment annually. Impairment is also tested when events or changes in circumstances indicate that the assets’ carrying values may be greater than the fair values.
No events or changes in circumstances occurred in 2018 that required goodwill impairment testing in between annual tests. During the second quarter of fiscal 2017, based on operating results for the Europe Wine & Spirits (EUR W&S) reporting unit, a quantitative goodwill impairment assessment was performed for this reporting unit. No impairment was indicated.
Goodwill has been assigned to reporting units for purposes of impairment testing. The reporting units are the Company’s divisions. The Company can evaluate qualitative factors to determine if it is more likely than not that the fair value of a reporting unit is less than the carrying value and whether it is necessary to perform the two-step goodwill impairment test.
In conjunction with our annual impairment tests as of January 31, 2018 and January 31, 2017, the Company performed quantitative assessments for all of our reporting units. The first step of the impairment test compares the fair value of each reporting unit to its carrying value. We estimated the fair value of each reporting unit using a combination of: (i) a market approach based on multiples of revenue and EBITDA from recent comparable transactions and other market data; and (ii) an income approach based on expected future cash flows discounted at rates ranging between 8.5% to 11.5% in 2018 and 8.5% to 11.0% in 2017. The discount rate reflects the risk associated
28
with each respective reporting unit, including the industry and geographies in which they operate. The market and income approaches were both considered, with the income approach selected based on judgment of the comparability of the recent transactions due to the fluid nature of the business and recent acquisitions. The market approach was used to corroborate values determined by the income approach. We considered recent economic and industry trends, as well as risk in executing our current plans from the perspective of a hypothetical buyer in estimating expected future cash flows in the income approach.
For all of our reporting units, the first step of the impairment test did not indicate potential impairment as the estimated fair value of the reporting units exceeded the carrying amount. As a result, the second step of the impairment test was not required in either of the two years.
Significant assumptions used to estimate the fair value of our reporting units include estimates of future cash flows, discount rates and multiples of revenue and EBITDA. These assumptions are typically not considered individually because assumptions used to select one variable should also be considered when selecting other variables; however, sensitivity of the overall fair value assessment to each significant variable is also considered.
Intangible Assets. Intangible assets with definite useful lives are amortized over periods of up to 21 years based on a number of assumptions including estimated period of economic benefit and utilization. Intangible assets are tested for impairment when events or changes in circumstances indicate that the assets’ carrying values may be greater than their fair values. Tests are performed over asset groups at the lowest level of identifiable cash flows.
The Company performed impairment testing on long-lived assets, including intangibles, at certain manufacturing locations during fiscal 2018 and 2017 due to the existence of impairment indicators. The estimated undiscounted future cash flows associated with the long-lived assets were greater than their carrying values, and therefore, no impairment was present in either of these two years related to intangible assets.
Impairment of Long-Lived Assets
We review long-lived assets for impairment when events or changes in circumstances indicate that assets might be impaired and the related carrying amounts may not be recoverable. Changes in market conditions and/or losses of a production line could have a material impact on the consolidated statements of income. The determination of whether impairment exists involves various estimates and assumptions, including the determination of the undiscounted cash flows estimated to be generated by the assets involved in the review. The cash flow estimates are based upon our historical experience, adjusted to reflect estimated future market and operating conditions. Measurement of an impairment loss requires a determination of fair value. We base our estimates of fair values on quoted market prices when available, independent appraisals as appropriate and industry trends or other market knowledge. Tests are performed over asset groups at the lowest level of identifiable cash flows.
The Company recorded $150 in impairment losses on fixed assets during fiscal 2018 related to assets that more likely than not will be sold or otherwise disposed of significantly before the end of their estimated useful lives, all of which related to the closure of our manufacturing facilities in Merignac and Dormans, France. The Company recorded $2,006 in impairment losses on fixed assets during fiscal 2016 related to assets that more likely than not will be sold or otherwise disposed of significantly before the end of their estimated useful lives, $1,874 of which related to the closure of various manufacturing facilities. In addition, the Company performed impairment testing on long-lived assets at certain manufacturing locations during fiscal 2018, 2017 and 2016 due to the existence of other impairment indicators. The estimated undiscounted cash flows associated with the long-lived assets were greater than their carrying values, and therefore, no impairment was present in any of these three years related to long-lived assets.
Income Taxes
The Company is subject to income taxes in both the United States and numerous foreign jurisdictions. Income taxes are recorded based on the current year amounts payable or refundable. Deferred income taxes are recognized at the enacted tax rates for the expected future tax consequences related to temporary differences between amounts reported for income tax purposes and financial reporting purposes as well as any tax attributes. Deferred income taxes are not provided for the undistributed earnings of subsidiaries operating outside of the U.S. that have been permanently reinvested in foreign operations.
We regularly review our deferred income tax balances for each jurisdiction to estimate whether these deferred income tax balances are more likely than not to be realized based on the information currently available. Projected future taxable income is based on forecasted results and assumptions as to the jurisdiction in which the income will be earned. The timing of reversals of any existing temporary differences is based on our methods of accounting for income taxes and current tax legislation. Unless the deferred tax balances are more likely than not to be realized, a valuation allowance is established to reduce the carrying values of any deferred tax balances until circumstances indicate that realization becomes more likely than not.
The Company establishes reserves for income tax related uncertainties based on estimates of whether it is more likely than not that the tax uncertainty would be sustained upon challenge by the appropriate tax authorities. Provisions for and changes to these reserves and any related net interest and penalties are included in income tax expense in the consolidated statements of income. Significant judgment is required when evaluating our tax provisions and determining our provision for income taxes. We regularly review our tax positions and we adjust the reserves as circumstances change.
29
Fair Value Measurements
The Company defines fair value as the price that would be received to sell an asset, or paid to transfer a liability, in an orderly transaction between market participants at the measurement date. To increase consistency and comparability in fair value measurements, the Company uses a three-level hierarchy that prioritizes the use of observable inputs. The three levels are:
Level 1 – Quoted market prices in active markets for identical assets and liabilities
Level 2 – Observable inputs other than quoted market prices in active markets for identical assets and liabilities
Level 3 – Unobservable inputs
The determination of where an asset or liability falls in the hierarchy requires significant judgment.
Fair value measurements of nonfinancial assets and nonfinancial liabilities are primarily used in goodwill, other intangible assets and long-lived assets impairment analyses, the valuation of acquired intangibles and in the valuation of assets held for sale. The Company tests goodwill for impairment annually, as of the last day of January of each fiscal year. Impairment is also tested when events or changes in circumstances indicate that the assets’ carrying values may be greater than the fair values. Goodwill and intangible assets are typically valued using Level 3 inputs.
New Accounting Pronouncements
For a discussion of new accounting pronouncements, see Note 2 to our consolidated financial statements.
30
| ITEM 7A. | QUANTITATIVE AND QUALITATIVE DISCLOSURES ABOUT MARKET RISK |
(In thousands, except for statistical data)
Interest Rate Risk Management
The Company is exposed to market risks from changes in interest rates on certain of its outstanding debt. Loans under the New Credit Agreement (see Note 8), bear interest at variable rates plus a margin, based on the Company’s consolidated secured net leverage ratio.
In conjunction with entering into the New Credit Agreement, the Company entered into two spot non-amortizing interest rate swap agreements (“Swaps”) with a total notional amount of $300,000 to convert variable rate debt to fixed rate debt. These Swaps became effective October 2017, will expire in October 2018, and will result in interest payments of 1.5625% plus the applicable margin per the requirements in the New Credit Agreement. The Company also entered into two forward starting non-amortizing Swaps with a total notional amount of $300,000 to convert variable rate debt to fixed rate debt that will become effective in October 2018, will expire in October 2022, and will result in interest payments of 2.1345% plus the applicable margin per the requirements in the New Credit Agreement.
Upon inception, the Swaps were designated as cash flow hedges, with the gains and losses, net of tax, measured on an ongoing basis, recorded in accumulated other comprehensive income.
Foreign Currency Risk Management
Foreign currency exchange risk arises from our international operations as well as from transactions with customers or suppliers denominated in currencies other than the U.S. Dollar. The functional currency of each of the Company’s subsidiaries is generally the currency of the country in which the subsidiary operates or the U.S. Dollar. The results of operations of our foreign subsidiaries are translated into U.S. Dollars at the average exchange rate for each monthly period. As foreign exchange rates change, there are changes to the U.S. Dollar equivalent of sales and expenses denominated in foreign currencies. During fiscal 2018, approximately 55% of our net sales were made by our foreign subsidiaries and their combined net income was 47% of the Company’s net income.
The balance sheets of our foreign subsidiaries are translated into U.S. Dollars at the closing exchange rates of each monthly balance sheet date. During fiscal 2018, the Company recorded an unrealized foreign currency translation gain of $93,892 in other comprehensive income as a result of movements in foreign currency exchange rates related to our international operations. See Notes 2 and 19 to the Company’s consolidated financial statements. As of March 31, 2018, a 10% change in these foreign exchange rates would change shareholders’ equity by approximately $151. This hypothetical change was calculated by multiplying the net assets of each of our foreign subsidiaries by a 10% change in the applicable foreign exchange rate.
In July 2017, the Company entered into a foreign currency forward contract to fix the Euro cash component of the Constantia Labels purchase price. The notional amount of the foreign currency forward contract was €495,600 with a maturity date of November 2017. Concurrent with the closing of the Company’s purchase of Constantia Labels on October 31, 2017, the Company exited the foreign currency forward contract resulting in a $8,109 net gain. The foreign currency forward contract was not designated as a hedging instrument, and all changes in the fair value of the contract were reported in current period earnings.
Net Investment Hedging
In September 2017, as a means of managing foreign currency risk related to our significant operations in Europe, the Company executed four fixed-for-fixed cross currency swaps, in which the Company will pay Euros and receive U.S. Dollars with a combined notional amount of €400,000, which have a maturity date of November 2025. This will effectively convert U.S. Dollar denominated debt to Euro denominated debt. The Company initially designated €205,000 of swap notional as a net investment hedge of the Company’s net investment in our European operations under ASU 2017-12 and applied the spot method to these hedges. The changes in fair values of the derivative instruments that are designated and qualify as hedges of net investments in foreign operations are recognized in AOCI to offset the changes in the values of the net investments being hedged.
The remaining €195,000 of swap notional was not designated as an accounting hedge in September 2017. Therefore, changes in fair value of the derivative instruments were recognized in other income and expense in the consolidated statements of income. Subsequently, in November 2017, the Company formally designated the remaining €195,000 of swap notional as a net investment hedge under ASU 2017-12, bringing the total designated notional value to €400,000. Effective November 1, 2017, hedge accounting was applied to the newly designated swap notional of €195,000.
31
| ITEM 8. | FINANCIAL STATEMENTS AND SUPPLEMENTARY DATA |
Index to Consolidated Financial Statements and Financial Statement Schedules
CONSOLIDATED FINANCIAL STATEMENTS
| Page | ||
| 33-34 | ||
| 35 | ||
| 36 | ||
| 37 | ||
| 38 | ||
| 39 | ||
| 40 |
All financial statement schedules have been omitted because they are either not required or the information is included in the financial statements or notes thereto.
32
REPORT OF INDEPENDENT REGISTERED PUBLIC ACCOUNTING FIRM
Board of Directors and Stockholders
Multi-Color Corporation
Opinion on the financial statements
We have audited the accompanying consolidated balance sheets of Multi-Color Corporation (an Ohio corporation) and subsidiaries (the “Company”) as of March 31, 2018 and 2017, the related consolidated statements of income, comprehensive income, stockholders’ equity, and cash flows for each of the three years in the period ended March 31, 2018, and the related notes (collectively referred to as the “financial statements”). In our opinion, the financial statements present fairly, in all material respects, the financial position of the Company as of March 31, 2018 and 2017, and the results of its operations and its cash flows for each of the three years in the period ended March 31, 2018, in conformity with accounting principles generally accepted in the United States of America.
We also have audited, in accordance with the standards of the Public Company Accounting Oversight Board (United States) (“PCAOB”), the Company’s internal control over financial reporting as of March 31, 2018, based on criteria established in the 2013 Internal Control—Integrated Framework issued by the Committee of Sponsoring Organizations of the Treadway Commission (“COSO”), and our report dated May 30, 2018 expressed an unqualified opinion.
Basis for opinion
These financial statements are the responsibility of the Company’s management. Our responsibility is to express an opinion on the Company’s financial statements based on our audits. We are a public accounting firm registered with the PCAOB and are required to be independent with respect to the Company in accordance with the U.S. federal securities laws and the applicable rules and regulations of the Securities and Exchange Commission and the PCAOB.
We conducted our audits in accordance with the standards of the PCAOB. Those standards require that we plan and perform the audit to obtain reasonable assurance about whether the financial statements are free of material misstatement, whether due to error or fraud. Our audits included performing procedures to assess the risks of material misstatement of the financial statements, whether due to error or fraud, and performing procedures that respond to those risks. Such procedures included examining, on a test basis, evidence supporting the amounts and disclosures in the financial statements. Our audits also included evaluating the accounting principles used and significant estimates made by management, as well as evaluating the overall presentation of the financial statements. We believe that our audits provide a reasonable basis for our opinion.
/s/ GRANT THORNTON LLP
We have served as the Company’s auditor since 2015.
Cincinnati, Ohio
May 30, 2018
33
REPORT OF INDEPENDENT REGISTERED PUBLIC ACCOUNTING FIRM
Board of Directors and Stockholders
Multi-Color Corporation
Opinion on internal control over financial reporting
We have audited the internal control over financial reporting of Multi-Color Corporation (an Ohio corporation) and subsidiaries (the “Company”) as of March 31, 2018, based on criteria established in the 2013 Internal Control—Integrated Framework issued by the Committee of Sponsoring Organizations of the Treadway Commission (“COSO”). In our opinion, the Company maintained, in all material respects, effective internal control over financial reporting as of March 31, 2018, based on criteria established in the 2013 Internal Control—Integrated Framework issued by COSO.
We also have audited, in accordance with the standards of the Public Company Accounting Oversight Board (United States) (“PCAOB”), the consolidated financial statements of the Company as of and for the year ended March 31, 2018, and our report dated May 30, 2018 expressed an unqualified opinion on those financial statements.
Basis for opinion
The Company’s management is responsible for maintaining effective internal control over financial reporting and for its assessment of the effectiveness of internal control over financial reporting, included in the accompanying Management’s Report on Internal Control over Financial Reporting (“Management’s Report”). Our responsibility is to express an opinion on the Company’s internal control over financial reporting based on our audit. We are a public accounting firm registered with the PCAOB and are required to be independent with respect to the Company in accordance with the U.S. federal securities laws and the applicable rules and regulations of the Securities and Exchange Commission and the PCAOB.
We conducted our audit in accordance with the standards of the PCAOB. Those standards require that we plan and perform the audit to obtain reasonable assurance about whether effective internal control over financial reporting was maintained in all material respects. Our audit included obtaining an understanding of internal control over financial reporting, assessing the risk that a material weakness exists, testing and evaluating the design and operating effectiveness of internal control based on the assessed risk, and performing such other procedures as we considered necessary in the circumstances. We believe that our audit provides a reasonable basis for our opinion.
Our audit of, and opinion on, the Company’s internal control over financial reporting does not include the internal control over financial reporting of GEWA Etiketten GmbH (“GEWA”), TP Label Limited (“TP Label”), and Constantia Labels, collectively, whose financial statements reflect total assets and revenues constituting 54% and 24% percent, respectively, of the related consolidated financial statement amounts as of and for the year ended March 31, 2018. As indicated in Management’s Report, GEWA, TP Label, and Constantia Labels were acquired during the year ended March 31, 2018. Management’s assertion on the effectiveness of the Company’s internal control over financial reporting excluded internal control over financial reporting of GEWA, TP Label, and Constantia Labels.
Definition and limitations of internal control over financial reporting
A company’s internal control over financial reporting is a process designed to provide reasonable assurance regarding the reliability of financial reporting and the preparation of financial statements for external purposes in accordance with generally accepted accounting principles. A company’s internal control over financial reporting includes those policies and procedures that (1) pertain to the maintenance of records that, in reasonable detail, accurately and fairly reflect the transactions and dispositions of the assets of the company; (2) provide reasonable assurance that transactions are recorded as necessary to permit preparation of financial statements in accordance with generally accepted accounting principles, and that receipts and expenditures of the company are being made only in accordance with authorizations of management and directors of the company; and (3) provide reasonable assurance regarding prevention or timely detection of unauthorized acquisition, use, or disposition of the company’s assets that could have a material effect on the financial statements.
Because of its inherent limitations, internal control over financial reporting may not prevent or detect misstatements. Also, projections of any evaluation of effectiveness to future periods are subject to the risk that controls may become inadequate because of changes in conditions, or that the degree of compliance with the policies or procedures may deteriorate.
/s/ GRANT THORNTON LLP
Cincinnati, Ohio
May 30, 2018
34
CONSOLIDATED STATEMENTS OF INCOME
For the Years Ended March 31
(In thousands, except per share data)
| 2018 | 2017 | 2016 | ||||||||||
| Net revenues |
$ | 1,300,912 | $ | 923,295 | $ | 870,825 | ||||||
| Cost of revenues |
1,054,312 | 726,486 | 689,199 | |||||||||
|
|
|
|
|
|
|
|||||||
| Gross profit |
246,600 | 196,809 | 181,626 | |||||||||
| Selling, general and administrative expenses |
129,601 | 84,922 | 81,998 | |||||||||
| Facility closure expenses |
1,419 | 921 | 5,200 | |||||||||
|
|
|
|
|
|
|
|||||||
| Operating income |
115,580 | 110,966 | 94,428 | |||||||||
| Interest expense |
54,027 | 25,488 | 25,751 | |||||||||
| Other (income) expense, net |
7,851 | (2,735 | ) | 1,867 | ||||||||
|
|
|
|
|
|
|
|||||||
| Income before income taxes |
53,702 | 88,213 | 66,810 | |||||||||
| Income tax expense (benefit) |
(18,195 | ) | 26,848 | 18,981 | ||||||||
|
|
|
|
|
|
|
|||||||
| Net income |
71,897 | 61,365 | 47,829 | |||||||||
| Less: Net income (loss) attributable to noncontrolling interests |
(54 | ) | 369 | 90 | ||||||||
|
|
|
|
|
|
|
|||||||
| Net income attributable to Multi-Color Corporation |
$ | 71,951 | $ | 60,996 | $ | 47,739 | ||||||
|
|
|
|
|
|
|
|||||||
| Weighted average shares and equivalents outstanding: |
||||||||||||
| Basic |
18,421 | 16,879 | 16,750 | |||||||||
| Diluted |
18,583 | 17,024 | 16,952 | |||||||||
|
|
|
|
|
|
|
|||||||
| Basic earnings per common share |
$ | 3.91 | $ | 3.61 | $ | 2.85 | ||||||
| Diluted earnings per common share |
$ | 3.87 | $ | 3.58 | $ | 2.82 | ||||||
| Dividends per common share |
$ | 0.20 | $ | 0.20 | $ | 0.20 | ||||||
|
|
|
|
|
|
|
|||||||
The accompanying notes are an integral part of the consolidated financial statements.
35
CONSOLIDATED STATEMENTS OF COMPREHENSIVE INCOME
For the Years Ended March 31
(In thousands)
| 2018 | 2017 | 2016 | ||||||||||
| Net income |
$ | 71,897 | $ | 61,365 | $ | 47,829 | ||||||
| Other comprehensive income (loss): |
||||||||||||
| Unrealized foreign currency translation gain (loss) (1) |
93,892 | (25,254 | ) | (2,671 | ) | |||||||
| Unrealized gain (loss) on derivative contracts, net of tax (2) |
(25,408 | ) | 196 | 485 | ||||||||
| Change in minimum pension liability, net of tax (3) |
34 | 174 | 35 | |||||||||
|
|
|
|
|
|
|
|||||||
| Total other comprehensive income (loss) |
68,518 | (24,884 | ) | (2,151 | ) | |||||||
|
|
|
|
|
|
|
|||||||
| Comprehensive income |
140,415 | 36,481 | 45,678 | |||||||||
| Less: Comprehensive income attributable to noncontrolling interests |
1,686 | 157 | 163 | |||||||||
|
|
|
|
|
|
|
|||||||
| Comprehensive income attributable to Multi-Color Corporation |
$ | 138,729 | $ | 36,324 | $ | 45,515 | ||||||
|
|
|
|
|
|
|
|||||||
| (1) | The amount for the years ended March 31, 2018, 2017 and 2016 includes a tax impact of $(654), $284 and $(277), respectively, related to the settlement of foreign currency denominated intercompany loans. |
| (2) | Amounts are net of tax of $10,423, $(133) and $(303) for the years ended March 31, 2018, 2017 and 2016, respectively. |
| (3) | Amounts are net of tax of $(21), $(108) and $(22) for the years ended March 31, 2018, 2017 and 2016, respectively. |
The accompanying notes are an integral part of the consolidated financial statements.
36
As of March 31
(In thousands, except per share data)
| 2018 | 2017 | |||||||
| ASSETS |
||||||||
| Current assets: |
||||||||
| Cash and cash equivalents |
$ | 67,708 | $ | 25,229 | ||||
| Accounts receivable, net |
306,542 | 141,211 | ||||||
| Other receivables |
16,589 | 7,871 | ||||||
| Inventories, net |
167,950 | 63,995 | ||||||
| Prepaid expenses |
34,271 | 12,187 | ||||||
| Other current assets |
8,123 | 3,253 | ||||||
|
|
|
|
|
|||||
| Total current assets |
601,183 | 253,746 | ||||||
| Property, plant and equipment, net |
510,002 | 247,261 | ||||||
| Goodwill |
1,196,634 | 412,550 | ||||||
| Intangible assets, net |
580,233 | 169,220 | ||||||
| Other non-current assets |
12,097 | 6,365 | ||||||
| Deferred income tax assets |
2,827 | 2,848 | ||||||
|
|
|
|
|
|||||
| Total assets |
$ | 2,902,976 | $ | 1,091,990 | ||||
|
|
|
|
|
|||||
| LIABILITIES AND STOCKHOLDERS’ EQUITY |
||||||||
| Current liabilities: |
||||||||
| Current portion of long-term debt |
$ | 20,864 | $ | 2,093 | ||||
| Accounts payable |
192,341 | 88,475 | ||||||
| Accrued expenses and other liabilities |
114,022 | 53,758 | ||||||
|
|
|
|
|
|||||
| Total current liabilities |
327,227 | 144,326 | ||||||
| Long-term debt |
1,577,821 | 479,408 | ||||||
| Deferred income tax liabilities |
149,950 | 65,761 | ||||||
| Other liabilities |
87,605 | 20,675 | ||||||
|
|
|
|
|
|||||
| Total liabilities |
2,142,603 | 710,170 | ||||||
| Commitments and contingencies |
||||||||
| Stockholders’ equity: |
||||||||
| Preferred stock, no par value, 1,000 shares authorized, no shares outstanding |
— | — | ||||||
| Common stock, no par value, stated value of $0.10 per share; 40,000 shares authorized, 20,753 and 17,254 shares issued at March 31, 2018 and 2017, respectively |
1,403 | 1,054 | ||||||
| Paid-in capital |
402,252 | 158,399 | ||||||
| Treasury stock, 307 and 302 shares at cost at March 31, 2018 and 2017, respectively |
(11,528 | ) | (11,168 | ) | ||||
| Retained earnings |
384,671 | 316,461 | ||||||
| Accumulated other comprehensive loss |
(19,241 | ) | (85,795 | ) | ||||
|
|
|
|
|
|||||
| Total stockholders’ equity attributable to Multi-Color Corporation |
757,557 | 378,951 | ||||||
| Noncontrolling interests |
2,816 | 2,869 | ||||||
|
|
|
|
|
|||||
| Total stockholders’ equity |
760,373 | 381,820 | ||||||
|
|
|
|
|
|||||
| Total liabilities and stockholders’ equity |
$ | 2,902,976 | $ | 1,091,990 | ||||
|
|
|
|
|
|||||
The accompanying notes are an integral part of the consolidated financial statements.
37
CONSOLIDATED STATEMENTS OF STOCKHOLDERS’ EQUITY
(In thousands)
| Common Stock | Accumulated Other Comprehensive Loss |
|||||||||||||||||||||||||||||||
| Shares Issued |
Amount | Paid-In Capital |
Treasury Stock |
Retained Earnings |
Noncontrolling Interests |
Total | ||||||||||||||||||||||||||
| March 31, 2015 |
16,906 | $ | 1,021 | $ | 141,729 | $ | (8,768 | ) | $ | 214,463 | $ | (58,972 | ) | $ | — | $ | 289,473 | |||||||||||||||
| Net income |
47,739 | 90 | 47,829 | |||||||||||||||||||||||||||||
| Other comprehensive income (loss) |
(2,151 | ) | 73 | (2,078 | ) | |||||||||||||||||||||||||||
| Acquisitions |
3,477 | 3,477 | ||||||||||||||||||||||||||||||
| Issuance of common stock |
190 | 19 | 4,065 | 4,084 | ||||||||||||||||||||||||||||
| Excess tax benefit from stock-based compensation |
2,007 | 2,007 | ||||||||||||||||||||||||||||||
| Restricted stock grant |
15 | — | ||||||||||||||||||||||||||||||
| Stock-based compensation |
2,982 | 2,982 | ||||||||||||||||||||||||||||||
| Shares acquired under employee plans |
(1,788 | ) | (1,788 | ) | ||||||||||||||||||||||||||||
| Common stock dividends |
(3,354 | ) | (3,354 | ) | ||||||||||||||||||||||||||||
|
|
|
|
|
|
|
|
|
|
|
|
|
|
|
|
|
|||||||||||||||||
| March 31, 2016 |
17,111 | $ | 1,040 | $ | 150,783 | $ | (10,556 | ) | $ | 258,848 | $ | (61,123 | ) | $ | 3,640 | $ | 342,632 | |||||||||||||||
| Net income |
60,996 | 369 | 61,365 | |||||||||||||||||||||||||||||
| Other comprehensive loss |
(24,672 | ) | (212 | ) | (24,884 | ) | ||||||||||||||||||||||||||
| Acquisitions |
62 | 62 | ||||||||||||||||||||||||||||||
| Issuance of common stock |
136 | 14 | 3,338 | 3,352 | ||||||||||||||||||||||||||||
| Excess tax benefit from stock-based compensation |
1,258 | 1,258 | ||||||||||||||||||||||||||||||
| Restricted stock grant |
8 | — | ||||||||||||||||||||||||||||||
| Restricted stock forfeitures |
(1 | ) | — | |||||||||||||||||||||||||||||
| Stock-based compensation |
3,042 | 3,042 | ||||||||||||||||||||||||||||||
| Shares acquired under employee plans |
(612 | ) | (612 | ) | ||||||||||||||||||||||||||||
| Buyout of noncontrolling interest |
(22 | ) | (492 | ) | (514 | ) | ||||||||||||||||||||||||||
| Common stock dividends |
(3,383 | ) | (3,383 | ) | ||||||||||||||||||||||||||||
| Dividends paid to noncontrolling interests |
(498 | ) | (498 | ) | ||||||||||||||||||||||||||||
|
|
|
|
|
|
|
|
|
|
|
|
|
|
|
|
|
|||||||||||||||||
| March 31, 2017 |
17,254 | $ | 1,054 | $ | 158,399 | $ | (11,168 | ) | $ | 316,461 | $ | (85,795 | ) | $ | 2,869 | $ | 381,820 | |||||||||||||||
| Net income |
71,951 | (54 | ) | 71,897 | ||||||||||||||||||||||||||||
| Other comprehensive income |
66,778 | 1,740 | 68,518 | |||||||||||||||||||||||||||||
| Constantia Labels acquisition |
3,383 | 338 | 237,482 | 1,100 | 238,920 | |||||||||||||||||||||||||||
| Issuance of common stock |
110 | 11 | 2,915 | 2,926 | ||||||||||||||||||||||||||||
| Restricted stock grant |
9 | — | ||||||||||||||||||||||||||||||
| Restricted stock forfeitures |
(3 | ) | — | |||||||||||||||||||||||||||||
| Stock-based compensation |
3,456 | 3,456 | ||||||||||||||||||||||||||||||
| Shares acquired under employee plans |
(360 | ) | (360 | ) | ||||||||||||||||||||||||||||
| Common stock dividends |
(3,741 | ) | (3,741 | ) | ||||||||||||||||||||||||||||
| Sale of Southeast Asian durables business |
(231 | ) | (2,484 | ) | (2,715 | ) | ||||||||||||||||||||||||||
| Acquisition of noncontrolling interest |
7 | (76 | ) | (69 | ) | |||||||||||||||||||||||||||
| Dividends paid to noncontrolling interests |
(279 | ) | (279 | ) | ||||||||||||||||||||||||||||
|
|
|
|
|
|
|
|
|
|
|
|
|
|
|
|
|
|||||||||||||||||
| March 31, 2018 |
20,753 | $ | 1,403 | $ | 402,252 | $ | (11,528 | ) | $ | 384,671 | $ | (19,241 | ) | $ | 2,816 | $ | 760,373 | |||||||||||||||
|
|
|
|
|
|
|
|
|
|
|
|
|
|
|
|
|
|||||||||||||||||
The accompanying notes are an integral part of the consolidated financial statements.
38
CONSOLIDATED STATEMENTS OF CASH FLOWS
For the Years Ended March 31
(In thousands)
| 2018 | 2017 | 2016 | ||||||||||
| CASH FLOWS FROM OPERATING ACTIVITIES: |
||||||||||||
| Net income |
$ | 71,897 | $ | 61,365 | $ | 47,829 | ||||||
| Adjustments to reconcile net income to net cash provided by operating activities: |
| |||||||||||
| Depreciation |
46,913 | 33,480 | 31,295 | |||||||||
| Amortization of intangible assets |
26,009 | 14,425 | 13,178 | |||||||||
| Loss on sale of Southeast Asian durables business |
512 | — | — | |||||||||
| Loss on write-off of deferred financing fees |
660 | — | — | |||||||||
| Amortization of deferred financing costs |
3,174 | 1,665 | 1,692 | |||||||||
| Impairment loss on fixed assets |
— | — | 132 | |||||||||
| Facility closure expenses related to impairment loss on fixed assets |
— | — | 1,874 | |||||||||
| Gain on sale of Watertown facility |
— | — | (476 | ) | ||||||||
| Loss (gain) on benefit plans related to facility closures |
55 | 133 | 88 | |||||||||
| Gain on previously held equity interests |
— | (690 | ) | — | ||||||||
| Net (gain)/loss on disposal of property, plant and equipment |
1,150 | (230 | ) | 282 | ||||||||
| Net (gain)/loss on derivative contracts |
4,018 | 103 | (276 | ) | ||||||||
| Stock-based compensation expense |
3,456 | 3,042 | 2,982 | |||||||||
| Excess tax benefit from stock-based compensation |
— | (1,258 | ) | (2,007 | ) | |||||||
| Deferred income taxes, net |
(39,289 | ) | (2,938 | ) | 2,343 | |||||||
| Changes in assets and liabilities, net of acquisitions: |
||||||||||||
| Accounts receivable |
(35,410 | ) | (7,457 | ) | (5,412 | ) | ||||||
| Inventories |
(3,072 | ) | (1,999 | ) | 3,273 | |||||||
| Prepaid expenses and other assets |
(12,069 | ) | 1,067 | (10,581 | ) | |||||||
| Accounts payable |
(9,892 | ) | 171 | 11,773 | ||||||||
| Accrued expenses and other liabilities |
(1,205 | ) | 6,331 | 1,412 | ||||||||
|
|
|
|
|
|
|
|||||||
| Net cash provided by operating activities |
56,907 | 107,210 | 99,401 | |||||||||
|
|
|
|
|
|
|
|||||||
| CASH FLOWS FROM INVESTING ACTIVITIES: |
||||||||||||
| Capital expenditures |
(60,105 | ) | (46,146 | ) | (34,892 | ) | ||||||
| Investment in acquisitions, net of cash acquired |
(1,024,644 | ) | (28,839 | ) | (103,245 | ) | ||||||
| Net proceeds from sale of Southeast Asian durables business |
3,620 | — | — | |||||||||
| Proceeds from sale of Watertown and Norway facilities |
— | — | 2,505 | |||||||||
| Proceeds from sale of property, plant and equipment |
798 | 1,350 | 600 | |||||||||
|
|
|
|
|
|
|
|||||||
| Net cash used in investing activities |
(1,080,331 | ) | (73,635 | ) | (135,032 | ) | ||||||
|
|
|
|
|
|
|
|||||||
| CASH FLOWS FROM FINANCING ACTIVITIES: |
||||||||||||
| Borrowings under revolving lines of credit |
478,519 | 265,746 | 362,960 | |||||||||
| Payments under revolving lines of credit |
(618,804 | ) | (292,797 | ) | (309,621 | ) | ||||||
| Borrowings of long-term debt |
1,250,000 | 2,156 | 823 | |||||||||
| Repayments of long-term debt |
(10,808 | ) | (6,572 | ) | (9,165 | ) | ||||||
| Payment of acquisition related deferred payments |
(10,697 | ) | (1,784 | ) | (1,141 | ) | ||||||
| Buyout of non-controlling interest |
— | (514 | ) | — | ||||||||
| Proceeds from issuance of common stock |
2,572 | 2,742 | 2,706 | |||||||||
| Excess tax benefit from stock-based compensation |
— | 1,258 | 2,007 | |||||||||
| Debt issuance costs |
(26,669 | ) | — | (18 | ) | |||||||
| Dividends paid |
(4,024 | ) | (3,876 | ) | (3,351 | ) | ||||||
|
|
|
|
|
|
|
|||||||
| Net cash provided by/(used in) financing activities |
1,060,089 | (33,641 | ) | 45,200 | ||||||||
|
|
|
|
|
|
|
|||||||
| Effect of foreign exchange rate changes on cash |
5,814 | (2,414 | ) | 91 | ||||||||
|
|
|
|
|
|
|
|||||||
| Net increase/(decrease) in cash and cash equivalents |
42,479 | (2,480 | ) | 9,660 | ||||||||
| Cash and cash equivalents, beginning of year |
25,229 | 27,709 | 18,049 | |||||||||
|
|
|
|
|
|
|
|||||||
| Cash and cash equivalents, end of year |
$ | 67,708 | $ | 25,229 | $ | 27,709 | ||||||
|
|
|
|
|
|
|
|||||||
The accompanying notes are an integral part of the consolidated financial statements.
39
NOTES TO CONSOLIDATED FINANCIAL STATEMENTS
(In thousands, except for statistical and per share data)
| (1) | THE COMPANY |
Multi-Color Corporation (Multi-Color, MCC, we, us, our or the Company), headquartered near Cincinnati, Ohio, is a leader in global label solutions supporting a number of the world’s most prominent brands including leading producers of home & personal care, wine & spirits, food & beverage, healthcare and specialty consumer products. MCC serves international brand owners in the North American, Latin American, EMEA (Europe, Middle East and Africa) and Asia Pacific regions with a comprehensive range of the latest label technologies in Pressure Sensitive, Cut and Stack, In-Mold, Shrink Sleeve, Heat Transfer, Roll Fed, and Aluminum Labels.
| (2) | SUMMARY OF SIGNIFICANT ACCOUNTING POLICIES |
Basis of Presentation
References to 2018, 2017 and 2016 are for the fiscal years ended March 31, 2018, 2017 and 2016, respectively. The consolidated financial statements included herein have been prepared in conformity with accounting principles generally accepted in the United States of America (U.S. GAAP) and include the accounts of the Company and its wholly-owned subsidiaries. All significant intercompany accounts and transactions have been eliminated. Certain prior year balances have been reclassified to conform to current year classifications.
As of March 31, 2018, the Company’s operations were conducted through the Consumer Product Goods, Wine & Spirits and Food & Beverage operating segments, which are aggregated into one reportable segment in accordance with the Financial Accounting Standards Board (“FASB”) Accounting Standards Codification (“ASC”) Topic 280, “Segment Reporting.” The metrics used by management to assess the performance of the Company’s operating segments include revenue trends, gross profit margin and operating margin. The Company’s operating segments have historically had similar economic characteristics and are expected to have similar economic characteristics and long-term financial performance in future periods.
Use of Estimates in Financial Statements
In preparing financial statements in conformity with U.S. GAAP, management makes estimates and assumptions that affect the reported amounts of assets and liabilities and disclosures of contingent assets and liabilities at the date of the financial statements, as well as the reported amounts of revenues and expenses during the reporting period. Actual results could differ from those estimates.
Business Combinations
The Company allocates the purchase price of its acquisitions to the assets acquired and liabilities assumed based upon their respective fair values at the acquisition date. The Company utilizes management estimates and an independent third-party valuation firm to assist in determining these fair values. The excess of the acquisition price over the estimated fair value of the net assets is recorded as goodwill. Goodwill is adjusted for any changes to acquisition date fair value amounts made within the measurement period. Acquisition-related transaction costs are recognized separately from the business combination and expensed as incurred.
Revenue Recognition
The Company recognizes revenue on sales of products when the customer receives title to the goods and risk of loss transfers to the customer, which is generally upon shipment or delivery depending on sales terms, persuasive evidence of an arrangement exists, the sales price is fixed or determinable and collectability is reasonably assured. Revenues are generally denominated in the currency of the country from which the product is shipped and are net of applicable returns and discounts.
In addition, the Company also recognizes revenues related to multiple-element arrangements with both pre-press activities and traditional label revenues. These pre-press charges are specific to the customer and product under contract and the output generated has no marketable use outside of the label production process for the specific contract run. We have only one deliverable for revenue recognition and a single unit of accounting. As such, to the extent that revenue for these pre-press activities is separately billed, it is deferred and recognized over the period of the associated label runs. These label runs range from a single production run to ongoing runs over an average of 3-4 months. The associated costs are also deferred and recognized over the same period.
Shipping fees billed to customers are included in net revenues and shipping costs are included in cost of revenues in the consolidated statements of income. Taxes collected from customers and remitted to governmental authorities in applicable jurisdictions are excluded from net revenues.
Cost of Revenues
Cost of revenues primarily consists of direct materials and supplies consumed in the manufacture of product, as well as manufacturing labor, depreciation expense and direct overhead expense necessary to acquire and convert the purchased materials and supplies into finished product. Cost of revenues also includes inbound freight costs and costs to distribute products to customers.
Selling, General and Administrative Expenses
Selling, general and administrative expenses (SG&A) primarily consist of sales and marketing costs, corporate and divisional administrative and other costs and depreciation and amortization expense related to non-manufacturing assets. Advertising costs are charged to expense as incurred and were minimal in 2018, 2017 and 2016.
40
Research and Development Costs
Research and development costs are charged to expense as incurred and were $5,834, $5,274 and $5,520 in 2018, 2017 and 2016, respectively.
Cash and Cash Equivalents
The Company records all highly liquid short-term investments with maturities of three months or less as cash equivalents. At March 31, 2018 and 2017, the Company had cash in foreign bank accounts of $66,061 and $24,656, respectively. Outstanding checks of $2,280 and $8,876 were included in accounts payable as of March 31, 2018 and 2017, respectively.
Accounts Receivable
Our customers are primarily major consumer product, food & beverage, wine & spirits and container companies. Accounts receivable consist of amounts due from customers in connection with our normal business activities and are carried at sales value less allowance for doubtful accounts. The allowance for doubtful accounts is established to reflect the expected losses of accounts receivable based on past collection history, age, account payment status compared to invoice payment terms and specific individual risks identified. The delinquency of a receivable account is determined based on these factors. The Company does not accrue interest on aged accounts receivable.
Supply Chain Financing and Factoring
The Company has entered into supply chain financing agreements with certain customers and factoring arrangements with certain banks. The receivables for the agreements are sold without recourse to the customers’ banks and are accounted for as sales of accounts receivable. Losses on the sale of these receivables are included in selling, general and administrative expenses in the consolidated statements of income. Losses on the sale of these receivables are included in selling, general and administrative expenses in the consolidated statements of income, and losses of $1,325, $561 and $363 were recorded during 2018, 2017 and 2016, respectively.
Inventories
Inventories are valued at the lower of cost or net realizable value and substantially all are maintained using the FIFO (first-in, first-out) or specific identification method. Excess and obsolete inventory allowances are generally established based on inventory age.
Property, Plant and Equipment
Property, plant and equipment are stated at cost, net of accumulated depreciation.
Depreciation expense, which includes the amortization of assets recorded under capital leases, is calculated using the straight-line method over the estimated useful lives of the assets, or the remaining terms of the leases, as follows:
| Buildings Building improvements |
|
20-39 years 15 years |
| |
| Machinery and equipment |
3-15 years | |||
| Computers |
3-5 years | |||
| Furniture and fixtures |
5-10 years |
Goodwill and Other Acquired Intangible Assets
Impairment reviews comparing fair value to carrying value are highly judgmental and involve the use of significant estimates and assumptions, which determine whether there is potential impairment and the amount of any impairment charge recorded. Fair value assessments involve estimates of discounted cash flows that are dependent upon discount rates and long-term assumptions regarding future sales and margin trends, market conditions, cash flow and multiples of revenue and earnings before interest, taxes, depreciation and amortization (“EBITDA”). Actual results may differ from these estimates. Fair value measurements used in the impairment reviews of goodwill and intangible assets are Level 3 measurements. See further information about our policy for fair value measurements within this section below. See further information regarding our impairment tests in Note 7.
Goodwill. Goodwill is not amortized and is tested for impairment annually. Impairment is also tested when events or changes in circumstances indicate that the assets’ carrying values may be greater than the fair values.
Goodwill has been assigned to reporting units for purposes of impairment testing. The reporting units are the Company’s divisions. The Company can evaluate qualitative factors to determine if it is more likely than not that the fair value of a reporting unit is less than the carrying value and whether it is necessary to perform the two-step goodwill impairment test. The first step of the impairment test compares the fair value of the reporting unit to the carrying value. The market and income approaches were both considered, with the income approach selected based on judgement of the comparability of recent transactions due to the fluid nature of the business and recent acquisitions. The market approach was used to corroborate values determined by the income approach.
Intangible Assets. Intangible assets with definite useful lives are amortized over periods of up to 21 years based on a number of assumptions including estimated period of economic benefit and utilization. Intangible assets are tested for impairment when events or changes in circumstances indicate that the assets’ carrying values may be greater than their fair values. We test for impairment by comparing (i) estimates of undiscounted future cash flows, before interest charges, included in our operating plans to (ii) the carrying values of the related assets. Tests are performed over asset groups at the lowest level of identifiable cash flows.
Impairment of Long-Lived Assets
We review long-lived assets for impairment when events or changes in circumstances indicate that assets might be impaired and the related carrying amounts may not be recoverable. Changes in market conditions and/or losses of a production line could have a material
41
impact on the consolidated statements of income. The determination of whether impairment exists involves various estimates and assumptions, including the determination of the undiscounted cash flows estimated to be generated by the assets involved in the review. The cash flow estimates are based upon our historical experience, adjusted to reflect estimated future market and operating conditions. Measurement of an impairment loss requires a determination of fair value. We base our estimates of fair values on quoted market prices when available, independent appraisals as appropriate and industry trends or other market knowledge. Tests are performed over asset groups at the lowest level of identifiable cash flows.
Income Taxes
The Company is subject to income taxes in the United States and numerous foreign jurisdictions. Income taxes are recorded based on the current year amounts payable or refundable. Deferred income taxes are recognized at the enacted tax rates for the expected future tax consequences related to temporary differences between amounts reported for income tax purposes and financial reporting purposes as well as any tax attributes. Deferred income taxes are not provided for the undistributed earnings of subsidiaries operating outside of the U.S. that have been permanently reinvested in foreign operations.
We regularly review our deferred income tax balances for each jurisdiction to estimate whether these deferred income tax balances are more likely than not to be realized based on the information currently available. Projected future taxable income is based on forecasted results and assumptions as to the jurisdiction in which the income will be earned. The timing of reversals of any existing temporary differences is based on our methods of accounting for income taxes and current tax legislation. Unless the deferred tax balances are more likely than not to be realized, a valuation allowance is established to reduce the carrying values of any deferred tax balances until circumstances indicate that realization becomes more likely than not.
The Company establishes reserves for income tax related uncertainties based on estimates of whether it is more likely than not that the tax uncertainty would be sustained upon challenge by the appropriate tax authorities. Provisions for and changes to these reserves and any related net interest and penalties are included in income tax expense in the consolidated statements of income. Significant judgment is required when evaluating our tax provisions and determining our provision for income taxes. We regularly review our tax positions and we adjust the reserves as circumstances change.
Earnings per Common Share
Basic earnings per common share (EPS) is computed by dividing net income attributable to Multi-Color Corporation by the weighted average number of common shares outstanding during the period. Diluted EPS is computed by dividing net income attributable to Multi-Color Corporation by the sum of the weighted average number of common shares outstanding during the period plus, if dilutive, potential common shares outstanding during the period. Potential common shares outstanding during the period consist of restricted shares and the incremental common shares issuable upon the exercise of stock options and are reflected in diluted EPS by application of the treasury stock method.
Derivative Financial Instruments
The Company accounts for derivative financial instruments by recognizing derivative instruments as either assets or liabilities in the consolidated balance sheets at fair value and recognizing the resulting gains or losses as adjustments to the consolidated statements of income or accumulated other comprehensive income (loss). The Company does not hold or issue derivative financial instruments for trading or speculative purposes.
For derivative instruments that hedge the exposure to variability in expected future cash flows that are designated and qualify as cash flow hedges, the gain or loss on the derivative instrument is reported as a component of AOCI in stockholders’ equity and reclassified into earnings in the same period or periods during which the hedged transaction affects earnings. To receive hedge accounting treatment, cash flow hedges must be highly effective in offsetting changes to expected future cash flows on hedged transactions.
For derivative instruments that hedge the exposure to changes in the fair value of an asset or a liability and that are designated and qualify as fair value hedges, both the net gain or loss on the derivative instrument as well as the offsetting loss or gain on the hedged item attributable to the hedged risk are recognized in earnings in the current period.
For derivative instruments that hedge the exposure to changes in foreign currency exchange rates used for translation of the net investment in a foreign operation and that are designated as a net investment hedge, the net gain or loss on the derivative instrument is reported in AOCI as part of the foreign currency translation adjustment.
Derivatives that do not qualify as hedges are adjusted to fair value through earnings in the current period.
Fair Value Measurements
The carrying value of financial instruments approximates fair value.
The Company defines fair value as the price that would be received to sell an asset, or paid to transfer a liability, in an orderly transaction between market participants at the measurement date. To increase consistency and comparability in fair value measurements, the Company uses a three-level hierarchy that prioritizes the use of observable inputs. The three levels are:
Level 1 – Quoted market prices in active markets for identical assets and liabilities
Level 2 – Observable inputs other than quoted market prices in active markets for identical assets and liabilities
Level 3 – Unobservable inputs
42
The determination of where an asset or liability falls in the hierarchy requires significant judgment.
Fair value measurements of nonfinancial assets and nonfinancial liabilities are primarily used in goodwill, other intangible assets and long-lived assets impairment analyses, the valuation of acquired intangibles and in the valuation of assets held for sale. The Company tests goodwill for impairment annually, as of the last day of January of each fiscal year. Impairment is also tested when events or changes in circumstances indicate that the assets’ carrying values may be greater than the fair values. Goodwill and intangible assets are typically valued using Level 3 inputs.
Foreign Exchange
The functional currency of each of the Company’s subsidiaries is generally the currency of the country in which the subsidiary operates or the U.S. Dollar. Assets and liabilities of foreign operations are translated using period end exchange rates, and revenues and expenses are translated using average exchange rates during each period. Translation (gains) and losses are reported in accumulated other comprehensive loss as a component of stockholders’ equity and were $(93,892), $25,254 and $2,671 during 2018, 2017 and 2016, respectively. Transaction gains and (losses) are reported in other income and expense in the consolidated statements of income and were $3,899, ($533) and $2,185 during 2018, 2017 and 2016, respectively.
New Accounting Pronouncements
In February 2018, the Financial Accounting Standards Board (“FASB”) issued ASU 2018-02, “Reclassification of Certain Tax Effects from Accumulated Other Comprehensive Income (Topic 220),” which permits the reclassification of stranded tax effects resulting from the Tax Cuts and Jobs Act (the “Tax Act”) from accumulated other comprehensive income (AOCI) to retained earnings. This new guidance is effective for fiscal years beginning after December 15, 2018, and interim periods within those fiscal years, which for the Company is the fiscal year beginning April 1, 2019. Early adoption is permitted, and the update must be applied either at the beginning of the period of adoption or retrospectively to each period in which the effects of the Tax Act related to items remaining in AOCI are recognized. The Company is currently evaluating the impact of this update on its consolidated financial statements.
In August 2017, the FASB issued ASU 2017-12, “Derivatives and Hedging (Topic 815): Targeted Improvements to Accounting for Hedging Activities,” which improves the hedge accounting model to facilitate financial reporting that more closely reflects a company’s risk management activities. The FASB’s new guidance will make more financial and nonfinancial hedging strategies eligible for hedge accounting. It also amends the presentation and disclosure requirements and changes how companies assess effectiveness. It is intended to more closely align hedge accounting with companies’ risk management strategies, simplify the application of hedge accounting, and increase transparency as to the scope and results of hedging programs. This update is effective for fiscal years beginning after December 15, 2018, and interim periods within those fiscal years, which for the Company is the fiscal year beginning April 1, 2019. Early adoption is permitted in any interim period after issuance of the update. The Company elected to early adopt this update in the second quarter of fiscal 2018. See Note 9 for additional information on the Company’s derivative and hedging activities.
In January 2017, the FASB issued ASU 2017-04, “Intangibles-Goodwill and Other,” which simplifies the accounting for goodwill impairment. This update removes step 2 of the goodwill impairment test, which requires a hypothetical purchase price allocation. Goodwill impairment will now be the amount by which a reporting unit’s carrying value exceeds its fair value, not to exceed the carrying amount of goodwill. This update is effective for any annual or interim goodwill impairment tests in fiscal years beginning after December 15, 2019, which for the Company is any annual or interim goodwill impairment tests performed after April 1, 2020. Early adoption is permitted for any impairment tests performed after January 1, 2017. The Company is currently evaluating the impact of this update on its consolidated financial statements.
In January 2017, the FASB issued ASU 2017-01, “Business Combinations,” which revises the definition of a business. The FASB’s new framework will assist entities in evaluating whether a set (integrated set of assets and activities) should be accounted for as an acquisition of a business or a group of assets. The framework adds an initial screen to determine if substantially all of the fair value of the gross assets acquired is concentrated in a single asset or group of similar assets. If that screen is met, the set is not a business. This update is effective for fiscal years beginning after December 15, 2017, and interim periods within those fiscal years, which for the Company is the fiscal year beginning April 1, 2018. Early adoption is permitted, including adoption in an interim period. The Company will adopt the update effective April 1, 2018, and it is not expected to have a material impact on the Company’s consolidated financial statements.
In August 2016, the FASB issued ASU 2016-15, “Classification of Certain Cash Receipts and Cash Payments,” which addresses eight specific cash flow issues with the objective of reducing the existing diversity in practice in how certain cash receipts and cash payments are presented and classified in the statement of cash flows. The specific issues addressed include debt prepayment or debt extinguishment costs, contingent consideration payments made after a business combination and separately identifiable cash flows and application of the predominance principle. This update is effective for fiscal years beginning after December 15, 2017, and interim periods within those fiscal years, which for the Company is the fiscal year beginning April 1, 2018. The amendments in this update should be applied using a retrospective transition method to each period presented. The Company will adopt the update effective April 1, 2018, and it is not expected to have a material impact on the Company’s consolidated financial statements.
In March 2016, the FASB issued ASU 2016-09, “Improvements to Employee Share-Based Payment Accounting,” which simplifies several areas of accounting for employee share-based payments, including the accounting for income taxes, forfeitures, and the classification on the statement of cash flows. This update is effective prospectively for annual periods beginning after December 15, 2016, including interim periods within those fiscal years. We adopted this standard on April 1, 2017. As a result of this adoption, the Company recorded $1,462 of excess tax benefits from share-based payments in income tax expense as a discrete item for the year ended March 31, 2018. These amounts may not necessarily be indicative of future amounts that may be recognized as any excess tax benefits recognized will be dependent on future stock price, employee exercise behavior and applicable tax rates. Prior to April 1, 2017, excess tax benefits were
43
recognized in additional paid-in capital. Additionally, excess tax benefits are now included in net operating cash flows rather than net financing cash flows in the Company’s consolidated statements of cash flows. The treatment of forfeitures has not changed, as the Company elected to continue the current process of estimating forfeitures at the time of grant. The Company had no unrecognized excess tax benefits from prior periods to record upon the adoption of this ASU.
In February 2016, the FASB issued ASU 2016-02, “Leases,” which requires that lessees recognize almost all leases on the balance sheet as right-of-use assets and lease liabilities. For income statement purposes, leases will be classified as either finance leases or operating leases. This update is effective for annual periods beginning after December 15, 2018, including interim periods within those fiscal years, which for the Company is the fiscal year beginning April 1, 2019. This update should be applied at the beginning of the earliest period presented using a modified retrospective approach. The Company is currently evaluating the impact of this standard on its consolidated financial statements, which will include an increase in both assets and liabilities relating to its leasing activities.
In July 2015, the FASB issued ASU 2015-11, “Simplifying the Measurement of Inventory,” which simplifies the subsequent measurement of inventory by requiring inventory to be measured at the lower of cost and net realizable value. This update does not apply to inventory that is measured using last-in, first-out (LIFO) or the retail inventory method. Prior to issuance of this ASU, inventory was measured at the lower of cost or market (where market was defined as replacement cost, with a ceiling of net realizable value and a floor of net realizable value less normal profit margin). For inventory within the scope of the new guidance, entities are required to compare the cost of inventory to only its net realizable value, and not to the three measures required by current guidance. This update was effective prospectively for fiscal years beginning after December 15, 2016, including interim periods within those fiscal years, which for the Company was the fiscal year beginning April 1, 2017. This update was applied prospectively to all lower of cost and net realizable value assessments performed by the Company after the effective date. The adoption did not have a material impact on the Company’s consolidated financial statements.
In May 2014, the FASB issued ASU 2014-09, “Revenue from Contracts with Customers (Topic 606),” which provides revised guidance for revenue recognition. The standard’s core principle is that an entity should recognize revenue for transfer of promised goods or services to customers in an amount that reflects the consideration to which the entity expects to be entitled in exchange for those goods and services. This guidance provides five steps that should be applied to achieve that core principle. In 2016 and 2017, the FASB issued accounting standard updates to address implementation issues and to clarify the guidance for identifying performance obligations, licenses and determining if a company is the principal or agent in a revenue arrangement. This standard and its clarifying updates are effective for annual reporting periods beginning after December 15, 2017, including interim periods within that reporting period, which for the Company is the fiscal year beginning April 1, 2018. This standard can be applied retrospectively to each period presented or as a cumulative-effect adjustment (modified retrospective) as of the date of adoption. The Company will adopt the standard effective April 1, 2018, using the modified retrospective approach.
Historically, we have recognized revenue at a point in time, generally upon shipment or delivery of products. Given our diverse customer base, there are varying fact patterns that must be evaluated within each of our customer contracts to determine the appropriate pattern of revenue recognition upon the adoption of the standard. Certain customer arrangements that were historically recognized at a point in time under our previous policies will now be recognized over time as production is on-going. We have estimated that the cumulative adjustment to beginning retained earnings will be approximately $5,000. Additionally, the Company’s future disclosures will be expanded to comply with the standard.
The Company’s assessment efforts to date have included reviewing current accounting policies, processes, and system requirements, as well as assigning internal resources and engaging third-party consultants to assist in the process. At this time, we do not anticipate significant changes to our systems or processes will be necessary for implementation of the standard.
No other new accounting pronouncement issued or effective during the fiscal year had or is expected to have a material impact on the consolidated financial statements.
| (3) | ACQUISITIONS |
Constantia Labels Summary
On October 31, 2017, the Company completed its acquisition pursuant to the Sale and Purchase Agreement (as amended) with Constantia Flexibles Germany GmbH, Constantia Flexibles International GmbH, Constantia Flexibles Group GmbH and GPC Holdings B.V. (collectively, “Constantia Flexibles”), acquiring 100% of the Labels Division of Constantia Flexibles (“Constantia Labels”). Constantia Labels, headquartered in Vienna, Austria, is a leader in label solutions serving the food, beverage and consumer packaging goods industries. Constantia Labels has approximately 2,800 employees globally and 24 production plants across 14 countries, with major operations across Europe, Asia and North America. The acquisition included a 75% controlling interest in certain label operations in South Africa.
The Company believes the combination of Constantia Labels’ food & beverage business with Multi-Color’s existing platforms, particularly in home & personal care and wine & spirits and emerging position in healthcare, will create a company with significant scale and geographic, end-market, customer and product diversification and additional growth opportunities. The results of Constantia Labels’ operations were included in the Company’s consolidated financial statements beginning on October 31, 2017.
44
The purchase price for Constantia Labels consisted of the following:
| Cash from proceeds of borrowings |
$ | 1,048,656 | ||
| MCC common stock issued |
237,820 | |||
| Deferred payments |
3,901 | |||
| Contingent consideration |
9,026 | |||
|
|
|
|||
| Purchase price, before cash acquired |
1,299,403 | |||
| Net cash acquired |
(16,115 | ) | ||
|
|
|
|||
| Total purchase price |
$ | 1,283,288 | ||
|
|
|
In the fourth quarter of fiscal 2018, the Company received cash of $9,994 from the seller due to the finalization of net working capital. The effect of this cash receipt and other adjustments resulted in a decrease of $8,912 to the purchase price, before cash acquired, during the three months ended March 31, 2018.
The Company issued 3,383 shares of its common stock to Constantia Flexibles as part of the consideration for the purchase of Constantia Labels. The Sale and Purchase Agreement provides for restrictions on the transfer of the shares issued to Constantia Flexibles and certain registration rights with respect to the shares. The fair value of the shares issued of $237,820 was calculated using the Company share price of $82.70, which was the closing price on October 31, 2017, discounted to reflect the temporary lack of liquidity.
The cash portion of the purchase price was funded through the 4.875% Senior Notes due 2025 and funds from the New Credit Agreement (see Note 8). The purchase price includes deferred payments with a total fair value of $3,901, estimated as of the acquisition date, of which $807 will be paid during the three months ended June 30, 2018 with the remaining to be paid out within 90 days after December 31, 2018, 2019 and 2020. In addition, the purchase price includes future performance based earnouts with a total fair value of $9,026, estimated as of the acquisition date. The future value of the earnouts is dependent upon whether the Verstraete in Mould Labels N.V. (Verstraete) business, which was acquired in conjunction with the Constantia Labels’ acquisition, meets or exceeds certain agreed upon EBITA (earnings before interest, taxes, and amortization) metrics over the three to five year period following the acquisition. The earnouts have a minimum future payout of zero, and the maximum amount of the future payout is based on the amount of EBITA growth achieved relative to calendar 2017. The earnouts may be paid out within 90 days after December 31, 2020, 2021 or 2022. Net cash acquired includes $49,647 of cash acquired less $33,532 of assumed bank debt and capital leases. The Company spent $16,238 in acquisition expenses related to the Constantia Labels acquisition. These expenses were recorded in selling, general and administrative expenses in the consolidated statements of income as follows: $18 in the third quarter of fiscal 2017, $744 in the first quarter of fiscal 2018, $3,545 in the second quarter of fiscal 2018, $11,299 in the third quarter of fiscal 2018 and $632 in the fourth quarter of fiscal 2018.
Super Enterprise Holdings Berhad (Super Label) Summary
On August 11, 2015, the Company acquired 90% of the shares of Super Label based in Kuala Lumpur, Malaysia, which was publicly listed on the Malaysian stock exchange. During the second and third quarters of fiscal 2016, the Company acquired the remaining shares and delisted Super Label. Super Label had operations in Malaysia, Indonesia, the Philippines, Thailand and China and produces home & personal care, food and beverage and specialty consumer products labels. This acquisition expanded our presence in China and gave us access to new label markets in Southeast Asia.
The acquisition included an 80% controlling interest in the label operations in Indonesia and a 60% controlling interest in certain legal entities in Malaysia and China (the Southeast Asian durables business). During the third quarter of fiscal 2017, the Company acquired the remaining shares of the label operations in Indonesia for $514. The results of Super Label’s operations were included in the Company’s consolidated financial statements beginning on August 11, 2015.
The purchase price for Super Label consisted of the following:
| Cash from proceeds of borrowings |
$ | 39,782 | ||
| Net cash acquired |
(6,035 | ) | ||
|
|
|
|||
| Total purchase price |
$ | 33,747 | ||
|
|
|
The cash portion of the purchase price was funded through borrowings under our previous credit agreement. Net cash acquired included $8,152 of cash acquired less $2,117 of bank debt assumed. The Company spent $1,434 in acquisition expenses related to the Super Label acquisition. These expenses were recorded in selling, general and administrative expenses in the consolidated statements of income as follows: $7 in the first quarter of fiscal 2017, $1 in the fourth quarter of fiscal 2016, $105 in the third quarter of fiscal 2016, $390 in the second quarter of fiscal 2016 and $931 in the first quarter of fiscal 2016.
Sale of Southeast Asian durables business
On July 3, 2017, the Company sold its 60% controlling interest in its Southeast Asian durables business to its minority shareholders for $3,620 in net cash proceeds. The Company recognized a loss of $512 on the sale of the business, which was recognized in other expense in the consolidated statements of income.
45
Barat Group (Barat) Summary
On May 4, 2015, the Company acquired 100% of Barat based in Bordeaux, France. Barat operated four manufacturing facilities in Bordeaux and Burgundy, France, and the acquisition gave the Company access to the label market in the Bordeaux wine region and expanded our presence in Burgundy. The acquisition included a 30% minority interest in Gironde Imprimerie Publicité (GIP), which was accounted for under the cost method based upon Multi-Color’s inability to exercise significant influence over the business. The results of Barat’s operations were included in the Company’s consolidated financial statements beginning on May 4, 2015.
The purchase price for Barat consisted of the following:
| Cash from proceeds of borrowings |
$ | 47,813 | ||
| Deferred payment |
2,160 | |||
|
|
|
|||
| Purchase price, before cash acquired |
49,973 | |||
| Net cash acquired |
(746 | ) | ||
|
|
|
|||
| Total purchase price |
$ | 49,227 | ||
|
|
|
The cash portion of the purchase price was funded through the previous credit agreement. The purchase price included $2,160 due to the seller, which was paid during the three months ended September 30, 2015. Net cash acquired included $4,444 of cash acquired less $3,698 of bank debt assumed related to capital leases. The Company spent $1,500 in acquisition expenses related to the Barat acquisition. These expenses were recorded in selling, general and administrative expenses in the consolidated statements of income as follows: $8 in the second quarter of fiscal 2017, $4 in the first quarter of fiscal 2017, $65 in the second quarter of fiscal 2016, $751 in the first quarter of fiscal 2016, $467 in the fourth quarter of fiscal 2015 and $205 in the third quarter of fiscal 2015.
In conjunction with the acquisition of Barat, the Company recorded an indemnification asset of $1,115, which represented the seller’s obligation under the purchase agreement to indemnify Multi-Color for the outcome of potential contingent liabilities relating to uncertain tax positions. This asset was released during the six months ended September 30, 2017.
Purchase Price Allocation and Other Items
The determination of the purchase price allocation to specific assets acquired and liabilities assumed is incomplete for Constantia Labels. The purchase price allocation may change in future periods as the fair value estimates of assets and liabilities (including, but not limited to, accounts receivable, inventory, property, plant and equipment, intangibles, accounts payable, accrued liabilities, debt and non-controlling interests) and the valuation of the related tax assets and liabilities are completed. Based on fair value estimates, the purchase prices for Constantia Labels, Super Label and Barat have been allocated to individual assets acquired and liabilities assumed as follows:
| Constantia Labels |
Super Label | Barat | ||||||||||
| Assets Acquired: |
||||||||||||
| Net cash acquired |
$ | 16,115 | $ | 6,035 | $ | 746 | ||||||
| Accounts receivable |
118,054 | 8,479 | 8,489 | |||||||||
| Inventories |
87,318 | 4,276 | 2,863 | |||||||||
| Property, plant and equipment |
216,872 | 22,002 | 8,356 | |||||||||
| Intangible assets |
410,000 | 2,437 | 21,852 | |||||||||
| Goodwill |
707,333 | 8,668 | 23,391 | |||||||||
| Other assets |
14,411 | 1,984 | 2,794 | |||||||||
|
|
|
|
|
|
|
|||||||
| Total assets acquired |
1,570,103 | 53,881 | 68,491 | |||||||||
|
|
|
|
|
|
|
|||||||
| Liabilities Assumed: |
||||||||||||
| Accounts payable |
93,860 | 5,087 | 3,049 | |||||||||
| Accrued income taxes payable |
7,975 | 936 | 355 | |||||||||
| Accrued expenses and other liabilities |
39,113 | 1,725 | 7,043 | |||||||||
| Deferred tax liabilities |
128,652 | 2,874 | 8,071 | |||||||||
|
|
|
|
|
|
|
|||||||
| Total liabilities assumed |
269,600 | 10,622 | 18,518 | |||||||||
|
|
|
|
|
|
|
|||||||
| Net assets acquired |
1,300,503 | 43,259 | 49,973 | |||||||||
|
|
|
|
|
|
|
|||||||
| Noncontrolling interests |
(1,100 | ) | (3,477 | ) | — | |||||||
|
|
|
|
|
|
|
|||||||
| Net assets acquired attributable to Multi-Color Corporation |
$ | 1,299,403 | $ | 39,782 | $ | 49,973 | ||||||
|
|
|
|
|
|
|
|||||||
46
The liabilities assumed in the Constantia Labels acquisition included a contingent liability of $9,671, estimated as of the acquisition date based on the Company’s best estimate. The contingent liability, payable to the pre-Constantia Flexibles owners of the respective entities, was based on future earnings of certain entities acquired. In the fourth quarter of fiscal 2018, $7,523 of the contingent liability was paid. The remaining contingent liability may be paid no later than December 31, 2020.
The fair value of the noncontrolling interests for Constantia Labels and Super Label were estimated based on market valuations performed by an independent third party using a combination of: (i) an income approach based on expected future discounted cash flows; and (ii) an asset approach.
During the fourth quarter of fiscal 2018, goodwill decreased by $8,912 due to finalization of the purchase price and increased by $4,083 related to measurement period adjustments for the Constantia Labels acquisition. The measurement period adjustments primarily consisted of a $1,768 and $5,311 decrease in the valuation of inventory and other assets, respectively, and a $1,601 increase in the valuation of accrued and other liabilities, partially offset by a $4,765 decrease in the valuation of the related deferred tax liabilities.
During fiscal 2017, goodwill decreased by $4,741 related to measurement period adjustments for the Super Label acquisition, primarily $4,601 and $1,683 related to the final valuation of property, plant and equipment and intangible assets, respectively, partially offset by an increase of $1,654 related to the final valuation of deferred tax assets and liabilities. No material measurement period adjustments related to Super Label were recognized in the consolidated statements of income in fiscal 2017 that would have been recognized in previous periods if the adjustments to provisional amounts were recognized as of the acquisition date.
The estimated fair value of identifiable intangible assets acquired and their estimated useful lives are as follows:
| Constantia Labels | Super Label | Barat | ||||||||||||||||||||||
| Fair Value |
Useful Lives |
Fair Value |
Useful Lives |
Fair Value |
Useful Lives |
|||||||||||||||||||
| Customer relationships |
$ | 390,000 | 19 years | $ | 2,437 | 15 years | $ | 20,849 | 20 years | |||||||||||||||
| Non-compete agreements |
— | — | — | — | 780 | 2 years | ||||||||||||||||||
| Trademarks |
— | — | — | — | 223 | 1 year | ||||||||||||||||||
| Technology |
20,000 | 4 years | — | — | — | — | ||||||||||||||||||
|
|
|
|
|
|
|
|||||||||||||||||||
| Total identifiable intangible assets |
$ | 410,000 | $ | 2,437 | $ | 21,852 | ||||||||||||||||||
|
|
|
|
|
|
|
|||||||||||||||||||
Identifiable intangible assets are amortized over their useful lives based upon a number of assumptions including the estimated period of economic benefit and utilization. The weighted-average amortization period for identifiable intangible assets acquired in the Constantia Labels and Barat acquisitions is 18 and 19 years, respectively.
The goodwill for Constantia Labels is attributable to combining Constantia Labels’ food & beverage business with Multi-Color’s existing platforms, particularly in home & personal care and wine & spirits and emerging position in healthcare, thereby creating additional growth opportunities for both businesses utilizing the expanded global footprint and the acquired workforce. The goodwill for Super Label is attributable to access to the label markets in Malaysia, Indonesia, the Philippines and Thailand and the acquired workforce. The goodwill for Barat is attributable to access to the label market in the Bordeaux wine region and the acquired workforce. Goodwill arising from the Super Label, Barat and Constantia Labels acquisitions is not deductible for income tax purposes.
The accounts receivable acquired as part of the Constantia Labels acquisition had a fair value of $118,054 at the acquisition date. The gross contractual value of the receivables prior to any adjustments was $119,883 and the estimated contractual cash flows that are not expected to be collected are $1,829. The accounts receivable acquired as part of the Super Label acquisition had a fair value of $8,479 at the acquisition date. The gross contractual value of the receivables prior to any adjustments was $8,809 and the estimated contractual cash flows not expected to be collected were $330. The accounts receivable acquired as part of the Barat acquisition had a fair value of $8,489 at the acquisition date. The gross contractual value of the receivables prior to any adjustments was $8,679 and the estimated contractual cash flows that are not expected to be collected were $190.
Pro Forma Information
The following table provides the unaudited pro forma results of operations for the years ended March 31, 2018 and 2017 as if Constantia Labels had been acquired as of the beginning of fiscal year 2017. However, pro forma results do not include any anticipated synergies from the combination of the companies, and accordingly, are not necessarily indicative of the results that would have occurred if the acquisition had occurred on the dates indicated or that may result in the future.
| 2018 | 2017 | |||||||
| Net revenues |
$ | 1,718,924 | $ | 1,588,090 | ||||
| Net income attributable to Multi-Color |
82,716 | 71,275 | ||||||
| Diluted earnings per share |
4.02 | 3.49 | ||||||
47
The following is a reconciliation of actual net revenues and net income attributable to Multi-Color Corporation to unaudited pro forma net revenues and net income:
| 2018 | 2017 | |||||||||||||||
| Net revenues | Net income attributable to Multi-Color |
Net revenues | Net income attributable to Multi-Color |
|||||||||||||
| Multi-Color Corporation actual results |
$ | 1,300,912 | $ | 71,951 | $ | 923,295 | $ | 60,996 | ||||||||
| Constantia Labels actual results (1) |
418,012 | 23,426 | 664,795 | 52,109 | ||||||||||||
| Pro forma adjustments |
— | (12,661 | ) | — | (41,830 | ) | ||||||||||
|
|
|
|
|
|
|
|
|
|||||||||
| Pro forma results |
$ | 1,718,924 | $ | 82,716 | $ | 1,588,090 | $ | 71,275 | ||||||||
|
|
|
|
|
|
|
|
|
|||||||||
| (1) | Constantia Labels actual results include the seven months pre-acquisition in fiscal 2018 and 12 months in fiscal 2017. Constantia Labels results for the five months post-acquisition in fiscal 2018 are included in the Multi-Color Corporation actual results. |
The following table identifies the unaudited pro forma adjustments:
| 2018 | 2017 | |||||||
| Constantia Labels financing costs |
$ | 9,689 | $ | 15,524 | ||||
| Acquisition transaction costs |
16,220 | 18 | ||||||
| Incremental depreciation and amortization costs |
(14,890 | ) | (25,526 | ) | ||||
| Incremental interest costs |
(29,368 | ) | (50,639 | ) | ||||
| Tax effect of adjustments |
5,688 | 18,793 | ||||||
|
|
|
|
|
|||||
| Pro forma adjustments |
$ | (12,661 | ) | $ | (41,830 | ) | ||
|
|
|
|
|
|||||
Other Acquisition Activity
On October 11, 2017, the Company acquired 100% of TP Label Limited, the labels business of Tanzania Printers Limited (Tanzania Printers), and TP Kenya Limited (collectively, “TP Label”), which is located in Dar es Salaam, Tanzania with a sales and distribution center located in Nairobi, Kenya, for $15,929 less net cash acquired of $397. The purchase price included $9,557, which was retained by MCC at closing and was used to repay the indebtedness of TP Label Limited and Tanzania Printers during the three months ended March 31, 2018. The purchase price also included an indemnification holdback of $1,593 to fund certain potential obligations of the sellers with respect to the transaction, which is deferred for one year after the closing date. TP Label is primarily a pressure sensitive and cut and stack label business, serving customers in the food and beverage market.
On August 3, 2017, the Company acquired 100% of GEWA Etiketten GmbH (GEWA), including the remaining 2.4% of the common shares of GIP (see below), for $21,846 plus net debt assumed of $5,228. Upon closing, $2,185 of the purchase price was deposited into an escrow account and is to be released to the seller on the 18-month anniversary of the closing date in accordance with the purchase agreement. The escrow amount is to fund certain potential indemnification obligations of the seller with respect to the transaction. GEWA is located in Bingen am Rhein, Germany and specializes in producing pressure sensitive labels for the wine and spirits market.
On January 3, 2017, the Company acquired 100% of Graphix Labels and Packaging Pty Ltd. (Graphix) for $17,261. The purchase price included $1,631 that is deferred for two years after the closing date. Graphix is located in Melbourne, Victoria, Australia and specializes in producing labels for both the food & beverage and wine & spirits markets.
In January 2017, the Company acquired an additional 67.6% of the common shares of GIP for $2,084 plus net debt assumed of $862. The purchase price included a deferred payment of $208 that was paid during the three months ended March 31, 2018. The Company acquired 30% of GIP as part of the Barat acquisition in fiscal 2016. Immediately prior to obtaining a controlling interest in GIP, the Company recognized a gain of $690 as a result of re-measuring our equity interest to its fair value of $771 based on the most recent share activity. In August 2017, the Company acquired the remaining 2.4% of the common shares of GIP in conjunction with the GEWA acquisition (see above). GIP is located in the Bordeaux region of France and specializes in producing labels for the wine & spirits market.
The determination of the final purchase price allocation to specific assets acquired and liabilities assumed is incomplete for GEWA, GIP and TP Label. The purchase price allocations may change in future periods as the fair value estimates of assets and liabilities (including, but not limited to, accounts receivable, inventory, property, plant and equipment, intangibles and debt) and the valuation of the related tax assets and liabilities are completed.
On July 6, 2016, the Company acquired 100% of Industria Litografica Alessandrina S.r.l. (I.L.A.) for $6,301 plus net debt assumed of $3,547. The purchase price included $819 that is deferred for three years after the closing date. I.L.A. is located in the Piedmont region
48
of Italy and specializes in production of premium self-adhesive and wet glue labels primarily for the wine & spirits market and also services the food industry.
On July 1, 2016, the Company acquired 100% of Italstereo Resin Labels S.r.l. (Italstereo) for $3,342 less net cash acquired of $181. The purchase price included a deferred payment of $201 that was paid in the three months ended September 30, 2017 and a deferred payment of $133 that is due two years after the closing date. Italstereo is located near Lucca, Italy and specializes in producing pressure sensitive adhesive resin coated labels, seals and emblems.
On January 4, 2016, the Company acquired 100% of Cashin Print for $17,487 less net cash acquired of $135 and 100% of System Label for $11,665 less net cash acquired of $2,025. Cashin Print and System Label are located in Castlebar, Ireland and Roscommon, Ireland, respectively. The purchase prices for Cashin Print and System Label included $1,411 and $1,571, respectively, for purchase price adjustments, which were paid to the seller during the three months ended June 30, 2016. In addition, the purchase prices for Cashin Print and System Label include deferred payments of $3,317 and $1,011, respectively. The deferred payment for Cashin Print will be paid during the fourth quarter of fiscal 2019. System Label is currently not forecasted to make the required performance threshold. During the third quarter of fiscal 2017, the long-term liabilities related to these deferred payments were reduced based on management’s current estimate of the future payout and $887 was recorded in other income in the consolidated statements of income. The acquired businesses supply multinational customers in Ireland, the United Kingdom and Continental Europe and provide Multi-Color with the opportunity to supply a broader product range to a larger customer base, especially in the healthcare market.
On October 1, 2015, the Company acquired 100% of Supa Stik Labels (Supa Stik) for $6,787 less net cash acquired of $977. Supa Stik is located in Perth, West Australia and services the local wine, food & beverage and healthcare label markets. The purchase price included $622 that was paid in the third quarter of fiscal 2018.
On May 1, 2015, the Company acquired 100% of Mr. Labels in Brisbane, Queensland Australia for $2,110. The purchase price included $196 that was deferred until the first anniversary of the closing date, which was paid during the first quarter of fiscal 2017. Mr. Labels provides labels primarily to food and beverage customers.
The results of operations of the acquisitions described above within this “Other Acquisitions Activity” section have been included in the consolidated financial statements since the respective dates of acquisition and have been determined to be immaterial for purposes of additional disclosure.
| (4) | ACCOUNTS RECEIVABLE ALLOWANCE |
The Company’s customers are primarily producers of home & personal care, wine & spirits, food & beverage, healthcare and specialty consumer products. Accounts receivable consist of amounts due from customers in connection with our normal business activities and are carried at sales value less allowance for doubtful accounts. The allowance for doubtful accounts is established to reflect the expected losses of accounts receivable based on past collection history, age, account payment status compared to invoice payment terms and specific individual risks identified. The following table summarizes the activity in the allowance for doubtful accounts:
| 2018 | 2017 | 2016 | ||||||||||
| Balance at beginning of year |
$ | 2,273 | $ | 2,497 | $ | 2,101 | ||||||
| Provision |
319 | 234 | 1,249 | |||||||||
| Accounts written-off |
(62 | ) | (384 | ) | (864 | ) | ||||||
| Foreign exchange |
174 | (74 | ) | 11 | ||||||||
|
|
|
|
|
|
|
|||||||
| Balance at end of year |
$ | 2,704 | $ | 2,273 | $ | 2,497 | ||||||
|
|
|
|
|
|
|
|||||||
| (5) | INVENTORIES |
The Company’s inventories as of March 31 consisted of the following:
| 2018 | 2017 | |||||||
| Finished goods |
$ | 86,517 | $ | 35,204 | ||||
|
Work-in-process |
21,222 | 8,933 | ||||||
| Raw materials |
70,025 | 26,862 | ||||||
|
|
|
|
|
|||||
| Total inventories, gross |
177,764 | 70,999 | ||||||
| Inventory reserves |
(9,814 | ) | (7,004 | ) | ||||
|
|
|
|
|
|||||
| Total inventories, net |
$ | 167,950 | $ | 63,995 | ||||
|
|
|
|
|
|||||
49
| (6) | PROPERTY, PLANT AND EQUIPMENT |
The Company’s property, plant and equipment as of March 31 consisted of the following:
| 2018 | 2017 | |||||||
| Land |
$ | 13,766 | $ | 4,300 | ||||
| Buildings, building improvements and leasehold improvements |
114,790 | 53,711 | ||||||
| Machinery and equipment |
535,142 | 330,089 | ||||||
| Furniture, fixtures, computer equipment and software |
50,779 | 27,648 | ||||||
| Construction in progress |
31,505 | 22,428 | ||||||
|
|
|
|
|
|||||
| Property, plant and equipment, gross |
745,982 | 438,176 | ||||||
| Accumulated depreciation |
(235,980 | ) | (190,915 | ) | ||||
|
|
|
|
|
|||||
| Property, plant and equipment, net |
$ | 510,002 | $ | 247,261 | ||||
|
|
|
|
|
|||||
Total depreciation expense for 2018, 2017 and 2016 was $46,913, $33,480 and $31,295, respectively.
As a result of our decision to close certain manufacturing facilities during fiscal 2018, the Company determined that it was more likely than not that certain fixed assets at these facilities would be sold or otherwise disposed of significantly before the end of their estimated useful lives.
As a result of the decision to consolidate our manufacturing facility located in Merignac, France into our existing facility in Libourne, France during fiscal 2018, non-cash fixed asset impairment charges of $125 were recorded, primarily to write off land and building improvements that will not be transferred to Libourne and will be abandoned.
As a result of the decision to close our manufacturing facility located in Dormans, France, during fiscal 2018, non-cash fixed asset impairment charges of $25 were recorded, to adjust the carrying value of the land and building held for sale at the Dormans facility to their estimated fair value, less cost to sell, which were determined based on a quoted market price. The land and building at the Dormans facility were sold during fiscal 2018.
As a result of the decision to close or consolidate our manufacturing facilities located in Sonoma, California, Glasgow, Scotland, Greensboro, North Carolina and Dublin, Ireland, during fiscal 2016 non-cash fixed asset impairment charges of $220, $115, $786 and $219, respectively, were recorded, primarily to write off certain machinery and equipment and leasehold improvements that were not transferred to other locations and were abandoned.
In addition, as a result of the decision to close our manufacturing facilities located in Norway, Michigan and Watertown, Wisconsin, during fiscal 2016, the Company recorded impairment charges of $534 to reduce the carrying value of land and buildings held for sale at the Norway facility to their estimated fair value, less cost to sell, which were determined based on a quoted market price. These assets were sold during fiscal 2016.
These asset impairment charges were recorded in facility closure expenses in the consolidated statements of income. See Note 20 for further information on these facility closures.
In addition, the Company performed impairment testing on long-lived assets at certain manufacturing locations during fiscal 2018 and 2017 due to the existence of impairment indicators. The estimated undiscounted future cash flows associated with the long-lived assets were greater than their carrying values, and therefore, no impairment was present in either of these two years.
50
| (7) | GOODWILL AND INTANGIBLE ASSETS |
The changes in the Company’s goodwill consisted of the following:
| 2018 | 2017 | |||||||
| Balance at beginning of year |
||||||||
| Goodwill, gross |
$ | 424,941 | $ | 434,212 | ||||
| Accumulated impairment losses |
(12,391 | ) | (12,203 | ) | ||||
|
|
|
|
|
|||||
| Goodwill, net |
412,550 | 422,009 | ||||||
| Activity during the year |
||||||||
| Acquisitions |
721,874 | 12,551 | ||||||
| Adjustments to prior year acquisitions |
(359 | ) | (12,049 | ) | ||||
| Currency translation |
63,096 | (9,961 | ) | |||||
| Sale of Southeast Asian durables business |
(527 | ) | — | |||||
|
|
|
|
|
|||||
| Balance at end of year |
||||||||
| Goodwill, gross |
1,210,179 | 424,941 | ||||||
| Accumulated impairment losses |
(13,545 | ) | (12,391 | ) | ||||
|
|
|
|
|
|||||
| Goodwill, net |
$ | 1,196,634 | $ | 412,550 | ||||
|
|
|
|
|
|||||
See Note 3 for further information regarding acquisitions.
In conjunction with our annual impairment tests as of January 31, 2018 and January 31, 2017, the Company performed quantitative assessments for all of our reporting units. The first step of the impairment tests compares the fair value of each reporting unit to its carrying value. We estimated the fair value of each reporting unit using a combination of: (i) a market approach based on multiples of revenue and EBITDA from recent comparable transactions and other market data; and (ii) an income approach based on expected future cash flows discounted at rates ranging between 8.5% to 11.5% in 2018 and 8.5% to 11.0% in 2017. The discount rates reflect the risk associated with each respective reporting unit, including the industry and geographies in which they operate. The market and income approaches were both considered, with the income approach selected based on judgment of the comparability of the recent transactions due to the fluid nature of the business and recent acquisitions. The market approach was used to corroborate values determined by the income approach. We considered recent economic and industry trends, as well as risk in executing our current plans from the perspective of a hypothetical buyer in estimating expected future cash flows in the income approach.
For all of our reporting units, the first step of the impairment test did not indicate potential impairment as the estimated fair value of the reporting units exceeded the carrying amount. As a result, the second step of the impairment test was not required in either of the two years.
Significant assumptions used to estimate the fair value of our reporting units include estimates of future cash flows, discount rates and multiples of revenue and EBITDA. These assumptions are typically not considered individually because assumptions used to select one variable should also be considered when selecting other variables; however, sensitivity of the overall fair value assessment to each significant variable is also considered.
No events or changes in circumstances occurred in 2018 that required goodwill impairment testing in between annual tests. In the second quarter of 2017, based on operating results for the Europe Wine & Spirits (EUR W&S) reporting unit, a quantitative goodwill impairment assessment was performed for this reporting unit. No impairment was indicated.
51
The Company’s intangible assets as of March 31 consisted of the following:
| 2018 | 2017 | |||||||||||||||||||||||
| Gross Carrying Amount |
Accumulated Amortization |
Net Carrying Amount |
Gross Carrying Amount |
Accumulated Amortization |
Net Carrying Amount |
|||||||||||||||||||
| Customer relationships |
$ | 648,273 | $ | (87,560 | ) | $ | 560,713 | $ | 228,518 | $ | (61,546 | ) | $ | 166,972 | ||||||||||
| Technologies |
21,721 | (3,586 | ) | 18,135 | 1,658 | (1,368 | ) | 290 | ||||||||||||||||
| Trademarks |
99 | (66 | ) | 33 | 1,013 | (1,013 | ) | — | ||||||||||||||||
| Licensing intangible |
— | — | — | 1,958 | (1,958 | ) | — | |||||||||||||||||
| Non-compete agreements |
3,880 | (2,528 | ) | 1,352 | 5,063 | (3,116 | ) | 1,947 | ||||||||||||||||
| Lease intangible |
— | — | — | 128 | (117 | ) | 11 | |||||||||||||||||
|
|
|
|
|
|
|
|
|
|
|
|
|
|||||||||||||
| Total |
$ | 673,973 | $ | (93,740 | ) | $ | 580,233 | $ | 238,338 | $ | (69,118 | ) | $ | 169,220 | ||||||||||
|
|
|
|
|
|
|
|
|
|
|
|
|
|||||||||||||
The intangible assets were established in connection with completed acquisitions. They are amortized, using the straight-line method, over their estimated useful lives based on a number of assumptions including customer attrition rates, percentage of revenue attributable to technologies, royalty rates and projected future revenue growth. The weighted-average amortization period for the intangible assets acquired in fiscal 2018 is 18 years. The weighted-average amortization period for the intangible assets acquired in fiscal 2017 is 13 years. Total amortization expense of intangible assets for 2018, 2017 and 2016 was $26,009, $14,425 and $13,178, respectively.
The estimated useful lives for each intangible asset class are as follows:
| Customer relationships |
9 to 21 years | |||
| Technologies |
1 to 8 years | |||
| Trademarks |
1 to 2 years | |||
| Licensing intangible |
5 years | |||
| Non-compete agreements |
2 to 7 years | |||
| Lease intangible |
3 years |
The annual estimated amortization expense for future years is as follows:
| Fiscal 2019 |
$ | 41,416 | ||
| Fiscal 2020 |
41,384 | |||
| Fiscal 2021 |
41,012 | |||
| Fiscal 2022 |
37,544 | |||
| Fiscal 2023 |
34,556 | |||
| Thereafter |
384,321 | |||
|
|
|
|||
| Total |
$ | 580,233 | ||
|
|
|
The Company performed impairment testing on long-lived assets, including intangibles, at certain manufacturing locations during fiscal 2018 and 2017 due to the existence of impairment indicators. The estimated undiscounted future cash flows associated with the long-lived assets were greater than their carrying values, and therefore, no impairment was present in either of these two years related to intangible assets.
52
| (8) | DEBT |
The components of the Company’s debt as of March 31 consisted of the following:
| 2018 | 2017 | |||||||||||||||||||||||
| Principal | Unamortized Debt Issuance Costs |
Debt Less Unamortized Debt Issuance Costs |
Principal | Unamortized Debt Issuance Costs |
Debt Less Unamortized Debt Issuance Costs |
|||||||||||||||||||
| 6.125% Senior Notes (1) |
$ | 250,000 | $ | (3,148 | ) | $ | 246,852 | $ | 250,000 | $ | (3,822 | ) | $ | 246,178 | ||||||||||
| 4.875% Senior Notes (1) |
600,000 | (9,699 | ) | 590,301 | — | — | — | |||||||||||||||||
| New Credit Agreement |
||||||||||||||||||||||||
| Term Loan A Facility (2) |
148,125 | (3,996 | ) | 144,129 | — | — | — | |||||||||||||||||
| Term Loan B Facility (3) |
498,750 | (6,280 | ) | 492,470 | — | — | — | |||||||||||||||||
| U.S. Revolving Credit Facility (4) |
56,945 | (5,442 | ) | 51,503 | — | — | — | |||||||||||||||||
|
Australian Revolving Sub-Facility (4) |
33,033 | (605 | ) | 32,428 | — | — | — | |||||||||||||||||
| Previous credit agreement |
||||||||||||||||||||||||
| U.S. Revolving Credit Facility (5) |
— | — | — | 198,100 | (2,335 | ) | 195,765 | |||||||||||||||||
|
Australian Revolving Sub-Facility (5) |
— | — | — | 31,965 | (178 | ) | 31,787 | |||||||||||||||||
| Capital leases |
36,288 | — | 36,288 | 7,412 | — | 7,412 | ||||||||||||||||||
| Other subsidiary debt |
4,714 | — | 4,714 | 359 | — | 359 | ||||||||||||||||||
|
|
|
|
|
|
|
|
|
|
|
|
|
|||||||||||||
| Total debt |
1,627,855 | (29,170 | ) | 1,598,685 | 487,836 | (6,335 | ) | 481,501 | ||||||||||||||||
| Less current portion of debt |
(20,864 | ) | — | (20,864 | ) | (2,093 | ) | — | (2,093 | ) | ||||||||||||||
|
|
|
|
|
|
|
|
|
|
|
|
|
|||||||||||||
| Total long-term debt |
$ | 1,606,991 | $ | (29,170 | ) | $ | 1,577,821 | $ | 485,743 | $ | (6,335 | ) | $ | 479,408 | ||||||||||
|
|
|
|
|
|
|
|
|
|
|
|
|
|||||||||||||
| (1) | The 6.125% Senior Notes are due on December 1, 2022. The 4.875% Senior Notes are due on November 1, 2025. |
| (2) | Under the New Credit Agreement, the Company is required to make mandatory principal payments on the outstanding borrowings under the Term Loan A Facility. The principal payments are due on the last day of March, June, September and December of each year, commencing on March 31, 2018 through the maturity date of October 31, 2022. |
| (3) | Under the New Credit Agreement, the Company is required to make mandatory principal payments on the outstanding borrowings under the Term Loan B Facility. The principal payments are due on the last day of March, June, September and December of each year, commencing on March 31, 2018 through the maturity date of October 31, 2024. |
| (4) | Borrowings under the U.S. Revolving Credit Facility and Australian Revolving Sub-Facility, which were issued under the New Credit Agreement, mature on October 31, 2022. |
| (5) | Borrowings under the previous credit agreement were repaid on October 31, 2017. |
The carrying value of debt under the New Credit Agreement approximates fair value. The fair value of the Senior Notes is based on observable inputs, including quoted market prices (Level 2). The fair values of the 4.875% Senior Notes and 6.125% Senior Notes were approximately $564,000 and $258,750, respectively, as of March 31, 2018. The fair value of the 6.125% Senior Notes was approximately $260,625 as of March 31, 2017.
The following is a schedule of future annual principal payments as of March 31, 2018:
| Debt | Capital Leases | Total | ||||||||||
| Fiscal 2019 |
$ | 16,673 | $ | 4,191 | $ | 20,864 | ||||||
| Fiscal 2020 |
12,690 | 3,619 | 16,309 | |||||||||
| Fiscal 2021 |
12,651 | 3,196 | 15,847 | |||||||||
| Fiscal 2022 |
12,634 | 2,204 | 14,838 | |||||||||
| Fiscal 2023 |
463,169 | 2,040 | 465,209 | |||||||||
| Thereafter |
1,073,750 | 21,038 | 1,094,788 | |||||||||
|
|
|
|
|
|
|
|||||||
| Total |
$ | 1,591,567 | $ | 36,288 | $ | 1,627,855 | ||||||
|
|
|
|
|
|
|
|||||||
Senior Secured Credit Facility
In conjunction with the Constantia Labels acquisition, effective October 31, 2017 the Company entered into a credit agreement (the “New Credit Agreement”) with various lenders. The New Credit Agreement replaced the Company’s previous credit agreement and consists of
53
(i) a senior secured first lien term loan A facility (the “Term Loan A Facility”) in an aggregate principal amount of $150,000 with a five year maturity, (ii) a senior secured first lien term loan B facility (the “Term Loan B Facility”) in an aggregate principal amount of $500,000 with a seven year maturity, and (iii) a senior secured first lien revolving credit facility (the “Revolving Credit Facility”) in an aggregate principal amount up to $400,000, comprised of a $360,000 U.S. revolving credit facility (the “U.S. Revolving Credit Facility“) and a $40,000 U.S. Dollar equivalent Australian sub-facility (the “Australian Revolving Sub-Facility”), each with a five year maturity.
The New Credit Agreement contains customary mandatory and optional prepayment provisions and customary events of default. The New Credit Agreement’s Term Loan A Facility, Term Loan B Facility and U.S. Revolving Credit Facility (together, the “U.S. facilities”) are guaranteed by substantially all of the Company’s direct and indirect wholly owned domestic subsidiaries, and such guarantors pledged substantially all their assets as collateral to secure the U.S. facilities. The Australian Revolving Sub-Facility is secured by substantially all of the assets of the Australian borrower and its direct and indirect subsidiaries.
The New Credit Agreement can be used for working capital, capital expenditures and other corporate purposes and to fund permitted acquisitions (as defined in the New Credit Agreement). Loans under the New Credit Agreement bear interest at variable rates plus a margin, based on the Company’s consolidated secured net leverage ratio. The weighted average interest rate on borrowings under the U.S. Revolving Credit Facility was 4.42% at March 31, 2018. The interest rates on borrowings under the Term Loan A Facility, Term Loan B Facility and Australian Revolving Sub-Facility were 4.13% at March 31, 2018.
The New Credit Agreement contains customary representations and warranties as well as customary negative and affirmative covenants, which require the Company to maintain the following financial covenants at the end of each quarter: (i) the consolidated secured net leverage ratio as of the last day of any fiscal quarter of the Company shall not exceed 4.50 to 1.00 for the fiscal quarters ended during the period of March 31, 2017 through, and including June 30, 2019 and (ii) the consolidated secured net leverage ratio as of the last day of any fiscal quarter of the Company shall not exceed 4.25 to 1.00 for the fiscal quarters ended during the period of September 30, 2019 and thereafter.
The New Credit Agreement, the indenture governing the 4.875% Senior Notes (the “4.875% Senior Notes Indenture”) and the indenture governing the 6.125% Senior Notes (the “6.125% Senior Notes Indenture” and together with the 4.875% Senior Notes Indenture, the “Indentures”) limit the Company’s ability to incur additional indebtedness. Additional covenants contained in the New Credit Agreement and the Indentures, among other things, restrict the ability of the Company to dispose of assets, incur guarantee obligations, make restricted payments, create liens, make equity or debt investments, change the business conducted by the Company and its subsidiaries, and engage in certain transactions with affiliates. Under the New Credit Agreement and the Indentures, certain changes in control of the Company could result in the occurrence of an Event of Default. In addition, the New Credit Agreement limits the ability of the Company to modify terms of the Indentures. As of March 31, 2018, the Company was in compliance with the covenants in the New Credit Agreement and the Indentures.
Available borrowings under the U.S. Revolving Credit Facility and Australian Revolving Sub-Facility were $302,179 and $6,967, respectively, at March 31, 2018. The Company also has various other uncommitted lines of credit available at March 31, 2018 in the aggregate amount of $22,319.
4.875% Senior Notes
The $600,000 aggregate principal amount of 4.875% Senior Notes due 2025 (the “4.875% Senior Notes”) were issued in October 2017 to fund the acquisition of Constantia Labels. The 4.875% Senior Notes are unsecured senior obligations of the Company. Interest is payable on the 4.875% Senior Notes on May 1st and November 1st of each year beginning May 1, 2018 until the maturity date of November 1, 2025. The Company’s obligations under the 4.875% Senior Notes are guaranteed by certain of the Company’s existing direct and indirect wholly-owned domestic subsidiaries.
6.125% Senior Notes
The $250,000 aggregate principal amount of 6.125% Senior Notes due 2022 (the “6.125% Senior Notes”) were issued in November 2014. The 6.125% Senior Notes are unsecured senior obligations of the Company. Interest is payable on the 6.125% Senior Notes on June 1st and December 1st of each year beginning June 1, 2015 until the maturity date of December 1, 2022. The Company’s obligations under the 6.125% Senior Notes are guaranteed by certain of the Company’s existing direct and indirect wholly-owned domestic subsidiaries.
Debt Issuance Costs
In conjunction with the issuance of the New Credit Agreement, the Company incurred $16,331 in debt issuance costs, which are being deferred and amortized over the term of the Term A Loan Facility, Term Loan B Facility and Revolving Credit Facility. In conjunction with terminating the Company’s prior credit agreement, $660 in unamortized debt issuance costs related to a debt extinguishment were written-off to interest expense during the three months ended December 31, 2017. The remaining unamortized fees under the prior credit agreement related to a debt modification and are being amortized over the term of the Revolving Credit Facility.
The Company incurred $10,338 in debt issuance costs associated with the issuance of the 4.875% Senior Notes, which are being deferred and amortized over the term of the 4.875% Senior Notes.
54
The Company recorded $3,174, $1,665 and $1,692 in interest expense in 2018, 2017 and 2016, respectively, in the consolidated statements of income to amortize deferred financing costs.
The Company incurred $4,587 in commitment fees related to a senior unsecured bridge facility (the “Bridge Facility”), which were written off to interest expense upon expiration of the availability of the Bridge Facility during the three months ended December 31, 2017.
Capital Leases
The present value of the net minimum payments on the capitalized leases as of March 31 is as follows:
| 2018 | 2017 | |||||||
| Total minimum lease payments |
$ | 49,521 | $ | 8,327 | ||||
| Less amount representing interest |
(13,233 | ) | (915 | ) | ||||
|
|
|
|
|
|||||
| Present value of net minimum lease payments |
36,288 | 7,412 | ||||||
| Current portion |
(4,191 | ) | (1,964 | ) | ||||
|
|
|
|
|
|||||
| Capitalized lease obligations, less current portion |
$ | 32,097 | $ | 5,448 | ||||
|
|
|
|
|
|||||
Included in the consolidated balance sheet as of March 31, 2018 under property, plant and equipment are cost and accumulated depreciation related to capitalized leases of $49,640 and $9,841, respectively. Included in the consolidated balance sheet as of March 31, 2017 under property, plant and equipment are cost and accumulated depreciation related to capitalized leases of $10,702 and $1,959, respectively. The capitalized leases carry interest rates from 0.97% to 12.47% and mature from fiscal 2019 to fiscal 2032.
| (9) | RISK MANAGEMENT ACTIVITIES AND FINANCIAL INSTRUMENTS |
The Company is exposed to market risks, both directly and indirectly, such as currency fluctuations and interest rate movement. To the extent the Company deems it to be appropriate, derivative instruments and hedging activities are used as a risk management tool to mitigate the potential impact of certain risks, primarily foreign currency exchange risk and interest rate risk.
The Company uses various types of derivative instruments including, but not limited to, forward contracts and swaps. The Company formally assesses, designates, and documents as a hedge of an underlying exposure each qualifying derivative instrument that will be accounted for as an accounting hedge at inception. Additionally, the Company assesses, both at inception and at least quarterly thereafter, whether the financial instruments used in the hedging transactions are effective at offsetting changes in either the fair values or cash flows of the underlying exposures.
Interest Rate Risk Management
The Company uses interest rate swap agreements (the “Swaps”) to minimize its exposure to interest rate fluctuations on variable rate debt borrowings. Swaps involve the exchange of fixed and variable rate interest payments and do not represent an actual exchange of the underlying notional amounts between the two parties.
The Company had three forward starting non-amortizing Swaps with a total notional amount of $125,000 to convert variable rate debt to fixed rate debt. The Swaps became effective October 2012 and expired in August 2016. The Swaps resulted in interest payments based on an average fixed rate of 1.396% plus the applicable margin per the requirements in the previous credit agreement.
In conjunction with entering into the previous credit agreement on November 21, 2014 (see Note 8), the Company de-designated the Swaps as a cash flow hedge. The cumulative loss on the Swaps recorded in accumulated other comprehensive income (AOCI) at the time of de-designation was reclassified into interest expense in the same periods during which the originally hedged transactions affected earnings, as these transactions were still probable of occurring. Subsequent to November 21, 2014, changes in the fair value of the de-designated Swaps were immediately recognized in interest expense.
In conjunction with entering into the New Credit Agreement (see Note 8), the Company entered into two spot non-amortizing Swaps with a total notional amount of $300,000 to convert variable rate debt to fixed rate debt. These Swaps became effective October 2017, expire in October 2018, and will result in interest payments of 1.5625% plus the applicable margin per the requirements in the New Credit Agreement. The Company also entered into two forward starting non-amortizing Swaps with a total notional amount of $300,000 to convert variable rate debt to fixed rate debt. These Swaps will become effective in October 2018, will expire in October 2022, and will result in interest payments of 2.1345% plus the applicable margin per the requirements in the New Credit Agreement.
Upon inception, the Swaps were designated as cash flow hedges under ASU 2017-12, with gains and losses, net of tax, measured on an ongoing basis, recorded in accumulated other comprehensive income (loss).
Foreign Currency Risk Management
Foreign currency exchange risk arises from our international operations as well as from transactions with customers or suppliers denominated in currencies other than the U.S. Dollar. The functional currency of each of the Company’s subsidiaries is generally the
55
currency of the country in which the subsidiary operates or the U.S. Dollar. At times, the Company uses foreign currency forward contracts to minimize the impact of fluctuations in currency exchange rates.
In July 2017, the Company entered into a foreign currency forward contract to fix the Euro cash component of the Constantia Labels purchase price. The notional amount of the foreign currency forward contract was €495,600 which matured in November 2017. Concurrent with the closing of the Company’s purchase of Constantia Labels on October 31, 2017, the Company exited the foreign currency forward contract resulting in a $8,109 net gain. The foreign currency forward contract was not designated as a hedging instrument, and all changes in the fair value of the contract were reported in current period earnings. The fair value of the foreign currency forward contract was determined using forward exchange market rates at the balance sheet date.
The Company periodically enters into foreign currency forward contracts to fix the purchase price of foreign currency denominated firm commitments. In addition, the Company periodically enters into short-term foreign currency forward contracts to fix the U.S. Dollar value of certain intercompany loan payments, which typically settle in the following quarter. During 2018 and 2017, the Company’s forward contracts were not designated as hedging instruments; therefore, changes in the fair value of the contracts were immediately recognized in other income and expense in the consolidated statements of income.
In November and December 2017, the Company entered into foreign exchange forward contracts to fix the purchase price in U.S. Dollars of a foreign currency denominated firm commitment to purchase presses. The forward contracts are designated as fair value hedges and changes in the fair value of the contracts are recorded in other income and expense in the consolidated statements of income in the same period during which the related hedged items affect the consolidated statements of income.
Net Investment Hedging
In September 2017, as a means of managing foreign currency risk related to our significant operations in Europe, the Company executed four fixed-for-fixed cross currency swaps, in which the Company will pay Euros and receive U.S. Dollars with a combined notional amount of €400,000, which mature in November 2025. This will effectively convert U.S. Dollar denominated debt to Euro denominated debt. The Company designated €205,000 of swap notional as a net investment hedge of the Company’s net investment in our European operations under ASU 2017-12 and applied the spot method to these hedges. Changes in fair value of the derivative instruments that are designated and qualify as hedges of net investments in foreign operations are recognized in AOCI to offset changes in the values of the net investments being hedged.
The remaining €195,000 of swap notional was not designated as an accounting hedge in September 2017. Therefore, changes in fair value of the derivative instruments were recognized in other income and expense in the consolidated statements of income. Subsequently, in November 2017, the Company formally designated the remaining €195,000 of swap notional as a net investment hedge under ASU 2017-12, bringing the total designated notional value to €400,000. Effective November 1, 2017, hedge accounting was applied to the newly designated swap notional of €195,000.
Disclosures about Derivative Instruments
All of the Company’s derivative assets and liabilities measured at fair value are classified as Level 2 within the fair value hierarchy. The Company determines the fair values of its derivatives based on valuation models which project future cash flows and discount the future amounts to a present value using market based observable inputs including interest rate curves, foreign currency rates, futures and basis point spreads, as applicable. The fair values of qualifying and non-qualifying instruments used in hedging transactions as of March 31, 2018 are as follows:
| Fair Value | ||||||
| Derivatives Designated as Hedging Instruments |
Balance Sheet Location |
2018 | ||||
| Assets: |
||||||
| Cross currency swaps (Net investment hedges) |
Other current assets | $ | 4,295 | |||
| Interest rate swaps (Cash flow hedges) |
Other current assets | 920 | ||||
| Foreign exchange forward contracts (Fair value hedges) |
Other current assets | 127 | ||||
| Interest rate swaps (Cash flow hedges) |
Other long-term assets | 4,956 | ||||
| Liabilities: |
||||||
| Cross currency swaps (Net investment hedges) |
Other long-term liabilities | $ | 50,019 | |||
| Foreign exchange forward contracts (Fair value hedges) |
Other current liabilities | 190 | ||||
| Fair Value | ||||||
| Derivatives Not Designated as Hedging Instruments |
Balance Sheet Location |
2018 | ||||
| Liabilities: |
||||||
| Foreign exchange forward contracts |
Other current liabilities | $ | 127 | |||
56
The amounts of gains and (losses) recognized in OCI net of reclassifications into earnings, during the twelve months ended March 31, 2018 and 2017 are as follows:
| Derivatives Designated as Hedging Instruments |
2018 | 2017 | ||||||
| Cross currency swaps (Net investment hedges) (1) |
$ | (29,667 | ) | $ | — | |||
| Interest rate swaps (Cash flow hedges) |
4,259 | 196 | ||||||
| (1) | The net loss of $(29,667) recognized in OCI on the cross currency swaps in a net investment hedge as of March 31, 2018 is comprised of an excluded component loss of $(25,860) and an undiscounted spot loss of $(15,847), net of tax of $12,040. |
The amounts of gains and (losses) reclassified from AOCI into earnings for the twelve months ended March 31, 2018 and 2017 are as follows:
| Derivatives Designated as Hedging Instruments |
2018 | 2017 | ||||||
| Cross currency swaps (1) |
$ | 4,234 | $ | — | ||||
| Interest rate swaps (2) |
(101 | ) | (329 | ) | ||||
| (1) | The Company had a $4,234 excluded component gain in AOCI which was recognized into income during the twelve months ended March 31, 2018. |
| (2) | During the next 12 months, $922 of gains included in the March 31, 2018 AOCI balance are expected to be reclassified into interest expense. |
The amounts of gains and (losses) included in earnings from qualifying and non-qualifying financial instruments used in hedging transactions for the twelve months ended March 31, 2018 and 2017 are as follows:
| Derivatives Not Designated as Hedging Instruments |
Statement of Income Location |
2018 | 2017 | |||||||
| Interest rate swaps |
Interest expense | $ | — | $ | 225 | |||||
| Foreign currency contract-Constantia purchase price |
Other income (expense), net | 8,109 | — | |||||||
| Foreign currency contracts-Other |
Other income (expense), net | (7,198 | ) | 220 | ||||||
| Gain (loss) on underlying hedged items |
Other income (expense), net | 6,510 | (188 | ) | ||||||
| Cross currency swaps |
Other income (expense), net | (4,018 | ) | — | ||||||
| Derivatives Designated as Hedging Instruments |
Statement of Income Location |
2018 | 2017 | |||||||
| Foreign exchange forward contracts (Fair value hedges) |
Other income (expense), net | $ | (245 | ) | $ | — | ||||
| Gain (loss) on underlying hedged items |
Other income (expense), net | 245 | — | |||||||
| (10) | ACCRUED EXPENSES AND OTHER LIABILITIES |
The Company’s accrued expenses and other liabilities as of March 31 consisted of the following:
| 2018 | 2017 | |||||||
| Accrued payroll and benefits |
$ | 45,418 | $ | 24,286 | ||||
| Accrued income taxes |
13,838 | 5,604 | ||||||
| Professional fees |
1,965 | 500 | ||||||
| Accrued taxes other than income taxes |
4,682 | 1,616 | ||||||
| Accrued interest |
16,480 | 5,178 | ||||||
| Customer rebates |
2,578 | 2,672 | ||||||
| Exit and disposal costs related to facility closures |
457 | 123 | ||||||
| Deferred payments |
9,735 | 1,068 | ||||||
| Deferred revenue |
11,887 | 7,076 | ||||||
| Derivative liabilities |
317 | — | ||||||
| Other |
6,665 | 5,635 | ||||||
|
|
|
|
|
|||||
| Total accrued expenses and other liabilities |
$ | 114,022 | $ | 53,758 | ||||
|
|
|
|
|
|||||
57
| (11) | EMPLOYEE BENEFIT PLANS |
The Company maintains a 401K retirement savings plan (Plan) for U.S. employees who meet certain service requirements. The Plan provides for voluntary contributions by eligible U.S. employees up to a specified maximum percentage of gross pay. At the discretion of the Company’s Board of Directors, the Company may contribute a specified matching percentage of the employee contributions. The Company also makes contributions to various retirement savings plans for Australian employees as required by law equal to 9% of gross pay and to other voluntary and involuntary defined contribution plans in Scotland, China, Malaysia and other subsidiaries outside the U.S. Company contributions to these retirement savings plans were $7,217, $5,189 and $4,982 in 2018, 2017 and 2016, respectively.
The Company sponsors several pension plans, including our pension plan for certain former U.S. employees as well as other subsidiary pension plans around the globe. Our U.S. pension plan is a single employer defined benefit pension plan (Pension Plan), which covers eligible union employees at our former Norway, Michigan plant who were hired prior to July 14, 1998. The Pension Plan provides benefits based on a flat payment formula and years of credited service at a normal retirement age of 65. The benefits are actuarially reduced for early retirement. The Company recorded $56, $145 and $89 of net periodic benefit cost in 2018, 2017 and 2016, respectively.
The Company used a March 31 measurement date (the fiscal year end) for the Pension Plan in 2018 and 2017. The Pension Plan’s benefit obligation was $1,008 and $1,136 as of March 31, 2018 and 2017, respectively. The fair value of the Pension Plan’s assets was $498 and $580 as of March 31, 2018 and 2017, respectively. As of March 31, 2018 and 2017, the Pension Plan’s unfunded obligation was $510 and $556, respectively.
Non-U.S. Plans
Certain subsidiaries outside the U.S. sponsor defined benefit postretirement plans that cover eligible regular employees. The Company deposits funds and/or purchases investments to fund these plans in addition to providing reserves for these plans. Benefits under the defined benefit plans are typically based on years of service and the employee’s compensation. The range of assumptions that are used for the non-U.S. defined benefit plans reflect the different economic environments within the various countries. These defined benefit plans are recorded based upon local accounting standards and are immaterial to the Company’s financial position and results of operations.
The Company’s largest defined benefit postretirement plan outside the U.S. covers eligible employees at our Münden, Germany plant (Münden Plan). The Münden Plan recorded $47 of net periodic benefit cost in 2018. The Münden Plan’s benefit obligation, plan assets and unfunded obligation as of March 31, 2018 were $3,075, $3,037 and $38, respectively.
| (12) | INCOME TAXES |
Earnings before income taxes were as follows:
| 2018 | 2017 | 2016 | ||||||||||
| U.S. |
$ | 6,848 | $ | 65,113 | $ | 55,764 | ||||||
| Foreign |
46,854 | 23,100 | 11,046 | |||||||||
|
|
|
|
|
|
|
|||||||
| Total |
$ | 53,702 | $ | 88,213 | $ | 66,810 | ||||||
|
|
|
|
|
|
|
|||||||
The provision (benefit) for income taxes as of March 31 includes the following components:
| 2018 | 2017 | 2016 | ||||||||||
| Current: |
||||||||||||
| Federal |
$ | 2,783 | $ | 16,889 | $ | 11,492 | ||||||
| State and local |
611 | 2,498 | 1,103 | |||||||||
| Foreign |
20,641 | 9,298 | 4,268 | |||||||||
|
|
|
|
|
|
|
|||||||
| Total Current |
24,035 | 28,685 | 16,863 | |||||||||
|
|
|
|
|
|
|
|||||||
| Deferred: |
||||||||||||
| Federal |
(18,406 | ) | 987 | 5,360 | ||||||||
| State and local |
70 | (147 | ) | 437 | ||||||||
| Foreign |
(23,894 | ) | (2,677 | ) | (3,679 | ) | ||||||
|
|
|
|
|
|
|
|||||||
| Total Deferred |
(42,230 | ) | (1,837 | ) | 2,118 | |||||||
|
|
|
|
|
|
|
|||||||
| Total |
$ | (18,195 | ) | $ | 26,848 | $ | 18,981 | |||||
|
|
|
|
|
|
|
|||||||
58
The following is a reconciliation between the U.S. statutory federal income tax rate and the effective tax rate:
| 2018 | 2017 | 2016 | ||||||||||
| U.S. federal statutory rate |
31.5 | % | 35.0 | % | 35.0 | % | ||||||
| State and local income taxes, net of federal income tax benefit |
0.4 | % | 1.7 | % | 2.1 | % | ||||||
| Section 199 deduction |
— | (1.8 | )% | (1.5 | )% | |||||||
| International rate differential |
(5.1 | )% | (3.3 | )% | (2.6 | )% | ||||||
| Unrecognized tax benefits |
0.6 | % | (0.9 | )% | (1.6 | )% | ||||||
| Foreign permanent differences |
(1.1 | )% | (2.1 | )% | (2.0 | )% | ||||||
| Non-deductible transaction costs |
4.2 | % | 0.2 | % | 1.5 | % | ||||||
| Valuation allowances |
2.0 | % | 1.2 | % | (2.2 | )% | ||||||
| U.S. Repatriation Tax |
5.7 | % | — | — | ||||||||
| Share-based Compensation |
(2.5 | )% | — | — | ||||||||
| Tax Rate Changes |
(70.8 | )% | — | — | ||||||||
| Other |
1.2 | % | 0.4 | % | (0.3 | )% | ||||||
|
|
|
|
|
|
|
|||||||
| Effective tax rate |
(33.9 | )% | 30.4 | % | 28.4 | % | ||||||
|
|
|
|
|
|
|
|||||||
On December 22, 2017, the U.S. government enacted comprehensive tax legislation commonly referred to as the Tax Cuts and Jobs Act (the “Tax Act”). The Tax Act significantly revises the future ongoing U.S. corporate income tax by, among other things, lowering U.S. corporate income tax rates and implementing a territorial tax system. As the Company has a March 31 fiscal year-end, the lower corporate income tax rate will be phased in, resulting in a U.S. statutory federal rate of 31.5% for the Company’s fiscal year ending March 31, 2018, and 21% for subsequent fiscal years. The Tax Act eliminates the domestic manufacturing deduction and implements certain transitional impacts to the Company, including a one-time repatriation tax on deemed repatriation of historical earnings of foreign subsidiaries. In addition, the reduction of the U.S. corporate tax rate will cause the Company to adjust the U.S. deferred tax assets and liabilities to the lower federal base rate of 21%.
The changes included in the Tax Act are broad and complex. The final transition impacts of the Tax Act may differ from current estimates, possibly materially, due to, among other things, changes in interpretations of the Tax Act, any legislative action to address questions that arise because of the Tax Act, any changes in accounting standards for income taxes or related interpretations in response to the Tax Act, or any updates or changes to estimates the Company has utilized to calculate the transition impacts, including impacts from changes to current year earnings estimates and foreign exchange rates of foreign subsidiaries.
The U.S. Securities and Exchange Commission has issued Staff Accounting Bulletin No. 118, Income Tax Accounting Implications of the Tax Cuts and Jobs Act (SAB 118) which provides guidance on accounting for the Tax Act’s impact. SAB 118 provides a measurement period, which in no case should extend beyond one year from the Tax Act enactment date, during which a company acting in good faith may complete the accounting for the impacts of the Tax Reform Act under ASC Topic 740. This guidance allows entities to record provisional amounts based on current estimates that are updated on a quarterly basis. As a result, our accounting for the effects of the Tax Legislation are not considered complete at this time.
To the extent that a company’s accounting for certain income tax effects of the Tax Act is incomplete, the Company can determine a reasonable estimate for those effects and record a provisional estimate in the financial statements in the first reporting period in which a reasonable estimate can be determined. If a company cannot determine a provisional estimate to be included in the financial statements, the company should continue to apply ASC 740 based on the provisions of the tax laws that were in effect immediately prior to the Tax Act being enacted. If a company is unable to provide a reasonable estimate of the impacts of the Tax Act in a reporting period, a provisional amount must be recorded in the first reporting period in which a reasonable estimate can be determined.
As of March 31, 2018, the Company has recorded a provisional discrete net tax benefit of $18,268, comprised of an estimated repatriation tax charge of $3,075 and an estimated net deferred tax benefit due to the rate change of $21,343. These amounts have been adjusted from the provisional estimates recorded during the quarter ended December 31, 2017 as a result of additional guidance released by the U.S. Treasury Department as well as further analysis of information related to these calculations received by the Company. Additionally, a provisional valuation allowance on certain interest expense carryforwards of $5,291 was reversed during the quarter ended March 31, 2018 as a result of additional guidance released by the U.S. Treasury Department.
With regard to the repatriation tax, the charge is levied on the previously untaxed accumulated and current earnings and profits (E&P) of the Company’s foreign subsidiaries. In order to determine the amount of the repatriation tax, the Company must determine, in addition to other factors, the amount of post-1986 E&P of the relevant subsidiaries, as well as the amount of non-U.S. income taxes paid on such earnings. The Company has made a reasonable estimate of the repatriation tax and recorded a provisional repatriation tax obligation of $3,075 which the Company expects to elect to pay over eight years. However, the Company is awaiting further interpretative guidance, continuing to assess available tax methods and elections, and continuing to gather additional information to more precisely compute the amount of the repatriation tax.
59
With regard to the impact of rate change, the Company has recorded a provisional net deferred tax benefit of $21,343 to account for the reduction of the U.S. federal statutory tax rate to 21% for fiscal years beginning after March 31, 2018. The Company has made a reasonable estimate of the impact of the reduction in corporate rate, however continues to analyze the temporary differences that existed on the date of enactment, and those which reversed at the 31.5% phased-in tax rate applicable to the Company’s fiscal year ended March 31, 2018.
The Tax Act contains provisions that may limit or restrict the future realizability of certain deferred tax assets. The Company recorded a provisional valuation allowance of $5,291 related to interest expense carryforwards during the quarter ended December 31, 2017. The valuation allowance has been released as of March 31, 2018 as a result of interpretative guidance released by the U.S. Treasury Department. The Company continues to evaluate the realizability of additional deferred tax assets as a result of the Tax Act, and may continue to refine their provision estimates to the extent transition rules and interpretive guidance are clarified in subsequent periods.
The Company maintains its assertion that foreign earnings are considered permanently reinvested. The $3,075 transition tax will result in previously untaxed non-U.S. earnings being included in the U.S. federal and state 2017 taxable income. As a result of the Tax Act, the Company is currently evaluating its global working capital requirements and the potential tax liabilities that would be incurred if certain non-U.S. subsidiaries made distributions, which include local country withholding tax and potential U.S. state taxation. For these reasons, the Company is not yet able to reasonably estimate the effect of this provision of the Tax Act and has not recorded any incremental withholding or state tax liabilities on its investment in its non-U.S. subsidiaries.
On December 25, 2017, a Belgian tax reform bill was signed into law. The bill revises the future ongoing Belgian corporate income tax by, among other things, lowering the Belgian corporate income tax rates and implementing a group consolidation system. The reduction of the Belgian corporate income tax rate caused us to adjust our Belgian deferred tax assets and liabilities to the newly enacted tax rates. As of March 31, 2018, the Company recognized a net deferred tax benefit of $15,164 due to the rate change.
Effective April 1, 2017, the Company adopted ASU 2016-09, “Improvements to Employee Share-Based Payment Accounting.” As part of the adoption, the Company recognizes excess tax benefits or detriments for share-based payments as a reduction of or add-back to income tax expense. For the year ended March 31, 2018, the Company recognized $1,462, respectively, as discrete benefits in income tax expense related to share-based compensation. Due to the nature of share-based payment exercise patterns, the Company will not know all the potential impacts of the update until the end of each period.
The net deferred tax components as of March 31 consisted of the following:
| 2018 | 2017 | |||||||
| Deferred tax liabilities: |
||||||||
| Book basis over tax basis of fixed assets |
$ | (44,717 | ) | $ | (28,911 | ) | ||
| Book basis over tax basis of intangible assets |
(135,432 | ) | (45,044 | ) | ||||
| Deferred financing costs |
(297 | ) | (434 | ) | ||||
| Other |
(6,370 | ) | (185 | ) | ||||
|
|
|
|
|
|||||
| Total deferred tax liabilities |
(186,816 | ) | (74,574 | ) | ||||
|
|
|
|
|
|||||
| Deferred tax assets: |
||||||||
| Inventory reserves |
925 | 1,632 | ||||||
| Inventory capitalization |
809 | 595 | ||||||
| Allowance for doubtful accounts |
242 | 332 | ||||||
| Stock based compensation expense |
1,305 | 1,535 | ||||||
| Minimum pension liability |
546 | 642 | ||||||
| Loss carry forward amounts |
25,110 | 5,215 | ||||||
| Credit carry forward amounts |
2,007 | 378 | ||||||
| Interest rate swaps |
9,306 | — | ||||||
| State basis over tax basis of fixed assets |
667 | 565 | ||||||
| Non-deductible accruals and other |
10,148 | 5,037 | ||||||
| Deferred compensation |
699 | 206 | ||||||
| Lease obligations |
4,799 | 384 | ||||||
|
|
|
|
|
|||||
| Gross deferred tax asset |
56,563 | 16,521 | ||||||
| Valuation allowance |
(16,870 | ) | (4,860 | ) | ||||
|
|
|
|
|
|||||
| Net deferred tax asset |
39,693 | 11,661 | ||||||
|
|
|
|
|
|||||
| Net deferred tax liability |
$ | (147,123 | ) | $ | (62,913 | ) | ||
|
|
|
|
|
|||||
60
As of March 31, 2018, Multi-Color had tax-effected federal, state, and foreign operating loss carryforwards of $1,014, $1,922 and $22,174 respectively. As of March 31, 2017, Multi-Color had tax-effected state and foreign operating loss carryforwards of $727 and $4,488, respectively. The federal operating loss carryforward will expire in fiscal 2037. The state operating loss carryforwards will expire between fiscal 2020 and fiscal 2038. The foreign operating loss carryforwards include $13,134 with no expiration date; the remainder will expire between fiscal 2021 and fiscal 2038. The federal operating loss carryforwards include losses of $1,014 that were acquired in connection with business combinations. The state operating loss carryforwards include losses of $277 that were acquired in connection with business combinations. Utilization of the acquired federal and state tax loss carryforwards may be limited pursuant to Section 382 of the Internal Revenue Code of 1986.
As of March 31, 2018 and 2017, Multi-Color had valuation allowances of $16,870 and $4,860, respectively. As of March 31, 2018 and 2017, $16,454 and $4,752, respectively, of the valuation allowances related to certain deferred tax assets in foreign jurisdictions due to the uncertainty of the realization of future tax benefits from those assets.
In assessing the realizability of deferred tax assets, management considers whether it is more likely than not that some portion or all of the deferred tax assets will not be realized. The ultimate realization of deferred tax assets is dependent upon the generation of future taxable income during the periods in which those temporary differences become deductible. Management considers the scheduled reversal of deferred tax liabilities and projected future taxable income in making this assessment. At each reporting date, the Company considers both negative and positive evidence that impacts the assessment of the realization of deferred tax assets.
The benefits of tax positions are not recorded unless it is more likely than not the tax position would be sustained upon challenge by the appropriate tax authorities. Tax benefits that are more likely than not to be sustained are measured at the largest amount of benefit that is cumulatively greater than a 50% likelihood of being realized.
As of March 31, 2018 and 2017, the Company had liabilities of $7,038 and $5,665, respectively, recorded for unrecognized tax benefits for U.S. federal, state and foreign tax jurisdictions. During the years ended March 31, 2018 and 2017, the Company recognized $120 and $175, respectively, of interest and penalties in income tax expense in the consolidated statements of income. The liability for the gross amount of interest and penalties at March 31, 2018 and 2017 was $2,641 and $1,892, respectively. The liability for unrecognized tax benefits is classified in other noncurrent liabilities on the consolidated balance sheets for the portion of the liability where payment of cash is not anticipated within one year of the balance sheet date. During the year ended March 31, 2018, the Company released $2,046 of reserves, including interest and penalties, related to uncertain tax positions for which the statutes of limitations have lapsed or there was a reduction in the tax position related to a prior year. The Company believes that it is reasonably possible that $4,746 of unrecognized tax benefits as of March 31, 2018 could be released within the next 12 months due to lapse of statute of limitations and settlements of certain foreign and domestic income tax matters. The unrecognized tax benefits that, if recognized, would favorably impact the effective tax rate are $6,464.
A summary of the activity for the Company’s unrecognized tax benefits as of March 31 is as follows:
| 2018 | 2017 | |||||||
| Beginning balance |
$ | 5,665 | $ | 6,253 | ||||
| Additions based on tax positions related to the current year |
1,843 | 196 | ||||||
| Additions of tax positions of prior years |
833 | 684 | ||||||
| Settlements |
(1,358 | ) | — | |||||
| Reductions of tax positions of prior years |
(44 | ) | (7 | ) | ||||
| Lapse of applicable statutes of limitations |
(345 | ) | (1,091 | ) | ||||
| Currency translation |
444 | (370 | ) | |||||
|
|
|
|
|
|||||
| Ending balance |
$ | 7,038 | $ | 5,665 | ||||
|
|
|
|
|
|||||
The Company files income tax returns in the U.S. federal jurisdiction, various foreign jurisdictions and various state and local jurisdictions where the statutes of limitations generally range from three to four years. At March 31, 2018, the Company is no longer subject to U.S. federal examinations by tax authorities for years before fiscal 2015. The Company is no longer subject to state and local examinations by tax authorities for years before fiscal 2014. In foreign jurisdictions, the Company is no longer subject to examinations by tax authorities for years before fiscal 1999.
| (13) | MAJOR CUSTOMERS |
During 2018, 2017 and 2016, sales to major customers (those exceeding 10% of the Company’s net revenues in one or more of the periods presented) approximated 14%, 17% and 17%, respectively, of the Company’s consolidated net revenues. All of these sales were made to The Procter & Gamble Company.
In addition, accounts receivable balances from The Procter & Gamble Company approximated 3% and 4% of the Company’s total accounts receivable balance at March 31, 2018 and 2017, respectively. The loss or substantial reduction of the business of this major customer could have a material adverse impact on the Company’s results of operations and cash flows.
61
| (14) | EARNINGS PER COMMON SHARE |
The following is a reconciliation of the number of shares used in the basic EPS and diluted EPS computations:
| 2018 | 2017 | 2016 | ||||||||||||||||||||||
| Shares | Per Share Amount |
Shares | Per Share Amount |
Shares | Per Share Amount |
|||||||||||||||||||
| Basic EPS |
18,421 | $ | 3.91 | 16,879 | $ | 3.61 | 16,750 | $ | 2.85 | |||||||||||||||
| Effect of dilutive securities |
162 | (0.04 | ) | 145 | (0.03 | ) | 202 | (0.03 | ) | |||||||||||||||
|
|
|
|
|
|
|
|
|
|
|
|
|
|||||||||||||
| Diluted EPS |
18,583 | $ | 3.87 | 17,024 | $ | 3.58 | 16,952 | $ | 2.82 | |||||||||||||||
|
|
|
|
|
|
|
|
|
|
|
|
|
|||||||||||||
The Company excluded 94, 172 and 120 shares in the fiscal years ended March 31, 2018, 2017 and 2016, respectively, from the computation of diluted EPS because these shares would have an anti-dilutive effect.
| (15) | STOCK-BASED COMPENSATION |
The Company maintains incentive plans which authorize the issuance of stock-based compensation including stock options, restricted stock and restricted share units to officers, key employees and non-employee directors. New shares are issued upon exercise of stock options or vesting of restricted stock or restricted share units. As of March 31, 2018, 953 shares of common stock remained reserved for future issuance under the 2012 Stock Incentive Plan, 2003 Stock Incentive Plan, as amended, and 2006 Director Equity Compensation Plan.
The Company measures compensation costs related to stock-based transactions at the grant date, based on the fair value of the award, and recognizes them as expense over the requisite service period.
For the year ended March 31, 2018, the Company recorded pre-tax compensation expense for stock-based incentive awards of $3,456 which increased selling, general and administrative expenses by $2,489 and cost of revenues by $967 and had an associated tax benefit of $898.
For the year ended March 31, 2017, the Company recorded pre-tax compensation expense for stock-based incentive awards of $3,042 which increased selling, general and administrative expenses by $2,064 and cost of revenues by $978 and had an associated tax benefit of $943.
For the year ended March 31, 2016, the Company recorded pre-tax compensation expense for stock-based incentive awards of $2,982 which increased selling, general and administrative expenses by $2,211 and cost of revenues by $771 and had an associated tax benefit of $835.
Stock Options
Stock options granted under the plans enable the holder to purchase common stock at an exercise price not less than the market value on the date of grant and will expire not more than ten years after the date of grant. The applicable options vest ratably over a five year period. The Company calculates the value of each employee stock option, estimated on the grant date, using the Black-Scholes model and the following weighted average assumptions:
| 2018 | 2017 | 2016 | ||||||||||
| Expected life (years) |
5.7 | 5.8 | 5.8 | |||||||||
| Risk-free interest rate |
1.8 | % | 1.2 | % | 1.9 | % | ||||||
| Expected volatility |
32.4 | % | 38.9 | % | 40.1 | % | ||||||
| Dividend yield |
0.3 | % | 0.3 | % | 0.3 | % | ||||||
The Company estimated volatility based on the historical volatility of its common stock. The risk-free interest rate is based on the U.S. Treasury yield for a term consistent with the expected life of the options in effect at the time of the grant. The dividend yield assumption is based on the Company’s history and expectation of dividend payouts. The expected life of the options represents the weighted-average period the stock options are expected to remain outstanding and is based on review of historical exercise behavior of option grants with similar vesting periods. The Company uses an estimated forfeiture rate based on historical data. The forfeitures are estimated at the time of grant and revised, if necessary, in subsequent periods if actual forfeitures differ from those estimates.
62
A summary of the changes in the options outstanding for years ended March 31, 2018, 2017 and 2016 is shown below:
| Options | Weighted Average Exercise Price |
Weighted Average Remaining Life (Years) |
Aggregate Intrinsic Value |
|||||||||||||
| Outstanding at March 31, 2015 |
656 | $ | 24.24 | |||||||||||||
| Granted |
157 | $ | 61.85 | |||||||||||||
| Exercised |
(190 | ) | $ | 21.41 | $ | 8,037 | ||||||||||
| Forfeited |
(23 | ) | $ | 35.97 | ||||||||||||
|
|
|
|||||||||||||||
| Outstanding at March 31, 2016 |
600 | $ | 34.50 | |||||||||||||
| Granted |
32 | $ | 61.62 | |||||||||||||
| Exercised |
(136 | ) | $ | 24.52 | $ | 5,664 | ||||||||||
| Forfeited |
(25 | ) | $ | 41.66 | ||||||||||||
|
|
|
|||||||||||||||
| Outstanding at March 31, 2017 |
471 | $ | 38.84 | |||||||||||||
| Granted |
119 | $ | 85.38 | |||||||||||||
| Exercised |
(110 | ) | $ | 26.60 | $ | 5,990 | ||||||||||
| Forfeited |
(14 | ) | $ | 57.10 | ||||||||||||
|
|
|
|
|
|
|
|
|
|||||||||
| Outstanding at March 31, 2018 |
466 | $ | 53.10 | 6.7 | $ | 8,305 | ||||||||||
|
|
|
|
|
|
|
|
|
|||||||||
| Exercisable at March 31, 2018 |
186 | $ | 33.72 | 5.0 | $ | 6,024 | ||||||||||
| Exercisable at March 31, 2017 |
191 | $ | 26.72 | 4.9 | $ | 8,475 | ||||||||||
As of March 31, 2018, the total compensation cost related to nonvested options not yet recognized and the weighted-average period over which it is expected to be recognized is $4,562 and 3.3 years, respectively.
The weighted average grant-date fair value of options granted during the year ended March 31, 2018, 2017 and 2016 was $27.98, $22.72 and $24.35, respectively. Cash received from options exercised during the year ended March 31, 2018 was $2,572. The total grant-date fair value of options vested during the year ended March 31, 2018, 2017 and 2016 was $1,800, $2,062 and $1,528, respectively.
Restricted Stock
Restricted stock grants under the plans typically vest over a three to five year period. The cost of these awards is determined using the fair value of the Company’s common stock on the date of the grant and is recognized on a straight-line basis over the period the restrictions lapse. A summary of the changes in restricted shares for the year ended March 31, 2018, 2017 and 2016 is shown below:
| Restricted Shares |
Weighted Average Grant Date Fair Value |
|||||||
| Non-vested restricted shares at March 31, 2015 |
27 | $ | 34.07 | |||||
| Granted |
15 | $ | 68.15 | |||||
| Vested |
(17 | ) | $ | 31.34 | ||||
|
|
|
|
|
|||||
| Non-vested restricted shares at March 31, 2016 |
25 | $ | 55.99 | |||||
| Granted |
8 | $ | 64.50 | |||||
| Vested |
(15 | ) | $ | 51.67 | ||||
| Forfeited |
(1 | ) | $ | 64.05 | ||||
|
|
|
|
|
|||||
| Non-vested restricted shares at March 31, 2017 |
17 | $ | 62.72 | |||||
| Granted |
9 | $ | 85.17 | |||||
| Vested |
(10 | ) | $ | 63.46 | ||||
| Forfeited |
(3 | ) | $ | 72.47 | ||||
|
|
|
|
|
|||||
| Non-vested restricted shares at March 31, 2018 |
13 | $ | 76.17 | |||||
|
|
|
|
|
|||||
63
As of March 31, 2018, the total compensation cost related to non-vested restricted shares not yet recognized and the weighted-average period over which it is expected to be recognized was $635 and 2.0 years. The total grant-date fair value of restricted shares vested during the year ended March 31, 2018, 2017 and 2016 was $665, $720 and $520, respectively.
Restricted Share Units
Restricted share units (RSUs) granted under the plans vest over a three-year period, and the number of RSUs that will vest is based on the Company’s level of achievement of a certain performance target. Based on the extent to which the performance condition is met, it is possible for none of the RSUs to vest or for a range up to the maximum to vest. The cost of these awards is determined using the fair value of the Company’s common stock on the date of grant and is recognized over the requisite service period based on the Company’s estimate of the probable outcome of the performance condition. We evaluate our estimate quarterly, and the expense is adjusted for any change in our estimate of the probable outcome. A summary of the changes in restricted share units for the years ended March 31, 2018, 2017 and 2016 are shown below:
| RSUs | Weighted Average Grant Date Fair Value |
|||||||
| Non-vested RSUs at March 31, 2015 |
— | $ | — | |||||
| Granted |
42 | $ | 64.05 | |||||
|
|
|
|
|
|||||
| Non-vested RSUs at March 31, 2016 |
42 | $ | 64.05 | |||||
| Granted |
35 | $ | 61.19 | |||||
| Forfeited |
(18 | ) | $ | 62.59 | ||||
|
|
|
|
|
|||||
| Non-vested RSUs at March 31, 2017 |
59 | $ | 62.80 | |||||
| Granted |
19 | $ | 85.90 | |||||
| Vested |
(12 | ) | $ | 64.05 | ||||
| Forfeited |
(30 | ) | $ | 67.51 | ||||
|
|
|
|
|
|||||
| Non-vested RSUs at March 31, 2018 |
36 | $ | 70.73 | |||||
|
|
|
|
|
|||||
As of March 31, 2018, the total compensation cost related to non-vested RSUs not yet recognized was $665 based upon the Company’s estimate of the probable outcome of the performance condition. The weighted-average period over which it is expected to be recognized was 1.7 years.
| (16) | GEOGRAPHIC INFORMATION |
During fiscal 2018, we acquired GEWA, TP Label, Constantia Labels and began producing labels from our start-up in Auckland, New Zealand. During fiscal 2017, we acquired Italstereo, and I.L.A., Graphix and GIP. During fiscal 2016, we acquired Cashin Print, System Label, Supa Stik, Super Label, Barat and Mr. Labels and began producing labels from our start-up operation in La Rioja, Spain. All of these acquisitions expanded the Company’s geographic presence. See Note 3 for further information regarding these acquisitions. The Company now manufactures labels in the North American, Latin American, EMEA (Europe, Middle East and Africa) and Asia Pacific regions. Net revenues, based on the geographic area from which the product is shipped, for the years ended March 31 and long-lived assets by geographic area as of March 31 are as follows:
| 2018 | 2017 | 2016 | ||||||||||
| Net revenues: |
||||||||||||
| United States |
$ | 584,458 | $ | 511,551 | $ | 504,598 | ||||||
| Australia |
93,447 | 72,450 | 59,237 | |||||||||
| Germany |
62,184 | — | — | |||||||||
| Other International |
560,823 | 339,294 | 306,990 | |||||||||
|
|
|
|
|
|
|
|||||||
| Total |
$ | 1,300,912 | $ | 923,295 | $ | 870,825 | ||||||
|
|
|
|
|
|
|
|||||||
| 2018 | 2017 | |||||||
| Long-lived assets: |
||||||||
| United States |
$ | 649,413 | $ | 370,492 | ||||
| Australia |
161,617 | 105,670 | ||||||
| Germany |
878,106 | — | ||||||
| Other International |
609,830 | 359,234 | ||||||
|
|
|
|
|
|||||
| Total |
$ | 2,298,966 | $ | 835,396 | ||||
|
|
|
|
|
|||||
64
| (17) | COMMITMENTS AND CONTINGENCIES |
Operating Lease Agreements
The Company has various equipment, office and facility operating leases. Leases expire on various dates through September 2028 and some of the leases contain clauses requiring escalating rent payments. Rent expense during 2018, 2017 and 2016 was $17,953, $12,767 and $12,920, respectively.
The annual future minimum rental obligations as of March 31, 2018 are as follows:
| Fiscal 2019 |
$ | 23,538 | ||
| Fiscal 2020 |
18,705 | |||
| Fiscal 2021 |
11,873 | |||
| Fiscal 2022 |
9,874 | |||
| Fiscal 2023 |
7,228 | |||
| Thereafter |
14,308 | |||
|
|
|
|||
| Total |
$ | 85,526 | ||
|
|
|
Purchase Obligations
The Company has entered into purchase agreements for various raw materials, uniforms, supplies, utilities, other services and property, plant and equipment. Total estimated purchase obligations are $28,145 at March 31, 2018.
Litigation
The Company is subject to various legal claims and contingencies that arise out of the normal course of business, including claims related to commercial transactions, product liability, health and safety, taxes, environmental matters, employee matters and other matters. Litigation is subject to numerous uncertainties and the outcome of individual claims and contingencies is not predictable. It is possible that some legal matters for which reserves have or have not been established could result in an unfavorable outcome for the Company and any such unfavorable outcome could be of a material nature or have a material adverse effect on our financial condition, results of operations and cash flows.
| (18) | SUPPLEMENTAL CASH FLOW DISCLOSURES |
Supplemental disclosures with respect to cash flow information and non-cash investing and financing activities are as follows:
| 2018 | 2017 | 2016 | ||||||||||
| Supplemental Disclosures of Cash Flow Information: |
||||||||||||
| Interest paid |
$ | 32,844 | $ | 23,672 | $ | 24,244 | ||||||
| Income taxes paid, net of refunds |
30,305 | 21,143 | 18,680 | |||||||||
| Supplemental Disclosures of Non-Cash Activities: |
||||||||||||
| Additional minimum pension liability |
$ | (55 | ) | $ | (282 | ) | $ | 57 | ||||
| Capital expenditures incurred but not yet paid |
9,958 | 3,323 | 2,446 | |||||||||
| Capital lease obligations incurred |
— | 864 | 3,740 | |||||||||
| Change in derivative contract fair value—asset position |
10,298 | — | — | |||||||||
| Change in derivative contract fair value—liability position |
(50,336 | ) | 225 | 1,064 | ||||||||
| Business combinations accounted for as a purchase: |
||||||||||||
| Assets acquired (excluding cash) |
$ | 1,612,925 | $ | 45,328 | $ | 153,504 | ||||||
| Liabilities assumed |
(335,648 | ) | (16,669 | ) | (39,457 | ) | ||||||
| Liabilities for contingent / deferred payments |
(13,713 | ) | 242 | (7,326 | ) | |||||||
| MCC common stock issued |
(237,820 | ) | — | — | ||||||||
| Noncontrolling interest |
(1,100 | ) | (62 | ) | (3,476 | ) | ||||||
|
|
|
|
|
|
|
|||||||
| Net cash paid |
$ | 1,024,644 | $ | 28,839 | $ | 103,245 | ||||||
|
|
|
|
|
|
|
|||||||
65
| (19) | ACCUMULATED OTHER COMPREHENSIVE LOSS |
The changes in the Company’s accumulated other comprehensive loss by component consisted of the following:
| Foreign currency items |
Gains and (losses) on derivative contracts |
Defined benefit pension items |
Total | |||||||||||||
| Balance at March 31, 2016 |
$ | (60,551 | ) | $ | (196 | ) | $ | (376 | ) | $ | (61,123 | ) | ||||
| OCI before reclassifications (1) |
(25,042 | ) | — | 83 | (24,959 | ) | ||||||||||
| Amounts reclassified from AOCI |
— | 196 | 91 | 287 | ||||||||||||
|
|
|
|
|
|
|
|
|
|||||||||
| Net current period OCI |
(25,042 | ) | 196 | 174 | (24,672 | ) | ||||||||||
|
|
|
|
|
|
|
|
|
|||||||||
| Balance at March 31, 2017 |
(85,593 | ) | — | (202 | ) | (85,795 | ) | |||||||||
| OCI before reclassifications (2) |
91,928 | (22,635 | ) | 3 | 69,296 | |||||||||||
| Amounts reclassified from AOCI |
— | (2,773 | ) | 31 | (2,742 | ) | ||||||||||
|
|
|
|
|
|
|
|
|
|||||||||
| Net current period OCI |
91,928 | (25,408 | ) | 34 | 66,554 | |||||||||||
|
|
|
|
|
|
|
|
|
|||||||||
| Balance at March 31, 2018 |
$ | 6,335 | $ | (25,408 | ) | $ | (168 | ) | $ | (19,241 | ) | |||||
|
|
|
|
|
|
|
|
|
|||||||||
| (1) | Net of tax of $(51) for defined benefit pension items. |
| (2) | Net of tax of $9,063 and $(1) for derivative contracts and defined benefit pension items, respectively. |
Reclassifications out of accumulated other comprehensive loss consisted of the following:
| 2018 | 2017 | |||||||
| Gains and losses on cash flow hedges: |
||||||||
| Cross currency swaps (1) |
$ | (4,234 | ) | $ | — | |||
| Interest rate swaps (1) |
101 | 329 | ||||||
| Tax |
1,360 | (133 | ) | |||||
|
|
|
|
|
|||||
| Net of tax |
(2,773 | ) | 196 | |||||
|
|
|
|
|
|||||
| Defined benefit pension items: |
||||||||
| Amortization of net actuarial losses (2) |
7 | 15 | ||||||
| Settlement and curtailments (2) |
44 | 133 | ||||||
| Tax |
(20 | ) | (57 | ) | ||||
|
|
|
|
|
|||||
| Net of tax |
31 | 91 | ||||||
|
|
|
|
|
|||||
| Total reclassifications, net of tax |
$ | (2,742 | ) | $ | 287 | |||
|
|
|
|
|
|||||
| (1) | Reclassified from AOCI into interest expense in the consolidated statements of income. See Note 9. |
| (2) | Reclassified from AOCI into facility closure expenses in the consolidated statements of income. These components are included in the computation of net periodic pension cost. See Note 11. |
| (20) | FACILITY CLOSURES |
Merignac, France
During the three months ended September 30, 2017, the Company announced plans to consolidate our manufacturing facility located in Merignac, France into our existing facility in Libourne, France. The transition was substantially completed in the third quarter of fiscal 2018.
66
Below is a summary of the total contractual termination benefits and exit and disposal costs related to the closure of the Merignac facility:
| Total costs expected to be incurred |
Total costs incurred | Cumulative costs incurred as of March 31, 2018 |
||||||||||
| 2018 | ||||||||||||
| Severance and other termination benefits |
$ | 703 | $ | 703 | $ | 703 | ||||||
| Other associated costs |
450-750 | 347 | 347 | |||||||||
Other associated costs primarily consisted of costs to dismantle, transport and reassemble manufacturing equipment that was moved to other manufacturing facilities and ongoing costs related to the leased facility until expiration or early termination of the related lease agreement.
Below is a reconciliation of the beginning and ending liability balances related to the contractual termination benefits and exit and disposal costs:
| Balance at March 31, 2017 |
Amounts Expensed |
Amounts Paid |
Balance at March 31, 2018 |
|||||||||||||
| Severance and other termination benefits |
$ | — | 703 | (246 | ) | $ | 457 | |||||||||
| Other associated costs |
$ | — | 347 | (347 | ) | $ | — | |||||||||
As a result of the decision to close our Merignac facility, the Company determined that it was more likely than not that certain fixed assets at the Merignac facility would be sold or otherwise disposed of significantly before the end of their estimated useful lives. During fiscal 2018, non-cash impairment charges of $125 related to these assets were recorded to write off land and building improvements that will not be transferred to Libourne and will be abandoned. In addition, the Company recorded a net loss on the sale of property, plant and equipment of $42 related to assets in Merignac that were not transferred to Libourne and were sold during fiscal 2018. These items were recorded in facility closure expenses in the consolidated statements of income.
In addition, the Company reversed $102 in accrued pension related to employees that were terminated in conjunction with the closure, which was recorded in facility closure expenses in the consolidated statements of income.
The cumulative costs incurred in conjunction with the closure as of March 31, 2018 are $1,115, which were recorded in facility closure expenses in the consolidated statements of income in fiscal 2018.
Dormans, France
During the three months ended June 30, 2017, the Company announced plans to close our manufacturing facility located in Dormans, France. Production at the facility ceased during the first quarter of fiscal 2018.
Below is a summary of the exit and disposal costs related to the closure of the Dormans facility:
| Total costs expected to be incurred |
Total costs incurred | Cumulative costs incurred as of March 31, 2018 |
||||||||||
| 2018 | ||||||||||||
| Severance and other termination benefits |
$ | 106 | $ | 106 | $ | 106 | ||||||
| Other associated costs |
23 | 23 | 23 | |||||||||
Other associated costs primarily consisted of costs to dismantle, transport and reassemble manufacturing equipment that was moved to other manufacturing facilities.
Below is a reconciliation of the beginning and ending liability balances related to the exit and disposal costs:
| Balance at March 31, 2017 |
Amounts Expensed |
Amounts Paid |
Balance at March 31, 2018 |
|||||||||||||
| Severance and other termination benefits |
$ | — | 106 | (106 | ) | $ | — | |||||||||
| Other associated costs |
$ | — | 23 | (23 | ) | $ | — | |||||||||
During fiscal 2018, the Company recorded non-cash impairment charges of $25 to adjust the carrying value of the land and building held for sale at the Dormans facility to their estimated fair value, less costs to sell, which were determined based on a quoted market price. The land and building at the Dormans facility were sold during fiscal 2018. During fiscal 2018, the Company recorded a net loss on the disposal of property, plant and equipment of $59 related to assets in Dormans that were not transferred to other facilities and were sold or
67
abandoned. In addition, the Company wrote-off $47 in raw materials that were not transferred to other facilities. These items were recorded in facility closure expenses in the consolidated statements of income.
The cumulative costs incurred in conjunction with the closure as of March 31, 2018 are $260, which were recorded in facility closure expenses in the consolidated statements of income in fiscal 2018.
Sonoma, California
On January 19, 2016, the Company announced plans to consolidate our manufacturing facility located in Sonoma, California, into our existing facility in Napa, California. The transition was substantially completed in the third quarter of fiscal 2017.
Below is a summary of the exit and disposal costs related to the closure of the Sonoma facility:
| Total costs expected to be incurred |
Total costs incurred | Cumulative costs incurred as of March 31, 2018 |
||||||||||
| 2017 | ||||||||||||
| Severance and other termination benefits |
$ | 6 | $ | 6 | $ | 6 | ||||||
| Other associated costs |
91 | 91 | 91 | |||||||||
Below is a reconciliation of the beginning and ending liability balances related to the exit and disposal costs:
| Balance at March 31, 2017 |
Amounts Expensed |
Amounts Paid |
Balance at March 31, 2018 |
|||||||||||||
| Other associated costs |
$ | 24 | — | (24 | ) | $ | — | |||||||||
| Balance at March 31, 2016 |
Amounts Expensed |
Amounts Paid |
Balance at March 31, 2017 |
|||||||||||||
| Severance and other termination benefits |
$ | — | 6 | (6 | ) | $ | — | |||||||||
| Other associated costs |
$ | — | 91 | (67 | ) | $ | 24 | |||||||||
Other associated costs primarily consisted of costs to dismantle, transport and reassemble manufacturing equipment that was moved from Sonoma to Napa.
As a result of the decision to close our Sonoma facility, the Company determined that it was more likely than not that certain fixed assets at the Sonoma facility would be sold or otherwise disposed of significantly before the end of their estimated useful lives. During fiscal 2016, non-cash impairment charges of $220 related to these assets were recorded, primarily to write off certain machinery and equipment that was not transferred to other locations and was abandoned. During fiscal 2017, the Company recorded a net gain on the sale of property, plant and equipment of $185 related to assets in Sonoma that were not transferred to Napa and were sold. In addition, the Company wrote-off $140 in property, plant and equipment that was not transferred to Napa and was abandoned in fiscal 2017. These items were recorded in facility closure expenses in the consolidated statements of income.
The cumulative costs incurred in conjunction with the closure as of March 31, 2018 are $272, which were recorded in facility closure expenses in the consolidated statements of income, $52 and $220 in 2017 and 2016, respectively.
Glasgow, Scotland
During the three months ended March 31, 2016, the Company began the process to consolidate our two manufacturing facilities located in Glasgow, Scotland into one facility. The transition was substantially completed in the fourth quarter of fiscal 2017.
Below is a summary of the exit and disposal costs related to the closure of the Glasgow facility:
| Total costs expected to be incurred |
Total costs incurred | Cumulative costs incurred as of March 31, 2018 |
||||||||||||||
| 2017 | 2016 | |||||||||||||||
| Severance and other termination benefits |
$ | 479 | $ | 100 | $ | 379 | $ | 479 | ||||||||
| Other associated costs |
642 | 539 | 103 | 642 | ||||||||||||
68
Below is a reconciliation of the beginning and ending liability balances related to the exit and disposal costs:
| Balance at March 31, 2017 |
Amounts Expensed |
Amounts Paid |
Balance at March 31, 2018 |
|||||||||||||
| Other associated costs |
$ | 99 | — | (99 | ) | $ | — | |||||||||
| Balance at March 31, 2016 |
Amounts Expensed |
Amounts Paid |
Balance at March 31, 2017 |
|||||||||||||
| Severance and other termination benefits |
$ | 106 | 100 | (206 | ) | $ | — | |||||||||
| Other associated costs |
$ | — | 539 | (440 | ) | $ | 99 | |||||||||
Other associated costs primarily consisted of costs to dismantle, transport and reassemble manufacturing equipment that was moved in order to consolidate our two manufacturing facilities located in Glasgow into one facility.
As a result of the decision to consolidate our Glasgow facilities, the Company determined that it was more likely than not that certain fixed assets at the closing Glasgow facility would be sold or otherwise disposed of significantly before the end of their estimated useful lives. During fiscal 2016, non-cash impairment charges of $115 related to these assets were recorded in facility closure expenses in the consolidated statements of income, primarily to write off certain machinery and equipment that was not transferred to other locations and was abandoned. During fiscal 2017, the Company recorded a net gain on the sale of property, plant and equipment of $377 related to assets that were not transferred to other locations and were sold.
The cumulative costs incurred in conjunction with the closure as of March 31, 2018 are $859, which were recorded in facility closure expenses in the consolidated statements of income, $262 and $597 in fiscal 2017 and 2016, respectively.
Greensboro, North Carolina
On October 5, 2015, the Company announced plans to consolidate our manufacturing facility located in Greensboro, North Carolina into other North American facilities. The transition was substantially completed in the fourth quarter of fiscal 2016.
Below is a summary of the exit and disposal costs related to the closure of the Greensboro facility:
| Total costs expected to be incurred |
Total costs incurred | Cumulative costs incurred as of March 31, 2018 |
||||||||||||||
| 2017 | 2016 | |||||||||||||||
| Severance and other termination benefits |
$ | 651 | $ | (22 | ) | $ | 673 | $ | 651 | |||||||
| Contract termination costs |
— | (66 | ) | 66 | — | |||||||||||
| Other associated costs |
844 | 207 | 637 | 844 | ||||||||||||
Below is a reconciliation of the beginning and ending liability balances related to the exit and disposal costs:
| Balance at March 31, 2016 |
Amounts Expensed |
Amounts Paid |
Balance at March 31, 2017 |
|||||||||||||
| Severance and other termination benefits |
$ | 202 | (22 | ) | (180 | ) | $ | — | ||||||||
| Contract termination costs |
$ | 66 | (66 | ) | — | $ | — | |||||||||
| Other associated costs |
$ | 114 | 207 | (321 | ) | $ | — | |||||||||
Other associated costs primarily consist of costs to dismantle, transport and reassemble manufacturing equipment that was moved from the Greensboro facility to other North American facilities and costs to return the facility to its original leased condition.
As a result of the decision to close our Greensboro facility, the Company determined that it was more likely than not that certain fixed assets at the Greensboro facility would be sold or otherwise disposed of significantly before the end of their estimated useful lives. During fiscal 2016, non-cash impairment charges of $786 related to these assets were recorded in facility closure expenses in the consolidated statements of income, primarily to write off certain machinery and equipment that was not transferred to other locations and was abandoned. In addition, $85 to write off fixed assets that were not transferred to other facilities and were disposed of in conjunction with the final facility clean-up was recorded in facility closure expenses in fiscal 2016.
The cumulative costs incurred in conjunction with the closure as of March 31, 2018 are $2,366, which were recorded in facility closure expenses in the consolidated statements of income, $119 and $2,247 in fiscal 2017 and 2016, respectively.
69
Dublin, Ireland
During the three months ended December 31, 2015, the Company began the process to consolidate our manufacturing facility located in Dublin, Ireland into our existing facility in Drogheda, Ireland (near Dublin). The consolidation was substantially completed in the first quarter of fiscal 2017.
Below is a summary of the exit and disposal costs related to the closure of the Dublin facility:
| Total costs expected to be incurred |
Total costs incurred | Cumulative costs incurred as of March 31, 2018 |
||||||||||||||
| 2017 | 2016 | |||||||||||||||
| Severance and other termination benefits |
$ | 765 | $ | 102 | $ | 663 | $ | 765 | ||||||||
| Contract termination costs |
177 | 177 | — | 177 | ||||||||||||
| Other associated costs |
670 | 76 | 594 | 670 | ||||||||||||
Below is a reconciliation of the beginning and ending liability balances related to the exit and disposal costs:
| Balance at March 31, 2016 |
Amounts Expensed |
Amounts Paid |
Balance at March 31, 2017 |
|||||||||||||
| Severance and other termination benefits |
$ | — | 102 | (102 | ) | $ | — | |||||||||
| Contract termination costs |
$ | — | 177 | (177 | ) | $ | — | |||||||||
| Other associated costs |
$ | 83 | 76 | (159 | ) | $ | — | |||||||||
Other associated costs primarily consist of costs to dismantle, transport and reassemble manufacturing equipment that was moved from Dublin to Drogheda and costs to relocate employees.
As a result of the decision to close our Dublin facility, the Company determined that it was more likely than not that certain fixed assets at the Dublin facility would be sold or otherwise disposed of significantly before the end of their estimated useful lives. During fiscal 2016, non-cash fixed asset impairment charges of $219 were recorded in facility closure expenses in the consolidated statements of income, primarily to write off certain machinery and equipment and leasehold improvements that were not transferred to other locations and were abandoned.
The cumulative costs incurred in conjunction with the closure as of March 31, 2018 are $1,831, which were recorded in facility closure expenses in the consolidated statements of income, $355 and $1,476 in fiscal 2017 and 2016, respectively.
Norway, Michigan and Watertown, Wisconsin
During fiscal 2015, the Company decided to close our manufacturing facilities located in Norway, Michigan and Watertown, Wisconsin. Due to available capacity, we transitioned the Norway and Watertown business to other North American facilities.
During fiscal 2016, the Company incurred exit and disposal costs of $134 and $352 related to severance and other termination benefits and other associated costs, respectively, related to the closure of the Norway and Watertown facilities. Cumulative costs of $2,023, $64 and $943 in severance and other termination benefits, contract termination costs and other associated costs, respectively, were incurred in conjunction with the Norway and Watertown closures. Other associated costs primarily consisted of costs to dismantle, transport and reassemble manufacturing equipment that was moved from the Norway and Watertown facilities to other North American facilities and costs to maintain the facilities while held for sale.
During fiscal 2016, impairment charges of $534 were recorded to adjust the carrying value of the land and building held for sale at the Norway facility to their estimated fair value, less costs to sell. The land and building at the Watertown facility were sold during fiscal 2016, and a gain of $476 was recorded in facility closure expenses in the consolidated statements of income. In addition, the land and building at the Norway facility were sold during fiscal 2016.
During fiscal 2018, 2017 and 2016, the Company recorded settlement expense of $44, $133 and $88, respectively, related to the defined benefit pension plan that covers eligible union employees of our Norway plant who were hired prior to July 14, 1998.
The above costs incurred in conjunction with the closure were recorded in facility closure expenses in the consolidated statements of income, $44, $133 and $632 in fiscal 2018, 2017 and 2016, respectively.
Other Facility Closure Costs
During fiscal 2016, the Company closed a small sales office located near Toronto, Canada and recorded costs of $28 related to the closure.
70
| (21) | QUARTERLY DATA (UNAUDITED) |
Earnings per share amounts are computed independently each quarter. As a result, the sum of each quarter’s per share amount may not equal the total per share amount for the respective year.
| Quarter | ||||||||||||||||
| Fiscal 2018 |
First | Second | Third | Fourth | ||||||||||||
| Net revenues |
$ | 242,440 | $ | 256,034 | $ | 352,699 | $ | 449,739 | ||||||||
| Gross profit |
49,457 | 51,774 | 57,302 | 88,067 | ||||||||||||
| Net income |
14,142 | 15,190 | 20,511 | 22,054 | ||||||||||||
| Net income attributable to Multi-Color Corporation |
14,106 | 15,190 | 20,532 | 22,123 | ||||||||||||
| Basic earnings per share |
$ | 0.83 | $ | 0.89 | $ | 1.06 | $ | 1.08 | ||||||||
| Diluted earnings per share |
0.82 | 0.88 | 1.06 | 1.08 | ||||||||||||
Fiscal 2018 results include $1,419 ($945 after-tax) in costs related to the closure of our manufacturing facilities located in Merignac and Dormans, France and Norway, Michigan. These expenses were recorded as follows:
| Quarter | ||||||||||||||||
| First | Second | Third | Fourth | |||||||||||||
| Facility closure expenses |
$ | 34 | $ | 95 | $ | 761 | $ | 529 | ||||||||
| Quarter | ||||||||||||||||
| Fiscal 2017 |
First | Second | Third | Fourth | ||||||||||||
| Net revenues |
$ | 236,494 | $ | 232,140 | $ | 210,658 | $ | 244,003 | ||||||||
| Gross profit |
52,093 | 49,953 | 41,217 | 53,546 | ||||||||||||
| Net income |
15,910 | 16,534 | 12,195 | 16,726 | ||||||||||||
| Net income attributable to Multi-Color Corporation |
15,805 | 16,343 | 12,126 | 16,722 | ||||||||||||
| Basic earnings per share |
$ | 0.94 | $ | 0.97 | $ | 0.72 | $ | 0.99 | ||||||||
| Diluted earnings per share |
0.93 | 0.96 | 0.71 | 0.98 | ||||||||||||
Fiscal 2017 results include $921 ($706 after-tax) in costs related to the closure of our manufacturing facilities located in the following: Glasgow, Scotland; Sonoma, California; Greensboro, North Carolina; Dublin, Ireland; Norway, Michigan and Watertown, Wisconsin. These expenses were recorded as follows:
| Quarter | ||||||||||||||||
| First | Second | Third | Fourth | |||||||||||||
| Facility closure expenses |
$ | 157 | $ | 57 | $ | 393 | $ | 314 | ||||||||
| ITEM 9. | CHANGES IN AND DISAGREEMENTS WITH ACCOUNTANTS ON ACCOUNTING AND FINANCIAL DISCLOSURE |
None.
71
| ITEM 9A. | CONTROLS AND PROCEDURES |
(In thousands, except for statistical data)
| (a) | Evaluation of Disclosure Controls and Procedures |
The term “disclosure controls and procedures” as defined by Rule 13a-15(e) of the Securities Exchange Act of 1934, as amended (the “Exchange Act”) refers to the controls and other procedures of a company that are designed to ensure that information required to be disclosed by a company in the reports that it files under the Exchange Act is recorded, processed, summarized and reported within required time periods. Disclosure controls and procedures include, without limitation, controls and procedures designed to ensure that information required to be disclosed is accumulated and communicated to management, including the Chief Executive Officer and Chief Financial Officer, as appropriate to allow timely decisions regarding required disclosure.
In accordance with Exchange Act Rule 13a-15(b), Multi-Color’s management, with the participation of the Chief Executive Officer, Chief Financial Officer and Chief Accounting Officer, conducted an evaluation of the effectiveness of the Company’s disclosure controls and procedures as of March 31, 2018. Based on this evaluation, Multi-Color has concluded that the disclosure controls and procedures were effective as of March 31, 2018.
Multi-Color’s management does not expect that its disclosure controls and procedures will prevent all errors and all fraud. A control system, no matter how well designed and operated, can provide only reasonable, not absolute, assurance that the control system’s objectives will be met. Further, the design of a control system must reflect the fact that there are resource constraints, and the benefits of controls must be considered relative to their costs. Because of the inherent limitations in all control systems, no evaluation of controls can provide absolute assurance that all control issues and instances of fraud, if any, have been detected. These inherent limitations include the realities that judgments in decision-making can be faulty, and that breakdowns can occur due to simple errors or mistakes. The design of any system of controls is based in part upon certain assumptions regarding the likelihood of future events, and there can be no assurance that any design will succeed in achieving its stated goals under all potential future conditions.
| (b) | Management’s Report on Internal Control over Financial Reporting |
Multi-Color’s management is responsible for the preparation and accuracy of the financial statements and other information included in this report. Multi-Color’s management is also responsible for establishing and maintaining adequate internal control over financial reporting, as such term is defined in Securities Exchange Act Rules 13a-15(f) and 15d-15(f). Under the supervision and with the participation of management, including Multi-Color’s Chief Executive Officer, Chief Financial Officer and Chief Accounting Officer, Multi-Color conducted an evaluation of the effectiveness of internal control over financial reporting as of March 31, 2018, based on the criteria set forth in Internal Control – Integrated Framework (2013) (the “Framework”) issued by the Committee of Sponsoring Organizations of the Treadway Commission (“COSO”). Based on this assessment, management concluded that, as of March 31, 2018, its internal control over financial reporting was effective based on the Framework. The Company’s assessment of and conclusion on the effectiveness of its internal control over financial reporting did not include the internal controls of the companies it acquired during fiscal 2018 which were included in the 2018 consolidated financial statements. These acquired companies constituted $1,558,017 or 54% of the Company’s total assets as of March 31, 2018, and $317,722 or 24% of total net revenues, for the year end March 31, 2018.
There are inherent limitations on the effectiveness of any system of internal controls and procedures, including the possibility of human error and the circumvention or overriding of the controls and procedures. Accordingly, even effective internal controls and procedures can only provide reasonable assurance of achieving their control objectives.
Item 8 includes the audit report of Grant Thornton LLP on Multi-Color’s internal control over financial reporting as of March 31, 2018.
| (c) | Changes in Internal Control over Financial Reporting |
There were no changes in the Company’s internal control over financial reporting that have materially affected, or are reasonably likely to materially affect, Multi-Color’s internal control over financial reporting.
| ITEM 9B. | OTHER INFORMATION |
On May 30, 2018, Multi-Color Corporation (the “Company”) appointed Michael J. Henry to the Company’s Board of Directors (the “Board”). Mr. Henry, age 51, has served as the President and Chief Executive Officer of the Company since January 1, 2018. Prior to the Company’s acquisition of the Labels Division of Constantia Flexibles (“Constantia Labels”) on October 31, 2017, Mr. Henry served as the Executive Vice President of Constantia Labels (the “EVP Labels”) since June 2014. Prior to his service as EVP Labels, Mr. Henry served as Chief Financial Officer and Chief Operating Officer of Spear Group Holdings Limited, which was a subsidiary of Constantia Labels from September 1999 until June 2014. Mr. Henry will receive no compensation for his service to the Company’s Board outside of his Employment Agreement with the Company.
72
PART III
The information required by the following Items will be included in the Company’s definitive Proxy Statement for the 2018 Annual Meeting of Shareholders which will be filed with the Securities and Exchange Commission within 120 days after the end of the Registrant’s fiscal year and is incorporated herein by reference.
| ITEM 10. | Directors, Executive Officers and Corporate Governance |
| ITEM 11. | Executive Compensation |
| ITEM 12. | Security Ownership of Certain Beneficial Owners and Management and Related Stockholder Matters |
| ITEM 13. | Certain Relationships and Related Transactions, and Director Independence |
| ITEM 14. | Principal Accountant Fees and Services |
PART IV
| ITEM 15. | EXHIBITS AND FINANCIAL STATEMENT SCHEDULES |
| (a)(1) | Financial Statements: |
The following Consolidated Financial Statements of Multi-Color Corporation and subsidiaries and the Reports of the Independent Registered Public Accounting Firm are included in Part II, Item 8.
Reports of Independent Registered Public Accounting Firm
Consolidated Statements of Income for the years ended March 31, 2018, 2017 and 2016
Consolidated Statements of Comprehensive Income (Loss) for the years ended March 31, 2018, 2017 and 2016
Consolidated Balance Sheets as of March 31, 2018 and 2017
Consolidated Statements of Stockholders’ Equity for the years ended March 31, 2018, 2017 and 2016
Consolidated Statements of Cash Flows for the years ended March 31, 2018, 2017 and 2016
Notes to Consolidated Financial Statements
Management’s Report on Internal Control Over Financial Reporting is included in Part II, Item 9A.
| (a)(2) | Financial Statement Schedules: |
All schedules have been omitted because they are either not required or the information is included in the financial statements and notes thereto.
| (b) | Exhibits |
73
74
| ITEM 16. | FORM 10-K SUMMARY |
Not Applicable.
75
Pursuant to the requirements of Section 13 or 15(d) of the Securities Exchange Act of 1934, the Registrant has duly caused this report to be signed on its behalf by the undersigned thereunto duly authorized.
| MULTI-COLOR CORPORATION | ||||||
| Dated: May 30, 2018 | By: | /s/ Michael J. Henry | ||||
| Michael J. Henry | ||||||
| President and Chief Executive Officer | ||||||
| (Principal Executive Officer) | ||||||
We, the undersigned directors and officers of Multi-Color Corporation, hereby severally constitute Vadis A. Rodato and Sharon E. Birkett, and each of them singly, our true and lawful attorneys with full power to them and each of them to sign for us, in our names in the capacities indicated below, any and all amendments to this Annual Report on Form 10-K filed with the Securities and Exchange Commission.
Pursuant to the requirements of the Securities Exchange Act of 1934, this report has been signed below by the following persons on behalf of the Registrant in the capacities and on the date indicated.
| Name |
Capacity |
Date | ||
| /s/ Michael J. Henry Michael J. Henry |
President, Chief Executive Officer and Director (Principal Executive Officer) |
May 30, 2018 | ||
| /s/ Sharon E. Birkett Sharon E. Birkett |
Vice President, Chief Financial Officer, Secretary (Principal Financial Officer) |
May 30, 2018 | ||
| /s/ Timothy P. Lutz Timothy P. Lutz |
Chief Accounting Officer (Principal Accounting Officer) |
May 30, 2018 | ||
| /s/ Nigel A. Vinecombe Nigel A. Vinecombe |
Executive Chairman of the Board of Directors | May 30, 2018 | ||
| /s/ Alexander Baumgartner Alexander Baumgartner |
Director | May 30, 2018 | ||
| /s/ Ari J. Benacerraf Ari J. Benacerraf |
Director | May 30, 2018 | ||
| /s/ Robert R. Buck Robert R. Buck |
Director | May 30, 2018 | ||
| /s/ Charles B. Connolly Charles B. Connolly |
Director | May 30, 2018 | ||
| /s/ Robert W. Kuhn Robert W. Kuhn |
Director | May 30, 2018 | ||
| /s/ Roland Lienau Roland Lienau |
Director | May 30, 2018 | ||
| /s/ Vadis A. Rodato Vadis A. Rodato |
Director | May 30, 2018 | ||
76