Attached files
| file | filename |
|---|---|
| 8-K - 8-K - PHOTRONICS INC | form8k.htm |
| EX-99.4 - EXHIBIT 99.4 - PHOTRONICS INC | ex99_4.htm |
| EX-99.3 - EXHIBIT 99.3 - PHOTRONICS INC | ex99_3.htm |
| EX-99.2 - EXHIBIT 99.2 - PHOTRONICS INC | ex99_2.htm |
| EX-99.1 - EXHIBIT 99.1 - PHOTRONICS INC | ex99_1.htm |
Exhibit 99.5
Photronics, Inc. Q2 2018 Financial Results Conference CallMay 22, 2018

Safe Harbor Statement 2 This presentation and some of our comments may contain projections or other forward-looking statements regarding future events, our future financial performance, and/or the future performance of the industry. These statements are predictions, and contain risks and uncertainties. Actual events or results may differ materially from those presented. These statements include words like “anticipate”, “believe”, “estimate”, “expect”, “forecast”, “may”, “should”, “plan”, “project” or the negative thereto. We cannot guarantee the accuracy of any forecasts or estimates, and we are not obligated to update any forward-looking statements if our expectations change. If you would like more information on the risks involved in forward-looking statements, please see the documents we file from time to time with the Securities and Exchange Commission, specifically our most recent Form 10K and Form 10Q.Non-GAAP Financial MeasuresThis presentation and some of our comments may reference non-GAAP financial measures. These non-GAAP financial measures exclude certain income or expense items, and are consistent with another way management internally analyzes our results of operations. Non-GAAP information should be considered to be a supplement to, and not a substitute for, financial statements prepared in accordance with GAAP. Please see the “Reconciliation of GAAP to Non-GAAP Financial Information” in this presentation.

Revenue grew 21% Y/Y and 6% Q/QHigh-end IC biggest growth factor (+83% Y/Y)China revenue doubled Y/Y; up 18% Q/QGross and operating margins expanded on higher revenue and operating leverageNet income attributable to Photronics, Inc. shareholders of $10.7M ($0.15/share)Cash balance of $321M; capex increased to $33M as we invest in growthChina investments on trackConstruction to be completed later this yearProduction to begin first half of 2019 Q2 2018 Summary 3 Investing in long-term, profitable growth to increase shareholder value

$M (except EPS) Q218 Q118 Q/Q Q217 Y/Y Revenue $ 130.8 $ 123.4 6% $ 108.3 21% Gross Profit $ 32.8 $ 27.7 19% $ 20.2 63% Gross Margin 25.1% 22.4% 270 bps 18.6% 650 bps Operating Income $ 15.4 $ 11.8 30% $ 5.5 178% Operating Margin 11.7% 9.6% 210 bps 5.1% 660 bps Net Income* $ 10.7 $ 5.9 80% $ 1.8 493% Diluted EPS* $ 0.15 $ 0.09 $ 0.06 $ 0.03 $ 0.12 Higher revenue as we achieved growth in both IC & FPDGross margin improved due to effect of revenue increaseOperating margin increased as higher gross margin and lower R&D offset impact of higher SG&A due to compensationNet income includes foreign exchange gain, net of tax and non-controlling interest, of $1.5M ($0.02/share) in Q218; and a loss of $2.7M ($0.04/share) in Q118Q118 tax expense includes $4.2M ($0.06/share) benefits, primarily for recognition of accumulated AMT credits resulting from the tax reform act Income Statement Summary 4 *Net income attributable to Photronics, Inc. shareholders

Strong high-end growthHigh-end logic growth driven by Asia foundriesMemory demand from Asia continues to be strongChina revenue more that doubled Y/Y; represents 11% of Q218 IC revenueExpect demand trends to continue in Q3High-end logic improvingHigh-end memory flat to upMainstream stable $M Q218 Q118 Q/Q Q217 Y/Y High-End* $ 41.5 $ 33.4 24% $ 22.7 83% Mainstream $ 60.8 $ 62.3 (2%) $ 59.9 1% Total $ 102.3 $ 95.7 7% $ 82.6 24% IC Photomask Revenue 5 *28nm and smaller Total may differ due to rounding
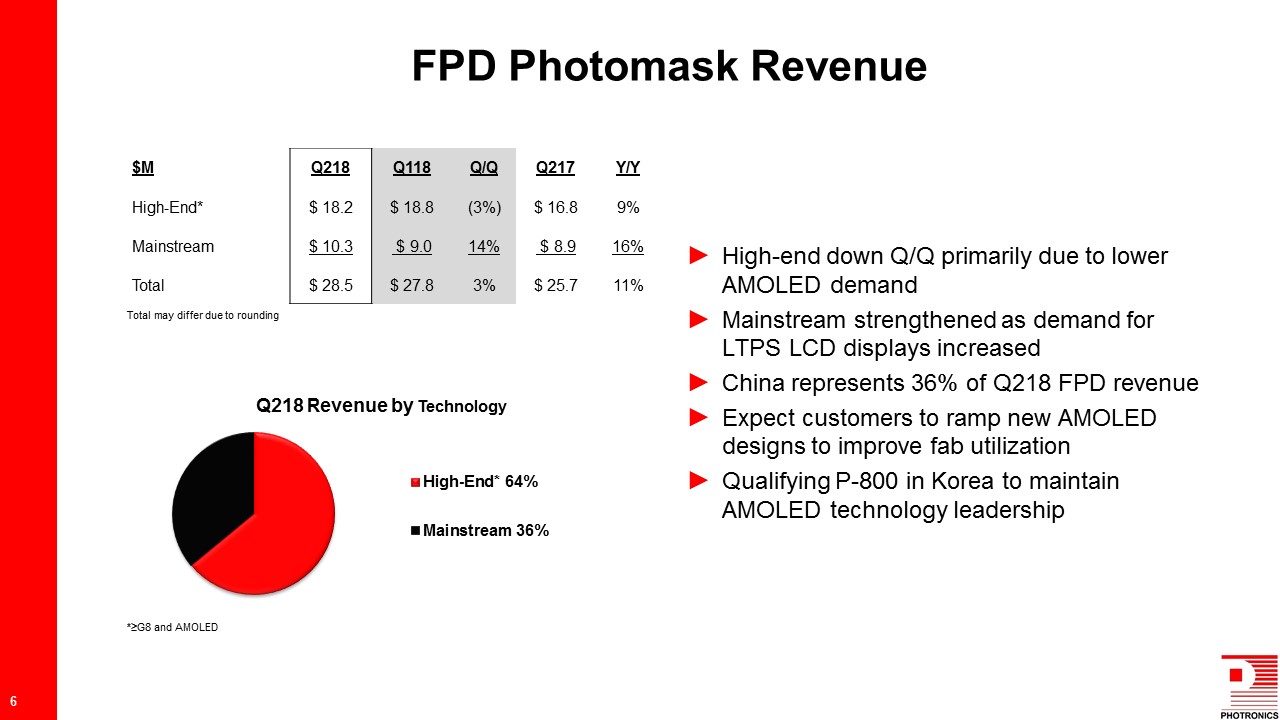
High-end down Q/Q primarily due to lower AMOLED demandMainstream strengthened as demand for LTPS LCD displays increasedChina represents 36% of Q218 FPD revenueExpect customers to ramp new AMOLED designs to improve fab utilizationQualifying P-800 in Korea to maintain AMOLED technology leadership $M Q218 Q118 Q/Q Q217 Y/Y High-End* $ 18.2 $ 18.8 (3%) $ 16.8 9% Mainstream $ 10.3 $ 9.0 14% $ 8.9 16% Total $ 28.5 $ 27.8 3% $ 25.7 11% FPD Photomask Revenue 6 *≥G8 and AMOLED Total may differ due to rounding

$M Q218 Q118 Q217 Cash $ 321 $ 349 $ 346 Debt $ 59 $ 61 $ 65 Net Cash* $ 262 $ 288 $ 281 Operating Cash Flow $ 7 $ 31 $ 15 Capital Expenditures $ 33 $ 11 $ 5 LTM EBITDA $ 138 $ 122 $ 120 Cash balance lower on higher capex and lower operating cash flowOperating cash flow lower due to increase in net working capital and other current assets, driven by revenue growth2018 capex expected to be ~$250M, primarily for China IC & FPD investmentsBalance sheet able to fund planned investments and strategic M&A opportunities Select Financial Data 7 *Net cash defined as cash and cash equivalents less long-term borrowings (including current portion), as reported in accordance with GAAP

Revenue ($M) $128 - $136 Taxes ($M) $2 - $3 EPS $0.12 - $0.18 Diluted Shares (M) ~75 High-end demand expectations are positiveHigh-end IC logic up on Asia foundry demandHigh-end IC memory stable to improvingHigh-end FPD mask demand should improve as customers release new designs to maintain utilizationSome high-end litho tools schedule for PM in Q3, limiting revenue growthExpect margin headwinds in H218 as China operations begin to ramp ahead of production in first half of 2019 Q318 Guidance 8

Thank you for your interest! For Additional Information:R. Troy Dewar, CFADirector, Investor Relations203.740.5610tdewar@photronics.com

Appendix

IC Photomask Revenue 11 Mainstream$250.2M66% High-End$129.0M34% High-End: 28nm and smaller; total may differ due to rounding

FPD Photomask Revenue 12 Mainstream$36.7M34% High-End$70.9M66% High-End: ≥G8 and AMOLED; total may differ due to rounding Mainstream$32.5M32% High-End$67.9M68%

Non-GAAP Reconciliation

14