Attached files
| file | filename |
|---|---|
| EX-32.1 - EX-32.1 - Tintri, Inc. | tntr-ex321_185.htm |
| EX-31.1 - EX-31.1 - Tintri, Inc. | tntr-ex311_188.htm |
| EX-23.1 - EX-23.1 - Tintri, Inc. | tntr-ex231_746.htm |
| EX-10.24 - EX-10.24 - Tintri, Inc. | tntr-ex1024_280.htm |
| EX-10.21 - EX-10.21 - Tintri, Inc. | tntr-ex1021_398.htm |
| EX-10.20 - EX-10.20 - Tintri, Inc. | tntr-ex1020_279.htm |
| EX-10.17 - EX-10.17 - Tintri, Inc. | tntr-ex1017_325.htm |
UNITED STATES
SECURITIES AND EXCHANGE COMMISSION
Washington, D.C. 20549
FORM 10-K
(Mark One)
|
☒ |
ANNUAL REPORT PURSUANT TO SECTION 13 OR 15(d) OF THE SECURITIES EXCHANGE ACT OF 1934 |
For the fiscal year ended January 31, 2018
OR
|
☐ |
TRANSITION REPORT PURSUANT TO SECTION 13 OR 15(d) OF THE SECURITIES EXCHANGE ACT OF 1934 FOR THE TRANSITION PERIOD FROM TO |
Commission File Number 001-38117
Tintri, Inc.
(Exact name of registrant as specified in its charter)
|
Delaware |
26-2906978 |
|
( State or other jurisdiction of incorporation or organization) |
(I.R.S. Employer |
|
303 Ravendale Drive Mountain View, CA 94043 |
|
|
(Address of principal executive offices including zip code) |
|
Registrant’s telephone number, including area code: (650) 810-8200
Securities registered pursuant to Section 12(b) of the Act:
|
Title of each class |
|
Name of each exchange on which registered |
|
Common Stock, par value $0.00005 per share |
|
The NASDAQ Global Select Market |
Securities registered pursuant to Section 12(g) of the Act: None
Indicate by check mark if the Registrant is a well-known seasoned issuer, as defined in Rule 405 of the Securities Act. YES ☐ NO ☒
Indicate by check mark if the Registrant is not required to file reports pursuant to Section 13 or 15(d) of the Act. YES ☐ NO ☒
Indicate by check mark whether the Registrant: (1) has filed all reports required to be filed by Section 13 or 15(d) of the Securities Exchange Act of 1934 during the preceding 12 months (or for such shorter period that the Registrant was required to file such reports), and (2) has been subject to such filing requirements for the past 90 days. YES ☒ NO ☐
Indicate by check mark whether the Registrant has submitted electronically and posted on its corporate Web site, if any, every Interactive Data File required to be submitted and posted pursuant to Rule 405 of Regulation S-T (§232.405 of this chapter) during the preceding 12 months (or for such shorter period that the Registrant was required to submit and post such files). YES ☒ NO ☐
Indicate by check mark if disclosure of delinquent filers pursuant to Item 405 of Regulation S-K (§229.405) is not contained herein, and will not be contained, to the best of Registrant’s knowledge, in definitive proxy or information statements incorporated by reference in Part III of this Form 10-K or any amendment to this Form 10-K. ☒
Indicate by check mark whether the registrant is a large accelerated filer, an accelerated filer, a non-accelerated filer, smaller reporting company, or an emerging growth company. See the definitions of “large accelerated filer,” “accelerated filer,” “smaller reporting company,” and “emerging growth company” in Rule 12b-2 of the Exchange Act.
|
Large accelerated filer |
|
☐ |
|
Accelerated filer |
|
☐ |
|
|
|
|
|
|||
|
Non-accelerated filer |
|
☒ (Do not check if a smaller reporting company) |
|
Smaller reporting company |
|
☐ |
|
|
|
|
|
|
|
|
|
|
|
|
|
Emerging growth company |
|
☒ |
If an emerging growth company, indicate by check mark if the registrant has elected not to use the extended transition period for complying with any new or revised financial accounting standards provided pursuant to Section 13(a) of the Exchange Act. ☒
Indicate by check mark whether the Registrant is a shell company (as defined in Rule 12b-2 of the Exchange Act). YES ☐ NO ☒
The aggregate market value of the voting and non-voting common equity held by non-affiliates of the Registrant, based on the closing price of the shares of common stock on The NASDAQ Stock Market on July 31, 2017, was $49.5 million. Shares of the registrant’s common stock held by each executive officer, director and holder of 5% or more of the outstanding common stock have been excluded in that such persons may be deemed to be affiliates. This calculation does not reflect a determination that certain persons are affiliates of the registrant for any other purpose.
The number of shares of Registrant’s Common Stock outstanding as of April 6, 2018, was 33,589,244.
Portions of the Registrant’s Definitive Proxy Statement relating to its 2018 annual meeting of stockholders (2018 Proxy Statement) are incorporated by reference into Part III of this Annual Report on Form 10-K. The 2018 Proxy Statement will be filed not later than 120 days after the end of our fiscal year ended January 31, 2018.
|
|
|
Page |
|
1 |
||
|
|
|
|
|
PART I |
|
|
|
Item 1. |
3 |
|
|
Item 1A. |
12 |
|
|
Item 1B. |
45 |
|
|
Item 2. |
45 |
|
|
Item 3. |
46 |
|
|
Item 4. |
46 |
|
|
|
|
|
|
PART II |
|
|
|
Item 5. |
47 |
|
|
Item 6. |
49 |
|
|
Item 7. |
Management’s Discussion and Analysis of Financial Condition and Results of Operations |
51 |
|
Item 7A. |
77 |
|
|
Item 8. |
78 |
|
|
Item 9. |
Changes in and Disagreements With Accountants on Accounting and Financial Disclosure |
113 |
|
Item 9A. |
113 |
|
|
Item 9B. |
113 |
|
|
|
|
|
|
PART III |
|
|
|
Item 10. |
114 |
|
|
Item 11. |
114 |
|
|
Item 12. |
Security Ownership of Certain Beneficial Owners and Management and Related Stockholder Matters |
114 |
|
Item 13. |
Certain Relationships and Related Transactions, and Director Independence |
114 |
|
Item 14. |
114 |
|
|
|
|
|
|
PART IV |
|
|
|
Item 15. |
115 |
|
|
Item 16. |
115 |
|
|
116 |
||
|
119 |
||
i
SPECIAL NOTE REGARDING FORWARD LOOKING STATEMENTS
This Annual Report on Form 10-K contains forward-looking statements within the meaning of Section 27A of the Securities Act of 1933, as amended (the Securities Act), and Section 21E of the Securities Exchange Act of 1934, as amended (the Exchange Act), which statements involve substantial risks and uncertainties. All statements contained in this Annual Report on Form 10-K other than statements of historical fact, including statements regarding our future results of operations and financial position, our business strategy and plans, and our objectives for future operations, are forward-looking statements. The words “believe,” “may,” “will,” “potentially,” “estimate,” “continue,” “anticipate,” “intend,” “could,” “would,” “project,” “plan,” “expect” and similar expressions that convey uncertainty of future events or outcomes are intended to identify forward-looking statements. These forward-looking statements include, but are not limited to, statements concerning the following:
|
|
• |
future financial performance, including our expectations regarding our revenue, cost of revenue, gross profit or gross margin, operating expenses including changes in research and development, sales and marketing and general and administrative expenses, and our ability to achieve, and maintain, future profitability; |
|
|
• |
the sufficiency of our cash resources to meet our cash needs; |
|
|
• |
our ability to raise additional capital; |
|
|
• |
our ability to comply with the financial or other covenants and other terms contained in our credit agreements; |
|
|
• |
our ability to continue as a going concern; |
|
|
• |
our ability to continue to operate; |
|
|
• |
our process of considering strategic alternatives; |
|
|
• |
our plans to seek to drive efficiencies in our sales organization and other business units; |
|
|
• |
the impact of recent changes in our executive management team and restructuring actions on our business; |
|
|
• |
our ability to retain and attract qualified employees and key personnel; |
|
|
• |
our business plan and our ability to effectively manage our growth and associated investments; |
|
|
• |
the anticipated benefits associated with the use of our solution; |
|
|
• |
anticipated trends, growth rates and challenges in our business and in the markets in which we operate; |
|
|
• |
market acceptance of our enterprise cloud solution; |
|
|
• |
adoption of and developments in the technologies that are integral to our value proposition, including virtualized applications and enterprise cloud data centers; |
|
|
• |
beliefs and objectives for future operations, including our plans to introduce new products; |
|
|
• |
our ability to increase sales of our solutions to our existing customers; |
|
|
• |
our ability to attract and retain customers; |
|
|
• |
our ability to maintain and expand our customer base and our relationships with our channel partners; |
|
|
• |
our ability to timely and effectively scale and adapt our existing solutions; |
|
|
• |
anticipated changes in the price of our solution and our pricing model; |
|
|
• |
our ability to develop new solutions and bring them to market in a timely manner; |
|
|
• |
our ability to maintain, protect and enhance our brand and intellectual property; |
|
|
• |
our ability to expand internationally; |
|
|
• |
the effects of increased competition in our markets and our ability to compete effectively; |
1
|
|
• |
future acquisitions or investments; |
|
|
• |
our ability to stay in compliance with laws and regulations that currently apply or become applicable to our business both in the United States and internationally; |
|
|
• |
changes in law and trade policies in the U.S. and other jurisdictions where we do business; |
|
|
• |
our compliance with tax laws and the adequacy of our accrual for potential tax liabilities; |
|
|
• |
economic and industry trends or trend analysis; |
|
|
• |
our plans regarding employee retention programs; |
|
|
• |
the effects of recent changes to the structure of our sales organization; |
|
|
• |
the estimates and estimate methodologies used in preparing our consolidated financial statements and determining option exercise prices; and |
|
|
• |
the future trading prices of our common stock. |
We caution you that the foregoing list may not contain all of the forward-looking statements made in this Annual Report on Form 10-K.
We discuss many of these risks in greater detail in “Risk Factors.” Also, these forward-looking statements represent our estimates and assumptions only as of the date of this Annual Report on Form 10-K. Unless required by federal securities laws, we do not intend to update any of these forward-looking statements to reflect circumstances or events that occur after the statements are made. Given these uncertainties, you should not place undue reliance on these forward-looking statements.
You should read this Annual Report on Form 10-K completely and with the understanding that our actual future results may be materially different from what we expect. We qualify all of our forward-looking statements by these cautionary statements.
In addition, statements that “we believe” and similar statements reflect our beliefs and opinions on the relevant subject. These statements are based upon information available to us as of the date of this Annual Report on Form 10-K, and while we believe such information forms a reasonable basis for such statements, such information may be limited or incomplete, and our statements should not be read to indicate that we have conducted an exhaustive inquiry into, or review of, all potentially available relevant information. These statements are inherently uncertain and investors are cautioned not to unduly rely upon these statements.
2
Overview
Our mission is to provide large organizations and cloud service providers with an enterprise cloud platform that offers public cloud capabilities inside their own data centers and that can also connect to public cloud services.
Our highly-differentiated and extensible enterprise cloud platform combines data management software, web services and a range of all-flash and hybrid storage systems. Our enterprise cloud platform not only delivers many of the benefits of public cloud infrastructure, but also gives organizations the control and functionality they need to run both enterprise and cloud-native application in their own private cloud.
Enterprise cloud technology provides customers with the flexibility to easily scale workloads up and down, automation and resource pooling. Our customers use our enterprise cloud platform for a variety of workloads and use cases, including virtualized desktop infrastructure, or VDI, development and test environments, or DevOps, which are sometimes referred to as Continuous Integration Continuous Delivery, or CI/CD, and other virtualized workloads, including virtualized servers, databases, and mixed workloads. Organizations use our platform to build agile development environments, run mission-critical enterprise applications and connect with public cloud services. We enable users to guarantee the performance of their organization’s applications, automate common IT tasks to reduce operating expenses, troubleshoot across compute, storage and network, predict their organization’s needs to scale, and provide needed elasticity on demand. Our platform enables organizations to easily scale to support tens of thousands of virtual machines on a single system across multiple hypervisors and containers and to connect to public cloud environments.
Our solution helps our customers optimize infrastructure by significantly simplifying deployment and operations, which can lead to substantial reductions in capital expenditures and operating expenses. We sell many of our software products separately from our core enterprise cloud platform solution, enabling our customers to tailor their infrastructure to their specific needs.
We have historically generated revenue from the sale of our products and related support and maintenance offerings. Our product revenue, which is generally recognized upon shipment, is derived from sales of our all-flash and hybrid storage systems and stand-alone software licenses for use in connection with our systems. While purchasing support is not mandatory, substantially all products shipped have been purchased together with a support contract, which includes software patches, bug fixes, updates, upgrades, hardware repair and replacement parts, and technical support. Support and maintenance revenue is recognized over the term of the support contracts. To date, substantially all of our customers have either renewed their support and maintenance subscriptions or have purchased new support and maintenance subscriptions together with replacement products. The average length of our support and maintenance contracts is approximately two years.
Revenue increased from $86.0 million in fiscal 2016 to $125.1 million in fiscal 2017, and to $125.9 million in fiscal 2018, representing year-over-year growth of 45% and 1%, respectively. Revenue increased $14.8 million in the first half of fiscal 2018 compared to the first half of fiscal 2017, which was offset by a $14.0 million decrease in revenue in the second half of fiscal 2018 compared to the second half of fiscal 2017. Our net loss was $101.0 million, $105.8 million, and $157.7 million in fiscal 2016, 2017, and 2018, respectively. Total assets decreased from $158.1 million as of the end of fiscal 2016 to $104.9 million as of the end of fiscal 2017, and to $76.2 million as of the end of fiscal 2018, representing year-over-year change of 34% and 27%, respectively.
In December 2017, we announced that we were in the process of considering strategic options to deliver value to our stockholders and had retained investment bank advisors to assist us in this process.
In March 2018, our board of directors, or the Board, approved a restructuring and reduction in force plan of approximately 20% of our global workforce. We expect to substantially complete the restructuring in our first quarter of fiscal 2019, which ended on April 30, 2018.
3
In March 2018, we announced that the Board had named Tom Barton as Chief Executive Officer and as a member of the Board, and his appointment became effective on April 2, 2018. Ken Klein transitioned from his role as our Chief Executive Officer and as a member of the Board in connection with Tom Barton joining the Company.
On May 15, 2018, we appointed Tom Barton as interim Chief Financial Officer, in addition to his existing roles with the Company.
Our Products and Technologies
Tintri Enterprise Cloud Platform
The Tintri enterprise cloud platform consists of our proprietary Tintri CONNECT architecture, Tintri software and Tintri storage systems. Customers combine the Tintri platform with their choice of server, network hardware and virtualization or cloud infrastructure software to build enterprise clouds within their own data centers and support other virtualized workloads.
Tintri CONNECT Architecture
Tintri CONNECT is a proprietary software architecture purpose-built for virtualized and cloud applications. The Tintri CONNECT architecture powers our complete range of Tintri systems and is the platform on which we offer a diverse set of Tintri software solutions. Specifically, Tintri CONNECT architecture uses the virtual machine or the container as the basis for all storage services down to the lowest levels of the hardware. This allows for all storage actions and analytics to operate at the VM and container level, including quality of service, or QoS, replication, cloning, snapshots and other key policies. Each Tintri array appears as a single pool of storage called a datastore, rather than as a collection of LUNs and volumes. Even our largest capacity array appears as a single large datastore to virtualization and cloud management tools, and can support multiple concurrent virtualization or cloud environments without partitioning. Through its VM and container level visibility, the Tintri platform can greatly simplify the interaction between the virtualized infrastructure, the applications running on that infrastructure, and the underlying storage serving that infrastructure.
Tintri Software
Tintri OS
Tintri OS, through its VM-level visibility capabilities, can greatly simplify the interaction between the virtualized infrastructure and the VM running on top of it, and the underlying storage serving that infrastructure. Rather than aggregating virtualized applications with various QoS requirements into a shared LUN, Tintri OS can assign each application its own I/O lane using algorithms and eliminate the competition between virtualized applications for resources. A storage administrator can also set minimum and maximum thresholds at the virtualized-application level to define specific QoS levels. Tintri OS incorporates a number of data protection and high availability features, including protection against double-drive failures, failed drive rebuild even under data read-error scenarios and real-time error correction.
Tintri Global Center
Tintri Global Center is an intelligent data and system management product that assists administrators in policing their infrastructure, simplifying capacity planning, visualizing resource utilization, reducing bottlenecks in the IT network outside of the storage system, and simplifying policy management and enforcement.
VM Scale-out
Tintri Global Center Advanced product adds our VM Scale-out software which creates resource pools of Tintri storage systems and intelligently optimizes the location of every application across those pools.
Tintri Analytics: Predictive Analytics
In addition to our real-time and historical analytics capabilities, which are integrated into the Tintri CONNECT architecture and available to all customers on-premises, we also offer predictive analytics that uses in-
4
memory big data technologies, such as ElasticSearch, to help customers model their current and future storage requirements.
ReplicateVM: Replication for Data Protection and Disaster Recovery
We offer support for array-level replication, including asynchronous and synchronous modes. Asynchronous replication supports one-to-one, many-to-one and one-to-many with recovery point objectives, or RPO, as low as 15 minutes. Synchronous replication offers zero RPO. Traditional replication operates at the LUN level, leading to “hitchhikers,” which are VMs that are unintentionally replicated because they share a LUN with an application that is targeted for replication, wasting overall storage capacity. ReplicateVM allows our customers to replicate only the intended VMs. ReplicateVM also allows each VM to have a unique replication policy, and customers can set standard policies for VMs that are preserved even when they migrate between VMstores. In addition, by operating at the VM level and offering compression and deduplication of data, ReplicateVM reduces WAN bandwidth and other data transfer requirements.
SyncVM: Copy Data Management
We allow the flexible use of fast and storage-efficient VM snapshots. Storage administration teams can recover point-in-time snapshots of individual VMs and rapidly restore files based on those snapshots. Application development teams can update multiple child-clones of applications from a master application image, reducing time required to set up a new application environment. We also offer advanced snapshot management for copy data management, allowing flexible point-in-time recovery for applications, file level restore from snaps and update of child applications from a master application snapshot for testing and development, or test/dev, and DevOps use cases.
SecureVM: Encryption of data-at-rest
We offer built-in encryption for data-at-rest, and support manual key rotation and SafeNet enterprise key management (a separate product sold by a third-party vendor). With SecureVM, the encryption key can be rotated by the customer, assuring that data on physical drives is unrecoverable if a key or physical drive is compromised. This capability allows many of our customers in finance, health care, government and other industries to meet data protection and regulatory requirements.
Tintri Cloud Connector
Tintri Cloud Connector allows customers to use either public cloud storage such as Amazon S3 or an on-premises object storage such as IBM Cloud Object Storage (formerly CleverSafe) for storing snapshots to extend retention periods and provide another tier of data protection and locality.
Tintri Software Suite
This suite includes Tintri Global Center Advanced (delivering Tintri VM Scale-out software), ReplicateVM, SyncVM, SecureVM, Tintri Cloud Connector, plus all the tool kits and plug-ins to a diverse set of third-party ecosystems including VMware, Microsoft, RedHat and OpenStack. It also includes Tintri API support for PowerShell, Python and REST API.
5
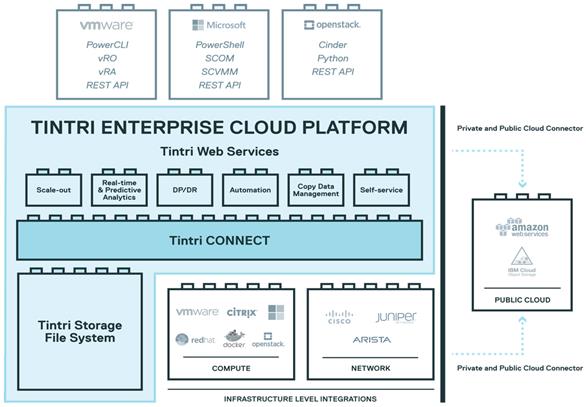
Our ecosystem partners and integration points extend the value of the Tintri platform for our customers, and include:
|
|
• |
VMware. Our products include support for vSphere, Horizon with View, PowerCLI, vRealize Orchestrator, vRealize Operations, vRealize Automation, vCloud Director and vSphere Integrated Containers, and deep integration with many other VMware solutions; |
|
|
• |
Microsoft. Our products include support for Hyper-V, System Center Virtual Machine Manager (SCVMM), System Center Operations Manager (SCOM), PowerShell, Microsoft Applications (Exchange, SQL Server, SharePoint, etc.) and Server Message Block 3 (SMB3); |
|
|
• |
Red Hat. Our products include support for Red Hat OpenStack and Red Hat Virtualization; |
|
|
• |
Citrix. Our products include support for XenDesktop, Unidesk and XenServer; |
|
|
• |
Cisco. Our products include support for UCS Director; and |
|
|
• |
OpenStack. Our products include support for commercial OpenStack distributions as well as open-source OpenStack beginning with the “Liberty” release. |
Other ecosystem partners include Brocade, Cohesity, Commvault, Docker, IBM, Mirantis, Rubrik, and Veeam. Scripting support includes PowerShell, PowerCLI, Python SDK and APIs.
Tintri Storage Systems
We market a range of enterprise-grade storage systems, including our Tintri EC6000 all-flash systems, our T800 hybrid-flash systems, and our T1000 all-flash system.
6
Our customers include leading enterprises across a broad range of industry segments, including education, financial services and insurance, healthcare, manufacturing and automotive technology, as well as cloud service providers (CSPs). As of January 31, 2018, our customer base consisted of more than 1,500 customers, including 7 of the top 15 Fortune 100 companies and 21 of the Fortune 100 companies.
Customer Use Cases
Our customers use our enterprise cloud platform for a variety of workloads and use cases.
Enterprise Cloud. Tintri’s architecture and RESTful APIs allow for tight integration into a customer’s broader enterprise cloud ecosystem—including hypervisor, compute, network, cloud management software and even public cloud (via Tintri Cloud Connector). For customers, Tintri serves as a foundational element used to realize the potential of enterprise cloud agility and scale.
Virtualized Desktop Infrastructure (VDI). Since the Tintri OS uses VMs and containers as units of management, Tintri is able to isolate each virtual desktop in its own “lane”. That prevents conflict over resources and eliminates latency associated with boot storms and anti-virus scans (typical of conventional storage). Tintri’s density also allows organizations to manage up to 7,500 virtual desktops in just two rack units, using less power, cooling and other resources than other solutions.
Virtualized Servers and Databases. Tintri auto-quality of service, or QoS, capabilities allow customers to ensure that servers and databases receive the resources they need for predictable performance. And Tintri Analytics makes it possible for customers to identify the root cause of performance issues in real-time, across storage, compute and network. Predictive analytics allow customers to model the impact and resource requirements of adding server and database virtual machines to their environment.
DevOps. In most DevOps workloads, there is pressure to speed development cycles. Tintri’s RESTful APIs allow for integration into the broader DevOps stack, and automation makes it possible to spin up and tear down test environments comprised of thousands of virtual machines in minutes. This allows DevOps organizations to enable continuous testing and delivery, shortening development cycles.
Customer Support
We offer product support for all of our customers, including those customers who purchase our products through our channel partners. Customers may choose to purchase support plan upgrades, which provide them with accelerated shipment and installation of replacement parts. We also provide proactive support services that alert customers to potential product failures before they occur. Our support and services contracts are offered for periods of one to five years. We subcontract with third-party service providers to provide onsite hardware repair and replacement for our customers.
Sales and Marketing
Sales. We sell our products predominantly through joint sales efforts made in conjunction with our channel partners. Our sales organization is responsible for large-account acquisition and overall market development, which includes managing our relationships with our channel partners, working with our channel partners in acquiring and supporting customers, and acting as the liaison between our customers and our marketing and product development teams.
As of January 31, 2018, we had direct sales teams located in nine countries. Our sales representatives typically become increasingly productive over several quarters as they are trained and learn to sell our products.
Our sales organization is supported by sales enablement engineers, specialist system architects and technical marketing personnel. These personnel have deep technical expertise and responsibility for pre-sales technical support, solutions engineering for our customers and technical training for our channel partners.
7
Distribution Channel Partners. We work with channel partners who help us market and sell our products to customers. This joint sales approach provides us with the benefit of direct relationships with substantially all of our customers and expands our reach through the relationships of our channel partners. Our channel partners are further supported by our distributors, who work together on a non-exclusive basis to market our products, identify and close sales opportunities, and provide pre-sales and post-sales services to our customers.
As of January 31, 2018, we had 447 channel partners. This distributed partner community includes both national and regional partners in the Americas and partners in EMEA, Japan and APAC. To promote channel productivity, we operate a formal accreditation program for the sales and technical professionals of our channel partners. Our channel partners include Ahead, Arrow, Avnet, CarahSoft, CDW, Champion, Fujitsu, Nuvias, Promark and SHI.
Approximately 90% of our revenue in fiscal 2018 was derived from sales to our channel partners. One of our channel partners represented 26% of our revenue in fiscal 2018. Approximately 89% and 85% of our revenue in fiscal 2016 and 2017, respectively was derived from sales to our channel partners, and no single channel partner represented more than 10% of our revenue in fiscal 2016 and 2017.
Marketing. Our marketing is focused on building our brand reputation and market awareness, communicating product and service advantages, driving customer demand and generating leads for our sales force and channel partners. Our marketing team designs and implements a wide range of activities and initiatives, including social media, digital marketing, community events, partner co-marketing and integrated marketing campaigns. In addition, we manage “Tintricity Hub,” an online community of customers that share best practices, trade ideas and provide referrals. Over 50% of our advocates are active in any given month. As of January 31, 2018, there were more than 1,600 Tintricity Hub members from approximately 750 companies.
Technology Partners
As a storage and data management platform company, we work with a rich ecosystem of technology partners to deliver world-class solutions to our mutual customers. Our technology partners include software and infrastructure partners such as Brocade, Cisco, Citrix, Cohesity, Commvault, Docker, IBM, Microsoft, Mirantis, OpenStack, Red Hat, Rubrik, Veeam, and VMware. In addition, we work closely with our technology partners through co-marketing and lead-generation activities in an effort to broaden our marketing reach. We also sell our solutions under an original equipment manufacturer arrangement with Fujitsu, who distributes our solutions on a non-exclusive basis in Japan.
We have and expect to continue to work closely with many of our technology partners through joint marketing and demand generation activities in an effort to broaden our marketing reach and help us win new and retain existing customers. We also jointly validate solutions, often with the expert help of our channel partners, to deliver qualified complete solutions to our customers.
Research and Development
Our research and development efforts are focused primarily on improving existing products and developing new products. Our products integrate both software and hardware innovations, and accordingly, our research and development teams employ both software and hardware engineers in the design, development, testing, certification and support of our products. As of January 31, 2018, and before giving effect to the restructuring plan that we announced in March 2018, we employed 139 software and hardware engineers with expertise in storage and IT infrastructure. A majority of our research and development team members are based in Mountain View, California. We also design, and certify our products to ensure interoperability with a variety of third-party software, hypervisor and networking components.
We believe that innovation and timely development of new features and products is essential to meeting the needs of our customers and improving our competitive position. We plan to dedicate significant resources to our continued research and development efforts.
8
We contract with an offshore subsidiary of Flex to manufacture all of our storage products. Flex purchases components from our approved list of suppliers and builds our hardware appliances according to our specifications. The outsourcing of our hardware manufacturing extends from prototypes to full production and includes activities such as material procurement, software implementation and final assembly and testing. Once the completed products are manufactured and tested, Flex arranges the shipment of our products directly to our customers.
Our contract manufacturer generally manages the procurement of the components and parts used in our products. We also engage in direct sourcing of certain strategic components. While our preference is to select components and materials that are available from multiple sources, we utilize a number of components that are available from only one source. Generally, neither we nor our contract manufacturer have written agreements with these sole-source component providers to guarantee the supply of the key components used in our hardware products. We generally do not have long-term supply commitments from our suppliers. We generally order our components on a “build to order” basis, and do not maintain any significant inventory of the components used in our products. However, we regularly monitor the supply of components and the availability of qualified and approved alternative sources. We provide nine-month forecasts to Flex (the first three months of which are binding) so that they can purchase key components in advance of their anticipated use, with the objective of maintaining an adequate supply of those components.
Except for the binding portion of forecasts mentioned above, our manufacturing services agreement with Flex does not provide for any specific volume purchase commitments and orders are placed on a purchase order basis. We work closely with Flex to meet our product delivery requirements and to manage the manufacturing process and quality control.
Our agreement with Flex is terminable at any time by us with 90 days’ notice or by Flex with 120 days’ notice and Flex has no obligation to provide services transitioning our manufacturing processes to another manufacturer. Although the contract manufacturing services required to manufacture and assemble our products may be readily available from a number of established manufacturers, it is time consuming and costly to qualify and implement contract manufacturer relationships. As a result, if Flex or our sole-source component suppliers suffer an interruption in their businesses, or experience delays, disruptions or quality control problems in their manufacturing operations, or we have to change or add additional contract manufacturers or suppliers of our sole-sourced components, our ability to ship our products to our customers could be delayed, and our business, operating results and financial condition could be adversely affected.
Competition
We operate in the intensely competitive IT infrastructure market that is characterized by constant change and innovation. Changes in application requirements, IT infrastructure trends and the broader technology landscape result in evolving customer requirements for architecture, performance, manageability and scalability, and organizations may require new features from enterprise cloud platforms and storage systems. Our main competitors fall into two categories:
|
|
• |
large IT infrastructure vendors consisting primarily of Dell EMC and NetApp, and also Hitachi Data Systems, HP Enterprise, IBM and VMware who each offer a broad range of storage systems targeting various use cases and end markets; and |
|
|
• |
smaller specialized IT infrastructure companies, including companies that offer solutions powered entirely or partially by flash memory technology, such as Nimble Storage, a Hewlett Packard Enterprise company, Nutanix and Pure Storage. |
As our market grows, we expect that the market will attract new startups and more highly specialized vendors, as well as larger vendors that may continue to acquire or bundle their products more effectively.
9
We believe the principal competitive factors in the storage market are as follows:
|
|
• |
product features, enhancements and capabilities, including ease of use, performance, manageability, reliability and ability to store and process physical and/or virtualized workloads; |
|
|
• |
business impact, including application time to market and rapid scalability; |
|
|
• |
product economics and value to customer, including cost of acquisition (capital expenses) and ongoing management and maintenance costs (operating expenses); |
|
|
• |
customer experience, from marketing and pre-sales through sales engagement, purchase and shipment, support and customer community; |
|
|
• |
product interoperability with broader third-party ecosystem, including hypervisor, cloud and networking vendors; and |
|
|
• |
global sales and distribution capability. |
We believe we compete favorably with our competitors on the basis of these factors. Our competitive strengths include the simplicity and performance of our advanced stand-alone software products packaged within enterprise-grade hardware, which leads to operating efficiencies and an improved customer experience; our high-quality, referenceable customer base; and our open architecture and ecosystem integration, which provides greater flexibility to operate a variety of storage platforms, form factors and hypervisors.
Intellectual Property
Our success depends in part upon our ability to protect our core technology and intellectual property. To establish and protect our technology, intellectual property and proprietary rights, we rely on a combination of intellectual property rights, including patent, copyright, service mark, trademark and trade secret laws, as well as confidentiality procedures and contractual restrictions.
As of January 31, 2018, we had eleven issued patents and 56 pending patent applications in the United States and internationally. Our issued patents have expiration dates ranging from 2030 to 2035.
We generally control access to and use of our proprietary hardware, software and other confidential information through the use of internal and external controls, including contractual protections with employees, contractors, customers and partners, and our software is protected by U.S. and international copyright laws.
The steps we have taken to protect our core technology, intellectual property and intellectual property rights may not be adequate. Any of our issued patents or trademarks or other intellectual property rights may be challenged, invalidated or circumvented, and we may not be able to prevent third parties from infringing them. Despite our efforts to protect our trade secrets and other technology and intellectual property through intellectual property rights, licenses, and confidentiality agreements, unauthorized parties may still copy or otherwise obtain and use our technology and intellectual property, including our software. In addition, we intend to expand our international operations, and effective patent, copyright, trademark, and trade secret protection may not be available or may be limited in foreign countries.
The IT infrastructure industry is characterized by the existence of a large number of patents, trademarks, copyrights and other intellectual property rights, and by frequent litigation based on allegations of infringement or other misappropriation of intellectual property rights. From time to time, third parties, including our competitors and non-practicing entities, have claimed and may in the future claim that our products or technologies may infringe their intellectual property rights and may assert patent, copyright, trade secret and other claims based on intellectual property rights against us and our customers, suppliers and channel partners. We cannot assure you that our products, services or business do not infringe or misappropriate such rights of such third-party claimants. Although we generally attempt to limit our liability to indemnify third parties against intellectual property infringement claims, we are party to a number of agreements pursuant to which we are obligated to indemnify certain third parties. We expect that intellectual property rights infringement or misappropriation claims may increase as the number of products and competitors in our market increase. In addition, to the extent that we gain greater visibility
10
and market exposure as a public company, we face a higher risk of being the subject of intellectual property rights infringement or misappropriation claims from third parties. Any third-party intellectual property rights claims against us could significantly increase our expenses and could have a significant and negative impact on our business, operating results and financial condition. See “Risk Factors” for additional information.
Employees
We believe that the expertise of our people and our corporate culture are important to our success as a technology leader. As of January 31, 2018, we had 445 employees in the United States and internationally, of which 277 employees were based in our corporate headquarters in Mountain View, California. None of our employees are represented by a labor organization or are a party to any collective bargaining agreement. We consider our relationship with our employees to be good.
In March 2018, the Board approved a restructuring and reduction in force plan of approximately 20% of our global workforce. We expect to substantially complete the restructuring in our first quarter of fiscal 2019, which ended on April 30, 2018. We believe that further such reductions are likely to be required in the near term dependent on developments in our financial condition.
Our typical fulfillment time on an order is approximately three days, and consequently we do not have a meaningful backlog at any point in time.
We typically accept and ship orders within a short time frame. In general, customers may cancel or reschedule orders without penalty, and delivery schedules requested by customers in their purchase orders vary based upon each customer’s particular needs. As a result, we do not believe that our backlog at any particular time is a reliable indicator of future revenue.
Seasonality
In general, our sales are subject to seasonal trends. Our fourth fiscal quarter, ending January 31, typically has the highest revenue of any of our fiscal quarters, and our first fiscal quarter, ending April 30, typically has the lowest revenue of any of our fiscal quarters. We believe that this seasonality results from a number of factors, including the budgeting, procurement and deployment cycles of many of our customers. Our rapid historical growth may have reduced the impact of seasonal or cyclical factors that might have influenced our business to date. To the extent our revenue growth slows, seasonal or cyclical variations in our operations may become more pronounced and may affect our business, operating results and financial condition.
Corporate Information
We were incorporated in Delaware in June 2008. Our principal executive offices are located at 303 Ravendale Drive, Mountain View, California 94043. Our telephone number at that location is (650) 810-8200. Our website address is www.tintri.com. Information on our website is not part of this report and should not be relied upon in determining whether to make an investment decision.
The Tintri design logo and the marks “Tintri,” “VMstore,” “Tintri OS,” “Tintri Global Center,” “ReplicateVM,” “SecureVM,” “SyncVM” and “VM Scale-out” are the property of Tintri. This Annual Report on Form 10-K contains additional trade names, trademarks and service marks of other companies. We do not intend our use or display of other companies’ trade names, trademarks or service marks to imply a relationship with, or endorsement or sponsorship of us by, these other companies.
Available Information
Our Annual Report on Form 10-K, Quarterly Reports on Form 10-Q, Current Reports on Form 8-K, and amendments to reports filed pursuant to Sections 13(a) and 15(d) of the Securities Exchange Act of 1934, as
11
amended (the Exchange Act), are filed with the Securities and Exchange Commission (the SEC). We are subject to the informational requirements of the Exchange Act and file or furnish reports, proxy statements and other information with the SEC. Such reports and other information filed by the Company with the SEC are available free of charge on the Company’s website at ir.tintri.com as soon as reasonably practicable after they have been electronically filed with, or furnished to, the SEC.
You may obtain copies of this information by mail from the Public Reference Section of the SEC, 100 F Street, N.E., Room 1580, Washington, D.C. 20549, at prescribed rates. You may obtain information on the operation of the public reference rooms by calling the SEC at 1-800-SEC-0330. The SEC also maintains an Internet website that contains reports, proxy statements and other information about issuers, like us, that file electronically with the SEC. The address of that website is www.sec.gov.
The information contained on the websites referenced in this Form 10-K is not incorporated by reference into this filing. Further, the Company’s references to website URLs are intended to be inactive textual references only.
Investing in our common stock involves a high degree of risk. You should carefully consider the risks and uncertainties described below, together with all of the other information contained in this Annual Report on Form 10-K, including our consolidated financial statements and the related notes thereto, before making a decision to invest in our common stock. The risks and uncertainties described below are not the only ones we face. Additional risks and uncertainties that we are unaware of, or that we currently believe are not material, may also become important factors that affect us. If any of the following risks occur, our business, financial condition, operating results and prospects could be materially and adversely affected. In that event, the price of our common stock could decline, and you could lose part or all of your investment.
Risks Related to Our Financial Condition
We have limited working capital and a history of losses that raise substantial doubts as to whether we will be able to continue as a going concern.
We have prepared our consolidated financial statements and the entirety of this Annual Report on Form 10-K on the basis that we would continue as a going concern, which contemplates the realization of assets and the satisfaction of liabilities in the normal course of business. However, we have incurred losses in each fiscal year since our inception and there is substantial doubt about our ability to continue as a going concern. The Report of Independent Registered Public Accounting Firm issued by KPMG LLP, or KPMG, with respect to the accompanying financial statements includes an explanatory note concerning our ability to continue as a going concern. We do not currently have any borrowing capacity available under our credit facility with TriplePoint Capital LLC, or TriplePoint, or our revolving line of credit with Silicon Valley Bank, or SVB. If we are unable to generate positive cash flows from operations or if we have insufficient liquidity to meet our obligations, we may have to seek additional capital, restructure or refinance our indebtedness, undertake additional restructuring plans, reduce or delay capital expenditures, file for bankruptcy protection, wind down our or sell our business or sell certain of our assets or operations.
We need to raise additional financing to continue our operations and to remain in compliance with financial covenants under our credit facilities.
Since the amendment to the terms of our credit agreements with our lenders, we have revised our forecasts of our cash flows and liquidity position for forward periods, casting additional doubt around our ability to meet our debt covenants. There can be no assurance that our lenders will not seek to demand immediate payment of amounts due under the relevant agreements as a result of the revisions to our forecasts. Based on our current forecasts, we will likely fail to satisfy the minimum liquidity covenants of our credit facilities as early as the end of May 2018, which would constitute an event of default under those facilities and enable our lenders to demand immediate payment of all amounts due under those facilities. Therefore, we will need to raise additional debt or equity financing in the immediate term in order to continue our operations and to remain in compliance with the financial covenants under our credit facilities or to obtain relief from our lenders. Our inability to satisfy the minimum liquidity covenants of our credit facilities would constitute an event of default under those facilities and enable our lenders to demand immediate payment of all amounts due under those facilities. We do not currently have the
12
ability to repay these amounts. Further, regardless of whether these amounts become immediately due and payable, we likely do not have sufficient liquidity to continue our operations beyond June 30, 2018.
Our management team’s efforts to secure additional financing may divert their attention from our day-to-day activities, which may adversely affect our ability to sell and market our products or to develop new and enhanced solutions. Our existing and any future debt holders would have rights senior to common stockholders to make claims on our assets, and the terms of any debt could restrict our operations, including our ability to pay dividends on our common stock. Furthermore, if we issue additional equity securities, stockholders will experience dilution, and the new equity securities could have rights senior to those of our common stock. Because our decision to issue securities in any future offering will depend on market conditions and other factors beyond our control, we cannot predict or estimate the amount, timing or nature of our future offerings. As a result, our stockholders bear the risk of any future securities offerings by us reducing the market price of our common stock and diluting their interest. In the meantime, the prospect that we may have to cease or significantly curtail our operations will adversely impact our sales, operations, ability to retain employees and other aspects of our business. We are currently actively seeking additional sources of financing and considering various alternatives for the company including the potential sale of the company, but cannot assure you that we will be able to obtain such financing on acceptable terms, if at all, or sell the company at a price that will provide any meaningful proceeds to our stockholders, if at all. If we cannot raise additional financing we will need to reduce or curtail our operations and may need to wind down the company, potentially through bankruptcy. In the event of a bankruptcy, common stockholders are unlikely to receive any recovery of their interest in the company.
We will likely not be able to generate sufficient cash to service our indebtedness.
Our ability to make scheduled payments or to refinance our debt obligations to TriplePoint and SVB depends on numerous factors, including the amount of our cash reserves and our actual and projected financial and operating performance. These amounts and our performance are subject to certain financial and business factors, as well as prevailing economic and competitive conditions, some of which may be beyond our control. We cannot assure you that we will maintain a level of cash reserves or cash flows from operating activities sufficient to permit us to pay the principal, interest, and other fees on our existing or future indebtedness. If our cash flows and capital resources are insufficient to fund our debt service obligations, we may have to seek additional capital, restructure or refinance our indebtedness, undertake additional restructuring plans, reduce or delay capital expenditures, file for bankruptcy protection, wind down our business, or sell our business or our certain of our assets or operations. We cannot assure you which course or courses we will pursue, whether we will be able to take certain of these actions, or whether these actions will enable us to meet our scheduled debt service obligations. In addition, in the event of our breach of revolving line of credit with SVB or our credit facility with TriplePoint, we may be required to repay any outstanding amounts earlier than anticipated, and the lenders may foreclose on their security interest in our assets. Any failure to satisfy our commitments under our indebtedness could cause our business, operating results and financial condition to be materially adversely affected.
We have a history of losses and may not be able to achieve or maintain profitability.
We have incurred losses in all fiscal years since our inception, and we expect that we will continue to incur net losses for the foreseeable future. We experienced net losses of $101.0 million, $105.8 million, and $157.7 million in fiscal 2016, 2017, and 2018, respectively. As of January 31, 2018, we had an accumulated deficit of $476.6 million. While currently uncertain, if we were to continue to grow, it is possible our operating expenses could increase over time, particularly in the medium to long term, for example in the event we were to hire additional employees, develop our technology and enhance our product and service offerings, expand our sales and marketing teams, make investments in our distribution channels and expand our operations. These efforts may prove more expensive than we currently anticipate, and we may not succeed in increasing our revenue sufficiently to offset higher expenses, or at all. Revenue growth is likely to continue to slow or may decline for a number of possible reasons, including slowing demand for our products or services, concerns of existing and potential customers and suppliers regarding our financial condition, increasing competition, a decrease in the growth of our overall market or a failure to capitalize on growth opportunities. Furthermore, it is likely we will be unable to generate or obtain sufficient cash from operations or other sources to adequately fund our business plan, which would negatively impact our revenue levels. As a result, and because of the numerous risks and uncertainties facing us, it is difficult to predict the extent of any future losses or the time required to achieve profitability, if at all. Any failure to become and remain profitable may require us to undertake a review of the potential business alternatives discussed above.
13
We have incurred indebtedness, which could adversely affect our ability to adjust our business to respond to competitive pressures and to obtain sufficient funds to satisfy our future research and development needs, to protect and enforce our intellectual property and to meet other needs.
We have entered into a revolving line of credit with Silicon Valley Bank, or SVB, and a $50.0 million credit facility with TriplePoint Capital LLC, or TriplePoint. These facilities are secured by substantially all of our assets and intellectual property rights. As of January 31, 2018, we had $19.0 million of principal indebtedness outstanding under the SVB line of credit and $50.0 million under the TriplePoint credit facility. These facilities contain various covenants and specify various events of default, including a “cross default” provision that provides that, if there is an event of default that has not been cured or waived within any applicable grace period under one lender’s debt facility, there is an event of default under the other lender’s debt facility, upon which, at each lender’s option, all amounts outstanding under each lender’s applicable facility would become immediately due and payable and further advances under the facility would not be available to us.
In April 2018, we entered into agreements with each of SVB and TriplePoint to amend the terms of our credit agreements with these lenders. After giving effect to this amendment with SVB, our agreement with SVB allows us to borrow, through May 2, 2019, up to $12.5 million dependent upon our qualifying monthly accounts receivables balances. Our revolving line of credit with SVB contains certain financial covenants, including a covenant that we achieve total revenues of at least $20.5 million, $23.4 million, $26.3 million and $29.4 million for our fiscal quarters ending April 30, 2018, July 31, 2018, October 31, 2018 and January 31, 2019, respectively, and a covenant that we maintain a minimum level of cash and availability under the SVB line of credit of at least $15.0 million through July 31, 2018 and at least $10.0 million thereafter. After giving effect to this amendment with TriplePoint, $50.0 million of borrowings under the TriplePoint credit facility will become due in August 2019. However, we may extend the maturity date of $25.0 million of such indebtedness to February 2021, subject to certain conditions, including us making equal monthly amortizing payments of principal and interest through the extended maturity date.
If we were to fail to comply with any of the financial or other covenants contained in our agreements with SVB or TriplePoint and either lender chose to declare an event of default, the debt outstanding under the relevant agreements would become immediately due and payable. We do not at present, and may not in the future, have sufficient liquidity to repay amounts outstanding under its debt facilities should they become immediately due and payable. Moreover, any required repayment of our existing indebtedness as a result of an event of default would reduce our cash on hand such that we would not have those funds available for use in our business, which could have a material adverse effect on our business, operating results and financial condition. Based on our assessment, it is probable that we will be unable to comply with our financial covenants through May 17, 2019, and we will likely fail to comply with our minimum liquidity covenants as early as May 31, 2018. Although we are seeking to raise additional debt or equity financing in order to remain in compliance with the financial covenants under our credit facilities, we may be unable to do so. As a result, we are currently undertaking a review of the potential business alternatives in addition to seeking additional capital, which may include restructuring or refinancing our indebtedness, undertaking additional restructuring plans, reducing or delaying capital expenditures, filing for bankruptcy protection, winding down our business, or selling our business or certain of our assets or operations.
In March 2018, we entered into a Waiver and Tenth Amendment to Loan and Security Agreement, or the Tenth Amendment, with SVB, pursuant to which the parties agreed to certain amendments and modifications to our line of credit with SVB. The Tenth Amendment provides that the interest rate on amounts outstanding under the revolving line of credit with SVB shall be equal to the prime rate plus 1.85% per annum through March 31, 2018, after which the interest rate returns to the prime rate plus 0.35% when we are borrowing base eligible and the prime rate plus 1.75% at all other times, and for the waiver by SVB with respect to certain prior breaches of financial covenants and related defaults, in each case subject to the terms and conditions set forth in the Tenth Amendment.
In May 2017, we entered into a Note Purchase Agreement with certain of our preferred stockholders pursuant to which such stockholders agreed to purchase from us, at our election, one or more subordinated convertible promissory notes, or Notes, having an aggregate maximum principal amount of $25.0 million. In June 2017, we entered into an amendment to the Note Purchase Agreement. As of January 31, 2018, no Notes were issued and sold under the Note Purchase Agreement. In February and March 2018, we issued an aggregate of $25.0 million of convertible promissory notes under the Note Purchase Agreement. The notes bear interest at the rate of 8% per annum and mature in August 2019.
14
We have a limited operating history, which makes our future operating results difficult to predict and exposes our business to a number of risks and uncertainties.
We were founded in June 2008 and began selling our solution and generating revenue in 2011. We have a limited operating history in an industry characterized by rapid technological change, changing customer needs, intense competition, evolving industry standards and frequent introductions of new products and services. Our limited operating history makes it difficult to evaluate our current business and our future prospects, including our ability to plan for and model future growth. All of these factors, as well as the other risks described in this Annual Report on Form 10-K, make our future operating results difficult to predict, which may impair our ability to manage our business and reduce your ability to assess our prospects.
We have encountered, and will continue to encounter, risks and uncertainties frequently experienced by growing companies in rapidly changing industries. Our limited operating history makes it more difficult for us to predict these risks and uncertainties. If our assumptions regarding these risks and uncertainties (which we use to plan our business) are incorrect or change, or if we do not address these risks and uncertainties successfully, our operating and financial results could differ from our expectations, and our business and prospects could suffer.
Our historic revenue growth rates may not be indicative of our future performance and have declined significantly in recent periods.
We experienced significant growth in prior periods. Revenue increased from $86.0 million in fiscal 2016 to $125.1 million in fiscal 2017, representing period-over-period growth of 45%. Revenue increased from $125.1 million in fiscal 2017 to $125.9 million in fiscal 2018, representing period-over-period growth of 1% and a significant reduction in our growth-rate compared to prior periods. Revenue increased $14.8 million in the first half of fiscal 2018 compared to the first half of fiscal 2017, which was offset by a $14.0 million decrease in revenue in the second half of fiscal 2018 compared to the second half of fiscal 2017. If we are able to achieve greater revenue scale, we may not be able to maintain revenue growth rates consistent with historical growth rates. You should not rely on our revenue for any prior quarterly or annual periods as any indication of our revenue or revenue growth for any future period.
Our operating results may fluctuate significantly on a quarterly basis, which could make our future results difficult to predict and could cause our operating results to fall below expectations.
Our operating results may fluctuate on a quarterly basis due to a variety of factors, many of which are outside of our control. As a result, comparing our operating results on a period-to-period basis may not be meaningful. If our revenue or operating results in any particular period fall below investor expectations, the price of our common stock would likely decline. Factors that are difficult to predict and that could cause our quarterly operating results to fluctuate include:
|
|
• |
the timing and magnitude of orders and shipments of our products in any quarter; |
|
|
• |
our ability to attract new and retain existing customers; |
|
|
• |
our ability to increase and maintain sales coverage and effectiveness, including to retain and attract sales, marketing, engineering and other employees; |
|
|
• |
changes in our executive management team, sales organization and other business units; |
|
|
• |
the impact of recent changes in our executive management team and restructuring actions on our business; |
|
|
• |
our ability to comply with the financial covenants and other terms contained in our credit agreements; |
|
|
• |
our ability to sell additional products to our existing customers; |
|
|
• |
disruptions in our sales channels or termination of our relationship with important distributors, channel partners, OEMs, contract manufacturers and suppliers; |
|
|
• |
our seasonal sales cycles; |
|
|
• |
reductions in customers’ budgets for information technology purchases; |
15
|
|
• |
the mix of solutions sold and the mix between product revenue and support and maintenance revenue; |
|
|
• |
the timing of introductions of plans of new products and our ability to manufacture and sell new products; |
|
|
• |
the amount and timing of expenses to grow our business; |
|
|
• |
the timing of revenue recognition for our sales; |
|
|
• |
regulatory, tax, accounting and other changes in requirements or policies applicable to us; |
|
|
• |
volatility in our share price, which may lead to higher stock-based compensation expense; and |
|
|
• |
general socioeconomic and political conditions in the countries where we operate or where our solution is sold or used. |
Any one of the factors above or the cumulative effect of the factors above may result in significant fluctuations in our operating results from period to period. This variability and unpredictability could result in our failure to meet our internal operating plan or the expectations of securities analysts or investors for any period. If we fail to meet such expectations, the market price of our common stock could decline and we could face costly lawsuits, including securities class action litigation.
Risks Related to Our Business
Our growth depends in part on our ability to attract new customers and sell additional solutions and renewals to existing customers.
Our future success depends in part on our ability to increase sales of our solution to new customers domestically and internationally, as well as to increase sales of additional solutions and renewals to our existing customers. The rate at which new and existing customers purchase solutions depends on a number of factors, including customers’ perceived need for enterprise cloud infrastructure solutions, general economic conditions, our ability to compete effectively with our competitors, spending levels on IT infrastructure solutions and other factors outside of our control. We may also be forced to engage in sophisticated and costly sales efforts, which may not result in additional sales.
Furthermore, the rate at which our customers purchase enterprise cloud infrastructure solutions may be impacted by customers’ concerns about the ongoing viability of our business. Following our IPO during fiscal 2018, we observed that some customers reduced or delayed purchases of our systems due to concerns about our financial condition and prospects.
The Report of Independent Registered Public Accounting Firm issued by KPMG with respect to the accompanying financial statements includes an explanatory note concerning our ability to continue as a going concern, which we believe could create further concerns among our customers and suppliers and potential customers or suppliers concerning our financial condition and prospects, and could impact future order rates and levels.
We provide our support services under limited term contracts, which range from one to five years. Our customer renewal rate may decline or fluctuate as a result of a number of factors, including our customers’ level of satisfaction with our solution, our customer support and increased competition and the pricing of our, or competing, services. Even if our customers choose to renew their support contracts, they may renew for shorter contract periods or on other terms that are less beneficial to us. We have limited historical data with respect to rates of customer renewals, so we may not accurately predict future renewal trends.
We cannot ensure that our customers will purchase our solution or will renew their support contracts, and their failure to make such purchases or renewals may adversely affect our business, operating results and financial condition.
16
We face intense competition from numerous established companies and new entrants.
We face intense competition from numerous established companies that sell competitive enterprise cloud infrastructure systems or storage solutions. These competitors include large system vendors, consisting primarily of Dell EMC and NetApp, and also Hitachi Data Systems, HP Enterprise, IBM and VMware, which each offer a broad range of data center systems targeting various use cases and end markets. We also face competition from other companies, including companies that offer solutions powered entirely or partially by flash memory technology, such as Nimble Storage, a Hewlett Packard Enterprise company, Nutanix and Pure Storage. These competitors, as well as other potential competitors, when compared to us may have:
|
|
• |
greater name recognition and longer operating histories; |
|
|
• |
larger sales and marketing and customer support budgets and resources; |
|
|
• |
the ability to bundle enterprise cloud infrastructure systems or storage solutions with other products and services to address customers’ needs; |
|
|
• |
more comprehensive enterprise cloud infrastructure systems or storage solutions; |
|
|
• |
greater resources to make acquisitions and develop new solutions; |
|
|
• |
infrastructure solutions that are, or that are perceived to be, simpler and faster to deploy, or able to store and process data more effectively; |
|
|
• |
infrastructure solutions that store and process both physical and virtualized workloads; |
|
|
• |
larger and more mature intellectual property portfolios; and |
|
|
• |
substantially greater financial, technical and other resources. |
Furthermore, many of our competitors benefit from established brand awareness and long-standing relationships with key decision makers at many of our current and prospective customers. We expect that our competitors will seek to leverage these existing relationships to discourage customers from purchasing our solution. If we are unsuccessful in establishing or maintaining relationships with customers, or if customers are reluctant or unwilling to try our solution, our ability to compete in the marketplace or to grow our revenue could be impaired.
Our competitors utilize a broad range of competitive strategies. For example, some of our competitors have offered bundled products and services in order to reduce the initial cost of their storage solutions, or seek to exploit concerns of existing and potential customers regarding our financial condition. Our competitors may also compete on purchase price and total cost of ownership, and may choose to adopt more aggressive pricing policies than we choose to adopt in the future.
Certain of our competitors may have developed, claim to have developed or have indicated that they intend to develop enterprise cloud technologies that may compete with our solution. We expect our competitors to continue to improve the performance of their solutions, reduce their prices and introduce new services and technologies that may, or that they may claim to, offer greater performance and improved total cost of ownership as compared to our solution. These and other competitive pressures may prevent us from competing successfully against current or future competitors. If we are unable to acquire customers, or if we are forced to reduce prices in order to do so, our business, operating results and financial condition may be adversely affected.
If the enterprise cloud market does not evolve as we anticipate or our target customers do not adopt our solution or lose confidence in our company, we may not be able to compete effectively, and our ability to generate revenue will suffer.
We compete in the new enterprise cloud category with our Tintri VMstore solutions, and the market for enterprise cloud solutions is still in an early stage. Our success depends upon our ability to provide enterprise cloud infrastructure solutions that address the needs of customers more effectively and economically than those of other competitors or existing technologies. Many of our target customers have never purchased enterprise cloud infrastructure solutions and may not have the desire or available budget to invest in new technologies such as ours or the confidence in our financial conditions and prospects to make investments in our products, particularly large or
17
long-term investments. Following our initial public offering, or IPO, during fiscal 2018, we observed that some customers reduced or delayed purchases of our systems due to concerns about our financial condition and prospects. Market awareness of our value proposition will be essential to our growth and our success, particularly for the enterprise and CSP markets. It is difficult to predict with any precision customer adoption rates, customer demand for our solution or the future growth rate and size of our market.
Changes or advances in alternative technologies or adoption of alternative enterprise cloud infrastructure offerings could adversely affect the demand for our solution. If the enterprise cloud infrastructure market does not develop in the way we anticipate, if our solution does not offer benefits compared to competing solutions or if customers do not recognize the benefits that our solution provides, then our business, operating results and financial condition could be adversely affected.
If we are unable to attract and retain qualified personnel, our business and operating results could suffer.
Our future success also depends on our ability to continue to attract, integrate and retain highly skilled personnel, especially skilled sales and engineering employees. Competition for highly skilled personnel is frequently intense, especially in the San Francisco Bay Area where we are headquartered. We compete with many larger and better funded organizations both inside and outside of the storage industry for skilled personnel, and we may be unable to compete with the compensation and other benefits that these organizations offer to attract candidates and retain existing personnel.
We have recently undertaken substantial reductions in our workforce, which may significantly affect our ability to retain our remaining employees or to attract new employees. See “Our recent restructuring actions could adversely affect sales or products and services and other business operations” below.
Volatility or declines in our stock price may also affect our ability to attract and retain key employees. Also, many of our employees have become, or will soon become, vested in a substantial amount of equity awards which may, in some cases, equate to a substantial amount of personal wealth. In addition, certain of our employees hold options to purchase shares of our common stock with exercise prices in excess of recent trading price of our common stock on the Nasdaq Stock Market, which may lessen the incentive these stock options represent for these employees to remain in our employment. These circumstances may make it more difficult for us to retain and motivate these employees. Conversely, recent declines in the trading price of our common stock on the Nasdaq Stock Market could reduce, or be perceived by employees to reduce, the value of their outstanding equity awards, which could affect their decision about whether or not they continue to work for us. We have experienced some of these effects since the completion of our IPO, in July 2017, and may continue to see similar recruitment and retention challenges in the future. In the future, we expect to implement employee retention programs from time to time, including through the grant of additional equity awards to existing employees, or the exchange or amendment to the terms of existing employee equity awards. Such programs may not be effective in improving employee retention and may be dilutive to our existing equity holders.
In March 2018, we announced that Ken Klein will transition from his role as our Chief Executive Officer and Ian Halifax will transition from his role as our Chief Financial Officer. In March 2018, we also announced that the Board had named Tom Barton as Chief Executive Officer and as a Board member. Mr. Barton subsequently joined the Company, and Mr. Klein and Mr. Halifax left the Company in April 2018. On May 15, 2018, we also appointed Tom Barton as interim Chief Financial Officer. We may experience increased employee turnover as a result of these and other changes in our management team. We cannot assure you that we will be able to successfully attract or retain qualified personnel. Any failure to successfully attract, integrate or retain qualified personnel to fulfill our current or future needs may negatively impact our growth and adversely affect our business, operating results and financial condition.
Our recent restructuring actions could adversely affect sales of products and services and other business operations.
We have recently undertaken substantial reductions in our workforce in an effort to drive efficiencies in our sales organization and other business units. In September 2017, we announced a restructuring and reduction in force plan of a little more than 10% of our global workforce. In March 2018, we announced a restructuring and reduction
18
in force plan of approximately 20% of our global workforce. These reductions have impacted all of our business units, including our sales and engineering functions. The reduction in the size of our sales team and related support functions may impact our ability to maintain and grow our product sales and to adequately support our post-sales commitments. If we are unable to achieve correspondingly greater efficiency from our sales and related support teams, our bookings may fail to achieve historic growth rates or may decline. In addition, reductions in our engineering and product development teams could negatively impact our ability to generate new products or deliver our current pipeline of products on a timely basis. Furthermore, we believe that further such reductions are likely to be required in the near term dependent on developments in our financial condition. Any of these changes would adversely impact our business, operating results and financial condition.
Our process of considering strategic options could adversely affect our business, financial condition, and results of operations.
In December 2017, we announced that we were in the process of considering strategic options to deliver value to our stockholders, and had retained investment bank advisors to assist us in this process. This process could disrupt and create uncertainty concerning our business, regardless of whether the strategic process is completed, and poses other risks to our business, including:
|
|
• |
potential uncertainty in the marketplace concerning our ongoing viability as a business, which could lead current and prospective customers to purchase from other vendors or delay purchasing from us; |
|
|
• |
the possibility of disruption to our business and operations, including diversion of significant management time and resources towards the completion of the strategic process; |
|
|
• |
impairment of our ability to attract and retain key personnel; |
|
|
• |
difficulties maintaining relationships with employees, customers, suppliers and other business partners; |
|
|
• |
restrictions on our business operations and ability to explore strategic alternatives under any definitive agreement we may enter into as a result of this process; and |
|
|
• |
potential future stockholder litigation relating to the strategic process that could prevent or delay the strategic process, and the related costs. |
If any of the foregoing risks were realized, our business, financial condition and results of operations could be adversely affected.
We historically experienced rapid growth, and if we do not effectively manage any future growth or are unable to improve our systems, processes and controls, our business may be adversely affected.
We historically experienced rapid growth and increased demand for our solution, although our growth rate has reduced significantly in recent periods. Our employee headcount and number of customers have increased significantly during certain prior periods, and we intend to continue to grow our customer base in the future.
Furthermore, we have increasingly managed more complex deployments of our products and services with larger customers. The growth of our business and our offerings creates an ongoing strain on our management, operational and financial resources. To manage our growth effectively, we must continue to improve and expand our information technology and financial infrastructure, our operating and administrative systems and our ability to manage headcount, capital and processes in an efficient manner. The increased operational complexity and higher costs of international product deployments and infrastructure expansion makes managing our growth outside of the United States uniquely challenging. Our failure to scale or manage improvements in these functions, processes and controls could disrupt existing customer relationships, limit the deployments of our solution, reduce the quality of our products and services, increase our technical support costs and impair our ability to operate our business and protect our assets. Failure to manage any future growth effectively could result in increased costs and harm our business, operating results and financial condition.
19
If our third-party channel partners fail to perform, our ability to sell and distribute our solution will be limited, and our operating results will be adversely affected.
We depend on channel partners and distributors for a substantial majority of our sales. Approximately 89%, 85%, and 90% of our revenue in fiscal 2016, 2017, and 2018, respectively, was derived from sales to our channel partners and distributors. We also depend upon our channel partners to manage the customer sales process and to generate sales opportunities. To the extent our channel partners are unsuccessful in fulfilling our sales, managing the sales process or selling our solution, or we are unable to enter into arrangements with, and retain a sufficient number of high-quality, motivated partners in each of our sales regions, our ability to sell our solution will be adversely affected.
Our contracts with channel partners are typically terminable without cause by either party after an initial term of one year. Our channel partner agreements do not prohibit them from offering competitive products or services and do not contain any purchase commitments. Many of our channel partners also sell our competitors’ solutions. If our channel partners give higher priority to our competitors’ storage solutions, we may be unable to grow our revenue and our net loss could increase. Further, in order to develop and expand our channels, we must continue to scale and improve our processes and procedures that support our channel partners, including investments in systems and training, and those processes and procedures may become increasingly complex and difficult to manage. If we fail to maintain existing channel partners or develop relationships with new channel partners, our business, operating results and financial condition may be adversely affected.
Reliance on shipments at the end of the quarter could cause our revenue for the applicable period to fall below expected levels.
As a result of customer buying patterns and related sales efforts, we have historically received a substantial portion of sales orders and generated a substantial portion of revenue during the last few weeks of each fiscal quarter. If expected revenue at the end of any fiscal quarter is delayed for any reason, including any failure of anticipated sales transactions to materialize, any inability on our part to ship products prior to fiscal quarter-end to fulfill sales orders received near the end of the fiscal quarter, any failure on our part to manage inventory to meet demand, any inability on our part to release new solutions on schedule, any failure of our systems related to order review and processing and other terms that may delay the recognition of revenue or any unexpected sales cancellations, our revenue for that quarter could fall below our expectations and the estimates of analysts, which could adversely impact our business, operating results and financial condition.
The markets for enterprise cloud infrastructure systems and storage solutions are rapidly evolving and, if we fail to correctly anticipate and respond to developing industry trends, demand for our solution may decline.
The IT infrastructure and storage industries are characterized by rapidly evolving technology, customer needs and industry standards. To remain competitive, we must correctly anticipate and invest in the adoption of new and emerging technologies, and continue to innovate our solution to provide superior benefits to our customers. The process of developing or adapting our solution to new technologies is complex and uncertain, and our product development efforts may fail to successfully address our customers’ changing needs. We must commit significant resources to developing new products and product enhancements before knowing whether our investments will result in products the market will accept. If we fail to implement or respond to a technology that gains widespread market acceptance, demand for our solution may decline. Conversely, if we adopt a technology for which market demand fails to materialize, then we may incur significant development and marketing expense for which we fail to realize an adequate return. In September 2017, we announced the introduction of a new series of enterprise cloud products, and the extent of market acceptance and demand for these and other new products will affect our future financial results. In addition, one or more new technologies could be introduced that compete favorably with our products or that cause our solution to no longer be able to compete successfully.
The success of our products also depends in large part on our ability to successfully adapt our solution to emerging industry standards. The servers, network, software and other components and systems within a datacenter must comply with industry standards in order to interoperate and function efficiently together. If larger companies that are more influential in driving industry standards do not support the same standards we use, market acceptance of our solution could be adversely affected, or we may be required to spend significant time and resources duplicating efforts to adapt to different standards.
20
Our failure to successfully identify new product opportunities, develop and bring new products to market in a timely manner or respond to changing industry standards would result in a lower revenue growth rate or decreased revenue, either of which would negatively impact our business, operating results and financial condition.
If we fail to develop or introduce new or enhanced solutions on a timely basis, our ability to attract and retain customers could be impaired and our competitive position could be adversely affected.
We operate in a dynamic environment characterized by rapidly changing technologies and industry standards and technological obsolescence. We will need to continue to create valuable software and hardware solutions to be integrated with our enterprise cloud platform. To compete successfully, we must design, develop, market and sell new or enhanced solutions that provide increasingly higher levels of performance, capacity, scalability, security and reliability and meet the cost expectations of our customers. In September 2017, we announced the introduction of a new series of enterprise cloud products. The extent of market acceptance and demand for these and other new products are expected to affect our future financial results. Any failure to anticipate or develop new or enhanced solutions or technologies in a timely manner in response to technological shifts could result in decreased revenue and harm to our business, operating results and financial condition. Any new feature or application that we develop or acquire may not be introduced in a timely or cost-effective manner and may not achieve broad market acceptance. If we fail to introduce new or enhanced solutions that meet the needs of our customers or penetrate new markets in a timely fashion, we will lose market share and our business, operating results and financial condition will be adversely affected.
Our solution must interoperate with third-party hypervisors and operating systems, software applications and hardware, and if we fail to maintain the compatibility of our solution with such software and hardware, we may lose or fail to increase our market share and may experience reduced demand for our solution.
Our solution must interoperate with our customers’ existing infrastructure, specifically their hypervisors, networks, servers, and other software, which are provided by a wide variety of vendors. For example, our VMstore solutions support hypervisors marketed by Citrix, Microsoft, Open Stack, Red Hat, and VMware. When new or updated versions of these hypervisors or software applications are introduced, we must sometimes develop updated versions of our software so that our solution will interoperate properly. These efforts require capital investment and engineering resources and we may not be able to deliver or maintain interoperability quickly, cost-effectively or at all. If we fail to maintain compatibility of our solution with these infrastructure components, our customers may not be able to fully utilize our solution, and we may, among other consequences, lose or fail to increase our market share and experience reduced demand for our solution, which may harm our business, operating results and financial condition.
If we are not able to successfully increase sales of our solution to large organizations and CSPs, our operating results may suffer.
Our growth strategy is dependent in large part upon increasing sales of our solution to large organizations and CSPs. Sales to these customers involve risks that may not be present (or that are present to a lesser extent) with sales to smaller customers. These risks include:
|
|
• |
competition from companies that traditionally target larger organizations and CSPs and that may have pre-existing relationships or purchase commitments from such customers; |
|
|
• |
increased purchasing power and leverage held by large customers in negotiating contractual arrangements with us; |
|
|
• |
more stringent requirements in our support and maintenance contracts, including demand for faster support response times and penalties for any failure to meet support requirements; and |
|
|
• |
longer sales cycles and the associated risk that substantial time and resources may be spent on a potential customer that elects not to purchase our solution. |
In addition, large organizations, including government entities, typically have longer implementation cycles, require greater solutions functionality and scalability, require a broader range of services, demand that vendors take on a larger share of risks, require acceptance provisions that can lead to a delay in revenue recognition and expect
21
greater payment flexibility. If we fail to realize an expected sale from a large customer in a particular quarter or at all, our business, operating results and financial condition could be adversely affected. Following our IPO during fiscal 2018, we observed that some customers reduced or delayed purchases of our systems due to concerns about our financial condition and prospects.
Our sales cycles can be long and unpredictable, and may require considerable time and expense, which may cause our operating results to fluctuate significantly.
The timing of customer sales commitments and our recognition of revenue is difficult to predict because of the length and unpredictability of our solutions’ sales cycles. A sales cycle is the period between initial contact with a prospective customer and any sale of our solution. Our sales cycles typically range from three to six months. Customers, especially large enterprises, CSPs and government entities, often view the purchase of our solution as a significant and strategic decision and require considerable time to evaluate, test and qualify our solution prior to making a purchase decision and placing an order. During our sales cycle, we expend significant time and money on sales and marketing activities, and sometimes make investments in evaluation equipment, all of which lower our operating margins, particularly if no sale occurs.
Even if a customer decides to purchase our solution, there are many factors that affect the timing of the customer’s purchase and our recognition of revenue, including the strategic importance of a particular project to a customer, budgetary constraints and changes in their personnel. Even after a customer makes a purchase, there may be circumstances or terms relating to the purchase that delay our ability to recognize revenue from that purchase. For all of these reasons, it is difficult to predict whether a sale will be completed, the particular period in which a sale will be completed or the period in which revenue from a sale will be recognized. If our sales cycles lengthen, our revenue could be lower than expected, which would have an adverse effect on our business, operating results and financial condition.
We derive substantially all of our revenue from a single family of products, and a decline in demand for our solution would cause our revenue to grow more slowly or to decline.
Our enterprise cloud platform, which includes our proprietary Tintri OS and our stand-alone software products, accounts for all of our product revenue and will continue to comprise a significant portion of our revenue for the foreseeable future. As a result, any of the following events or developments could have a comparatively greater impact on our business than they would if we offered a broader range of solutions:
|
|
• |
the failure of our current solutions to achieve broad market acceptance; |
|
|
• |
any decline or fluctuation in demand for our current solutions, whether as a result of customer budgetary constraints, introduction of competing products or technologies or other factors; and |
|
|
• |
our inability to release enhanced versions of our current solutions, including any related software, on a timely basis. |
If the market for enterprise cloud infrastructure solutions grows more slowly than anticipated, if demand for our solution declines, or if we fail to deliver new solutions, new features, or new releases that meet customer demand, our business, operating results and financial condition will be adversely affected.
We recognize revenue from support agreements over the term of the relevant support period, and as a result downturns or upturns in sales are not immediately reflected in full in our operating results.
Support and maintenance revenue was 20%, 22%, and 28% of our revenue in fiscal 2016, 2017, and 2018, respectively. We recognize support and maintenance revenue ratably over the term of the relevant support period, which ranges from one to five years. As a result, much of the support and maintenance revenue we report each quarter is derived from support agreements that we sold in prior quarters. Consequently, a decline in new or renewed support agreements, or decreases in the relative pricing of new support agreements, in any one quarter will not be fully reflected in revenue in that quarter but will negatively affect our revenue in future quarters. Accordingly, the effect of significant downturns in sales of support and maintenance is not reflected in full in our operating results until future periods. In addition, because revenue from renewals must be recognized ratably over the applicable
22
service period, it may be difficult for us to rapidly increase our support and maintenance revenue through additional sales in any period. The percentage of our total revenue that we derive from support and maintenance agreements may vary over time if we change the relative pricing of our products or support agreements. Our revenue from support agreements as a percentage of total revenue may decline as a result of changes in the relative pricing of our products and support. Changes in the mix of our product revenue and support and maintenance revenue may adversely affect our business, operating results and the trading price of our common stock.
The sales prices of our products and services may decrease, which would reduce our gross profit and adversely impact our financial condition.
The sales prices for our products or support and maintenance services may decline for a variety of reasons, including competitive pricing pressures, a change in our mix of products and services and the introduction of competing products or services or promotional programs. Competition continues to increase in the markets in which we participate, and we expect competition to further increase in the future, which may lead to increased pricing pressures. Larger competitors with more diverse product and service offerings may reduce the price of products or services that compete with ours or may bundle them with other products and services. Our sales prices could also decline due to pricing pressure caused by several factors, including overcapacity in the worldwide supply of competitive storage solutions, increased manufacturing efficiencies and implementation of new manufacturing processes. In addition, although we price our products and services predominantly in U.S. dollars, currency fluctuations in certain countries and regions may negatively impact actual prices that partners and customers are willing to pay in those countries and regions. To the extent we introduce new solutions, we anticipate that the sales prices for our existing solutions will decrease. We cannot assure you that we will be successful in developing and introducing new offerings with enhanced functionality on a timely basis, or that our new product and services offerings, if introduced, will enable us to maintain or improve our gross margins and achieve profitability. Furthermore, future cash requirements could require us to introduce additional discounting in order to generate increased sales. Any such decline in our sales prices could adversely impact our business, operating results and financial condition.
Our ability to successfully market and sell our solution is dependent in part on the quality of our customer support, and any failure to offer high-quality technical support could harm our business.
Once our solution is deployed within our customers’ datacenters, customers depend on our support organization to resolve technical issues relating to our solution. Our ability to provide effective support is largely dependent on our ability to attract, train and retain qualified personnel, as well as to engage with qualified support partners that provide a similar level of customer support. Furthermore, as we continue to expand our international operations, our support organization will face additional challenges, including those associated with delivering support, training and documentation in languages other than English and provisioning and staffing our international customer support field offices. In addition, our sales process is highly dependent on our solution and business reputation and on recommendations from our existing customers. Any failure to maintain, or a market perception that we do not maintain, high-quality technical support, including installation, could harm our reputation and our ability to sell our solution to existing and prospective customers.
We are exposed to the credit risk of some of our channel partners, distributors and direct customers, which could result in losses and negatively impact our operating results.
Some of our channel partners, distributors and direct customers have experienced financial difficulties in the past. A channel partner, distributor or direct customer experiencing such difficulties will generally not purchase or sell as many of our systems as it may have done under normal circumstances and may cancel orders. Our typical payment terms are 30 days from invoice but payment terms may be longer in particular circumstances and markets. In addition, a channel partner, distributor or direct customer experiencing financial difficulties generally increases our exposure to uncollectible receivables. Any concentration of our accounts receivable in one or a limited number of our channel partners, distributors and direct customers may increase our credit risk with respect to those channel partners, distributors and direct customers. If any of our channel partners, distributors or direct customers that represent a significant portion of our revenue becomes insolvent or suffers deterioration in its financial or business condition and is unable to pay for our solution, our business, operating results and financial condition could be adversely affected.
23
If we do not effectively expand and train our sales force, we may be unable to increase our revenue and our business will be adversely affected.
Although we have a channel sales model, our sales representatives typically engage in direct interaction with our prospective customers. Therefore, we continue to be substantially dependent on our sales force to obtain new customers and sell additional solutions to our existing customers. As such, we have invested and expect to continue to invest substantially in our sales organization. Competition for sales personnel with the skills and technical knowledge that we require is intense and our ability to achieve significant revenue growth will depend, in large part, on our success in recruiting, training and retaining sufficient numbers of sales personnel to support our growth.
In August 2017, we announced changes to the structure of our sales organization, including the departure of our former Chief Sales Officer, and Ken Klein, our former Chief Executive Officer, assuming more direct involvement with our sales organization. In March 2018, we announced the promotion of Tom Cashman to Executive Vice President, Worldwide Sales and Alliances. In March 2018, we also announced that the Board had named Tom Barton as our new Chief Executive Officer, who began his employment in April 2018. On May 15, 2018, we also appointed Tom Barton as interim Chief Financial Officer. These changes and other changes may impact our ability to attract and retain sales personnel.
A significant percentage of our sales force is new to our company and therefore less effective than our more seasoned sales personnel. New hires require significant training and may take significant time before they achieve full productivity; we estimate based on past experience that sales team members typically do not fully ramp and are not fully productive during the first several quarters of employment with us. Our recent hires and planned hires may not become productive as quickly as we expect. Furthermore, hiring sales personnel in new countries requires additional set up and upfront costs that we may not recover if the sales personnel fail to achieve full productivity. If we are unable to hire and train sufficient numbers of effective sales personnel, or the sales personnel are not successful in obtaining new customers or increasing sales to our existing customer base, our business, operating results and financial condition will be adversely affected.
Seasonality may cause fluctuations in our revenue and operating results.
In general, our sales are subject to seasonal trends. Our fourth fiscal quarter, ending January 31, typically has the highest revenue of any of our fiscal quarters, and our first fiscal quarter, ending April 30, typically has the lowest revenue of any of our fiscal quarters. We believe that this seasonality results from a number of factors, including the budgeting, procurement and deployment cycles of many of our customers. Our rapid historical growth may have reduced the impact of seasonal or cyclical factors that might have influenced our business to date. To the extent our revenue growth slows, seasonal or cyclical variations in our operations may become more pronounced and may affect our business, operating results and financial condition.
Sales to U.S. federal, state and local governments are subject to numerous challenges and risks that may adversely impact our business.
Although sales to U.S. federal, state and local government agencies accounted for less than 10% of our revenue in fiscal 2016, 2017, and 2018, our sales to government agencies may increase in the future. Sales to such government entities are subject to a number of risks, including the following:
|
|
• |
selling to government agencies can be extensively regulated, highly competitive and time consuming, often requiring significant upfront time and expense without any assurance that such efforts will generate a sale; |
|
|
• |
government certification requirements applicable to our solution may change and in doing so restrict our ability to sell into the U.S. federal government sector until we have attained the revised certification; |
|
|
• |
government demand and payment for our products and services may be impacted by public sector budgetary cycles, changes in administration and funding authorizations, with funding reductions or delays adversely affecting public sector demand for our products and services; |
24
|
|
• |
governments routinely investigate and audit government contractors’ administrative processes, and any unfavorable audit could result in the government refusing to continue buying our solution, which would adversely impact our revenue and operating results, or result in fines, civil or criminal liability or repayment of any overcharges, if any such audit uncovers improper or illegal activities; and |
|
|
• |
government agencies may require certain products to be manufactured in the United States and other relatively high-cost manufacturing locations, which may require costly changes to our manufacturing practices or otherwise adversely affect our ability to sell these products to such agencies. |
If any of the above risks are realized, our business, operating results and financial condition may be adversely affected.
Our solution is highly technical and may contain undetected defects, which could cause data unavailability, loss or corruption that might, in turn, result in liability to our customers and harm to our reputation and business.
Our solution is highly technical and complex and is often used to store information critical to our customers’ business operations. Our solution, particularly with respect to newly introduced or redesigned products, may contain undetected errors, defects or security vulnerabilities that could result in data unavailability, loss, corruption or other harm to our customers. Some errors in our solution may only be discovered after they have been installed and used by customers. Our solution has experienced temporary outages after they have been deployed. Any outages, errors, defects or security vulnerabilities discovered in our solution after commercial release could result in a loss of revenue, injury to our reputation, a loss of customers or increased service and warranty costs, any of which could adversely affect our business and operating results. In addition, errors or failures in the solutions of third-party technology vendors may be attributed to us and may harm our reputation.
If our solution fails, we could face claims for product liability, tort or breach of warranty. Although our customers are generally required to enter into our standard “click wrap” terms of service, which includes provisions relating to warranty disclaimers and liability limitations, these terms may be difficult to enforce. Defending a lawsuit, regardless of its merit, would be costly and might divert management’s attention and adversely affect the market’s perception of us and our solution. Our business liability insurance coverage could prove inadequate with respect to a claim and future coverage may be unavailable on acceptable terms or at all. These product-related issues could result in claims against us, and negatively impact our business, operating results and financial condition.
Our international operations expose us to additional risks, and failure to manage those risks could adversely affect our business, operating results and cash flows.
We derive a significant portion of our revenue from channel partners outside the United States. Revenue generated from customers outside of the United States was 30%, 30%, and 27% of our total revenue in fiscal 2016, 2017, and 2018, respectively. We are continuing to adapt to and develop strategies to address international markets but there is no guarantee that such efforts will be successful. As of January 31, 2018, 14% of our full-time employees were located outside of the United States. We expect that our international activities will continue to grow over the foreseeable future as we continue to pursue opportunities in international markets, which will require significant management attention and financial resources. We are subject to risks associated with having significant worldwide operations, including:
|
|
• |
increased complexity and costs of managing international operations; |
|
|
• |
geopolitical and economic instability and military conflicts; |
|
|
• |
limited protection of our intellectual property and other assets; |
|
|
• |
compliance with local laws and regulations and unanticipated changes in local laws and regulations, including tax laws and regulations; |
25
|
|
• |
travel restrictions; |
|
|
• |
timing and availability of import and export licenses and other government approvals, permits and licenses, including export classification requirements; |
|
|
• |
foreign currency exchange fluctuations relating to our international operating activities; |
|
|
• |
restrictions imposed by the U.S. government on our ability to do business with certain companies or in certain countries as a result of international political conflicts; |
|
|
• |
transportation delays and other consequences of limited local infrastructure and disruptions, such as large scale outages or interruptions of service from utilities or telecommunications providers; |
|
|
• |
reliance upon third parties to provide solution support services outside of the Unites States; |
|
|
• |
difficulties in staffing international operations and increased compliance costs and potential liabilities associated with employment laws and practices outside of the United States; |
|
|
• |
increased costs and risk of loss associated with provisioning local field offices to provide solution support services; |
|
|
• |
heightened risk of terrorist acts; |
|
|
• |
local business and cultural factors that differ from our normal standards and practices; |
|
|
• |
differing employment practices and labor relations; |
|
|
• |
regional health issues and natural disasters that are endemic to regions which we operate and sell or manufacture our solution; |
|
|
• |
difficulties in enforcing contracts generally; and |
|
|
• |
work stoppages. |
As we continue to expand our business globally, our success will depend, in large part, on our ability to anticipate and effectively manage these risks. These factors and other factors could harm our ability to gain future international revenue and, consequently, impact our business, operating results and financial condition.
We rely on a single contract manufacturer to manufacture our products, and any failure to forecast demand for our products or manage our relationship with our contract manufacturer, or if that manufacturer’s business were to become impaired in the future, our ability to sell our products could be impacted.
We contract with an offshore subsidiary of Flex to manufacture all of our products. Our reliance on Flex reduces our control over the assembly process, exposing us to risks, including reduced control over quality assurance, production costs and product supply. If we fail to manage our relationship with Flex effectively, or if Flex experiences delays, disruptions, capacity constraints or quality control problems in their operations, our ability to ship products to our customers could be impaired and our competitive position and reputation could be adversely affected. In addition, any adverse change in Flex’s financial or business condition could disrupt our ability to supply quality products to our customers. If we are required to change our contract manufacturer or assume internal manufacturing operations, we may lose revenue, incur increased costs and damage our customer relationships. In addition, qualifying a new contract manufacturer and commencing production can be an expensive and lengthy process. If we experience increased demand that Flex is unable to fulfill, or if Flex is unable or unwilling to provide us with adequate supplies of high-quality products for any other reason, we could experience a delay in our order fulfillment, and our business, operating results and financial condition would be adversely affected.
Our agreement with Flex is terminable at any time by us with 90 days’ notice or by Flex with 120 days’ notice and Flex has no obligation to provide services transitioning our manufacturing processes to another manufacturer. Our agreement with Flex does not provide for any specific volume purchase commitments, though we are required to submit a nine month forecast for orders (the first three months of which are binding) and orders are placed on a purchase order basis. Furthermore, because we contract with a subsidiary of Flex, we have limited recourse to assets held by other members of the Flex group of companies in the event of manufacturing problems or other claims. If we are required to change to a new contract manufacturer, qualify an additional contract manufacturer or assume
26
internal manufacturing operations for any reason, including financial problems of our contract manufacturer, reduction of manufacturing output made available to us, or the termination of our contract, we may lose revenue, incur increased costs and damage our customer relationships.
We intend to introduce new products and product enhancements, which could require us to coordinate with Flex and component suppliers in order to achieve volume production rapidly. We may need to increase our component purchases, contract manufacturing capacity and internal test and quality functions if we experience increased demand for our products. Our orders may represent a relatively small percentage of the overall orders received by Flex from its customers. As a result, fulfilling our orders may not be considered a priority in the event Flex is constrained in its ability to fulfill all of its customer obligations in a timely manner. If Flex is unable to provide us with adequate supplies of high-quality products, or if we are, or Flex is unable to obtain adequate quantities of components, it could cause a delay in our order fulfillment, in which case our business, operating results and financial condition could be adversely affected.
We rely on a limited number of suppliers, and in some cases single-source suppliers, and any disruption or termination of these supply arrangements could delay shipments of our products and could harm our relationships with current and prospective customers.
We rely on a limited number of suppliers, and in some cases single-source suppliers, for several key hardware components of our solution. These components are generally purchased on a purchase order basis through Flex, and we generally do not have long-term supply contracts with our suppliers. For example, the chassis used in our hybrid-flash systems and our new all-flash systems are obtained on a purchase order-basis under an agreement with a single-source component supplier that has no fixed term.
Our current purchase volumes may be too low for us to be considered a priority customer by certain of our suppliers. Any of the sole-source and limited source suppliers we rely on could stop producing our components, cease operations or be acquired by, or enter into exclusive arrangements with, our competitors. Our reliance on key suppliers exposes us to risks, including:
|
|
• |
the inability to obtain an adequate supply of key components; |
|
|
• |
delays or disruptions of shipments of our products or their components; |
|
|
• |
price volatility for the components of our products; |
|
|
• |
failure of a supplier to meet our quality or production requirements; |
|
|
• |
failure of a supplier of key components to remain in business or adjust to market conditions; and |
|
|
• |
consolidation among suppliers, resulting in some suppliers exiting the industry or discontinuing the manufacture of components. |
In addition, many of our products are sourced from suppliers based outside of the United States, primarily in Asia. Uncertainty with respect to tax and trade policies, tariffs and government regulations affecting trade between the United States and other countries has recently increased. Major developments in tax policy or trade relations, such as the imposition of tariffs on imported products, could increase our product and product-related costs or require us to seek alternative suppliers, either of which could result in decreased sales or increases product and product-related costs.
As a result of these risks, we cannot assure you that we will be able to obtain enough key components in the future or that the cost of these components will not increase. We generally order our components on a “build to order” basis, and do not maintain any significant inventory of the components used in our products. The technology industry has experienced component shortages and delivery delays in the past, and we may experience shortages or delays of critical components in the future as a result of strong demand in the industry or other factors. If our supply of components is disrupted or delayed, or if we need to replace our existing suppliers, there can be no assurance that additional components will be available when required or on terms that are favorable to us, which could extend our lead times and increase the costs of our components. Switching suppliers may require that we redesign our products to accommodate new components and to re-qualify our solution, which would be costly and time-consuming.
27
Any interruption in the supply of our components may adversely affect our ability to meet scheduled product deliveries to our customers and could result in lost revenue or higher expenses, any of which would harm our business, operating results and financial condition.
Insufficient supply and inventory of our products and their components may result in lost sales opportunities or delayed revenue, while excess inventory will harm our gross margins.
Our third-party manufacturer procures components and builds our products based on our forecasts, and we generally do not hold inventory for a prolonged period of time. These forecasts are based on estimates of future demand for our products, which are in turn based on historical trends and analyses from our sales and marketing organizations, adjusted for overall market conditions. In order to reduce manufacturing lead times and plan for adequate component supply, from time to time we may issue forecasts for components and products that are non-cancelable and non-returnable. Our inventory management systems and related supply chain visibility tools may be inadequate to enable us to make accurate forecasts and effectively manage the supply of our products and components. We have, in the past, had to write off inventory in connection with transitions to new product models. If we ultimately determine that we have excess supply, we may have to reduce our prices and write down or write off excess or obsolete inventory, which in turn could result in lower gross margins. Alternatively, insufficient supply levels may lead to shortages that result in delayed revenue or loss of sales opportunities altogether as potential customers turn to competitors’ products that may be more readily available. If we are unable to effectively manage our supply and inventory, our business, operating results and financial condition could be adversely affected.
Industry consolidation may lead to increased competition, which could harm our business.
Consolidation among IT infrastructure providers has been common. Some of our competitors have made acquisitions or entered into partnerships or other strategic relationships to offer a more comprehensive solution than they had offered individually. For example, in February 2016, NetApp acquired SolidFire, a developer of all-flash storage systems, in September 2016, Dell acquired EMC, in February 2017, HP Enterprise acquired SimpliVity, a developer of hyperconverged systems, in April 2017, HP Enterprise acquired Nimble Storage, a storage solutions provider, and in September 2017, Cisco acquired Springpath, a developer of hyperconverged systems. We expect this trend to continue as companies attempt to strengthen or maintain their market positions through strategic acquisitions.
Consolidation in our industry may result in stronger competitors that may create more compelling offerings, offer greater pricing flexibility and be better able to compete as their customers’ sole-source vendors. Any of these developments would make it more difficult for us to compete effectively, including on the basis of price, sales and marketing programs and breadth of technology offerings. In addition, companies with which we have strategic partnerships may acquire or form alliances with our competitors, causing them to reduce their business with us. Continued industry consolidation may adversely affect customers’ and potential customers’ perceptions of the viability of less mature technology companies such as us and, consequently, their willingness to purchase from us. Any such competitive forces resulting from consolidation in our industry could adversely impact our business, operating results and financial condition.
Our research and development efforts may not produce successful solutions that result in significant revenue in the near future, if at all.
Developing new solutions and related enhancements is expensive and time consuming. Our investments in research and development may result in solutions that do not achieve market adoption, are more expensive to develop than anticipated, take longer to generate revenue or generate less revenue than we anticipate. Our future plans include significant investments in research and development for new solutions and related opportunities. We believe that we must continue to dedicate significant resources to our research and development efforts to maintain or expand our competitive position. However, these efforts may not result in significant revenue in the near future, if at all, which could adversely affect our business, operating results and financial condition.
28
The success of our business depends in part on our ability to protect and enforce our intellectual property rights.
Our success depends to a significant degree on our ability to protect our core technology and intellectual property. We rely on a combination of patent, copyright, service mark, trademark and trade secret laws, as well as confidentiality procedures and contractual restrictions, to establish and protect our technology, intellectual property and proprietary rights, all of which provide only limited protection. We cannot assure you that any patents or trademarks will be issued with respect to any pending patent or trademark applications in a manner that gives us adequate defensive protection or competitive advantages, if at all, or that any patents or trademarks issued to us or our other intellectual property rights will not be challenged, invalidated or circumvented. We have filed for patents and trademarks in the United States and in certain international jurisdictions, but such protections may not be available in all countries in which we operate or in which we seek to enforce our intellectual property rights, or may be difficult to enforce in practice. Our currently issued patents and trademarks and any patents or trademarks that may be issued in the future with respect to pending or future applications may not provide sufficiently broad protection or they may not prove to be enforceable in actions against alleged infringers. We cannot be certain that the steps we have taken will prevent unauthorized use or reverse engineering of our technology. Moreover, others may independently develop technologies that are competitive to ours or infringe our intellectual property rights.
Protecting against the unauthorized use of our intellectual property and technology, and infringement or misappropriation of our intellectual property rights is expensive and difficult, particularly internationally. Litigation may be necessary in the future to enforce or defend our intellectual property rights or to determine the validity and scope of the intellectual property rights of others. Such litigation could result in substantial costs and diversion of management resources, either of which could harm our business, operating results and financial condition. If we fail to protect our intellectual property rights adequately, our competitors could offer similar solutions, potentially harming our business. Further, many of our current and potential competitors have the ability to dedicate substantially greater resources to defending intellectual property rights infringement claims and to enforcing their intellectual property rights than we have. Attempts to enforce our rights against third parties could also provoke these third parties to assert their own intellectual property rights or other rights against us, or result in a holding that invalidates or narrows the scope of our intellectual property rights, in whole or in part. If we are unable to adequately protect and enforce our intellectual property, technology and our intellectual property rights, the value of our intellectual property, technology and intellectual property rights, and our business, operating results and financial condition could be adversely affected.
Third-party claims that we are infringing intellectual property rights, whether successful or not, could subject us to costly and time-consuming litigation or expensive licenses, and our business could be adversely affected.
A number of companies, both within and outside of the IT infrastructure industry, hold a large number of patents covering aspects of storage, servers and virtualization solutions. In addition to these patents, participants in this industry typically also protect their technology through copyrights and trade secrets. As a result, there is frequent litigation based on allegations of infringement, misappropriation or other violations of intellectual property rights. We have in the past, and may in the future, receive inquiries from other intellectual property rights holders seeking to profit from royalties in connection with grants of licenses and may in the future become subject to claims that we infringe their intellectual property rights, particularly as we expand our presence in the market and face increasing competition. We have in the past and may in the future be required to enter into agreements with such intellectual property rights holders involving the payment of royalties or other fees, or granting a limited license of our intellectual property rights, in order to resolve such inquiries and settle such claims. We cannot assure you that our business or products or services do not violate such rights of such third-party claimants. Regardless of the merit of any such claim, responding to such claims can be time consuming, divert management’s attention and resources and may cause us to incur significant expenses. In addition, parties may claim that the names and branding of our solution infringe their trademark rights in certain countries or territories. If such a claim were to prevail we may have to change the names and branding of our solution in the affected territories and incur other costs.
We currently have a number of agreements in effect pursuant to which we have agreed to defend, indemnify and hold harmless our customers, suppliers and channel and other partners from damages and costs which may arise from the infringement by our solution of third-party intellectual property rights, which may include patents, copyrights, trademarks or trade secrets. The scope of these indemnity obligations varies, but may, in some instances, include indemnification for damages and expenses, including attorneys’ fees. Our insurance may not cover all
29
intellectual property rights infringement claims. A claim that our solution infringes a third party’s intellectual property rights, even if untrue, could harm our relationships with our customers, may deter future customers from purchasing our solution and could expose us to costly litigation and settlement expenses. Even if we are not a party to any litigation between a customer and a third party relating to infringement by our solution, an adverse outcome in any such litigation could make it more difficult for us to defend our solution against intellectual property rights infringement claims in any subsequent litigation in which we are a named party. Any of these results could harm our brand and operating results.
Our defense of intellectual property rights claims brought against us or our customers, suppliers and channel partners, with or without merit, could be time-consuming, expensive to litigate or settle, divert management resources and attention and force us to acquire or license intellectual property rights, which may involve substantial royalty or other payments. We cannot assure you that we would be successful in defending against any such claims. Further, a party making such a claim, if successful, could secure a judgment that requires us to pay substantial damages. In addition, patent applications in the United States and most other countries are confidential for a period of time before being published, so we cannot be certain that we were the first to conceive the inventions covered by our patents or patent applications. An adverse determination also could invalidate our intellectual property rights and prevent us from offering our solution to our customers and may require that we procure or develop substitute solutions that do not infringe, which could require significant effort and expense. We may be unable to replace those technologies with technologies that have the same features or functionality and that are of equal quality and performance standards on commercially reasonable terms, or at all. We may have to seek a license for the technology, which may not be available on acceptable terms or at all, and as a result may significantly increase our operating expenses or require us to restrict our business activities in one or more respects. Any of these events could adversely affect our business, operating results and financial condition.
System security risks, data protection breaches and cyber-attacks on our systems or solutions could compromise our proprietary information (or information of our customers), disrupt our internal operations and harm public perception of our solution, which could cause our business and reputation to suffer, create additional liabilities and adversely affect our financial conditions and stock price.
In the ordinary course of business, we store sensitive data on our internal systems, networks and servers, which may include intellectual property, our proprietary business information and that of our customers, suppliers and business partners and sales data, which may include personally identifiable information. In addition, we design and sell solutions that our customers use to store their data. The security of our own networks and the intrusion protection features of our solution are both critical to our operations and business strategy.
We devote significant resources to network security, data encryption and other security measures to protect our systems and data, but these security measures are subject to third-party security breaches, employee error, malfeasance, faulty password management or other irregularities and cannot provide absolute security. Any destructive or intrusive breach of our internal systems could result in the information stored on our networks being accessed, publicly disclosed, lost or stolen. In addition, an effective attack on our solution could disrupt the proper functioning of our solution, allow unauthorized access to sensitive, proprietary or confidential information of ours or our customers, disrupt or temporarily interrupt customers’ operations or cause other destructive outcomes, including the theft of information sufficient to engage in fraudulent transactions. The risk that these types of events could seriously harm our business is likely to increase as we expand our network of channel partners, resellers and authorized service providers and as we operate in more countries. The economic costs to us to eliminate or alleviate cyber or other security problems, viruses, worms, malicious software systems and security vulnerabilities could be significant and may be difficult to anticipate or measure because the damage may differ based on the identity and motive of the programmer or hacker, which is often difficult to identify. If any of these types of security breaches, actual or perceived, were to occur and we were to be unable to protect sensitive data, our relationships with our business partners and customers could be damaged, our reputation and brand could be harmed, use of our solution could decrease and we could be exposed to a risk of loss or litigation and possible liability.
30
If we are unable to successfully manage our use of “open source” software, our ability to sell our products and services could be harmed, which could result in competitive disadvantages, and subject us to possible litigation.
We incorporate open source software in our products and services. Use of open source software can lead to greater risks than the use of proprietary or third-party commercial software since open source licensors generally do not provide warranties or controls with respect to origin, functionality or other features of the software. Some open source software licenses require users who distribute open source software as part of their solutions to publicly disclose all or part of the source code in their software and make any derivative works of the open source software generally available in source code form for limited fees or at no cost. Although we monitor our use of open source software, open source license terms may be ambiguous, and many of the risks associated with the use of open source software cannot be eliminated. If we were found to have inappropriately used open source software in our solution, we may be required to release our proprietary source code, re-engineer our software, discontinue the sale of certain solutions in the event re-engineering cannot be accomplished on a timely basis, or take other remedial action. Furthermore, if we fail to comply with applicable open source licenses, we may be subject to costly claims of intellectual property rights infringement or demands for the public release of proprietary source code. Any of the foregoing could harm our business, operating results and financial condition.
We may become subject to claims that our employees have wrongfully disclosed or that we have wrongfully used proprietary information of their former employers, which could adversely affect our business.
Many of our employees were previously employed at current or potential competitors. Although we require our employees to not use the proprietary information or know-how of others in their work for us and we are not currently subject to any claims that they have done so, we have in the past received inquiries from former employers of our employees and we may in the future become subject to claims that these employees have divulged, or we have used, proprietary information of these employees’ former employers. Litigation may be necessary to defend against these claims. If we are unable to successfully defend any such claims, we may be required to pay monetary damages and to discontinue our commercialization of certain solutions. In addition, we may lose valuable intellectual property rights or personnel. A loss of key research personnel or their work product could hamper our ability to develop new solutions and features for our existing solutions, which could severely harm our business. Even if we are successful in defending against these claims, litigation efforts are costly, time-consuming and a significant distraction to management.
We may face risks related to shareholder litigation that could result in significant legal expenses and settlement or damage awards.
We are currently and may in the future become subject to claims and litigation alleging violations of securities laws or other related claims, including shareholder derivative litigation, which could harm our business, divert management attention and require us to incur significant costs. For example, following our initial public offering in July 2017, four class action lawsuits were filed against us, as described in Item 1, Legal Proceedings. Each lawsuit is purportedly brought on behalf of a putative class of all persons who purchased shares of common stock pursuant or traceable to our initial public offering, and seeks, among other things, compensatory damages and attorney’s fees and costs on behalf of the putative class.
We are generally required, to the extent permitted by law, to indemnify our current and former directors and officers who are named as defendants in these types of lawsuits. We also have certain contractual obligations to the underwriters regarding such lawsuits. While a certain amount of insurance coverage may be available for expenses or losses associated with these lawsuits, this coverage may not be sufficient. Based on information currently available, we are unable to reasonably estimate a possible loss or range of possible loss, if any, with regards to these lawsuits; therefore, no litigation reserve has been recorded in the accompanying financial statements. Although we plan to defend against these lawsuits vigorously, there can be no assurances that a favorable final outcome will be obtained. These lawsuits or future litigation may require significant attention from management and could result in significant legal expenses, settlement costs or damage awards that could have a material impact on our financial position, results of operations and cash flows.
31
We are exposed to fluctuations in currency exchange rates, which could negatively affect our operating results.
Our sales contracts are denominated in U.S. dollars. As a result, a strengthening of the U.S. dollar could increase the real cost of our solution to our customers outside of the United States, which could adversely affect our international sales. In addition, a significant portion of our operating expenses is incurred outside the United States, denominated in foreign currencies and subject to fluctuations in foreign currency exchange rates. If we become more exposed to currency fluctuations and are not able to successfully hedge against the risks associated with currency fluctuations, our business, operating results and financial condition could be adversely affected.
We rely on our key technical, sales and management personnel to grow our business, and the loss of one or more key employees could harm our business.
Our success and future growth depends to a significant degree on the skills and continued services of our key technical, sales and management personnel. In particular, we are highly dependent on the services of Tom Barton, our incoming Chief Executive Officer, and Kieran Harty, our co-founder and Chief Technical Officer, who are each critical to the development of our technology, future vision and strategic direction. We rely on our leadership team in the areas of operations, security, marketing, sales, support and general and administrative functions, and on individual contributors on our research and development team, and changes to our senior managerial or other key employee could have a negative impact on our business. For example, in August 2017, we announced the departure of our former Chief Sales Officer and changes to the structure of our sales organization. In March 2018, we announced the departure of Ken Klein, our then-Chief Executive Officer, and Ian Halifax, our Chief Financial Officer. Mr. Klein’s and Mr. Halifax’s departures became effective in April 2018. All of our employees are employed by us on an at-will basis, and we could experience difficulty in retaining members of our senior management team or other key personnel, including as a result of layoffs, concerns by employees regarding our financial condition and the future of our business, and the loss of retention value of employee equity awards due to declines in the trading price of our common stock. We do not have “key person” life insurance policies that cover any of our officers or other key employees. The loss of the services of any of our key employees could disrupt our operations, delay the development and introduction of our solution and negatively impact our business, operating results and financial condition.
Our company culture has contributed to our success, and if we cannot maintain this culture as we grow, we could lose the innovation, creativity and teamwork fostered by our culture, and our business may be harmed.
We believe that a critical contributor to our success has been our company culture, which we believe fosters innovation, creativity, teamwork, passion for customers and focus on execution, as well as facilitating critical knowledge transfer and knowledge sharing. As we grow and change, we may find it difficult to maintain these important aspects of our company culture, which could limit our ability to innovate and operate effectively. Any failure to preserve our culture could also negatively affect our ability to retain and recruit personnel, continue to perform at current levels or execute on our business strategy.
Our ability to hire and retain employees may be negatively impacted by changes in immigration laws, regulations and procedures.
Foreign nationals who are not U.S. citizens or permanent residents constitute an important part of our U.S. workforce, particularly in the areas of engineering and product development. Our ability to hire and retain these workers and their ability to remain and work in the United States are impacted by laws and regulations, as well as by procedures and enforcement practices of various government agencies. Changes in immigration laws, regulations or procedures, including those that may be enacted by the current U.S. presidential administration, may adversely affect our ability to hire or retain such workers, increase our operating expenses and negatively impact our ability to deliver our products and services.
32
We may further expand through acquisitions of, or investments in, other companies, each of which may divert our management’s attention, resulting in additional dilution to our stockholders and consumption of resources that are necessary to sustain and grow our business.
While we have not consummated any acquisitions to date, we may evaluate and consider potential strategic transactions, including acquisitions of, or investments in, complementary businesses, technologies, services, products and other assets in the future. We also may enter into relationships with other businesses in order to expand our solution, which could involve preferred or exclusive licenses, additional channels of distribution or discount pricing or investments in other companies. Negotiating these transactions can be time-consuming, difficult and expensive, and our ability to close these transactions may be subject to third-party approvals, such as government regulatory approvals, which are beyond our control. Consequently, we can make no assurance that these transactions, once undertaken and announced, will close.
These kinds of acquisitions or investments may result in unforeseen operating difficulties and expenditures. In particular, we may encounter difficulties assimilating or integrating the businesses, technologies, products, personnel or operations of the acquired companies, particularly if the key personnel of the acquired business choose not to work for us. We may have difficulty retaining the customers of any acquired business or the acquired technologies or research and development expectations may prove unsuccessful. Acquisitions may also disrupt our ongoing business, divert our resources and require significant management attention that would otherwise be available for development of our business. Any acquisition or investment could expose us to unknown liabilities. Moreover, we cannot assure you that the anticipated benefits of any acquisition or investment would be realized or that we would not be exposed to unknown liabilities. In connection with these types of transactions, we may issue additional equity securities that would dilute our stockholders, use cash that we may need in the future to operate our business, incur debt on terms unfavorable to us or that we are unable to repay, incur large charges or substantial liabilities, encounter difficulties integrating diverse business cultures and become subject to adverse tax consequences, substantial depreciation or deferred compensation charges. These challenges related to acquisitions or investments could adversely affect our business, operating results and financial condition.
Failure to comply with laws and regulations applicable to our business could subject us to fines and penalties and could also negatively impact our ability to attract and retain customers.
Our business is subject to regulation by various federal, state, local and foreign government agencies, including agencies responsible for monitoring and enforcing employment and labor laws, workplace safety, product safety, environmental laws, consumer protection laws, anti-bribery laws, import/export controls, federal securities laws and tax laws and regulations. In certain jurisdictions, these regulatory requirements may be more stringent than in the United States. Noncompliance with applicable regulations or requirements could subject us to investigations, sanctions, mandatory product recalls, enforcement actions, disgorgement of profits, fines, damages and civil and criminal penalties or injunctions. If any government sanctions are imposed, or if we do not prevail in any possible civil or criminal litigation, our business, operating results and financial condition could be adversely affected. In addition, responding to any action will likely result in a significant diversion of management’s attention and resources and an increase in professional fees. Enforcement actions and sanctions could harm our business, operating results and financial condition.
In addition, we must comply with laws and regulations relating to the formation, administration and performance of contracts with the public sector, including U.S. federal, state and local government organizations, which affect how we and our channel partners do business with government agencies. Selling our solution to the U.S. government, whether directly or through channel partners, also subjects us to certain regulatory and contractual requirements. Failure to comply with these requirements by either us or our channel partners could subject us to investigations, fines and other penalties, which could have an adverse effect on our business, operating results and financial condition. As an example, the U.S. Department of Justice, or DOJ, and the General Services Administration, or GSA, have in the past pursued claims against and financial settlements with IT vendors under the False Claims Act and other statutes related to pricing and discount practices and compliance with certain provisions of GSA contracts for sales to the federal government. The DOJ and GSA continue to actively pursue such claims. Violations of certain regulatory and contractual requirements could also result in us being suspended or barred from future government contracting. Any of these outcomes could have an adverse effect on our business, operating results and financial condition.
33
These laws and regulations impose added costs on our business, and failure to comply with these or other applicable regulations and requirements, including non-compliance in the past, could lead to claims for damages from our channel partners, penalties, termination of contracts, loss of exclusive rights in our intellectual property, and temporary suspension or permanent debarment from government contracting. Any such damages, penalties, disruptions or limitations in our ability to do business with certain customers could have an adverse effect on our business, operating results and financial condition.
Our failure to prepare and timely file our periodic reports with the SEC may limit our access to the public markets to raise debt or equity capital, and could have negative consequences related to our financing agreements.
We did not file this Annual Report on Form 10-K within the timeframe required by the SEC. As a result of this late filing, we may be limited in our ability to access the public markets to raise debt or equity capital, which could prevent us from pursuing transactions or implementing business strategies that we believe would be beneficial to our business. We are ineligible to use shorter and less costly filings, such as Form S-3, to register our securities for sale for a period of 12 months following the month in which we regain compliance with our SEC reporting obligations. While we may be able to use Form S-1 to register a sale of our stock to raise capital or complete acquisitions, doing so would likely increase transaction costs and adversely impact our ability to raise capital or complete acquisitions of other companies in a timely manner.
We are subject to government export and import controls that could impair our ability to compete in international markets or subject us to liability if we violate the controls.
Our solution is subject to U.S. export controls, including the Export Administration Regulations and economic sanctions administered by the Office of Foreign Assets Control, or OFAC, and we incorporate encryption technology into our solution. These encryption products and the underlying technology may be exported outside of the United States only with the required export authorizations, including by license, a license exception or other appropriate government authorizations, including the filing of an encryption registration.
Furthermore, our activities are subject to the U.S. economic sanctions laws and regulations that prohibit the export, re-export and transfer of certain products and services without the required export authorizations, including to countries, governments and persons targeted by U.S. embargoes or sanctions. Obtaining the necessary export license or other authorization for a particular sale may be time-consuming and may result in the delay or loss of sales opportunities even if the export license ultimately may be granted. While we take precautions to prevent our solution from being exported in violation of these laws, including obtaining authorizations for our encryption products and screening exports against U.S. government and international lists of restricted and prohibited persons, we cannot guarantee that the precautions we take will prevent violations of export control and sanctions laws. Violations of U.S. sanctions or export control laws can result in significant fines or penalties, denial of export privileges, and possible incarceration for responsible employees and managers could be imposed for criminal violations of these laws.
We also note that if our channel partners fail to obtain appropriate import, export or re-export licenses or permits, we may also be adversely affected, through reputational harm as well as other negative consequences, including government investigations and penalties. No assurance can be given that our channel partners will comply with export requirements.
Also, various countries, in addition to the United States, regulate the import and export of certain encryption and other technology, including through import and export licensing requirements, and have enacted laws that could limit our ability to distribute our solution or could limit our customers’ ability to implement our solution in those countries. Changes in our solution or future changes in export and import regulations may create delays in the introduction of our solution in international markets, prevent our customers with international operations from deploying our solution globally or, in some cases, prevent the export or import of our solution to certain countries, governments, or persons altogether. From time to time, various government agencies have proposed additional regulation of encryption technology. Any change in export or import regulations, economic sanctions or related legislation, or change in the countries, governments, persons or technologies targeted by such regulations, could
34
result in decreased use of our solution by, or in our decreased ability to export or sell our solution to, existing or potential customers with international operations. Any decreased use of our solution or limitation on our ability to export or sell our solution would adversely affect our business, operating results and financial condition.
Changes in tariffs, sanctions, international treaties, and export/import laws may delay the introduction and sale of our products in international markets, prevent our customers with international operations from deploying our products or, in some cases, prevent the export or import of our products to certain countries, governments, persons or entities altogether. Any change in export or import regulations, economic sanctions or related laws, shift in the enforcement or scope of existing regulations, or change in the countries, governments, persons or technologies targeted by such regulations, could result in decreased demand for our products, or in our decreased ability to export or sell our products to existing or potential customers with international operations. Any decrease in demand for our products or limitation on our ability to export or sell our products would likely adversely affect our business, operating results and financial condition.
We are subject to government regulation and other legal obligations related to privacy, data protection and information security, and our actual or perceived failure to comply with such obligations could adversely affect our business and operating results. Compliance with such laws could also impair our efforts to maintain and expand our customer base and thereby decrease our revenue.
The United States and other jurisdictions where we offer our solution have laws, regulations and standards governing the protection of information privacy, data protection and information security. Our handling of data is subject to a variety of laws and regulations, including regulation by various government agencies, including the U.S. Federal Trade Commission, or FTC, and various state, local and foreign bodies and agencies. In addition, agreements with our customers and business partners may contain contractual provisions related to the protection of information privacy, data protection and information security.
The U.S. federal and various state and foreign governments have adopted or proposed limitations on the collection, distribution, use and storage of personal information of individuals, including customers and employees. In the United States, the FTC and many state attorneys general are applying federal and state consumer protection laws to the online collection, use and dissemination of data. In addition, many foreign countries and government bodies, including in Australia, the European Union, Japan and numerous other jurisdictions in which we operate or conduct our business, have laws and regulations concerning the collection and use of personally identifiable information obtained from their residents or by businesses operating within their jurisdiction. These laws and regulations often are more restrictive than those in the United States. Such laws and regulations may require companies to implement privacy and security policies, permit customers to access, correct and delete personal information stored or maintained by such companies, inform individuals of security breaches that affect their personal information, and, in some cases, obtain individuals’ consent to use personally identifiable information for certain purposes. In addition, a foreign government could require that any personally identifiable information collected in a country not be disseminated outside of that country, and we are not currently equipped to comply with such a requirement. We also may find it necessary or desirable to join industry or other self-regulatory bodies or other information security- or data protection-related organizations that require compliance with their rules pertaining to information security and data protection. We also may be bound by additional, more stringent contractual obligations relating to our collection, use and disclosure of personal, financial and other data.
We also expect that there will continue to be new proposed laws, regulations and industry standards concerning privacy, data protection and information security in the United States, the European Union and other jurisdictions, and we cannot yet determine the impact such future laws, regulations and standards may have on our business. In addition, we expect that existing laws, regulations and standards may be interpreted in new manners in the future. For example, an October 2015 decision by the Court of Justice for the European Union invalidated the U.S.-EU Safe Harbor Framework, which facilitated personal data transfers to the U.S. in compliance with applicable EU data protection laws. While we did not rely upon the U.S.-EU Safe Harbor Framework for our transfer of EU personal data to the United States, and do not rely upon its replacement framework, the U.S.-EU Privacy Shield, there remains some regulatory uncertainty surrounding the future of data transfers from the European Union to the United States. In addition, European legislators have adopted a general data protection regulation that will, when effective in May 2018, supersede current EU data protection legislation, impose more stringent EU data protection requirements and provide for greater penalties for noncompliance. Future laws, regulations, standards and other obligations, and changes in the interpretation of existing laws, regulations, standards and other obligations could
35
impair our or our customers’ ability to collect, use or disclose information relating to individuals, which could decrease demand for our solution, require us to restrict our business operations, increase our costs and impair our ability to maintain and grow our customer base and increase our revenue.
Although we are working to comply with those federal, state and foreign laws and regulations, industry standards, contractual obligations and other legal obligations that apply to us, those laws, regulations, standards and obligations are evolving and may be modified, interpreted and applied in an inconsistent manner from one jurisdiction to another, and may conflict with one another, other requirements or legal obligations, our practices or the features of our solution. As such, we cannot assure ongoing compliance with all such laws or regulations, industry standards, contractual obligations and other legal obligations. Any failure or perceived failure by us to comply with federal, state or foreign laws or regulations, industry standards, contractual obligations or other legal obligations, or any actual or suspected cybersecurity breach, ransomware attack or other security incident, whether or not resulting in unauthorized access to, or acquisition, release or use or transfer of personally identifiable information or other data, may result in government enforcement actions and prosecutions, private litigation, fines and penalties or adverse publicity and could cause our customers to lose trust in us, which could have an adverse effect on our reputation and business. Any inability to adequately address privacy and security concerns, even if unfounded, or comply with applicable laws, regulations, policies, industry standards, contractual obligations or other legal obligations could result in additional cost and liability to us, damage our reputation, inhibit sales, and adversely affect our business, operating results and financial condition.
Changes to laws or regulations affecting privacy could impose additional costs and liabilities on us and could limit our use of such information to add value for customers. If we were required to change our business activities or revise or eliminate services, or to implement burdensome compliance measures, our business and operating results could be harmed. In addition, we may be subject to fines, penalties, and potential litigation if we fail to comply with applicable privacy and/or data security laws, regulations, standards and other requirements. The costs of compliance with and other burdens imposed by privacy-related laws, regulations and standards may limit the use and adoption of our product solutions and reduce overall demand.
Furthermore, concerns regarding data privacy may cause our customers’ customers to resist providing the data and information necessary to allow our customers to use our product solutions effectively. Even the perception that the privacy and/or security of personal information is not satisfactorily protected or does not meet applicable legal, regulatory and other requirements could inhibit sales of our products or services, and could limit adoption of our solution.
Failure to comply with anticorruption and anti-money laundering laws, including the U.S. Foreign Corrupt Practices Act of 1977, as amended, or the FCPA, and similar laws associated with our activities outside of the United States could subject us to penalties and other adverse consequences.
We are subject to the FCPA, the U.S. domestic bribery statute contained in 18 U.S.C. § 201, the U.S. Travel Act, the USA PATRIOT Act, the United Kingdom Bribery Act of 2010 and other anti-bribery and anti-money laundering laws in countries in which we conduct activities. We face significant risks if we fail to comply with the FCPA and other anticorruption laws that prohibit companies and their employees and third-party intermediaries from authorizing, offering or providing, directly or indirectly, improper payments or benefits to foreign government officials, political parties and private-sector recipients for the purpose of obtaining or retaining business, directing business to any person or securing any advantage. In addition, we use various third parties to sell our solution and conduct our business abroad. We, our channel partners, and our other third-party intermediaries may have direct or indirect interactions with officials and employees of government agencies or state-owned or affiliated entities and we can be held liable for the corrupt or other illegal activities of these third-party intermediaries, our employees, representatives, contractors, partners, and agents, even if we do not explicitly authorize such activities. We continue to implement our FCPA/anti-corruption compliance program and cannot assure you that all of our employees and agents, as well as those companies to which we outsource certain of our business operations, will not take actions in violation of our policies and applicable law, for which we may be ultimately held responsible.
Any violation of the FCPA, other applicable anticorruption laws, and anti-money laundering laws could result in whistleblower complaints, adverse media coverage, investigations, severe criminal or civil sanctions and, in the case of the FCPA, suspension or debarment from U.S. government contracts, which could have a material and
36
adverse effect on our reputation, business, operating results and financial condition. In addition, responding to any enforcement action may result in a significant diversion of management’s attention and resources and significant defense costs and other professional fees.
We are a multinational organization faced with increasingly complex tax issues in many jurisdictions, and changes in our effective tax rate or changes in tax laws or their application to the operation of our business could adversely impact our operating results and our business.
We conduct operations in multiple jurisdictions, and we are subject to certain taxes, including income, sales and use, value added and other taxes, in the United States and other jurisdictions in which we do business. A change in the tax laws in the jurisdictions in which we do business, including an increase in tax rates or an adverse change in the treatment of an item of income or expense, possibly with retroactive effect, could result in a material increase in the amount of taxes we incur. Recent changes to U.S. tax laws that limit the ability of taxpayers to claim and utilize foreign tax credits and require the deferral of certain tax deductions until earnings outside of the United States are repatriated to the United States, as well as changes to U.S. tax laws that may be enacted in the future, could affect the tax treatment of our foreign earnings, as well as cash and cash equivalent balances we currently maintain outside of the United States. In addition, the Organization for Economic Co-operation and Development has initiated a base erosion and profit shifting project which seeks to establish certain international standards for taxing the worldwide income of multinational companies. As a result of these developments, the tax laws of certain countries in which we and our affiliates do business could change on a prospective or retroactive basis, and any such changes could increase our liabilities for taxes, interest and penalties, and therefore could harm our cash flows, operating results and financial position. Finally, the amount of taxes we pay in different jurisdictions depends on our ability to operate our business in a manner consistent with our corporate structure and transfer pricing arrangements, as well as any future intercompany transactions we may undertake.
In the United States, a number of proposals for broad reform of the corporate tax system are under evaluation by various legislative and administrative bodies. It is not possible to accurately determine the overall impact of such proposals on our effective tax rate or balance sheet at this time. Proposed changes in corporate tax rates, the taxation of foreign earnings and the deductibility of expenses could have a material impact on the recoverability of our deferred tax assets, could result in significant one-time charges in the period in which tax reform is enacted, or could result in increases to our future United States tax expense. Furthermore, proposed changes to the taxation of undistributed foreign earnings could change our future intentions regarding reinvestment of such earnings.
We are subject to periodic audits or other reviews by tax authorities in the jurisdictions in which we do business, and these tax authorities may disagree with our interpretations of applicable tax law or our determinations as to the income and expenses attributable to specific jurisdictions or may challenge our methodologies for pricing intercompany transactions. In addition, authorities in jurisdictions in which we do not file tax returns could assert that we are subject to tax in such jurisdiction. In either case, such authorities could impose additional taxes, interest and penalties, claim that various withholding requirements apply to us or our subsidiaries or assert that benefits of tax treaties are not available to us or our subsidiaries. Any such audit, examination or review requires management’s time, diverts internal resources and, in the event of an unfavorable outcome, may result in additional tax liabilities or other adjustments to our historical results.
We do not collect sales and use, value added or similar taxes in all jurisdictions in which we have sales. We have previously filed voluntary disclosure agreements with several U.S. states related to past due sales and use taxes. While we believe that we have properly accrued for sales and use taxes in accordance with U.S. GAAP, taxing authorities may assert that we owe additional taxes, interest or penalties, which may impact our historical and future results.
Because we conduct operations in multiple jurisdictions, our effective tax rate is influenced by the amounts of income and expense attributed to each jurisdiction. If such amounts were to change so as to increase the amounts of our net income subject to taxation in higher-tax jurisdictions, or if we were to commence operations in jurisdictions assessing relatively higher tax rates, our effective tax rate could be adversely affected. In addition, we may determine that it is advisable from time to time to repatriate earnings from subsidiaries under circumstances that could give rise to imposition of potentially significant tax liabilities, including withholding taxes by the jurisdictions
37
in which such amounts were earned, without our receiving the benefit of any offsetting tax credits, which could also adversely impact our effective tax rate and operating results.
Our ability to use net operating losses to offset future taxable income may be subject to certain limitations.
As of January 31, 2018, we had $348.2 million of federal and $153.8 million of state net operating loss carryforwards available to reduce future taxable income. These net operating loss carryforwards begin to expire in 2028 for U.S. federal and state income tax purposes. U.S. federal and state income tax laws limit the amount of these carryforwards we can utilize in any given year to offset our taxable income following an “ownership change” (generally defined as a greater than 50% cumulative shift of the stock ownership of certain stockholders over a rolling three-year period), including ownership changes due to the issuance of additional shares of our common stock, or securities convertible into our common stock. Some of our existing carryforwards may be subject to limitations arising from previous ownership changes, and we may experience subsequent ownership changes. Accordingly, there is a risk that our ability to use our existing carryforwards in the future could be limited and that existing carryforwards would be unavailable to offset future income tax liabilities. Furthermore, our ability to utilize the net operating loss carryforwards of companies that we may acquire in the future may be subject to limitations. Limitations imposed on our ability to utilize our net operating loss carryforwards could cause U.S. federal and state income taxes to be paid earlier than would be paid if such limitations were not in effect and could cause some of our net operating loss carryforwards to expire unused, in each case reducing or eliminating the benefit of such net operating loss carryforwards. In addition, we may not be able to generate sufficient taxable income to utilize our net operating loss carryforwards before they expire and our existing net operating loss carryforwards could be limited by legislative or regulatory changes, such as suspensions on the use of net operating carryforwards. If any of these events occur, we may not derive some or all of the expected benefits from our net operating loss carryforwards, which could potentially result in increased future tax liability to us and could adversely affect our business, operating results and financial condition.
Changes in U.S. tax laws could have a material adverse effect on our business, cash flow, results of operations or financial conditions.
Legislation commonly referred to as the Tax Cuts and Jobs Act (the “Tax Act”) was enacted in December 2017, and contains many significant changes to the U.S. federal income tax laws, the consequences of which have not yet been determined. Changes in corporate tax rates, the realizability of the net deferred tax assets relating to our U.S. operations, the taxation of foreign earnings, and the deductibility of expenses contained in the Act or other tax reform legislation could have a material impact on the value of our deferred tax assets, could result in significant one-time charges in the current or future taxable years, and could increase our future U.S. tax expense. The foregoing items could have a material adverse effect on our business, cash flow, results of operations or financial conditions. In accordance with Staff Accounting Bulletin 118, a company generally has up to one year from the Tax Act enactment date to complete the accounting under ASC 740 to reflect the income tax effects of those aspects of the Tax Act for which the accounting under ASC 740 is complete. The Deemed Repatriation Transition Tax, or the Transition Tax, is a tax on previously untaxed accumulated and current earnings and profits of certain of our foreign subsidiaries at reduced tax rates. We have made a reasonable estimate of the Transition Tax and expect to utilize U.S. net operating losses to reduce the tax. However, we have not collected all of the necessary data to complete our analysis of the effect of the Tax Act on our underlying deferred taxes and as such, the amounts recorded in our financial statements as of January 31, 2018, are provisional.
Our reported financial results may be adversely affected by changes in accounting principles applicable to us.
Generally accepted accounting principles in the United States are subject to interpretation by the Financial Accounting Standards Board, or FASB, the Securities and Exchange Commission, or the SEC, and other bodies formed to promulgate and interpret appropriate accounting principles. A change in these principles or interpretations could have a significant effect on our reported financial results, and could affect the reporting of transactions completed before the announcement of a change. In addition, the SEC has announced a multi-year plan that could ultimately lead to the use of International Financial Reporting Standards by U.S. issuers in their SEC filings. Any such change could have a significant effect on our reported financial results. Additionally, the adoption of new or revised accounting principles may require that we make significant changes to our systems, processes and controls.
38
Regulations related to conflict minerals may cause us to incur additional expenses and could limit the supply and increase the costs of certain metals used in the manufacturing of our platforms.
We are subject to the requirements under the Dodd-Frank Wall Street Reform and Consumer Protection Act of 2010, or the Dodd-Frank Act, that will require us to investigate, disclose and report whether the hardware components that house our solution contain conflict minerals. The implementation of these requirements could adversely affect the sourcing, availability and pricing of the materials used in the manufacture of components used in our solution. In addition, we will incur additional costs to comply with the disclosure requirements, including costs related to conducting diligence procedures to determine the sources of conflict minerals that may be used in or necessary to the production of our hardware components and, if applicable, potential changes to components, processes or sources of supply as a consequence of such verification activities. It is also possible that we may face reputational harm if we determine that certain of our hardware components contain minerals not determined to be conflict-free or if we are unable to alter our solution, processes or sources of supply to avoid use of such materials.
If we fail to comply with environmental requirements, our business, operating results and reputation could be adversely affected.
We are subject to various environmental laws and regulations, including laws governing the hazardous material content of our products and laws relating to the collection of and recycling of electrical and electronic equipment. Examples of these laws and regulations include the EU Restrictions of Hazardous Substances Directive, or RoHS, and the EU Waste Electrical and Electronic Equipment Directive, or WEEE, as well as the implementing legislation of the EU member states. Similar laws and regulations have been passed or are pending in China, South Korea, Norway and Japan and may be enacted in other regions, including in the United States, and we are, or may in the future be, subject to these laws and regulations.
The EU RoHS and the similar laws of other jurisdictions ban the use of certain hazardous materials such as lead, mercury and cadmium in the manufacture of electrical equipment, including our products. Currently, the manufacturer of the hardware components that house our solution and our major component part suppliers comply with the EU RoHS requirements. However, if there are changes to this or other laws (or their interpretation) or if new similar laws are passed in other jurisdictions, we may be required to reengineer our products to use components compatible with these regulations. This reengineering and component substitution could result in additional costs to us or disrupt our operations or logistics.
The WEEE Directive requires electronic goods producers to be responsible for the collection, recycling and treatment of such products. Changes in interpretation of the directive or with any similar laws adopted in other jurisdictions may cause us to incur additional costs or have additional regulatory requirements to meet in the future in order to comply.
Our failure to comply with past, present and future similar laws could result in reduced sales of our products, substantial product inventory write-offs, reputational damage, penalties and other sanctions, any of which could harm our business and operating results. We also expect that our products will be affected by new environmental laws and regulations on an ongoing basis. To date, our expenditures for environmental compliance have not had a material impact on our operating results or cash flows, and although we cannot predict the future impact of such laws or regulations, they will likely result in additional costs and may increase penalties associated with violations or require us to change the content of our products or how they are manufactured, which could have an adverse effect on our business, operating results and financial condition.
Our business is subject to the risks of earthquakes, fire, power outages, floods, and other catastrophic events, and to interruption by man-made problems such as terrorism.
A significant natural disaster, such as an earthquake, fire, flood or significant power outage, could have a material adverse impact on our business and operating results. Our corporate headquarters and the location where our products are manufactured are located in a region known for seismic activity. In addition, natural disasters could affect our supply chain, manufacturing vendors, or logistics providers’ ability to provide materials and perform services such as manufacturing products or assisting with shipments on a timely basis. In the event we or our service providers are hindered by any of the events discussed above, shipments could be delayed, resulting in missed financial targets, such as revenue and shipment targets, for a particular quarter. In addition, acts of terrorism and
39
other geo-political unrest could cause disruptions in our business or the businesses of our supply chain, manufacturer, logistics providers, partners or customers, or the economy as a whole. Any disruption in the business of our supply chain, manufacturer, logistics providers, partners or customers that impacts sales at the end of a fiscal quarter could have a significant adverse impact on our quarterly results. All of the aforementioned risks may be further increased if we do not implement a disaster recovery plan or our suppliers’ disaster recovery plans prove to be inadequate. To the extent that any of the above should result in delays or cancellations of customer orders, or delays in the manufacture, deployment or shipment of our products, our business, operating results and financial condition would be adversely affected.
Risks Related to Our Common Stock
Our share price may be volatile, and may decline and could subject us to litigation.
The trading prices of the securities of technology companies, including enterprise cloud companies, have been highly volatile. The market price of our common stock has fluctuated and may continue to fluctuate significantly in response to numerous factors, many of which are beyond our control, including:
|
|
• |
actual or anticipated fluctuations in our revenue and other operating results; |
|
|
• |
announcements by us or our competitors of significant technical innovations, acquisitions, partnerships, joint ventures or capital commitments; |
|
|
• |
the financial projections we may provide to the public or any decision to cease providing financial projections to the public, any changes in these projections or our failure to meet these projections; |
|
|
• |
failure of securities analysts to maintain coverage of us, changes in ratings and financial estimates by any securities analysts who follow our company, or our failure to meet these estimates or the expectations of investors; |
|
|
• |
changes in operating performance and stock market valuations of other technology or comparable companies, or those in our industry in particular; |
|
|
• |
price and volume fluctuations in the trading of our common stock and in the overall stock market, including as a result of trends in the economy as a whole; |
|
|
• |
changes in our executive management team or departures of key employees; |
|
|
• |
our failure to comply with the financial covenants and other terms contained in our credit agreements; |
|
|
• |
developments or disputes concerning our intellectual property or other proprietary rights; |
|
|
• |
changes in accounting standards, policies, guidelines, interpretations or principles; |
|
|
• |
new laws or regulations or new interpretations of existing laws or regulations applicable to our business or our industry; |
|
|
• |
lawsuits threatened or filed against us; |
|
|
• |
future sales of shares of our common stock by us or our stockholders; |
|
|
• |
rumors and market speculation involving us or other companies in our industry; |
|
|
• |
actual or anticipated developments in our business, our competitors’ businesses, or the competitive landscape generally; and |
|
|
• |
other events or factors, including those resulting from war, incidents of terrorism or responses to these events. |
Stock prices of many technology companies have fluctuated in a manner unrelated or disproportionate to the operating performance of those companies. In the past, stockholders have instituted securities class action litigation following periods of market volatility and class action lawsuits have been filed against us. See “Item 3. Legal Proceedings” below. Such litigation could subject us to substantial costs and divert resources and the attention of management from our business and adversely affect our business, operating results and financial condition.
40
Sales of outstanding shares of our common stock into the market in the future could cause the market price of our common stock to drop significantly.
The market price for our common stock could decline as a result of the sale of substantial amounts of our common stock, particularly sales by our directors, executive officers and significant stockholders, a large number of shares of our common stock becoming available for sale or the perception in the market that holders of a large number of shares intend to sell their shares. As of January 31, 2018, we had approximately 31.3 million shares of common stock outstanding.
In addition, we have granted stock option, RSU and other equity-based awards to our service providers from time to time, and anticipate continuing to do so in the future. In order to attract and retain qualified personnel, we may be required to increase the aggregate size of these grants, or modify the standard vesting conditions we have utilized in the past with these grants, as compared with our historical equity award practices. Any of these practices may have the effect of increasing the number of shares of our common stock that are available for sale and negatively impact the market price for our common stock.
Holders of an aggregate of 19,790,378 shares of our common stock as of January 31, 2018, have rights, subject to some conditions, to require us to file registration statements covering their shares or to include their shares in registration statements that we may file for ourselves or our other stockholders.
In addition, the shares of common stock subject to outstanding options and RSUs under our equity incentive plans and the shares reserved for future issuance under our equity incentive plans will become eligible for sale in the public market in the future, subject to certain legal and contractual limitations.
If a substantial number of shares are sold, or if it is perceived that they will be sold, in the public market, the trading price of our common stock could decline.
If securities analysts do not publish research or reports about our business, or if they downgrade our common stock, the price of our common stock could decline.
The trading market for our common stock depends in part on the research and reports that securities or industry analysts publish about us or our business, our market and our competitors. If no or few securities or industry analysts cover our company, the trading price for our common stock would be negatively impacted. If one or more of the analysts who covers us downgrades our common stock or publishes incorrect or unfavorable research about our business, our stock price would likely decline. If one or more of these analysts ceases coverage of our company or fails to publish reports on us regularly, demand for our common stock could decrease, which could cause our stock price or trading volume to decline.
The concentration of ownership among our existing directors, executive officers and principal stockholders provides them, collectively, with substantial control over us, which could limit your ability to influence the outcome of key transactions, including a change of control.
Our executive officers, directors, current 5% or greater stockholders and affiliated entities together beneficially own a significant portion of our outstanding common stock. As a result, these stockholders, acting together, have significant influence over all matters that require approval by our stockholders, including the election of directors and approval of significant corporate transactions. Corporate action might be taken even if other stockholders oppose them. This concentration of ownership might also have the effect of delaying or preventing a change of control of our company that other stockholders may view as beneficial.
We are an “emerging growth company,” and the reduced disclosure requirements applicable to emerging growth companies might make our common stock less attractive to investors, which would in turn decrease the value of our stock.
We are an “emerging growth company,” as defined in the JOBS Act, and we may take advantage of certain exemptions from various reporting requirements that are applicable to other public companies that are not “emerging growth companies” including, but not limited to, not being required to comply with the auditor attestation
41
requirements of Section 404 of the Sarbanes-Oxley Act of 2002, or the Sarbanes-Oxley Act, reduced financial disclosure obligations, reduced disclosure obligations regarding executive compensation in our periodic reports and proxy statements, and exemptions from the requirements of holding a nonbinding advisory vote on executive compensation and any golden parachute payments not previously approved. We may take advantage of these provisions for up to five years or such earlier time that we are no longer an “emerging growth company.” We will cease to be an “emerging growth company” upon the earliest to occur of: the last day of the fiscal year in which we have more than $1.07 billion in annual revenue; the date we qualify as a “large accelerated filer,” with at least $700 million of equity securities held by non-affiliates; the issuance, in any three-year period, by us of more than $1.0 billion in non-convertible debt securities; and the last day of the fiscal year ending after the fifth anniversary of our initial public offering. We may choose to take advantage of some but not all of these reduced reporting burdens. If we take advantage of any of these reduced reporting burdens in future filings, the information that we provide our security holders may be different than the information you might get from other public companies in which you hold equity interests. We cannot predict if investors will find our common stock less attractive because we may rely on these exemptions. If some investors find our common stock less attractive as a result, there may be a less active trading market for our common stock and our stock price may be more volatile.
In addition, Section 107 of the JOBS Act provides that an “emerging growth company” can take advantage of the extended transition period provided in Section 7(a)(2)(B) of the Securities Act of 1933, as amended, or the Securities Act, for complying with new or revised accounting standards. In other words, an “emerging growth company” can delay the adoption of certain accounting standards until those standards would otherwise apply to private companies. However, we have chosen to “opt out” of such extended transition period, and as a result, we will comply with new or revised accounting standards on the relevant dates on which adoption of such standards is required for non-emerging growth companies. Section 107 of the JOBS Act provides that our decision to opt out of the extended transition period for complying with new or revised accounting standards is irrevocable.
The requirements of being a public company subject us to increased costs as compared to prior periods and may strain our resources and divert management’s attention.
We are subject to the reporting requirements of the Securities Exchange Act of 1934, as amended, or the Exchange Act, the Sarbanes-Oxley Act, the Dodd-Frank Act, and the rules and regulations of the NASDAQ Stock Market. The requirements of these rules and regulations have resulted in an increase in our legal, accounting and financial compliance costs as compared to prior periods, make some activities more difficult, time-consuming and costly and may also place undue strain on our personnel, systems and resources.
The Exchange Act requires, among other things, that we file annual, quarterly and current reports with respect to our business and operating results. The Sarbanes-Oxley Act requires, among other things, that we maintain effective disclosure controls and procedures and internal control over financial reporting. We are continuing the costly process of implementing and testing our systems to report our results as a public company, to continue to manage our growth and to implement internal controls. We have been and will be required to implement and maintain various other control and business systems related to our equity, finance, treasury, information technology, other recordkeeping systems and other operations. As a result of this implementation and maintenance, management’s attention may be diverted from other business concerns, which could adversely affect our business. Furthermore, we rely on third-party software and system providers for ensuring our reporting obligations and effective internal controls, and to the extent these third parties fail to provide adequate service including as a result of any inability to scale to handle our growth and the imposition of these increased reporting and internal controls and procedures, we could incur material costs for upgrading or switching systems and our business could be affected.
42
In addition, changing laws, regulations and standards relating to corporate governance and public disclosure are creating uncertainty for public companies, increasing legal and financial compliance costs and making some activities more time-consuming. These laws, regulations and standards are subject to varying interpretations, in many cases due to their lack of specificity and, as a result, their application in practice may evolve over time as new guidance is provided by regulatory and governing bodies. This could result in continuing uncertainty regarding compliance matters and higher costs necessitated by ongoing revisions to disclosure and governance practices. We intend to invest resources to comply with evolving laws, regulations and standards, and this investment may result in increased general and administrative expenses and a diversion of management’s time and attention from revenue-generating activities to compliance activities. If our efforts to comply with new laws, regulations and standards differ from the activities intended by regulatory or governing bodies due to ambiguities related to their application and practice, regulatory authorities may initiate legal proceedings against us and our business may be adversely affected.
In addition, we expect these laws, rules and regulations to make it more difficult and more expensive for us to maintain director and officer liability insurance, and we may be required to incur substantial costs to maintain appropriate levels of coverage. These factors could also make it more difficult for us to attract and retain qualified members of the Board, particularly to serve on our audit committee, and qualified executive officers.
As a result of disclosure of information in filings required of a public company, our business and financial condition have become more visible, which we believe may result in threatened or actual litigation, including by competitors and other third parties. If such claims are successful, our business and operating results could be adversely affected, and even if the claims do not result in litigation or are resolved in our favor, these claims, and the time and resources necessary to resolve them, could divert the time and resources of our management and adversely affect our business, operating results and financial condition.
As a result of becoming a public company, we are obligated to further develop and maintain proper and effective internal control over financial reporting. We may not complete our analysis of our internal control over financial reporting in a timely manner, or these internal controls may not be determined to be effective, which may adversely affect investor confidence in our company and, as a result, the value of our common stock.
We will be required, pursuant to Section 404 of the Sarbanes-Oxley Act, to furnish a report by management on, among other things, the effectiveness of our internal control over financial reporting commencing with our annual report covering the fiscal year ending January 31, 2019. This assessment will need to include disclosure of any material weaknesses identified by our management in our internal control over financial reporting. Prior to our initial public offering, we had never been required to test our internal controls within a specified period, and, as a result, we may experience difficulty in meeting these reporting requirements in a timely manner. In addition, as a result of our testing of internal controls, we may identify control deficiencies which could result in a material weakness or significant deficiency. Our independent registered public accounting firm will not be required to formally attest to the effectiveness of our internal control over financial reporting pursuant to Section 404 of the Sarbanes-Oxley Act until the later of the year following our first annual report required to be filed with the SEC or the date we are no longer an “emerging growth company” as defined in the JOBS Act. If we are unable to comply with the requirements of Section 404 of the Sarbanes-Oxley Act in a timely manner, the market price of our stock could decline and we could be subject to sanctions or investigations by the stock exchange on which our common stock is listed, the SEC or other regulatory authorities, which would require additional financial and management resources.
Any failure to develop or maintain effective controls, or any difficulties encountered in their implementation or improvement, could harm our operating results or cause us to fail to meet our reporting obligations. Any failure to implement and maintain effective internal controls also could adversely affect the results of periodic management evaluations regarding the effectiveness of our internal control over financial reporting. Ineffective disclosure controls and procedures or internal control over financial reporting could also cause investors to lose confidence in our reported financial and other information, which would likely have a negative effect on the trading price of our common stock.
Implementing any appropriate changes to our internal controls may require specific compliance training of our directors, officers and employees, entail substantial costs in order to modify our existing accounting systems, and
43
take a significant period of time to complete. Such changes may not, however, be effective in maintaining the adequacy of our internal controls, and any failure to maintain that adequacy, or consequent inability to produce accurate financial statements on a timely basis, could increase our operating costs and could impair our ability to operate our business. In the event that we are not able to demonstrate compliance with Section 404 of the Sarbanes-Oxley Act in a timely manner, that our internal controls are perceived as inadequate or that we are unable to produce timely or accurate financial statements, investors may lose confidence in our operating results and our stock price could decline.
We do not intend to pay dividends for the foreseeable future.
We have never declared or paid any cash dividends on our common stock and do not currently intend to do so for the foreseeable future. In addition, our loan and security agreements with SVB and TriplePoint prohibit us from paying dividends, and future financing or credit agreements that we enter into may contain similar restrictions. We currently intend to invest our future earnings, if any, to fund our growth. Therefore, you are not likely to receive any dividends on your common stock for the foreseeable future and the success of an investment in shares of our common stock will depend upon any future appreciation in its value. Consequently, investors may need to sell all or part of their holdings of our common stock after price appreciation, which may never occur, as the only way to realize any future gains on their investment. There is no guarantee that shares of our common stock will appreciate in value or even maintain the price at which our stockholders have purchased their shares. Investors seeking cash dividends should not purchase our common stock.
Anti-takeover provisions in our certificate of incorporation and bylaws as well as provisions of Delaware law might discourage, delay or prevent a change of control of our company or changes in our management and, therefore, may depress the trading price of our common stock.
Our amended and restated certificate of incorporation, amended and restated bylaws and Delaware law contain provisions that may have the effect of delaying or preventing a change in control of us or changes in our management. Our amended and restated certificate of incorporation and amended and restated bylaws include provisions that:
|
|
• |
create a classified board of directors whose members serve staggered three-year terms; |
|
|
• |
authorize “blank check” preferred stock, which could be issued by the Board without stockholder approval and may contain voting, liquidation, dividend, and other rights superior to our common stock; |
|
|
• |
specify that special meetings of our stockholders can be called only by the Board, the chairperson of the board, the chief executive officer or the president and that limit the ability of our stockholders to act by written consent; |
|
|
• |
establish an advance notice procedure for stockholder approvals to be brought before an annual meeting of our stockholders, including proposed nominations of persons for election to the Board; |
|
|
• |
limit the liability of, and provide indemnification to, our directors; |
|
|
• |
provide that our directors may be removed only for cause; |
|
|
• |
provide that vacancies on the Board may be filled only by a majority of directors then in office, even though less than a quorum, or by a sole remaining director; |
|
|
• |
do not provide for cumulative voting for members of the Board; |
|
|
• |
authorize the Board to modify, alter or repeal our amended and restated bylaws; and |
|
|
• |
require supermajority votes of the holders of our common stock to amend specified provisions of our charter documents. |
These provisions, alone or together, could delay or prevent hostile takeovers and changes in control or changes in our management.
44
In addition, because we are incorporated in Delaware, we are governed by the provisions of Section 203 of the Delaware General Corporation Law, which limits the ability of stockholders owning in excess of 15% of our outstanding voting stock to merge or combine with us in certain circumstances.
Any provision of our amended and restated certificate of incorporation or amended and restated bylaws or Delaware law that has the effect of delaying or deterring a change in control could limit the opportunity for our stockholders to receive a premium for their shares of our common stock, and could also affect the price that some investors are willing to pay for our common stock.
Our amended and restated bylaws provide that the Court of Chancery of the State of Delaware and the federal district courts of the United States of America will be the exclusive forums for substantially all disputes between us and our stockholders, which could limit our stockholders’ ability to obtain a favorable judicial forum for disputes with us or our directors, officers, or employees.
Our amended and restated bylaws provide that the Court of Chancery of the State of Delaware is the exclusive forum for:
|
|
• |
any derivative action or proceeding brought on our behalf; |
|
|
• |
any action asserting a breach of fiduciary duty; |
|
|
• |
any action asserting a claim against us arising under the Delaware General Corporation Law, our amended and restated certificate of incorporation, or our amended and restated bylaws; |
|
|
• |
any action to interpret, apply, enforce or determine the validity of our amended and restated certificate of incorporation or our amended and restated bylaws; and |
|
|
• |
any action asserting a claim against us that is governed by the internal-affairs doctrine. |
Our amended and restated bylaws further provides that the federal district courts of the United States of America will be the exclusive forum for resolving any complaint asserting a cause of action arising under the Securities Act.
These exclusive-forum provisions may limit a stockholder’s ability to bring a claim in a judicial forum that it finds favorable for disputes with us or our directors, officers, or other employees, which may discourage lawsuits against us and our directors, officers, and other employees. If a court were to find either exclusive-forum provision in our amended and restated bylaws to be inapplicable or unenforceable in an action, we may incur additional costs associated with resolving the dispute in other jurisdictions, which could seriously harm our business.
Item 1B. Unresolved Staff Comments.
Not applicable.
Our corporate headquarters are located in Mountain View, California, where we lease a total of, as of January 31, 2018, approximately 127,000 square feet, of which approximately 29,000 square feet are currently sublet to a third-party. The lease agreement for our Mountain View, California headquarters expires in 2022. We also lease offices in other locations in the United States and internationally in the United Kingdom, Germany, Ireland, Japan, and Singapore. We lease all of our facilities and do not own any real property. We believe that our facilities are sufficient for our current needs.
In February 2018, we terminated a lease agreement for approximately 31,000 square feet of office space located in Mountain View, California.
45
Following our initial public offering in July 2017, four class action lawsuits were filed against us. In September 2017, a class action lawsuit was filed against us and is now pending in the United States District Court for the Northern District of California under the caption Tuller v. Tintri, Inc. et al., No. 4:17-CV-05714-YGR (filed Sept. 18, 2017). A consolidated complaint has been filed in the Tuller action, which, in addition to the Company, names as defendants our then-Chief Executive Officer, our then-Chief Financial Officer, and our Chief Technology Officer, and alleges violations of Sections 11, 12(a)(2), and 15 of the Securities Act of 1933. We filed a motion to dismiss on March 30, 2018. Three substantially similar lawsuits were subsequently filed in California state court in the County of San Mateo against the same parties, as well as the then-serving members of the Board, the underwriters of our initial public offering, and entities associated with several institutional investors that invested in the Company prior to the initial public offering. These suits also allege violations of Sections 11, 12(a)(2), and 15 of the Securities Act of 1933, and are captioned Clayton v. Tintri, Inc. et al., No. 17CIV04312 (filed Sept. 20, 2017), Nurlybayev v. Tintri, Inc. et al., No. 17CIV04321 (filed Sept. 21, 2017), and Golosiy v. Tintri, Inc. et al., No. 17CIV04618 (filed Oct. 6, 2017). The actions have yet to be consolidated and a consolidated complaint has yet to be filed. All four class action lawsuits are in their initial stages and are based on similar allegations that we made false and misleading statements in the registration statement and prospectus filed with the SEC in connection with our initial public offering. Each lawsuit is purportedly brought on behalf of a putative class of all persons who purchased shares of common stock pursuant or traceable to our initial public offering, and seeks, among other things, compensatory damages and attorney’s fees and costs on behalf of the putative class.
We are generally required, to the extent permitted by law, to indemnify our current and former directors and officers who are named as defendants in these types of lawsuits. We also have certain contractual obligations to the underwriters regarding such lawsuits. While a certain amount of insurance coverage may be available for expenses or losses associated with these lawsuits, this coverage may not be sufficient. Based on information currently available, we are unable to reasonably estimate a possible loss or range of possible loss, if any, with regards to these lawsuits; therefore, no litigation reserve has been recorded in the accompanying financial statements. Although we plan to defend against these lawsuits vigorously, there can be no assurances that a favorable final outcome will be obtained. These lawsuits or future litigation may require significant attention from management and could result in significant legal expenses, settlement costs or damage awards that could have a material impact on our financial position, results of operations and cash flows.
In addition, we may, from time to time, become party to various litigation matters that arise in the ordinary course of business.
Item 4. Mine Safety Disclosures.
Not applicable.
46
Item 5. Market for Registrant’s Common Equity, Related Stockholder Matters and Issuer Purchases of Equity Securities.
Market Information for Common Stock
Our common stock began trading publicly on the NASDAQ Global Market under the ticker symbol “TNTR” on June 30, 2017. Prior to that time, there was no public market for our common stock. The following table sets forth, for the periods indicated, the high and low sale prices of our common stock as reported on the NASDAQ Global Market since our initial public offering, or IPO.
|
|
|
High |
|
|
Low |
|
||
|
Fiscal Year Ended January 31, 2018 |
|
|
|
|
|
|
|
|
|
Second Quarter (from June 30, 2017) |
|
$ |
7.27 |
|
|
$ |
6.72 |
|
|
Third Quarter |
|
$ |
6.79 |
|
|
$ |
2.85 |
|
|
Fourth Quarter |
|
$ |
6.98 |
|
|
$ |
3.68 |
|
Holders of Record
As of January 31, 2018, there were 101 holders of record of our common stock. This figure does not include a substantially greater number of “street name” holders or beneficial holders of our common stock whose shares are held of record by banks, brokers and other financial institutions.
Dividend Policy
We have never declared or paid cash dividends on our common stock. We currently intend to retain all available funds and any future earnings for use in the operation of our business and do not anticipate paying any dividends in the foreseeable future. Any future determination to declare dividends will be made at the discretion of the Board, subject to applicable laws, and will depend on our financial condition, operating results, capital requirements, general business conditions and other factors that the Board may deem relevant.
Securities Authorized for Issuance Under Equity Compensation Plans
The information required by this item is incorporated herein by reference to our definitive proxy statement for our 2018 annual meeting of stockholders, which will be filed not later than 120 days after the end of our fiscal year ended January 31, 2018.
47
The following graph shows a comparison from June 30, 2017, (the date our common stock commenced trading on the NASDAQ Global Select Market) through January 31, 2018, of the cumulative total return for our common stock, the NASDAQ Composite Index, and the NASDAQ Computer Index. The graph assumes that $100 was invested on June 30, 2017, in the common stock of Tintri, Inc., the NASDAQ Composite Index and NASDAQ Computer Index, and assumes reinvestment of any dividends. The stock price performance on the following graph is not necessarily indicative of future stock price performance.
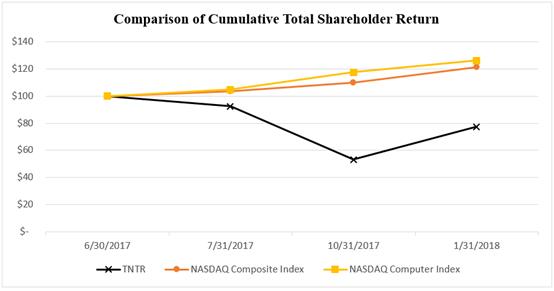
Recent Sales of Unregistered Securities and Use of Proceeds
|
|
(a) |
Unregistered Sales of Equity Securities |
None
|
|
(b) |
Use of Proceeds |
Our IPO of common stock was effected through Registration Statements on Form S-1 (File No. 333-218429), which was declared or became effective on June 29, 2017. There has been no material change in the use of proceeds from our IPO as described in our final prospectus filed with the Securities and Exchange Commission, or SEC, pursuant to Rule 424(b) of the Securities Act of 1933, as amended, or the Securities Act, and other periodic reports previously filed with the SEC.
Issuer Purchases of Equity Securities by the Issuer and Affiliated Purchasers
None.
48
Item 6. Selected Financial Data.
The following selected consolidated financial and other data should be read together with our consolidated financial statements and accompanying notes and “Management’s Discussion and Analysis of Financial Condition and Results of Operations” included elsewhere in this Annual Report on Form 10-K. The selected consolidated financial and other data in this section is not intended to replace our consolidated financial statements and the related notes. We derived the selected consolidated statements of operations data for fiscal 2016, 2017, and 2018 and the consolidated balance sheet data as of January 31, 2017 and 2018, from our audited consolidated financial statements included elsewhere in this Annual Report on Form 10-K. The selected consolidated statements of operations data for fiscal 2015 and the consolidated balance sheet data as of January 31, 2015 and 2016, are derived from our audited consolidated financial statements not included in this Annual Report on Form 10-K. Our historical results presented below are not necessarily indicative of financial results to be achieved in future periods.
|
|
|
Year Ended January 31, |
|
|||||||||||||
|
|
|
2015 |
|
|
2016 |
|
|
2017 |
|
|
2018 |
|
||||
|
|
|
(in thousands) |
|
|||||||||||||
|
Consolidated Statements of Operations Data: |
|
|
|
|
|
|
|
|
|
|
|
|
|
|
|
|
|
Revenue: |
|
|
|
|
|
|
|
|
|
|
|
|
|
|
|
|
|
Product |
|
$ |
41,420 |
|
|
$ |
68,652 |
|
|
$ |
97,330 |
|
|
$ |
90,793 |
|
|
Support and maintenance |
|
|
8,379 |
|
|
|
17,360 |
|
|
|
27,775 |
|
|
|
35,111 |
|
|
Total revenue |
|
|
49,799 |
|
|
|
86,012 |
|
|
|
125,105 |
|
|
|
125,904 |
|
|
Cost of revenue: |
|
|
|
|
|
|
|
|
|
|
|
|
|
|
|
|
|
Product(1) |
|
|
17,144 |
|
|
|
25,138 |
|
|
|
34,738 |
|
|
|
38,959 |
|
|
Support and maintenance(1) |
|
|
4,565 |
|
|
|
7,110 |
|
|
|
9,437 |
|
|
|
13,907 |
|
|
Total cost of revenue |
|
|
21,709 |
|
|
|
32,248 |
|
|
|
44,175 |
|
|
|
52,866 |
|
|
Gross profit: |
|
|
|
|
|
|
|
|
|
|
|
|
|
|
|
|
|
Product |
|
|
24,276 |
|
|
|
43,514 |
|
|
|
62,592 |
|
|
|
51,834 |
|
|
Support and maintenance |
|
|
3,814 |
|
|
|
10,250 |
|
|
|
18,338 |
|
|
|
21,204 |
|
|
Total gross profit |
|
|
28,090 |
|
|
|
53,764 |
|
|
|
80,930 |
|
|
|
73,038 |
|
|
Operating expenses: |
|
|
|
|
|
|
|
|
|
|
|
|
|
|
|
|
|
Research and development(1) |
|
|
28,155 |
|
|
|
43,179 |
|
|
|
53,445 |
|
|
|
74,120 |
|
|
Sales and marketing(1) |
|
|
55,060 |
|
|
|
87,993 |
|
|
|
108,903 |
|
|
|
112,685 |
|
|
General and administrative(1) |
|
|
13,941 |
|
|
|
18,773 |
|
|
|
19,364 |
|
|
|
34,800 |
|
|
Restructuring charges |
|
|
— |
|
|
|
— |
|
|
|
— |
|
|
|
899 |
|
|
Total operating expenses |
|
|
97,156 |
|
|
|
149,945 |
|
|
|
181,712 |
|
|
|
222,504 |
|
|
Loss from operations |
|
|
(69,066 |
) |
|
|
(96,181 |
) |
|
|
(100,782 |
) |
|
|
(149,466 |
) |
|
Other expense, net: |
|
|
|
|
|
|
|
|
|
|
|
|
|
|
|
|
|
Interest expense |
|
|
(279 |
) |
|
|
(4,407 |
) |
|
|
(5,231 |
) |
|
|
(8,448 |
) |
|
Other income, net |
|
|
(119 |
) |
|
|
254 |
|
|
|
677 |
|
|
|
733 |
|
|
Total other expense, net |
|
|
(398 |
) |
|
|
(4,153 |
) |
|
|
(4,554 |
) |
|
|
(7,715 |
) |
|
Loss before provision for income taxes |
|
|
(69,464 |
) |
|
|
(100,334 |
) |
|
|
(105,336 |
) |
|
|
(157,181 |
) |
|
Provision for income taxes |
|
|
222 |
|
|
|
634 |
|
|
|
465 |
|
|
|
478 |
|
|
Net loss |
|
$ |
(69,686 |
) |
|
$ |
(100,968 |
) |
|
$ |
(105,801 |
) |
|
$ |
(157,659 |
) |
|
Deemed dividend to Series E and E-1 Convertible Preferred Stock |
|
|
— |
|
|
|
— |
|
|
|
— |
|
|
|
(6,588 |
) |
|
Impact of adjustment to Series E, E-1 and F Convertible Preferred Stock |
|
|
— |
|
|
|
— |
|
|
|
— |
|
|
|
26,336 |
|
|
Net loss attributable to common stockholders |
|
$ |
(69,686 |
) |
|
$ |
(100,968 |
) |
|
$ |
(105,801 |
) |
|
$ |
(137,911 |
) |
|
Net loss per share attributable to common stockholders—basic and diluted |
|
$ |
(25.34 |
) |
|
$ |
(32.15 |
) |
|
$ |
(30.73 |
) |
|
$ |
(6.98 |
) |
|
Weighted-average shares used in computing net loss per share attributable to common stockholders—basic and diluted |
|
|
2,750,413 |
|
|
|
3,140,947 |
|
|
|
3,442,549 |
|
|
|
19,763,684 |
|
|
(1) |
Includes stock-based compensation expense as follows: |
49
|
|
|
Year Ended January 31, |
|
|||||||||||||
|
|
2015 |
|
|
2016 |
|
|
2017 |
|
|
2018 |
|
|||||
|
|
|
(in thousands) |
|
|||||||||||||
|
Cost of product revenue |
|
$ |
82 |
|
|
$ |
181 |
|
|
$ |
264 |
|
|
$ |
1,612 |
|
|
Cost of support and maintenance revenue |
|
|
92 |
|
|
|
176 |
|
|
|
323 |
|
|
|
1,579 |
|
|
Research and development |
|
|
1,762 |
|
|
|
2,906 |
|
|
|
5,227 |
|
|
|
21,608 |
|
|
Sales and marketing |
|
|
1,658 |
|
|
|
3,073 |
|
|
|
4,115 |
|
|
|
10,432 |
|
|
General and administrative |
|
|
1,600 |
|
|
|
3,419 |
|
|
|
3,905 |
|
|
|
16,587 |
|
|
Total stock-based compensation expense(2) |
|
$ |
5,194 |
|
|
$ |
9,755 |
|
|
$ |
13,834 |
|
|
$ |
51,818 |
|
|
(2) |
In September 2017, the Company’s board of directors approved a restructuring plan, which resulted in a $0.7 million non-cash adjustment to restructuring charges for previously recognized stock-based compensation expense related to awards that will not vest as a result of the restructuring plan. |
|
|
|
Year Ended January 31, |
|
|||||||||||||
|
|
|
2015 |
|
|
2016 |
|
|
2017 |
|
|
2018 |
|
||||
|
|
|
(in thousands) |
|
|||||||||||||
|
Consolidated Balance Sheet Data: |
|
|
|
|
|
|
|
|
|
|
|
|
|
|
|
|
|
Cash and cash equivalents |
|
|
7,639 |
|
|
|
50,716 |
|
|
|
48,048 |
|
|
|
32,281 |
|
|
Working capital |
|
|
9,128 |
|
|
|
89,683 |
|
|
|
27,110 |
|
|
|
(74,396 |
) |
|
Total assets |
|
|
65,924 |
|
|
|
158,157 |
|
|
|
104,902 |
|
|
|
76,247 |
|
|
Deferred revenue, current and non-current |
|
|
23,022 |
|
|
|
41,864 |
|
|
|
56,445 |
|
|
|
61,661 |
|
|
Long-term debt, current and non-current |
|
|
6,000 |
|
|
|
41,906 |
|
|
|
48,914 |
|
|
|
68,638 |
|
|
Convertible preferred stock |
|
|
134,371 |
|
|
|
257,141 |
|
|
|
257,141 |
|
|
|
— |
|
|
Total stockholders’ deficit |
|
|
(121,400 |
) |
|
|
(209,557 |
) |
|
|
(298,981 |
) |
|
|
(91,710 |
) |
50
Item 7. Management’s Discussion and Analysis of Financial Condition and Results of Operations.
The following discussion and analysis of our financial condition, results of operations and cash flows should be read in conjunction with the consolidated financial statements and the related notes thereto included elsewhere in this Annual Report on Form 10-K. The last day of our fiscal year is January 31. Our fiscal quarters end on April 30, July 31, October 31 and January 31. This discussion contains forward-looking statements based upon current expectations that involve risks and uncertainties. Our actual results may differ materially from those anticipated in these forward-looking statements as a result of various factors, including those set forth under “Risk Factors”, set forth in Part I, Item 1A of this Annual Report on Form 10-K. See also the section titled “Special Note Regarding Forward-Looking Statements” in this Form 10-K.
Overview
Our mission is to provide large organizations and cloud service providers with an enterprise cloud platform that offers public cloud capabilities inside their own data centers and that can also connect to public cloud services.
Enterprise cloud technology provides customers with the flexibility to easily scale workloads up and down, automation and resource pooling. Our customers use our enterprise cloud platform for a variety of workloads and use cases, including virtualized desktop infrastructure, or VDI, development and test environments, or DevOps, which are sometimes referred to as Continuous Integration Continuous Delivery, or CI/CD, and other virtualized workloads, including virtualized servers, databases, and mixed workloads. Organizations use our platform to build agile development environments, run mission-critical enterprise applications and connect with public cloud services. We enable users to guarantee the performance of their organization’s applications, automate common IT tasks to reduce operating expenses, troubleshoot across compute, storage and network, predict their organization’s needs to scale, and provide needed elasticity on demand. Our platform enables organizations to easily scale to support tens of thousands of virtual machines on a single system across multiple hypervisors and containers and to connect to public cloud environments.
Our solution helps our customers optimize infrastructure by significantly simplifying deployment and operations, which can lead to substantial reductions in capital expenditures and operating expenses. We sell many of our software products separately from our core enterprise cloud platform solution, enabling our customers to tailor their infrastructure to their specific needs.
Our product revenue, which is generally recognized upon shipment, is derived from sales of our all-flash and hybrid storage systems and stand-alone software licenses for use in connection with our systems. While purchasing support is not mandatory, substantially all products shipped have been purchased together with a support contract, which includes software patches, bug fixes, updates, upgrades, hardware repair and replacement parts, and technical support. Support and maintenance revenue is recognized over the term of the support contracts. To date, substantially all of our customers have either renewed their support and maintenance subscriptions or have purchased new support and maintenance subscriptions together with replacement products. The average length of our support and maintenance contracts is approximately two years.
We sell our products predominantly through the joint sales efforts of our global sales force and channel partners. Our channel partners are further supported by our distributors, who work together on a non-exclusive basis to market our products, identify and close sales opportunities and provide pre-sales and post-sales services to our customers. Our joint sales approach with our channel partners provides us with expanded and efficient reach. Our channel partners typically place orders with us upon receiving an order from a customer and do not stock inventory. Our typical fulfillment time on an order is approximately three days, and consequently we do not have a meaningful backlog at any point in time.
We focus on acquiring large organizations and CSPs as customers and maximizing the lifetime value of a customer through a land-and-expand strategy. Our solution is designed to integrate easily into a customer’s existing infrastructure, which facilitates easier and faster adoption. Once our products have been deployed in a given environment, we are generally able to expand our footprint quickly through sales of additional systems and stand-alone software products.
51
Revenue increased from $86.0 million in fiscal 2016 to $125.1 million in fiscal 2017, and to $125.9 million in fiscal 2018, representing year-over-year growth of 45% and 1%, respectively. Revenue increased $14.8 million in the first half of fiscal 2018 compared to the first half of fiscal 2017, which was offset by a $14.0 million decrease in revenue in the second half of fiscal 2018 compared to the second half of fiscal 2017. Revenue remained substantially unchanged in fiscal 2018 in part due to delayed and reduced purchases of our products as a result of customer concerns about our financial condition, as well as a shift in our product mix toward lower-priced products, offset by increased support and maintenance revenue from our growing installed customer base. Our net loss was $101.0 million, $105.8 million, and $157.7 million in fiscal 2016, 2017, and 2018, respectively. Total assets decreased from $158.1 million as of the end of fiscal 2016 to $104.9 million as of the end of fiscal 2017, and to $76.2 million as of the end of fiscal 2018, representing year-over-year changes of 34% and 27%, respectively.
In July 2017, we completed our IPO of common stock, in which we sold 8,572,000 shares of common stock. The shares were sold at the IPO price of $7.00 per share for net proceeds of $55.8 million, after deducting underwriting discounts and commissions of $4.2 million. Following the completion of the IPO, our IPO underwriters exercised an over-allotment option to purchase an additional 1,000,000 shares of common stock from us in August 2017. The additional shares were sold at the IPO price of $7.00 per share for net proceeds of $6.5 million, after deducting underwriting discounts and commissions of $0.5 million.
In February and March 2018, we issued an aggregate of $25.0 million of convertible promissory notes under the Note Purchase Agreement, which have an interest rate of 8% per annum and will mature 18 months from the date of issuance.
As of January 31, 2018, we were not in compliance with certain covenants contained in our credit facility with SVB. In March 2018, we entered into a Waiver and Tenth Amendment to Loan and Security Agreement, or Tenth Amendment, with SVB, pursuant to which the parties agreed to certain amendments and modifications to our line of credit. The Tenth Amendment provides that the interest rate on amounts outstanding under the Loan Agreement shall be equal to the prime rate plus 1.85% per annum through March 31, 2018, in exchange for the waiver by SVB with respect to certain prior events of default, in each case subject to the terms and conditions set forth in the Tenth Amendment.
In April 2018, we entered into an amended and restated loan agreement with SVB to, among other things, extend the maturity date of our credit facility. Under the amended agreement, we may borrow, through May 2, 2019, up to $12.5 million dependent upon our monthly accounts receivables balances, subject to the terms and conditions of the agreement. The $5.0 million non-formula facility previously included in our SVB revolving line of credit terminated in May 2018. Our revolving line of credit with SVB contains certain financial covenants, including a covenant that we achieve total revenues of at least $20.5 million, $23.4 million, $26.3 million and $29.4 million for our fiscal quarters ending April 30, 2018, July 31, 2018, October 31, 2018 and January 31, 2019, respectively, and a covenant that we maintain a minimum level of cash and availability under the SVB line of credit of at least $15.0 million through July 31, 2018 and at least $10.0 million thereafter.
In April 2018, we also entered into an amendment with TriplePoint to extend the maturity date of our credit facility to August 2019. Pursuant to the amended terms, of the $50.0 million outstanding under this facility, $15.0 million will bear interest at 10.5% per year and $35.0 million will bear interest at 12.75% per year. The $50.0 million principal amount will become due in August 2019; provided, however, that if we, on or before August 2019, prepay a minimum of $25.0 million of the total amount outstanding under this facility, the maturity date for the then remaining principal balance will be extended to February 2021, subject to us making equal monthly amortizing payments of principal and interest through the extended maturity date. Certain end-of-term payments will become payable upon the maturity of this indebtedness and certain other fees will become payable in connection with this indebtedness upon the occurrence of a change of control of the company.
Based on our current forecasts, it is probable that we will be unable to comply with our financial covenants through January 31, 2019, and will likely fail to comply with our minimum liquidity covenants as early as May 31, 2018. Although we are seeking to raise additional debt or equity financing in order to remain in compliance with the financial covenants under our credit facilities, we may be unable to do so. As a result, we are currently undertaking a review of the potential business alternatives in addition to seeking additional capital, which many include restructuring or refinancing our indebtedness, undertaking additional restructuring plans, reducing or delaying capital expenditures, filing for bankruptcy protection, winding down our business, or selling our business or certain of our assets or operations.
52
In September 2017, we announced a restructuring and reduction in force plan of a little more than 10% of our global workforce and was substantially completed in the third quarter of fiscal 2018, which ended on October 31, 2017. In February 2018, we terminated our lease of certain office space located at 205 Ravendale Drive, Mountain View, California. In March 2018, we announced a restructuring and reduction in force plan of approximately 20% of our global workforce. We expect to substantially complete the restructuring in our first quarter of fiscal 2019, which ended on April 30, 2018. These restructuring plans are part of an overall plan to seek to drive efficiencies in our sales organization and other business units. We believe that further such reductions are likely to be required in the near term dependent on developments in our financial condition.
In December 2017, we announced that we were in the process of considering strategic options to deliver value to our stockholders, and had retained investment bank advisors to assist us in this process.
In March 2018, we announced that the Board had named Tom Barton as Chief Executive Officer and as a member of the Board, and his appointment became effective on April 2, 2018. Ken Klein transitioned from his role as our Chief Executive Officer and as a member of the Board in connection with Mr. Barton’s joining the Company. On May 15, 2018, we also appointed Tom Barton as interim Chief Financial Officer.
Key Financial and Operational Metrics
|
|
|
Year Ended January 31, |
|
|||||||||
|
|
|
2016 |
|
|
2017 |
|
|
2018 |
|
|||
|
|
|
(in thousands, except percentages) |
|
|||||||||
|
Total revenue |
|
$ |
86,012 |
|
|
$ |
125,105 |
|
|
$ |
125,904 |
|
|
Period-over-period percentage increase |
|
|
73 |
% |
|
|
45 |
% |
|
|
1 |
% |
|
Gross margin |
|
|
63 |
% |
|
|
65 |
% |
|
|
58 |
% |
|
Deferred revenue, current and non-current |
|
$ |
41,864 |
|
|
$ |
56,445 |
|
|
$ |
61,661 |
|
|
Net cash used in operating activities |
|
$ |
(62,109 |
) |
|
$ |
(70,366 |
) |
|
$ |
(91,860 |
) |
|
Net cash provided by (used in) investing activities |
|
$ |
(56,409 |
) |
|
$ |
58,334 |
|
|
$ |
(6,415 |
) |
|
Net cash provided by (used in) financing activities |
|
$ |
161,597 |
|
|
$ |
9,425 |
|
|
$ |
82,550 |
|
|
Free cash flow as a percentage of total revenue |
|
|
(85 |
)% |
|
|
(60 |
)% |
|
|
(78 |
)% |
|
Total customers |
|
|
928 |
|
|
|
1,273 |
|
|
|
1,543 |
|
The above key financial and operational metrics:
|
|
• |
help us evaluate our growth and operational efficiencies, measure our performance and identify trends in our sales activity; |
|
|
• |
provide a useful measure for period-to-period comparisons of our core business; |
|
|
• |
are often used by investors and other parties in understanding and evaluating companies in our industry as a measure of financial performance; and |
|
|
• |
are used by management to prepare and approve our annual budget and to develop short-term and long-term operational and compensation plans, as well as to assess the extent of achievement of goals. |
Deferred Revenue
Our deferred revenue consists of amounts that have been invoiced but that have not yet been recognized as revenue as of the period end. The majority of our deferred revenue balance consists of support and maintenance revenue that is recognized ratably over the contractual service period. These service periods range from one to five years and, as of January 31, 2018, averaged approximately two years.
53
Free Cash Flow as a Percentage of Total Revenue
Free cash flow as a percentage of total revenue is a non-GAAP financial measure we calculate by dividing free cash flow by total revenue. We define free cash flow, a non-GAAP financial measure, as cash used in operating activities less purchase of property and equipment. We have included free cash flow as a percentage of total revenue because it is a key measure used by our management and board of directors to understand and evaluate our free cash flow in relation to our revenue growth. In addition, we consider free cash flow to be a liquidity measure that provides useful information to management and investors about the amount of cash generated by the business that, after the purchases of property and equipment, can be used for investing in our business, making strategic acquisitions and strengthening the balance sheet. A limitation of the utility of free cash flow as a measure of our financial performance and liquidity is that it does not represent the total increase or decrease in our cash balance for the period. In addition, other companies, including companies in our industry, may not use free cash flow, may calculate free cash flow in a different manner than we do, or may use other financial measures to evaluate their performance, all of which could reduce the usefulness of free cash flow as a comparative measure. A reconciliation of free cash flow to cash flow used in operating activities, the most directly comparable financial measure calculated and presented in accordance with GAAP, is provided below:
|
|
|
Year Ended January 31, |
|
|||||||||
|
|
|
2016 |
|
|
2017 |
|
|
2018 |
|
|||
|
|
|
(in thousands, except percentages) |
|
|||||||||
|
Net cash used in operating activities |
|
$ |
(62,109 |
) |
|
$ |
(70,366 |
) |
|
$ |
(91,860 |
) |
|
Less: purchase of property and equipment |
|
$ |
(10,914 |
) |
|
$ |
(4,337 |
) |
|
$ |
(6,415 |
) |
|
Free cash flow |
|
$ |
(73,023 |
) |
|
$ |
(74,703 |
) |
|
$ |
(98,275 |
) |
|
Total revenue |
|
$ |
86,012 |
|
|
$ |
125,105 |
|
|
$ |
125,904 |
|
|
Free cash flow as a percentage of total revenue |
|
|
(85 |
)% |
|
|
(60 |
)% |
|
|
(78 |
)% |
|
Net cash provided by (used in) investing activities |
|
$ |
(56,409 |
) |
|
$ |
58,334 |
|
|
$ |
(6,415 |
) |
|
Net cash provided by financing activities |
|
$ |
161,597 |
|
|
$ |
9,425 |
|
|
$ |
82,550 |
|
Total Customers
We define a customer as an end-user that has purchased one or more of our products either from one of our channel partners or from us directly. In situations where there are purchases by multiple subsidiaries or divisions, universities or governmental organizations affiliated with a single entity, each separate buying unit within an enterprise is counted as representing a separate customer. We do not include our channel partners or distributors in our definition of a customer.
Components of Our Operating Results
Revenue
Product Revenue. We generate product revenue from sales of enterprise cloud platform products, which consists of our VMstore systems, and stand-alone software licenses for use in connection with our VMstore systems. Provided that all other revenue recognition criteria have been met, we typically recognize revenue for VMstores and perpetual software licenses upon shipment, as title and risk of loss are transferred to our channel partners or customers at that time. Sales of our VMstore systems represented over half of our revenue for fiscal 2017 and fiscal 2018. Revenue from stand-alone software licenses represents an increasingly significant part of our business. Our product revenue may vary from period to period based on, among other things, the timing, size and mix of orders and the impact of significant transactions.
Support and Maintenance Revenue. We generate our support and maintenance revenue from support contracts related to our product sales as well as renewals of support contracts, and, to a small extent, from installation services and training. Substantially all of our product sales include support contracts. The length of these contracts ranges from one to five years, and as of January 31, 2018, averaged approximately two years. We recognize revenue from support contracts over the contractual service period. We also recognize revenue related to installation services and training upon delivery or completion of performance, although this revenue has been, and is expected to remain, insignificant.
For additional information, please see “Critical Accounting Policies and Estimates—Revenue Recognition.”
54
Cost of Product Revenue. Cost of product revenue primarily includes costs paid to our third-party contract manufacturer for components, assembly and testing, as well as personnel costs in our operations organization. Personnel costs consist of salaries, stock-based compensation, benefits and bonuses. Our cost of product revenue also includes other inventory related expenses such as inventory write-offs, purchase price variances, component and manufacturing cost revisions, freight and overhead costs. Overhead costs consist of certain facilities, depreciation and IT costs. We expect our cost of product revenue to increase on an absolute basis as our product revenue increases. In the fourth quarter of fiscal 2018, we observed increases in DRAM pricing and to a lesser extent flash pricing, which had a negative impact on our product gross margins. We expect flash pricing to stabilize but DRAM pricing to continue to increase over the near to mid-term.
Cost of Support and Maintenance Revenue. Cost of support and maintenance revenue primarily includes personnel costs associated with our global customer support organization, operation and administration of our third-party service inventory depots, which are physical warehouse locations that hold service inventory in support of our customer support agreements, overhead costs and costs to fulfill our service inventory obligations. We expect our cost of support and maintenance revenue to increase on an absolute basis as our installed customer base grows.
Gross Margin
Gross margin is gross profit as a percentage of revenue, and gross profit is revenue less cost of revenue. Gross margin has been and will continue to be affected by a variety of factors, including the average sales price of our products, manufacturing and inventory-related costs, the mix of products sold and the mix of revenue between products and support and maintenance. Our gross margins may fluctuate over time depending on the factors described above.
Operating Expenses
Research and Development. Research and development expense consists primarily of personnel costs, as well as other direct and overhead costs. We have devoted our product development efforts primarily to enhancing the functionality and expanding the capabilities of our products. To date, we have expensed all research and development costs as incurred.
Sales and Marketing. Sales and marketing expense consists primarily of personnel costs. Sales and marketing expense also includes sales commission costs, costs for promotional activities and other marketing costs, travel costs and overhead costs. We expense sales commission costs as incurred. Upon adoption of the new revenue recognition accounting standard in fiscal 2019, sales commission costs will be required to be deferred and subsequently amortized on a systematic basis that is consistent with the pattern of revenue recognition of the related performance obligation.
General and Administrative. General and administrative expense consists primarily of personnel costs. The general and administrative function includes our executive, finance, human resources, IT, facilities and legal organizations. General and administrative expense also includes outside professional services, which consists primarily of accounting, legal, IT, other consulting costs and overhead costs.
Restructuring Charges. In September 2017, our board of directors approved a restructuring and reduction in force plan of a little more than 10% of our global workforce. The restructuring is part of an overall plan to seek to drive efficiencies in our sales organization and other business units. Restructuring charges consist primarily of severance costs.
Other Expense, Net
Other expense, net consists of interest expense and other income, net.
55
Interest expense is associated with interest on our debt obligations, as well as amortization of deferred credit facility fees, debt issuance costs and debt discounts in relation to our credit facility and loan obligation. Other income, net consists primarily of gain (loss) on revaluation of convertible preferred stock warrants, interest income from our cash and cash equivalents, and gain (loss) from remeasurement of foreign currency-denominated balances.
Provision for Income Taxes
Provision for income taxes consists primarily of income taxes in certain foreign jurisdictions in which we conduct business, and state income taxes in the United States. We provide a full valuation allowance for U.S. deferred tax assets, which resulted from net operating loss, carryforwards and tax credits related primarily to research and development. We expect to maintain this full valuation allowance for the foreseeable future as it is more likely than not that the assets will not be realized based on our history of losses.
Results of Operations
The following tables summarize our consolidated results of operations for the periods presented and as a percentage of our total revenue for those periods. The period-to-period comparison of results is not necessarily indicative of results for future periods.
|
|
|
Year Ended January 31, |
|
|||||||||
|
|
2016 |
|
|
2017 |
|
|
2018 |
|
||||
|
|
|
(in thousands) |
|
|||||||||
|
Consolidated Statements of Operations Data: |
|
|
|
|
|
|
|
|
|
|
|
|
|
Revenue: |
|
|
|
|
|
|
|
|
|
|
|
|
|
Product |
|
$ |
68,652 |
|
|
$ |
97,330 |
|
|
$ |
90,793 |
|
|
Support and maintenance |
|
|
17,360 |
|
|
|
27,775 |
|
|
|
35,111 |
|
|
Total revenue |
|
|
86,012 |
|
|
|
125,105 |
|
|
|
125,904 |
|
|
Cost of revenue: |
|
|
|
|
|
|
|
|
|
|
|
|
|
Product(1) |
|
|
25,138 |
|
|
|
34,738 |
|
|
|
38,959 |
|
|
Support and maintenance(1) |
|
|
7,110 |
|
|
|
9,437 |
|
|
|
13,907 |
|
|
Total cost of revenue |
|
|
32,248 |
|
|
|
44,175 |
|
|
|
52,866 |
|
|
Gross profit: |
|
|
|
|
|
|
|
|
|
|
|
|
|
Product |
|
|
43,514 |
|
|
|
62,592 |
|
|
|
51,834 |
|
|
Support and maintenance |
|
|
10,250 |
|
|
|
18,338 |
|
|
|
21,204 |
|
|
Total gross profit |
|
|
53,764 |
|
|
|
80,930 |
|
|
|
73,038 |
|
|
Operating expenses: |
|
|
|
|
|
|
|
|
|
|
|
|
|
Research and development(1) |
|
|
43,179 |
|
|
|
53,445 |
|
|
|
74,120 |
|
|
Sales and marketing(1) |
|
|
87,993 |
|
|
|
108,903 |
|
|
|
112,685 |
|
|
General and administrative(1) |
|
|
18,773 |
|
|
|
19,364 |
|
|
|
34,800 |
|
|
Restructuring charges |
|
|
— |
|
|
|
— |
|
|
|
899 |
|
|
Total operating expenses |
|
|
149,945 |
|
|
|
181,712 |
|
|
|
222,504 |
|
|
Loss from operations |
|
|
(96,181 |
) |
|
|
(100,782 |
) |
|
|
(149,466 |
) |
|
Other expense, net: |
|
|
|
|
|
|
|
|
|
|
|
|
|
Interest expense |
|
|
(4,407 |
) |
|
|
(5,231 |
) |
|
|
(8,448 |
) |
|
Other income, net |
|
|
254 |
|
|
|
677 |
|
|
|
733 |
|
|
Total other expense, net |
|
|
(4,153 |
) |
|
|
(4,554 |
) |
|
|
(7,715 |
) |
|
Loss before provision for income taxes |
|
|
(100,334 |
) |
|
|
(105,336 |
) |
|
|
(157,181 |
) |
|
Provision for income taxes |
|
|
634 |
|
|
|
465 |
|
|
|
478 |
|
|
Net loss |
|
$ |
(100,968 |
) |
|
$ |
(105,801 |
) |
|
$ |
(157,659 |
) |
|
(1) |
Includes stock-based compensation expense as follows: |
56
|
|
|
Year Ended January 31, |
|
|||||||||
|
|
2016 |
|
|
2017 |
|
|
2018 |
|
||||
|
|
|
(in thousands) |
|
|||||||||
|
Cost of product revenue |
|
$ |
181 |
|
|
$ |
264 |
|
|
$ |
1,612 |
|
|
Cost of support and maintenance revenue |
|
|
176 |
|
|
|
323 |
|
|
|
1,579 |
|
|
Research and development |
|
|
2,906 |
|
|
|
5,227 |
|
|
|
21,608 |
|
|
Sales and marketing |
|
|
3,073 |
|
|
|
4,115 |
|
|
|
10,432 |
|
|
General and administrative |
|
|
3,419 |
|
|
|
3,905 |
|
|
|
16,587 |
|
|
Total stock-based compensation expense(2) |
|
$ |
9,755 |
|
|
$ |
13,834 |
|
|
$ |
51,818 |
|
|
(2) |
In September 2017, our board of directors approved a restructuring plan, which resulted in a $0.7 million non-cash adjustment to restructuring charges for previously recognized stock-based compensation expense related to awards that will not vest as a result of the restructuring plan. |
|
|
|
Year Ended January 31, |
|
|||||||||
|
|
|
2016 |
|
|
2017 |
|
|
2018 |
|
|||
|
Percentage of Revenue Data: |
|
|
|
|
|
|
|
|
|
|
|
|
|
Revenue: |
|
|
|
|
|
|
|
|
|
|
|
|
|
Product |
|
|
80 |
% |
|
|
78 |
% |
|
|
72 |
% |
|
Support and maintenance |
|
|
20 |
|
|
|
22 |
|
|
|
28 |
|
|
Total revenue |
|
|
100 |
|
|
|
100 |
|
|
|
100 |
|
|
Total cost of revenue |
|
|
37 |
|
|
|
35 |
|
|
|
42 |
|
|
Total gross profit |
|
|
63 |
|
|
|
65 |
|
|
|
58 |
|
|
Operating expenses: |
|
|
|
|
|
|
|
|
|
|
|
|
|
Research and development |
|
|
50 |
|
|
|
43 |
|
|
|
59 |
|
|
Sales and marketing |
|
|
102 |
|
|
|
87 |
|
|
|
90 |
|
|
General and administrative |
|
|
22 |
|
|
|
16 |
|
|
|
27 |
|
|
Restructuring charges |
|
|
— |
|
|
|
— |
|
|
|
1 |
|
|
Total operating expenses |
|
|
174 |
|
|
|
146 |
|
|
|
177 |
|
|
Loss from operations |
|
|
(111 |
) |
|
|
(81 |
) |
|
|
(119 |
) |
|
Other expense, net: |
|
|
|
|
|
|
|
|
|
|
|
|
|
Interest expense |
|
|
(5 |
) |
|
|
(4 |
) |
|
|
(7 |
) |
|
Other income, net |
|
|
— |
|
|
|
1 |
|
|
|
1 |
|
|
Total other expense, net |
|
|
(5 |
) |
|
|
(3 |
) |
|
|
(6 |
) |
|
Loss before provision for income taxes |
|
|
(116 |
) |
|
|
(84 |
) |
|
|
(125 |
) |
|
Provision for income taxes |
|
|
1 |
|
|
|
1 |
|
|
|
— |
|
|
Net loss |
|
|
(117 |
)% |
|
|
(85 |
)% |
|
|
(125 |
)% |
Revenue by Geographic Region
|
|
|
Year Ended January 31, |
|
|||||||||
|
|
2016 |
|
|
2017 |
|
|
2018 |
|
||||
|
|
|
(in thousands) |
|
|||||||||
|
United States |
|
$ |
60,300 |
|
|
$ |
87,519 |
|
|
$ |
91,324 |
|
|
EMEA |
|
|
13,712 |
|
|
|
18,207 |
|
|
|
19,256 |
|
|
Rest of the World |
|
|
12,000 |
|
|
|
19,379 |
|
|
|
15,324 |
|
|
Total |
|
$ |
86,012 |
|
|
$ |
125,105 |
|
|
$ |
125,904 |
|
57
Comparison of the Fiscal Years Ended January 31, 2017 and 2018
Revenue
|
|
|
Year Ended January 31, |
|
|
Change |
|
||||||||||
|
|
2017 |
|
|
2018 |
|
|
$ |
|
|
% |
|
|||||
|
|
|
(in thousands, except percentages) |
|
|||||||||||||
|
Revenue: |
|
|
|
|
|
|
|
|
|
|
|
|
|
|
|
|
|
Product |
|
$ |
97,330 |
|
|
$ |
90,793 |
|
|
$ |
(6,537 |
) |
|
|
(7 |
)% |
|
Support and maintenance |
|
|
27,775 |
|
|
|
35,111 |
|
|
|
7,336 |
|
|
|
26 |
% |
|
Total |
|
$ |
125,105 |
|
|
$ |
125,904 |
|
|
$ |
799 |
|
|
|
1 |
% |
Total revenue increased by $0.8 million, or 1%, from $125.1 million in fiscal 2017 to $125.9 million in fiscal 2018.
Product revenue decreased by $6.5 million, or 7%, from $97.3 million in fiscal 2017 to $90.8 million in fiscal 2018. The decrease in product revenue was primarily driven by lower volume of sales of our products, in part, we believe, due to delayed and reduced purchases of our products as a result of customer concerns about our financial condition, as well as a shift in our product mix toward lower priced products. We sold 10% fewer VMstores during fiscal 2018 as compared to fiscal 2017. This was partially offset by an increase in our stand-alone software license revenue of $0.3 million, or 2%, from $14.3 million in fiscal 2017 to $14.6 million in fiscal 2018.
Support and maintenance revenue increased by $7.3 million, or 26%, from $27.8 million in fiscal 2017 to $35.1 million in fiscal 2018. The increase in support and maintenance revenue reflects the increase in our installed customer base with support contracts, which is recognized as revenue over the contractual service period.
Cost of Revenue and Gross Margin
|
|
|
Year Ended January 31, |
|
|
Change |
|
||||||||||
|
|
2017 |
|
|
2018 |
|
|
$ |
|
|
% |
|
|||||
|
|
|
(in thousands, except percentages) |
|
|||||||||||||
|
Cost of Revenue: |
|
|
|
|
|
|
|
|
|
|
|
|
|
|
|
|
|
Product |
|
$ |
34,738 |
|
|
$ |
38,959 |
|
|
$ |
4,221 |
|
|
|
12 |
% |
|
Support and maintenance |
|
|
9,437 |
|
|
|
13,907 |
|
|
|
4,470 |
|
|
|
47 |
% |
|
Total |
|
$ |
44,175 |
|
|
$ |
52,866 |
|
|
$ |
8,691 |
|
|
|
20 |
% |
|
Gross margin |
|
|
65 |
% |
|
|
58 |
% |
|
|
|
|
|
|
|
|
|
Gross margin, product |
|
|
64 |
% |
|
|
57 |
% |
|
|
|
|
|
|
|
|
|
Gross margin, support and maintenance |
|
|
66 |
% |
|
|
60 |
% |
|
|
|
|
|
|
|
|
Total cost of revenue increased by $8.7 million, or 20%, from $44.2 million in fiscal 2017 to $52.9 million in fiscal 2018.
Cost of product revenue increased by $4.2 million, or 12%, from $34.7 million in fiscal 2017 to $39.0 million in fiscal 2018. The increase was a result of a shift in our product mix towards a greater proportion of higher cost all-flash systems. The increase in cost of product revenue was also partially driven by higher costs in our operations organization related to an increase in personnel costs of $1.7 million. The increase in personnel costs was attributable to a $0.9 million increase in stock-based compensation expense primarily driven by cumulative and subsequent expensing of PSUs for which satisfaction of the performance conditions became probable upon the completion of our IPO, expensing of PSUs granted subsequent to our IPO, and repricing of outstanding and unexercised stock options held by current service providers with an exercise price in excess of $13.68 per share (each, an Eligible Option) in May 2017, and a $0.8 million increase in other personnel costs due to a 12% increase in average headcount.
58
Cost of support and maintenance revenue increased by $4.5 million, or 47%, from $9.4 million in fiscal 2017 to $13.9 million in fiscal 2018. The increase in cost of support and maintenance revenue was primarily driven by higher costs in our global customer support organization related to an increase in personnel costs of $2.4 million. The increase in personnel costs was attributable to a $1.3 million increase in stock-based compensation expense primarily driven by cumulative and subsequent expensing of PSUs for which satisfaction of the performance conditions became probable upon the completion of our IPO, expensing of PSUs granted subsequent to our IPO, and repricing of Eligible Options, and a $1.1 million increase in other personnel costs due to a 21% increase in average headcount. The increase in cost of support and maintenance revenue is also a result of a $0.6 million increase in overhead costs and costs to administer and operate our third-party service inventory depots, and a $1.5 million increase in other costs in support of our customer support agreements, all of which were driven primarily by the increase in our customer base.
Gross margin decreased from 65% in fiscal 2017 to 58% in fiscal 2018.
Product gross margin decreased from 64% in fiscal 2017 to 57% in fiscal 2018. The decrease in product gross margin was primarily a result of shifts in our product mix toward lower-priced products and a greater proportion of higher cost all-flash systems, as well as higher costs for certain components period over period.
Support and maintenance gross margin decreased from 66% in fiscal 2017 to 60% in fiscal 2018. This is primarily due to our continued investment in scaling our global customer support organization in response to our increased installed customer base.
Operating Expenses
Research and Development
|
|
|
Year Ended January 31, |
|
|
Change |
|
||||||||||
|
|
2017 |
|
|
2018 |
|
|
$ |
|
|
% |
|
|||||
|
|
|
(in thousands, except percentages) |
|
|||||||||||||
|
Research and development |
|
$ |
53,445 |
|
|
$ |
74,120 |
|
|
$ |
20,675 |
|
|
|
39 |
% |
Research and development expense increased by $20.7 million, or 39%, from $53.4 million in fiscal 2017 to $74.1 million in fiscal 2018. The increase in research and development expense was primarily due to an increase in personnel costs of $20.7 million. The increase in personnel costs was attributable to a $16.4 million increase in stock-based compensation expense primarily driven by cumulative and subsequent expensing of PSUs for which satisfaction of the performance conditions became probable upon the completion of our IPO, expensing of PSUs granted subsequent to our IPO, and repricing of Eligible Options, and a $4.3 million increase in other personnel costs due to a 2% increase in average headcount. In addition, outside services and other research and development costs increased by $1.1 million and $1.2 million, respectively, as we continued to expand our research and development effort. This was offset by a $2.4 million decrease in prototype equipment due to timing of new product line development.
Sales and Marketing
|
|
|
Year Ended January 31, |
|
|
Change |
|
||||||||||
|
|
2017 |
|
|
2018 |
|
|
$ |
|
|
% |
|
|||||
|
|
|
(in thousands, except percentages) |
|
|||||||||||||
|
Sales and marketing |
|
$ |
108,903 |
|
|
$ |
112,685 |
|
|
$ |
3,782 |
|
|
|
3 |
% |
Sales and marketing expense increased by $3.8 million, or 3%, from $108.9 million in fiscal 2017 to $112.7 million in fiscal 2018. The increase in sales and marketing expense was primarily due to an increase in personnel costs of $6.9 million. The increase in personnel costs was attributable to a $6.3 million increase stock-based compensation expense primarily driven by cumulative and subsequent expensing of PSUs for which satisfaction of the performance conditions became probable upon the completion of our IPO, expensing of PSUs granted subsequent to our IPO, and repricing of Eligible Options. Further, as part of our efforts to penetrate and expand in global markets, the cost of our marketing activities, including field events, advertising, tradeshows, brand
59
awareness, demand generation and other expenses, collectively accounted for $2.0 million of the increase. This was offset by a decrease in sales commission and travel expenses of $3.8 million due to our efforts to align our sales and marketing initiatives with revenue, and a decrease in depreciation of $1.5 million due to certain sales demonstration equipment reaching the end of the product life cycle.
General and Administrative
|
|
|
Year Ended January 31, |
|
|
Change |
|
||||||||||
|
|
2017 |
|
|
2018 |
|
|
$ |
|
|
% |
|
|||||
|
|
|
(in thousands, except percentages) |
|
|||||||||||||
|
General and administrative |
|
$ |
19,364 |
|
|
$ |
34,800 |
|
|
$ |
15,436 |
|
|
|
80 |
% |
General and administrative expense increased by $15.4 million, or 80%, from $19.4 million in fiscal 2017 to $34.8 million in fiscal 2018. The increase in general and administrative expense was primarily due to an increase in personnel costs of $13.3 million of which $12.7 million of the increase was related to stock-based compensation expense primarily driven by cumulative and subsequent expensing of PSUs for which satisfaction of the performance conditions became probable upon the completion of our IPO, expensing of PSUs granted subsequent to our IPO, and repricing of Eligible Options. In addition, professional services expenses increased by $2.2 million to support our operations as a public company.
Restructuring Charges
|
|
|
Year Ended January 31, |
|
|
Change |
|||||||||
|
|
2017 |
|
|
2018 |
|
|
$ |
|
|
% |
||||
|
|
|
(in thousands, except percentages) |
||||||||||||
|
Restructuring charges |
|
$ |
— |
|
|
$ |
899 |
|
|
$ |
899 |
|
|
NM |
In September 2017, our board of directors approved a restructuring and reduction in force plan of a little more than 10% of our global workforce. The restructuring is part of an overall plan to seek to drive efficiencies in our sales organization and other business units. Restructuring charges consist primarily of severance costs. See Note 12 of our audited consolidated financial statements included elsewhere in this Annual Report on Form 10-K for further details. As of January 31, 2018, the September 2017 restructuring plan has been substantially completed.
Other Expense, Net
|
|
|
Year Ended January 31, |
|
|
Change |
|
||||||||||
|
|
2017 |
|
|
2018 |
|
|
$ |
|
|
% |
|
|||||
|
|
|
(in thousands, except percentages) |
|
|||||||||||||
|
Other expense, net: |
|
|
|
|
|
|
|
|
|
|
|
|
|
|
|
|
|
Interest expense |
|
$ |
(5,231 |
) |
|
$ |
(8,448 |
) |
|
$ |
(3,217 |
) |
|
|
61 |
% |
|
Other income, net |
|
$ |
677 |
|
|
$ |
733 |
|
|
$ |
56 |
|
|
|
8 |
% |
Other expense, net increased by $3.2 million, or 69%, from $4.6 million in fiscal 2017 to $7.7 million in fiscal 2018.
Interest expense increased by $3.2 million, or 61%, from $5.2 million in fiscal 2017 to $8.4 million in fiscal 2018. The increase in interest expense was due to increased borrowings under our credit facilities and revolving line of credit and increased amortization of debt issuance cost and debt discounts in relation to our loan obligations.
Other income, net was $0.7 million in fiscal 2017 and remained substantially unchanged in fiscal 2018.
60
|
|
|
Year Ended January 31, |
|
|
Change |
|
||||||||||
|
|
2017 |
|
|
2018 |
|
|
$ |
|
|
% |
|
|||||
|
|
|
(in thousands, except percentages) |
|
|||||||||||||
|
Provision for income taxes |
|
$ |
465 |
|
|
$ |
478 |
|
|
$ |
13 |
|
|
|
3 |
% |
Provision for income taxes was $0.5 million in fiscal 2017 and remained substantially unchanged in fiscal 2018.
Comparison of the Fiscal Years Ended January 31, 2016 and 2017
Revenue
|
|
Year Ended January 31, |
|
|
Change |
|
|||||||||||
|
|
|
2016 |
|
|
2017 |
|
|
$ |
|
|
% |
|
||||
|
|
|
(in thousands, except percentages) |
|
|||||||||||||
|
Revenue: |
|
|
|
|
|
|
|
|
|
|
|
|
|
|
|
|
|
Product |
|
$ |
68,652 |
|
|
$ |
97,330 |
|
|
$ |
28,678 |
|
|
|
42 |
% |
|
Support and maintenance |
|
|
17,360 |
|
|
|
27,775 |
|
|
|
10,415 |
|
|
|
60 |
% |
|
Total |
|
$ |
86,012 |
|
|
$ |
125,105 |
|
|
$ |
39,093 |
|
|
|
45 |
% |
Total revenue increased by $39.1 million, or 45%, from $86.0 million fiscal 2016 to $125.1 million in fiscal 2017.
Product revenue increased by $28.6 million, or 42%, from $68.7 million in fiscal 2016 to $97.3 million in fiscal 2017. The increase in product revenue was primarily driven by higher volume of sales of our products. Our customer count grew from 928 as of January 31, 2016, to 1,273 as of January 31, 2017. We sold 23% more VMstores during fiscal 2017 as compared to fiscal 2016. Our stand-alone software license revenue increased by $7.5 million, or 110%, from $6.8 million in fiscal 2016 to $14.3 million in fiscal 2017.
Support and maintenance revenue increased by $10.4 million, or 60%, from $17.4 million in fiscal 2016 to $27.8 million in fiscal 2017. The increase in support and maintenance revenue was driven primarily by an increase in support contracts sold as a result of increased product sales, as well as continued recognition of deferred support revenue related to product sales made in prior periods.
Cost of Revenue and Gross Margin
|
|
|
Year Ended January 31, |
|
|
Change |
|
||||||||||
|
|
2016 |
|
|
2017 |
|
|
$ |
|
|
% |
|
|||||
|
|
|
(in thousands, except percentages) |
|
|||||||||||||
|
Cost of Revenue: |
|
|
|
|
|
|
|
|
|
|
|
|
|
|
|
|
|
Product |
|
$ |
25,138 |
|
|
$ |
34,738 |
|
|
$ |
9,600 |
|
|
|
38 |
% |
|
Support and maintenance |
|
|
7,110 |
|
|
|
9,437 |
|
|
|
2,327 |
|
|
|
33 |
% |
|
Total |
|
$ |
32,248 |
|
|
$ |
44,175 |
|
|
$ |
11,927 |
|
|
|
37 |
% |
|
Gross margin |
|
|
63 |
% |
|
|
65 |
% |
|
|
|
|
|
|
|
|
|
Gross margin, product |
|
|
63 |
% |
|
|
64 |
% |
|
|
|
|
|
|
|
|
|
Gross margin, support and maintenance |
|
|
59 |
% |
|
|
66 |
% |
|
|
|
|
|
|
|
|
Total cost of revenue increased by $12.0 million, or 37%, from $32.2 million in fiscal 2016 to $44.2 million in fiscal 2017.
61
Cost of product revenue increased by $9.6 million, or 38%, from $25.1 million in fiscal 2016 to $34.7 million in fiscal 2017. Approximately $8.7 million of the increase in cost of product revenue was driven by higher unit volumes. The increase in cost of product revenue was also partially driven by $0.9 million higher costs in our operations organization, primarily related to a $0.7 million increase in personnel costs driven by an 18% average headcount increase.
Cost of support and maintenance revenue increased by $2.3 million, or 33%, from $7.1 million in fiscal 2016 to $9.4 million in fiscal 2017. The increase in cost of support and maintenance revenue was primarily driven by higher costs in our global customer support organization related to an increase of $1.6 million in personnel costs due to a 22% increase in our average headcount in fiscal 2017 as compared to our average headcount in fiscal 2016, a $0.2 million increase to overhead costs and costs to administer and operate our third-party service inventory depots, and a $0.3 million increase in other costs in support of our customer support agreements, all of which were driven by the increase in our customer base.
Gross margin increased from 63% in fiscal 2016 to 65% in fiscal 2017.
Product gross margin increased from 63% in fiscal 2016 to 64% in fiscal 2017. Improvement in our product gross margin was related to favorable product mix, higher stand-alone software sales, and lower inventory charges due to decreases in writedowns of our customer evaluation inventory. The improvement was partially offset by higher costs in our operations organization as we invested in scaling our operations organization through headcount increases.
Support and maintenance gross margin increased from 59% in fiscal 2016 to 66% in fiscal 2017, as we gained leverage in our customer support organization.
Operating Expenses
Research and Development
|
|
Year Ended January 31, |
|
|
Change |
|
|||||||||||
|
|
|
2016 |
|
|
2017 |
|
|
$ |
|
|
% |
|
||||
|
|
|
(in thousands, except percentages) |
|
|||||||||||||
|
Research and development |
|
$ |
43,179 |
|
|
$ |
53,445 |
|
|
$ |
10,266 |
|
|
|
24 |
% |
Research and development expense increased by $10.3 million, or 24%, from $43.2 million in fiscal 2016 to $53.5 million in fiscal 2017. The increase in research and development expense was driven primarily by higher personnel costs of $7.9 million due to a 15% increase in our average headcount for the comparable periods as we hired additional personnel to continue to develop new and enhanced product offerings, and a $1.0 million increase in overhead costs. In addition, prototype expense increased by $1.2 million as we continued to expand our research and development efforts.
Sales and Marketing
|
|
Year Ended January 31, |
|
|
Change |
|
|||||||||||
|
|
|
2016 |
|
|
2017 |
|
|
$ |
|
|
% |
|
||||
|
|
|
(in thousands, except percentages) |
|
|||||||||||||
|
Sales and marketing |
|
$ |
87,993 |
|
|
$ |
108,903 |
|
|
$ |
20,910 |
|
|
|
24 |
% |
Sales and marketing expense increased by $20.9 million, or 24%, from $88.0 million in fiscal 2016 to $108.9 million in fiscal 2017. The increase in sales and marketing expense was primarily driven by higher personnel costs of $8.5 million due to a 16% average headcount increase. Sales commission and travel expenses increased by $4.8 million due to increased sales, expanded sales and marketing activities, and overhead costs increased by $3.0 million. In addition, as part of our efforts to penetrate and expand in global markets, the cost of our marketing activities, including field events, advertising, tradeshows, brand awareness, demand generation and other expenses, collectively accounted for $3.7 million of the increase.
62
|
|
Year Ended January 31, |
|
|
Change |
|
|||||||||||
|
|
|
2016 |
|
|
2017 |
|
|
$ |
|
|
% |
|
||||
|
|
|
(in thousands, except percentages) |
|
|||||||||||||
|
General and administrative |
|
$ |
18,773 |
|
|
$ |
19,364 |
|
|
$ |
591 |
|
|
|
3 |
% |
General and administrative expense increased by $0.6 million, or 3%, from $18.8 million in fiscal 2016 to $19.4 million in fiscal 2017. The increase in general and administrative expense was primarily due to a $1.8 million increase in personnel costs, driven by a 14% increase in average headcount to support our growing operations and a $0.4 million increase in outside professional services. The increase was offset by a $1.6 million decrease in allocated overhead costs.
Other Expense, Net
|
|
Year Ended January 31, |
|
|
Change |
|
|||||||||||
|
|
|
2016 |
|
|
2017 |
|
|
$ |
|
|
% |
|
||||
|
|
|
(in thousands, except percentages) |
|
|||||||||||||
|
Other expense, net: |
|
|
|
|
|
|
|
|
|
|
|
|
|
|
|
|
|
Interest expense |
|
$ |
(4,407 |
) |
|
$ |
(5,231 |
) |
|
$ |
(824 |
) |
|
|
19 |
% |
|
Other income, net |
|
$ |
254 |
|
|
$ |
677 |
|
|
$ |
423 |
|
|
|
167 |
% |
Other expense, net increased by $0.4 million, or 10%, from $4.2 million in fiscal 2016 to $4.6 million in fiscal 2017.
Interest expense increased by $0.8 million, from $4.4 million in fiscal 2016 to $5.2 million in fiscal 2017. The increase in interest expense was primarily due to increased borrowings under our credit facilities during fiscal 2017 as compared to fiscal 2016, partially offset by a decrease in amortization of deferred credit facility fees, debt issuance cost and debt discounts in relation to our loan obligations.
Other income (expense), net increased by $0.4 million, from $0.3 million in income in fiscal 2016 to $0.7 million in income in fiscal 2017. The change in other income (expense), net was primarily due to an increase of $0.3 million in investment income together with a $0.1 million gain as a result of favorable changes in foreign exchange rates.
Provision for Income Taxes
|
|
Year Ended January 31, |
|
|
Change |
|
|||||||||||
|
|
|
2016 |
|
|
2017 |
|
|
$ |
|
|
% |
|
||||
|
|
|
(in thousands, except percentages) |
|
|||||||||||||
|
Provision for income taxes |
|
$ |
634 |
|
|
$ |
465 |
|
|
$ |
(169 |
) |
|
|
(27 |
)% |
Provision for income taxes decreased by $0.1 million, or 27%, from $0.6 million in fiscal 2016 to $0.5 million in fiscal 2017. The decrease in provision for income taxes was primarily due to higher tax deductions driven by increased stock option exercises in one of our subsidiaries, in addition to lower corporate tax rates for certain of our subsidiaries.
63
Selected Quarterly Financial Data (Unaudited)
The following selected consolidated financial and other data should be read together with our consolidated financial statements and accompanying notes included elsewhere in this report. Our historical results presented below are not necessarily indicative of financial results to be achieved in future periods.
|
|
|
Three Months Ended |
|
|||||||||||||||||||||||||||||
|
|
April 30, |
|
|
July 31, |
|
|
October 31, |
|
|
January 31, |
|
|
April 30, |
|
|
July 31, |
|
|
October 31, |
|
|
January 31, |
|
|||||||||
|
|
|
2016 |
|
|
2016 |
|
|
2016 |
|
|
2017 |
|
|
2017 |
|
|
2017 |
|
|
2017 |
|
|
2018 |
|
||||||||
|
|
|
(in thousands, unaudited) |
|
|||||||||||||||||||||||||||||
|
Consolidated Statements of Operations Data: |
|
|
|
|
|
|
|
|
|
|
|
|
|
|
|
|
|
|
|
|
|
|
|
|
|
|
|
|
|
|
|
|
|
Revenue: |
|
|
|
|
|
|
|
|
|
|
|
|
|
|
|
|
|
|
|
|
|
|
|
|
|
|
|
|
|
|
|
|
|
Product |
|
$ |
16,677 |
|
|
$ |
20,768 |
|
|
$ |
26,871 |
|
|
$ |
33,014 |
|
|
$ |
22,387 |
|
|
$ |
26,329 |
|
|
$ |
22,758 |
|
|
$ |
19,319 |
|
|
Support and maintenance |
|
|
6,199 |
|
|
|
6,788 |
|
|
|
7,046 |
|
|
|
7,742 |
|
|
|
7,968 |
|
|
|
8,537 |
|
|
|
9,014 |
|
|
|
9,592 |
|
|
Total revenue |
|
|
22,876 |
|
|
|
27,556 |
|
|
|
33,917 |
|
|
|
40,756 |
|
|
|
30,355 |
|
|
|
34,866 |
|
|
|
31,772 |
|
|
|
28,911 |
|
|
Cost of revenue: |
|
|
|
|
|
|
|
|
|
|
|
|
|
|
|
|
|
|
|
|
|
|
|
|
|
|
|
|
|
|
|
|
|
Product(2) |
|
|
5,936 |
|
|
|
7,160 |
|
|
|
8,953 |
|
|
|
12,689 |
|
|
|
8,909 |
|
|
|
11,470 |
|
|
|
9,757 |
|
|
|
8,823 |
|
|
Support and maintenance(2) |
|
|
2,072 |
|
|
|
2,568 |
|
|
|
2,424 |
|
|
|
2,373 |
|
|
|
3,039 |
|
|
|
3,682 |
|
|
|
3,095 |
|
|
|
4,091 |
|
|
Total cost of revenue |
|
|
8,008 |
|
|
|
9,728 |
|
|
|
11,377 |
|
|
|
15,062 |
|
|
|
11,948 |
|
|
|
15,152 |
|
|
|
12,852 |
|
|
|
12,914 |
|
|
Gross profit: |
|
|
|
|
|
|
|
|
|
|
|
|
|
|
|
|
|
|
|
|
|
|
|
|
|
|
|
|
|
|
|
|
|
Product |
|
|
10,741 |
|
|
|
13,608 |
|
|
|
17,918 |
|
|
|
20,325 |
|
|
|
13,478 |
|
|
|
14,859 |
|
|
|
13,001 |
|
|
|
10,496 |
|
|
Support and maintenance |
|
|
4,127 |
|
|
|
4,220 |
|
|
|
4,622 |
|
|
|
5,369 |
|
|
|
4,929 |
|
|
|
4,855 |
|
|
|
5,919 |
|
|
|
5,501 |
|
|
Total gross profit |
|
|
14,868 |
|
|
|
17,828 |
|
|
|
22,540 |
|
|
|
25,694 |
|
|
|
18,407 |
|
|
|
19,714 |
|
|
|
18,920 |
|
|
|
15,997 |
|
|
Operating expenses: |
|
|
|
|
|
|
|
|
|
|
|
|
|
|
|
|
|
|
|
|
|
|
|
|
|
|
|
|
|
|
|
|
|
Research and development(2) |
|
|
13,659 |
|
|
|
12,989 |
|
|
|
13,227 |
|
|
|
13,570 |
|
|
|
14,923 |
|
|
|
23,080 |
|
|
|
17,287 |
|
|
|
18,830 |
|
|
Sales and marketing(2) |
|
|
24,996 |
|
|
|
24,466 |
|
|
|
27,862 |
|
|
|
31,579 |
|
|
|
27,442 |
|
|
|
32,607 |
|
|
|
28,435 |
|
|
|
24,201 |
|
|
General and administrative(2) |
|
|
5,675 |
|
|
|
4,911 |
|
|
|
3,955 |
|
|
|
4,823 |
|
|
|
5,332 |
|
|
|
13,171 |
|
|
|
8,061 |
|
|
|
8,236 |
|
|
Restructuring charges |
|
|
— |
|
|
|
— |
|
|
|
— |
|
|
|
— |
|
|
|
— |
|
|
|
— |
|
|
|
890 |
|
|
|
9 |
|
|
Total operating expenses |
|
|
44,330 |
|
|
|
42,366 |
|
|
|
45,044 |
|
|
|
49,972 |
|
|
|
47,697 |
|
|
|
68,858 |
|
|
|
54,673 |
|
|
|
51,276 |
|
|
Loss from operations |
|
|
(29,462 |
) |
|
|
(24,538 |
) |
|
|
(22,504 |
) |
|
|
(24,278 |
) |
|
|
(29,290 |
) |
|
|
(49,144 |
) |
|
|
(35,753 |
) |
|
|
(35,279 |
) |
|
Other expense, net: |
|
|
|
|
|
|
|
|
|
|
|
|
|
|
|
|
|
|
|
|
|
|
|
|
|
|
|
|
|
|
|
|
|
Interest expense |
|
|
(1,437 |
) |
|
|
(1,376 |
) |
|
|
(1,231 |
) |
|
|
(1,187 |
) |
|
|
(1,274 |
) |
|
|
(2,798 |
) |
|
|
(2,170 |
) |
|
|
(2,206 |
) |
|
Other income, net |
|
|
286 |
|
|
|
395 |
|
|
|
54 |
|
|
|
(58 |
) |
|
|
42 |
|
|
|
413 |
|
|
|
130 |
|
|
|
148 |
|
|
Total other expense, net |
|
|
(1,151 |
) |
|
|
(981 |
) |
|
|
(1,177 |
) |
|
|
(1,245 |
) |
|
|
(1,232 |
) |
|
|
(2,385 |
) |
|
|
(2,040 |
) |
|
|
(2,058 |
) |
|
Loss before provision for income taxes |
|
|
(30,613 |
) |
|
|
(25,519 |
) |
|
|
(23,681 |
) |
|
|
(25,523 |
) |
|
|
(30,522 |
) |
|
|
(51,529 |
) |
|
|
(37,793 |
) |
|
|
(37,337 |
) |
|
Provision for income taxes |
|
|
198 |
|
|
|
153 |
|
|
|
89 |
|
|
|
25 |
|
|
|
158 |
|
|
|
138 |
|
|
|
132 |
|
|
|
50 |
|
|
Net loss |
|
$ |
(30,811 |
) |
|
$ |
(25,672 |
) |
|
$ |
(23,770 |
) |
|
$ |
(25,548 |
) |
|
$ |
(30,680 |
) |
|
$ |
(51,667 |
) |
|
$ |
(37,925 |
) |
|
$ |
(37,387 |
) |
|
Deemed dividend to Series E and E-1 Convertible Preferred Stock |
|
$ |
— |
|
|
$ |
— |
|
|
$ |
— |
|
|
$ |
— |
|
|
$ |
(6,588 |
) |
|
$ |
— |
|
|
$ |
— |
|
|
$ |
— |
|
|
Impact of adjustment to Series E, E-1 and F Convertible Preferred Stock |
|
$ |
— |
|
|
$ |
— |
|
|
$ |
— |
|
|
$ |
— |
|
|
$ |
— |
|
|
$ |
26,336 |
|
|
$ |
— |
|
|
$ |
— |
|
|
Net loss attributable to common stockholders |
|
$ |
(30,811 |
) |
|
$ |
(25,672 |
) |
|
$ |
(23,770 |
) |
|
$ |
(25,548 |
) |
|
$ |
(37,268 |
) |
|
$ |
(25,331 |
) |
|
$ |
(37,925 |
) |
|
$ |
(37,387 |
) |
|
Net loss per share attributable to common stockholders—basic and diluted (1) |
|
$ |
(9.15 |
) |
|
$ |
(7.53 |
) |
|
$ |
(6.87 |
) |
|
$ |
(7.23 |
) |
|
$ |
(10.35 |
) |
|
$ |
(2.05 |
) |
|
$ |
(1.21 |
) |
|
$ |
(1.19 |
) |
|
(1) |
Basic and diluted earnings per share are computed independently for each of the quarters presented. Therefore, the sum of quarterly basic and diluted per share amounts may not equal annual basic and diluted per share amounts. |
|
(2) |
Includes stock-based compensation expense as follows: |
64
|
|
|
Three Months Ended |
|
|||||||||||||||||||||||||||||
|
|
April 30, |
|
|
July 31, |
|
|
October 31, |
|
|
January 31, |
|
|
April 30, |
|
|
July 31, |
|
|
October 31, |
|
|
January 31, |
|
|||||||||
|
|
|
2016 |
|
|
2016 |
|
|
2016 |
|
|
2017 |
|
|
2017 |
|
|
2017 |
|
|
2017 |
|
|
2018 |
|
||||||||
|
|
|
(in thousands, unaudited) |
|
|||||||||||||||||||||||||||||
|
Cost of product revenue |
|
$ |
62 |
|
|
$ |
67 |
|
|
$ |
68 |
|
|
$ |
67 |
|
|
$ |
71 |
|
|
$ |
690 |
|
|
$ |
334 |
|
|
$ |
517 |
|
|
Cost of support and maintenance revenue |
|
|
76 |
|
|
|
96 |
|
|
|
71 |
|
|
|
80 |
|
|
|
115 |
|
|
|
538 |
|
|
|
358 |
|
|
|
568 |
|
|
Research and development |
|
|
1,476 |
|
|
|
1,384 |
|
|
|
1,230 |
|
|
|
1,137 |
|
|
|
1,276 |
|
|
|
8,380 |
|
|
|
5,116 |
|
|
|
6,836 |
|
|
Sales and marketing |
|
|
1,223 |
|
|
|
1,027 |
|
|
|
959 |
|
|
|
906 |
|
|
|
1,044 |
|
|
|
4,638 |
|
|
|
2,468 |
|
|
|
2,282 |
|
|
General and administrative |
|
|
961 |
|
|
|
1,069 |
|
|
|
973 |
|
|
|
902 |
|
|
|
959 |
|
|
|
8,207 |
|
|
|
3,576 |
|
|
|
3,845 |
|
|
Total stock-based compensation expense(3) |
|
$ |
3,798 |
|
|
$ |
3,643 |
|
|
$ |
3,301 |
|
|
$ |
3,092 |
|
|
$ |
3,465 |
|
|
$ |
22,453 |
|
|
$ |
11,852 |
|
|
$ |
14,048 |
|
|
(3) |
In September 2017, our board of directors approved a restructuring plan, which resulted in a $0.7 million non-cash adjustment to restructuring charges for previously recognized stock-based compensation expense related to awards that will not vest as a result of the restructuring plan. |
Liquidity and Capital Resources
The accompanying consolidated financial statements have been prepared on the going concern basis, which contemplates the realization of assets and the satisfaction of liabilities in the normal course of business.
We have experienced negative cash flows from operations since our inception and expect negative cash flows from operations to continue for the foreseeable future. Net losses incurred during the years ended January 31, 2016, 2017, and 2018, amounted to $101.0 million, $105.8 million, and $157.7 million, respectively. Unless and until we are able to generate sufficient revenue from sales of our products and services to generate positive cash flows from operations, we expect such losses to continue. We are also subject to certain financial covenants related to our debt facilities that, if breached, could result in the debt becoming immediately due and payable in the event the lenders choose to declare an event of default. We do not currently have sufficient liquidity to repay amounts outstanding under our debt facilities should they become immediately due and payable. Further, regardless of whether these amounts become immediately due and payable, we likely do not have sufficient liquidity to continue our operations beyond June 30, 2018. As of January 31, 2018, we were not in compliance with certain covenants contained in our credit facility with Silicon Valley Bank (SVB). In March 2018, we amended the credit facility with SVB in exchange for the waiver by SVB with respect to certain prior events of default (Note 15). In April 2018, we entered into an amended and restated loan agreement with SVB to, among other things, extend the maturity date of our credit facility to May 2, 2019. In April 2018, we also entered into an amendment with TriplePoint to extend the maturity date of our credit facility to August 2019. Since the amendment to the terms of our credit agreements with our lenders, we have revised our forecasts of our cash flows and liquidity position for forward periods, casting additional doubt around our ability to meet our debt covenants. There can be no assurance that our lenders will not seek to demand immediate payment of amounts due under the relevant agreements as a result of the revisions to our forecasts.
Historically, we have funded a significant portion of our operations through the issuance of equity and debt. In the year ended January 31, 2016, we raised $124.6 million in gross proceeds (Note 7) related to the sale of convertible preferred stock. We have also entered into credit facilities, under which we have borrowed an aggregate of $69.0 million as of January 31, 2018, and drawn down $25.0 million from our Note Purchase Agreement in February and March 2018 (Notes 5 and 15). In July 2017, we completed our IPO, in which we raised $55.8 million, after deducting underwriting discounts and commission of $4.2 million. In August 2017, we sold an additional 1,000,000 shares of our common stock in connection with the IPO underwriters exercising an over-allotment option, pursuant to which we received net proceeds of $6.5 million, after deducting underwriting discounts and commissions.
The additional financing from our IPO, our existing cash and cash equivalents, amounts borrowed under our credit facilities and Note Purchase Agreement (Note 15), and our plan to continue to drive efficiencies in the our sales organization and other business units, through efforts such as the September 2017 restructuring plan (Note 12) and the February 2018 and March 2018 restructuring plans (Note 15), may not allow us to meet our debt financial
65
covenants or provide sufficient liquidity for us to meet our obligations through May 17, 2019, and we will likely fail to comply with our minimum liquidity covenants as early as May 31, 2018. As a result, there is substantial doubt about our ability to continue as a going concern.
While we plan to mitigate the conditions that are causing the substantial doubt to raise additional debt or equity financing and/or work with our lenders to amend certain financial covenants, it cannot be assessed as that we will be successful. Our ability to raise additional liquidity and/or amend our financial covenants is subject to a number of uncertainties, including, but not limited to, the market demand for our common or preferred stock, our financial performance and outlook, the market demand for our products and services, negative economic developments, adverse market conditions, significant delays in launch of new products and lack of market acceptance of new products.
If we are unable to successfully raise additional capital or otherwise address our liquidity requirements, we will likely fail to satisfy the minimum liquidity covenants of our credit facilities as early as the end of May 2018, which would constitute an event of default under those facilities and enable our lenders to demand immediate payment of all amounts due under those facilities. We do not currently have the ability to repay these amounts. Further, regardless of whether these amounts become immediately due and payable, we likely do not have sufficient liquidity to continue our operations beyond June 30, 2018. We are currently actively seeking additional sources of financing and considering various alternatives for the company including the potential sale of the company, but cannot assure you that we will be able to obtain such financing on acceptable terms, if at all, or sell the company at a price that will provide any meaningful proceeds to our stockholders, if at all.
Based on our current forecasts, it is probable that we will be unable to comply with our financial covenants through January 31, 2019, and will likely fail to comply with certain financial covenants as early as May 31, 2018, and as such have classified all of our outstanding debt balances as of January 31, 2018 as a current liability.
Cash Flows
The following table summarizes our cash flows for the periods presented:
|
|
|
Year Ended January 31, |
|
|||||||||
|
|
2016 |
|
|
2017 |
|
|
2018 |
|
||||
|
|
|
(in thousands) |
|
|||||||||
|
Cash used in operating activities |
|
$ |
(62,109 |
) |
|
$ |
(70,366 |
) |
|
$ |
(91,860 |
) |
|
Cash provided by (used in) investing activities |
|
|
(56,409 |
) |
|
|
58,334 |
|
|
|
(6,415 |
) |
|
Cash provided by financing activities |
|
|
161,597 |
|
|
|
9,425 |
|
|
|
82,550 |
|
|
Foreign exchange impact on cash and cash equivalents |
|
|
(2 |
) |
|
|
(61 |
) |
|
|
(42 |
) |
|
Net increase (decrease) in cash and cash equivalents |
|
$ |
43,077 |
|
|
$ |
(2,668 |
) |
|
$ |
(15,767 |
) |
Cash Flows Used In Operating Activities
In fiscal 2018, cash used in operating activities was $91.9 million. The primary factors affecting our cash used in operating activities during this period were our net loss of $157.7 million, partially offset by non-cash charges of $51.8 million for stock-based compensation, $7.1 million for depreciation and amortization of our property and equipment, $2.0 million for accretion of balloon payment and amortization of debt issuance cost, credit facility fees and discount on debt, $1.0 million for non-cash adjustments resulting from our restructuring during fiscal 2018, and net cash flows of $5.9 million provided by changes in our operating assets and liabilities. The primary driver of the changes in operating assets and liabilities was a $13.0 million decrease in accounts receivable. The decrease in accounts receivable was primarily a result of lower sales in the fourth quarter of fiscal 2018 compared to fourth quarter of fiscal 2017 and timing of collections. Changes in our operating assets and liabilities were also significantly affected by a $5.2 million increase in deferred revenue, and a $0.5 million decrease in prepaid expenses and other assets, offset by a $7.6 million decrease in accounts payable and accrued liabilities, payment of costs of $4.2 million in connection with our IPO, and a $1.0 million increase in inventory. The increase in deferred revenue was due to a greater number of support and maintenance contracts related to continued product sales and increased renewal of existing support and maintenance contracts associated with our larger installed customer base. The
66
decrease in accounts payable and accrued liabilities is primarily affected by lower cash operating expenses and cost of sales in the fourth quarter of fiscal 2018 compared to fourth quarter of fiscal 2017 and timing of payments.
In fiscal 2017, cash used in operating activities was $70.4 million. The primary factors affecting our cash used in operating activities during this period were our net loss of $105.8 million, partially offset by non-cash charges of $13.8 million for stock-based compensation, $9.3 million for depreciation and amortization of our property and equipment, $0.8 million for accretion of balloon payment and amortization of debt issuance cost, credit facility fees and discount on debt, and net cash flows of $11.5 million provided by changes in our operating assets and liabilities. The primary driver of the changes in operating assets and liabilities was a $14.6 million increase in deferred revenue. The increase in deferred revenue was due to a greater number of support and maintenance contracts related to the growth in our product sales and increased renewal of existing support and maintenance contracts associated with our larger installed customer base. Changes in our operating assets and liabilities were also significantly affected by a $13.7 million increase in accounts payable and accrued liabilities, offset by a $10.0 million increase in accounts receivable, a $3.1 million increase in inventories, payment of costs of $2.3 million in connection with our IPO, and $1.4 million increase in prepaid expenses and other assets. The increase in accounts payable and accrued liabilities was primarily attributable to increased activities to support overall business growth. The increase in accounts receivable was primarily due to revenue growth. We expect operating cash flows to continue to be affected by timing of sales and timing of collections. The increase in inventories was primarily attributable to incremental service inventory acquired to support our customer support agreements associated with our larger installed customer base.
Cash Flows Provided By (Used In) Investing Activities
In fiscal 2018, net cash used in investing activities was $6.4 million, which consisted of $11.5 million from purchases of investments and $6.4 million from purchases of property and equipment, partially offset by $11.5 million from maturities of our investments.
In fiscal 2017, net cash provided by investing activities was $58.3 million, which consisted of $76.4 million from maturities of our investments, partially offset by $13.8 million from purchases of investments and $4.3 million of purchases of property and equipment.
Cash Flows Provided By Financing Activities
In fiscal 2018, net cash provided by financing activities was $82.6 million, which consisted primarily of $62.3 million of proceeds from the IPO, net of underwriting discounts and commissions, $15.0 million from the draw-down from our credit facility, $5.0 million from the draw-down of our revolving line of credit and $0.5 million of proceeds from exercises of stock options, partially offset by $0.2 million of capital lease financing payments.
In fiscal 2017, net cash provided by financing activities was $9.4 million, which consisted primarily of $7.0 million from the draw-down of our revolving line of credit and $2.3 million of proceeds from exercises of stock options.
Debt Obligations
Credit Facility with TriplePoint
We have a credit facility with TriplePoint which, as of January 31, 2018, provided up to $50.0 million of available funds. This credit facility is secured by a security interest, junior to the SVB facility described below, on substantially all of our assets, including our intellectual property, and contains certain customary non-financial restrictive covenants. As of January 31, 2018, $50.0 million was outstanding under this facility.
In April 2018, we entered into an amendment with TriplePoint to extend the maturity date of our credit facility to August 2019. Pursuant to the amended terms, of the $50.0 million outstanding under this facility, $15.0 million will bear interest at 10.5% per year and $35.0 million will bear interest at 12.75% per year. The $50.0 million principal amount will become due in August 2019; provided, however, that if we, on or before August 2019, prepay a minimum of $25.0 million of the total amount outstanding under this facility, the maturity date for the then remaining outstanding principal balance will be extended to February 2021, subject to us making equal monthly
67
amortizing payments of principal and interest through the extended maturity date. Certain end-of-term payments will become payable upon the maturity of this indebtedness and certain other fees will become payable in connection with this indebtedness upon the occurrence of a change of control of the company.
Revolving Line of Credit with Silicon Valley Bank
We have a revolving line of credit with SVB, from which an amount based on a percentage of qualifying accounts receivable is available for us to borrow up to a total of $15.0 million. This facility is secured by a security interest, senior to the TriplePoint facility described above, on substantially all of our assets, including our intellectual property, and is subject to certain financial covenant. This facility is scheduled to expire May 2, 2019. As of January 31, 2018, we had $19.0 million outstanding under this facility.
As of January 31, 2018, we were not in compliance with certain covenants contained in our credit facility with SVB. In March 2018, we amended the credit facility with SVB in exchange for the waiver by SVB with respect to certain prior events of default (Note 15).
In April 2018, we entered into an amended and restated revolving loan agreement with SVB to, among other things, extend the maturity date of our credit facility. Under the amended agreement, we may borrow, through May 2, 2019, up to $12.5 million dependent upon our monthly accounts receivables balances, subject to the terms and conditions of the agreement. The $5.0 million non-formula facility previously included in our SVB revolving line of credit terminated in May 2018. Our revolving line of credit with SVB contains certain financial covenants, including a covenant that we achieve total revenues of at least $20.5 million, $23.4 million, $26.3 million and $29.4 for our fiscal quarters ending April 30, 2018, July 31, 2018, October 31, 2018 and January 31, 2019, respectively, and a covenant that we maintain a minimum level of cash and availability under the SVB line of credit of at least $15.0 million through July 31, 2018 and at least $10.0 million thereafter. We may also be required to pay a fee to SVB upon a change of control.
The amended and restated revolving loan agreement, among other things, provides for a secured revolving formula loan facility from SVB in an aggregate principal amount of up to $12.5 million (the “Formula Revolver”). The loans under the Formula Revolver accrue interest at a floating per annum rate based on the prime rate published in the Wall Street Journal, plus (i) 3.0% during a Streamline Period (as defined in the amended and restated revolving loan agreement) or (ii) 4.0% at all other times. Accrued interest on the revolving loans is required to be paid monthly.
Since the amendment to the terms of our credit agreements with TriplePoint and SVB, we have revised our forecasts of our cash flows and liquidity position for forward periods, casting additional doubt around our ability to meet our debt covenants. There can be no assurance that our lenders will not seek to demand immediate payment of amounts due under the relevant agreements as a result of the revisions to our forecasts.
Note Purchase Agreement
In May 2017, we entered into a Note Purchase Agreement with certain of our stockholders pursuant to which such stockholders have agreed to purchase from us, at our election, one or more subordinated convertible promissory notes, or Notes, having an aggregate maximum principal amount of $25.0 million. As of January 31, 2018, no Notes were issued and sold under the Note Purchase Agreement. In February and March 2018, we issued an aggregate of $25.0 million of convertible promissory notes under the Note Purchase Agreement.
The Notes issued under the Note Purchase Agreement have an interest rate of 8.0% per annum and mature in August 2019. If the Notes remain outstanding on or after December 1, 2019, at our election, we may convert the amounts outstanding under the Notes, if any, into common stock at the IPO price of $7.00 per share, provided that any Notes issued to entities affiliated with Insight Venture Partners shall be converted at the average closing price of our common stock on the Nasdaq Stock Market over the 30-day period preceding the conversion. The Notes are subject to acceleration upon the occurrence of an event of default, which include nonpayment, breach of representations and warranties, and the occurrence of certain bankruptcy or insolvency events.
68
Contractual Obligations and Commitments
The following table summarizes our contractual obligations as of January 31, 2018:
|
|
|
Payment Due by Period |
|
|||||||||||||||||
|
|
|
Total |
|
|
Less Than 1 Year |
|
|
1-3 Years |
|
|
3-5 Years |
|
|
More Than 5 Years |
|
|||||
|
|
|
(in thousands) |
|
|||||||||||||||||
|
Operating Leases(1) |
|
$ |
32,741 |
|
|
$ |
7,145 |
|
|
$ |
14,379 |
|
|
$ |
11,217 |
|
|
$ |
— |
|
|
Capital leases |
|
|
199 |
|
|
|
103 |
|
|
|
96 |
|
|
|
— |
|
|
|
— |
|
|
Debt obligations(2) (3) (4) |
|
|
68,962 |
|
|
|
18,962 |
|
|
|
50,000 |
|
|
|
— |
|
|
|
— |
|
|
Purchase obligations |
|
|
9,730 |
|
|
|
9,730 |
|
|
|
— |
|
|
|
— |
|
|
|
— |
|
|
Total |
|
$ |
111,632 |
|
|
$ |
35,940 |
|
|
$ |
64,475 |
|
|
$ |
11,217 |
|
|
$ |
— |
|
|
(1) |
In February 2018, we terminated our lease of certain office space located at 205 Ravendale Drive, Mountain View, California. |
|
(2) |
In February and March 2018, we issued an aggregate of $25.0 million of convertible promissory notes under the Note Purchase Agreement, which mature in August 2019. |
|
(3) |
In April 2018, we entered into an amendment with TriplePoint to extend the maturity date of our credit facility to August 2019. The $50.0 million principal amount will become due in August 2019; provided, however, that if we, on or before August 2019, prepay a minimum of $25.0 million of the total amount outstanding under this facility, the maturity date for the then remaining outstanding principal balance will be extended to February 2021, subject to us making equal monthly amortizing payments of principal and interest through the extended maturity date. |
|
(4) |
In April 2018, we entered into an amended and restated revolving loan agreement with SVB to, among other things, extend the maturity date of our credit facility. Under the amended agreement, we may borrow, through May 2, 2019, up to $12.5 million dependent upon our monthly accounts receivables balances, subject to the terms and conditions of the agreement. The $5.0 million non-formula facility previously included in our SVB revolving line of credit terminated in May 2018. |
We contract with an offshore subsidiary of Flex to manufacture all of our hardware products. Our agreement with Flex does not require us to purchase any minimum volumes of products from Flex, but in the normal course of business we provide rolling nine month forecasts to Flex of our monthly purchase requirements, the first three months of which are purchase commitments that Flex relies upon to procure components used to build finished products. We have commitments to Flex related to inventories on-hand at Flex and non-cancelable purchase orders for our products and related components. We record a charge to cost of product sales for firm, non-cancelable and unconditional purchase commitments with Flex for non-standard components when and if quantities exceed our future demand forecasts. As of January 31, 2017 and 2018, we had $13.5 million and $9.7 million of purchase commitments with Flex, respectively.
Off-Balance Sheet Arrangements
In fiscal 2018, we did not have any relationships with unconsolidated entities or financial partnerships, such as structured finance or special purpose entities that were established for the purpose of facilitating off-balance sheet arrangements or other purposes.
Critical Accounting Policies and Estimates
Our consolidated financial statements are prepared in accordance with U.S. generally accepted accounting principles, or GAAP. The preparation of these consolidated financial statements requires our management to make estimates, assumptions and judgments that affect the reported amounts of assets, liabilities, revenue, expenses and related disclosures. We base our estimates, assumptions and judgments on historical experience and on various other factors that we believe to be reasonable under the circumstances. Different assumptions and judgments would change the estimates used in the preparation of our consolidated financial statements, which, in turn, could change the results from those reported. We evaluate our estimates, assumptions and judgments on an ongoing basis.
69
The critical accounting estimates, assumptions and judgments that we believe have the most significant impact on our consolidated financial statements are described below.
Revenue Recognition
We generate revenue from sales of enterprise cloud platform products and related support and maintenance. We derive revenue primarily from two sources: (i) product revenue, which includes hardware and perpetual software license revenue and (ii) support and maintenance revenue, which includes support, installation services and training. Revenue is recognized when all of the following criteria are met: persuasive evidence of an arrangement exists; the product or service has been delivered; the sales price is fixed or determinable; and collection is reasonably assured.
We define each of the four criteria above as follows:
|
|
• |
Persuasive Evidence of an Arrangement Exists. We use stand-alone purchase orders, signed sales quotations or purchase orders pursuant to the terms and conditions of a master sales agreement to support the evidence of an arrangement with channel partners, distributors and customers. |
|
|
• |
Delivery Has Occurred. We use shipping documentation to verify delivery of products. We typically recognize product revenue upon transfer of title and risk of loss, which is primarily upon shipment to channel partners, distributors and customers. Support and maintenance revenue is recognized over time as the services are delivered. We generally do not have significant obligations for future performance, such as rights of return or pricing credits, associated with sales of our products. It is our practice to identify an end-user prior to shipment to a channel partner or distributor. |
|
|
• |
The Sales Price Is Fixed or Determinable. We assess whether the fee is fixed or determinable based on the payment terms associated with the transaction. If the terms are extended beyond our normal payment terms, we will recognize revenue as the payments become due. Payment from partners is not contingent on partner’s receiving payment from customers. |
|
|
• |
Collection Is Reasonably Assured. We assess probability of collection on a customer-by-customer basis. Our channel partners, distributors and customers are subjected to a credit review process that evaluates their financial condition and ability to pay. |
Support and maintenance revenue includes arrangements for software and technical support for our products. While purchasing support and maintenance services is not mandatory, substantially all products shipped have been purchased together with a support contract. Support is offered under renewable, fee-based contracts and includes technical support, hardware repair and replacement parts, and software patches, bug fixes, updates, and upgrades. Support and maintenance revenue is initially deferred and recognized ratably over the life of the contract, with the related expenses, including the write down of customer support inventory to its net realizable value, recognized as incurred. Support and maintenance contracts range from one to five years. Unearned support revenue is included in deferred revenue.
Professional service revenue primarily consists of fees we earn related to installation. While installation services are not contractually mandatory, customers occasionally purchase such services. We generally recognize revenue from installation services upon delivery or completion of performance. Installation services are typically short term in nature. To date, revenue arising from installation services has been insignificant.
We report revenue net of sales taxes. Shipping charges billed to customers are included in product revenue and the related shipping and handling costs are included in cost of product revenue.
Our offering consists of hardware products containing software components that function together to provide the essential functionality of the product. Therefore, our hardware products (inclusive of the core software) are considered non-software deliverables and are not subject to industry-specific software revenue recognition guidance.
Our product revenue also includes revenue from the sale of stand-alone software products. Stand-alone software may operate on our hardware product, but is not considered essential to the functionality of the hardware and is subject to the industry-specific software revenue recognition guidance.
70
Our typical multiple element arrangement includes hardware product (including the essential software) and support. We may also sell stand-alone software as part of our multiple element arrangements. We consider each of these deliverables to be separate units of accounting based on whether the delivered items have stand-alone value. We have determined that each unit of accounting has stand-alone value because they are sold separately by us or, for hardware products, because the customers can resell them to others on a stand-alone basis.
For certain arrangements with multiple deliverables, we allocate the arrangement fee to the non-software element based upon the relative selling price of such element and, if software and software-related elements such as support for the software element are also included in the arrangement, we allocate the arrangement fee to those software and software-related elements as a group. After such allocations are made, the amount of the arrangement fee allocated to the software and software-related elements is accounted for using the residual method. When applying the relative selling price method, we determine the selling price for each element using vendor-specific objective evidence, or VSOE, of selling price, if it exists, or if not, third-party evidence, or TPE, of selling price, if it exists. If neither VSOE nor TPE of selling price exist for an element, we use our best estimated selling price, or BESP, for that element. The revenue allocated to each element is then recognized when the basic revenue recognition criteria are met for that element.
When an arrangement includes stand-alone software products and related support, under the software revenue recognition guidance, we use the residual method to recognize revenue when a product agreement includes one or more elements to be delivered at a future date and VSOE of the fair value of all undelivered elements exists. In the majority of our contracts, the only element that remains undelivered at the time of delivery of the product is support services. Under the residual method, the VSOE of fair value of the undelivered elements is deferred and the remaining portion of the contract fee is recognized upfront as product revenue. If evidence of the VSOE of fair value of the undelivered elements does not exist, all revenue is deferred and recognized at the earlier of (i) delivery of those elements occurs or (ii) when fair value can be established unless support services is the only undelivered element, in which case, the entire arrangement fee is recognized ratably over the contractual period of the support services.
VSOE of fair value for elements of an arrangement is based upon the normal pricing and discounting practices for those deliverables when sold separately. In determining VSOE, we require that a substantial majority of the selling prices for a deliverable fall within a reasonably narrow pricing range, evidenced by a substantial majority of such historical stand-alone transactions falling within a reasonably narrow range.
We are not able to determine TPE for our products or services. TPE is determined based on competitor prices for similar deliverables when sold separately. Generally, our go-to-market strategy differs from that of our peers and our offerings contain a significant level of differentiation such that the comparable pricing of products with similar functionality cannot be obtained. Furthermore, we are unable to reliably determine what similar competitor products’ selling prices are on a stand-alone basis.
When we are unable to establish the selling price of our deliverables using VSOE or TPE, we use BESP in our allocation of arrangement consideration. The objective of BESP is to determine the price at which we would transact a sale if the product or service were sold on a stand-alone basis. We determine BESP for the purposes of allocating the arrangement by reviewing market factors including, but not limited to, pricing practices including discounting, the geographies in which we offer our products and services, and the type of customer (i.e., channel or end-user). Additionally, we consider historical transactions, including transactions whereby the deliverable was sold on a stand-alone basis.
Deferred revenue consists of billings or payments received in advance of revenue recognition and primarily relate to support and maintenance. Deferred revenue that will be recognized during the twelve-month period following the balance sheet date is recorded as current deferred revenue and the remaining portion is recorded as noncurrent.
71
Inventories consist primarily of raw materials related to component parts and finished goods. Finished goods include both inventory held for sale, service inventory held at third-party service inventory depots in support of customer support agreements, and customer evaluation inventory.
Inventory values are stated at the lower of cost (on a first in, first out method) or market value. A provision is recorded to adjust inventory to its estimated realizable value when inventory is determined to be in excess of anticipated demand or obsolete. Specifically, service inventory is written down to its net realizable value based upon the estimated loss of utility starting from the date the customer support inventory is placed in the third-party service inventory depots; and customer evaluation inventory is reviewed and reserved for excess and obsolescence.
We use significant judgment in establishing our forecasts of future demand within a specific time horizon and obsolete material exposures. These estimates depend on our assessment of current and expected purchases from our customers, product lifecycle and development plans and current sales levels. If actual market conditions are less favorable than those projected by management, which may be caused by factors within and outside of our control, we may be required to increase our inventory write-downs, which could have an adverse impact on our gross margins and profitability.
Income Taxes
Income tax expense is an estimate of current income taxes payable in the current fiscal year based on reported income before income taxes. Deferred income taxes reflect the effect of temporary differences and carryforwards that we recognize for financial reporting and income tax purposes.
We recognize income taxes under the asset and liability method. We recognize deferred income tax assets and liabilities for the expected future consequences of temporary differences between the financial reporting and tax bases of assets and liabilities. These differences are measured using the enacted statutory tax rates that are expected to apply to taxable income for the years in which differences are expected to reverse. We recognize the effect on deferred income taxes of a change in tax rates in income in the period that includes the enactment date.
We record a valuation allowance to reduce our deferred tax assets to the net amount that we believe is more likely than not to be realized. We consider all available evidence, both positive and negative, including historical levels of income, expectations and risks associated with estimates of future taxable income, and ongoing tax planning strategies in assessing the need for a valuation allowance. Realization of deferred tax assets is dependent upon the generation of future taxable income, if any, the timing and amount of which are uncertain. Due to the history of losses we have generated in the past, we believe that it is more likely than not that the deferred tax assets will not be realized as of January 31, 2018. Accordingly, we have recorded a full valuation allowance on our net deferred tax assets.
We recognize tax benefits from uncertain tax positions only if we believe that it is more likely than not that the tax position will be sustained on examination by the taxing authorities based on the technical merits of the position. We make adjustments to these reserves when facts and circumstances change, such as the closing of a tax audit or the refinement of an estimate. The provision for income taxes includes the effects of any reserves that are considered appropriate, as well as the related net interest and penalties.
We expect to permanently reinvest undistributed earnings in foreign subsidiaries outside of the United States to fund future foreign operations. We project that we will have sufficient cash flow in the United States and will not need to repatriate the foreign earnings to finance our domestic operations. If we were to distribute these earnings to the United States, we would be subject to U.S. income taxes, less any allowable foreign tax credits, and foreign withholding taxes. We have not recorded a deferred tax liability on any portion of our undistributed earnings in foreign subsidiaries. If we were to repatriate these earnings to the United States, any associated income tax liability would be insignificant.
We believe that we have adequately reserved for our uncertain tax positions, although we can provide no assurance that the final tax outcome of these matters will not be materially different. To the extent that the final tax
72
outcome of these matters is different than the amounts recorded, such differences will affect the provision for income taxes in the period in which such determination is made and could have a material impact on our financial condition and operating results. The provision for income taxes includes the effects of any reserves that we believe are appropriate, as well as the related net interest and penalties.
The Tax Cuts and Jobs Act of 2017 (Tax Act), as signed by the President of the United States on December 22, 2017, significantly revises U.S. tax law. The tax reform legislation reduces the corporate tax rate, limits or eliminates certain tax deductions and changes the taxation of foreign earnings of U.S. multinational companies. The Deemed Repatriation Transition Tax (Transition Tax) is a tax on previously untaxed accumulated and current earnings and profits (E&P) of certain of our foreign subsidiaries at reduced tax rates. To determine the amount of the Transition Tax, we must determine, in addition to other factors, the amount of post-1986 E&P of the relevant subsidiaries, as well as the amount of non-U.S. income taxes paid on such earnings.
The Tax Act reduces the corporate tax rate to 21 percent, effective January 1, 2018. Consequently, we recorded a decrease to deferred tax assets of approximately $59.2 million. This reduction was fully offset by a corresponding change in the valuation allowance recorded against deferred tax assets.
The SEC staff issued SAB 118, which provides guidance on accounting for the tax effects of the Tax Act. SAB 118 provides a measurement period that should not extend beyond one year from the Tax Act enactment date for companies to complete the accounting under ASC 740. In accordance with SAB 118, a company must reflect the income tax effects of those aspects of the Act for which the accounting under ASC 740 is complete. To the extent that a company’s accounting for certain income tax effects of the Tax Act is incomplete but it is able to determine a reasonable estimate, it must record a provisional estimate in the financial statements. If a company cannot determine a provisional estimate to be included in the financial statements, it should continue to apply ASC 740 on the basis of the provisions of the tax laws that were in effect immediately before the enactment of the Tax Act. We are able to make a reasonable estimate of the Transition Tax and expect to utilize U.S. net operating losses to reduce the tax. We will continue to gather additional information to more precisely compute the amount of the Transition Tax within the measurement period. Although the tax rate reduction is known, we have not collected all of the necessary data to complete our analysis of the effect of the Tax Act on the underlying deferred taxes and as such, the amounts recorded as of January 31, 2018, are provisional.
Stock-Based Compensation
Stock Options
Stock-based compensation expense is measured and recognized in the financial statements based on the fair value of the awards granted. The fair value of a stock option is estimated on the grant date using the Black-Scholes option-pricing model. Stock-based compensation expense is recognized, net of actual forfeitures, over the requisite service period of the awards, which is generally four years.
Our use of the Black-Scholes option-pricing model requires the input of highly subjective assumptions, including the fair value of the underlying common stock, expected term of the option, expected volatility of the price of our common stock, risk-free interest rates, and the expected dividend yield of our common stock. The assumptions used in our option-pricing model represent management’s best estimates. These estimates involve inherent uncertainties and the application of management’s judgment. If factors change and different assumptions are used, our stock-based compensation expense could be materially different in the future.
These assumptions and estimates are as follows:
|
|
• |
Fair Value of Common Stock. Prior to our IPO, we estimated the fair value of common stock. See further discussion in “Common Stock Valuations” below. Subsequent to our IPO, we use the closing price of our common stock as reported by The NASDAQ Global Market on the date of grant to determine the fair value of our common stock. |
|
|
• |
Expected Term. The expected term of the options is calculated as the midpoint between the average vesting period and the contractual term of the option grants. |
73
|
|
• |
Risk-Free Interest Rate. The risk-free rate that we use is based on U.S. Treasury zero-coupon issues with remaining terms similar to the expected term of the options. |
|
|
• |
Dividends. We have never declared or paid any cash dividends and do not plan to pay cash dividends in the foreseeable future and, therefore, we used an expected dividend yield of zero in the valuation model. |
We will continue to use judgment in evaluating the assumptions related to our stock-based compensation on a prospective basis. As we continue to accumulate additional data related to the historic optionee exercise and termination behavior and to our common stock value, we may have refinements to our estimates, which could materially impact our future stock-based compensation expense.
We have granted stock awards with a service condition only, which stock-based compensation expense is recognized using straight-line method over the requisite service period of the awards. As of January 31, 2018, we had a total of approximately $18.4 million of unrecognized stock-based compensation expense related to stock awards with a service condition only, which is expected to be recognized over a weighted-average period of 2.0 years.
In May 2017, we repriced each Eligible Option to a new exercise price of $13.68 per share, which is no less than the fair value of our common stock as determined by our compensation committee on the date of repricing. Eligible Options covering 3,291,783 shares of our common stock with a weighted average exercise price of $24.31 were repriced on May 30, 2017. The incremental stock based compensation expense related to this repricing is $7.3 million, of which $2.6 million is recorded on the date of repricing, and the remaining $4.7 million will be recognized over 2.5 years.
Restricted Stock Units
Stock-based compensation expense is measured and recognized in the financial statements based on the fair value of our common stock on the date of the grant. Stock-based compensation expense is recognized, net of actual forfeitures, over the requisite service period of the award, and upon performance conditions being met. As of January 31, 2018, we had a total of approximately $28.9 million of unrecognized stock-based compensation expense, which is expected to be recognized over a weighted-average period of 2.0 years.
Common Stock Valuations
Prior to our IPO, the fair value of our common stock underlying our stock options was determined by our board of directors. The valuations of our common stock were determined in accordance with the guidelines outlined in the American Institute of Certified Public Accountants Practice Aid, Valuation of Privately-Held-Company Equity Securities Issued as Compensation. In the absence of a public trading market, our board of directors, with input from management, exercised significant judgment and considered numerous objective and subjective factors to determine the fair value of our common stock as of the date of each option grant, including the following factors:
|
|
• |
contemporaneous valuations performed by unrelated third-party valuation firms; |
|
|
• |
the prices, rights, preferences and privileges of our convertible preferred stock relative to those of our common stock; |
|
|
• |
the lack of marketability of our common stock; |
|
|
• |
our actual operating and financial performance; |
|
|
• |
current business conditions and projections; |
|
|
• |
our hiring key personnel and the experience of our management; |
|
|
• |
our history and the timing of the introduction of new products and services; |
74
|
|
• |
the likelihood of achieving a liquidity event, such as an initial public offering or a merger or acquisition of our business given prevailing market conditions; |
|
|
• |
the illiquidity of stock-based awards involving securities in a private company; |
|
|
• |
the market performance of comparable publicly traded companies; |
|
|
• |
recent private stock sales transactions; and |
|
|
• |
U.S. and global capital market conditions. |
In valuing our common stock, the fair value of our business, or Enterprise Value, was determined using a guideline publicly traded company analysis of the market approach. The Enterprise Value determined was then adjusted to remove our debt obligations and add back cash and cash equivalents as of the valuation date to arrive at an equity value. In general, the resulting equity value was then allocated to our common stock using a combination of the option pricing method and a probability weighted expected return method. After the equity value is determined and allocated to the various classes of shares, a discount for lack of marketability, or DLOM, is applied to arrive at the fair value of the common stock. The DLOM reflects the lower value placed on securities that are not freely transferable, as compared to those that trade frequently in an established market. With respect to the valuation report that we received in May 2017, the resulting equity value was allocated to our common stock using a probability weighted expect return method and not the option pricing method, and no DLOM was applied, due to proximity to this offering, the lower indicated valuation range of our common stock and the relatively large number of shares of common stock issuable upon conversion of our preferred stock in connection with this offering.
Our assessments of the fair value of the common stock for grant dates between the dates of the valuations were based in part on the current available financial and operational information and the common stock value provided in the most recent valuation as compared to the timing of each grant. For financial reporting purposes, we considered the amount of time between the valuation date and the grant date to determine whether to use the latest common stock valuation or a straight-line calculation between the two valuation dates. This determination included an evaluation of whether the subsequent valuation indicated that any significant change in valuation had occurred between the previous valuation and the grant date.
Subsequent to our IPO, we have relied on the closing price of our common stock as reported by The NASDAQ Global Market on the date of grant to determine the fair value of our common stock.
Recent Accounting Pronouncements
In May 2017, the Financial Accounting Standard Board (FASB) issued Accounting Standards Update (ASU) No. 2017-09, Scope of Modification Accounting. The standard provides guidance about which changes to the terms or conditions of a share-based payment award require an entity to apply modification accounting. The standard is effective for us in the first quarter of fiscal year 2019. We are evaluating the impact the adoption of this standard will have on our consolidated financial statements.
In August 2016, FASB issued ASU No. 2016-15, Classification of Certain Cash Receipts and Cash Payments. The standard provides new authoritative guidance addressing eight specific cash flow issues with the objective of reducing the existing diversity in practice in how certain transactions are presented and classified in the statement of cash flows. The standard is effective for us in the first quarter of fiscal year 2019. We are evaluating the impact the adoption of this standard will have on our consolidated financial statements.
In February 2016, FASB issued ASU No. 2016-02, Leases. The standard increases transparency and comparability among organizations by requiring companies to recognize leased assets and related liabilities on the balance sheet and disclose key information about leasing arrangements. This standard is effective for us in the first quarter of fiscal year 2020. We are evaluating the impact the adoption of this standard will have on our consolidated financial statements.
75
In May 2014, FASB issued ASU, 2014-09, Revenue from Contracts with Customers. The standard is a comprehensive new revenue recognition model that requires revenue to be recognized in a manner to depict the transfer of goods or services to a customer at an amount that reflects the consideration expected to be received in exchange for those goods or services. In August 2015, FASB issued ASU 2015-14, Revenue from Contracts with Customers, to defer the effective date of ASU 2014-09 by one year to annual reporting periods beginning after December 15, 2017, but permits entities to adopt the original effective date if they choose. The standard will be applied using either the full or modified retrospective adoption methods. We will adopt the new standard in the first quarter of fiscal 2019 using the full retrospective adoption method.
The most significantly impacted areas relate to the deferral of costs to obtain a contract, which are primarily commission expense directly incurred as a result of sales of products and related support, and the upfront revenue recognition of the amount allocated from support and maintenance to products for certain arrangements, as the requirement relating to the contingency of the performance of the service is eliminated in the new standard.
For the year ended January 31, 2017, we currently expect the adoption of the standard to result in the recognition of additional revenue of approximately $2.7 million to $3.7 million and a decrease in sales and marketing expense of approximately $1.3 million to $2.3 million. For the year ended January 31, 2018, we currently do not expect the adoption of the standard to result in significant changes in revenue or expenses. In addition, the adoption of the standard will result in a decrease in deferred revenue of approximately $4.8 million to $5.8 million and $5.1 million to $6.1 million as of January 31, 2017 and 2018, respectively, driven by the upfront recognition of revenue allocated from support and maintenance to products for certain arrangements for which the contingency on the performance of the service no longer exists, and an increase in deferred commissions of approximately $3.8 million to $4.8 million and $4.6 million to $5.6 million as of January 31, 2017 and 2018, respectively, which will be recognized in sales and marketing expense in future periods.
The adoption of the standard will have no significant impact to the provision for income taxes and will have no impact to the net cash used in, or provided by, operating, investing, or financing activities on our consolidated statements of cash flows.
We are finalizing the impact of the standard on our consolidated financial statements and disclosures, as well as changes to our systems, processes, and internal controls. Our preliminary assessments are subject to change.
76
Item 7A. Quantitative and Qualitative Disclosures About Market Risk.
We are exposed to market risk in the ordinary course of our business. Market risk represents the risk of loss that may impact our financial position due to adverse changes in financial market prices and rates. Our market risk exposure is primarily a result of fluctuations in foreign currency exchange rates and interest rates.
Foreign Currency Risk
Our sales contracts are denominated in U.S. dollars, and therefore, substantially all of our revenue is not subject to foreign currency risk. However, a strengthening of the U.S. dollar could increase the real cost of our products to our customers outside of the United States, which could adversely affect our financial condition and operating results. In addition, a portion of our operating expenses is incurred outside the United States, is denominated in foreign currencies such as the Euro, the Pound Sterling, and the Japanese Yen, and is subject to fluctuations due to changes in foreign currency exchange rates. To date, we have not entered into any hedging arrangements with respect to foreign currency risk or other derivative instruments. In the event our foreign sales and expenses increase, our operating results may be more greatly affected by foreign currency exchange rate fluctuations, which can affect our operating income or loss. The effect of a hypothetical 10% change in foreign currency exchanges rates applicable to our business would not have had a material impact on our historical consolidated financial statements. If in the future we become more exposed to currency fluctuations and are not able to successfully hedge against the risks associated with currency fluctuations, our operating results could be adversely affected.
Interest Rate Risk
Our cash and cash equivalents primarily consist of bank deposits and money market funds. The carrying amount of our cash equivalents reasonably approximates fair value, due to the short maturities of these instruments. The primary objectives of our investment activities are the preservation of capital, the fulfillment of liquidity needs and the fiduciary control of cash and investments. We do not enter into investments for trading or speculative purposes. Our investments are exposed to market risk due to a fluctuation in interest rates, which may affect our interest income and the fair market value of our investments. However, due to the short-term nature of our investment portfolio, we do not believe an immediate 10% increase or decrease in interest rates would have a material effect on the fair market value of our portfolio. We therefore do not expect our operating results or cash flows to be materially affected by a sudden change in market interest rates.
77
Item 8. Financial Statements and Supplementary Data.
Report of Independent Registered Public Accounting Firm
To the Stockholders and Board of Directors Tintri, Inc.:
Opinion on the Consolidated Financial Statements
We have audited the accompanying consolidated balance sheets of Tintri, Inc. and subsidiaries (the Company) as of January 31, 2017 and 2018, the related consolidated statements of operations, comprehensive loss, convertible preferred stock and stockholders’ deficit, and cash flows for each of the years in the three-year period ended January 31, 2018, and the related notes (collectively, the consolidated financial statements). In our opinion, the consolidated financial statements present fairly, in all material respects, the financial position of the Company as of January 31, 2017 and 2018, and the results of its operations and its cash flows for each of the years in the three-year period ended January 31, 2018, in conformity with U.S. generally accepted accounting principles.
Going Concern
The accompanying consolidated financial statements have been prepared assuming that the Company will continue as a going concern. As discussed in Note 1 to the consolidated financial statements, the Company has incurred negative cash flows from operations, is required to maintain compliance with certain financial covenants and, regardless of the financial covenants, the Company likely does not have sufficient cash to meet its obligations associated with its operating activities beyond June 30, 2018. Together these factors raise substantial doubt about the Company’s ability to continue as a going concern. Management’s plans in regard to these matters are also described in Note 1. The consolidated financial statements do not include any adjustments that might result from the outcome of this uncertainty.
Basis for Opinion
These consolidated financial statements are the responsibility of the Company’s management. Our responsibility is to express an opinion on these consolidated financial statements based on our audits. We are a public accounting firm registered with the Public Company Accounting Oversight Board (United States) (PCAOB) and are required to be independent with respect to the Company in accordance with the U.S. federal securities laws and the applicable rules and regulations of the Securities and Exchange Commission and the PCAOB.
We conducted our audits in accordance with the standards of the PCAOB. Those standards require that we plan and perform the audit to obtain reasonable assurance about whether the consolidated financial statements are free of material misstatement, whether due to error or fraud. Our audits included performing procedures to assess the risks of material misstatement of the consolidated financial statements, whether due to error or fraud, and performing procedures that respond to those risks. Such procedures included examining, on a test basis, evidence regarding the amounts and disclosures in the consolidated financial statements. Our audits also included evaluating the accounting principles used and significant estimates made by management, as well as evaluating the overall presentation of the consolidated financial statements. We believe that our audits provide a reasonable basis for our opinion.
/s/ KPMG LLP
We have served as the Company’s auditor since 2014.
San Francisco, California
May 16, 2018
78
Consolidated Balance Sheets
(in thousands, except share and per share data)
|
|
|
As of January 31, |
|
|||||
|
|
|
2017 |
|
|
2018 |
|
||
|
Assets |
|
|
|
|
|
|
|
|
|
Current assets: |
|
|
|
|
|
|
|
|
|
Cash and cash equivalents |
|
$ |
48,048 |
|
|
$ |
32,281 |
|
|
Accounts receivable, net |
|
|
30,749 |
|
|
|
17,722 |
|
|
Inventories, net |
|
|
6,509 |
|
|
|
7,494 |
|
|
Prepaid and other current assets |
|
|
6,202 |
|
|
|
3,633 |
|
|
Total current assets |
|
|
91,508 |
|
|
|
61,130 |
|
|
Property and equipment, net |
|
|
10,410 |
|
|
|
12,246 |
|
|
Other long-term assets |
|
|
2,984 |
|
|
|
2,871 |
|
|
Total assets |
|
$ |
104,902 |
|
|
$ |
76,247 |
|
|
Liabilities, Convertible Preferred Stock and Stockholders’ Deficit |
|
|
|
|
|
|
|
|
|
Current liabilities: |
|
|
|
|
|
|
|
|
|
Accounts payable |
|
$ |
15,674 |
|
|
$ |
11,908 |
|
|
Accrued and other current liabilities |
|
|
20,668 |
|
|
|
23,301 |
|
|
Deferred revenue, current |
|
|
28,056 |
|
|
|
31,679 |
|
|
Long-term debt, current portion |
|
|
— |
|
|
|
68,638 |
|
|
Total current liabilities |
|
|
64,398 |
|
|
|
135,526 |
|
|
Deferred revenue, non-current |
|
|
28,389 |
|
|
|
29,982 |
|
|
Long-term debt |
|
|
48,914 |
|
|
|
— |
|
|
Other long-term liabilities |
|
|
5,041 |
|
|
|
2,449 |
|
|
Total liabilities |
|
|
146,742 |
|
|
|
167,957 |
|
|
Commitments and contingencies (Note 6) |
|
|
|
|
|
|
|
|
|
Convertible preferred stock, par value of $0.00005 per share—10,651,216 and 100,000,000 shares authorized as of January 31, 2017 and 2018; 10,610,966 and 0 shares issued and outstanding as of January 31, 2017 and 2018; aggregate liquidation preference $259,254 and $0 as of January 31, 2017 and 2018 |
|
|
257,141 |
|
|
|
— |
|
|
Stockholders’ deficit: |
|
|
|
|
|
|
|
|
|
Common stock, par value of $0.00005 per share—21,333,333 and 1,000,000,000 shares authorized as of January 31, 2017 and 2018; 3,627,748 and 31,324,097 shares issued and outstanding as of January 31, 2017 and 2018 |
|
|
1 |
|
|
|
2 |
|
|
Additional paid-in capital |
|
|
41,745 |
|
|
|
387,232 |
|
|
Notes receivables from stockholders |
|
|
(1,544 |
) |
|
|
(750 |
) |
|
Accumulated other comprehensive loss |
|
|
(466 |
) |
|
|
(355 |
) |
|
Accumulated deficit |
|
|
(338,717 |
) |
|
|
(476,628 |
) |
|
Treasury stock |
|
|
— |
|
|
|
(1,211 |
) |
|
Total stockholders’ deficit |
|
|
(298,981 |
) |
|
|
(91,710 |
) |
|
Total liabilities, convertible preferred stock and stockholders’ deficit |
|
$ |
104,902 |
|
|
$ |
76,247 |
|
See accompanying notes to consolidated financial statements.
79
Consolidated Statements of Operations
(in thousands, except share and per share data)
|
|
|
Year Ended January 31, |
|
|||||||||
|
|
2016 |
|
|
2017 |
|
|
2018 |
|
||||
|
Revenue: |
|
|
|
|
|
|
|
|
|
|
|
|
|
Product |
|
$ |
68,652 |
|
|
$ |
97,330 |
|
|
$ |
90,793 |
|
|
Support and maintenance |
|
|
17,360 |
|
|
|
27,775 |
|
|
|
35,111 |
|
|
Total revenue |
|
|
86,012 |
|
|
|
125,105 |
|
|
|
125,904 |
|
|
Cost of revenue: |
|
|
|
|
|
|
|
|
|
|
|
|
|
Product |
|
|
25,138 |
|
|
|
34,738 |
|
|
|
38,959 |
|
|
Support and maintenance |
|
|
7,110 |
|
|
|
9,437 |
|
|
|
13,907 |
|
|
Total cost of revenue |
|
|
32,248 |
|
|
|
44,175 |
|
|
|
52,866 |
|
|
Gross profit: |
|
|
|
|
|
|
|
|
|
|
|
|
|
Product |
|
|
43,514 |
|
|
|
62,592 |
|
|
|
51,834 |
|
|
Support and maintenance |
|
|
10,250 |
|
|
|
18,338 |
|
|
|
21,204 |
|
|
Total gross profit |
|
|
53,764 |
|
|
|
80,930 |
|
|
|
73,038 |
|
|
Operating expenses: |
|
|
|
|
|
|
|
|
|
|
|
|
|
Research and development |
|
|
43,179 |
|
|
|
53,445 |
|
|
|
74,120 |
|
|
Sales and marketing |
|
|
87,993 |
|
|
|
108,903 |
|
|
|
112,685 |
|
|
General and administrative |
|
|
18,773 |
|
|
|
19,364 |
|
|
|
34,800 |
|
|
Restructuring charges |
|
|
— |
|
|
|
— |
|
|
|
899 |
|
|
Total operating expenses |
|
|
149,945 |
|
|
|
181,712 |
|
|
|
222,504 |
|
|
Loss from operations |
|
|
(96,181 |
) |
|
|
(100,782 |
) |
|
|
(149,466 |
) |
|
Other expense, net: |
|
|
|
|
|
|
|
|
|
|
|
|
|
Interest expense |
|
|
(4,407 |
) |
|
|
(5,231 |
) |
|
|
(8,448 |
) |
|
Other income, net |
|
|
254 |
|
|
|
677 |
|
|
|
733 |
|
|
Total other expense, net |
|
|
(4,153 |
) |
|
|
(4,554 |
) |
|
|
(7,715 |
) |
|
Loss before provision for income taxes |
|
|
(100,334 |
) |
|
|
(105,336 |
) |
|
|
(157,181 |
) |
|
Provision for income taxes |
|
|
634 |
|
|
|
465 |
|
|
|
478 |
|
|
Net loss |
|
$ |
(100,968 |
) |
|
$ |
(105,801 |
) |
|
$ |
(157,659 |
) |
|
Deemed dividend to Series E and E-1 Convertible Preferred Stock |
|
$ |
— |
|
|
$ |
— |
|
|
$ |
(6,588 |
) |
|
Impact of adjustment to Series E, E-1 and F Convertible Preferred Stock |
|
$ |
— |
|
|
$ |
— |
|
|
$ |
26,336 |
|
|
Net loss attributable to common stockholders |
|
$ |
(100,968 |
) |
|
$ |
(105,801 |
) |
|
$ |
(137,911 |
) |
|
Net loss per share attributable to common stockholders— basic and diluted |
|
$ |
(32.15 |
) |
|
$ |
(30.73 |
) |
|
$ |
(6.98 |
) |
|
Weighted-average shares used in computing net loss per share attributable to common stockholders—basic and diluted |
|
|
3,140,947 |
|
|
|
3,442,549 |
|
|
|
19,763,684 |
|
See accompanying notes to consolidated financial statements.
80
Consolidated Statements of Comprehensive Loss
(in thousands)
|
|
|
Year Ended January 31, |
|
|||||||||
|
|
2016 |
|
|
2017 |
|
|
2018 |
|
||||
|
Net loss |
|
$ |
(100,968 |
) |
|
$ |
(105,801 |
) |
|
$ |
(157,659 |
) |
|
Other comprehensive income (loss), net of taxes: |
|
|
|
|
|
|
|
|
|
|
|
|
|
Unrealized gains on available-for-sale investments |
|
|
(27 |
) |
|
|
14 |
|
|
|
— |
|
|
Foreign currency translation adjustments |
|
|
(28 |
) |
|
|
(274 |
) |
|
|
111 |
|
|
Comprehensive loss, net of taxes |
|
$ |
(101,023 |
) |
|
$ |
(106,061 |
) |
|
$ |
(157,548 |
) |
See accompanying notes to consolidated financial statements.
81
Consolidated Statements of Convertible Preferred Stock and Stockholders’ Deficit
(in thousands, except share and per share data)
|
|
|
|
|
|
|
|
|
|
|
|
|
|
|
|
|
|
|
|
|
|
|
|
Notes |
|
|
Accumulated |
|
|
|
|
|
|
|
|
|
|
|
|
|
||
|
|
|
Convertible |
|
|
|
|
|
|
Additional |
|
|
receivable |
|
|
other |
|
|
|
|
|
|
|
|
|
|
Total |
|
||||||||||||||
|
|
|
preferred stock |
|
|
|
Common stock |
|
|
paid-in |
|
|
from |
|
|
comprehensive |
|
|
Accumulated |
|
|
Treasury |
|
|
stockholders’ |
|
||||||||||||||||
|
|
|
Shares |
|
|
Amount |
|
|
|
Shares |
|
|
Amount |
|
|
capital |
|
|
stockholders |
|
|
loss |
|
|
deficit |
|
|
stock |
|
|
deficit |
|
||||||||||
|
Balance - January 31, 2015 |
|
|
7,782,781 |
|
|
$ |
134,371 |
|
|
|
|
3,131,353 |
|
|
$ |
1 |
|
|
$ |
11,464 |
|
|
$ |
(766 |
) |
|
$ |
(151 |
) |
|
$ |
(131,948 |
) |
|
$ |
— |
|
|
$ |
(121,400 |
) |
|
Issuance of Series F Convertible Preferred Stock at $44.04 per share for cash, net of issuance costs of $1,784 |
|
|
2,828,185 |
|
|
|
122,770 |
|
|
|
|
— |
|
|
|
— |
|
|
|
— |
|
|
|
— |
|
|
|
— |
|
|
|
— |
|
|
|
— |
|
|
|
— |
|
|
Issuance of common stock upon exercise of stock options |
|
|
— |
|
|
|
— |
|
|
|
|
329,717 |
|
|
|
— |
|
|
|
3,132 |
|
|
|
— |
|
|
|
— |
|
|
|
— |
|
|
|
— |
|
|
|
3,132 |
|
|
Repurchase of unvested early exercised stock options |
|
|
— |
|
|
|
— |
|
|
|
|
(1,702 |
) |
|
|
— |
|
|
|
(5 |
) |
|
|
— |
|
|
|
— |
|
|
|
— |
|
|
|
— |
|
|
|
(5 |
) |
|
Vesting of early exercise of stock options |
|
|
— |
|
|
|
— |
|
|
|
|
— |
|
|
|
— |
|
|
|
23 |
|
|
|
— |
|
|
|
— |
|
|
|
— |
|
|
|
— |
|
|
|
23 |
|
|
Vesting of stock options exercised with notes receivable |
|
|
— |
|
|
|
— |
|
|
|
|
— |
|
|
|
— |
|
|
|
556 |
|
|
|
(556 |
) |
|
|
— |
|
|
|
— |
|
|
|
— |
|
|
|
— |
|
|
Accrued interest for notes receivable from stockholders |
|
|
— |
|
|
|
— |
|
|
|
|
— |
|
|
|
— |
|
|
|
— |
|
|
|
(39 |
) |
|
|
— |
|
|
|
— |
|
|
|
— |
|
|
|
(39 |
) |
|
Stock-based compensation |
|
|
— |
|
|
|
— |
|
|
|
|
— |
|
|
|
— |
|
|
|
9,755 |
|
|
|
— |
|
|
|
— |
|
|
|
— |
|
|
|
— |
|
|
|
9,755 |
|
|
Other comprehensive loss |
|
|
— |
|
|
|
— |
|
|
|
|
— |
|
|
|
— |
|
|
|
— |
|
|
|
— |
|
|
|
(55 |
) |
|
|
— |
|
|
|
— |
|
|
|
(55 |
) |
|
Net loss |
|
|
— |
|
|
|
— |
|
|
|
|
— |
|
|
|
— |
|
|
|
— |
|
|
|
— |
|
|
|
— |
|
|
|
(100,968 |
) |
|
|
— |
|
|
|
(100,968 |
) |
|
Balance - January 31, 2016 |
|
|
10,610,966 |
|
|
|
257,141 |
|
|
|
|
3,459,368 |
|
|
|
1 |
|
|
|
24,925 |
|
|
|
(1,361 |
) |
|
|
(206 |
) |
|
|
(232,916 |
) |
|
|
— |
|
|
|
(209,557 |
) |
|
Issuance of common stock upon exercise of stock options |
|
|
— |
|
|
|
— |
|
|
|
|
168,380 |
|
|
|
— |
|
|
|
2,292 |
|
|
|
— |
|
|
|
— |
|
|
|
— |
|
|
|
— |
|
|
|
2,292 |
|
|
Vesting of early exercise of stock options |
|
|
— |
|
|
|
— |
|
|
|
|
— |
|
|
|
— |
|
|
|
65 |
|
|
|
— |
|
|
|
— |
|
|
|
— |
|
|
|
— |
|
|
|
65 |
|
|
Vesting of stock options exercised with notes receivable |
|
|
— |
|
|
|
— |
|
|
|
|
— |
|
|
|
— |
|
|
|
558 |
|
|
|
(558 |
) |
|
|
— |
|
|
|
— |
|
|
|
— |
|
|
|
— |
|
|
Proceeds from repayment of notes receivable from stockholder |
|
|
— |
|
|
|
— |
|
|
|
|
— |
|
|
|
— |
|
|
|
— |
|
|
|
411 |
|
|
|
— |
|
|
|
— |
|
|
|
— |
|
|
|
411 |
|
|
Accrued interest for notes receivable from stockholders |
|
|
— |
|
|
|
— |
|
|
|
|
— |
|
|
|
— |
|
|
|
— |
|
|
|
(36 |
) |
|
|
— |
|
|
|
— |
|
|
|
— |
|
|
|
(36 |
) |
|
Stock-based compensation |
|
|
— |
|
|
|
— |
|
|
|
|
— |
|
|
|
— |
|
|
|
13,834 |
|
|
|
— |
|
|
|
— |
|
|
|
— |
|
|
|
— |
|
|
|
13,834 |
|
|
Excess tax benefit from stock-based compensation |
|
|
— |
|
|
|
— |
|
|
|
|
— |
|
|
|
— |
|
|
|
71 |
|
|
|
— |
|
|
|
— |
|
|
|
— |
|
|
|
— |
|
|
|
71 |
|
|
Other comprehensive loss |
|
|
— |
|
|
|
— |
|
|
|
|
— |
|
|
|
— |
|
|
|
— |
|
|
|
— |
|
|
|
(260 |
) |
|
|
— |
|
|
|
— |
|
|
|
(260 |
) |
|
Net loss |
|
|
— |
|
|
|
— |
|
|
|
|
— |
|
|
|
— |
|
|
|
— |
|
|
|
— |
|
|
|
— |
|
|
|
(105,801 |
) |
|
|
— |
|
|
|
(105,801 |
) |
|
Balance - January 31, 2017 |
|
|
10,610,966 |
|
|
|
257,141 |
|
|
|
|
3,627,748 |
|
|
|
1 |
|
|
|
41,745 |
|
|
|
(1,544 |
) |
|
|
(466 |
) |
|
|
(338,717 |
) |
|
|
— |
|
|
|
(298,981 |
) |
|
Issuance of common stock upon exercise of stock options |
|
|
— |
|
|
|
— |
|
|
|
|
33,011 |
|
|
|
— |
|
|
|
470 |
|
|
|
— |
|
|
|
— |
|
|
|
— |
|
|
|
— |
|
|
|
470 |
|
|
Early exercise of stock options |
|
|
— |
|
|
|
— |
|
|
|
|
— |
|
|
|
— |
|
|
|
(665 |
) |
|
|
— |
|
|
|
— |
|
|
|
— |
|
|
|
— |
|
|
|
(665 |
) |
|
Vesting of early exercise of stock options |
|
|
— |
|
|
|
— |
|
|
|
|
— |
|
|
|
— |
|
|
|
891 |
|
|
|
— |
|
|
|
— |
|
|
|
— |
|
|
|
— |
|
|
|
891 |
|
|
Vesting of stock options exercised with notes receivable |
|
|
— |
|
|
|
— |
|
|
|
|
— |
|
|
|
— |
|
|
|
231 |
|
|
|
(231 |
) |
|
|
— |
|
|
|
— |
|
|
|
— |
|
|
|
— |
|
|
Accrued interest for notes receivable from stockholders |
|
|
— |
|
|
|
— |
|
|
|
|
— |
|
|
|
— |
|
|
|
— |
|
|
|
(19 |
) |
|
|
— |
|
|
|
— |
|
|
|
— |
|
|
|
(19 |
) |
|
Deemed dividend to Series E and E-1 Convertible Preferred Stock |
|
|
— |
|
|
|
6,588 |
|
|
|
|
— |
|
|
|
— |
|
|
|
— |
|
|
|
— |
|
|
|
— |
|
|
|
(6,588 |
) |
|
|
— |
|
|
|
(6,588 |
) |
|
Repayment of executive employee promissory notes through repurchase of common stock |
|
|
— |
|
|
|
— |
|
|
|
|
186,885 |
|
|
|
— |
|
|
|
— |
|
|
|
— |
|
|
|
— |
|
|
|
— |
|
|
|
— |
|
|
|
— |
|
|
Repurchase of common stock by way of note forgiveness |
|
|
— |
|
|
|
— |
|
|
|
|
(88,520 |
) |
|
|
— |
|
|
|
— |
|
|
|
1,044 |
|
|
|
— |
|
|
|
— |
|
|
|
(1,211 |
) |
|
|
(167 |
) |
|
Stock-based compensation |
|
|
— |
|
|
|
— |
|
|
|
|
— |
|
|
|
— |
|
|
|
51,818 |
|
|
|
— |
|
|
|
— |
|
|
|
— |
|
|
|
— |
|
|
|
51,818 |
|
|
Stock-based compensation reversal due to restructuring |
|
|
— |
|
|
|
— |
|
|
|
|
— |
|
|
|
— |
|
|
|
(738 |
) |
|
|
— |
|
|
|
— |
|
|
|
— |
|
|
|
— |
|
|
|
(738 |
) |
|
Conversion of convertible preferred stock to common stock |
|
|
(10,610,966 |
) |
|
|
(237,393 |
) |
|
|
|
17,992,973 |
|
|
|
1 |
|
|
|
237,392 |
|
|
|
— |
|
|
|
— |
|
|
|
— |
|
|
|
— |
|
|
|
237,393 |
|
|
Impact of adjustment to Series E, E-1, and F Convertible Preferred Stock |
|
|
— |
|
|
|
(26,336 |
) |
|
|
|
— |
|
|
|
— |
|
|
|
— |
|
|
|
— |
|
|
|
— |
|
|
|
26,336 |
|
|
|
— |
|
|
|
26,336 |
|
|
Reclassification of convertible preferred stock warrant liability to additional paid in capital |
|
|
— |
|
|
|
— |
|
|
|
|
— |
|
|
|
— |
|
|
|
375 |
|
|
|
— |
|
|
|
— |
|
|
|
— |
|
|
|
— |
|
|
|
375 |
|
|
Proceeds from initial public offering, net of underwriting discounts and commissions |
|
|
— |
|
|
|
— |
|
|
|
|
9,572,000 |
|
|
|
— |
|
|
|
62,314 |
|
|
|
— |
|
|
|
— |
|
|
|
— |
|
|
|
— |
|
|
|
62,314 |
|
|
Payment of offering costs |
|
|
— |
|
|
|
— |
|
|
|
|
— |
|
|
|
— |
|
|
|
(6,601 |
) |
|
|
— |
|
|
|
— |
|
|
|
— |
|
|
|
— |
|
|
|
(6,601 |
) |
|
Other comprehensive loss |
|
|
— |
|
|
|
— |
|
|
|
|
— |
|
|
|
— |
|
|
|
— |
|
|
|
— |
|
|
|
111 |
|
|
|
— |
|
|
|
— |
|
|
|
111 |
|
|
Net loss |
|
|
— |
|
|
|
— |
|
|
|
|
— |
|
|
|
— |
|
|
|
— |
|
|
|
— |
|
|
|
— |
|
|
|
(157,659 |
) |
|
|
— |
|
|
|
(157,659 |
) |
|
Balance - January 31, 2018 |
|
|
— |
|
|
$ |
— |
|
|
|
|
31,324,097 |
|
|
$ |
2 |
|
|
$ |
387,232 |
|
|
$ |
(750 |
) |
|
$ |
(355 |
) |
|
$ |
(476,628 |
) |
|
$ |
(1,211 |
) |
|
$ |
(91,710 |
) |
See accompanying notes to consolidated financial statements.
82
Consolidated Statements of Cash Flows
(in thousands)
|
|
|
Year Ended January 31, |
|
|||||||||
|
|
|
2016 |
|
|
2017 |
|
|
2018 |
|
|||
|
Cash flows from operating activities: |
|
|
|
|
|
|
|
|
|
|
|
|
|
Net loss |
|
$ |
(100,968 |
) |
|
$ |
(105,801 |
) |
|
$ |
(157,659 |
) |
|
Adjustments to reconcile net loss to net cash used in operating activities: |
|
|
|
|
|
|
|
|
|
|
|
|
|
Depreciation and amortization |
|
|
7,753 |
|
|
|
9,270 |
|
|
|
7,105 |
|
|
Stock-based compensation expense |
|
|
9,755 |
|
|
|
13,834 |
|
|
|
51,818 |
|
|
Excess tax benefit from stock-based compensation |
|
|
— |
|
|
|
71 |
|
|
|
— |
|
|
Accretion of balloon payment |
|
|
947 |
|
|
|
603 |
|
|
|
1,709 |
|
|
Amortization of debt issuance cost, credit facility fees and debt discounts |
|
|
670 |
|
|
|
239 |
|
|
|
241 |
|
|
Restructuring charges |
|
|
— |
|
|
|
— |
|
|
|
(974 |
) |
|
Other |
|
|
(39 |
) |
|
|
(36 |
) |
|
|
(16 |
) |
|
Changes in operating assets and liabilities: |
|
|
|
|
|
|
|
|
|
|
|
|
|
Accounts receivable |
|
|
(4,083 |
) |
|
|
(10,036 |
) |
|
|
13,027 |
|
|
Inventories |
|
|
1,821 |
|
|
|
(3,134 |
) |
|
|
(1,024 |
) |
|
Prepaid expenses and other assets |
|
|
(645 |
) |
|
|
(1,383 |
) |
|
|
550 |
|
|
Payment of offering costs |
|
|
— |
|
|
|
(2,348 |
) |
|
|
(4,253 |
) |
|
Accounts payable |
|
|
(1,095 |
) |
|
|
7,291 |
|
|
|
(6,354 |
) |
|
Deferred revenue |
|
|
18,842 |
|
|
|
14,581 |
|
|
|
5,216 |
|
|
Accrued and other liabilities |
|
|
4,933 |
|
|
|
6,483 |
|
|
|
(1,246 |
) |
|
Net cash used in operating activities |
|
|
(62,109 |
) |
|
|
(70,366 |
) |
|
|
(91,860 |
) |
|
Cash flows from investing activities: |
|
|
|
|
|
|
|
|
|
|
|
|
|
Purchase of property and equipment |
|
|
(10,914 |
) |
|
|
(4,337 |
) |
|
|
(6,415 |
) |
|
Purchase of investments |
|
|
(70,419 |
) |
|
|
(13,807 |
) |
|
|
(11,513 |
) |
|
Proceeds from maturities of investments |
|
|
6,350 |
|
|
|
76,478 |
|
|
|
11,513 |
|
|
Proceeds from disposition of investments |
|
|
18,574 |
|
|
|
— |
|
|
|
— |
|
|
Net cash provided by (used in) investing activities |
|
|
(56,409 |
) |
|
|
58,334 |
|
|
|
(6,415 |
) |
|
Cash flows from financing activities: |
|
|
|
|
|
|
|
|
|
|
|
|
|
Payment on capital lease financing |
|
|
(300 |
) |
|
|
(240 |
) |
|
|
(234 |
) |
|
Proceeds from issuance of convertible preferred stock, net of issuance costs |
|
|
122,770 |
|
|
|
— |
|
|
|
— |
|
|
Proceeds from revolving line of credit |
|
|
7,000 |
|
|
|
6,962 |
|
|
|
5,000 |
|
|
Proceeds from term loan |
|
|
35,000 |
|
|
|
— |
|
|
|
15,000 |
|
|
Repayment of revolving line of credit |
|
|
(6,000 |
) |
|
|
— |
|
|
|
— |
|
|
Proceeds from initial public offering, net of underwriting discounts and commissions |
|
|
— |
|
|
|
— |
|
|
|
62,314 |
|
|
Proceeds from repayment of employee notes receivable |
|
|
— |
|
|
|
411 |
|
|
|
— |
|
|
Proceeds from exercise of stock options |
|
|
3,132 |
|
|
|
2,292 |
|
|
|
470 |
|
|
Repurchase of common stock |
|
|
(5 |
) |
|
|
— |
|
|
|
— |
|
|
Net cash provided by financing activities |
|
|
161,597 |
|
|
|
9,425 |
|
|
|
82,550 |
|
|
Foreign exchange impact on cash and cash equivalents |
|
|
(2 |
) |
|
|
(61 |
) |
|
|
(42 |
) |
|
Net increase (decrease) in cash and cash equivalents |
|
|
43,077 |
|
|
|
(2,668 |
) |
|
|
(15,767 |
) |
|
Cash and cash equivalents, beginning of period |
|
|
7,639 |
|
|
|
50,716 |
|
|
|
48,048 |
|
|
Cash and cash equivalents, end of period |
|
$ |
50,716 |
|
|
$ |
48,048 |
|
|
$ |
32,281 |
|
|
Supplemental disclosures of cash flow information: |
|
|
|
|
|
|
|
|
|
|
|
|
|
Cash paid for income taxes |
|
$ |
361 |
|
|
$ |
912 |
|
|
$ |
145 |
|
|
Cash paid for interest |
|
$ |
2,411 |
|
|
$ |
4,038 |
|
|
$ |
6,573 |
|
|
Supplemental disclosures of noncash investing and financing activities: |
|
|
|
|
|
|
|
|
|
|
|
|
|
Common stock warrants issued to Series E-2 and F-2 holders |
|
$ |
— |
|
|
$ |
— |
|
|
$ |
14,641 |
|
|
Conversion of convertible preferred stock to common stock |
|
$ |
— |
|
|
$ |
— |
|
|
$ |
263,729 |
|
|
Vesting of early exercised options |
|
$ |
23 |
|
|
$ |
65 |
|
|
$ |
891 |
|
|
Assets acquired through accounts payable |
|
$ |
402 |
|
|
$ |
317 |
|
|
$ |
2,157 |
|
|
Transfer of inventory to sales demonstration equipment |
|
$ |
1,150 |
|
|
$ |
140 |
|
|
$ |
416 |
|
|
Deemed dividend to series E and E-1 Convertible Preferred Stock |
|
$ |
— |
|
|
$ |
— |
|
|
$ |
6,588 |
|
|
Impact of adjustment to Series E, E-1 and F Convertible Preferred Stock |
|
$ |
— |
|
|
$ |
— |
|
|
$ |
26,336 |
|
|
Repurchase of common stock by way of note forgiveness |
|
$ |
— |
|
|
$ |
— |
|
|
$ |
1,211 |
|
|
Repayment of executive employee promissory notes through repurchase of common stock |
|
$ |
— |
|
|
$ |
— |
|
|
$ |
7,899 |
|
See accompanying notes to consolidated financial statements.
83
Notes to Consolidated Financial Statements
(1) Business Overview
Description of Business
Tintri, Inc. (Tintri or the Company) was incorporated in the state of Delaware in 2008 and is headquartered in Mountain View, California. The Company develops and markets an enterprise cloud platform combining cloud management software technology and a range of all-flash and hybrid storage systems, for virtualized and cloud environments.
Initial Public Offering
In July 2017, the Company completed its initial public offering (IPO), in which it sold 8,572,000 shares of common stock. The shares were sold at an IPO price of $7.00 per share for net proceeds of $55.8 million, after deducting underwriting discounts and commissions of $4.2 million. Immediately prior to the closing of the Company’s IPO, all shares of the Company’s then-outstanding convertible preferred stock automatically converted into an aggregate 17,992,973 shares of common stock in accordance with the terms of each series of preferred stock.
Following the completion of the IPO, the IPO underwriters exercised an over-allotment option to purchase an additional 1,000,000 shares of common stock from the Company in August 2017. The additional shares were sold at the IPO price of $7.00 per share for net proceeds of $6.5 million, after deducting underwriting discounts and commissions of $0.5 million.
Liquidity and Going Concern
The accompanying consolidated financial statements have been prepared on the going concern basis, which contemplates the realization of assets and the satisfaction of liabilities in the normal course of business.
The Company has experienced negative cash flows from operations since its inception and expects negative cash flows from operations to continue for the foreseeable future. Net losses incurred during the years ended January 31, 2016, 2017, and 2018, amounted to $101.0 million, $105.8 million, and $157.7 million, respectively. Unless and until the Company is able to generate sufficient revenue from sales of its products and services to generate positive cash flows from operations, it expects such losses to continue. The Company is also subject to certain financial covenants related to its debt facilities that, if breached, could result in the debt becoming immediately due and payable in the event the lenders choose to declare an event of default. The Company may not have sufficient liquidity to repay amounts outstanding under its debt facilities should they become immediately due and payable. As of January 31, 2018, the Company was not in compliance with certain covenants contained in its credit facility with Silicon Valley Bank (SVB). In March 2018, the Company amended the credit facility with SVB in exchange for the waiver by SVB with respect to certain prior events of default (Note 15). In April 2018, the Company entered into an amended and restated loan agreement with SVB to, among other things, extend the maturity date of its credit facility to May 2, 2019. In April 2018, the Company also entered into an amendment with TriplePoint to extend the maturity date of its credit facility to August 2019.
Historically, the Company has funded a significant portion of its operations through the issuance of equity and debt. In the year ended January 31, 2016, the Company raised $124.6 million in gross proceeds (Note 7) related to the sale of convertible preferred stock. The Company has also entered into credit facilities, under which the Company had borrowed an aggregate of $69.0 million as of January 31, 2018, and drawn down $25.0 million from its Note Purchase Agreement in February and March 2018 (Notes 5 and 15). In July 2017, the Company completed its IPO, in which it raised $55.8 million, after deducting underwriting discounts and commission of $4.2 million. In August 2017, the Company sold an additional 1,000,000 shares of its common stock in connection with the IPO underwriters exercising an over-allotment option, pursuant to which the Company received net proceeds of $6.5 million, after deducting underwriting discounts and commissions.
84
The additional financing from the Company’s IPO, its existing cash and cash equivalents, amounts borrowed under its credit facilities and Note Purchase Agreement (Note 15), and its plan to continue to drive efficiencies in the Company’s sales organization and other business units, through efforts such as the September 2017 restructuring plan (Note 12) and the February 2018 and March 2018 restructuring plans (Note 15), may not allow the Company to meet its debt financial covenants as early as May 31, 2018. Further, regardless of the financial covenants the Company likely does not have sufficient cash to meet its obligations associated with its operating activities beyond June 30, 2018. As a result, there is substantial doubt about the Company’s ability to continue as a going concern.
While the Company’s plan to mitigate the conditions that are causing the substantial doubt is to raise additional debt or equity financing and/or work with its lenders to amend certain financial covenants, it cannot be assessed as that the Company will be successful. The Company’s ability to raise additional liquidity and/or amend its financial covenants is subject to a number of uncertainties, including, but not limited to, the market demand for the Company’s common or preferred stock, the Company’s financial performance and outlook, the market demand for the Company’s products and services, negative economic developments, adverse market conditions, significant delays in launch of new products and lack of market acceptance of new products.
If the Company is unable to successfully raise additional capital or otherwise address its liquidity requirements, it will likely fail to satisfy the minimum liquidity covenants of its credit facilities as early as the end of May 2018, which would constitute an event of default under those facilities and enable its lenders to demand immediate payment of all amounts due under those facilities. The Company does not currently have the ability to repay these amounts. Although the Company is seeking to raise additional debt or equity financing in order to remain in compliance with the financial covenants under its credit facilities, it may be unable to do so. As a result, the Company is currently undertaking a review of the potential business alternatives in addition to seeking additional capital, which may include restructuring or refinancing its indebtedness, undertaking additional restructuring plans, reducing or delaying capital expenditures, filing for bankruptcy protection, winding down its business, or selling the business or certain of its assets or operations.
Based on the Company’s assessment, it is probable that it will be unable to comply with its financial covenants through January 31, 2019, and it may fail to comply with certain financial covenants as early as May 31, 2018, and as such it has classified all outstanding balances as of January 31, 2018 as a current liability.
(2) Basis of Presentation and Summary of Significant Accounting Policies
Principles of Consolidation
The consolidated financial statements include the accounts of the Company and its wholly owned subsidiaries. All intercompany balances and transactions have been eliminated in consolidation.
Use of Estimates
The preparation of the accompanying consolidated financial statements in conformity with U.S. GAAP requires management to make estimates and assumptions that affect the amounts reported in the financial statements and accompanying notes. Such estimates include, but are not limited to, the determination of the fair value of deliverables included in multiple element revenue arrangements, valuation of inventories, warranty liability, the useful lives of property and equipment, fair value of the Company’s common stock, value of convertible preferred stock warrant liability, the value of stock options granted, accounting for income taxes, including the valuation reserve on deferred tax assets and accounting for uncertain tax positions, and contingencies. Management evaluates these estimates and assumptions on an ongoing basis using historical experience and other factors and makes adjustments when facts and circumstances dictate. As future events and their effects cannot be determined with precision, actual results could materially differ from those estimates and assumptions.
Concentrations
The Company’s financial instruments that are exposed to concentrations of credit risk are primarily cash and cash equivalents, investments, and accounts receivable. Cash and cash equivalents, and investments are maintained primarily at one financial institution, and deposits will generally exceed the amount of insurance provided on such
85
deposits. Risks associated with cash and cash equivalents, and investments are mitigated by banking with a creditworthy institution. The Company has not experienced any losses on its deposits of cash and cash equivalents or its investments.
The Company sells its products primarily through channel partners and distributors (collectively, Partners), and occasionally directly to customers.
The Company’s accounts receivable are unsecured and represent amounts due to the Company based on contractual obligations of the Company’s Partners and direct customers. The Company mitigates credit risk with respect to accounts receivable by performing ongoing credit evaluations of its Partners and direct customers to assess the probability of collection based on a number of factors, including, but not limited to, past transaction experience with its Partners and direct customers, evaluation of their credit history, limiting the credit extended, and review of the invoicing terms of the contract. The Company generally does not require its Partners and direct customers to provide collateral to support accounts receivable. The Company records an allowance for doubtful accounts for those receivables that are determined not to be collectible.
Partners or direct customers representing greater than 10% of the Company’s revenue and accounts receivable are as follows:
|
|
|
Revenue for the Year Ended January 31, |
|
|
Accounts Receivable as of January 31, |
|
|||||||
|
|
|
2016 |
|
2017 |
|
2018 |
|
|
2017 |
|
|
2018 |
|
|
Partner A |
|
* |
|
* |
|
26% |
|
|
16% |
|
|
26% |
|
|
* |
Represents less than 10%. |
The Company outsources substantially all of its manufacturing to one independent contract manufacturer. The inability of the manufacturer or supplier to fulfill the Company’s supply or quality requirements or performance failures of the Company’s products could result in lost sales and damage to the Company’s end-customer relationships, which would adversely impact the Company’s business, financial condition and operating results.
Foreign Currency Translation and Transactions
The financial position and operating results of the Company’s international subsidiaries in the United Kingdom, Japan, Ireland, Singapore, Australia, and Canada have been measured using their respective local currency as the functional currency. Assets and liabilities are translated into U.S. dollars at the exchange rate in effect on the respective consolidated balance sheet date. Revenue and expenses are translated into U.S. dollars using average exchange rates for the corresponding period. Translation adjustments are recorded within other comprehensive loss as a separate component of stockholders’ deficit. There is no income tax effect of currency translation adjustments related to foreign subsidiaries as the Company has no present intention of remitting the undistributed earnings of its foreign subsidiaries.
Gains and losses from the remeasurement of foreign currency-denominated balances into the functional currency are included in Other income, net in the Company’s consolidated statements of operations. Remeasurement gains and losses were immaterial in the years ended January 31, 2016, 2017, and 2018.
Fair Value of Financial Instruments
The carrying value of the Company’s financial instruments, including cash and cash equivalents, accounts receivable, investments, accounts payable and accrued and other current liabilities, approximates fair value due to the short period of time to maturity, receipt or payment. The carrying amount of the Company’s revolving line of credit and term loan approximates its fair value as the stated interest rates approximate market rates currently available to the Company.
86
The Company considers all highly liquid investments, such as money market funds, with original maturities of 90 days or less at date of purchase, to be cash equivalents. Cash and cash equivalents consist principally of checking account deposits and money market funds.
Accounts Receivable
Accounts receivable are recorded at the invoiced amounts and do not bear interest. The Company maintains an allowance for doubtful accounts for estimated losses inherent in its accounts receivable portfolio and an allowance for returns. An allowance for doubtful accounts is determined based on the aging of the Company’s trade receivables, historical experience, and management judgment. The Company writes off trade receivables against the allowance when management determines a balance is uncollectible and no longer actively pursues collection of the receivable. An allowance for returns is determined based on historical returns and management judgment. As of January 31, 2017 and 2018, allowance for doubtful accounts was $0.1 million and $0, respectively. Allowance for returns was $0.3 million and $0.4 million as of January 31, 2017 and 2018, respectively.
Inventories
Inventories consist primarily of raw materials related to component parts and finished goods. Finished goods include inventory held for sale, service inventory held at third-party service inventory depots in support of customer service agreements, and customer evaluation inventory.
The following is a summary of the Company’s inventories by major category (in thousands):
Inventory values are stated at the lower of cost (on a first-in, first-out method), or market value. A provision is recorded to adjust inventory to its estimated realizable value when inventory is determined to be in excess of anticipated demand or obsolete. Specifically, customer support inventory is written down to its net realizable value based upon the estimated loss of utility starting from the date the customer support inventory is placed in the third-party service inventory depots through the estimated period of service obligation fulfillment; and customer evaluation inventory is periodically reviewed and reserved for excess and obsolescence.
The Company recorded inventory write-downs of $1.8 million, $1.2 million, and $1.9 million for the years ended January 31, 2016, 2017, and 2018, respectively, of which $0.6 million, $0.2 million, and $0.3 million, respectively, were recorded in cost of product revenue and $1.2 million, $1.0 million, and $1.6 million, respectively, were recorded in cost of support and maintenance revenue in the consolidated statements of operations.
Investments
The Company’s primary objectives of its investment activities are to preserve principal, provide liquidity, and maximize income without significantly increasing risk. Some of the securities the Company invests in are subject to interest risk. To minimize this risk, the Company maintains its portfolio of cash, cash equivalents, short-term and long-term investments in a variety of securities, which may include commercial paper, money market funds, U.S. government and agency securities, and corporate debt securities.
The Company classifies its investments as available-for-sale at the time of purchase since it is intended that these investments are available for current operations, and include these investments on the accompanying consolidated balance sheets as either short-term or long-term investments depending on their maturity. Investments not considered cash equivalents and with maturities of one year or less from the consolidated balance sheet date are classified as short-term investments. Investments with maturities greater than one year from the consolidated balance sheet date are classified as long-term investments.
87
Investments are reported at fair value and are subject to periodic impairment review. Unrealized gains and losses related to changes in the fair value of these securities are recognized in accumulated other comprehensive loss net of tax, unless they are determined to be other-than-temporary impairments. The ultimate value realized on these securities is subject to market price volatility until they are sold.
Investments are considered impaired when a decline in fair value is judged to be other-than-temporary. The Company consults with investment managers and considers available quantitative and qualitative evidence in evaluating potential impairment of investments on a quarterly basis. If the cost of an individual investment exceeds its fair value, the Company evaluates, among other factors, general market conditions, the duration and extent to which the fair value is less than cost, and the Company’s intent and ability to hold the investment to maturity. Once a decline in fair value is determined to be other-than-temporary, an impairment charge is recorded and a new cost basis in the investment is established.
Property and Equipment, Net
Property and equipment, including leasehold improvements, are stated at cost, less accumulated depreciation and amortization. Depreciation is computed using the straight-line method over the estimated useful lives of the related assets. Depreciation on property and equipment, excluding leasehold improvements and sales demonstration equipment, ranges from 24 to 60 months. Sales demonstration equipment is depreciated over the estimated useful lives of the respective assets, which range up to 24 months.
Leasehold improvements are amortized over the shorter of the estimated useful lives of the respective assets or the remaining property lease terms, which range up to eight years.
Upon the retirement or disposition of property and equipment, the related costs and accumulated depreciation are removed and any related gain or loss is recorded in the consolidated statements of operations as an operating expense.
Impairment of Long-Lived Assets
The Company evaluates events and changes in circumstances that could indicate carrying amounts of long-lived assets, consisting of property and equipment, may not be recoverable. When such events or changes in circumstances occur, the Company assesses the recoverability of long-lived assets by determining whether or not the carrying value of such assets will be recovered through undiscounted expected future cash flows. If the total of the future undiscounted cash flows is less than the carrying amount of an asset, the Company records an impairment charge for the amount by which the carrying amount of the asset exceeds the fair value of the asset. When the Company determines that the useful lives of assets are shorter than was originally estimated, the Company accelerates the rate of depreciation over the assets’ new, shorter useful lives. Through January 31, 2018, the Company did not write down any of its long-lived assets as a result of impairment.
Warranties
The Company provides a one-year warranty for hardware components covering material defects in materials and workmanship. In addition, the Company provides a 90-day warranty on the software in its products for nonconformance with documented specifications.
With respect to the hardware warranty obligation, the Company’s contract manufacturer is generally required to repair or replace defective hardware resulting from defective workmanship within one year of shipment. Furthermore, the Company’s support contracts provide for the same parts replacement that end-users are entitled to under the warranty program, except that replacement parts are delivered according to targeted response times to minimize disruption to the end-users’ critical business applications. Substantially all end-users purchase support contracts.
Given that substantially all products are sold together with support contracts, the Company has limited exposure related to warranty costs and therefore no warranty reserve has been recorded.
88
The Company generates revenue from sales of enterprise cloud platform solutions and related support and maintenance. The Company derives revenue primarily from two sources: (i) Product revenue, which includes hardware and perpetual software license revenue and (ii) Support and maintenance revenue, which includes support, installation services and training. Revenue is recognized when all of the following criteria are met: persuasive evidence of an arrangement exists; the product or service has been delivered; the sales price is fixed or determinable; and collection is reasonably assured.
The Company defines each of the four criteria above as follows:
|
|
• |
Persuasive Evidence of an Arrangement Exists. The Company uses stand-alone purchase orders, signed sales quotations or purchase orders pursuant to the terms and conditions of a master sales agreement to support the evidence of an arrangement with Partners and direct customers. |
|
|
• |
Delivery has Occurred. The Company uses shipping documentation to verify delivery of products. Provided that all other revenue recognition criteria have been met, the Company typically recognizes product revenue upon shipment, as title and risk of loss are transferred at that time. Products are typically shipped directly by the Company to Partners and direct customers. Support and maintenance revenue is recognized over time as the services are delivered. The Company generally does not have significant obligations for future performance, such as rights of return or pricing credits, associated with the sales of its products. It is the Company’s practice to identify an end user prior to shipment to a Partner. |
|
|
• |
The Sales Price is Fixed or Determinable. The Company assesses whether the fee is fixed or determinable based on the payment terms associated with the transaction. If the terms are extended beyond the Company’s normal payment terms, the Company will recognize revenue as the payments become due. Payments from Partners are not contingent on the Partners’ receiving payment from the end-users. |
|
|
• |
Collection is Reasonably Assured. The Company assesses probability of collection on an individual basis. The Company’s Partners or customers are subjected to a credit review process that evaluates their financial condition and ability to pay. |
Support and maintenance revenue includes arrangements for software and technical support for the Company’s products. While purchasing support and maintenance is not mandatory, substantially all products shipped have been purchased together with a support contract. Support is offered under renewable, fee-based contracts and includes technical support, hardware repair and replacement parts, and software patches, bug fixes, updates, and upgrades. Support and maintenance revenue is initially deferred and recognized ratably over the life of the contract, with the related expenses, including the write down of customer support inventory to its net realizable value, recognized as incurred. Support and maintenance contracts range from one to five years. Unearned support revenue is included in deferred revenue.
Professional service revenue primarily consists of fees the Company earns related to installation. While installation services are not contractually mandatory, customers occasionally purchase such services. The Company generally recognizes revenue from installation services upon delivery or completion of performance. Installation services are typically short term in nature. To date, revenue arising from installation service has been insignificant.
The Company reports revenue net of sales taxes. Shipping charges billed to customers are included in product revenue and the related shipping and handling costs are included in cost of product revenue.
Multiple Element Arrangements
The Company’s offering consists of hardware products containing software components that function together to provide the essential functionality of the product. Therefore, the Company’s hardware products (inclusive of the core software) are considered non-software deliverables and are not subject to industry-specific software revenue recognition guidance.
89
The Company’s product revenue also includes revenue from the sale of stand-alone software products. Stand-alone software may operate on the Company’s hardware product, but is not considered essential to the functionality of the hardware and is subject to the industry-specific software revenue recognition guidance.
The Company’s typical multiple element arrangement includes hardware product (including the essential software) and support. The Company may also sell stand-alone software as part of its multiple element arrangements. The Company considers each of these deliverables to be separate units of accounting based on whether the delivered items have stand-alone value. The Company has determined that each unit of accounting has stand-alone value because they are sold separately by the Company or, for hardware products, because the customers can resell them to others on a stand-alone basis.
For certain arrangements with multiple deliverables, the Company allocates the arrangement fee to the non-software element based upon the relative selling price of such element and, if software and software-related elements such as support for the software element are also included in the arrangement, the Company allocates the arrangement fee to those software and software-related elements as a group. After such allocations are made, the amount of the arrangement fee allocated to the software and software-related elements is accounted for using the residual method. When applying the relative selling price method, the Company determines the selling price for each element using vendor-specific objective evidence (VSOE) of selling price, if it exists, or if not, third-party evidence (TPE) of selling price, if it exists. If neither VSOE nor TPE of selling price exist for an element, the Company uses its best estimated selling price (BESP) for that element. The revenue allocated to each element is then recognized when the basic revenue recognition criteria are met for that element.
When an arrangement includes stand-alone software products and related support, consideration is allocated to the software deliverable as described above. The Company uses the residual method to recognize revenue related to this consideration when a product agreement includes one or more elements to be delivered at a future date and VSOE of the fair value of all undelivered elements exists. In the majority of the Company’s contracts, the only element that remains undelivered at the time of delivery of the product is support services. Under the residual method, the VSOE of fair value of the undelivered elements is deferred and the remaining portion of the contract fee is recognized upfront as product revenue. If evidence of the VSOE of fair value of the undelivered elements does not exist, all revenue is deferred and recognized at the earlier of (i) when delivery of those elements occurs or (ii) when fair value can be established unless support services is the only undelivered element, in which case, the entire arrangement fee is recognized ratably over the contractual period of the support services.
VSOE of fair value for elements of an arrangement is based upon the normal pricing and discounting practices for those deliverables when sold separately. In determining VSOE, the Company requires that a substantial majority of the selling prices for a deliverable fall within a reasonably narrow pricing range, evidenced by a substantial majority of such historical stand-alone transactions falling within a reasonably narrow range.
The Company is not able to determine TPE for its products or services. TPE is determined based on competitor prices for similar deliverables when sold separately. Generally, the Company’s go-to-market strategy differs from that of its peers and its offerings contain a significant level of differentiation such that the comparable pricing of products with similar functionality cannot be obtained. Furthermore, the Company is unable to reliably determine what similar competitor products’ selling prices are on a stand-alone basis.
When the Company is unable to establish the selling price of its deliverables using VSOE or TPE, the Company uses BESP in its allocation of arrangement consideration. The objective of BESP is to determine the price at which we would transact a sale if the product or service were sold on a stand-alone basis. The Company determines BESP for the purposes of allocating the arrangement by reviewing market factors including, but not limited to, pricing practices including discounting, the geographies in which the Company offers its products and services, and the type of customer (i.e., Partners or direct customers). Additionally, the Company considers historical transactions, including transactions whereby the deliverable was sold on a stand-alone basis.
Deferred revenue consists of billings or payments received in advance of revenue recognition and primarily relates to support and maintenance. Deferred revenue that will be recognized during the twelve-month period following the balance sheet date is recorded as Deferred revenue, current and the remaining portion is recorded as Deferred revenue, non-current.
90
Research and development expense consists of personnel costs, including stock-based compensation expense, for the Company’s research and development personnel and product development costs, including engineering services, development software and hardware tools, depreciation of capital equipment, facility costs, and information technology spend. Research and development costs are expensed as incurred.
All costs incurred in the research and development of the Company’s software products are expensed as incurred until technological feasibility has been established. As of January 31, 2017 and 2018, there were no capitalized computer software development costs as the time between technological feasibility and general release is short.
Advertising Costs
Advertising costs are expensed as incurred and are included in sales and marketing expense. Advertising costs for the years ended January 31, 2016, 2017, and 2018, were $1.1 million, $0.8 million, and $2.3 million, respectively.
Commission Costs
Commission costs are expensed as incurred and are included in sales and marketing expense.
Stock-Based Compensation
Stock Options
The Company measures and recognizes compensation expense for all stock-based awards made to employees based on estimated fair values on the date of grant. The Company uses the Black-Scholes option pricing model to estimate the value of stock-based compensation expense for all stock options. The related stock-based compensation expense is recognized on a straight-line basis, over the period in which an employee is required to provide service in exchange for the stock-based award, which is generally four years.
Restricted Stock Units
Stock-based compensation expense is measured and recognized in the financial statements based on the fair value of the Company’s common stock on the date of grant. Stock-based compensation expense is recognized over the requisite service period, and upon performance conditions being met.
Income Taxes
The Company recognizes income taxes under the asset-and-liability method. The Company recognizes deferred income tax assets and liabilities for the expected future consequences of temporary differences between the financial reporting and tax bases of assets and liabilities. These differences are measured using the enacted statutory tax rates that are expected to apply to taxable income for the years in which differences are expected to reverse. The Company recognizes the effect on deferred income taxes of a change in tax rates in income in the period that includes the enactment date.
The Company records a valuation allowance to reduce its deferred tax assets to the net amount that the Company believes is more likely than not to be realized. The Company considers all available evidence, both positive and negative, including historical levels of income, expectations and risks associated with estimates of future taxable income, and ongoing tax planning strategies in assessing the need for a valuation allowance. Realization of deferred tax assets is dependent upon the generation of future taxable income, if any, the timing and amount of which are uncertain. Due to the history of losses the Company has generated in the past, the Company believes that it is not more likely than not that the deferred tax assets will be realized as of January 31, 2018. Accordingly, the Company has recorded a full valuation allowance on its net deferred tax assets.
91
The Company recognizes tax benefits from uncertain tax positions only if they believe that it is more likely than not that the tax position will be sustained on examination by the taxing authorities based on the technical merits of the position. The Company makes adjustments to these reserves when facts and circumstances change, such as the closing of a tax audit or the refinement of an estimate. The provision for income taxes includes the effects of any reserves that are considered appropriate, as well as the related net interest and penalties.
The Company expects to permanently reinvest undistributed earnings in foreign subsidiaries outside of the United States to fund future foreign operations. The Company projects that it will have sufficient cash flow in the United States and will not need to repatriate the foreign earnings to finance its domestic operations. If the Company were to distribute these earnings to the United States, it would be subject to U.S. income taxes, less any allowable foreign tax credits, and foreign withholding taxes. The Company has not recorded a deferred tax liability on any portion of its undistributed earnings in foreign subsidiaries. If the Company were to repatriate these earnings to the United States, any associated income tax liability would be insignificant.
Recently Issued and Not Yet Adopted Accounting Pronouncements
In May 2017, the Financial Accounting Standard Board (FASB) issued Accounting Standards Update (ASU) No. 2017-09, Scope of Modification Accounting. The standard provides guidance about which changes to the terms or conditions of a share-based payment award require an entity to apply modification accounting. The standard is effective for the Company in the first quarter of fiscal year 2019. The Company does not expect the adoption of this standard to have a significant impact on its consolidated financial statements.
In August 2016, FASB issued ASU No. 2016-15, Classification of Certain Cash Receipts and Cash Payments. The standard provides new authoritative guidance addressing eight specific cash flow issues with the objective of reducing the existing diversity in practice in how certain transactions are presented and classified in the statement of cash flows. The standard is effective for the Company in the first quarter of fiscal year 2019. The Company does not expect the adoption of this standard to have a significant impact on its consolidated financial statements.
In February 2016, FASB issued ASU No. 2016-02, Leases. The standard increases transparency and comparability among organizations by requiring companies to recognize leased assets and related liabilities on the balance sheet and disclose key information about leasing arrangements. This standard is effective for the Company in the first quarter of fiscal year 2020. The Company is evaluating the impact the adoption of this standard will have on its consolidated financial statements.
In May 2014, FASB issued ASU, 2014-09, Revenue from Contracts with Customers. The standard is a comprehensive new revenue recognition model that requires revenue to be recognized in a manner to depict the transfer of goods or services to a customer at an amount that reflects the consideration expected to be received in exchange for those goods or services. In August 2015, FASB issued ASU 2015-14, Revenue from Contracts with Customers, to defer the effective date of ASU 2014-09 by one year to annual reporting periods beginning after December 15, 2017, but permits entities to adopt the original effective date if they choose. The standard will be applied using either the full or modified retrospective adoption methods. The Company will adopt the new standard in its first quarter of fiscal 2019 using the full retrospective adoption method.
The most significantly impacted areas relate to the deferral of costs to obtain a contract, which are primarily commission expense directly incurred as a result of sales of products and related support, and the upfront revenue recognition of the amount allocated from support and maintenance to products for certain arrangements, as the requirement relating to the contingency of the performance of the service is eliminated in the new standard. Costs to obtain a contract will be amortized on a systematic basis that is consistent with the pattern of revenue recognition of the related performance obligation, which may be at a point in time for product, or over time for support and maintenance contract, which range from one to five years.
Based on the Company’s preliminary assessment, it does not expect the adoption of the standard to result in material changes in revenue or deferred revenue. Any changes to revenue and deferred revenue will be driven by the upfront recognition of revenue allocated from support and maintenance to products for certain arrangements for which the contingency on the performance of the service no longer exists. Further, deferred costs to obtain contracts, which will be recognized in sales and marketing expense in future periods, are not expected to be material.
92
The adoption of the standard will have no significant impact to the provision for income taxes and will have no impact to the net cash used in, or provided by, operating, investing, or financing activities on the Company's consolidated statements of cash flows.
The Company is finalizing the impact of the standard on its consolidated financial statements and disclosures, as well as changes to its systems, processes, and internal controls. The Company's preliminary assessments are subject to change.
(3) Fair Value Measurements
The Company categorizes assets and liabilities recorded at fair value on its consolidated balance sheets based on the accounting guidance framework for measuring fair value on either a recurring or nonrecurring basis, whereby inputs used in valuation techniques are assigned a hierarchical level.
Fair value is defined as the exchange price that would be received for an asset or paid to transfer a liability (an exit price) in the principal or most advantageous market for the asset or liability in an orderly transaction between market participants on the measurement date. Valuation techniques used to measure fair value must maximize the use of observable inputs and minimize the use of unobservable inputs. U.S. GAAP describes a fair value hierarchy based on three levels of inputs, of which the first two are considered observable and the last unobservable, to measure the fair value:
|
|
• |
Level 1—Inputs are unadjusted quoted prices in active markets for identical assets or liabilities. |
|
|
• |
Level 2—Inputs are quoted prices for similar assets and liabilities in active markets; or quoted prices for identical assets or liabilities in less active markets; or benchmark yields, reported trades, broker/dealer quotes or inputs other than quoted prices that are observable for the assets or liabilities, either directly or indirectly through market corroboration, for substantially the full term of the financial instruments. The valuation techniques leverage an independent professional pricing service that uses calculated prices whereby securities with short maturities and infrequent secondary market trades are typically priced via mathematical calculations, cross-market approach, and model valuation methods, which are corroborated by market data. |
|
|
• |
Level 3—Inputs are unobservable inputs based on the Company’s own assumptions used to measure assets and liabilities at fair value. The inputs require significant management judgment or estimation. |
Fair value estimates are made at a specific point in time based on relevant market information and information about the financial or nonfinancial asset or liability. These estimates are subjective in nature and involve uncertainties or significant judgment and, therefore, cannot be determined with precision. Changes in assumptions could significantly affect the estimates.
The following table presents the fair value of the Company’s financial assets and liabilities using the above input categories as of January 31, 2017 and 2018 (in thousands):
|
|
As of January 31, 2017 |
|
||||||||||||||
|
|
|
Level 1 |
|
|
Level 2 |
|
|
Level 3 |
|
|
Total |
|
||||
|
Cash equivalents: |
|
|
|
|
|
|
|
|
|
|
|
|
|
|
|
|
|
Money market funds |
|
$ |
31,468 |
|
|
$ |
— |
|
|
$ |
— |
|
|
$ |
31,468 |
|
|
Total cash equivalents |
|
|
31,468 |
|
|
|
— |
|
|
|
— |
|
|
|
31,468 |
|
|
Total assets measured at fair value |
|
$ |
31,468 |
|
|
$ |
— |
|
|
$ |
— |
|
|
$ |
31,468 |
|
|
Convertible preferred warrants: |
|
|
|
|
|
|
|
|
|
|
|
|
|
|
|
|
|
Series E Convertible Preferred Stock warrants(1) |
|
$ |
— |
|
|
$ |
— |
|
|
$ |
568 |
|
|
$ |
568 |
|
|
Total convertible preferred stock warrants |
|
|
— |
|
|
|
— |
|
|
|
568 |
|
|
|
568 |
|
|
Total liabilities measured at fair value |
|
$ |
— |
|
|
$ |
— |
|
|
$ |
568 |
|
|
$ |
568 |
|
93
|
|
|
As of January 31, 2018 |
|
|||||||||||||
|
|
|
Level 1 |
|
|
Level 2 |
|
|
Level 3 |
|
|
Total |
|
||||
|
Cash equivalents: |
|
|
|
|
|
|
|
|
|
|
|
|
|
|
|
|
|
Money market funds |
|
$ |
11,735 |
|
|
$ |
— |
|
|
$ |
— |
|
|
$ |
11,735 |
|
|
Total cash equivalents |
|
|
11,735 |
|
|
|
— |
|
|
|
— |
|
|
|
11,735 |
|
|
Total assets measured at fair value |
|
$ |
11,735 |
|
|
$ |
— |
|
|
$ |
— |
|
|
$ |
11,735 |
|
|
(1) |
Series E Convertible Preferred Stock Convertible Preferred Stock warrant liability is included in Other long-term liabilities in the accompanying consolidated balance sheets. Immediately prior to the closing of the IPO, all convertible preferred stock warrants automatically converted into common stock warrants. |
A summary of the changes in the fair value of the Company’s convertible preferred stock warrant liability is as follows (in thousands):
|
|
|
As of January 31, |
|
|||||
|
|
|
2017 |
|
|
2018 |
|
||
|
Convertible preferred stock warrant liability—beginning balance |
|
$ |
532 |
|
|
$ |
568 |
|
|
Change in fair value(1) |
|
|
36 |
|
|
|
(470 |
) |
|
Issuance of convertible preferred stock warrants |
|
|
— |
|
|
|
277 |
|
|
Reclassification of convertible preferred stock warrant liability to additional paid in capital |
|
|
— |
|
|
|
(375 |
) |
|
Convertible preferred stock warrant liability—ending balance |
|
$ |
568 |
|
|
$ |
— |
|
|
(1) |
Recorded in the consolidated statements of operations within Other income, net. |
The Company did not have any material financial assets or liabilities for which fair value is determined using Level 3 inputs other than convertible preferred stock warrants and common stock warrants, which are discussed further in Note 7 Convertible Preferred Stock and Note 8 Common Stock, respectively.
(4) Balance Sheet Components
Property and Equipment, Net
Property and equipment, net consist of the following (in thousands):
|
|
|
As of January 31, |
|
|||||
|
|
|
2017 |
|
|
2018 |
|
||
|
Computer equipment |
|
$ |
17,431 |
|
|
$ |
20,176 |
|
|
Sales demonstration equipment |
|
|
5,903 |
|
|
|
7,656 |
|
|
Leasehold improvements |
|
|
5,941 |
|
|
|
6,010 |
|
|
Furniture and fixtures |
|
|
1,550 |
|
|
|
2,046 |
|
|
Beta equipment |
|
|
1,060 |
|
|
|
1,706 |
|
|
Software |
|
|
649 |
|
|
|
660 |
|
|
Construction in progress |
|
|
39 |
|
|
|
2,825 |
|
|
Total property and equipment |
|
|
32,573 |
|
|
|
41,079 |
|
|
Less accumulated depreciation and amortization |
|
|
(22,163 |
) |
|
|
(28,833 |
) |
|
Total property and equipment, net |
|
$ |
10,410 |
|
|
$ |
12,246 |
|
Depreciation and amortization expense related to property and equipment for the years ended January 31, 2016, 2017, and 2018, was $7.8 million, $9.3 million, and $7.1 million, respectively.
94
Accrued and Other Current Liabilities
Accrued and other current liabilities consist of the following (in thousands):
|
|
|
As of January 31, |
|
|||||
|
|
|
2017 |
|
|
2018 |
|
||
|
Accrued vacation |
|
$ |
3,561 |
|
|
$ |
3,511 |
|
|
Accrued interest |
|
|
61 |
|
|
|
3,141 |
|
|
Accrued sales commissions |
|
|
4,706 |
|
|
|
2,567 |
|
|
Accrued sales and use taxes payable |
|
|
1,697 |
|
|
|
2,060 |
|
|
Accrued bonus |
|
|
2,427 |
|
|
|
1,417 |
|
|
Other accruals |
|
|
8,216 |
|
|
|
10,605 |
|
|
Total accrued and other current liabilities |
|
$ |
20,668 |
|
|
$ |
23,301 |
|
(5) Debt Obligations
Debt obligations, net of debt discount and deferred financing costs, consist of the following (in thousands):
|
|
|
As of January 31, |
|
|||||
|
|
|
2017 |
|
|
2018 |
|
||
|
Revolving line of credit |
|
$ |
13,962 |
|
|
$ |
18,962 |
|
|
Term loan |
|
|
34,952 |
|
|
|
49,676 |
|
|
Total debt |
|
|
48,914 |
|
|
|
68,638 |
|
|
Less current portion of debt |
|
|
— |
|
|
|
(68,638 |
) |
|
Total long-term portion of debt |
|
$ |
48,914 |
|
|
$ |
— |
|
As of January 31, 2018, the Company has a credit facility with TriplePoint (Facility Agreement) that provides up to $50.0 million of available funds. This credit facility is secured by a security interest, junior to the SVB facility described below, on substantially all of the Company’s assets, including its intellectual property, and contains certain customary non-financial restrictive covenants.
In connection with the Facility Agreement, the Company issued a warrant which was initially exercisable upon issuance for 17,030 shares of Series F Convertible Preferred Stock at an exercise price of $14.68 per share. The warrant provided that, upon additional loan being made available and drawn, the warrant would become exercisable for an additional 11,353 shares of Series F Convertible Preferred Stock at the same exercise price of $14.68 per share. The warrant expires in February 2024.
As of January 31, 2018, $50.0 million was outstanding under the Facility Agreement. Of such amount, $15.0 million bears interest at 9.0% per year and becomes due in February 2019. The remaining $35.0 million bears interest at 11.25% per year and also becomes due in February 2019. If the Company, on or before February 2019, prepays a minimum of $20.0 million of the total $50.0 million of principal outstanding under this facility and pays an amortization fee to TriplePoint and complies with certain other conditions, the maturity of the remaining $30.0 million outstanding principal balance will be extended to August 2020, subject to the Company making equal monthly amortizing payments of principal and interest through the extended maturity date, calculated at an interest rate equal to 1.50% higher than the rate that previously applied.
In April 2018, the Company entered into an amendment with TriplePoint to extend the maturity date of its credit facility to August 2019 (Note 15).
The Company also has a revolving line of credit with SVB, from which an amount based on a percentage of qualifying accounts receivable is available for the Company to borrow, as well as an amount available on a non-formula basis, up to a total of $20.0 million. This facility is secured by a security interest, senior to the TriplePoint facility described above, on substantially all of the Company’s assets, including its intellectual property, and is subject to certain financial covenants. This facility expired in May 2018. As of January 31, 2018, $19.0 million was outstanding under this facility, which bears weighted average interest of 5.09% per year.
95
As of January 31, 2018, the Company was not in compliance with certain covenants contained in its credit facility with SVB.
In March 2018, the Company entered into a Waiver and Tenth Amendment to Loan and Security Agreement (the Tenth Amendment) with SVB. The Tenth Amendment provides for the interest rate on amounts outstanding under the Loan Agreement shall be equal to the prime rate plus 1.85% per annum through March 31, 2018, in exchange for the waiver by SVB with respect to certain prior events of default, in each case subject to the terms and conditions set forth in the Tenth Amendment. Further, in April 2018, the Company entered into an amended and restated loan agreement with SVB to, among other things, extend the maturity date of its credit facility (Note 15).
Amortization of credit facility fees and debt issuance costs and discounts to interest expense under the line of credit and the credit facility was $0.5 million, $0.2 million, and $0.2 million for the years ended January 31, 2016, 2017, and 2018, respectively. The credit facility fee balance was $0 as of both January 31, 2017 and 2018. The debt issuance costs and discounts balance was $0 and $0.3 million as of January 31, 2017 and 2018, respectively. The accreted balloon payment balance as of January 31, 2017 and 2018, was $1.4 million and $3.0 million, respectively.
In May 2017, the Company entered into a Note Purchase Agreement with certain of its stockholders pursuant to which such stockholders have agreed to purchase from the Company, and the Company has agreed to sell to such stockholders, one or more subordinated convertible promissory notes (Convertible Promissory Notes) having a maximum aggregate principal amount of $25.0 million. Subject to the terms and conditions set forth in the Note Purchase Agreement, the Convertible Promissory Notes may be issued and sold in one or more tranches (each a Tranche) in aggregate amounts to be determined by the Company pursuant to approval of a majority of the members of the Company’s board of directors. Within 30 days of the Company providing a written notice to the relevant stockholders that the Company intends to draw funds under a Tranche, the stockholders shall purchase the required Convertible Promissory Notes.
In June 2017, the Company entered into an amendment to the Note Purchase Agreement with certain of its stockholders. Pursuant to the amendment, the obligations of the Company to issue and the stockholders to purchase Convertible Promissory Notes was to expire upon the earlier to occur of December 31, 2019, or a change of control of the Company. In addition, at any time on or after December 1, 2019, at the Company’s election, pursuant to the approval of a majority of the members of the Company’s board of directors, the Convertible Promissory Notes will convert into shares of the Company’s common stock at the IPO price of $7.00 per share, provided that any Convertible Promissory Notes issued to entities affiliated with one of the Company’s existing stockholders that is a party to the Note Purchase Agreement will be converted at the average price of the Company’s common stock on the NASDAQ Stock Market over the 30-day period preceding the conversion.
As of January 31, 2018, no Convertible Promissory Notes were issued under the Note Purchase Agreement. In February and March 2018, the Company issued an aggregate of $25.0 million of Notes under the Note Purchase Agreement, which mature in August 2019 (Note 15).
As of January 31, 2018, scheduled principal payments on the outstanding borrowings are as follows (in thousands):
|
As of January 31, 2018: |
|
|
|
|
|
2019(2)(3)(4) |
|
$ |
18,962 |
|
|
2020(2)(3)(4) |
|
|
50,000 |
|
|
Total(1) |
|
|
68,962 |
|
|
Less debt discount |
|
|
(324 |
) |
|
Less current portion(2)(3) |
|
|
(68,638 |
) |
|
Non-current portion(1)(2)(3) |
|
$ |
— |
|
|
(1) |
In February and March 2018, the Company issued an aggregate of $25.0 million of Notes under the Note Purchase Agreement (Note 15). |
|
(2) |
In April 2018, the Company entered into an amendment with TriplePoint to extend the maturity date of its credit facility to August 2019 (Note 15). |
96
|
(4) |
Based on the Company’s assessment, it is probable that it will be unable to comply with its financial covenants through January 31, 2019, and it may fail to comply with certain financial covenants as early as May 31, 2018, and as such it has classified all outstanding debt balances as of January 31, 2018 as a current liability. |
(6) Commitments and Contingencies
Leases
The Company has entered into various non-cancelable operating lease agreements and capital lease agreements for its offices and equipment with lease periods expiring between fiscal 2018 and 2023. Certain of these arrangements have escalating rent payment provisions and optional renewal clauses. The Company is also committed to pay a portion of the actual operating expenses under certain of these operating lease agreements. As of January 31, 2018, future minimum lease payments under non-cancelable operating leases were as follows (in thousands):
|
As of January 31, 2018: |
|
|
|
|
|
2019 |
|
$ |
7,145 |
|
|
2020 |
|
|
7,175 |
|
|
2021 |
|
|
7,204 |
|
|
2022 |
|
|
7,233 |
|
|
2023 |
|
|
3,984 |
|
|
Committed gross lease payments |
|
|
32,741 |
|
|
Less proceeds from sublease rental |
|
|
(3,012 |
) |
|
Net operating lease obligation |
|
$ |
29,729 |
|
In February 2018, the Company terminated its lease of certain office space located at 205 Ravendale Drive, Mountain View, California (Note 15).
The Company recognizes rent expense under its operating leases on a straight-line basis. Rent expense totaled $4.3 million, $5.3 million, and $6.3 million for the years ended January 31, 2016, 2017, and 2018, respectively.
As of January 31, 2018, future minimum lease payments under non-cancelable capital leases were as follows (in thousands):
Contingencies
Following the Company’s initial public offering in July 2017, four class action lawsuits were filed against it. On September 18, 2017, a securities class action lawsuit was filed against the Company and is now pending in the United States District Court for the Northern District of California, under the caption Tuller v. Tintri, Inc. et al., No. 4:17-CV-05714-YGR (filed Sept. 18, 2017). A consolidated complaint has been filed in the Tuller action, which, in
97
addition to the Company, names as defendants the then-Chief Executive Officer, the then-Chief Financial Officer, and the Chief Technology Officer, and alleges violations of Sections 11, 12(a)(2), and 15 of the Securities Act of 1933. The Company filed a motion to dismiss on March 30, 2018.
Three substantially similar lawsuits were subsequently filed in California state court in the County of San Mateo against the same parties, as well as the then-serving members of the Company’s Board of Directors, the underwriters of the Company’s initial public offering, and entities associated with several institutional investors that invested in the Company prior to the initial public offering. These suits also allege violations of Sections 11, 12(a)(2), and 15 of the Securities Act of 1933, and are captioned Clayton v. Tintri, Inc. et al., No. 17CIV04312 (filed Sept. 20, 2017), Nurlybayev v. Tintri, Inc. et al., No. 17CIV04321 (filed Sept. 21, 2017), and Golosiy v. Tintri, Inc. et al., No. 17CIV04618 (filed Oct. 6, 2017). The actions have yet to be consolidated and a consolidated complaint has yet to be filed.
All four class action lawsuits are based on similar allegations that the Company made false and misleading statements in the registration statement and prospectus filed with the SEC in connection with its initial public offering. Each lawsuit is purportedly brought on behalf of a putative class of all persons who purchased shares of common stock pursuant or traceable to the Company’s initial public offering, and seeks, among other things, compensatory damages and attorney’s fees and costs on behalf of the putative class.
The Company is generally required, to the extent permitted by law, to indemnify its current and former directors and officers who are named as defendants in these types of lawsuits. The Company also has certain contractual obligations to the underwriters regarding such lawsuits. While a certain amount of insurance coverage may be available for expenses or losses associated with these lawsuits, this coverage may not be sufficient. Based on information currently available, the Company is unable to reasonably estimate a possible loss or range of possible loss, if any, with regards to these lawsuits; therefore, no litigation reserve has been recorded in the accompanying financial statements.
Indemnification
Some of the Company’s contracts require the Company to indemnify its customers, distributors, or other business partners against certain risks, including in some cases against any third-party claims asserting infringement of certain intellectual property rights. The Company’s exposure under these indemnification provisions is generally limited to the total amount paid by the customer or business partner under the agreement. However, certain agreements include indemnification provisions that could potentially expose the Company to losses in excess of the amount received under the agreement. In addition, the Company has agreed to indemnify its directors, officers, and certain key employees against any liabilities that they may incur while serving in good faith in their respective capacities. To date, there have been no claims under any indemnification provisions.
Purchase Commitments
During the normal course of business, in order to manage manufacturing lead times and help ensure adequate component supply, the Company provides rolling forecasts to its contract manufacturer of the monthly purchase requirements, a certain amount of which are purchase commitments that the contract manufacturer relies upon to procure components used to build finished products. The Company records a charge to cost of product revenue for firm, non-cancelable and unconditional purchase commitments with its contract manufacturer for non-standard components when and if quantities exceed the Company’s future demand forecasts. As of January 31, 2017 and 2018, the Company had approximately $13.5 million and $9.7 million of purchase commitments with its contract manufacturer, respectively.
98
(7) Convertible Preferred Stock
Prior to the closing of the Company’s IPO, the Company’s convertible preferred stock was issuable in series. The number of authorized, issued, and outstanding shares of convertible preferred stock, the issuance date, net proceeds and the aggregate liquidation preferences for the convertible preferred stock as of January 31, 2017, and immediately prior to the automatic conversion of the convertible preferred stock into common stock were as follows (in thousands, except share data):
|
|
Date issued |
|
Number of shares authorized |
|
|
Shares issued and outstanding |
|
|
Liquidation preference |
|
||||
|
A |
|
August 2008 |
|
|
1,533,329 |
|
|
|
1,533,329 |
|
|
$ |
4,600 |
|
|
B |
|
July 2009 |
|
|
2,119,997 |
|
|
|
2,119,997 |
|
|
|
12,000 |
|
|
C |
|
May 2011 |
|
|
1,312,311 |
|
|
|
1,312,311 |
|
|
|
18,100 |
|
|
D |
|
July 2012 |
|
|
1,092,149 |
|
|
|
1,092,149 |
|
|
|
25,000 |
|
|
E |
|
January 2014 |
|
|
1,681,912 |
|
|
|
1,641,662 |
|
|
|
71,377 |
|
|
E-1 |
|
January 2014 |
|
|
83,333 |
|
|
|
83,333 |
|
|
|
3,623 |
|
|
F |
|
July 2015 |
|
|
2,828,185 |
|
|
|
2,828,185 |
|
|
|
124,554 |
|
|
Total outstanding as of January 31, 2017 |
|
|
|
|
10,651,216 |
|
|
|
10,610,966 |
|
|
|
259,254 |
|
|
F |
|
February 2017 |
|
|
28,383 |
|
|
|
— |
|
|
|
— |
|
|
Total outstanding immediately prior to the closing of the Company’s IPO |
|
|
|
|
10,679,599 |
|
|
|
10,610,966 |
|
|
$ |
259,254 |
|
In April 2017, the Company amended its Certificate of Incorporation to modify the automatic conversion terms that would apply to shares of Series E and E-1 Convertible Preferred Stock in the event that the Company completes a sale of its common stock in a firm underwritten public offering pursuant to a registration statement under the Securities Act of 1933, as amended, for which the proceeds are at least $50.0 million in the aggregate (Qualified IPO) in which the per share public offering price is less than the Series E and E-1 Convertible Preferred Stock purchase price of $43.47828 per share. In lieu of holders of the Series E and E-1 Convertible Preferred Stock having an election to receive cash in such circumstances, under the amended Certificate of Incorporation, the holders of Series E and E-1 Convertible Preferred Stock will have similar rights as the holders of Series F Convertible Preferred Stock if the per share public offering price in a Qualified IPO is less than 1.1x the Series E and E-1 Convertible Preferred purchase price, or $47.826108. As a result of this modification to Series E and E-1 Convertible Preferred Stock, the Company recorded a deemed dividend to Series E and E-1 Convertible Preferred Stock of $6.6 million resulting in a charge to accumulated deficit.
In June 2017, the Company amended its Certificate of Incorporation to eliminate certain variable rate adjustments to the conversion ratios of the Series E, E-1 and F Convertible Preferred Stock and replaced them with certain fixed conversion ratios for purposes of the IPO. Pursuant to these fixed conversion ratios, an additional 7,382,007 shares of common stock were issued to holders of Series E, E-1 and F Convertible Preferred Stock, as well as holders of shares of E-2 and F-2 Convertible Preferred Stock that were created in June 2017, who are referred to as the Series E-2 and F-2 Holders, upon the conversion of their shares immediately prior to the closing of the IPO. As an integral part of the foregoing transactions, the Company issued warrants to purchase up to 1,666,665 shares of common stock to the Series E-2 and F-2 Holders. The warrants are exercisable for ten years from the date of grant and have an exercise price of $16.44 per share, which represents 1.2x the fair value of the Company’s common stock as of the date of grant.
The issuance of additional shares of common stock upon conversion of the Series E, E-1, E-2, F, and F-2 Convertible Preferred Stock and the issuance of the common stock warrants are considered parts of a single, integrated transaction and was accounted for as an extinguishment of the originally issued Series E, E-1, and F Convertible Preferred Stock. The resulting gain on extinguishment was $26.3 million, which includes an amount of $14.6 million attributable to the warrants, and was recorded as a contribution of capital.
Immediately prior to the closing of the Company’s IPO, all shares of the Company’s then-outstanding convertible preferred stock, as shown in the table above, automatically converted into 17,992,973 shares of common stock in accordance with the terms of each series of preferred stock.
99
In addition, immediately prior to the closing of the Company’s IPO, all convertible preferred stock warrants automatically converted into common stock warrants. Accordingly, the Company revalued the convertible preferred stock warrants and reclassified the outstanding preferred stock warrant liability balance to additional paid-in capital with no further remeasurements as the common stock warrants are now deemed permanent equity. As a result of the automatic conversion, 68,633 shares of convertible preferred stock warrants converted into an aggregate 205,897 shares of common stock warrants. Of the 205,897 shares of common stock warrants, 34,058 shares will not be exercisable until such time that additional loan amount of $10.0 million under the Facility Agreement is drawn.
(8) Common Stock
Shares Reserved for Future Issuance
As of January 31, 2017 and 2018, the Company had reserved the following shares of authorized but unissued common stock:
|
|
|
As of January 31, |
|
|||||
|
|
2017 |
|
|
2018 |
|
|||
|
|
|
(in shares) |
|
|||||
|
Convertible preferred stock |
|
|
10,610,966 |
|
|
|
— |
|
|
Options and RSUs outstanding and shares available for grant |
|
|
5,814,388 |
|
|
|
12,080,540 |
|
|
Convertible preferred stock warrants |
|
|
40,250 |
|
|
|
— |
|
|
Common stock warrants |
|
|
25,000 |
|
|
|
1,897,562 |
|
|
Total |
|
|
16,490,604 |
|
|
|
13,978,102 |
|
Stock Plans
2008 Stock Plan. In 2008, the Company adopted the 2008 Stock Plan (the 2008 Plan). Under the 2008 Plan, as amended, 7,688,078 shares of common stock were reserved for the issuance of incentive stock options (ISOs), nonstatutory stock options (NSOs), and stock purchase rights to employees, directors, and consultants of the Company as of January 31, 2017. Options may be granted with exercise prices at no less than 100% of the fair value of the common stock on the date of grant. ISOs granted under the 2008 Plan generally vest 25% after the completion of one year of service and then vest in equal monthly installments over the next 36 months of service and expire ten years from the date of grant. NSOs vest according to the specific agreement and expire ten years from the date of grant.
Early Exercise of Stock Options. The Company’s 2008 Plan allows select employees to exercise options prior to vesting. The Company has a right to repurchase unvested shares acquired upon early exercise of options at the original exercise price upon termination of employment. The repurchase rights will lapse in accordance with the original vesting schedule of the option. Early exercises of options are not deemed to be substantive exercises for accounting purposes and, accordingly, amounts received for early exercises are recorded as a liability included in other long-term liabilities. These amounts are reclassified to common stock as the underlying options vest. As of January 31, 2017 and 2018, shares held by employees that were subject to repurchase were 49,234 and 0, respectively, with an aggregate purchase price of $0.5 million and $0, respectively.
Repurchase of Common Stock. In 2013, one executive and one non-executive employee exercised stock options early in exchange for full-recourse notes in an amount of $2.2 million bearing annual interest of 1.62% to 1.64% payable to the Company. In addition, one executive employee exercised stock options early in exchange for a partial recourse promissory note in an amount of $6.6 million bearing interest of 1.92% payable to the Company.
100
In May 2017, the executive employee with the full-recourse promissory note was issued 88,520 shares (Additional Options) of fully vested and exercisable options. In June 2017, the outstanding principal and interest balance of $1.0 million was repaid in full by the executive employee through the Company’s repurchase of 88,520 shares of the executive employee’s common stock. The shares were valued at $13.68 per share, which was the fair market value of the Company’s common stock as determined by the Company’s compensation committee on the date of the repurchase. The Company deems the issuance of 88,520 Additional Options, and its purchase of the shares of common stock issued pursuant to the note, in lieu of forgiving the executive employee’s loan altogether, as a stock repurchase. The Company recorded additional stock-based compensation expense of $0.5 million during the year ended January 31, 2018, representing the extent that the fair value of the 88,520 Additional Options and the value of the loan forgiven exceeds the fair value of the 88,520 shares of common stock repurchased.
In May 2017, the executive employee with the partial recourse promissory note was issued 501,104 Additional Options that are fully vested and exercisable on the date of the grant. In June 2017, the outstanding principal and interest balance of $6.9 million was repaid in full by the executive employee through the Company’s repurchase of 501,104 shares of the executive employee’s common stock. The shares were valued at $13.68 per share, which was the fair market value of the Company’s common stock as determined by the Company’s compensation committee on the date of the repurchase. The repayment of the promissory note through the Company’s repurchase of all 501,104 shares purchased under the note, and the issuance of the 501,104 Additional Options, is treated as a modification of the promissory note. The Company did not record any additional compensation for the modification as the fair value of these Additional Options did not exceed the fair value of the promissory note.
2017 Equity Incentive Plan. In May 2017, the Company adopted the 2017 Equity Incentive Plan (the 2017 Plan) and approved the termination of the 2008 Plan, effective concurrently upon the closing of the Company’s IPO. Under the 2017 Plan, 4,537,000 shares of common stock were reserved for the issuance of ISOs, NSOs, restricted stock, stock appreciation rights and performance awards to employees and directors of the Company. Options may be granted with exercise prices at no less than 100% of the fair value of the common stock on the date of grant. In addition, shares subject to outstanding awards granted under the 2008 Plan that expire or otherwise terminate without having been exercised in full or are forfeited to the Company due to failure to vest, will be allocated to the 2017 Plan reserve. ISOs and NSOs granted under the 2017 Plan generally will vest 25% after the completion of one year of service and then vest in equal monthly installments over the next 36 months of service and expire ten years from the date of grant. NSOs vest according to the specific agreement and expire ten years from the date of grant.
In April 2018, the Company adopted the 2018 Inducement Plan (Note 15).
Stock-Based Compensation
The following is a summary of shares available for grant under the Company’s stock plans for the years ended January 31, 2017 and 2018:
|
Available for grant—January 31, 2016 |
|
|
156,417 |
|
|
Authorized |
|
|
1,405,316 |
|
|
Options and RSUs granted |
|
|
(1,240,032 |
) |
|
Options and RSUs canceled |
|
|
738,891 |
|
|
Available for grant—January 31, 2017 |
|
|
1,060,592 |
|
|
Authorized |
|
|
7,024,194 |
|
|
Options and RSUs granted |
|
|
(8,738,088 |
) |
|
Options and RSUs canceled |
|
|
1,661,703 |
|
|
Available for grant—January 31, 2018 |
|
|
1,008,401 |
|
101
The following is a summary of stock option activity under the Company’s stock plans for the years ended January 31, 2017 and 2018:
|
|
|
|
|
|
|
Options Outstanding |
|
|||||||||
|
|
|
Number of shares underlying outstanding options |
|
|
Weighted- average exercise price |
|
|
Weighted- average remaining contractual term |
|
|
Aggregate Intrinsic Value |
|
||||
|
|
|
|
|
|
|
|
|
|
|
(in years) |
|
|
(in thousands) |
|
||
|
Outstanding—January 31, 2017 |
|
|
4,467,961 |
|
|
$ |
18.83 |
|
|
|
7.5 |
|
|
$ |
60,756 |
|
|
Options granted |
|
|
1,580,416 |
|
|
$ |
16.72 |
|
|
|
|
|
|
|
|
|
|
Options exercised |
|
|
(219,896 |
) |
|
$ |
10.04 |
|
|
|
|
|
|
|
|
|
|
Options canceled |
|
|
(1,475,636 |
) |
|
$ |
12.88 |
|
|
|
|
|
|
|
|
|
|
Outstanding—January 31, 2018 |
|
|
4,352,845 |
|
|
$ |
12.49 |
|
|
|
7.2 |
|
|
$ |
756 |
|
|
Vested and exercisable |
|
|
|
|
|
|
|
|
|
|
|
|
|
|
|
|
|
January 31, 2018 |
|
|
2,908,420 |
|
|
$ |
12.19 |
|
|
|
6.7 |
|
|
$ |
692 |
|
|
Vested and Expected to Vest |
|
|
|
|
|
|
|
|
|
|
|
|
|
|
|
|
|
January 31, 2018 |
|
|
4,352,845 |
|
|
$ |
12.49 |
|
|
|
7.2 |
|
|
$ |
756 |
|
The aggregate intrinsic value is calculated as the difference between the exercise price of the underlying options and the fair value of the common stock for options that had exercise prices that were lower than the fair value per share of the common stock. The aggregate intrinsic value of stock options exercised for the years ended January 31, 2016, 2017, and 2018, was $4.5 million, $2.9 million, and $0.6 million, respectively.
The weighted-average grant date fair value of options granted during the years ended January 31, 2016, 2017, and 2018, was $12.36, $17.34, and $7.97 per share, respectively.
The valuation model for stock-based compensation expense requires the Company to make assumptions and judgments about the variables used in the calculation, including the expected term (weighted-average period of time that the options granted are expected to be outstanding), the expected volatility of the Company’s common stock, a risk-free interest rate and expected dividend yield. The weighted-average assumptions used to estimate the fair value of stock options granted in the following periods was:
|
|
|
Year Ended January 31, |
|
|||||||||
|
|
2016 |
|
|
2017 |
|
|
2018 |
|
||||
|
Risk-free interest rate |
|
|
1.64 |
% |
|
|
1.52 |
% |
|
|
1.86 |
% |
|
Expected term (in years) |
|
|
6.08 |
|
|
|
6.04 |
|
|
|
5.47 |
|
|
Expected volatility |
|
|
55.80 |
% |
|
|
61.68 |
% |
|
|
48.21 |
% |
|
Dividend yield |
|
|
— |
|
|
|
— |
|
|
|
— |
|
The fair value of each grant of stock options was determined using the Black-Scholes option-pricing model. The inputs used in the Black-Scholes option-pricing model are subjective and generally require significant judgment to determine.
All time-based stock-based payment awards are amortized on a straight-line basis over the requisite service periods of the awards, which are generally the vesting periods. Compensation expense related to options granted to non-employees is recognized as the equity instruments vest, and such options are revalued at each reporting date. As a result, compensation expense related to unvested options granted to non-employees fluctuates as the fair value of the Company’s common stock fluctuates.
102
The Company grants RSUs to its executives, employees, and members of the Board of Directors (the Board). The Board determines the vesting conditions for RSUs and the period over which the RSUs will vest and be settled. RSUs convert into common stock upon vesting and settlement.
Performance RSUs. The Company grants RSUs that contain vesting requirements that must be satisfied on or before the expiration date of the RSUs in order for an RSU to vest (in whole or in part): (i) a time and service-based requirement and (ii) performance conditions (altogether, PSUs). The time and service-based requirement is met by the recipient’s continuing employment and service with the Company from grant date through the applicable date. In general, the time and service-based requirement is two years. The performance conditions consist of the occurrence of a liquidity event and, in some instances, individual performance conditions by the recipient. The liquidity event performance condition is not satisfied unless and until the earlier to occur of (i) a change of control or (ii) the first date following the expiration of all lockup and blackout periods following an IPO; in either case, prior to the expiration date of the PSU and subject to the recipient’s continuing employment and service with the Company through the applicable date.
Stock-based compensation expense is measured and recognized in the financial statements based on the fair value of the Company’s common stock on the date of the grant. Stock-based compensation expense is recognized, net of actual forfeitures, over the requisite service period of the award, and upon satisfaction of the relevant performance conditions becoming probable.
The following is a summary of RSU activity under the Company’s stock plans for the year ended January 31, 2018, is presented below:
|
|
|
Shares |
|
|
Weighted average grant date fair value per share |
|
||
|
|
|
— |
|
|
$ |
— |
|
|
|
Awarded |
|
|
319,885 |
|
|
$ |
30.54 |
|
|
Released |
|
|
— |
|
|
$ |
— |
|
|
Forfeited |
|
|
(34,050 |
) |
|
$ |
30.06 |
|
|
Outstanding—January 31, 2017 |
|
|
285,835 |
|
|
$ |
30.60 |
|
|
Awarded |
|
|
7,157,672 |
|
|
$ |
9.23 |
|
|
Released |
|
|
— |
|
|
$ |
— |
|
|
Forfeited |
|
|
(724,213 |
) |
|
$ |
13.33 |
|
|
Outstanding—January 31, 2018 |
|
|
6,719,294 |
|
|
$ |
9.69 |
|
Employee Stock Purchase Plan
In May 2017, the Board of the Company authorized and approved a 2017 Employee Stock Purchase Plan (the ESPP).
A total of 907,000 shares of common stock were initially reserved for issuance under the ESPP. The number of shares of common stock available for sale under the ESPP will also include an annual increase on the first day of each fiscal year beginning in fiscal 2019, equal to the lesser of: 907,000 shares, 1% of the outstanding shares of classes of common stock as of the last day of the Company’s immediately preceding fiscal year, or such other amount as may be determined by the Board.
The ESPP allows eligible employees to purchase shares of the Company’s common stock at a discount through payroll deductions of up to 15% of eligible compensation, subject to caps of $25,000 of value in any calendar year and 2,000 shares on any purchase date. The ESPP provides for 24-month offering periods generally beginning March and September of each year, with the exception of the initial offering period which commenced on June 29, 2017. Each offering period consists of four six-month purchase periods with the initial offering period having its first purchase on March 20, 2018.
103
On each purchase date, participating employees will purchase common stock at a price per share equal to 85% of the lesser of the fair market value of the Company’s common stock on (i) the first trading day of the applicable offering period and (ii) the last trading day of each purchase period in the applicable offering period. If the stock price of the Company's common stock on any purchase date in an offering period is less than the stock price on the first trading day of that offering period, participants will be withdrawn from the current offering period following their purchase of shares on the purchase date and will be automatically re-enrolled in a new offering period.
For the first offering period, which began on June 29, 2017, the fair market value of the common stock used for the first offering period was $7.00, the IPO price of the Company’s common stock.
The Company uses the Black-Scholes option-pricing model to determine the fair value of shares purchased under the ESPP with the following weighted average assumptions on the date of the grant:
|
|
|
Year Ended January 31, |
|
|||||
|
|
2016 |
|
2017 |
|
2018 |
|
||
|
Risk-free interest rate |
|
n/a |
|
n/a |
|
|
1.32 |
% |
|
Expected term (in years) |
|
n/a |
|
n/a |
|
|
1.36 |
|
|
Expected volatility |
|
n/a |
|
n/a |
|
|
45.74 |
% |
|
Dividend yield |
|
n/a |
|
n/a |
|
|
— |
|
Stock-Based Compensation Expense
Total stock-based compensation expense recognized for stock award in the consolidated statements of operations and by type of award is as follows (in thousands):
|
|
|
Year Ended January 31, |
|
|||||||||
|
|
2016 |
|
|
2017 |
|
|
2018 |
|
||||
|
Stock-based compensation: |
|
|
|
|
|
|
|
|
|
|
|
|
|
Cost of product revenue |
|
$ |
181 |
|
|
$ |
264 |
|
|
$ |
1,612 |
|
|
Cost of support and maintenance revenue |
|
|
176 |
|
|
|
323 |
|
|
|
1,579 |
|
|
Research and development |
|
|
2,906 |
|
|
|
5,227 |
|
|
|
21,608 |
|
|
Sales and marketing |
|
|
3,073 |
|
|
|
4,115 |
|
|
|
10,432 |
|
|
General and administrative |
|
|
3,419 |
|
|
|
3,905 |
|
|
|
16,587 |
|
|
Total stock-based compensation expense(1) |
|
$ |
9,755 |
|
|
$ |
13,834 |
|
|
$ |
51,818 |
|
|
|
|
Year Ended January 31, |
|
|||||||||
|
|
|
2016 |
|
|
2017 |
|
|
2018 |
|
|||
|
Stock-based compensation: |
|
|
|
|
|
|
|
|
|
|
|
|
|
Stock options(1) (2) |
|
$ |
9,755 |
|
|
$ |
13,834 |
|
|
$ |
19,821 |
|
|
RSUs(1) |
|
|
— |
|
|
|
— |
|
|
|
30,984 |
|
|
ESPP |
|
|
— |
|
|
|
— |
|
|
|
1,013 |
|
|
Total stock-based compensation expense |
|
$ |
9,755 |
|
|
$ |
13,834 |
|
|
$ |
51,818 |
|
|
(1) |
In September 2017, the Company’s board of directors approved a restructuring plan (Note 12), which resulted in a $0.7 million non-cash adjustment to restructuring charges for previously recognized stock-based compensation expense related to awards that will not vest as a result of the restructuring plan. |
|
(2) |
In May 2017, the Company repriced each outstanding and unexercised stock option held by current service providers with an exercise price in excess of $13.68 per share (each, an Eligible Option), to a new exercise price of $13.68 per share, which is no less than the fair market value of the Company's common stock as determined by the Company's compensation committee on the date of repricing. Eligible Options covering 3,291,783 shares of the Company's common stock with a weighted average exercise price of $24.31 were repriced. Additional stock-based compensation expense related to this repricing is $7.3 million, of which $2.6 million was recognized immediately on the date of repricing for Eligible Options that were vested. |
104
As of January 31, 2018, the total unrecognized stock-based compensation expense related to the outstanding stock awards was $50.9 million, which is expected to be recognized over a weighted-average period of 2.0 years.
Common Stock Warrants
In connection with the Loan and Security Agreement with SVB, the Company issued immediately exercisable and fully vested warrants to purchase 4,167 shares of common stock. The fair value of the warrant was $27,000 and was recorded in other income (expense), net in the consolidated statements of operations. In July 2013, upon drawing down on the term loan, the Company issued the lender a warrant to purchase an additional 20,833 shares of common stock. The warrants have an exercise price of $7.80. The warrants expire in May 2023. The Company determined the fair value of the additional common stock warrants on the date of issuance to be $0.1 million, which was recorded as a debt discount. The debt discount was amortized to interest expense over the loan term using the effective-interest rate method. In connection with the total term loan balance being repaid during the year ended January 31, 2015, the unamortized debt discount of $0.1 million was written off.
In June 2017, the Company amended its certificate of incorporation to eliminate certain variable rate adjustments to the conversion ratios of the Series E, E-1 and F Convertible Preferred Stock and replaced them with certain fixed conversion ratios. As an integral part of the transaction, the Company issued warrants to purchase up to 1,666,665 shares of common stock to the Series E-2 and F-2 Holders. The warrants will become exercisable for ten years from the date of grant and have an exercise price of $16.44 per share. The warrants may be exercised on a cashless basis. The warrants from this arrangement remain outstanding as of January 31, 2018.
In addition, immediately prior to the closing of the Company’s IPO, all convertible preferred stock warrants automatically converted into common stock warrants. Accordingly, the Company revalued the convertible preferred stock warrants and reclassified the outstanding preferred stock warrant liability balance to additional paid-in capital with no further remeasurements as the common stock warrants are now deemed permanent equity. As a result of the automatic conversion, 68,633 shares of convertible preferred stock warrants converted into an aggregate 205,897 shares of common stock warrants. Of the 205,897 shares of common stock warrants, 34,058 shares will not be exercisable until such time that additional loan amount of $10.0 million under the Facility Agreement is drawn.
(9) 401(k) Plan
The Company maintains a tax-qualified retirement plan, or the 401(k) plan. Participants are able to defer eligible compensation up to applicable annual Internal Revenue Code limits. All participants’ interests in their deferrals are 100% vested when contributed. The 401(k) plan allows the Company to make matching contributions and profit sharing contributions to eligible participants. No contributions were made for the years ended January 31, 2016, 2017, and 2018.
(10) Net Loss Per Share Attributable to Common Stockholders
Basic and diluted net loss per share attributable to common stockholders is presented in conformity with the two-class method required for participating securities. The Company’s convertible preferred stock that was outstanding prior to the closing of the IPO is considered a participating security with respect to the periods during which it was outstanding. Participating securities do not have a contractual obligation to share in the Company’s losses. As such, for the periods the Company incurs net losses, there is no impact on the calculated net loss per share attributable to common stockholders in applying the two-class method.
Basic net loss per share attributable to common stockholders is computed by dividing the net loss attributable to common stockholders by the weighted-average number of shares of common stock outstanding during the period. The diluted net loss per share attributable to common stockholders is computed by giving effect to all potential dilutive common stock equivalents outstanding for the period. For purposes of this calculation, participating securities, stock options to purchase common stock, RSUs, warrants to purchase common stock and convertible preferred stock are considered to be common stock equivalents and have been excluded from the calculation of diluted net loss per share attributable to common stockholders, as their effect is antidilutive.
105
The computation of basic and diluted net loss per share attributable to common stockholders is as follows (in thousands, except share and per share data):
|
|
|
Year Ended January 31, |
|
|||||||||
|
|
|
2016 |
|
|
2017 |
|
|
2018 |
|
|||
|
Numerator: |
|
|
|
|
|
|
|
|
|
|
|
|
|
Net loss |
|
$ |
(100,968 |
) |
|
$ |
(105,801 |
) |
|
$ |
(157,659 |
) |
|
Deemed dividend to Series E and E-1 Convertible Preferred Stock |
|
|
— |
|
|
|
— |
|
|
|
(6,588 |
) |
|
Impact of adjustment to Series E, E-1 and F Convertible Preferred Stock |
|
|
— |
|
|
|
— |
|
|
|
26,336 |
|
|
Net loss attributable to common stockholders |
|
$ |
(100,968 |
) |
|
$ |
(105,801 |
) |
|
$ |
(137,911 |
) |
|
|
|
|
|
|
|
|
|
|
|
|
|
|
|
Denominator: |
|
|
|
|
|
|
|
|
|
|
|
|
|
Weighted-average common shares outstanding |
|
|
3,299,908 |
|
|
|
3,523,695 |
|
|
|
19,805,320 |
|
|
Weighted-average unvested common shares subject to repurchase |
|
|
(158,961 |
) |
|
|
(81,146 |
) |
|
|
(41,636 |
) |
|
Weighted-average shares—basic and diluted |
|
|
3,140,947 |
|
|
|
3,442,549 |
|
|
|
19,763,684 |
|
|
Net loss per share attributable to common stockholders—basic and diluted |
|
$ |
(32.15 |
) |
|
$ |
(30.73 |
) |
|
$ |
(6.98 |
) |
The potential absolute shares of common stock that were excluded from the computation of diluted net loss per share attributable to common stockholders for the periods presented because including them would have been antidilutive are as follows:
|
|
|
As of January 31, |
|
|||||
|
|
2017 |
|
|
2018 |
|
|||
|
|
|
(in shares) |
|
|||||
|
Convertible preferred stock (on an if-converted basis) |
|
|
10,610,966 |
|
|
|
— |
|
|
Stock options and RSUs |
|
|
4,753,796 |
|
|
|
11,072,139 |
|
|
Early exercised stock options |
|
|
49,233 |
|
|
|
— |
|
|
Convertible preferred stock warrants |
|
|
40,250 |
|
|
|
— |
|
|
Common stock warrants |
|
|
25,000 |
|
|
|
1,897,562 |
|
|
Total |
|
|
15,479,245 |
|
|
|
12,969,701 |
|
(11) Income Taxes
The provision for income taxes is based upon the income (loss) before income taxes as follows (in thousands):
|
|
|
Year Ended January 31, |
|
|||||
|
|
|
2017 |
|
|
2018 |
|
||
|
Domestic |
|
$ |
(106,856 |
) |
|
$ |
(158,664 |
) |
|
Foreign |
|
|
1,520 |
|
|
|
1,483 |
|
|
Total loss before provision for income taxes |
|
$ |
(105,336 |
) |
|
$ |
(157,181 |
) |
106
The provision for income taxes consisted of the following (in thousands):
|
|
|
Year Ended January 31, |
|
|||||
|
|
|
2017 |
|
|
2018 |
|
||
|
Current: |
|
|
|
|
|
|
|
|
|
Federal |
|
$ |
— |
|
|
$ |
— |
|
|
State |
|
|
12 |
|
|
|
16 |
|
|
Foreign |
|
|
443 |
|
|
|
425 |
|
|
Total current tax provision |
|
|
455 |
|
|
|
441 |
|
|
Deferred: |
|
|
|
|
|
|
|
|
|
Federal |
|
|
(8 |
) |
|
|
— |
|
|
State |
|
— |
|
|
|
— |
|
|
|
Foreign |
|
|
18 |
|
|
|
37 |
|
|
Total deferred tax provision |
|
|
10 |
|
|
|
37 |
|
|
Provision for income taxes |
|
$ |
465 |
|
|
$ |
478 |
|
The provision for income taxes differs from the amount computed by applying the federal statutory income tax rate to income before taxes as follows (in thousands):
|
|
|
Year Ended January 31, |
|
|||||
|
|
|
2017 |
|
|
2018 |
|
||
|
U.S. federal taxes at statutory tax rate |
|
$ |
(35,816 |
) |
|
$ |
(53,143 |
) |
|
State taxes, net of federal benefit |
|
|
8 |
|
|
|
11 |
|
|
Nondeductible expenses |
|
|
281 |
|
|
|
978 |
|
|
Nondeductible stock-based compensation |
|
|
2,894 |
|
|
|
4,453 |
|
|
Foreign rate differential |
|
|
(59 |
) |
|
|
(54 |
) |
|
Remeasurement of deferred tax assets and liabilities |
|
|
— |
|
|
|
59,160 |
|
|
Other |
|
|
(618 |
) |
|
|
(1,859 |
) |
|
Change in valuation allowance |
|
|
33,775 |
|
|
|
(9,068 |
) |
|
Provision for income taxes |
|
$ |
465 |
|
|
$ |
478 |
|
During the year ended January 31, 2018, the Company’s provision for income taxes was primarily attributable to foreign tax provision in certain foreign jurisdictions in which it conducts business, as well as U.S. state taxes.
Deferred income taxes reflect the tax effects of temporary differences between the carrying amounts of assets and liabilities for financial reporting purposes and the amounts used for income tax purposes. The components of deferred income tax assets and liabilities are as follows (in thousands):
|
|
|
Year Ended January 31, |
|
|||||
|
|
|
2017 |
|
|
2018 |
|
||
|
Deferred tax assets: |
|
|
|
|
|
|
|
|
|
Net operating losses |
|
$ |
93,497 |
|
|
$ |
82,375 |
|
|
Depreciation and amortization |
|
|
2,527 |
|
|
|
1,877 |
|
|
Accruals and reserves |
|
|
14,565 |
|
|
|
12,295 |
|
|
Stock-based compensation |
|
|
3,715 |
|
|
|
11,480 |
|
|
Tax credits |
|
|
4,592 |
|
|
|
8,202 |
|
|
Other |
|
|
5 |
|
|
|
3 |
|
|
Gross deferred tax assets |
|
|
118,901 |
|
|
|
116,232 |
|
|
Valuation allowance |
|
|
(118,827 |
) |
|
|
(116,195 |
) |
|
Net deferred tax assets after valuation allowance |
|
|
74 |
|
|
|
37 |
|
|
Deferred tax liabilities |
|
|
— |
|
|
|
— |
|
|
Total net deferred tax assets |
|
$ |
74 |
|
|
$ |
37 |
|
107
The valuation allowance increased by $37.2 million and decreased $2.6 million during the years ended January 31, 2017 and 2018, respectively. The Company recorded a full valuation allowance against the net federal and state deferred tax assets as it is not more likely than not that the assets will be realized. Realization of deferred tax assets is dependent upon future taxable income, if any, the amount and timing of which are uncertain. At such time, if it is determined that it is more likely than not that the deferred tax assets are realizable, the valuation allowance will be adjusted.
As of January 31, 2018, the Company had net operating loss carryforwards and tax credit carryforwards as follows (in thousands):
|
|
|
Amount |
|
|
Expiration year |
|
|
Net operating losses, federal |
|
$ |
348,210 |
|
|
2028-2038 |
|
Net operating losses, California |
|
|
50,706 |
|
|
2028-2038 |
|
Net operating losses, other states |
|
|
103,064 |
|
|
Various |
|
Tax credits, federal |
|
|
7,778 |
|
|
2030-2038 |
|
Tax credits, state |
|
$ |
7,431 |
|
|
Indefinite |
Federal and California tax laws impose limitations on the utilization of NOL and credit carryforwards in the event of an “ownership change” for tax purposes, as defined in Section 382 of the Internal Revenue Code. Accordingly, the Company’s ability to utilize these carryforwards may be limited as a result of such “ownership change.”
The Company has no present intention of remitting undistributed earnings of foreign subsidiaries and, accordingly, no deferred tax liability has been established relative to these earnings. Determination of the amount of an unrecognized deferred tax liability on these undistributed earnings is not practicable.
The activity related to the unrecognized tax benefits is as follows (in thousands):
|
|
|
Year Ended January 31, |
|
|||||
|
|
|
2017 |
|
|
2018 |
|
||
|
Gross unrecognized tax benefits—beginning balance |
|
$ |
2,511 |
|
|
$ |
3,598 |
|
|
Increase related to tax positions taken during current year |
|
|
1,087 |
|
|
|
1,386 |
|
|
Increase related to tax positions taken during prior years |
|
— |
|
|
|
1,084 |
|
|
|
Gross unrecognized tax benefits—ending balance |
|
$ |
3,598 |
|
|
$ |
6,068 |
|
As of January 31, 2017 and 2018, the Company has unrecognized tax benefits of $3.6 million and $6.1 million, respectively, none of which would have an impact on the effective tax rate, if recognized.
The Company recognizes interest and penalties related to uncertain tax positions, if any, as a component of its income tax provision. The Company recognized no interest and penalties related to uncertain tax positions for the years ended January 31, 2017 and 2018, in the consolidated statements of operations or balance sheets. None of the unrecognized tax benefits, if recognized currently, would impact the Company’s effective tax rate. The Company does not expect any material changes to its uncertain tax positions within the next twelve months.
The Company files federal, state, and foreign income tax returns in many jurisdictions in the United States and abroad. For U.S. federal and state income tax purposes, the statute of limitations currently remains open for all years due to the Company’s NOL carryforwards. The Company is not currently under examination in any jurisdiction.
Income tax expense or benefit from continuing operations is generally determined without regard to other categories of earnings, such as discontinued operations and other comprehensive income. An exception is provided in ASC 740 when there is aggregate income from categories other than continuing operations and a loss from continuing operations in the current year. In this case, the tax benefit allocated to continuing operations is the amount by which the loss from continuing operations reduces the tax expenses recorded with respect to the other categories of earnings, even when a valuation allowance has been established against the deferred tax assets. In
108
instances where a valuation allowance is established against current year losses, income from other sources, including gains from other comprehensive income, is considered when determining whether sufficient future taxable income exists to realize the deferred tax assets.
The Tax Cuts and Jobs Act of 2017 (Tax Act), as signed by the President of the United States on December 22, 2017, significantly revises U.S. tax law. The tax reform legislation reduces the corporate tax rate, limits or eliminates certain tax deductions and changes the taxation of foreign earnings of U.S. multinational companies. The Deemed Repatriation Transition Tax (Transition Tax) is a tax on previously untaxed accumulated and current earnings and profits (E&P) of certain of the Company’s foreign subsidiaries at reduced tax rates. To determine the amount of the Transition Tax, the Company must determine, in addition to other factors, the amount of post-1986 E&P of the relevant subsidiaries, as well as the amount of non-U.S. income taxes paid on such earnings.
The Tax Act reduces the corporate tax rate to 21 percent, effective January 1, 2018. Consequently, the Company recorded a decrease to deferred tax assets of approximately $59.2 million. This reduction was fully offset by a corresponding change in the valuation allowance recorded against deferred tax assets.
The SEC staff issued SAB 118, which provides guidance on accounting for the tax effects of the Tax Act. SAB 118 provides a measurement period that should not extend beyond one year from the Tax Act enactment date for companies to complete the accounting under ASC 740. In accordance with SAB 118, a company must reflect the income tax effects of those aspects of the Act for which the accounting under ASC 740 is complete. To the extent that a company’s accounting for certain income tax effects of the Tax Act is incomplete but it is able to determine a reasonable estimate, it must record a provisional estimate in the financial statements. If a company cannot determine a provisional estimate to be included in the financial statements, it should continue to apply ASC 740 on the basis of the provisions of the tax laws that were in effect immediately before the enactment of the Tax Act. The Company is able to make a reasonable estimate of the Transition Tax and expects to utilize U.S. net operating losses to reduce the tax. The Company will continue to gather additional information to more precisely compute the amount of the Transition Tax within the measurement period. Although the tax rate reduction is known, the Company has not collected all of the necessary data to complete its analysis of the effect of the Tax Act on the underlying deferred taxes and as such, the amounts recorded as of January 31, 2018, are provisional.
(12) Restructuring Charges
In September 2017, the Company’s board of directors approved a restructuring and reduction in force plan of a little more than 10% of the Company’s global workforce. The restructuring is part of an overall plan to seek to drive efficiencies in the Company’s sales organization and other business units. Restructuring charges for the year ended January 31, 2018, were $0.9 million and consist primarily of severance costs. As of January 31, 2018, the September 2017 restructuring plan has been substantially completed.
A summary of activities related to the restructuring plan for the year ended January 31, 2018, is presented below (in thousands):
|
Balance as of January 31, 2017 |
|
$ |
— |
|
|
|
|
1,873 |
|
|
|
Cash payments |
|
|
(810 |
) |
|
Non-cash adjustments(1) |
|
|
(974 |
) |
|
Balance as of January 31, 2018 |
|
$ |
89 |
|
|
(1) |
The non-cash adjustments to restructuring charges primarily consist of the reversal of previously recognized stock-based compensation expense related to awards that will not vest and the reversal of incentive compensation that will not be paid as a result of the restructuring plan. |
Liabilities for activities related to the restructuring plan are included in Accrued and other current liabilities in the consolidated balance sheets. In February 2018, the Company terminated its lease of certain office space located at 205 Ravendale Drive, Mountain View, California (Note 15). In March 2018, the Board approved a restructuring and reduction in force plan of approximately 20% of the Company’s global workforce (Note 15).
109
The Company’s chief operating decision maker is a group which is comprised of its Chief Executive Officer and Chief Financial Officer. This group reviews financial information presented on a consolidated basis for purposes of allocating resources and evaluating financial performance. Accordingly, the Company has a single reportable segment.
The following table sets forth revenue by geographic area by customer location (in thousands):
|
|
|
Year Ended January 31, |
|
|||||||||
|
|
2016 |
|
|
2017 |
|
|
2018 |
|
||||
|
United States |
|
$ |
60,300 |
|
|
$ |
87,519 |
|
|
$ |
91,324 |
|
|
EMEA |
|
|
13,712 |
|
|
|
18,207 |
|
|
|
19,256 |
|
|
Rest of the World |
|
|
12,000 |
|
|
|
19,379 |
|
|
|
15,324 |
|
|
Total revenue |
|
$ |
86,012 |
|
|
$ |
125,105 |
|
|
$ |
125,904 |
|
As of January 31, 2017 and 2018, $10.2 million and $12.1 million, respectively, of the Company’s long-lived assets were located in the United States.
(14) Related-Party and Other Transactions
In 2013, one executive and one non-executive employee exercised stock options early in exchange for full-recourse promissory notes in an amount of $2.2 million bearing annual interest of 1.62% to 1.64%, respectively, payable to the Company. These notes are secured by the underlying shares purchased and such unvested shares can be repurchased by the Company upon employee termination at the original issuance price. In September 2017, the Company entered into an amendment to the full-recourse promissory note with the non-executive. Pursuant to the amendment, a portion of the promissory note and accrued interest will become due and payable in April 2018 and the remaining portion will become due and payable in March 2019, but will become due earlier if the non-executive terminates services. The Company is recording the notes receivable balance within equity with a corresponding entry to additional paid-in capital upon the vesting of these shares. In June 2017, the outstanding principal and interest balance of $1.0 million was repaid in full by the executive employee through the Company’s repurchase of 88,520 shares of the executive employee’s common stock. Employee notes receivable as of January 31, 2017 and 2018, was $1.5 million and $0.7 million, respectively.
In 2013, one executive employee exercised stock options early in exchange for a promissory note in an amount of $6.6 million bearing interest of 1.92% payable to the Company. This note is secured by the underlying shares purchased and such unvested shares can be repurchased by the Company upon employee termination at the original issuance price. Because the Company only has partial recourse under the promissory note, the Company deemed the exercise of the stock options to be nonsubstantive. As such, the note receivable is not reflected in these consolidated financial statements and the related stock transaction will be recorded at the time the note receivable is settled in cash. In June 2017, the outstanding principal and interest balance of $6.9 million was repaid in full by the executive employee through the Company’s repurchase of 501,104 shares of the executive employee’s common stock.
In July 2015, certain executives of the Company participated in the Company’s Series F financing round, and acquired 11,353 shares of Series F Convertible Preferred Stock with an aggregate value of $0.5 million. In June 2017, the Company amended its certificate of incorporation to eliminate certain variable rate adjustments to the conversion ratios of the Series E, E-1 and F Convertible Preferred Stock and replaced them with certain fixed conversion ratios. Pursuant to these fixed conversion ratios, the executives who participated in the series F financing round were issued additional shares of common stock immediately prior the closing of the Company’s IPO.
110
In February 2018, the Company terminated its lease of certain office space located at 205 Ravendale Drive, Mountain View, California. The lease termination is part of an overall plan to seek to drive efficiencies in the Company’s business. The Company anticipates surrendering the premises and substantially completing the lease termination in the first quarter of fiscal 2019. The Company expects to incur total costs of approximately $3.7 million in connection with the lease termination, comprised of a write-off of net leasehold costs of approximately $2.5 million, contract termination costs of approximately $1.8 million, partly offset by the recovery of deferred rental expenses of $0.6 million. The Company anticipates that these costs will result in approximately $1.8 million of cash expenditures related to contract termination costs.
In February and March 2018, the Company issued an aggregate of $25.0 million of convertible promissory notes (Notes) under the Note Purchase Agreement. Under the Note Purchase Agreement, the Company agreed to sell Notes having a maximum aggregate principal amount of $25.0 million subject to the terms and conditions set forth in the Note Purchase Agreement. The Notes have an interest rate of 8% per annum and will mature 18 months from the date of issuance. If the Notes remain outstanding on or after December 1, 2019, at the Company’s election, pursuant to the approval of a majority of the members of the Company’s board of directors, the Notes will convert into shares of the Company’s common stock at the IPO price of $7.00 per share, provided that any Notes issued to entities affiliated with one of the Company’s existing stockholders that is a party to the Note Purchase Agreement will be converted at the average price of the Company’s common stock on the NASDAQ Stock Market over the 30-day period preceding the conversion. The Notes are subject to acceleration upon the occurrence of an event of default, which include nonpayment, breach of representations and warranties, and the occurrence of certain bankruptcy or insolvency events.
In March 2018, the Board approved a restructuring and reduction in force plan of approximately 20% of the Company’s global workforce. The Company expects to substantially complete the restructuring in its first quarter of fiscal 2019, which ended on April 30, 2018. The Company estimates it will incur approximately $3.0 million to $4.0 million of cash expenditures in connection with the restructuring, substantially all of which relate to severance costs and contract termination costs. Total restructuring expenses are estimated at $2.5 million to $3.5 million, substantially all of which relate to severance costs. Total restructuring expense is expected to be lower than cash restructuring costs primarily due to the reversal of previously recognized non-cash stock-based compensation expense related to awards that will not vest as a result of the restructuring plan. The Company expects to recognize all of these pre-tax restructuring charges in the first quarter of fiscal 2019.
In March 2018, the Company entered into a Waiver and Tenth Amendment with SVB, pursuant to which the parties agreed to certain amendments and modifications to the Company’s line of credit under the Loan and Security Agreement between the Company and SVB dated as of May 14, 2013, as amended (Loan Agreement). The Tenth Amendment provides for the interest rate on amounts outstanding under the Loan Agreement shall be equal to the prime rate plus 1.85% per annum through March 31, 2018, in exchange for the waiver by SVB with respect to certain prior events of default, in each case subject to the terms and conditions set forth in the Tenth Amendment.
In April 2018, the Company entered into an amended and restated loan agreement with SVB to, among other things, extend the maturity date of its credit facility. Under the amended agreement, the Company may borrow, through May 2, 2019, up to $12.5 million dependent upon its monthly accounts receivables balances, subject to the terms and conditions of the agreement. The $5.0 million non-formula facility previously included in its SVB revolving line of credit terminated in May 2018. The Company’s revolving line of credit with SVB contains certain financial covenants, including a covenant that it achieve total revenues of at least $20.5 million, $23.4 million, $26.3 million and $29.4 million for the fiscal quarters ending April 30, 2018, July 31, 2018, October 31, 2018 and January 31, 2019, respectively, and a covenant that the it maintain a minimum level of cash and availability under the SVB line of credit of at least $15.0 million through July 31, 2018 and at least $10.0 million thereafter. The Company may also be required to pay a fee to SVB upon a change of control.
111
In April 2018, the Company also entered into an amendment with TriplePoint to extend the maturity date of its credit facility to August 2019. Pursuant to the amended terms, of the $50.0 million outstanding under this facility, $15.0 million will bear interest at 10.5% per year and $35.0 million will bear interest at 12.75% per year. The $50.0 million principal amount will become due in August 2019; provided, however, that if the Company, on or before August 2019, prepays a minimum of $ 25.0 million of the total amount outstanding under this facility, the maturity date for the then remaining outstanding principal balance will be extended to February 2021, subject to the Company making equal monthly amortizing payments of principal and interest through the extended maturity date. Certain end-of-term payments will become payable upon the maturity of this indebtedness and certain other fees will become payable in connection with this indebtedness upon the occurrence of a change of control of the company.
In March 2018, the Company announced that the Board had named Tom Barton as Chief Executive Officer and as a member of the Board, and his appointment became effective on April 2, 2018. Ken Klein transitioned from his role as Chief Executive Officer and as a member of the Board in connection with Mr. Barton’s joining the Company.
In March 2018, the Company also announced that Ian Halifax resigned from his role as Chief Financial Officer, and his resignation became effective in April 2018.
In March 2018, the Company also announced that John Bolger and Harvey Jones had each resigned from the Board.
In March 2018, the Company granted RSUs under the 2017 Plan to certain eligible employees covering a total of 2,846,025 shares. The total grant date fair value for these RSUs is $12.6 million.
In March and April 2018, the Board adopted the Tintri, Inc. Inducement Plan (Inducement Plan) and, subject to the adjustment provisions of the Inducement Plan, reserved 1,700,000 shares of the Company’s common stock for issuance pursuant to equity awards granted under the Inducement Plan.
In March 2018, a partial principal and interest payment was made by the non-executive employee towards his full-recourse promissory note. In consideration, the Company agreed to extend the due date of the full-recourse promissory note to September 2018, and forgive the remaining balance due under the full-recourse promissory note provided that the non-executive executes certain releases related to the Company’s March 2018 restructuring.
In April 2018, the Company granted options under the Inducement Plan to Mr. Barton to purchase a total of 1,700,000 shares. The total grant date fair value is $1.4 million for these options.
On May 15, 2018, the Company appointed Tom Barton as interim Chief Financial Officer, in addition to his existing roles with the Company.
112
Item 9. Changes in and Disagreements With Accountants on Accounting and Financial Disclosure.
None.
Item 9A. Controls and Procedures.
Evaluation of Disclosure Controls and Procedures
Our management, with the participation of our Chief Executive Officer and our Chief Financial Officer, has evaluated the effectiveness of our disclosure controls and procedures (as defined in Rules 13a-15(e) and 15d-15(e) under the Securities and Exchange Act of 1934, as amended, or the Exchange Act) prior to the filing of this Annual Report on Form 10-K. Based on such evaluation, our Chief Executive Officer and Chief Financial Officer have concluded that, as of the end of the period covered by this Annual Report on Form 10-K, our disclosure controls and procedures were, in design and operation, effective at the reasonable assurance level.
Changes in Internal Control over Financial Reporting
There was no change in our internal control over financial reporting identified in connection with the evaluation required by Rule 13a-15(d) and 15d-15(d) of the Exchange Act that occurred during the year ended January 31, 2018, that has materially affected, or is reasonably likely to materially affect, our internal control over financial reporting.
Management’s Report on Internal Control over Financial Reporting
This Annual Report on Form 10-K does not include a report of management’s assessment regarding internal control over financial reporting or an attestation report of our independent registered public accounting firm due to a transition period established by the rules of the Securities Exchange Commission for newly public companies.
Attestation Report of the Registered Public Accounting Firm
This Annual Report on Form 10-K does not include an attestation report of our registered public accounting firm due to an exemption established by the Jumpstart Our Business Startups Act, or JOBS Act, for “emerging growth companies.”
On May 15, 2018, our Board appointed Tom Barton as interim Chief Financial Officer, in addition to his existing roles with the Company.
113
Item 10. Directors, Executive Officers and Corporate Governance.
The information required by this item is incorporated herein by reference to our definitive proxy statement for our 2018 annual meeting of stockholders (2018 Proxy Statement), which we plan to file no later than 120 days after the end of our fiscal year ended January 31, 2018.
Item 11. Executive Compensation.
The information required by this item is incorporated herein by reference to our 2018 Proxy Statement.
Item 12. Security Ownership of Certain Beneficial Owners and Management and Related Stockholder Matters.
The information required by this item is incorporated herein by reference to our 2018 Proxy Statement.
Item 13. Certain Relationships and Related Transactions, and Director Independence.
The information required by this item is incorporated herein by reference to our 2018 Proxy Statement.
Item 14. Principal Accounting Fees and Services.
The information required by this item is incorporated herein by reference to our 2018 Proxy Statement.
114
Item 15. Exhibits, Financial Statement Schedules.
(a)(1) Consolidated Financial Statements
We have filed the consolidated financial statements listed in the Index to Consolidated Financial Statements, Schedules, and Exhibits included in Part II, Item 8, “Financial Statements and Supplementary Data” of this Annual Report on Form 10-K.
(a)(2) Financial Statement Schedules
All financial statement schedules have been omitted because they are not applicable, not material, or the required information is shown in the consolidated financial statements or the notes thereto.
(a)(3) Exhibits
See the Exhibit Index below in this Annual Report on Form 10-K.
None.
115
116
117
|
|
XBRL Taxonomy Extension Definition Linkbase Document |
||||||||||
|
|
|
|
|
|
|
|
|
|
|
|
|
|
101.LAB |
|
XBRL Taxonomy Extension Label Linkbase Document |
|||||||||
|
|
|
|
|
|
|
|
|
|
|
|
|
|
101.PRE |
|
XBRL Taxonomy Extension Presentation Linkbase Document |
|||||||||
|
|
|
|
|
|
|
|
|
|
|
|
|
|
|
|
|
|
+ |
Indicates a management contract or compensatory plan or arrangement. |
|
† |
Confidential treatment has been requested for portions of this exhibit. These portions have been omitted and have been filed separately with the Securities and Exchange Commission. |
|
* |
Filed herewith. The certifications attached as Exhibit 32.1 and Exhibit 32.2 that accompany this Annual Report on Form 10-K are deemed furnished and not filed with the Securities and Exchange Commission and are not to be incorporated by reference into any filing of Tintri, Inc. under the Securities Act of 1933, as amended, or the Securities Exchange Act of 1934, as amended, whether made before or after the date of this Annual Report on Form 10-K, irrespective of any general incorporation language contained in such filing. |
118
Pursuant to the requirements of Section 13 or 15(d) of the Securities Exchange Act of 1934, as amended, the Registrant has duly caused this Report to be signed on its behalf by the undersigned, thereunto duly authorized.
|
|
|
Tintri, Inc. |
|
|
|
|
|
|
|
Date: May 17, 2018 |
|
By: |
/s/ Tom Barton |
|
|
|
|
Tom Barton |
|
|
|
|
Chief Executive Officer, Interim Chief Financial Officer, and Director (Principal Executive Officer) |
Pursuant to the requirements of the Securities Exchange Act of 1934, as amended, this Report has been signed below by the following persons on behalf of the Registrant in the capacities and on the dates indicated.
|
Name |
|
Title |
|
Date |
|
|
|
|
|
|
|
/s/ TOM BARTON |
|
Chief Executive Officer, Interim Chief Financial Officer and Director (Principal Executive Officer, Principal Accounting and Financial Officer) |
|
May 17, 2018 |
|
Tom Barton |
|
|
|
|
|
|
|
|
|
|
|
/s/ ADAM GROSSER |
|
Director |
|
May 17, 2018 |
|
Adam Grosser |
|
|
|
|
|
|
|
|
|
|
|
/s/ KIERAN HARTY |
|
Director |
|
May 17, 2018 |
|
Kieran Harty |
|
|
|
|
|
|
|
|
|
|
|
/s/ CHRISTOPHER SCHAEPE |
|
Director |
|
May 17, 2018 |
|
Christopher Schaepe |
|
|
|
|
|
|
|
|
|
|
|
/s/ PETER SONSINI |
|
Director |
|
May 17, 2018 |
|
Peter Sonsini |
|
|
|
|
|
|
|
|
|
|
119