Attached files
| file | filename |
|---|---|
| 8-K - FORM 8-K - Sprague Resources LP | f8kmlpa2018.htm |

Sprague Resources LP MLP and Energy Infrastructure May 23, 2018

Forward Looking Statements and Non-GAAP Measures This presentation contains unaudited quarterly results which should not be taken as an indication of the results of operations to be reported for any subsequent period or for the full fiscal year. Forward-Looking Statements: Some of the statements in this presentation contain forward-looking statements within the meaning of the safe harbor provisions of the U.S. Private Securities Litigation Reform Act of 1995. We believe these statements to be reasonable as of the date of this presentation only. Our actual future results and financial condition may differ materially because of risks and uncertainties that are difficult to predict. For a more detailed description of these and other risks and uncertainties, please see the “Risk Factors” section in our most recent Annual Report on Form 10-K and/or most recent Form10-Q, Form 8-K and other items filed with the U.S. Securities and Exchange Commission “SEC” and also available in the “Investor Relations” section of our website www.spragueenergy.com. Non-GAAP Measures: In this presentation, and in statements we make in connection with this presentation, we refer to certain historical and forward looking financial measures not prepared in accordance with U.S. generally accepted accounting principles, or GAAP. Non-GAAP measures include adjusted gross margin, adjusted gross unit margin, adjusted EBITDA, distributable cash flow (DCF), coverage ratio, leverage, permanent leverage ratio, and liquidity. Please refer to the Appendix for a description of the non-GAAP measures used in this presentation, including reconciliations with comparable GAAP financial measures. Additional Information: References in this presentation to volume sold, or handled, adjusted gross margin, distributable cash flow, distribution coverage, and adjusted gross unit margin are as of March 31, 2018 on a trailing-twelve-month period, unless a specific year or quarter is referenced. References to permanent leverage, storage capacity, and customer count are as of March 31, 2018. Amounts shown as investments in acquisitions exclude consideration paid for working capital. Under the terms of a three-year earn-out agreement related to the Coen Energy acquisition, additional consideration of up to $12 million may be paid if certain performance targets are met. Representative throughput and wholesale supply services margins are based on Sprague estimates. 2

Sprague Overview Sprague was founded in 1870 and has grown to become one of the largest suppliers of energy and materials handling services to commercial and industrial customers in the northeast United States and Quebec Refined Products Natural Gas Materials Handling • 14.7 billion barrels of storage • 16,000 customers in 13 states • Handle 2.5 million short tons • 1.5 billion gallons sales • 62 Bcf of sales and 381 million gallons • $159 million Adjusted Gross • $64 million Adjusted Gross • $50 million Adjusted Gross Margin Margin Margin 3

We focus on Integrated Supply, Logistics & Marketing Sprague thinks past “commodity” when it comes to commodity marketing Refined Products Adjusted Gross Unit Margin ($/gallon) Natural Gas Adjusted Gross Unit Margin ($/MMBtu) $0.12 $1.20 $1.05 $0.10 $0.10 $0.10 $1.02 $1.01 $0.10 $1.00 $0.09 $0.90 $0.08 $0.78 $0.08 $0.80 $0.06 $0.06 $0.60 $0.54 $0.04 $0.40 $0.02 $0.20 $0.00 $0.00 2012 2013 2014 2015 2016 2017 2012 2013 2014 2015 2016 2017 Representative Throughput Model Representative Wholesale Supply Margin Services Margin 4

Since our IPO in 2013, Sprague has… • Grown distributions for 16 consecutive quarters at a double digit annual pace 5

Since our IPO in 2013, Sprague has… • Invested over $425 million in growth, completing 10 acquisitions, with no external equity raise Global NG Carbo $17 mm $72 mm Metromedia Energy Kildair Santa Buckley Coen $22 mm (dropdown) $18 mm $35 mm (2) $175 mm 2013 2014 2015 2016 2017 Hess Commercial Bronx, NY Castle Oil L.E. Belcher Capital $0 $56mm $20 mm $22 mm Refined Products Natural Gas Materials Handling 6

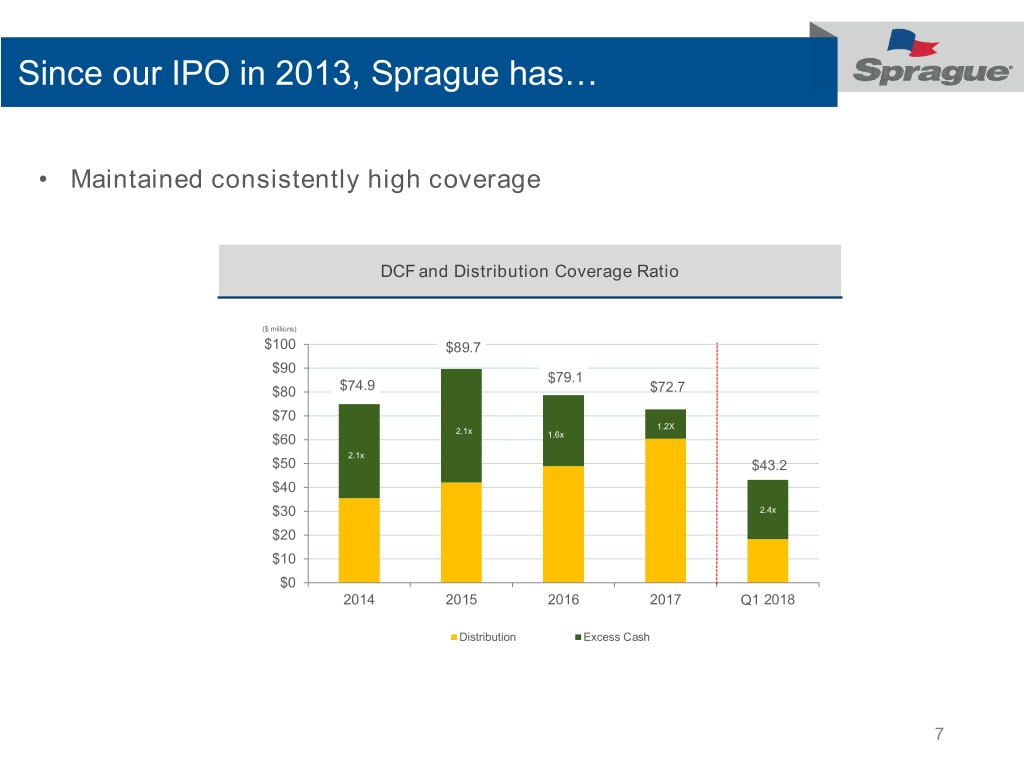
Since our IPO in 2013, Sprague has… • Maintained consistently high coverage DCF and Distribution Coverage Ratio ($ millions) $100 $89.7 $90 $79.1 $80 $74.9 $72.7 $70 1.2X 2.1x $60 1.6x 2.1x $50 $43.2 $40 $30 2.4x $20 $10 $0 2014 2015 2016 2017 Q1 2018 Distribution Excess Cash 7

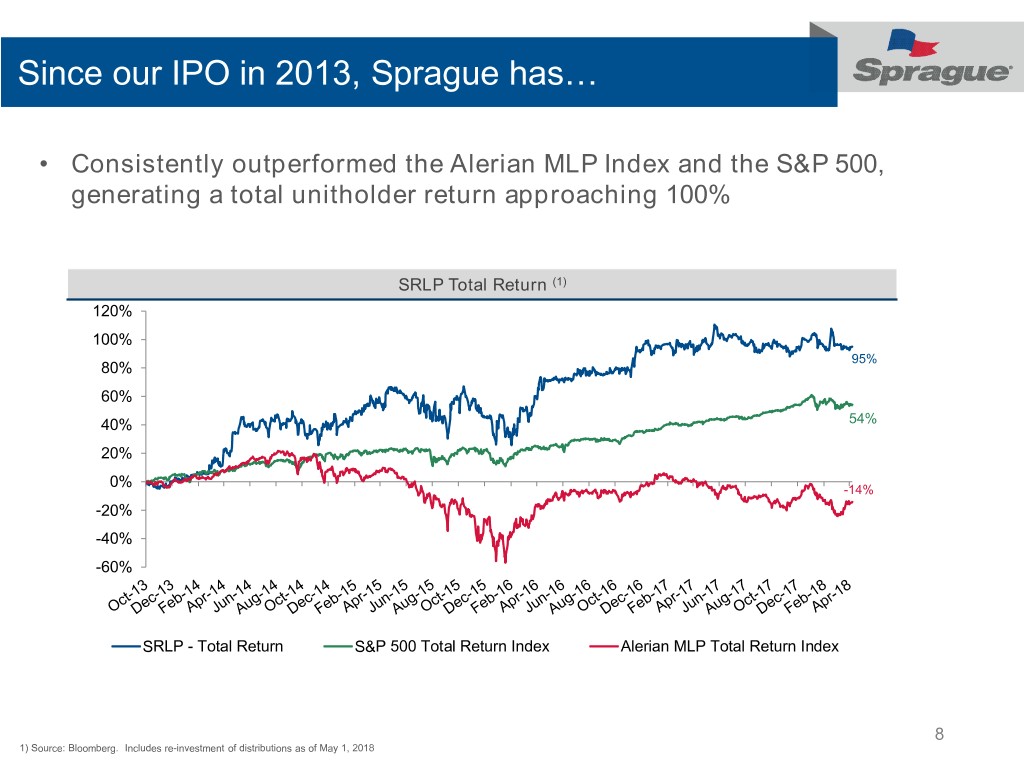
Since our IPO in 2013, Sprague has… • Consistently outperformed the Alerian MLP Index and the S&P 500, generating a total unitholder return approaching 100% SRLP Total Return (1) 120% 100% 95% 80% 60% 40% 54% 20% 0% -14% -20% -40% -60% SRLP - Total Return S&P 500 Total Return Index Alerian MLP Total Return Index 8 1) Source: Bloomberg. Includes re-investment of distributions as of May 1, 2018

…yet our Yield remains stubbornly high SRLP and AMZ Yields 14% 12% 10% 8% 6% 4% 2% 0% Dec-13 Dec-14 Dec-15 Dec-16 Dec-17 AMZ Yield SRLP Yield Source: Bloomberg, Alerian 9

A stable ownership profile drives limited liquidity… • Making SRLP better suited to Retail / Small Institutional Investors Oppenheimer 7% Top Institutional Holders Units at IPO Current Hold (in ‘000) (in ‘000) Goldman Sachs 5% Kayne Anderson 4% Axel Johnson, Inc. 11,644 12,106 Oppenheimer Funds, Inc. 500 1,657 Management 2% Goldman Sachs Group Inc. 500 1,211 Carbo Industries Inc. - 1,132 Kayne Anderson Capital Advisors LP 850 829 Spirit of America Management - 220 Cohen & Steers Inc 350 176 Axel Johnson 54% Doheny Asset Management LLC - 159 Management 693 Other 28% Total 18,183 10 Source: Bloomberg reported holding as of December 31, 2017

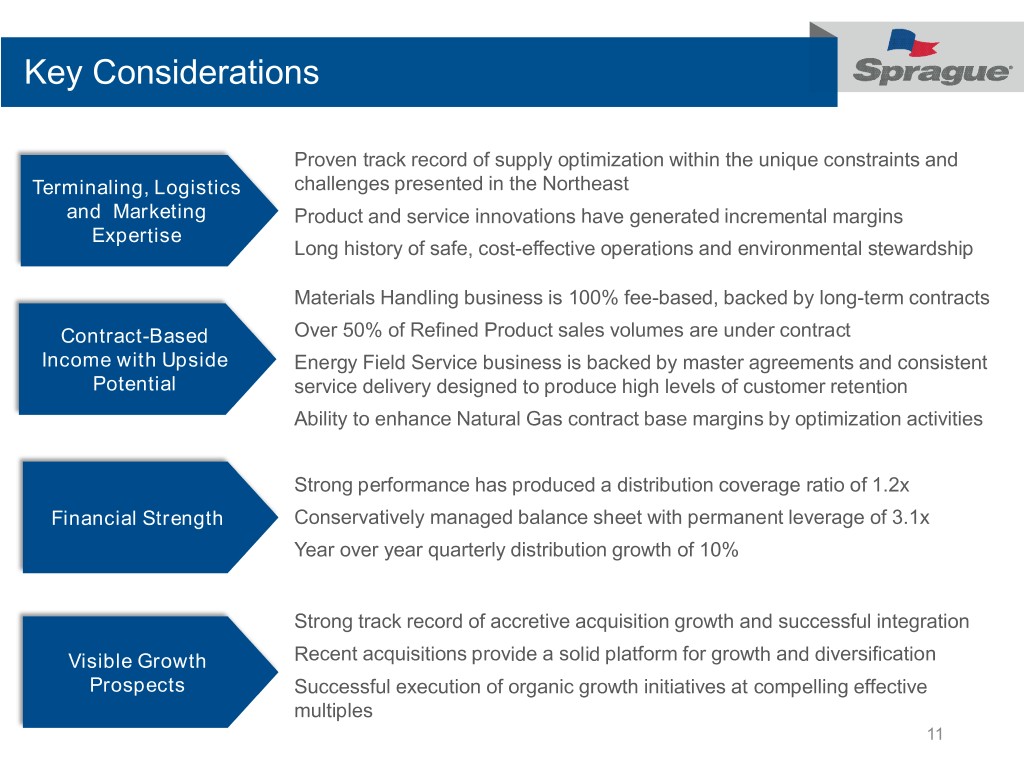
Key Considerations Proven track record of supply optimization within the unique constraints and Terminaling, Logistics challenges presented in the Northeast and Marketing Product and service innovations have generated incremental margins Expertise Long history of safe, cost-effective operations and environmental stewardship Materials Handling business is 100% fee-based, backed by long-term contracts Contract-Based Over 50% of Refined Product sales volumes are under contract Income with Upside Energy Field Service business is backed by master agreements and consistent Potential service delivery designed to produce high levels of customer retention Ability to enhance Natural Gas contract base margins by optimization activities Strong performance has produced a distribution coverage ratio of 1.2x Financial Strength Conservatively managed balance sheet with permanent leverage of 3.1x Year over year quarterly distribution growth of 10% Strong track record of accretive acquisition growth and successful integration Visible Growth Recent acquisitions provide a solid platform for growth and diversification Prospects Successful execution of organic growth initiatives at compelling effective multiples 11

Appendix 12

Volume, Net Sales and Adjusted Gross Margin 13

14

15

16
