Attached files
| file | filename |
|---|---|
| EX-10.1 - EXHIBIT 10.1 - WhiteHorse Finance, Inc. | tv494407_ex10-1.htm |
| 8-K - FORM 8-K - WhiteHorse Finance, Inc. | tv494407_8k.htm |
Exhibit 99.1

Investor Presentation May 2018 WhiteHorse Finance, Inc. NASDAQ: WHF (Common Stock) NASDAQ: WHFBL (6.50% Senior Notes due 2020)

1 References in this presentation to “WHF”, “we”, “us”, “our” and “the Company” refer to WhiteHorse Finance, Inc. This presentation and the information and views included herein do not constitute investment advice, or a recommendation or a n o ffer to enter into any transaction with the Company or any of its affiliates. Investors are advised to consider carefully the Company’s investment objectives, r isk s, charges and expenses before investing in the Company’s securities. An annual report on Form 10 - K for the year ended December 31, 2017 and a quarterly report on Form 10 - Q for the quarter ended March 31, 2018, which have been filed with the Securities and Exchange Commission (“SEC”), contain this and other information about the Company and should be read carefully before investing in the Company’s securities. The information in this presentation is not complete and may be changed. This presentation is not an offer to sell the Company’s securities and is not soliciting an offer to buy the Company’s securities in any jurisdiction where such offer or sale is not permitted. A shelf registration statement relating to the Company’s securities is on file with the SEC. A public offering of the Company’s securities may be made only by means of a prospectus and a related prospectus supplement, copies of which may be obtained by writing the Company at 1450 Brickell Avenue, 31st Floor, Miami, FL 33131, Attention: Investor Relations, or by calling (305) 381 - 6999; copies may also be obtained by visiting EDGAR on the SEC’s website at http://www.sec.gov . Forward Looking Statements Some of the statements in this presentation constitute forward - looking statements, which relate to future events or the Company’s fut ure performance or financial condition. The forward - looking statements contained in this presentation involve risks and uncertainties, including statements as to: the Company’s future operating results; changes in political, economic or industry conditions, the interest rate environment or conditions affecti ng the financial and capital markets, which could result in changes to the value of the Company’s assets; the Company’s business prospects and the prospects of its pr ospective portfolio companies; the impact of investments that the Company expects to make; the impact of increased competition; the Company’s contractual ar ran gements and relationships with third parties; the dependence of the Company’s future success on the general economy and its impact on the industries in wh ich the Company invests; the ability of the Company’s prospective portfolio companies to achieve their objectives; the relative and absolute performance o f t he Company’s investment adviser; the Company’s expected financings and investments; the adequacy of the Company’s cash resources and working capital; the timi ng of cash flows, if any, from the operations of the Company’s prospective portfolio companies; and the impact of future acquisitions and divestitures. Such forward - looking statements may include statements preceded by, followed by or that otherwise include the words “may,” “migh t,” “will,” “intend,” “should,” “could,” “can,” “would,” “expect,” “believe,” “estimate,” “anticipate,” “predict,” “potential,” “plan” or similar words. The Company has based the forward - looking statements included in this presentation on information available to us on the date of this presentation, and the Company assumes no obligation to update any such forward - looking statements. Actual results could differ materially from those implied or expressed in the Company’s forward - looking statements for any reason, and future results could differ materially from historical performance. Al though the Company undertakes no obligation to revise or update any forward - looking statements, whether as a result of new information, future events or other wise, you are advised to consult any additional disclosures that are made directly to you or through reports that the Company in the future may file with the Sec urities and Exchange Commission, including annual reports on Form 10 - K, quarterly reports on Form 10 - Q and current reports on Form 8 - K. For a further discussion of factors that could cause the Company’s future results to differ materially from any forward - looking statements, see the section entitled “Risk Factors” in th e annual report on Form 10 - K and the quarterly report on Form 10 - Q for the quarter ended March 31, 2018. Important Information and Forward Looking Statements

2 WhiteHorse Finance Snapshot Company / Ticker: WhiteHorse Finance, Inc. / NASDAQ: WHF (“WhiteHorse Finance” or the “Company”) : Current Share Price: $13.90 (1) : Market Cap: $285.4MM (1 ) : Price / NAV: 0.97x (1 )(2) Portfolio Fair Value: $467.7MM (2 ) : Current Dividend Yield: 10.2% ( 1) ; consistent quarterly dividends of $0.355 per share since 2012 IPO: (1) As of May 14, 2018 (2) Based on NAV per share of $14.30 as of March 31, 2018 External Manager: Affiliate of H.I.G. Capital, LLC (“H.I.G. Capital” or “H.I.G.”)

3 H.I.G. WhiteHorse Highlights Leading Lower Middle Market Position ▪ H.I.G. brings over 20 years of experience and ~$ 25Bn of capital committed (1) primarily across a number of synergistic lower middle market strategies Unique Deal Sourcing Infrastructure ▪ Robust direct origination platform has enabled the Company to deploy ~$1Bn since December 2012 IPO Deep Credit Expertise ▪ H.I.G.’s senior management team has collectively invested in more than 1,000 loans Compelling Market Opportunity ▪ Structural inefficiencies in the lower middle market provide an opportunity to generate attractive risk - adjusted returns Attractive Portfolio ▪ Diversified ~$468MM portfolio principally composed of senior secured loans with an attractive yield Note: As of March 31, 2018, unless otherwise noted (1) Based on total capital commitments managed by H.I.G. Capital and affiliates Large and Experienced Team with Substantial Resources ▪ Access to H.I.G. Capital’s resources and expertise, including an investment team of over 350 professionals with 23 business development resources and dedicated team of over 25 WhiteHorse Direct Lending professionals

▪ Consistent, robust deal flow generated through H.I.G.’s proprietary sourcing network - Proprietary deal sourcing consisting of sponsored and non - sponsored opportunities - Experienced team able to underwrite more complex non - sponsored opportunities ▪ Over 3 ,000 opportunities reviewed and approximately $1Bn invested since December 2012 IPO ▪ Over 25 WhiteHorse deal professionals dedicated to sourcing and underwriting for WHF plus 23 person business development team seeks opportunities from H.I.G .’s proprietary database of over 21,000 contacts ▪ Deals being sourced by more than 350 Investment Professionals across H.I.G.’s platform Proprietary Deal Sourcing Network 4 WhiteHorse Finance Overview Investment Strategy ▪ Generate attractive risk - adjusted returns primarily by originating and investing in senior secured loans to performing lower middle market companies ▪ Opportunistically invest at other levels of a company’s capital structure where the investment presents an opportunity to achieve an attractive risk - adjusted return Secure Investment Portfolio ▪ 100% of all WHF loans were senior secured loans as of 3/31/2018 ▪ Portfolio has significant downside protection with meaningful value coverage ▪ Loans diligently structured with tight covenants and broad lender rights Note: As of March 31, 2018, unless otherwise noted

Note: As of March 31, 2018, unless otherwise noted (1) Based on total capital commitments managed by H.I.G. Capital and affiliates 5 H.I.G. Capital Overview ▪ Leading global alternative asset manager focused on the lower middle market , defined as companies with $50MM to $350MM of enterprise value − Founded in 1993; ~$ 25Bn of capital under management (1) ▪ Differentiated, value - added strategy and deep experience in the lower middle market segment of the market have resulted in what we believe is a superior track record ▪ Broad investment capabilities across sectors, capital structures, and investment styles, with a focus on smaller, complex situations ▪ Investment activities include: − Leveraged Buyouts − Credit − Growth Capital − Real Estate ▪ Over ~350 investment professionals located in eighteen offices across North America, South America and Europe ▪ “Institutionalized” management structure and processes with strong financial staff, controls, legal, compliance, IT support, and risk management procedures in place Investment Approach Global Footprint Miami New York Boston Chicago San Francisco Dallas Rio de Janeiro London Madrid Milan Hamburg Paris Atlanta

6 Lower Middle Market Overview Unstructured and Inefficient Market ▪ Sourcing lower middle market lending opportunities requires access to an extensive network of relationships in local small - business communities (as opposed to the established investment banking sources for larger companies) Specialized Lending Requirements ▪ As a result of lower middle market companies having limited resources to facilitate a financing process, there is an opportunity to create an informational advantage through a more rigorous due diligence and underwriting process Credit Supply / Demand Imbalance ▪ C ommercial banks, investment banks, CLOs and hedge funds have reduced lower middle market lending efforts to focus on larger, more liquid asset classes ▪ Demand for debt financing from lower middle market companies remains strong as these companies continue to require credit to refinance existing debt, to support growth initiatives and to finance acquisitions

7 Self - Originated Lower Middle Market Broadly Syndicated Market Value Add for Investors ▪ Proprietary deals with limited competition, resulting in above market risk - return dynamics ▪ Larger, more liquid investments; competition among a large number of participants often drives down yields Number of Lenders ▪ Sole or club lender in most transactions ▪ Large number of lenders in syndicated transactions; less influence over process Due Diligence ▪ Direct access to management allows for more thorough diligence process to create potential informational advantages ▪ Limited access to management and owners/ sponsors at underwriting stage Terms/ Credit Metrics ▪ Moderate leverage levels, favorable lender terms ▪ Market process and equity sponsor influence often lead to more borrower - friendly terms Financial Covenants ▪ Control over documentation, resulting in tight operational and financial covenants ▪ Documentation controlled by agent; competitive market dynamics can result in less stringent covenant packages Monitoring ▪ Lead monitoring process, able to take quick action if any issues arise ▪ Often limited to predetermined compliance package; access to company controlled by the agent Compelling Lower Middle Market Lending Opportunities ▪ With access to H.I.G. Capital’s extensive sourcing network, the Company is able to capitalize on attractive self - originated lower middle market transactions as compared to the broadly syndicated market Directly originated loans to lower middle market companies typically generate more attractive risk - adjusted returns relative to larger, broadly syndicated credits

WhiteHorse Finance Performance Summary Summary Stats: Invested Capital since IPO: $1,033MM (1) Number of Investments Made: ~83 (1) Average Investment Size: ~$9.7MM (2) All - in Yield : 12.0% (1) Average Net Debt / EBITDA of Portfolio Companies: ~ 3.2x (1)(3) Secured Debt as a % of Total Debt : 100% (2) $1Bn invested through WhiteHorse Finance that has generated an average all - in yield of 12.0% and has consistently paid a $0.355 quarterly dividend per share since WHF’s IPO in 2012 (1) Figures reflect life - to - date since IPO (2) As of March 31, 2018; based on fair value of investments (3) Measured at origination based on WHF’s underwriting leverage 8

9 WhiteHorse Finance Portfolio Investment Characteristics Note: As of March 31, 2018; based on fair value of investments; numbers may not foot due to rounding Produced an Average All - in Yield of 12.0% and an Average Leverage Multiple of 3.2x since 2013 Diligently Structured with Tight Covenants and Broad Lender Rights Businesses with Discernible Downside Protection through Recurring Revenue or Strong Tangible Asset Coverage Directly - originated Senior Secured Loans Sourced through both WhiteHorse Finance and H.I.G.’s Deal Flow Network Focus on Defensively Positioned, Attractive Industries Strong Investment Discipline and Focus on Downside Protection Well Diversified Portfolio – 34 Companies Focus on High Cash Flow Businesses Composition by Security Type (Based on Fair Value) Composition by Industry (Based on Fair Value) 100% of WHF loans are senior secured First Lien , 0.5503636 97 Second Lien , 0.3616664 79 Equity / Warrants , 0.0879698 24 Specialized Finance , 0.14569998 Other Diversified Financial Services , 0.12976812 Food Retail , 0.085264954 Internet Software & Services , 0.06229075 Diversified Support Services , 0.059090268 Broadcasting , 0.056851854 Data Processing & Outsourced Services , 0.049012062 Advertising , … Specialized Consumer Services , 0.040618546 Research & Consulting Services , 0.039594477 Automotive Retail , 0.038655926 Application Software , … Investment Banking & Brokerage , 0.038070133 Internet Retail , 0.03612034 Other , 0.132216051

Attractive, High Quality Portfolio Historical Portfolio Trends 10 % Floating / Fixed (Based on Fair Value ) % First Lien / % Second Lien (Based on Debt Investments) % Sponsored loans relative to total originations (1) Average Leverage through WHF’s Security (2) Note: As of end of each quarter presented, unless otherwise noted. Not a guarantee of future performance or investment pace . (1) Based on fair value of investments (2) Measured at origination based on WHF’s underwriting leverage Average: 39.5% Average: 3.2x 0.884 0.961 0.971 0.998 0.999 0.999714857 0.116 0.039 0.029 0.002 0.001 0.000285143 0 0.2 0.4 0.6 0.8 1 2013 (Q4) 2014 (Q4) 2015 (Q4) 2016 (Q4) 2017 (Q4) 2018 (Q1) Floating Fixed 0.518486799 0.575958413 0.547811331 0.643421287 0.572416913 0.605413281 0.481513201 0.424041587 0.452188669 0.356578713 43% 0.394586719 2013 (Q4) 2014 (Q4) 2015 (Q4) 2016 (Q4) 2017 (Q4) 2018 (Q1) % First Lien Loans % Second Lien Loans 0.44423848 0.488012824 0.738645035 0.595908329 0.586909377 0.474229923 0.429072348 0.328339599 0.353069102 0.304664022 0.261662487 0.304376577 0.333214588 0.294585676 0.281412316 0.344085473 0.367502488 0.34642987 0.343080184 0.346337373 0.338599057 0 0.1 0.2 0.3 0.4 0.5 0.6 0.7 0.8 % Sponsored / Unsponsored Investments 2.8 2.4 4.1 3.4 3.4 2.1 4.5 3 3.8 2.3 3.1 2.7 3 3.6 2.9 3.4 3.2 3.5 3.4 3.4 3.4 0 1 2 3 4 5 Leverage Multiple of Invested Capital

WhiteHorse Finance Differentiated Deal Flow As a result of its proprietary sourcing network, we believe the WhiteHorse Finance portfolio has generated higher yields at lower portfolio company leverage than the broader middle market Effective Yield From IPO to March 31, 2018 11 233.2 237.744 214.669 272.439 286.862 336.877 355.089 382.29 370.189 366.236 354.776 393.837 396.999 371.705 373.159 381.108 401.723 405.947 401.848 402.531 422.11 0.155 0.149 0.131 0.118 0.117 0.111 0.107 0.113 0.114 0.117 0.116 0.118 0.119 0.119 0.121 0.118 0.118 0.119 0.119 0.119 0.119813234 0.059 0.071 0.055 0.069 0.065 0.06 0.062 0.066 0.067 0.063 0.063 0.064 0.071 0.069 0.061 0.066 0.067 0.061 0.062 0.062 0.0661 -40.0% -25.0% -10.0% 5.0% 20.0% 0 60 120 180 240 300 360 420 480 540 600 Q1'13 Q2'13 Q3'13 Q4'13 Q1'14 Q2'14 Q3'14 Q4'14 Q1'15 Q2'15 Q3'15 Q4'15 Q1'16 Q2'16 Q3'16 Q4'16 Q1'17 Q2'17 Q3'17 Q4'17 Q1'18 Total Debt Investments (Fair Value) Effective Yield S&P LCD Middle Market Note: As of end of each quarter presented, unless otherwise noted; dollar amounts in millions. Not a guarantee of future performance or investment pace.

Origination Pipeline Funnel (1) Closed Transactions 12 (1) Origination Pipeline figures reflect 2014 through March 31, 2018 Three tier sourcing platform, generating meaningful investable opportunities for WhiteHorse Finance Over 25 WhiteHorse deal professionals dedicated to sourcing and underwriting for WHF 23 person business development team seeks opportunities from H.I.G.’s proprietary database of over 21,000 contacts (telephonic salesforce) ▪ With access to H.I.G. Capital’s extensive sourcing network, the Company is able to capitalize on attractive self - originated lowe r middle market transactions as compared to the broadly syndicated market ▪ Directly originated loans to lower middle market companies typically generate more attractive risk - adjusted returns relative to larger, broadly syndicated credits Typical Underwriting Process: 1 - 3 months Opportunities Reviewed Initial Due Diligence Term Sheets Delivered Closed Transactions Total % of Sourced 3,495 100.00% 1,094 31.30% 291 8.33% 49 1.40%

Rigorous Credit Process Institutionalized processes for evaluating, monitoring and, if necessary, working out credits Fundamental Analysis » Structured approach to deal evaluation » Assesses industry, company, management, and macro factors » Emphasizes cash flow and downside protection Investment Committee » Broad market experience investing and managing structured credit with experience across cycles » Access to H.I.G. Capital’s global knowledge platform to leverage insight across industry, geography, and transaction type » Conservative view on credit risk driven by prior workout and bankruptcy experience » Weekly investment committee meetings include entire credit team, require group consensus, and are structured to provide detailed feedback to counterparties separate from a buy/pass decision Technical Analysis » Assess return potential from rate, fee, upside participation » Focus on structural protections including covenants, call protection, security, priority, and inter - creditor rights » Leverage past experience with issuers, management teams, and sponsors Portfolio Construction & Monitoring » Portfolio construction and ongoing risk management to mitigate risk and enhance investment returns » Top - down assessment of portfolio diversification and risk exposure (industry, issuer, geography, and credit type) » Multi - layered monitoring and active manager dialogue to stay current on issuer activities » Four formal investment committee reviews annually on existing portfolio with watch list credits reviewed more frequently 13

14 Appendix
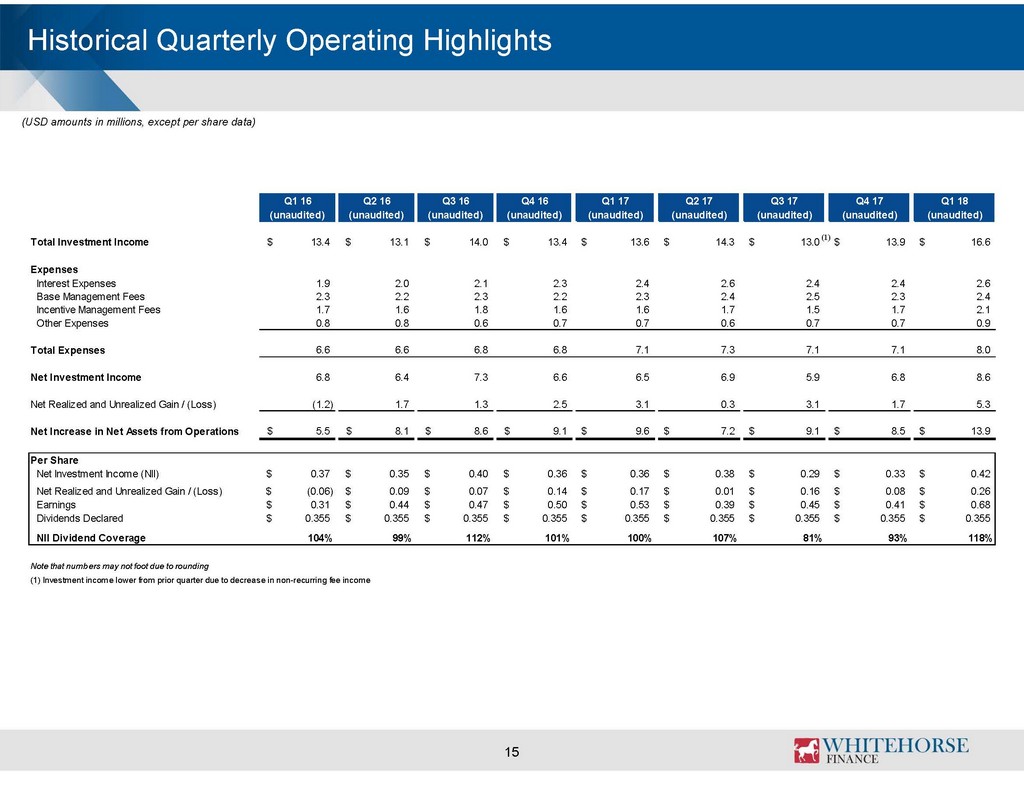
Q1 16 Q2 16 Q3 16 Q4 16 Q1 17 Q2 17 Q3 17 Q4 17 Q1 18 (unaudited) (unaudited) (unaudited) (unaudited) (unaudited) (unaudited) (unaudited) (unaudited) (unaudited) Total Investment Income 13.4$ 13.1$ 14.0$ 13.4$ 13.6$ 14.3$ 13.0$ 13.9$ 16.6$ Expenses Interest Expenses 1.9 2.0 2.1 2.3 2.4 2.6 2.4 2.4 2.6 Base Management Fees 2.3 2.2 2.3 2.2 2.3 2.4 2.5 2.3 2.4 Incentive Management Fees 1.7 1.6 1.8 1.6 1.6 1.7 1.5 1.7 2.1 Other Expenses 0.8 0.8 0.6 0.7 0.7 0.6 0.7 0.7 0.9 Total Expenses 6.6 6.6 6.8 6.8 7.1 7.3 7.1 7.1 8.0 Net Investment Income 6.8 6.4 7.3 6.6 6.5 6.9 5.9 6.8 8.6 Net Realized and Unrealized Gain / (Loss) (1.2) 1.7 1.3 2.5 3.1 0.3 3.1 1.7 5.3 Net Increase in Net Assets from Operations 5.5$ 8.1$ 8.6$ 9.1$ 9.6$ 7.2$ 9.1$ 8.5$ 13.9$ Per Share Net Investment Income (NII) 0.37$ 0.35$ 0.40$ 0.36$ 0.36$ 0.38$ 0.29$ 0.33$ 0.42$ Net Realized and Unrealized Gain / (Loss) (0.06)$ 0.09$ 0.07$ 0.14$ 0.17$ 0.01$ 0.16$ 0.08$ 0.26$ Earnings 0.31$ 0.44$ 0.47$ 0.50$ 0.53$ 0.39$ 0.45$ 0.41$ 0.68$ Dividends Declared 0.355$ 0.355$ 0.355$ 0.355$ 0.355$ 0.355$ 0.355$ 0.355$ 0.355$ NII Dividend Coverage 104% 99% 112% 101% 100% 107% 81% 93% 118% Note that numbers may not foot due to rounding (1) Investment income lower from prior quarter due to decrease in non-recurring fee income 15 Historical Quarterly Operating Highlights (USD amounts in millions, except per share data) (1)

16 Historical Quarterly Balance Sheet Highlights (USD amounts in millions, except per share data) Q1 16 Q2 16 Q3 16 Q4 16 Q1 17 Q2 17 Q3 17 Q4 17 Q1 18 (unaudited) (unaudited) (unaudited) (unaudited) (unaudited) (unaudited) (unaudited) (unaudited) (unaudited) Assets Investments at Fair Value 417.2$ 400.9$ 402.9$ 411.7$ 431.7$ 437.9$ 435.3$ 440.7$ 467.7$ Cash and Equivalents (1) 21.1 44.1 23.7 28.9 20.1 43.7 41.9 38.9 18.6 Other Assets 4.5 4.4 4.4 5.6 6.7 5.7 6.1 5.9 6.3 Total Assets 442.7$ 449.4$ 430.9$ 446.2$ 458.4$ 487.3$ 483.4$ 485.5$ 492.6$ Liabilities Debt 186.7 191.4 170.4 182.3 192.1 189.0 181.9 182.1 182.3 Other Liabilities 13.0 13.3 13.8 14.5 13.8 14.5 15.9 16.5 16.8 Total Liabilities 199.7$ 204.7$ 184.1$ 196.8$ 205.9$ 203.5$ 197.8$ 198.6$ 199.1$ Total Net Assets 243.1$ 244.7$ 246.8$ 249.4$ 252.5$ 283.8$ 285.5$ 287.0$ 293.5$ Total Liabilities and Net Assets 442.7$ 449.4$ 430.9$ 446.2$ 458.4$ 487.3$ 483.4$ 485.5$ 492.6$ Net Asset Value per Share 13.28$ 13.37$ 13.48$ 13.63$ 13.80$ 13.83$ 13.92$ 13.98$ 14.30$ Leverage Ratio (2) 0.78x 0.79x 0.70x 0.74x 0.77x 0.68x 0.65x 0.64x 0.63x Net Leverage Ratio (3) 0.69x 0.61x 0.61x 0.63x 0.69x 0.52x 0.50x 0.51x 0.57x Note that numbers may not foot due to rounding (1) Includes Restricted Cash (2) Calculated as Total Debt Outstanding divided by Total Net Assets (3) Net Leverage Ratio is defined as debt outstanding plus any amounts payable for investments purchased less cash and receivables for investments sold, divided by total net assets

17 WhiteHorse Finance – Senior Team Bios Title Years of Experience Highlights John Bolduc ▪ Chairman of the Board ▪ Member of the Investment Committee 26 ▪ Leads H.I.G. Capital’s credit platform ▪ Previous experience at Bain & Company and Chemed Corporation Stuart Aronson ▪ Chief Executive Officer and Director ▪ Member of Investment Committee 31 ▪ Leads H.I.G. Capital’s direct lending strategy ▪ Previously President and CEO of GE Sponsor Finance and an officer of General Electric Edward Giordano ▪ Interim Chief Financial Officer 24 ▪ Serves as CFO for H.I.G. Capital’s entire $10Bn credit platform ▪ Former Chief Accounting Officer at Black Diamond Capital Management Sami Mnaymneh ▪ Member of the Investment Committee 30 ▪ Co - founding Partner of H.I.G. Capital ▪ Former Managing Director at The Blackstone Group ▪ Vice President in the Mergers & Acquisitions group at Morgan Stanley Anthony Tamer ▪ Member of the Investment Committee 32 ▪ Co - founding Partner of H.I.G. Capital ▪ Former Partner at Bain & Company ▪ Previously held marketing, engineering and manufacturing positions at Hewlett - Packard and Sprint Corporation Jay Carvell ▪ Director ▪ Member of the Investment Committee 21 ▪ Founding partner of WhiteHorse Capital, a leading credit investor and manager of CLOs (certain assets acquired by H.I.G. Capital in 2011) ▪ Previously held various positions with Highland Capital Management and PricewaterhouseCoopers LLP Brian Schwartz ▪ Member of the Investment Committee 24 ▪ Executive Managing Director and co - head of H.I.G. Capital’s Middle Market funds ▪ Previous experience at PepsiCo and Dillon, Read and Co. Pankaj Gupta ▪ Member of the Investment Committee 17 ▪ Managing Director with H.I.G. Capital’s credit platform ▪ Former co - head of the Credit and Sponsor Finance group at American Capital Javier Casillas ▪ Member of the Investment Committee 15 ▪ Managing Director with H.I.G. Capital’s credit platform ▪ Previously held various positions with JP Morgan and ING David Indelicato ▪ Member of the Investment Committee 24 ▪ Managing Director with H.I.G. Capital’s credit platform ▪ Former head of Credit and Restructuring at Medley Capital Mark Bernier ▪ Member of the Investment Committee 23 ▪ Managing Director with H.I.G. Capital’s credit platform ▪ Previously held various positions with GE Capital Title Years of Experience Highlights