Attached files
| file | filename |
|---|---|
| 8-K - 8-K - MIDDLEFIELD BANC CORP | d537616d8k.htm |
Middlefield Banc Corp. Annual Shareholder Meeting May 16, 2018 Exhibit 99.1
Forward Looking Statements This presentation contains forward-looking statements within the meaning of the Securities Exchange Act of 1934 and the Private Securities Litigation Reform Act of 1995 concerning Middlefield Banc Corp.’s plans, strategies, objectives, expectations, intentions, financial condition and results of operations. These forward-looking statements reflect management’s current views and intentions and are subject to known and unknown risks, uncertainties, assumptions and other factors that could cause the actual results to differ materially from those contemplated by the statements. The significant risks and uncertainties related to Middlefield Banc Corp. of which management is aware are discussed in detail in the periodic reports that Middlefield Banc Corp. files with the Securities and Exchange Commission (the “SEC”), including in the “Risk Factors” section of its Annual Report on Form 10-K and its Quarterly Report on Form 10-Q. Investors are urged to review Middlefield Banc Corp.’s periodic reports, which are available at no charge through the SEC’s website at www.sec.gov and through Middlefield Banc Corp.’s website at www.middlefieldbank.bank on the “Investor Relations” page. Middlefield Banc Corp. assumes no obligation to update any of these forward-looking statements to reflect a change in its views or events or circumstances that occur after the date of this presentation. 2
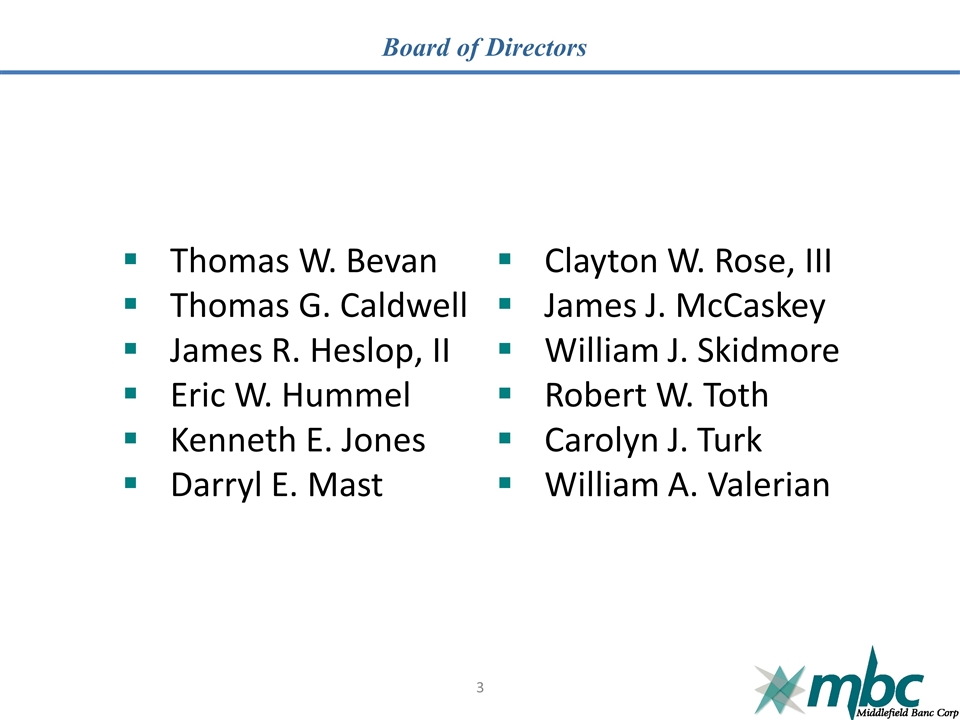
Board of Directors Thomas W. Bevan Thomas G. Caldwell James R. Heslop, II Eric W. Hummel Kenneth E. Jones Darryl E. Mast Clayton W. Rose, III James J. McCaskey William J. Skidmore Robert W. Toth Carolyn J. Turk William A. Valerian 3
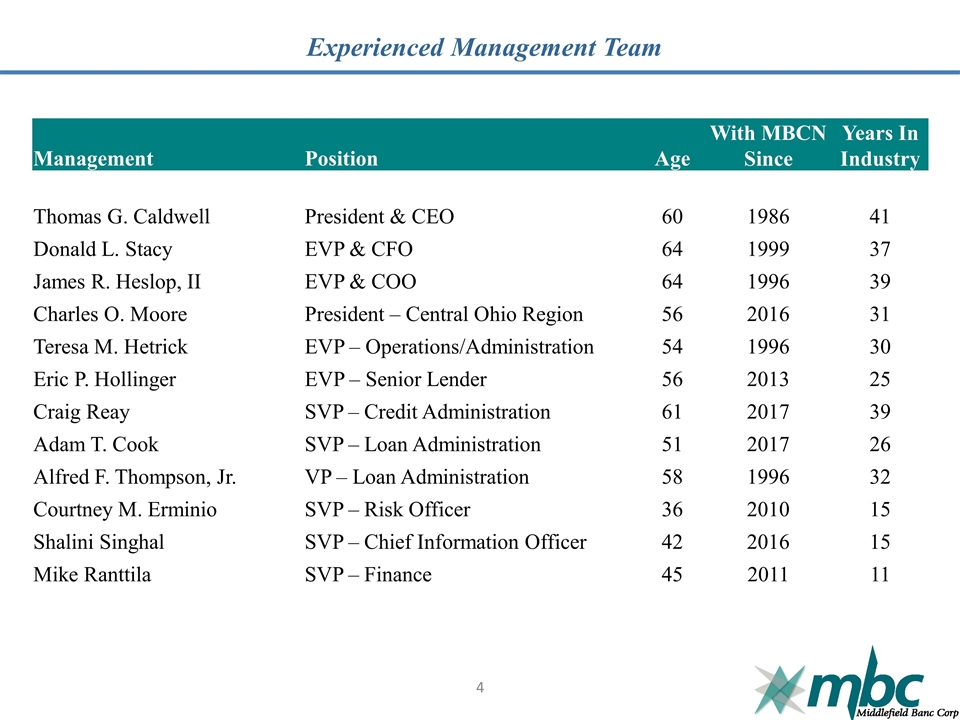
Experienced Management Team Management Position Age With MBCN Since Years In Industry Thomas G. Caldwell President & CEO 60 1986 41 Donald L. Stacy EVP & CFO 64 1999 37 James R. Heslop, II EVP & COO 64 1996 39 Charles O. Moore President – Central Ohio Region 56 2016 31 Teresa M. Hetrick EVP – Operations/Administration 54 1996 30 Eric P. Hollinger EVP – Senior Lender 56 2013 25 Craig Reay SVP – Credit Administration 61 2017 39 Adam T. Cook SVP – Loan Administration 51 2017 26 Alfred F. Thompson, Jr. VP – Loan Administration 58 1996 32 Courtney M. Erminio SVP – Risk Officer 36 2010 15 Shalini Singhal SVP – Chief Information Officer 42 2016 15 Mike Ranttila SVP – Finance 45 2011 11 4
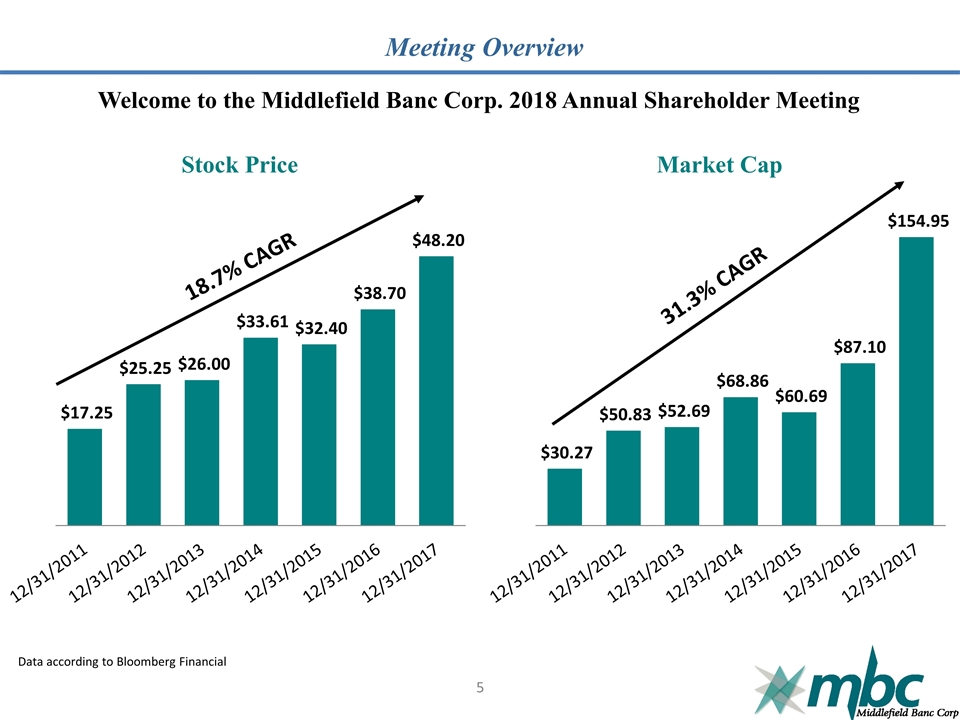
Meeting Overview Welcome to the Middlefield Banc Corp. 2018 Annual Shareholder Meeting Data according to Bloomberg Financial 5 Stock Price Market Cap 18.7% CAGR 31.3% CAGR
6 CEO Report
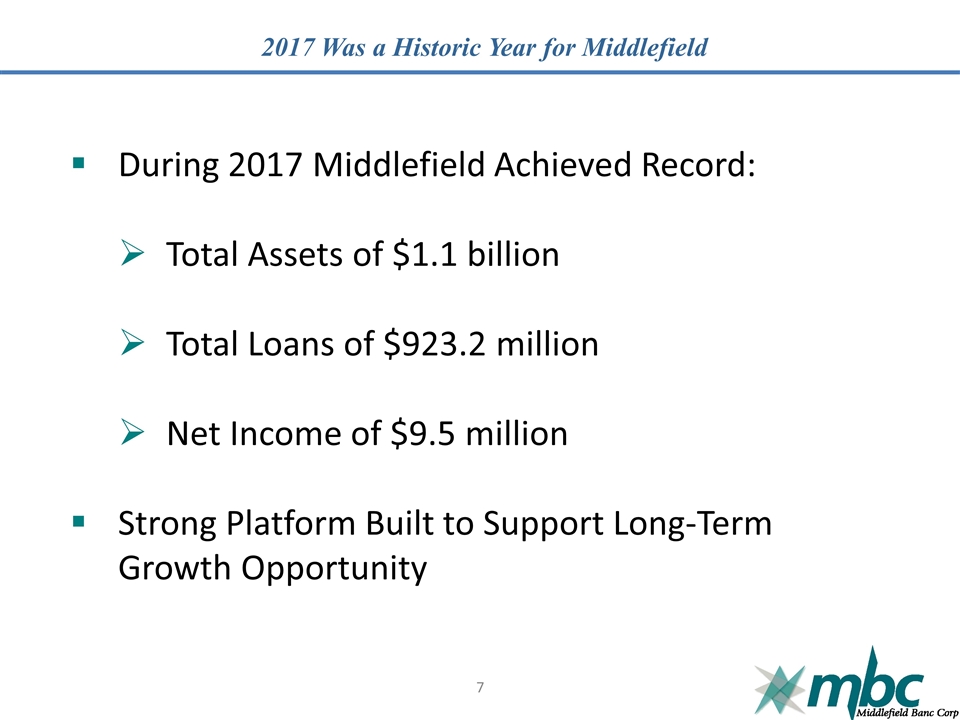
2017 Was a Historic Year for Middlefield 7 During 2017 Middlefield Achieved Record: Total Assets of $1.1 billion Total Loans of $923.2 million Net Income of $9.5 million Strong Platform Built to Support Long-Term Growth Opportunity
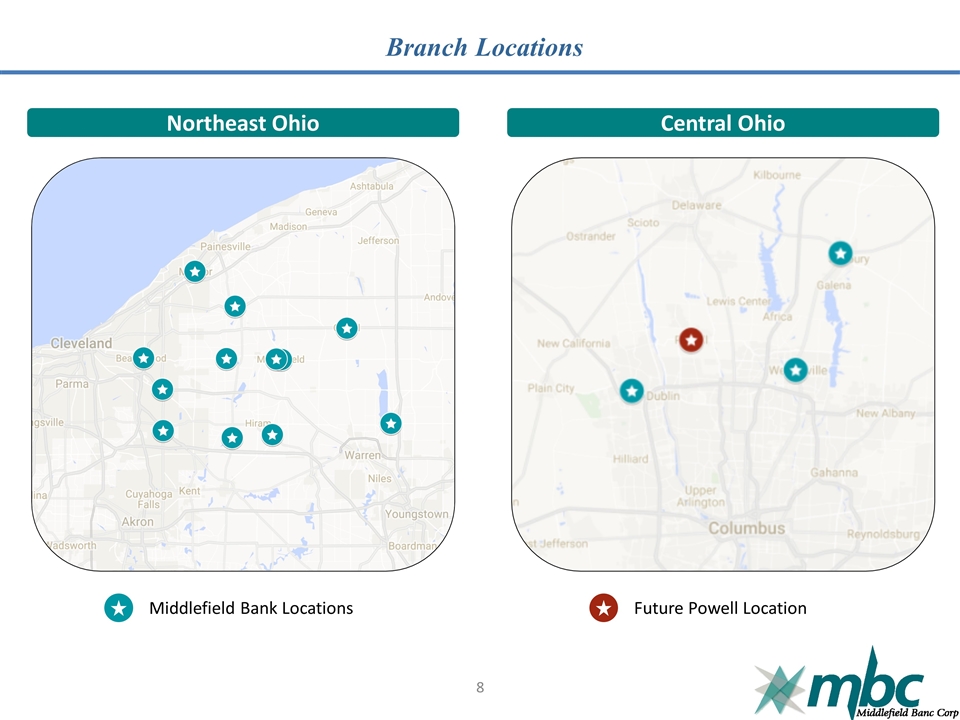
Branch Locations 8 Northeast Ohio Central Ohio Middlefield Bank Locations Future Powell Location
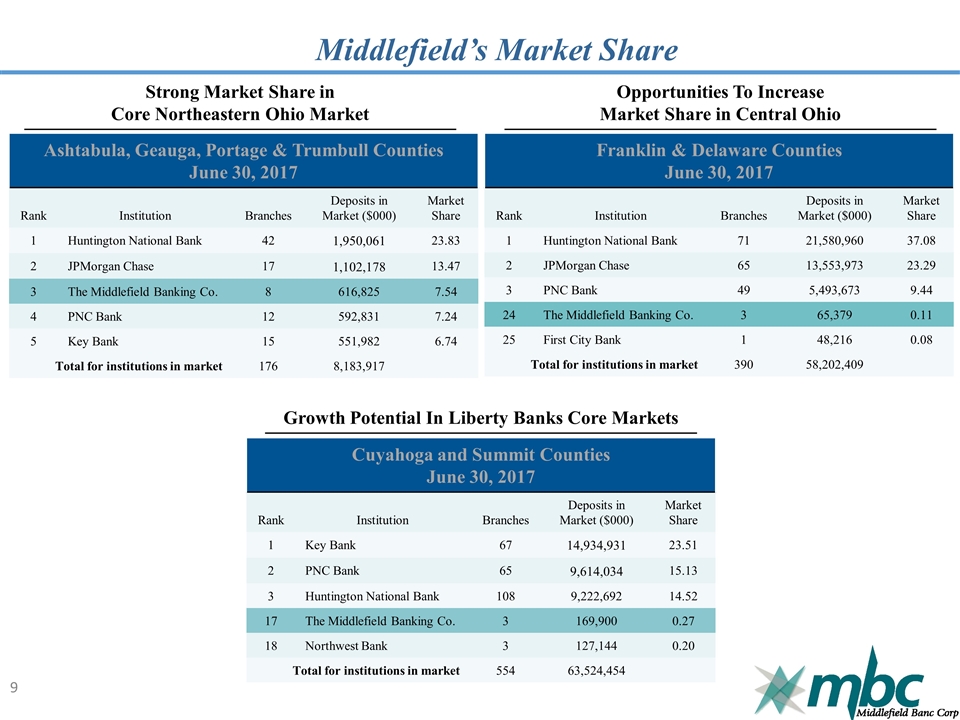
Middlefield’s Market Share Source: FDIC Ashtabula, Geauga, Portage & Trumbull Counties June 30, 2017 Rank Institution Branches Deposits in Market ($000) Market Share 1 Huntington National Bank 42 1,950,061 23.83 2 JPMorgan Chase 17 1,102,178 13.47 3 The Middlefield Banking Co. 8 616,825 7.54 4 PNC Bank 12 592,831 7.24 5 Key Bank 15 551,982 6.74 Total for institutions in market 176 8,183,917 Franklin & Delaware Counties June 30, 2017 Rank Institution Branches Deposits in Market ($000) Market Share 1 Huntington National Bank 71 21,580,960 37.08 2 JPMorgan Chase 65 13,553,973 23.29 3 PNC Bank 49 5,493,673 9.44 24 The Middlefield Banking Co. 3 65,379 0.11 25 First City Bank 1 48,216 0.08 Total for institutions in market 390 58,202,409 Strong Market Share in Core Northeastern Ohio Market Opportunities To Increase Market Share in Central Ohio Growth Potential In Liberty Banks Core Markets Cuyahoga and Summit Counties June 30, 2017 Rank Institution Branches Deposits in Market ($000) Market Share 1 Key Bank 67 14,934,931 23.51 2 PNC Bank 65 9,614,034 15.13 3 Huntington National Bank 108 9,222,692 14.52 17 The Middlefield Banking Co. 3 169,900 0.27 18 Northwest Bank 3 127,144 0.20 Total for institutions in market 554 63,524,454 9
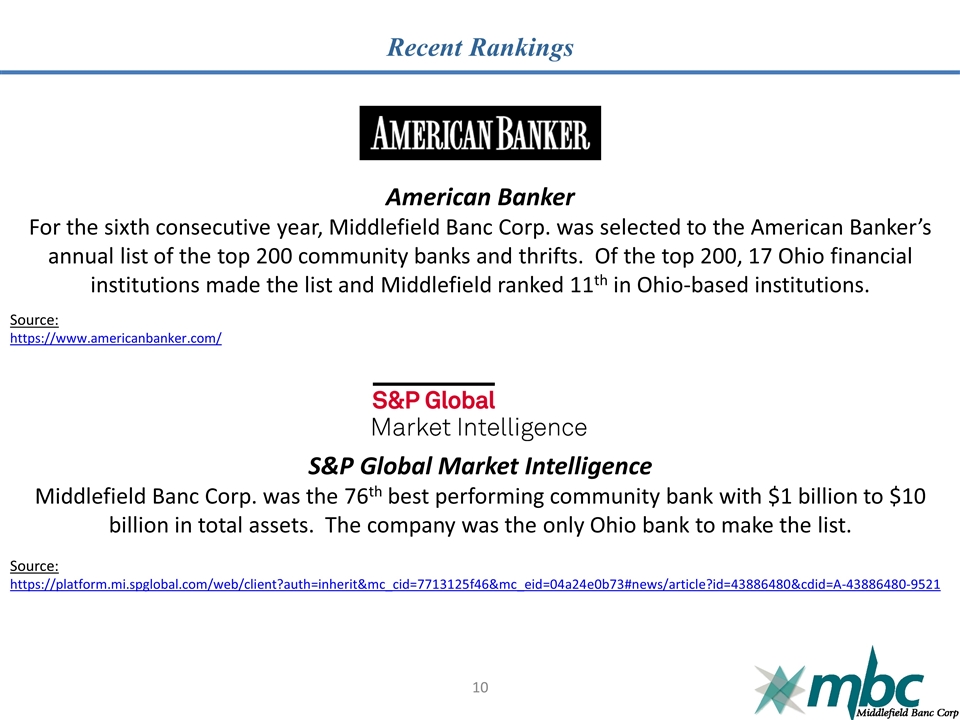
Recent Rankings 10 S&P Global Market Intelligence Middlefield Banc Corp. was the 76th best performing community bank with $1 billion to $10 billion in total assets. The company was the only Ohio bank to make the list. Source: https://platform.mi.spglobal.com/web/client?auth=inherit&mc_cid=7713125f46&mc_eid=04a24e0b73#news/article?id=43886480&cdid=A-43886480-9521 American Banker For the sixth consecutive year, Middlefield Banc Corp. was selected to the American Banker’s annual list of the top 200 community banks and thrifts. Of the top 200, 17 Ohio financial institutions made the list and Middlefield ranked 11th in Ohio-based institutions. Source: https://www.americanbanker.com/
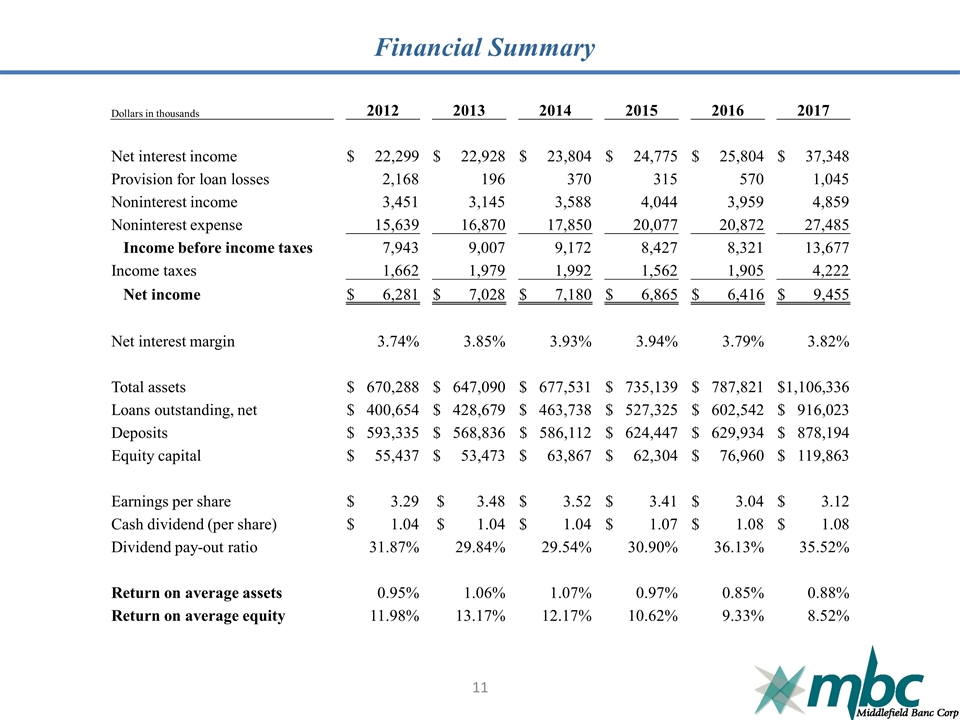
Financial Summary Dollars in thousands 2012 2013 2014 2015 2016 2017 Net interest income $ 22,299 $ 22,928 $ 23,804 $ 24,775 $ 25,804 $ 37,348 Provision for loan losses 2,168 196 370 315 570 1,045 Noninterest income 3,451 3,145 3,588 4,044 3,959 4,859 Noninterest expense 15,639 16,870 17,850 20,077 20,872 27,485 Income before income taxes 7,943 9,007 9,172 8,427 8,321 13,677 Income taxes 1,662 1,979 1,992 1,562 1,905 4,222 Net income $ 6,281 $ 7,028 $ 7,180 $ 6,865 $ 6,416 $ 9,455 Net interest margin 3.74% 3.85% 3.93% 3.94% 3.79% 3.82% Total assets $ 670,288 $ 647,090 $ 677,531 $ 735,139 $ 787,821 $1,106,336 Loans outstanding, net $ 400,654 $ 428,679 $ 463,738 $ 527,325 $ 602,542 $ 916,023 Deposits $ 593,335 $ 568,836 $ 586,112 $ 624,447 $ 629,934 $ 878,194 Equity capital $ 55,437 $ 53,473 $ 63,867 $ 62,304 $ 76,960 $ 119,863 Earnings per share $ 3.29 $ 3.48 $ 3.52 $ 3.41 $ 3.04 $ 3.12 Cash dividend (per share) $ 1.04 $ 1.04 $ 1.04 $ 1.07 $ 1.08 $ 1.08 Dividend pay-out ratio 31.87% 29.84% 29.54% 30.90% 36.13% 35.52% Return on average assets 0.95% 1.06% 1.07% 0.97% 0.85% 0.88% Return on average equity 11.98% 13.17% 12.17% 10.62% 9.33% 8.52% 11
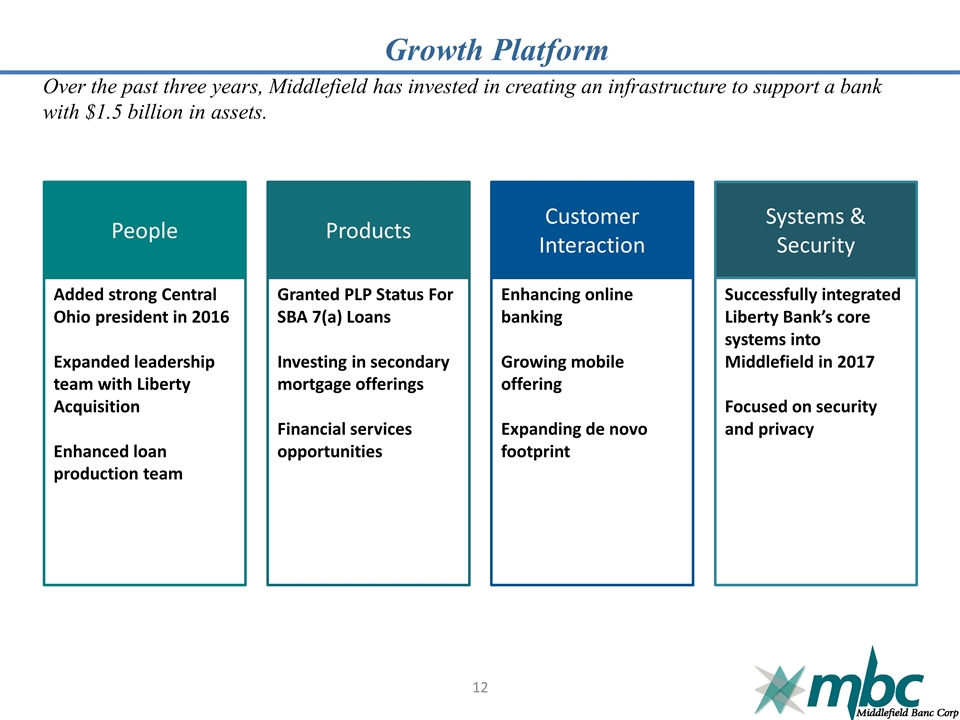
Growth Platform Over the past three years, Middlefield has invested in creating an infrastructure to support a bank with $1.5 billion in assets. People Added strong Central Ohio president in 2016 Expanded leadership team with Liberty Acquisition Enhanced loan production team Products Granted PLP Status For SBA 7(a) Loans Investing in secondary mortgage offerings Financial services opportunities Systems & Security Successfully integrated Liberty Bank’s core systems into Middlefield in 2017 Focused on security and privacy Customer Interaction Enhancing online banking Growing mobile offering Expanding de novo footprint
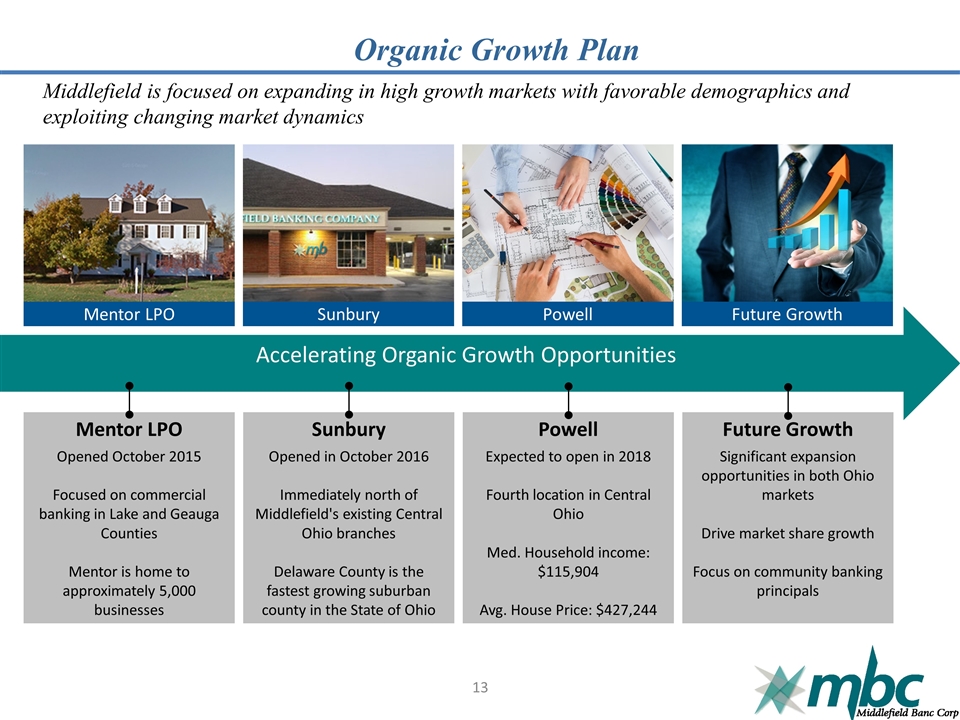
Organic Growth Plan Mentor LPO Opened October 2015 Focused on commercial banking in Lake and Geauga Counties Mentor is home to approximately 5,000 businesses Sunbury Opened in October 2016 Immediately north of Middlefield's existing Central Ohio branches Delaware County is the fastest growing suburban county in the State of Ohio Powell Expected to open in 2018 Fourth location in Central Ohio Med. Household income: $115,904 Avg. House Price: $427,244 Future Growth Significant expansion opportunities in both Ohio markets Drive market share growth Focus on community banking principals Accelerating Organic Growth Opportunities Mentor LPO Sunbury Powell Future Growth Middlefield is focused on expanding in high growth markets with favorable demographics and exploiting changing market dynamics
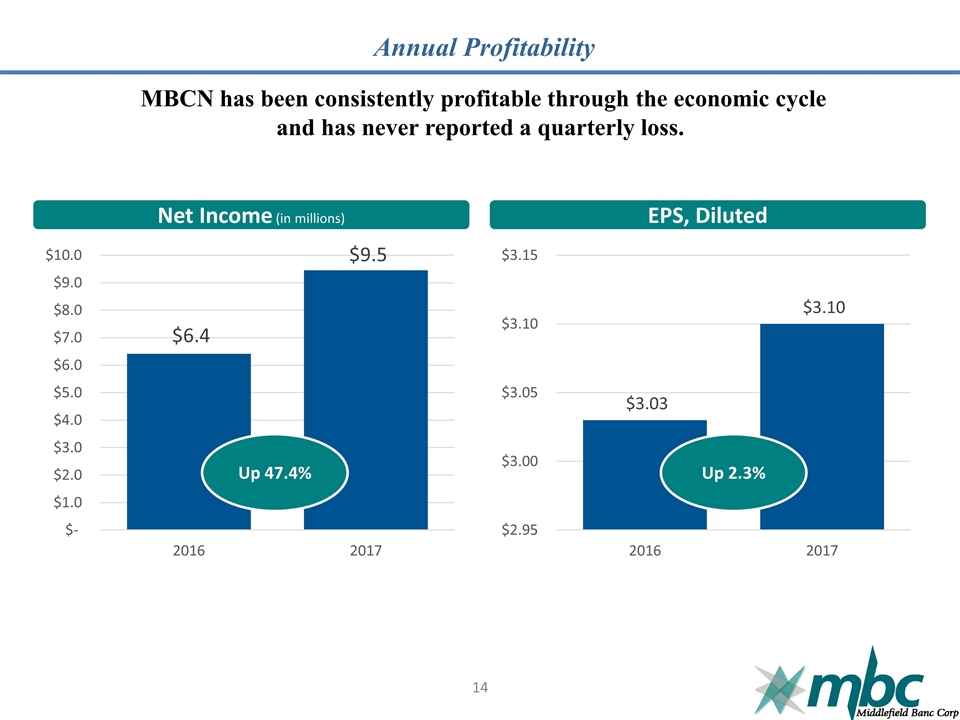
Annual Profitability MBCN has been consistently profitable through the economic cycle and has never reported a quarterly loss. 14 Net Income (in millions) EPS, Diluted Up 47.4% Up 2.3%
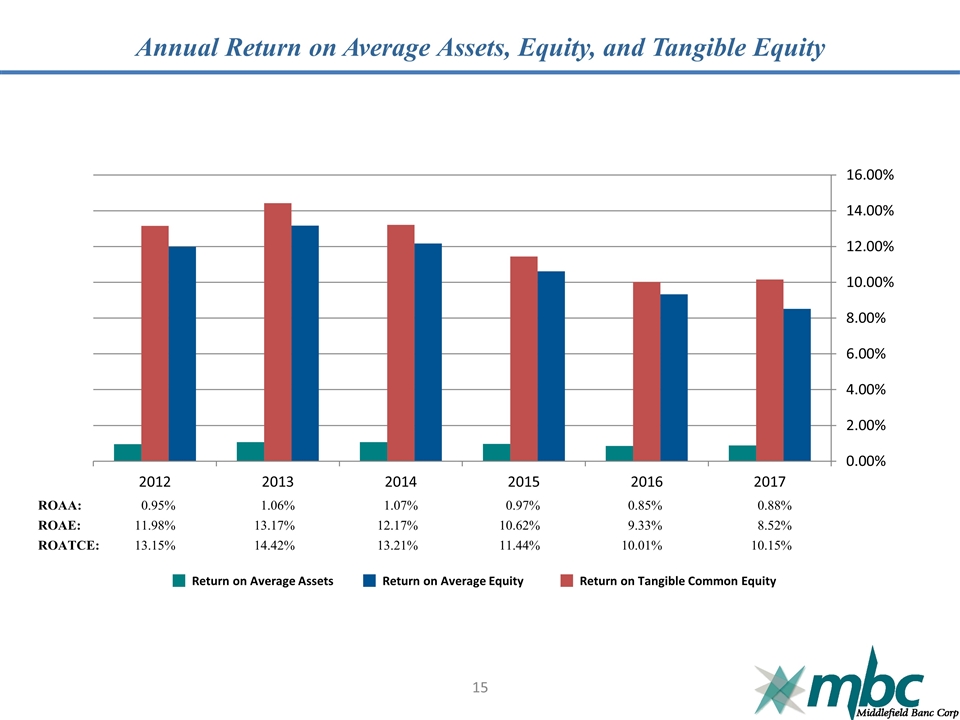
Annual Return on Average Assets, Equity, and Tangible Equity 15 ROAA: 0.95% 1.06% 1.07% 0.97% 0.85% 0.88% ROAE: 11.98% 13.17% 12.17% 10.62% 9.33% 8.52% ROATCE: 13.15% 14.42% 13.21% 11.44% 10.01% 10.15% Return on Average Assets Return on Average Equity Return on Tangible Common Equity
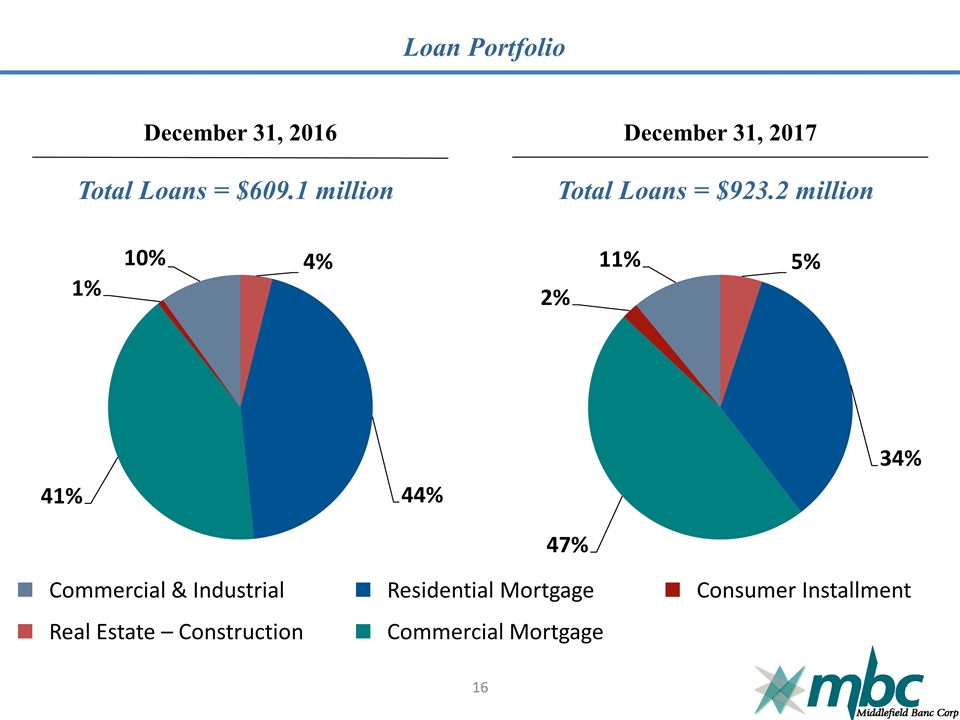
Loan Portfolio 16 December 31, 2016 December 31, 2017 Commercial & Industrial Real Estate – Construction Residential Mortgage Commercial Mortgage Consumer Installment Total Loans = $609.1 million Total Loans = $923.2 million
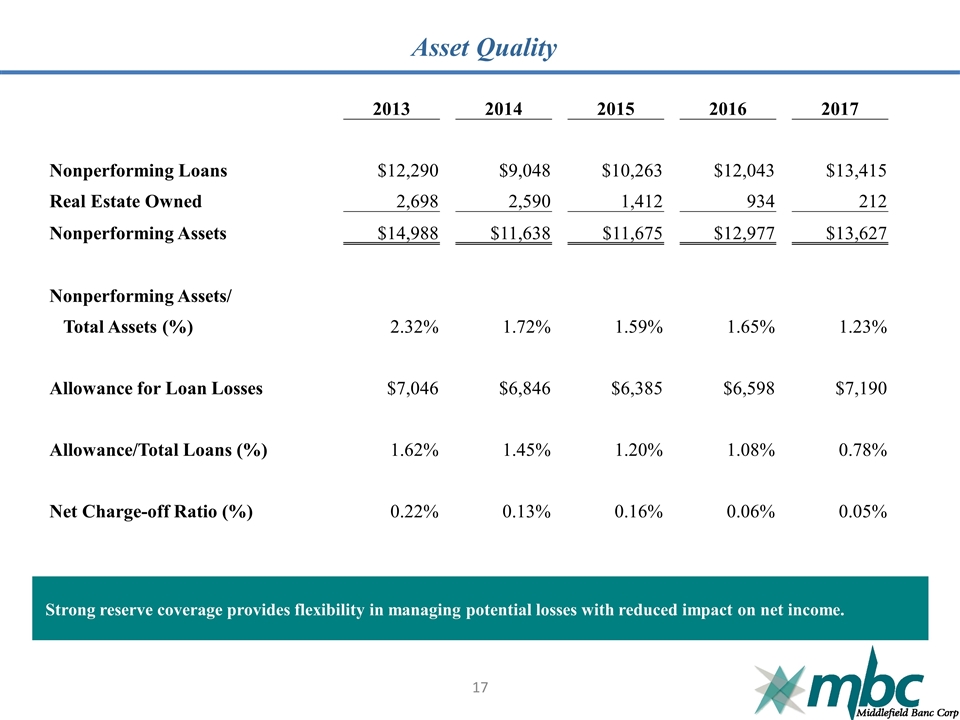
Asset Quality 2013 2014 2015 2016 2017 Nonperforming Loans $12,290 $9,048 $10,263 $12,043 $13,415 Real Estate Owned 2,698 2,590 1,412 934 212 Nonperforming Assets $14,988 $11,638 $11,675 $12,977 $13,627 Nonperforming Assets/ Total Assets (%) 2.32% 1.72% 1.59% 1.65% 1.23% Allowance for Loan Losses $7,046 $6,846 $6,385 $6,598 $7,190 Allowance/Total Loans (%) 1.62% 1.45% 1.20% 1.08% 0.78% Net Charge-off Ratio (%) 0.22% 0.13% 0.16% 0.06% 0.05% Strong reserve coverage provides flexibility in managing potential losses with reduced impact on net income. 17
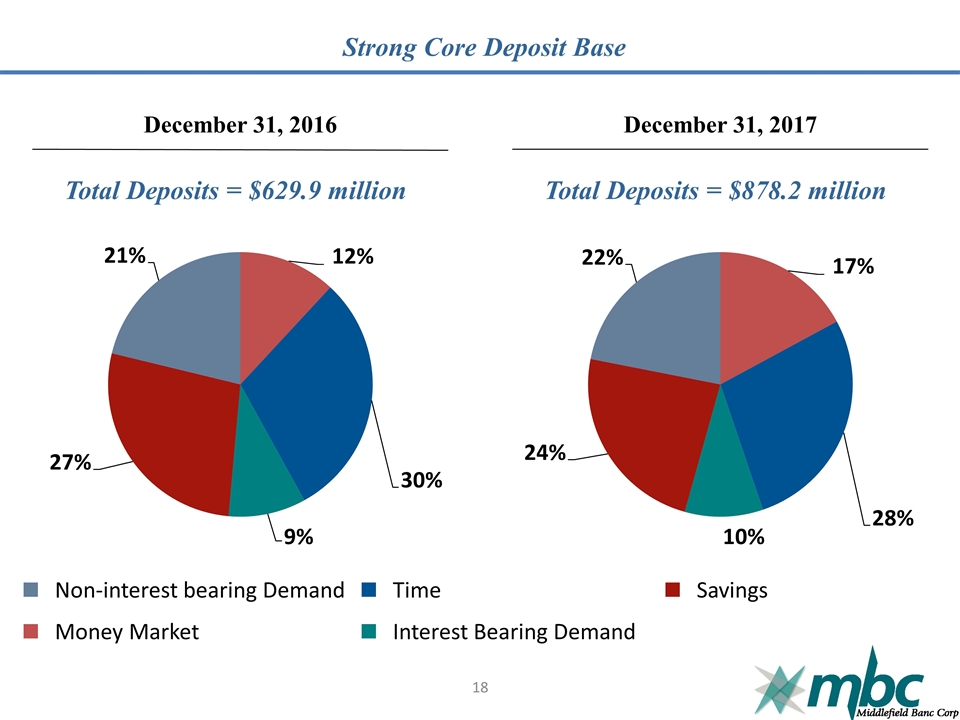
Strong Core Deposit Base 18 December 31, 2016 December 31, 2017 Non-interest bearing Demand Money Market Time Interest Bearing Demand Savings Total Deposits = $629.9 million Total Deposits = $878.2 million
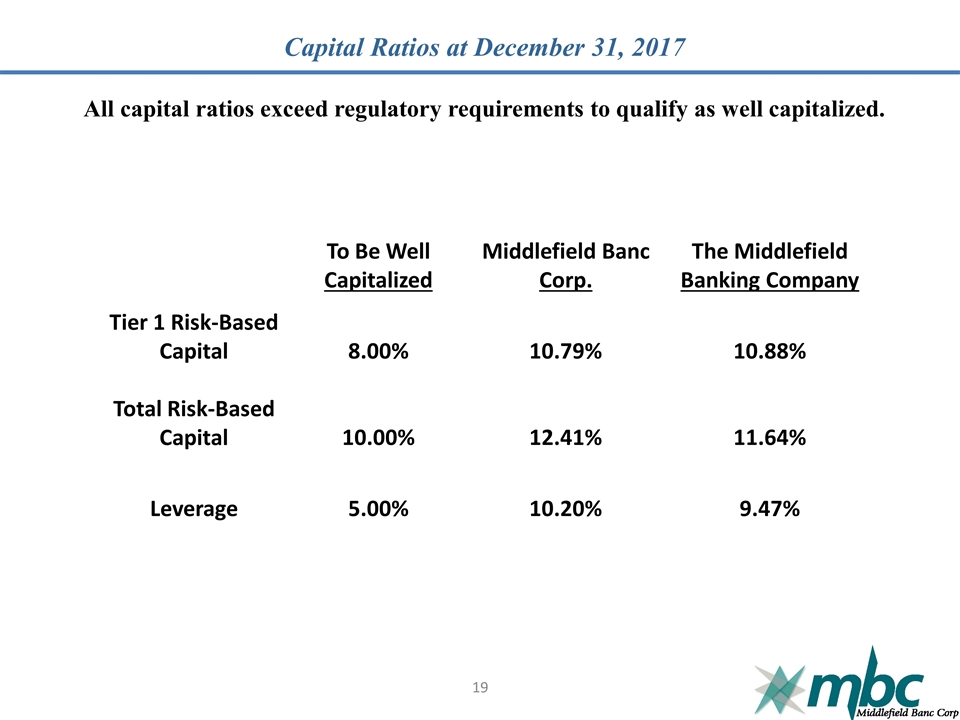
Capital Ratios at December 31, 2017 To Be Well Capitalized Middlefield Banc Corp. The Middlefield Banking Company Tier 1 Risk-Based Capital 8.00% 10.79% 10.88% Total Risk-Based Capital 10.00% 12.41% 11.64% Leverage 5.00% 10.20% 9.47% All capital ratios exceed regulatory requirements to qualify as well capitalized. 19

Questions, Comments, and Discussion 20
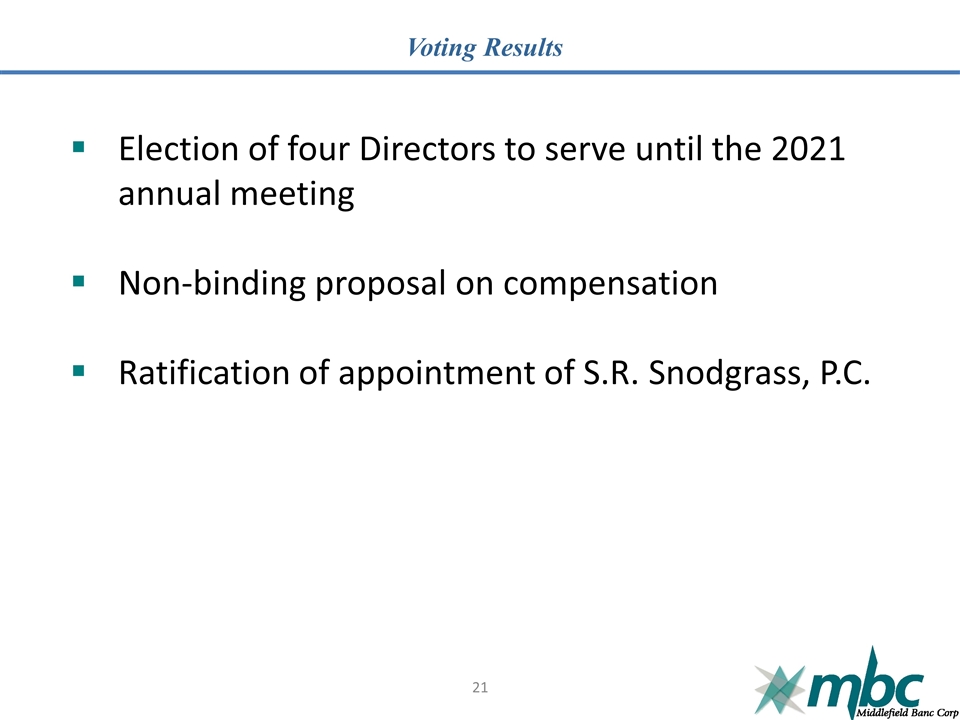
Voting Results Election of four Directors to serve until the 2021 annual meeting Non-binding proposal on compensation Ratification of appointment of S.R. Snodgrass, P.C. 21
Thank you for your support! May 16, 2018 22
