Attached files
| file | filename |
|---|---|
| 8-K - 8-K - Conifer Holdings, Inc. | a20188-kannualmeetingslide.htm |

CNFR ANNUAL SHAREHOLDER MEETING MAY 16, 2018

SAFE HARBOR STATEMENT This presentation contains “forward-looking” statements within the meaning of Section 27A of the Securities Act of 1933, as amended, and Section 21E of the Securities Exchange Act of 1934, as amended, that are based on our management’s beliefs and assumptions and on information currently available to management. These forward-looking statements include, without limitation, statements regarding our industry, business strategy, plans, goals and expectations concerning our market position, product expansion, future operations, margins, profitability, future efficiencies, and other financial and operating information. When used in this discussion, the words “may,” “believes,” “intends,” “seeks,” “anticipates,” “plans,” “estimates,” “expects,” “should,” “assumes,” “continues,” “potential,” “could,” “will,” “future” and the negative of these or similar terms and phrases are intended to identify forward-looking statements. Forward-looking statements involve known and unknown risks, uncertainties, inherent risks and other factors that may cause our actual results, performance or achievements to be materially different from any future results, performance or achievements expressed or implied by the forward-looking statements. Forward- looking statements represent our management’s beliefs and assumptions only as of the date of this presentation. Our actual future results may be materially different from what we expect due to factors largely outside our control, including the occurrence of severe weather conditions and other catastrophes, the cyclical nature of the insurance industry, future actions by regulators, our ability to obtain reinsurance coverage at reasonable rates and the effects of competition. These and other risks and uncertainties associated with our business are described under the heading “Risk Factors” in our most recently filed Annual Report on Form 10- K, which should be read in conjunction with this presentation. The company and subsidiaries operate in a dynamic business environment, and therefore the risks identified are not meant to be exhaustive. Risk factors change and new risks emerge frequently. Except as required by law, we assume no obligation to update these forward-looking statements publicly, or to update the reasons actual results could differ materially from those anticipated in the forward-looking statements, even if new information becomes available in the future. 1

CONIFER: ATAGLANCE Exchange / Ticker Nasdaq: CNFR Conifer Holdings, Inc. Share Price (at 5/11/2018): $6.05 Shares Outstanding: 8.5M Conifer White Pine Sycamore Insurance Company Insurance Company Insurance Agency Market Capitalization: $52M MI Domicile MI Domicile MI Domicile A.M. Best: B++ A.M. Best: B+ A.M. Best: NR GAAP Equity*: $53M Demotech: A Demotech: A Demotech: NR Book Value per Share*: $6.20 COMPANY HISTORY 2008 2012 August 2015 2015 2016 2017 North Pointe Non-compete Conifer completes Company makes Conifer continues to Lower expense ratio (founded by agreements expire IPO on Nasdaq, strategic decision to lessen exposure to as GWP continues Conifer founder and Conifer is further expands slow growth in Florida market; to grow; focus on Jim Petcoff) founded, bringing as a specialty homeowners Ramps up new lines; enhancing sold to QBE for together successful niche writer of product in Florida; reports favorable underwriting profit $146 million, or executives with P&C products Commences new underwriting trends in core specialty approximately new, state-of-the- specialty products in new lines; grows commercial lines 1.7X book value art processing in security guards GWP by 22.6% systems and low-value dwelling with historically strong loss ratios 2 * as of 12/31/2017 2

CNFR 2017: YEAR IN REVIEW Business Mix Shift Resulted in Q4 2017 Return to Profitability Performance Initiatives Produced Combined Ratio Improvement Significant Opportunities for Growth and Continued Expansion Balance Sheet Remains Well-Positioned to Support Companies 2018: Increase Profitability for CNFR Shareholders 3

BUSINESS MIX –GROSS WRITTEN PREMIUM 2016 & 2017 GROSS WRITTEN PREMIUM FOR 2016 GROSS WRITTEN PREMIUM FOR 2017 4

GROSS WRITTEN PREMIUM • Total gross written premium was $120 $114 million as of December 31, 2017 • Net Earned Premium – up 2.3% for 2017 ILLIONS M $22.2 $26.7 • Factors driving Net Earned Premium $100 growth include: Strong commercial lines experience in hospitality & small business accounts $80 $25.6 Particularly in commercial multi-peril and other liability lines $28.8 Achieved growth despite planned reduction in Personal Lines, shifting away from $60 wind-exposed premium (particularly reducing Florida homeowners exposure) $92.1 $88.2 $40 $68.2 $55.1 $1.9 $20 $21.8 $0 2014 2015 2016 2017 Q1 2018 Commercial Lines Personal Lines 5 5

Q1 2018 RESULTS OVERVIEW Gross Written Premium: GROSS WRITTEN PREMIUM • GWP was $23.7M in Q1 2018 $30 Commercial Lines GWP increased 0.7% from Q1 2017 ILLIONS • Quick Service Restaurants and M Security Guards business performed well $25 in the period $4.8 $1.9 Personal Lines GWP decreased 59.6% from Q1 2017 – aligned with the Company’s plan to focus on core lines of businesses $20 • Florida homeowners was down 51% $15 Net Earned Premium: • Overall NEP was roughly unchanged, at $23.8M in Q1 2018 due to repositioning of the Company’s $21.6 $21.8 personal lines $10 Commercial Lines NEP increased 2.2% in Q1 2018 Personal Lines NEP decreased almost 18%, $5 consistent with planned shift in business mix $0 Q1 2017 Q1 2018 Commercial Lines Personal Lines 6 6

COMMERCIAL LINES OVERVIEW GROSS WRITTEN PREMIUM $25 ILLIONS M $20 $9.9 $10.2 $15 As of March 31, 2018 GROSS WRITTEN PREMIUM Top Five States $ in thousands Florida $ 5,485 25.2% $10 Michigan 4,911 22.5% Texas 1,620 7.4% Pennsylvania 1,541 7.1% $11.7 $11.6 Ohio 1,119 5.1% $5 All Other 7,112 32.7% Total $ 21,788 100.0% $0 Q1 2017 Q1 2018 • Commercial Lines represented roughly 90% of the premium written in the first quarter 2018 – and roughly 80% Hospitality Small Business for 2017 as a whole • Quarter over quarter, Commercial gross written premium was flat in Q1 2018 • Conifer continues to write Commercial Lines in all 50 states 7 7

PERSONAL LINES OVERVIEW GROSS WRITTEN PREMIUM $6 ILLIONS M $5 Decrease was a strategic decision to deemphasize the Company’s Florida homeowners business and wind-exposed $4 business in Texas and Hawaii. $2.9 $3 As of March 31, 2018 GROSS WRITTEN PREMIUM Top Five States $ in thousands $2 Indiana $ 558 28.6% $1.0 Florida 468 24.0% $1 $1.9 Hawaii 447 22.9% Texas 232 11.9% $0.9 Illinois 148 7.6% $0 All Other 96 5.0% Q1 2017 Q1 2018 Total 1,949 100.0% Wind-Exposed Low-Value Dwelling • Personal Lines production was approximately 8% of total premium in Q1 2018 • Net earned premium in personal lines declined almost 18% in the first quarter • Planned decrease in wind-exposed homeowners, specifically Florida homeowners, which was down 50.5% in Q1 2018 • Florida assumption business started non-renewing February 9th • Continuing efforts to reduce wind exposure overall 8 8

RESULTS OVERVIEW: COMBINED RATIO • Continued focus on core commercial lines will help drive overall combined ratio improvement 92% of total premiums in Q1 were from our core commercial business Expense ratio was down slightly, quarter over quarter 9.6 percentage point improvement 109.1% 99.5% 64.2% 55.2% 44.9% 44.3% Q1 2017 Q1 2018 Expense Ratio Loss Ratio 9

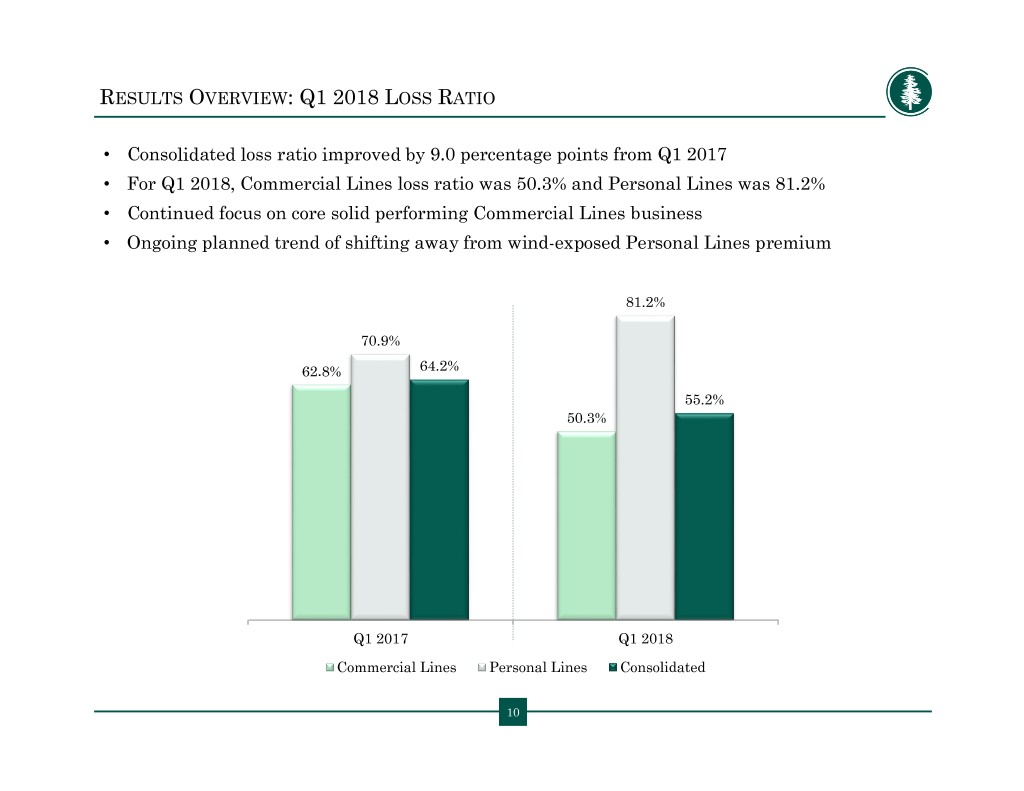
RESULTS OVERVIEW: Q1 2018 LOSS RATIO • Consolidated loss ratio improved by 9.0 percentage points from Q1 2017 • For Q1 2018, Commercial Lines loss ratio was 50.3% and Personal Lines was 81.2% • Continued focus on core solid performing Commercial Lines business • Ongoing planned trend of shifting away from wind-exposed Personal Lines premium 81.2% 70.9% 62.8% 64.2% 55.2% 50.3% Q1 2017 Q1 2018 Commercial Lines Personal Lines Consolidated 10

RESULTS OVERVIEW: Q1 2018 EXPENSE RATIO • Continued sequential expense ratio improvement - quarter over quarter • Almost 980 basis point improvement overall since Q4 2015 • Downward trend reflects commitment to focused expense management 49.8% 44.9% 44.3% Q1 2016 Q1 2017 Q1 2018 11

FINANCIAL RESULTS: CHI CONSOLIDATED BALANCE SHEET • Book value of $6.04 as of quarter ended March 31, 2018 • $1.19 per share full valuation allowance against deferred tax assets not reflected in book value • Shareholders’ equity of $51.4 million SUMMARY BALANCE SHEET March 31, 2018 December 31, 2017 $ in thousands Cash and Invested Assets $ 161,047 $ 169,518 Reinsurance Recoverables 24,658 24,539 Goodwill and Intangible Assets 985 987 Total Assets $ 229,654 $ 239,032 Unpaid Losses and Loss Adjustment Expenses 85,491 87,896 Unearned Premiums 53,685 57,672 Senior Debt 29,043 29,027 Total Liabilities $ 178,230 $ 186,206 Total Shareholders' Equity $ 51,424 $ 52,826 12

CONIFER: FOCUSED ON BOTTOM LINE RESULTS IMPROVED BUSINESS MIX COMBINED RATIO OPPORTUNITIES PRODUCES RESULTS IMPROVEMENT FOR GROWTH Commercial Lines 10% improvement from Committed to disciplined business leading the way – Q1 2017 to Q1 2018 growth in specialty markets represented 80% of overall to generate positive business mix in 2017 Expect continued underwriting results improvement over time FOCUS: INCREASE PROFITABILITY FOR CNFR SHAREHOLDERS IN 2018 AND BEYOND 13

