Attached files
| file | filename |
|---|---|
| 8-K - 8-K - BROOKLINE BANCORP INC | a18-13501_18k.htm |
2018 Annual Meeting of Stockholders May 16, 2018 The Charles Hotel Cambridge, Massachusetts Joseph J. Slotnik Chairman of the Board
Agenda Welcoming Remarks Introductions Procedural Matters Relating to the Conduct of the Annual Meeting Presentation of the Three Proposals Before the Annual Meeting Opening of Polls and Balloting Closing of Polls Report of the Inspector of Elections Adjournment of Formal Portion of the Annual Meeting Annual Report of the Company General Question and Answer Period
Annual Report of the Company Paul Perrault President and Chief Executive Officer
Financial Performance Carl M. Carlson Chief Financial Officer
Forward-Looking Statements Certain statements in this presentation that are not historical facts may constitute forward-looking statements within the meaning of Section 27A of the Securities Act of 1933, as amended, and Section 21E of the Securities Exchange Act of 1934, as amended, and are intended to be covered by the safe harbor provisions of the Private Securities Litigation Reform Act of 1995. Forward-looking statements involve risks and uncertainties. These statements include, among others, statements regarding our strategy, evaluations of future interest rate trends and liquidity, expectations as to growth in assets, deposits and results of operations, success of acquisitions, future operations, market position, financial position, and prospects, plans and objectives of management. You should not place undue reliance on the Company’s forward-looking statements. You should exercise caution in interpreting and relying on forward-looking statements because they are subject to significant risks, uncertainties and other factors which are, in some cases, beyond the Company’s control. Forward-looking statements are based on the current assumptions and beliefs of management and are only expectations of future results. The Company’s actual results could differ materially from those projected in the forward-looking statements as a result of, among other factors, changes in interest rates; competitive pressures from other financial institutions; the effects of continued weakness in general economic conditions on a national basis or in the local markets in which the Company operates, including changes that adversely affect borrowers’ ability to service and repay our loans; changes in the value of securities in the Company’s investment portfolio, changes in loan default and charge-off rates, the adequacy of loan loss reserves, decreases in deposit levels necessitating increased borrowing to fund loans and investments; changes in government regulation, as well as the other risks and uncertainties detailed in the Company’s Annual Report on Form 10-K, as updated by the Company’s Quarterly Reports on Form 10-Q and other filings submitted to the Securities and Exchange Commission. Forward looking statements speak only as of the date on which they are made. The Company does not undertake any obligation to update any forward-looking statement to reflect circumstances or events that occur after the date the forward-looking statements are made.
Basis of Presentation GAAP The Company's consolidated financial statements have been prepared in conformity with generally accepted accounting principles (“GAAP”) as set forth by the FASB in its Accounting Standards Codification and through the rules and interpretive releases of the SEC under the authority of federal securities laws. Non-GAAP Financial Measures The Company uses certain non-GAAP financial measures, such as net earnings from operations, operating earnings per share, operating ROE, operating ROA, the allowance for loan and lease losses as a percentage of originated loans and leases, tangible stockholders’ equity, tangible book value per common share and tangible stockholders’ equity to tangible assets. These non-GAAP financial measures provide information for investors to effectively analyze financial trends of ongoing business activities, and to enhance comparability with peers across the financial services sector. A detailed reconciliation table of the Company's GAAP to the non-GAAP measures is included in the Company’s April 25, 2018 press release.
$ in millions, except per share amounts 2017 2016 $ Change % Change Total Assets $6,780 $6,438 $342 5.3% Total Loans 5,731 5,399 332 6.1% Total Deposits 4,871 4,611 260 5.6% Net Income-BRKL $50.5 $52.4 ($1.9) -3.6% Earnings Per Share $0.68 $0.74 ($0.06) -8.1% Dividends Per Share $0.36 $0.36 - - Excluding the impact of the 2017 Tax Cuts and Jobs Act (non-GAAP) Net Income-BRKL $59.5 Earnings Per Share $0.80 Selected Financial Metrics
$ in thousands 2017 2016 $ Change % Change Non performing loans $27,272 $40,077 ($12,805) -32.0% As a % of total loans 0.48% 0.74% Net charge offs $13,858 $13,275 $583 4.4% As a % of average loans 0.25% 0.25% Reserve for loan losses $58,592 $53,666 $4,926 9.2% As a % of total loans 1.02% 0.99% Pristine Asset Quality
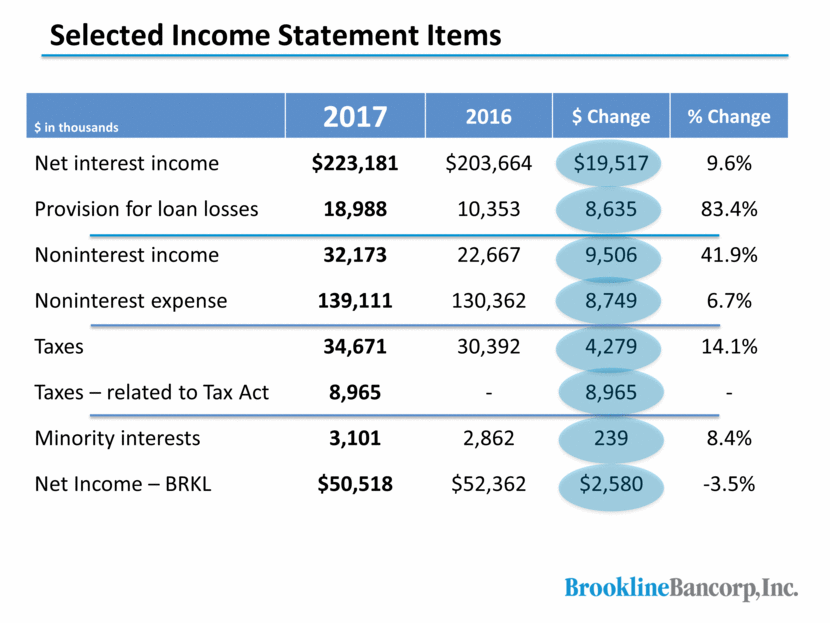
$ in thousands 2017 2016 $ Change % Change Net interest income $223,181 $203,664 $19,517 9.6% Provision for loan losses 18,988 10,353 8,635 83.4% Noninterest income 32,173 22,667 9,506 41.9% Noninterest expense 139,111 130,362 8,749 6.7% Taxes 34,671 30,392 4,279 14.1% Taxes – related to Tax Act 8,965 - 8,965 - Minority interests 3,101 2,862 239 8.4% Net Income – BRKL $50,518 $52,362 $2,580 -3.5% Selected Income Statement Items
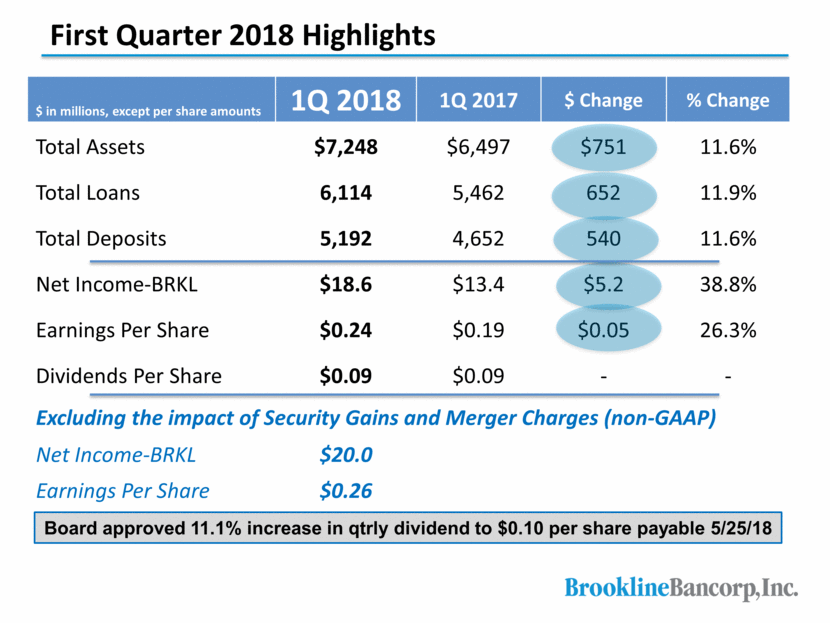
$ in millions, except per share amounts 1Q 2018 1Q 2017 $ Change % Change Total Assets $7,248 $6,497 $751 11.6% Total Loans 6,114 5,462 652 11.9% Total Deposits 5,192 4,652 540 11.6% Net Income-BRKL $18.6 $13.4 $5.2 38.8% Earnings Per Share $0.24 $0.19 $0.05 26.3% Dividends Per Share $0.09 $0.09 - - Excluding the impact of Security Gains and Merger Charges (non-GAAP) Net Income-BRKL $20.0 Earnings Per Share $0.26 First Quarter 2018 Highlights Board approved 11.1% increase in qtrly dividend to $0.10 per share payable 5/25/18
Paul Perrault President and Chief Executive Officer

Questions & Answers

