Attached files
| file | filename |
|---|---|
| 8-K - CURRENT REPORT - Western New England Bancorp, Inc. | wneb-8k_051518.htm |
Western New England Bancorp, Inc. 8-K
Exhibit 99.1

Annual Meeting of Shareholders May 15, 2018

We may, from time to time, make written or oral “forward - looking statements” within the meaning of the Private Securities Litigation Reform Act of 1995 , including statements contained in our filings with the Securities and Exchange Commission (the “SEC”), our reports to shareholders and in other communications by us . This Annual Report on Form 10 - K contains “forward - looking statements” which may be identified by the use of such words as “believe,” “expect,” “anticipate,” “should,” “planned,” “estimated,” and “potential . ” Examples of forward looking statements include, but are not limited to, estimates with respect to our financial condition, results of operations and business that are subject to various factors which could cause actual results to differ materially from these estimates . These factors include, but are not limited to : • changes in the interest rate environment that reduce margins ; • changes in the regulatory environment ; • the highly competitive industry and market area in which we operate ; • general economic conditions, either nationally or regionally, resulting in, among other things, a deterioration in credit quality ; • changes in business conditions and inflation ; • changes in credit market conditions ; • changes in the securities markets which affect investment management revenues ; • increases in Federal Deposit Insurance Corporation deposit insurance premiums and assessments could adversely affect our financial condition ; • changes in technology used in the banking business ; • the soundness of other financial services institutions which may adversely affect our credit risk ; • certain of our intangible assets may become impaired in the future ; • our controls and procedures may fail or be circumvented ; • new lines of business or new products and services, which may subject us to additional risks ; • changes in key management personnel which may adversely impact our operations ; • the effect on our operations of governmental legislation and regulation, including changes in accounting regulation or standards, the nature and timing of the adoption and effectiveness of new requirements under the Dodd - Frank Act Wall Street Reform and Consumer Protection Act of 2010 , Basel guidelines, capital requirements and other applicable laws and regulations ; • severe weather, natural disasters, acts of war or terrorism and other external events which could significantly impact our business ; and • other factors detailed from time to time in our SEC filings . Although we believe that the expectations reflected in such forward - looking statements are reasonable, actual results may differ materially from the results discussed in these forward - looking statements . You are cautioned not to place undue reliance on these forward - looking statements, which speak only as of the date hereof . We do not undertake any obligation to republish revised forward - looking statements to reflect events or circumstances after the date hereof or to reflect the occurrence of unanticipated events . Forward Looking Statements

Strategic Foundation Every day, we focus on showing Westfield Bank customers “ what better banking is all about . ” For us, the idea of better banking starts with putting customers first, while adhering to our core values . Our Core Values : • Integrity • Enhance Shareholder Value • Customer Focus • Community Focus Our Core Mission : The Company’s purpose drives the outcome we envision for WNEB . Our purpose is to help customers succeed in our community, while creating and increasing shareholder value .

Building Value for WNEB • Grow loans organically and diversify the mix • Grow deposits with a focus on low - cost core deposits • Grow non - interest income with a focus on wealth management, cash management services and municipal deposit program • Control expenses and improve efficiency • Continue to enhance products and services and alternative state of the art delivery options • Increase number of customers, and penetration within • Utilize capital management tools to enhance shareholder value
Key Notes • The financial results for 2017 reflect a full year of combined operations following the completion of the merger of Chicopee Bancorp, Inc . (“Chicopee”) into WNEB on October 21 , 2016 . The fourth quarter financial results for 2016 reflect the results of the merger with Chicopee on October 21 , 2016 . As a result, the Company’s 2017 results are not comparable to financial results for 2016 . • On January 31 , 2017 , the Company announced a stock repurchase program under which the Company may purchase up to approximately 3 . 0 million shares, or 10 % of its outstanding stock . • On June 30 , 2017 , the Company announced that Mr . Donald Williams, Director since 1983 and Chairman since 2005 , provided his intention to retire from the Board at the 2018 Annual Meeting . Christos A . Tapases was unanimously elected to become the Chairman of the Board, effective as of WNEB’s 2018 Annual Meeting . • On January 30 , 2018 , the Company announced a 33 % increase to its quarterly cash dividend from $ 0 . 03 to $ 0 . 04 per share . • On May 1 , 2018 , the Company announced it will open a full - service branch office at 1342 Liberty Street in Springfield in July 2018 . The Liberty Street office, which currently has a 24 - hour ATM, will be operated as a full - service branch featuring lobby and drive - up banking, a drive - up ATM, and banking specialists trained to assist customers with business banking, residential mortgages, and investment and insurance services (via Westfield Financial Management Services) .

Balance Sheet Transformation Securities Loans Deposits Borrowings 2013 $538 $637 $817 $297 2014 $494 $723 $834 $326 2015 $421 $814 $900 $282 2016 $300 $1,562 $1,518 $297 2017 $288 $1,626 $1,506 $309 $538 $637 $817 $297 $494 $723 $834 $326 $421 $814 $900 $282 $300 $1,562 $1,518 $297 $288 $1,626 $1,506 $309 $- $200 $400 $600 $800 $1,000 $1,200 $1,400 $1,600 $1,800 Data as of December 31 st (in millions)

Loan Growth and Diversification C&I CRE Residential & Consumer 2013 $136 $264 $237 2014 $166 $278 $279 2015 $168 $303 $343 2016 $222 $721 $619 2017 $238 $733 $655 $136 $264 $237 $166 $278 $279 $168 $303 $343 $222 $721 $619 $238 $733 $655 $- $100 $200 $300 $400 $500 $600 $700 $800 Data as of December 31 st (in millions)

Loan Growth and Diversification CRE - Owner 12.5% CRE - Non - Owner 32.5% Residential 34.3% HELOC 5.7% C&I 14.7% Consumer 0.3% $1.6 Billion in Total Loans as of 12/31/2017 At December 31, 2017, the Company’s CRE concentration as a percentage of risk - based capital was 199%, compared to regulatory guidance of 300% or less.

Asset Quality Indicators Continue to be Strong Non-performing Loans/Total Loans Non-performing Assets/ Total Assets 2013 0.41% 0.20% 2014 1.22% 0.67% 2015 0.99% 0.60% 2016 0.90% 0.69% 2017 0.78% 0.63% 0.41% 0.20% 1.22% 0.67% 0.99% 0.60% 0.90% 0.69% 0.78% 0.63% 0.00% 0.20% 0.40% 0.60% 0.80% 1.00% 1.20% 1.40% Non - performing Loans to Total Loans Non - performing Assets to Total Assets

ALLL/Total Loans ALLL/Non-performing Loans 2013 1.17% 2.88% 2014 1.10% 0.90% 2015 1.09% 1.09% 2016 0.64% 0.72% 2017 0.66% 0.85% 1.17% 2.88% 1.10% 0.90% 1.09% 1.09% 0.64% 0.72% 0.66% 0.85% 0.00% 0.50% 1.00% 1.50% 2.00% 2.50% 3.00% 3.50% Allowance for Loan Losses as a Percentage of Total Loans & Non - performing Loans The ratios above include loans acquired from Chicopee recorded at fair value with no corresponding allowance. Asset Quality Indicators Continue to be Strong

0.01% 0.16% 0.05% - 0.06% 0.04% -0.10% -0.05% 0.00% 0.05% 0.10% 0.15% 0.20% Net Charge - offs as a Percentage of Average Loans Data as of December 31 st 2016: Net recoveries were $ 653,000 for the year ended December 31, 2016. This was comprised of $1.1 million in recoveries primarily on one commercial real estate loan previously charged - off in 2010, offset by charge - offs of $486,000 . Low Net Charge - off History

Growing and Strengthening Balance Sheet 49.9% 54.8% 60.8% 75.2% 78.1% 40% 50% 60% 70% 80% 90% Loan to Asset Ratio 78.0% 86.7% 90.4% 102.9% 108.0% 70% 80% 90% 100% 110% Loan to Deposit Ratio Data as of December 31 st 42.1% 37.4% 31.4% 14.5% 13.8% 10% 20% 30% 40% 50% Securities to Asset Ratio 23.2% 24.7% 21.0% 14.3% 14.9% 10% 15% 20% 25% 30% Borrowings to Total Assets
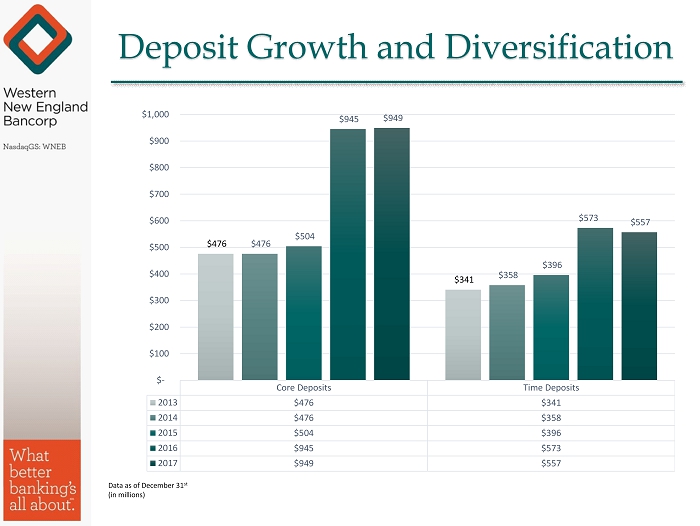
Deposit Growth and Diversification Core Deposits Time Deposits 2013 $476 $341 2014 $476 $358 2015 $504 $396 2016 $945 $573 2017 $949 $557 $476 $341 $476 $358 $504 $396 $945 $573 $949 $557 $- $100 $200 $300 $400 $500 $600 $700 $800 $900 $1,000 Data as of December 31 st (in millions)

Deposit Diversification $145 $136 $158 $304 $312 18% 16% 18% 20% 21% 0% 5% 10% 15% 20% 25% $100 $150 $200 $250 $300 $350 Demand Deposits as a Percentage of Total Deposits Demand Deposits % of total deposits Data as of December 31 st (in millions)

Funding Costs 0.84% 0.76% 0.75% 0.77% 0.70% 0.65% 0.67% 0.69% 0.71% 0.73% 0.75% 0.77% 0.79% 0.81% 0.83% 0.85% Cost of Deposits 0.93% 0.88% 0.91% 0.86% 0.81% 0.80% 0.82% 0.84% 0.86% 0.88% 0.90% 0.92% 0.94% Total Funding Costs, Includes Demand Accounts The Company has been successful in managing its cost of funds during a rising rate environment. Data as of December 31 st

Deposit Growth and Diversification Interest - bearing demand accounts 6% Demand deposits 21% Savings accounts 9% Money market accounts 27% Time deposits of $250,000 or over 9% Time deposits under $250,000 28% $1.5 Billion in Total Deposits as of 12/31/2017

Largest Community Bank in Hampden County 2017 RankInstitution (ST) # of Branches Deposits in Market ($000) Market Share (%) 1Toronto-Dominion Bank 16 1,409,215 13.42 2Bank of America Corp. (NC) 10 1,398,900 13.32 3 Western New England Bancorp (MA) 19 1,398,526 13.32 4PeoplesBancorp MHC (MA) 15 1,258,342 11.99 5Berkshire Hills Bancorp Inc. (MA) 15 1,115,264 10.62 6United Financial Bancorp (CT) 15 1,084,877 10.33 7KeyCorp (OH) 8 1,069,095 10.18 8Citizens Financial Group Inc. (RI) 15 401,168 3.82 9Country Bank for Savings (MA) 5 386,583 3.68 10Monson Financial Services MHC (MA) 3 274,560 2.62 Total For Institutions In Market 137 10,498,844 ________ Source: SNL Financial as of June 30, 2017 Note: Two Westfield branches are located in Hartford County, CT outside of Springfield MSA
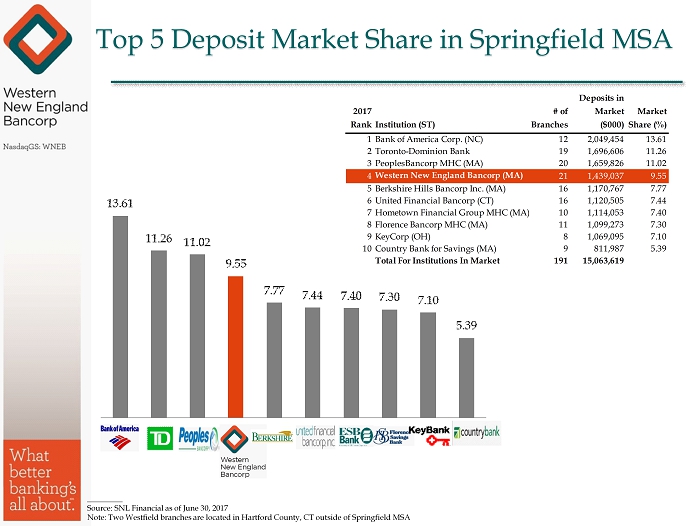
2017 RankInstitution (ST) # of Branches Deposits in Market ($000) Market Share (%) 1Bank of America Corp. (NC) 12 2,049,454 13.61 2Toronto-Dominion Bank 19 1,696,606 11.26 3PeoplesBancorp MHC (MA) 20 1,659,826 11.02 4 Western New England Bancorp (MA) 21 1,439,037 9.55 5Berkshire Hills Bancorp Inc. (MA) 16 1,170,767 7.77 6United Financial Bancorp (CT) 16 1,120,505 7.44 7Hometown Financial Group MHC (MA) 10 1,114,053 7.40 8Florence Bancorp MHC (MA) 11 1,099,273 7.30 9KeyCorp (OH) 8 1,069,095 7.10 10Country Bank for Savings (MA) 9 811,987 5.39 Total For Institutions In Market 191 15,063,619 ________ Source: SNL Financial as of June 30, 2017 Note: Two Westfield branches are located in Hartford County, CT outside of Springfield MSA Top 5 Deposit Market Share in Springfield MSA

2017 Financial Highlights ▪ The Tax Cuts and Jobs Act enacted on December 22, 2017 negatively impacted the Company’s reported net income and capital in 2017. The Company reported a $4.0 million DTA write - down, which impacted EPS by $0.13; however, the Company’s net income will positively benefit from a federal tax rate of 21% in future years . ▪ The financial results for 2017 reflect a full year of combined operations following the merger with Chicopee, whereas 2016 results reflect only a partial year; therefore, 2017 results are not comparable to 2016. ▪ Net income of $14.9 million, or $0.50 per share, excluding non - recurring charges, compared to net income of $8.1 million, or $0.41 per share, in 2016. ▪ Total loans of $ 1.63 billion, up $ 64.2 million, or 4.1% during 2017. ▪ Total deposits of $ 1.51 billion, decreased $ 12.0 million during 2017, or 0.8%, driven by a decline in time deposits. The Company is focused on replacing higher cost deposits with low - cost core deposits. ▪ Net interest margin of 3.12% compared to 2.70% for the year ended December 31, 2016. ▪ Efficiency ratio of 65.3% compared to 72.6 % in 2016 . ▪ Tangible Book Value per share was $7.57 at December 31, 2017, compared to $7.25 per share at December 31, 2016, an increase of 4.4%.

Improving Net Interest Margin 2.58% 2.60% 2.53% 2.70% 3.12% 2.00% 2.20% 2.40% 2.60% 2.80% 3.00% 3.20% Data as of December 31 st
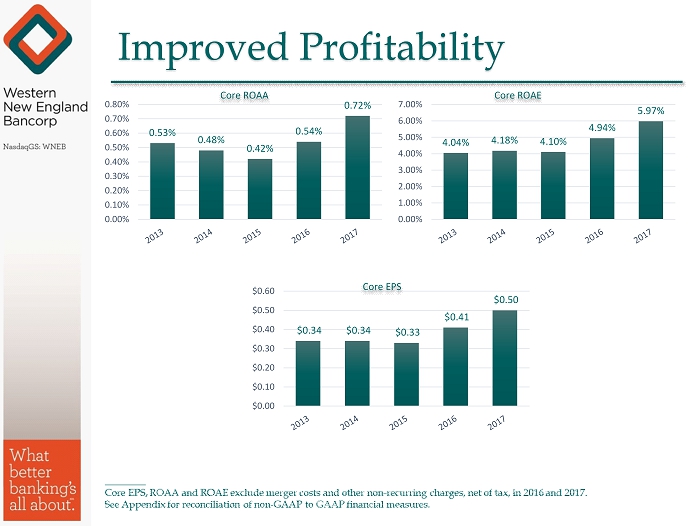
Improved Profitability 0.53% 0.48% 0.42% 0.54% 0.72% 0.00% 0.10% 0.20% 0.30% 0.40% 0.50% 0.60% 0.70% 0.80% Core ROAA 4.04% 4.18% 4.10% 4.94% 5.97% 0.00% 1.00% 2.00% 3.00% 4.00% 5.00% 6.00% 7.00% Core ROAE $0.34 $0.34 $0.33 $0.41 $0.50 $0.00 $0.10 $0.20 $0.30 $0.40 $0.50 $0.60 Core EPS
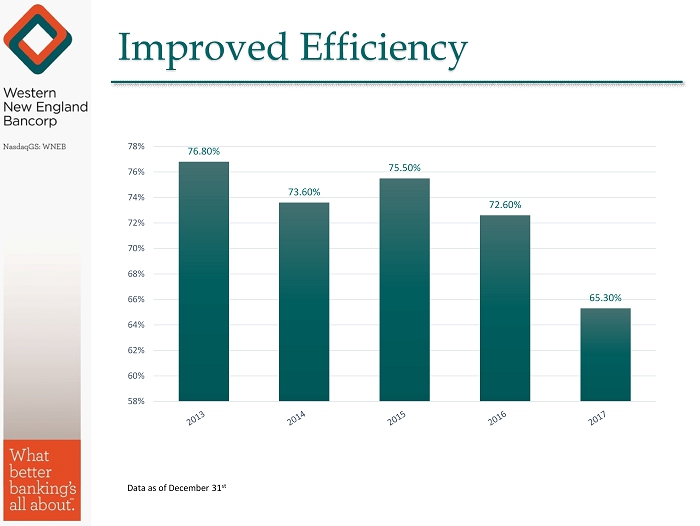
Improved Efficiency 76.80% 73.60% 75.50% 72.60% 65.30% 58% 60% 62% 64% 66% 68% 70% 72% 74% 76% 78% Data as of December 31 st
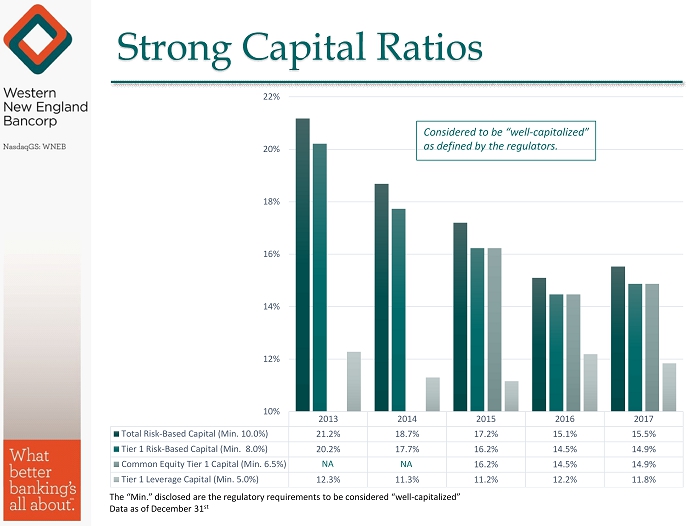
Strong Capital Ratios 2013 2014 2015 2016 2017 Total Risk-Based Capital (Min. 10.0%) 21.2% 18.7% 17.2% 15.1% 15.5% Tier 1 Risk-Based Capital (Min. 8.0%) 20.2% 17.7% 16.2% 14.5% 14.9% Common Equity Tier 1 Capital (Min. 6.5%) 16.2% 14.5% 14.9% Tier 1 Leverage Capital (Min. 5.0%) 12.3% 11.3% 11.2% 12.2% 11.8% 10% 12% 14% 16% 18% 20% 22% NA Considered to be “well - capitalized” as defined by the regulators. NA The “Min.” disclosed are the regulatory requirements to be considered “well - capitalized” Data as of December 31 st

Tangible Book Value $7.65 $7.61 $7.63 $7.25 $7.57 $7.00 $7.10 $7.20 $7.30 $7.40 $7.50 $7.60 $7.70 Data as of December 31 st

Capital Management Total Repurchased Weighted Average Price 2013 2,703,053 $7.54 2014 1,405,878 $7.27 2015 515,604 $7.58 2016 201,296 $9.11 2017 903,813 $10.14 Regular Dividend History Special Dividend History 2013 $0.24 $0.05 2014 $0.21 - 2015 $0.12 - 2016 $0.12 - 2017 $0.12 - “On January 30 , 2018 , the Company announced a 33 % increase in the common stock quarterly cash dividend from $ 0 . 03 to $ 0 . 04 per share . ” “On January 31 , 2017 , the Company announced a stock repurchase program under which the Company may purchase up to approximately 3 . 0 million shares, or 10 % of its outstanding stock . As of December 31 , 2017 , there were approximately 2 . 4 million shares remaining to be purchased . ” Data as of December 31 st

Competitive Shareholder Returns Three Year Total Return (30.00) (20.00) (10.00) 0.00 10.00 20.00 30.00 40.00 50.00 60.00 70.00 WNEB SNL U.S. Bank and Thrift S&P 500

1 st Quarter of 2018 ▪ Net income of $ 3 . 5 million, or $ 0 . 12 per share, compared to a net loss of $ 353 , 000 , or $ 0 . 01 loss per share, in the fourth quarter 2017 which includes the $ 4 . 0 million deferred tax write - down . Excluding the $ 4 . 0 million write - down, net income was $ 3 . 6 million, or $ 0 . 12 per share . ▪ Core return on average assets and core return on average equity of 0 . 69 % and 5 . 79 % , respectively, compared to 0 . 70 % and 5 . 75 % in the fourth quarter of 2017 . ▪ At March 31 , 2018 , total loans of $ 1 . 6 billion increased $ 16 . 3 million, representing a 4 % annualized increase . ▪ At March 31 , 2018 , total deposits of $ 1 . 6 billion versus $ 1 . 5 billion at December 31 , 2017 , increased $ 47 . 6 million, or 12 % on an annualized basis . Core deposits, which excludes time deposits, increased $ 35 . 1 million, or 3 . 7 % , and represented 63 . 4 % of total deposits at March 31 , 2018 , compared to 63 . 0 % at December 31 , 2017 . ▪ For the quarter ended March 31 , 2018 , the net interest margin, excluding purchase accounting adjustments, was 3 . 07 % compared to 2 . 99 % for the quarter ended December 31 , 2017 and 2 . 94 % for the three months ended March 31 , 2017 . ▪ For the quarter ended March 31 , 2018 , the efficiency ratio was 68 . 2 % , compared to 65 . 3 % for the quarter ended December 31 , 2017 and 63 . 7 % for the quarter ended March 31 , 2017 . Excluding purchase accounting adjustments, the efficiency ratio was 69 . 2 % for the quarter ended March 31 , 2018 , compared to 69 . 1 % for the quarter ended December 31 , 2017 . ▪ Tangible book value was $ 7 . 50 per share compared to $ 7 . 57 per share at December 31 , 2017 .

1 st Quarter of 2018 1Q2018 4Q2017 1Q2017 EPS $0.12 $(0.01) $0.17 “Core” EPS $0.11 $0.09 $0.11 Earnings per Share 1Q2018 4Q2017 1Q2017 ROAA 0.69% (0.07)% 1.00% “Core” ROAA 0.69% 0.70% 0.74% Return on Average Assets Return on Average Equity 1Q2018 4Q2017 1Q2017 ROAE 5.82% (0.56)% 8.51% “Core” ROAE 5.79% 5.75% 6.28% 1Q2018 4Q2017 1Q2017 Net Interest Margin 3.12% 3.19% 3.08% “Core” Net Interest Margin 3.07% 2.99% 2.94% Net Interest Margin Core net income is a non - GAAP financial measure . Management believes core net income more accurately reflects the Company’s results of operations in the overall evaluation of its performance . The following was excluded to calculate the “core” results : 1 st Quarter 2018 : Excludes $ 235 , 000 in purchase accounting adjustments due to the Chicopee merger . 4 th Quarter 2017 : Excludes $ 953 , 000 in purchase accounting adjustments due to the Chicopee merger and exclude the $ 4 . 0 million DTA write - down from the Tax Plan . 1 st Quarter 2017 : Excludes $ 661 , 000 in purchase accounting adjustments due to the Chicopee merger, tax benefits and merger costs recorded during the period .
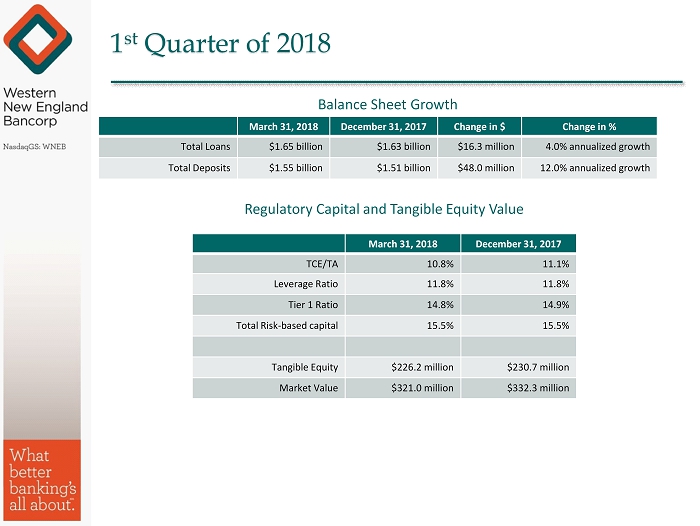
1 st Quarter of 2018 March 31, 2018 December 31, 2017 Change in $ Change in % Total Loans $1.65 billion $1.63 billion $16.3 million 4.0% annualized growth Total Deposits $1.55 billion $1.51 billion $48.0 million 12.0% annualized growth Balance Sheet Growth March 31, 2018 December 31, 2017 TCE/TA 10.8% 11.1% Leverage Ratio 11.8% 11.8% Tier 1 Ratio 14.8% 14.9% Total Risk - based capital 15.5% 15.5% Tangible Equity $226.2 million $230.7 million Market Value $321.0 million $332.3 million Regulatory Capital and Tangible Equity Value

30 Appendix

Reconciliation of Non - GAAP to GAAP Financial Measures March 31, December 31, March 31, December 31, 2018 2017 2017 2017 2016 Net Income: Net income (loss), as presented 3,519$ (353)$ 5,103$ 12,320$ 4,834$ Merger related expenses, net of tax (1) - - 293 377 3,274 Tax benefits impact (2) (15) - (1,632) (1,806) - Deferred tax asset adjustment (3) - 4,000 - 4,000 - Core net income, exclusive of merger related expenses and tax benefits 3,504$ 3,647$ 3,764$ 14,891$ 8,108$ Diluted EPS: Diluted EPS, as presented 0.12$ (0.01)$ 0.17$ 0.41$ 0.24$ Merger related expenses, net of tax (1) - - 0.01 0.02 0.17 Tax benefits impact (2) - - (0.05) (0.06) - Deferred tax asset adjustment (3) - 0.13 - 0.13 - Core diluted EPS, exclusive of merger related expense and tax benefits impact 0.12$ 0.12$ 0.13$ 0.50$ 0.41$ Return on Average Assets: Return on average assets, as presented 0.69% (0.07)% 1.00% 0.59% 0.32% Merger related expenses, net of tax (1) - - 0.06 0.02 0.22 Tax benefits impact (2) - - (0.32) (0.09) - Deferred tax asset adjustment (3) - 0.77 - 0.20 - Core return on average assets, exclusive of merger related expense impact 0.69% 0.70% 0.74% 0.72% 0.54% Return on Average Equity: Return on average equity, as presented 5.82% (0.56)% 8.51% 4.94% 2.95% Merger related expenses, net of tax (1) - - 0.49 0.15 1.99 Tax benefits impact (2) (0.03) - (2.72) (0.72) - Deferred tax asset adjustment (3) - 6.31 - 1.60 - Core return on average equity, exclusive of merger related expense impact 5.79% 5.75% 6.28% 5.97% 4.94% (2) Tax benefit impact of the reversal of a deferred tax valuation allowance and stock option exercises incurred during period presented. (3) Deferred tax asset adjustment recorded during the fourth quarter of 2017 upon change in corporate tax rate. Three Months Ended Year Ended (1) Assumed tax rate for deductible expenses of 33.4% and 34.1% at December 31 and March 31, 2017, respectively, and 34.7% for all 2016 periods.
