Attached files
| file | filename |
|---|---|
| 8-K - FORM 8-K - SMTA Liquidating Trust | d567524d8k.htm |
Exhibit 99.1
Spirit MTA REIT May 2018 Spirit MASTER TRUST
Disclaimer This presentation contains forward-looking statements within the meaning of the Private Securities Litigation Reform Act of 1995 and other federal securities laws. These forward-looking statements can be identified by the use of words such as “expect,” “plan,” “will,” “estimate,” “project,” “intend,” “believe,” “guidance,” and other similar expressions that do not relate to historical matters. These forward-looking statements are subject to known and unknown risks and uncertainties that can cause actual results to differ materially from those currently anticipated due to a number of factors, which include, but are not limited to, our continued ability to source new investments, risks associated with using debt and equity financing to fund our business activities (including refinancing and interest rate risks, changes in interest rates and/or credit spreads, changes in the price of our common shares, and conditions of the equity and debt capital markets, generally), unknown liabilities acquired in connection with acquired properties or interests in real-estate related entities, general risks affecting the real estate industry and local real estate markets (including, without limitation, the market value of our properties, the inability to enter into or renew leases at favorable rates, portfolio occupancy varying from our expectations, dependence on tenants’ financial condition and operating performance, and competition from other developers, owners and operators of real estate), the financial performance of our retail tenants and the demand for retail space, particularly with respect to challenges being experienced by general merchandise retailers, potential fluctuations in the consumer price index, risks associated with our failure to maintain our status as a REIT under the Internal Revenue Code of 1986, as amended, risks and uncertainties related to the completion, timing and impact of the proposed spin-off of certain properties leased to Shopko, the assets that collateralize Master Trust 2014 and potentially other assets, and other additional risks discussed in our most recent filings with the Securities and Exchange Commission. We expressly disclaim any responsibility to update or revise forward-looking statements, whether as a result of new information, future events or otherwise, except as required by law. This presentation shall not constitute an offer to sell or the solicitation of an offer to buy securities nor shall there be any sale of any securities in any state in which such solicitation or sale would be unlawful prior to registration or qualification of these securities under the laws of any such state. Certain information contained herein is preliminary and subject to change and may be superseded in its entirety by further updated materials. We do not make any representation as to the accuracy or completeness of the information contained herein. Certain data set forth herein has been obtained from third parties, the accuracy of which we have not independently verified. This information is not intended to provide and should not be relied upon for accounting, legal or tax advice or investment recommendations. You should consult your own counsel, tax, accountant, regulatory and other advisors as to such matters. Pg. 2
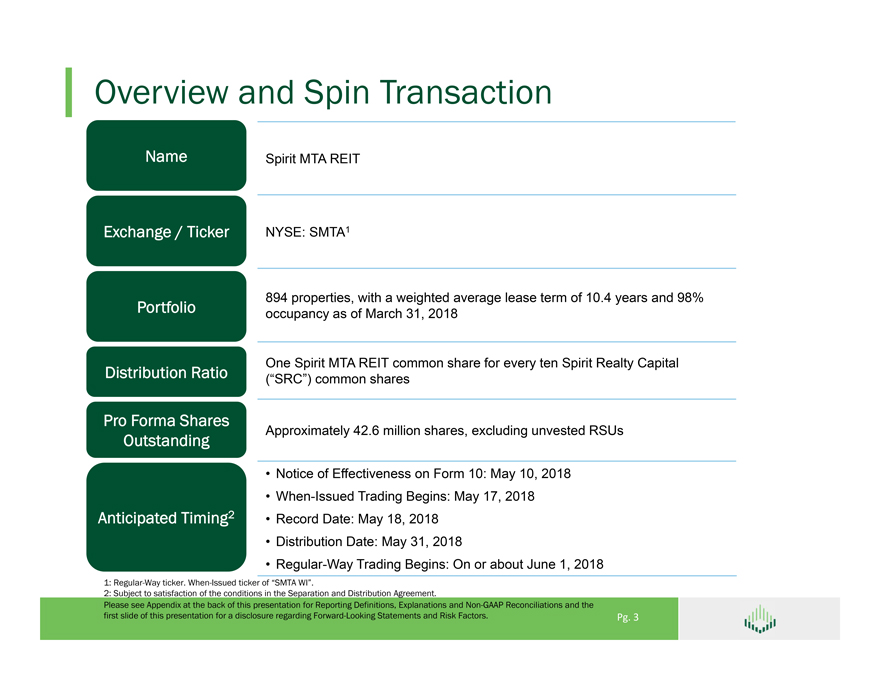
Overview and Spin Transaction Name Spirit MTA REIT Exchange / Ticker NYSE: SMTA1 894 properties, with a weighted average lease term of 10.4 years and 98% Portfolio occupancy as of March 31, 2018 One Spirit MTA REIT common share for every ten Spirit Realty Capital Distribution Ratio (“SRC”) common shares Pro Forma Shares Approximately 42.6 million shares, excluding unvested RSUs Outstanding • Notice of Effectiveness on Form 10: May 10, 2018 • When-Issued Trading Begins: May 17, 2018 Anticipated Timing2 • Record Date: May 18, 2018 • Distribution Date: May 31, 2018 • Regular-Way Trading Begins: On or about June 1, 2018 1: Regular-Way ticker. When-Issued ticker of “SMTA WI”. 2: Subject to satisfaction of the conditions in the Separation and Distribution Agreement. Please see Appendix at the back of this presentation for Reporting Definitions, Explanations and Non-GAAP Reconciliations and the first slide of this presentation for a disclosure regarding Forward-Looking Statements and Risk Factors. Pg. 3
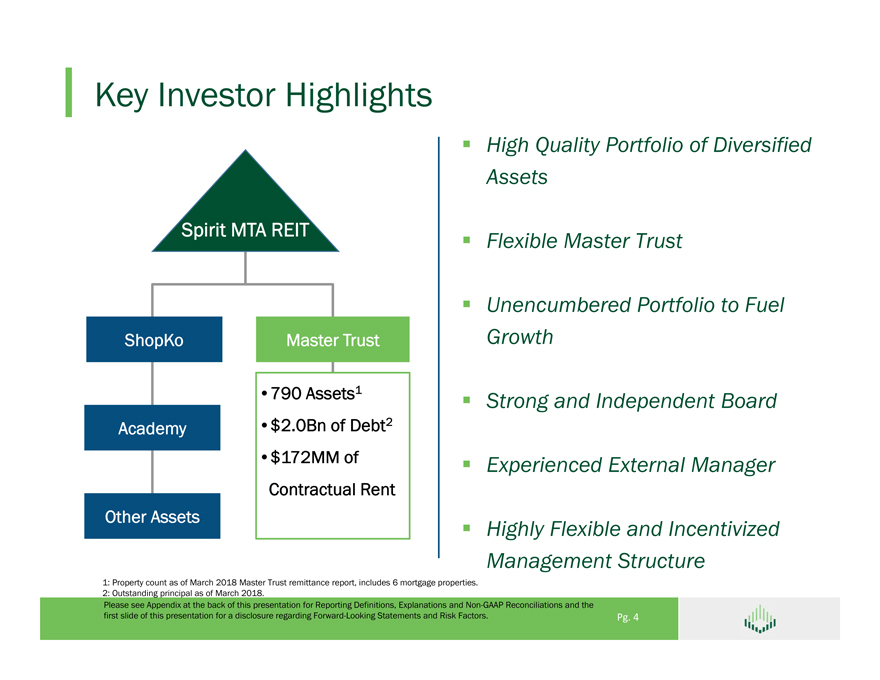
Key Investor Highlights Spirit MTA REIT ShopKo Master Trust •790 Assets1 Academy •$2.0Bn of Debt2 •$172MM of Contractual Rent Other Assets High Quality Portfolio of Diversified Assets Flexible Master Trust Unencumbered Portfolio to Fuel Growth Strong and Independent Board Experienced External Manager Highly Flexible and Incentivized Management Structure 1: Property count as of March 2018 Master Trust remittance report, includes 6 mortgage properties. 2: Outstanding principal as of March 2018. Please see Appendix at the back of this presentation for Reporting Definitions, Explanations and Non-GAAP Reconciliations and the first slide of this presentation for a disclosure regarding Forward-Looking Statements and Risk Factors. Pg. 4
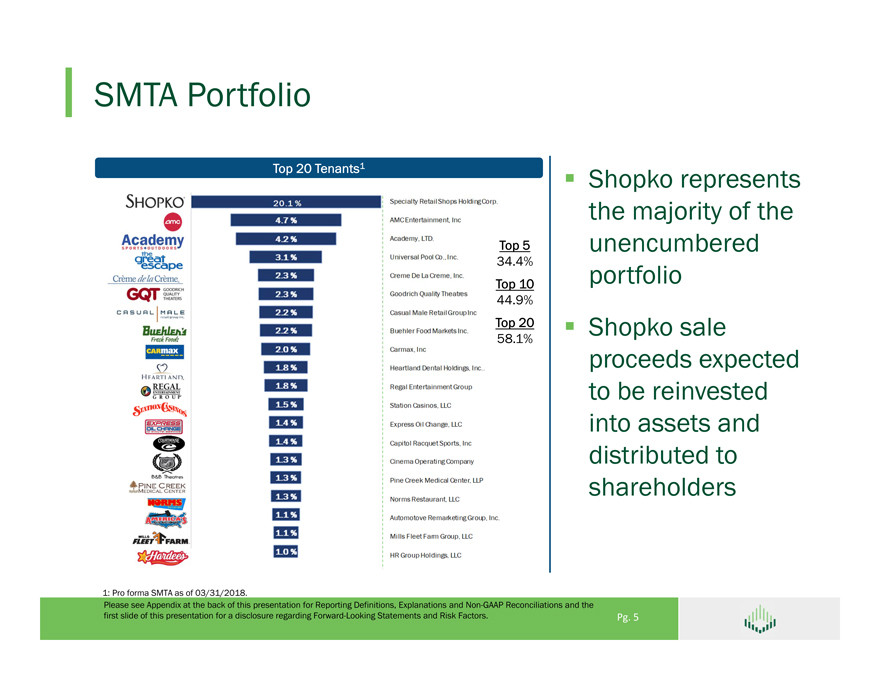
SMTA Portfolio Top 20 Tenants1 Shopko represents the majority of the Top 5 unencumbered 34.4% portfolio Top 10 44.9% Top 20 Shopko sale 58.1% proceeds expected to be reinvested into assets and distributed to shareholders 1: Pro forma SMTA as of 03/31/2018. Please see Appendix at the back of this presentation for Reporting Definitions, Explanations and Non-GAAP Reconciliations and the first slide of this presentation for a disclosure regarding Forward-Looking Statements and Risk Factors. Pg. 5
SMTA Strategy Sell Shopko and non-core assets Distribute a portion of net sale proceeds to shareholders Redeploy remaining proceeds into MTA assets for levered growth Increase MTA’s cash flows through portfolio recycling and new investments Refinance existing MTA notes to maximize FAD as refinancing windows open Please see Appendix at the back of this presentation for Reporting Definitions, Explanations and Non-GAAP Reconciliations and the first slide of this presentation for a disclosure regarding Forward-Looking Statements and Risk Factors. Pg. 6
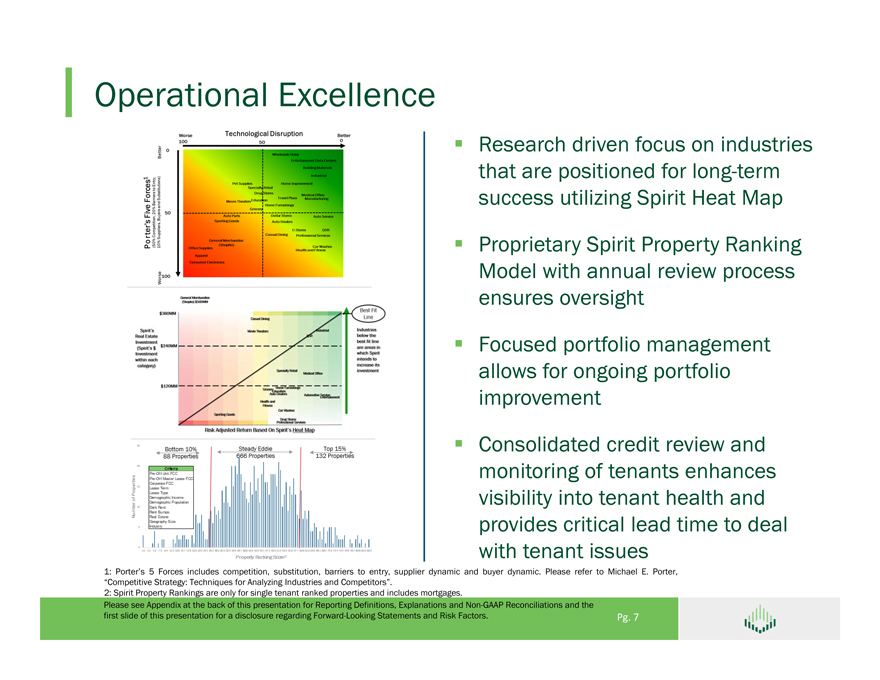
Operational Excellence Porter’s Five Forces1 Research driven focus on industries that are positioned for long-term success utilizing Spirit Heat Map Proprietary Spirit Property Ranking Model with annual review process ensures oversight Focused portfolio management allows for ongoing portfolio improvement Consolidated credit review and monitoring of tenants enhances visibility into tenant health and provides critical lead time to deal with tenant issues 1: Porter’s 5 Forces includes competition, substitution, barriers to entry, supplier dynamic and buyer dynamic. Please refer to Michael E. Porter, “Competitive Strategy: Techniques for Analyzing Industries and Competitors”. 2: Spirit Property Rankings are only for single tenant ranked properties and includes mortgages. Please see Appendix at the back of this presentation for Reporting Definitions, Explanations and Non-GAAP Reconciliations and the first slide of this presentation for a disclosure regarding Forward-Looking Statements and Risk Factors. Pg. 7
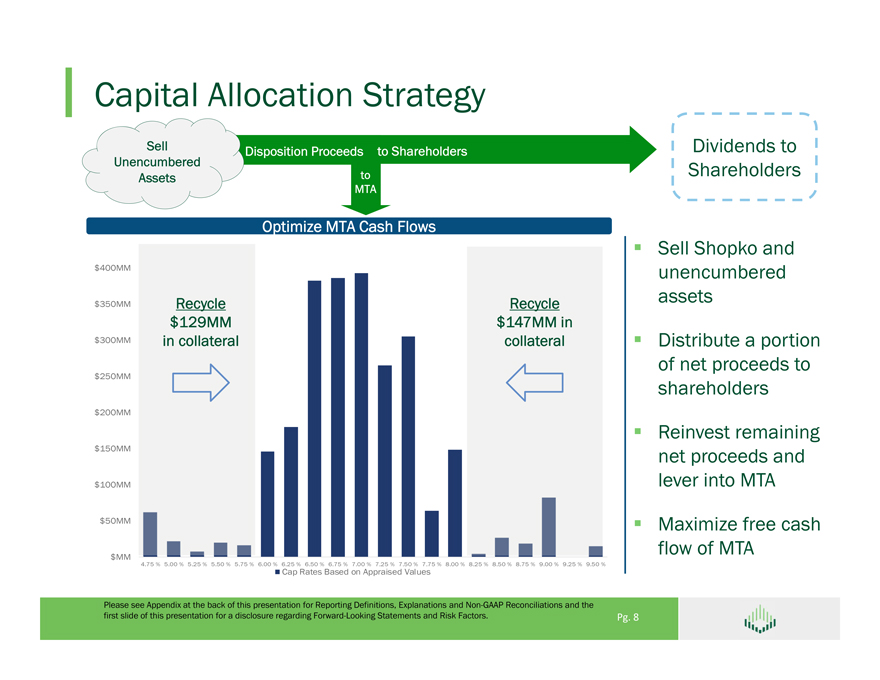
Capital Allocation Strategy Sell Disposition Proceeds to Shareholders Dividends to Unencumbered Shareholders Assets to MTA Optimize MTA Cash Flows Sell Shopko and $400MM unencumbered assets $350MM Recycle Recycle $129MM $147MM in $300MM in collateral collateral Distribute a portion of net proceeds to $250MM shareholders $200MM Reinvest remaining $150MM net proceeds and $100MM lever into MTA $50MM Maximize free cash flow of MTA $MM 4.75 % 5.00 % 5.25 % 5.50 % 5.75 % 6.00 % 6.25 % 6.50 % 6.75 % 7.00 % 7.25 % 7.50 % 7.75 % 8.00 % 8.25 % 8.50 % 8.75 % 9.00 % 9.25 % 9.50 % Cap Rates Based on Appraised Values Please see Appendix at the back of this presentation for Reporting Definitions, Explanations and Non-GAAP Reconciliations and the first slide of this presentation for a disclosure regarding Forward-Looking Statements and Risk Factors. Pg. 8
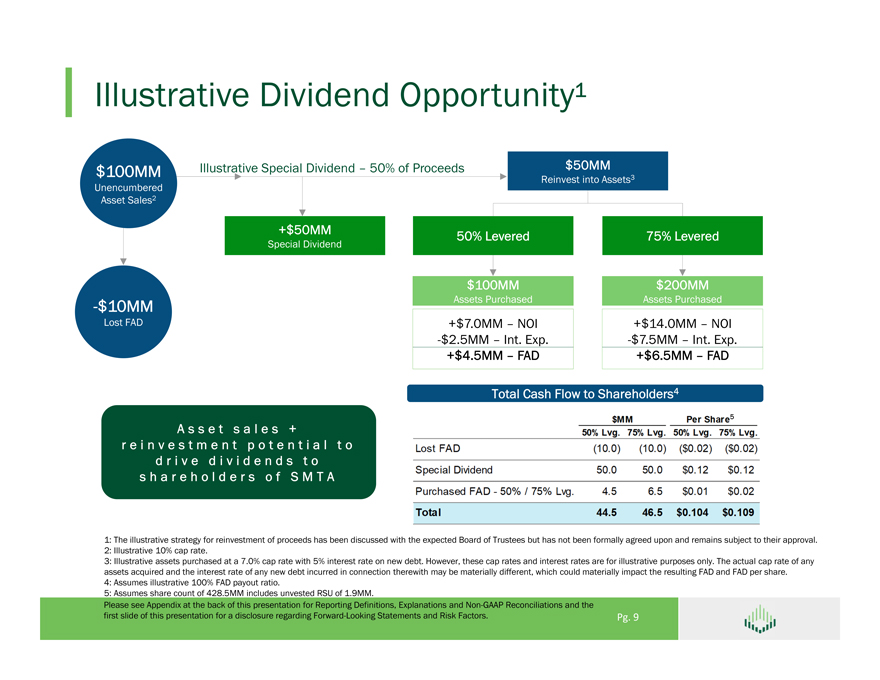
Illustrative Dividend Opportunity1 $100MM Illustrative Special Dividend – 50% of Proceeds $50MM Reinvest into Assets3 Unencumbered Asset Sales2 +$50MM 50% Levered 75% Levered Special Dividend $100MM $200MM -$10MM Assets Purchased Assets Purchased Lost FAD +$7.0MM – NOI +$14.0MM – NOI -$2.5MM – Int. Exp. -$7.5MM – Int. Exp. +$4.5MM – FAD +$6.5MM – FAD Total Cash Flow to Shareholders4 5 A s s e t s a l e s + r e i n v e s t m e n t p o t e n t i a l t o d r i v e d i v i d e n d s t o s h a r e h o l d e r s o f S M T A 1: The illustrative strategy for reinvestment of proceeds has been discussed with the expected Board of Trustees but has not been formally agreed upon and remains subject to their approval. 2: Illustrative 10% cap rate. 3: Illustrative assets purchased at a 7.0% cap rate with 5% interest rate on new debt. However, these cap rates and interest rates are for illustrative purposes only. The actual cap rate of any assets acquired and the interest rate of any new debt incurred in connection therewith may be materially different, which could materially impact the resulting FAD and FAD per share. 4: Assumes illustrative 100% FAD payout ratio. 5: Assumes share count of 428.5MM includes unvested RSU of 1.9MM. Please see Appendix at the back of this presentation for Reporting Definitions, Explanations and Non-GAAP Reconciliations and the first slide of this presentation for a disclosure regarding Forward-Looking Statements and Risk Factors. Pg. 9
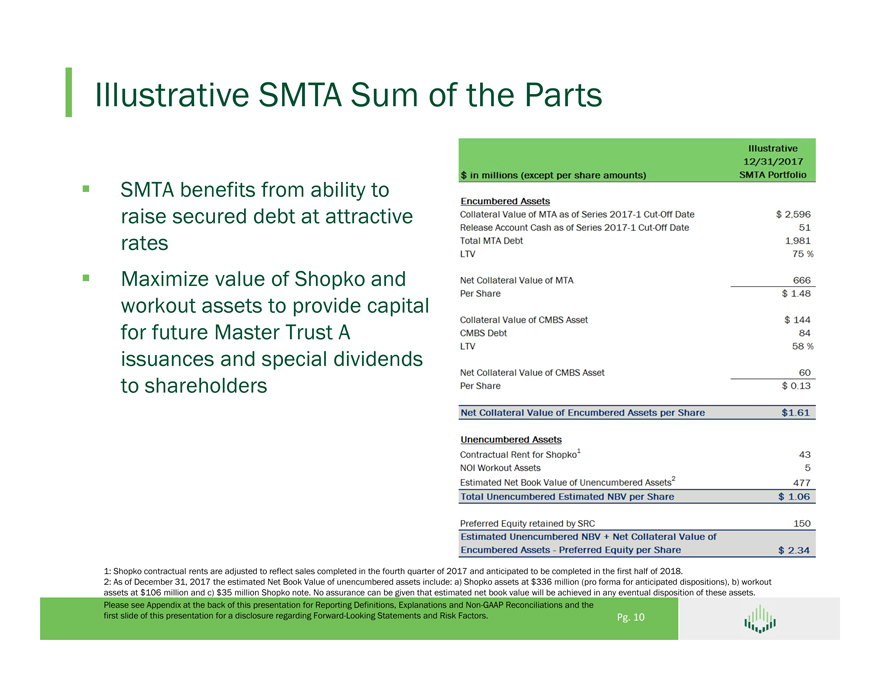
Illustrative SMTA Sum of the Parts SMTA benefits from ability to raise secured debt at attractive rates Maximize value of Shopko and workout assets to provide capital for future Master Trust A issuances and special dividends to shareholders 1: Shopko contractual rents are adjusted to reflect sales completed in the fourth quarter of 2017 and anticipated to be completed in the first half of 2018. 2: As of December 31, 2017 the estimated Net Book Value of unencumbered assets include: a) Shopko assets at $336 million (pro forma for anticipated dispositions), b) workout assets at $106 million and c) $35 million Shopko note. No assurance can be given that estimated net book value will be achieved in any eventual disposition of these assets. Please see Appendix at the back of this presentation for Reporting Definitions, Explanations and Non-GAAP Reconciliations and the first slide of this presentation for a disclosure regarding Forward-Looking Statements and Risk Factors. Pg. 10 $ in millions (except per share amounts) Illustrative 12/31/2017 SMTA Portfolio Encumbered Assets Collateral Value of MTA as of Series 2017-1 Cut-off Date $2,596 Release Account Cash as of Series 2017-1 Cut-Off Date 51 Total MTA Debt 1,981 LTV 75% Net Collateral Value of MTA 666 Per Share $1.48
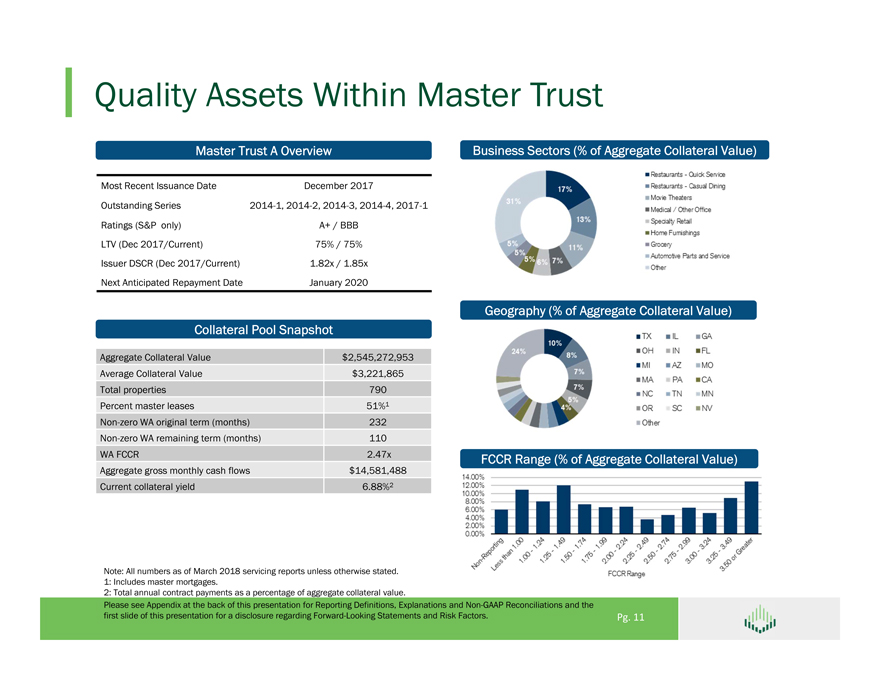
Quality Assets Within Master Trust Master Trust A Overview Business Sectors (% of Aggregate Collateral Value) Most Recent Issuance Date December 2017 Outstanding Series 2014-1, 2014-2, 2014-3, 2014-4, 2017-1 Ratings (S&P only) A+ / BBB LTV (Dec 2017/Current) 75% / 75% Issuer DSCR (Dec 2017/Current) 1.82x / 1.85x Next Anticipated Repayment Date January 2020 Geography (% of Aggregate Collateral Value) Collateral Pool Snapshot Aggregate Collateral Value $2,545,272,953 Average Collateral Value $3,221,865 Total properties 790 Percent master leases 51%1 Non-zero WA original term (months) 232 Non-zero WA remaining term (months) 110 WA FCCR 2.47x FCCR Range (% of Aggregate Collateral Value) Aggregate gross monthly cash flows $14,581,488 Current collateral yield 6.88%2 Note: All numbers as of March 2018 servicing reports unless otherwise stated. 1: Includes master mortgages. 2: Total annual contract payments as a percentage of aggregate collateral value. Please see Appendix at the back of this presentation for Reporting Definitions, Explanations and Non-GAAP Reconciliations and the first slide of this presentation for a disclosure regarding Forward-Looking Statements and Risk Factors. Pg. 11
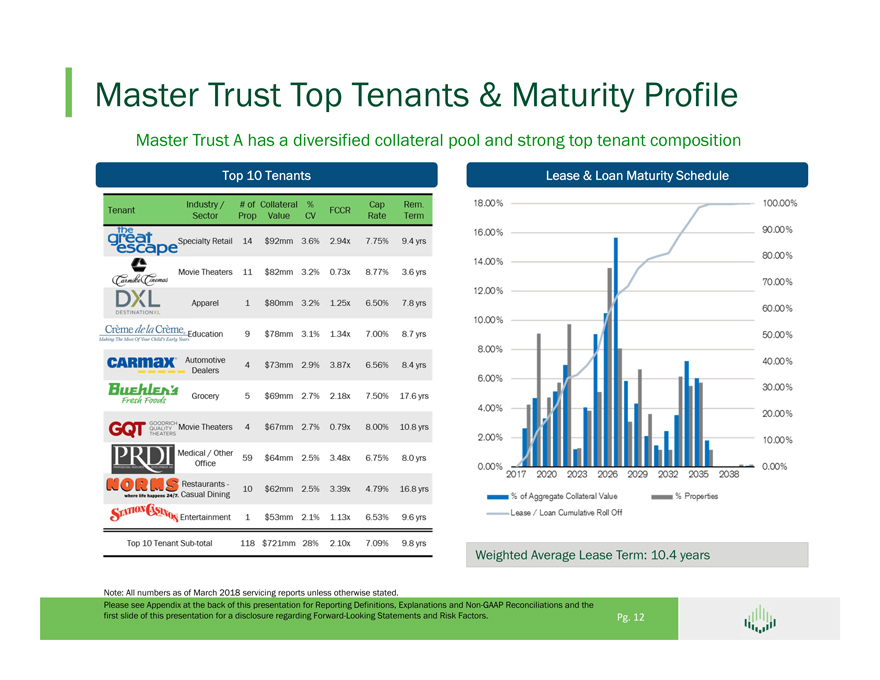
Master Trust Top Tenants & Maturity Profile Master Trust A has a diversified collateral pool and strong top tenant composition Top 10 Tenants Lease & Loan Maturity Schedule Weighted Average Lease Term: 10.4 years Note: All numbers as of March 2018 servicing reports unless otherwise stated. Please see Appendix at the back of this presentation for Reporting Definitions, Explanations and Non-GAAP Reconciliations and the first slide of this presentation for a disclosure regarding Forward-Looking Statements and Risk Factors. Pg. 12 Specialty Retail 14 $92mm 3.6% 2.94x 7.75% 9.4 yrs
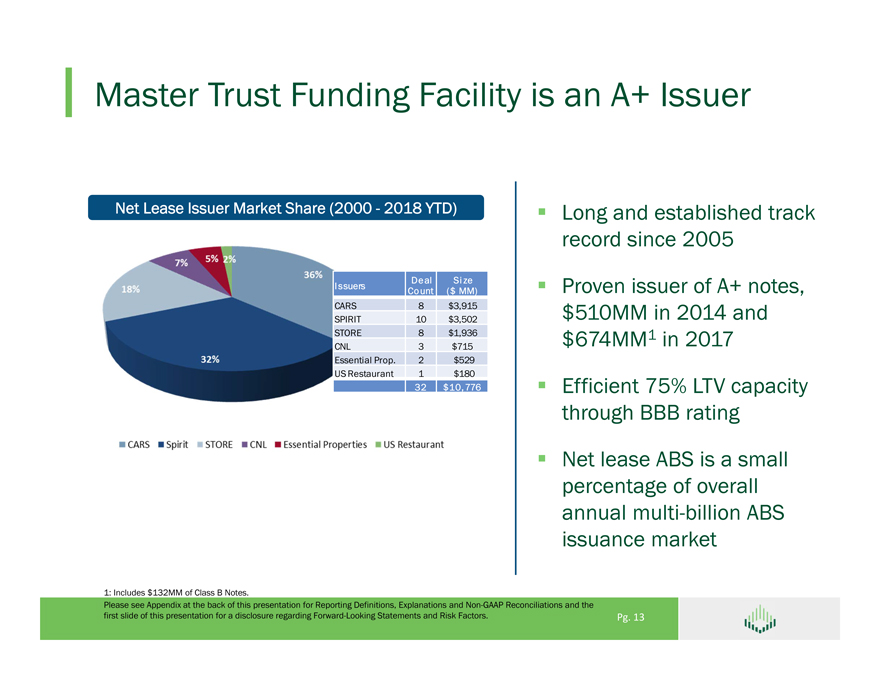
Master Trust Funding Facility is an A+ Issuer Net Lease Issuer Market Share (2000—2018 YTD) Long and established track record since 2005 Deal Si ze Issuers Proven issuer of A+ notes, Count ($ MM) CARS 8 $3,915 $510MM in 2014 and SPIRIT 10 $3,502 STORE 8 $1,936 $674MM1 in 2017 CNL 3 $715 Essential Prop. 2 $529 US Restaurant 1 $180 32 $10,776 Efficient 75% LTV capacity through BBB rating Net lease ABS is a small percentage of overall annual multi-billion ABS issuance market 1: Includes $132MM of Class B Notes. Please see Appendix at the back of this presentation for Reporting Definitions, Explanations and Non-GAAP Reconciliations and the first slide of this presentation for a disclosure regarding Forward-Looking Statements and Risk Factors. Pg. 13
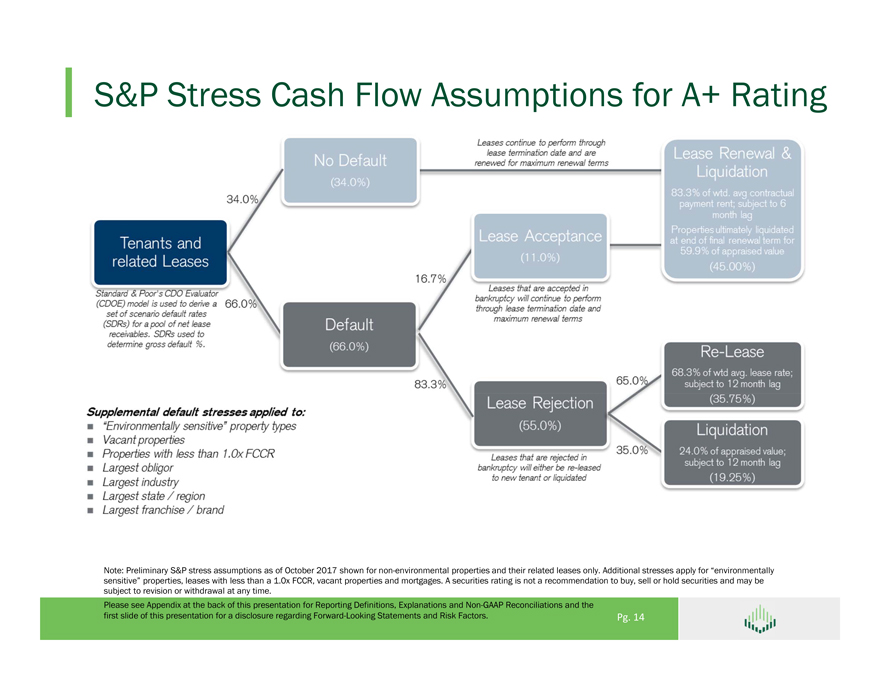
S&P Stress Cash Flow Assumptions for A+ Rating Note: Preliminary S&P stress assumptions as of October 2017 shown for non-environmental properties and their related leases only. Additional stresses apply for “environmentally sensitive” properties, leases with less than a 1.0x FCCR, vacant properties and mortgages. A securities rating is not a recommendation to buy, sell or hold securities and may be subject to revision or withdrawal at any time. Please see Appendix at the back of this presentation for Reporting Definitions, Explanations and Non-GAAP Reconciliations and the first slide of this presentation for a disclosure regarding Forward-Looking Statements and Risk Factors. Pg. 14
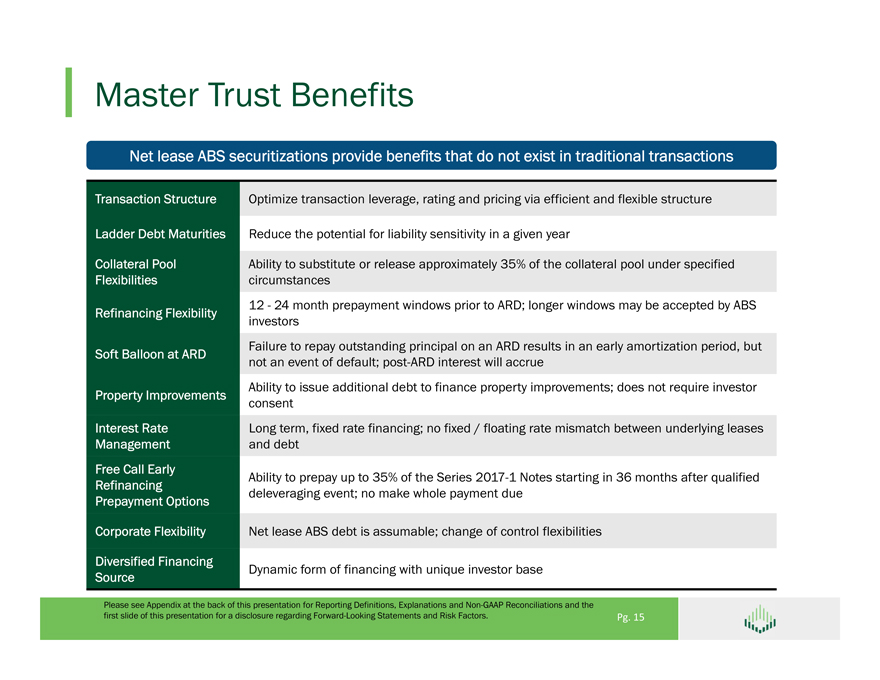
Master Trust Benefits Net lease ABS securitizations provide benefits that do not exist in traditional transactions Transaction Structure Optimize transaction leverage, rating and pricing via efficient and flexible structure Ladder Debt Maturities Reduce the potential for liability sensitivity in a given year Collateral Pool Ability to substitute or release approximately 35% of the collateral pool under specified Flexibilities circumstances 12—24 month prepayment windows prior to ARD; longer windows may be accepted by ABS Refinancing Flexibility investors Failure to repay outstanding principal on an ARD results in an early amortization period, but Soft Balloon at ARD not an event of default; post-ARD interest will accrue Ability to issue additional debt to finance property improvements; does not require investor Property Improvements consent Interest Rate Long term, fixed rate financing; no fixed / floating rate mismatch between underlying leases Management and debt Free Call Early Ability to prepay up to 35% of the Series 2017-1 Notes starting in 36 months after qualified Refinancing deleveraging event; no make whole payment due Prepayment Options Corporate Flexibility Net lease ABS debt is assumable; change of control flexibilities Diversified Financing Dynamic form of financing with unique investor base Source Please see Appendix at the back of this presentation for Reporting Definitions, Explanations and Non-GAAP Reconciliations and the first slide of this presentation for a disclosure regarding Forward-Looking Statements and Risk Factors. Pg. 15
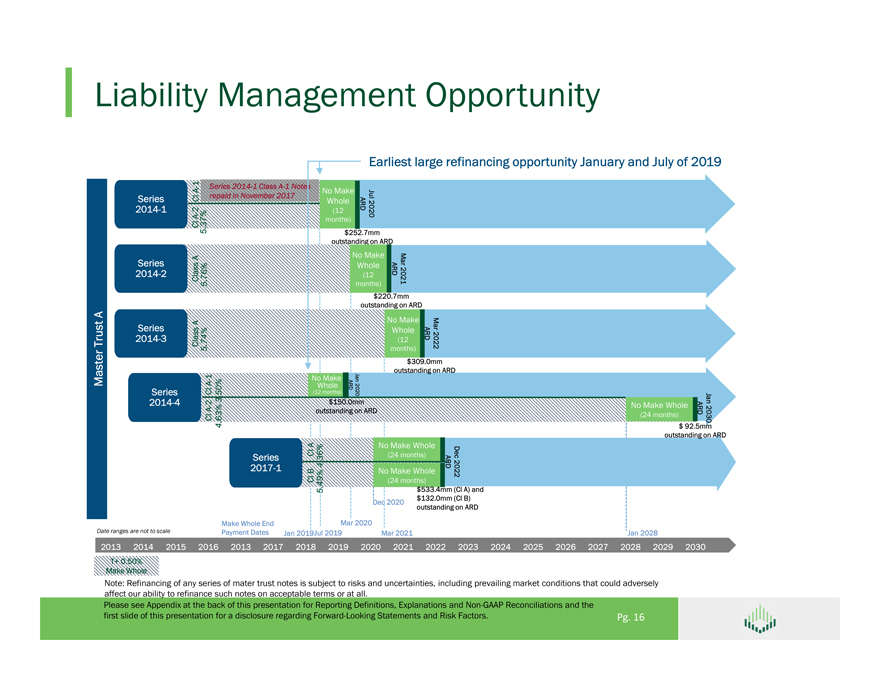
Liability Management Opportunity Earliest large refinancing opportunity January and July of 2019 —1 Series 2014-1 Class A-1 Notes A No Make repaid in November 2017Jul Series Cl Whole ARD 2014-1—2 (12 2020 A37% months) Cl. 5 $252.7mm outstanding on ARD A No Make Series Mar Whole ARD 2014-2 76% (12 Class5 . months) 2021 $220.7mm outstanding on ARD A No Make Series A Mar Whole ARD 2014-3 74% (12 Trust Class. 2022 months) 5 $309.0mm outstanding on ARD—1 No Make Jan Master A Whole ARD Series Cl 50% (12 months) 2020 3 . $150.0mm Jan 2014-4—2 No Make Whole A outstanding on ARD ARD 63% (24 months) Cl . 2030 4 $ 92.5mm outstanding on ARD A No Make Whole Cl (24 months) Dec Series 36% . 2017-1 4 ARD B No Make Whole 2022 Cl 49% (24 months) . 5 $533.4mm (Cl A) and $132.0mm (Cl B) Dec 2020 outstanding on ARD Make Whole End Mar 2020 Date ranges are not to scale Payment Dates Jan 2019Jul 2019 Mar 2021 Jan 2028 2013 2014 2015 2016 2013 2017 2018 2019 2020 2021 2022 2023 2024 2025 2026 2027 2028 2029 2030 T+ 0.50% Make Whole Note: Refinancing of any series of mater trust notes is subject to risks and uncertainties, including prevailing market conditions that could adversely affect our ability to refinance such notes on acceptable terms or at all. Please see Appendix at the back of this presentation for Reporting Definitions, Explanations and Non-GAAP Reconciliations and the first slide of this presentation for a disclosure regarding Forward-Looking Statements and Risk Factors. Pg. 16
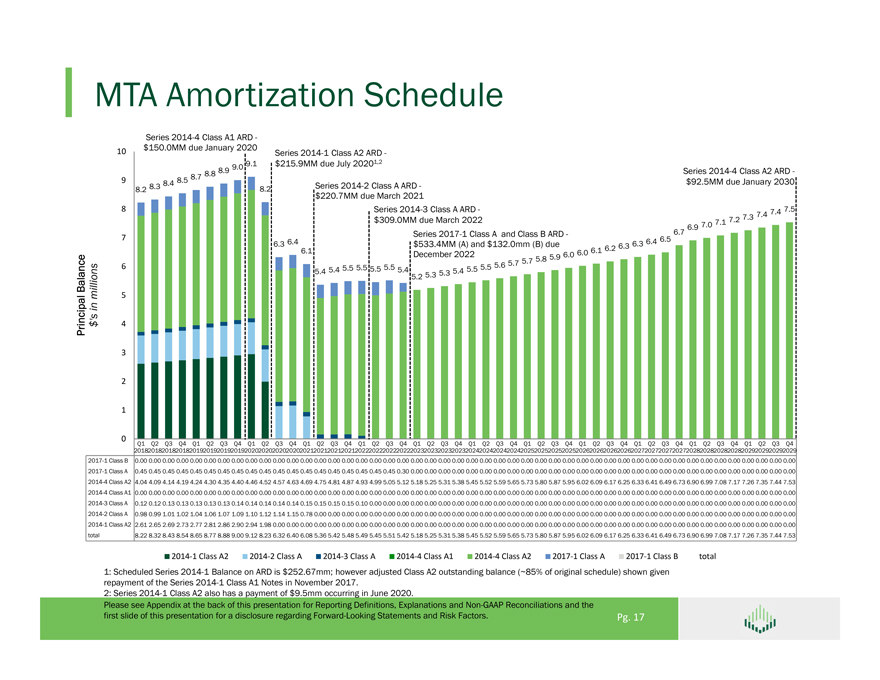
MTA Amortization Schedule Series 2014-4 Class A1 ARD -$150.0MM due January 2020 10 Series 2014-1 Class A2 ARD -9.1 $215.9MM due July 20201,2 8.8 8.9 9.0 Series 2014-4 Class A2 ARD—8.5 8.7 9 8.4 $92.5MM due January 2030 8.2 8.3 8.2 Series 2014-2 Class A ARD -$220.7MM due March 2021 8 Series 2014-3 Class A ARD—7.4 7.5 7.3 7.4 $309.0MM due March 2022 7.1 7.2 6.7 6.9 7.0 Series 2017-1 Class A and Class B ARD—7 6.4 6.5 6.3 6.4 $533.4MM (A) and $132.0mm (B) due 6.3 6.2 6.3 6.1 December 2022 6.0 6.1 5.9 6.0 5.7 5.8 5.6 5.7 6 5.4 5.5 5.5 5.5 5.5 5.4 5.5 5.5 5.4 5.3 5.4 Balance 5.2 5.3 millions 5 Principal $ 4 3 2 1 0 Q1 Q2 Q3 Q4 Q1 Q2 Q3 Q4 Q1 Q2 Q3 Q4 Q1 Q2 Q3 Q4 Q1 Q2 Q3 Q4 Q1 Q2 Q3 Q4 Q1 Q2 Q3 Q4 Q1 Q2 Q3 Q4 Q1 Q2 Q3 Q4 Q1 Q2 Q3 Q4 Q1 Q2 Q3 Q4 Q1 Q2 Q3 Q4 20182018201820182019201920192019202020202020202020212021202120212022202220222022202320232023202320242024 2024202420252025202520252026202620262026202720272027202720282028202820282029202920292029 2017-1 Class B 0.00 0.00 0.00 0.00 0.00 0.00 0.00 0.00 0.00 0.00 0.00 0.00 0.00 0.00 0.00 0.00 0.00 0.00 0.00 0.00 0.00 0.00 0.00 0.00 0.00 0.00 0.00 0.00 0.00 0.00 0.00 0.00 0.00 0.00 0.00 0.00 0.00 0.00 0.00 0.00 0.00 0.00 0.00 0.00 0.00 0.00 0.00 0.00 2017-1 Class A 0.45 0.45 0.45 0.45 0.45 0.45 0.45 0.45 0.45 0.45 0.45 0.45 0.45 0.45 0.45 0.45 0.45 0.45 0.45 0.30 0.00 0.00 0.00 0.00 0.00 0.00 0.00 0.00 0.00 0.00 0.00 0.00 0.00 0.00 0.00 0.00 0.00 0.00 0.00 0.00 0.00 0.00 0.00 0.00 0.00 0.00 0.00 0.00 2014-4 Class A2 4.04 4.09 4.14 4.19 4.24 4.30 4.35 4.40 4.46 4.52 4.57 4.63 4.69 4.75 4.81 4.87 4.93 4.99 5.05 5.12 5.18 5.25 5.31 5.38 5.45 5.52 5.59 5.65 5.73 5.80 5.87 5.95 6.02 6.09 6.17 6.25 6.33 6.41 6.49 6.73 6.90 6.99 7.08 7.17 7.26 7.35 7.44 7.53 2014-4 Class A1 0.00 0.00 0.00 0.00 0.00 0.00 0.00 0.00 0.00 0.00 0.00 0.00 0.00 0.00 0.00 0.00 0.00 0.00 0.00 0.00 0.00 0.00 0.00 0.00 0.00 0.00 0.00 0.00 0.00 0.00 0.00 0.00 0.00 0.00 0.00 0.00 0.00 0.00 0.00 0.00 0.00 0.00 0.00 0.00 0.00 0.00 0.00 0.00 2014-3 Class A 0.12 0.12 0.13 0.13 0.13 0.13 0.13 0.14 0.14 0.14 0.14 0.14 0.15 0.15 0.15 0.15 0.10 0.00 0.00 0.00 0.00 0.00 0.00 0.00 0.00 0.00 0.00 0.00 0.00 0.00 0.00 0.00 0.00 0.00 0.00 0.00 0.00 0.00 0.00 0.00 0.00 0.00 0.00 0.00 0.00 0.00 0.00 0.00 2014-2 Class A 0.98 0.99 1.01 1.02 1.04 1.06 1.07 1.09 1.10 1.12 1.14 1.15 0.78 0.00 0.00 0.00 0.00 0.00 0.00 0.00 0.00 0.00 0.00 0.00 0.00 0.00 0.00 0.00 0.00 0.00 0.00 0.00 0.00 0.00 0.00 0.00 0.00 0.00 0.00 0.00 0.00 0.00 0.00 0.00 0.00 0.00 0.00 0.00 2014-1 Class A2 2.61 2.65 2.69 2.73 2.77 2.81 2.86 2.90 2.94 1.98 0.00 0.00 0.00 0.00 0.00 0.00 0.00 0.00 0.00 0.00 0.00 0.00 0.00 0.00 0.00 0.00 0.00 0.00 0.00 0.00 0.00 0.00 0.00 0.00 0.00 0.00 0.00 0.00 0.00 0.00 0.00 0.00 0.00 0.00 0.00 0.00 0.00 0.00 total 8.22 8.32 8.43 8.54 8.65 8.77 8.88 9.00 9.12 8.23 6.32 6.40 6.08 5.36 5.42 5.48 5.49 5.45 5.51 5.42 5.18 5.25 5.31 5.38 5.45 5.52 5.59 5.65 5.73 5.80 5.87 5.95 6.02 6.09 6.17 6.25 6.33 6.41 6.49 6.73 6.90 6.99 7.08 7.17 7.26 7.35 7.44 7.53 2014 1 Class A2 2014 2 Class A 2014 3 Class A 2014 4 Class A1 2014 4 Class A2 2017 1 Class A 2017 1 Class B total 1: Scheduled Series 2014-1 Balance on ARD is $252.67mm; however adjusted Class A2 outstanding balance (~85% of original schedule) shown given repayment of the Series 2014-1 Class A1 Notes in November 2017. 2: Series 2014-1 Class A2 also has a payment of $9.5mm occurring in June 2020. Please see Appendix at the back of this presentation for Reporting Definitions, Explanations and Non-GAAP Reconciliations and the first slide of this presentation for a disclosure regarding Forward-Looking Statements and Risk Factors. Pg. 17
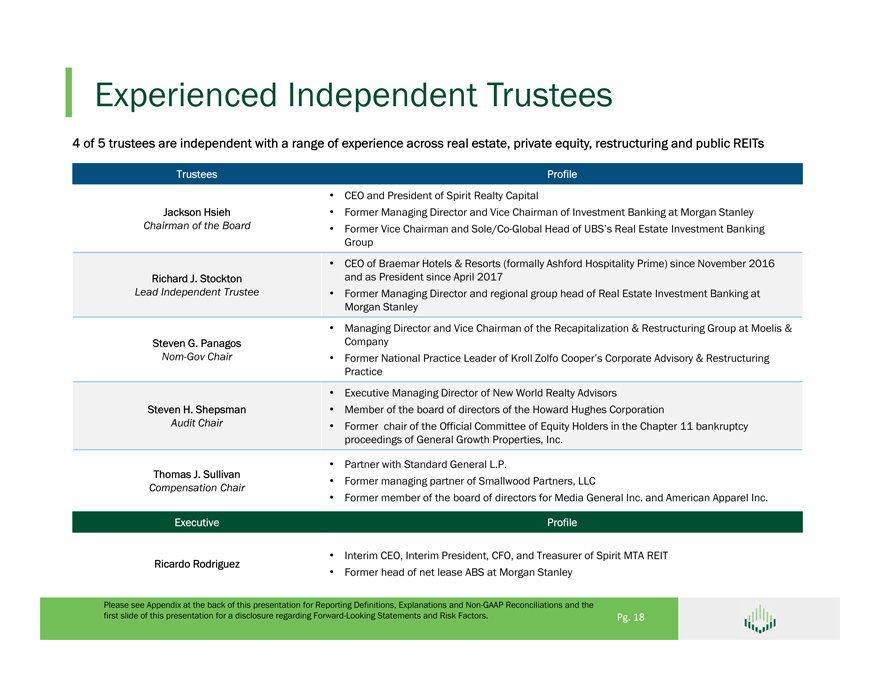
Experienced Independent Trustees 4 of 5 trustees are independent with a range of experience across real estate, private equity, restructuring and public REITs Trustees Profile • CEO and President of Spirit Realty Capital Jackson Hsieh • Former Managing Director and Vice Chairman of Investment Banking at Morgan Stanley Chairman of the Board • Former Vice Chairman and Sole/Co-Global Head of UBS’s Real Estate Investment Banking Group • CEO of Braemar Hotels & Resorts (formally Ashford Hospitality Prime) since November 2016 Richard J. Stockton and as President since April 2017 Lead Independent Trustee • Former Managing Director and regional group head of Real Estate Investment Banking at Morgan Stanley • Managing Director and Vice Chairman of the Recapitalization & Restructuring Group at Moelis & Steven G. Panagos Company Nom-Gov Chair • Former National Practice Leader of Kroll Zolfo Cooper’s Corporate Advisory & Restructuring Practice • Executive Managing Director of New World Realty Advisors Steven H. Shepsman • Member of the board of directors of the Howard Hughes Corporation Audit Chair • Former chair of the Official Committee of Equity Holders in the Chapter 11 bankruptcy proceedings of General Growth Properties, Inc. Thomas J. Sullivan • Partner with Standard General L.P. • Former managing partner of Smallwood Partners, LLC Compensation Chair Former member of • the board of directors for Media General Inc. and American Apparel Inc. Executive Profile • Interim CEO, Interim President, CFO, and Treasurer of Spirit MTA REIT Ricardo Rodriguez • Former head of net lease ABS at Morgan Stanley Please see Appendix at the back of this presentation for Reporting Definitions, Explanations and Non-GAAP Reconciliations and the first slide of this presentation for a disclosure regarding Forward-Looking Statements and Risk Factors. Pg. 18
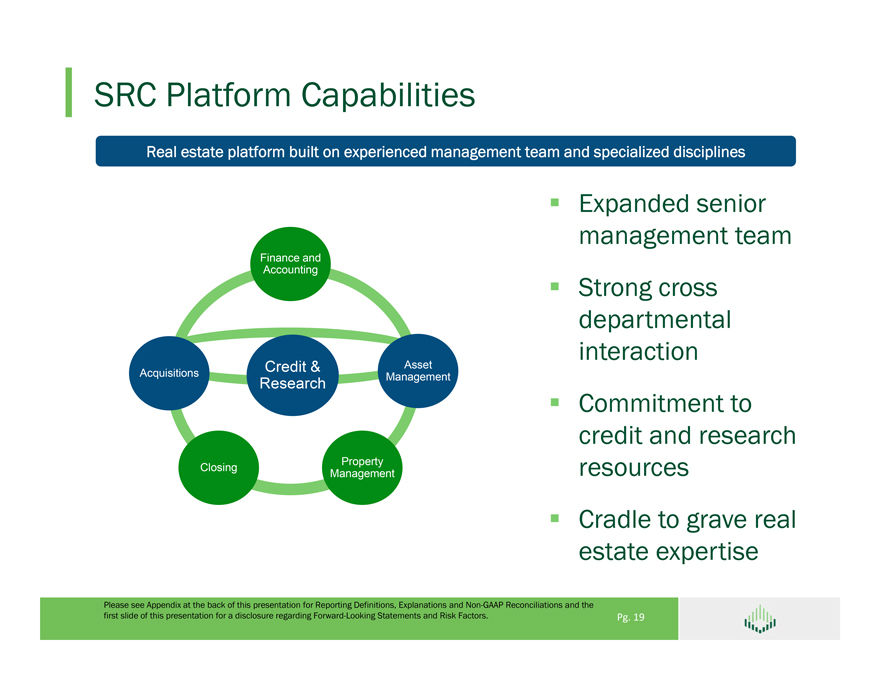
SRC Platform Capabilities Real estate platform built on experienced management team and specialized disciplines Expanded senior management team Finance and Accounting Strong cross departmental interaction Credit & Asset Acquisitions Management Research Commitment to credit and research Property Closing resources Management Cradle to grave real estate expertise Please see Appendix at the back of this presentation for Reporting Definitions, Explanations and Non-GAAP Reconciliations and the first slide of this presentation for a disclosure regarding Forward-Looking Statements and Risk Factors. Pg. 19
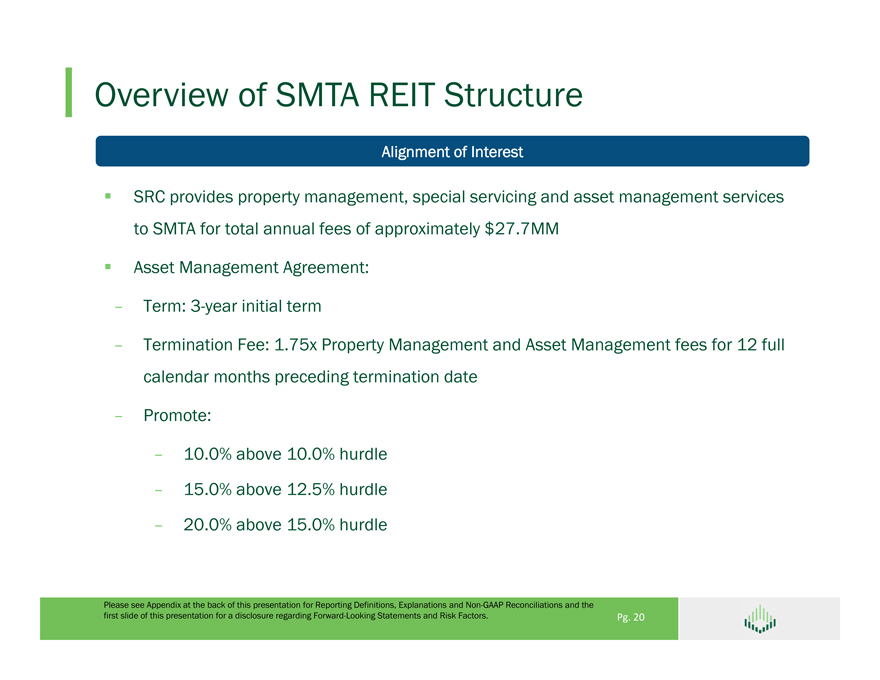
Overview of SMTA REIT Structure Alignment of Interest SRC provides property management, special servicing and asset management services to SMTA for total annual fees of approximately $27.7MM Asset Management Agreement: – Term: 3-year initial term – Termination Fee: 1.75x Property Management and Asset Management fees for 12 full calendar months preceding termination date – Promote: – 10.0% above 10.0% hurdle – 15.0% above 12.5% hurdle – 20.0% above 15.0% hurdle Please see Appendix at the back of this presentation for Reporting Definitions, Explanations and Non-GAAP Reconciliations and the first slide of this presentation for a disclosure regarding Forward-Looking Statements and Risk Factors. Pg. 20
Appendix–Reporting Definitions
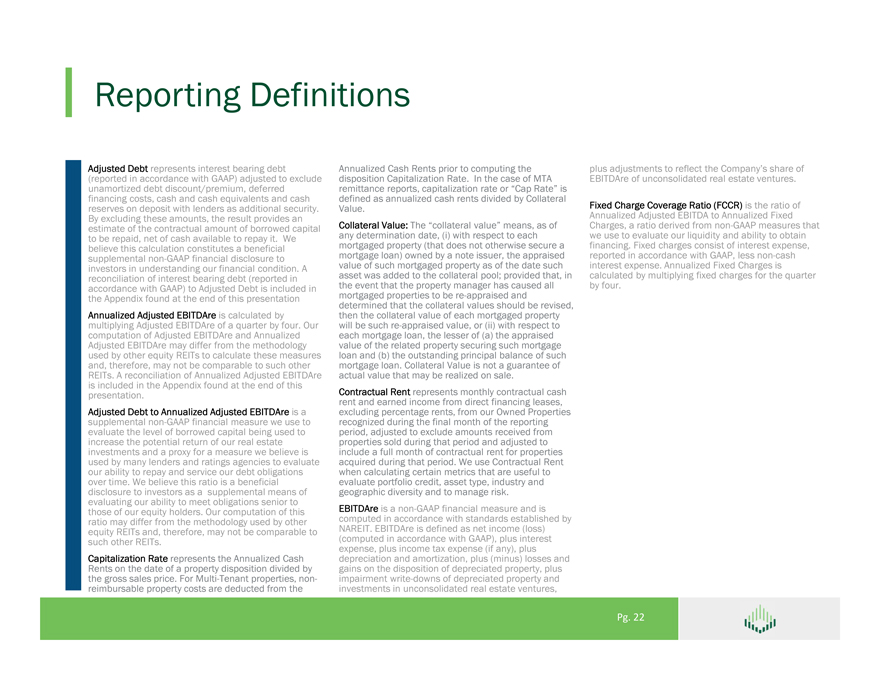
Reporting Definitions Adjusted Debt represents interest bearing debt Annualized Cash Rents prior to computing the plus adjustments to reflect the Company’s share of (reported in accordance with GAAP) adjusted to exclude disposition Capitalization Rate. In the case of MTA EBITDAre of unconsolidated real estate ventures. unamortized debt discount/premium, deferred remittance reports, capitalization rate or “Cap Rate” is financing costs, cash and cash equivalents and cash defined as annualized cash rents divided by Collateral reserves on deposit with lenders as additional security. Value. Fixed Charge Coverage Ratio (FCCR) is the ratio of By excluding these amounts, the result provides an Annualized Adjusted EBITDA to Annualized Fixed estimate of the contractual amount of borrowed capital Collateral Value: The “collateral value” means, as of Charges, a ratio derived from non-GAAP measures that to be repaid, net of cash available to repay it. We any determination date, (i) with respect to each we use to evaluate our liquidity and ability to obtain believe this calculation constitutes a beneficial mortgaged property (that does not otherwise secure a financing. Fixed charges consist of interest expense, supplemental non-GAAP financial disclosure to mortgage loan) owned by a note issuer, the appraised reported in accordance with GAAP, less non-cash investors in understanding our financial condition. A value of such mortgaged property as of the date such interest expense. Annualized Fixed Charges is reconciliation of interest bearing debt (reported in asset was added to the collateral pool; provided that, in calculated by multiplying fixed charges for the quarter accordance with GAAP) to Adjusted Debt is included in the event that the property manager has caused all by four. the Appendix found at the end of this presentation mortgaged properties to be re-appraised and determined that the collateral values should be revised, Annualized Adjusted EBITDAre is calculated by then the collateral value of each mortgaged property multiplying Adjusted EBITDAre of a quarter by four. Our will be such re-appraised value, or (ii) with respect to computation of Adjusted EBITDAre and Annualized each mortgage loan, the lesser of (a) the appraised Adjusted EBITDAre may differ from the methodology value of the related property securing such mortgage used by other equity REITs to calculate these measures loan and (b) the outstanding principal balance of such and, therefore, may not be comparable to such other mortgage loan. Collateral Value is not a guarantee of REITs. A reconciliation of Annualized Adjusted EBITDAre actual value that may be realized on sale. is included in the Appendix found at the end of this presentation. Contractual Rent represents monthly contractual cash rent and earned income from direct financing leases, Adjusted Debt to Annualized Adjusted EBITDAre is a excluding percentage rents, from our Owned Properties supplemental non-GAAP financial measure we use to recognized during the final month of the reporting evaluate the level of borrowed capital being used to period, adjusted to exclude amounts received from increase the potential return of our real estate properties sold during that period and adjusted to investments and a proxy for a measure we believe is include a full month of contractual rent for properties used by many lenders and ratings agencies to evaluate acquired during that period. We use Contractual Rent our ability to repay and service our debt obligations when calculating certain metrics that are useful to over time. We believe this ratio is a beneficial evaluate portfolio credit, asset type, industry and disclosure to investors as a supplemental means of geographic diversity and to manage risk. evaluating our ability to meet obligations senior to those of our equity holders. Our computation of this EBITDAre is a non-GAAP financial measure and is ratio may differ from the methodology used by other computed in accordance with standards established by equity REITs and, therefore, may not be comparable to NAREIT. EBITDAre is defined as net income (loss) such other REITs. (computed in accordance with GAAP), plus interest expense, plus income tax expense (if any), plus Capitalization Rate represents the Annualized Cash depreciation and amortization, plus (minus) losses and Rents on the date of a property disposition divided by gains on the disposition of depreciated property, plus the gross sales price. For Multi-Tenant properties, non- impairment write-downs of depreciated property and reimbursable property costs are deducted from the investments in unconsolidated real estate ventures, Pg. 22
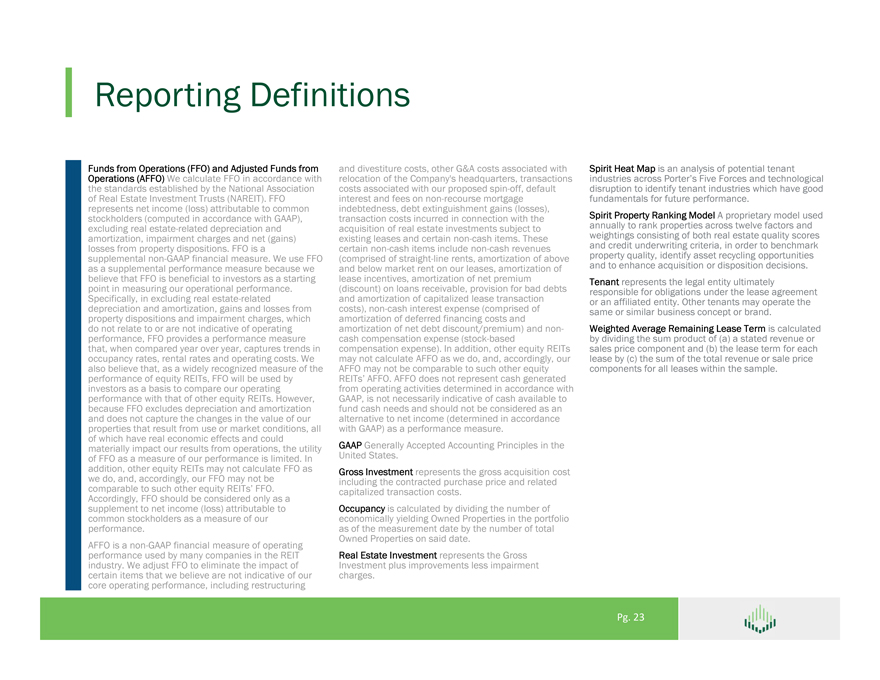
Reporting Definitions Funds from Operations (FFO) and Adjusted Funds from and divestiture costs, other G&A costs associated with Spirit Heat Map is an analysis of potential tenant Operations (AFFO) We calculate FFO in accordance with relocation of the Company’s headquarters, transactions industries across Porter’s Five Forces and technological the standards established by the National Association costs associated with our proposed spin-off, default disruption to identify tenant industries which have good of Real Estate Investment Trusts (NAREIT). FFO interest and fees on non-recourse mortgage fundamentals for future performance. represents net income (loss) attributable to common indebtedness, debt extinguishment gains (losses), stockholders (computed in accordance with GAAP), transaction costs incurred in connection with the Spirit Property Ranking Model A proprietary model used excluding real estate-related depreciation and acquisition of real estate investments subject to annually to rank properties across twelve factors and amortization, impairment charges and net (gains) existing leases and certain non-cash items. These weightings consisting of both real estate quality scores losses from property dispositions. FFO is a certain non-cash items include non-cash revenues and credit underwriting criteria, in order to benchmark supplemental non-GAAP financial measure. We use FFO (comprised of straight-line rents, amortization of above property quality, identify asset recycling opportunities as a supplemental performance measure because we and below market rent on our leases, amortization of and to enhance acquisition or disposition decisions. believe that FFO is beneficial to investors as a starting lease incentives, amortization of net premium Tenant represents the legal entity ultimately point in measuring our operational performance. (discount) on loans receivable, provision for bad debts responsible for obligations under the lease agreement Specifically, in excluding real estate-related and amortization of capitalized lease transaction or an affiliated entity. Other tenants may operate the depreciation and amortization, gains and losses from costs), non-cash interest expense (comprised of same or similar business concept or brand. property dispositions and impairment charges, which amortization of deferred financing costs and do not relate to or are not indicative of operating amortization of net debt discount/premium) and non- Weighted Average Remaining Lease Term is calculated performance, FFO provides a performance measure cash compensation expense (stock-based by dividing the sum product of (a) a stated revenue or that, when compared year over year, captures trends in compensation expense). In addition, other equity REITs sales price component and (b) the lease term for each occupancy rates, rental rates and operating costs. We may not calculate AFFO as we do, and, accordingly, our lease by (c) the sum of the total revenue or sale price also believe that, as a widely recognized measure of the AFFO may not be comparable to such other equity components for all leases within the sample. performance of equity REITs, FFO will be used by REITs’ AFFO. AFFO does not represent cash generated investors as a basis to compare our operating from operating activities determined in accordance with performance with that of other equity REITs. However, GAAP, is not necessarily indicative of cash available to because FFO excludes depreciation and amortization fund cash needs and should not be considered as an and does not capture the changes in the value of our alternative to net income (determined in accordance properties that result from use or market conditions, all with GAAP) as a performance measure. of which have real economic effects and could materially impact our results from operations, the utility GAAP Generally Accepted Accounting Principles in the of FFO as a measure of our performance is limited. In United States. addition, other equity REITs may not calculate FFO as Gross Investment represents the gross acquisition cost we do, and, accordingly, our FFO may not be including the contracted purchase price and related comparable to such other equity REITs’ FFO. capitalized transaction costs. Accordingly, FFO should be considered only as a supplement to net income (loss) attributable to Occupancy is calculated by dividing the number of common stockholders as a measure of our economically yielding Owned Properties in the portfolio performance. as of the measurement date by the number of total Owned Properties on said date. AFFO is a non-GAAP financial measure of operating performance used by many companies in the REIT Real Estate Investment represents the Gross industry. We adjust FFO to eliminate the impact of Investment plus improvements less impairment certain items that we believe are not indicative of our charges. core operating performance, including restructuring Pg. 23