Attached files
| file | filename |
|---|---|
| 8-K - 8-K - SAUL CENTERS, INC. | bfs-033120188kxannualmeeti.htm |
Exhibit 99.(a) We have prepared a brief slide show to review the company’s recent significant capital markets transactions, on‐going and future development activity, and to highlight our core portfolio operating performance and the resulting returns delivered to shareholders over our 25 years as a public REIT. 1

2

We completed 2 significant capital transactions in January 2018. We replaced our $275 million line of credit with a $400 million facility, comprised of a $75 million term loan and a $325 million revolving line of credit. Under the new facility, the maturities of the revolving facility and the term loan are January 2022 and January 2023, respectively. Our earliest redemption date of our $180 million 6‐7/8% Series C Preferred stock was February 2018. Even with the headwinds of rising interest rates in January, we completed a $75 million 6‐ 1/8% Series D Preferred issuance. While this transaction negatively impacted earnings and FFO available to stockholders by $2.6 million in the first quarter, looking forward we will save $560,000 annually in preferred dividends. 3
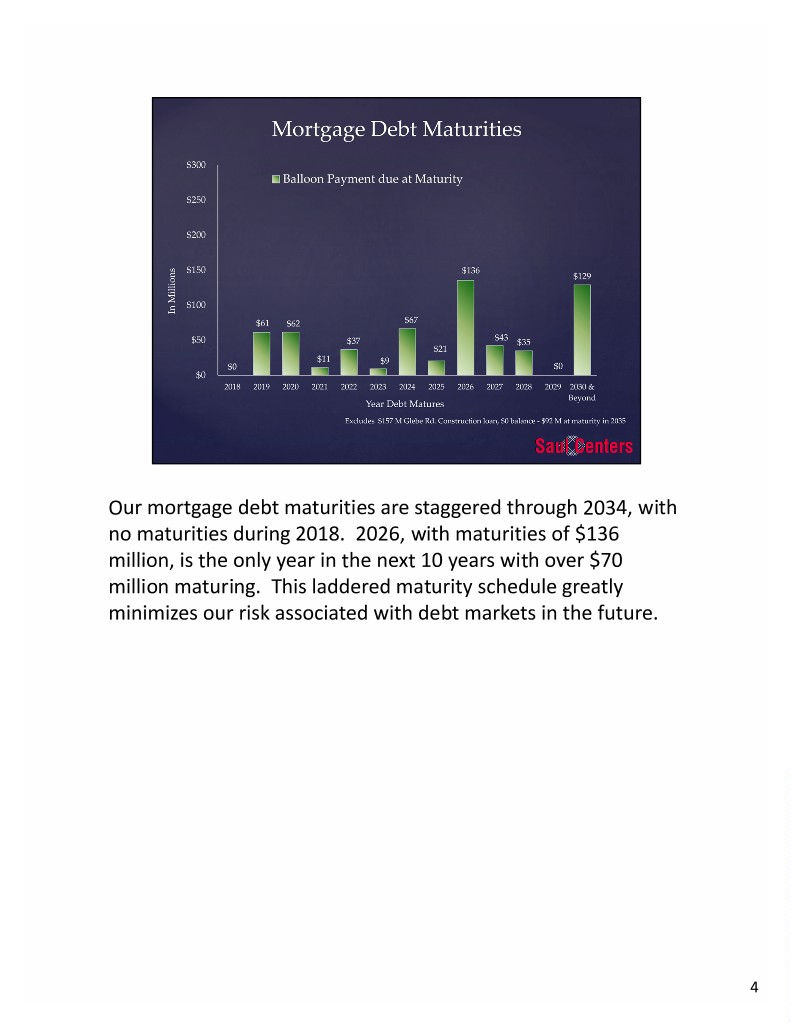
Our mortgage debt maturities are staggered through 2034, with no maturities during 2018. 2026, with maturities of $136 million, is the only year in the next 10 years with over $70 million maturing. This laddered maturity schedule greatly minimizes our risk associated with debt markets in the future. 4
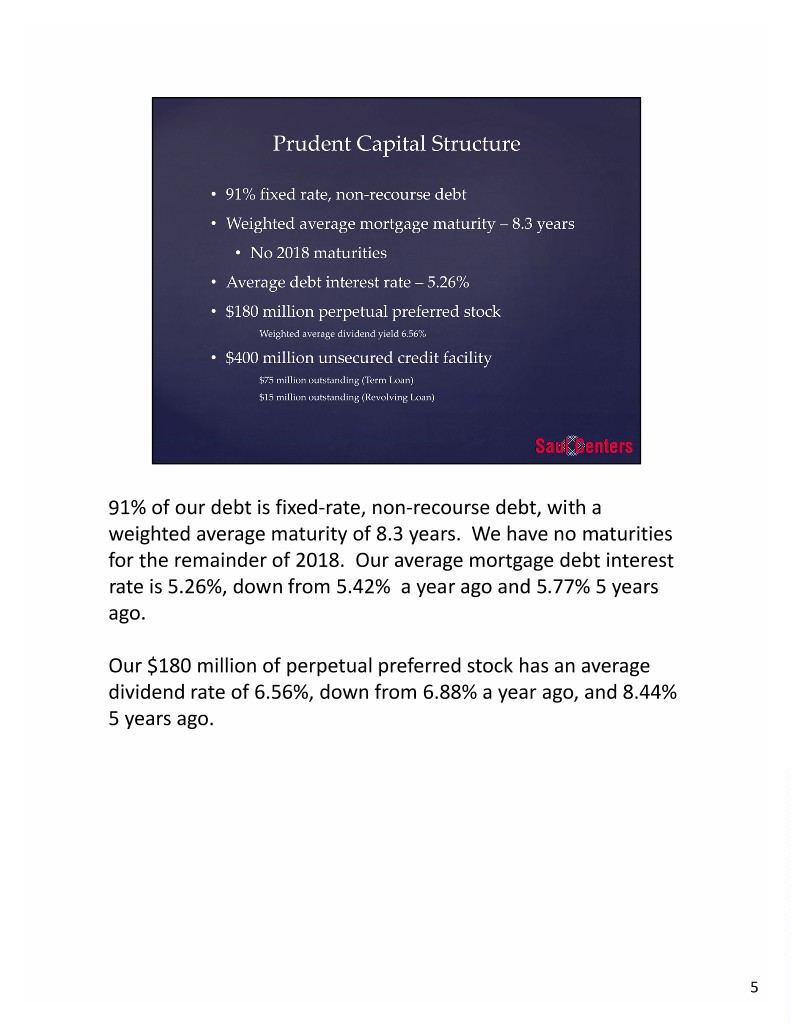
91% of our debt is fixed‐rate, non‐recourse debt, with a weighted average maturity of 8.3 years. We have no maturities for the remainder of 2018. Our average mortgage debt interest rate is 5.26%, down from 5.42% a year ago and 5.77% 5 years ago. Our $180 million of perpetual preferred stock has an average dividend rate of 6.56%, down from 6.88% a year ago, and 8.44% 5 years ago. 5
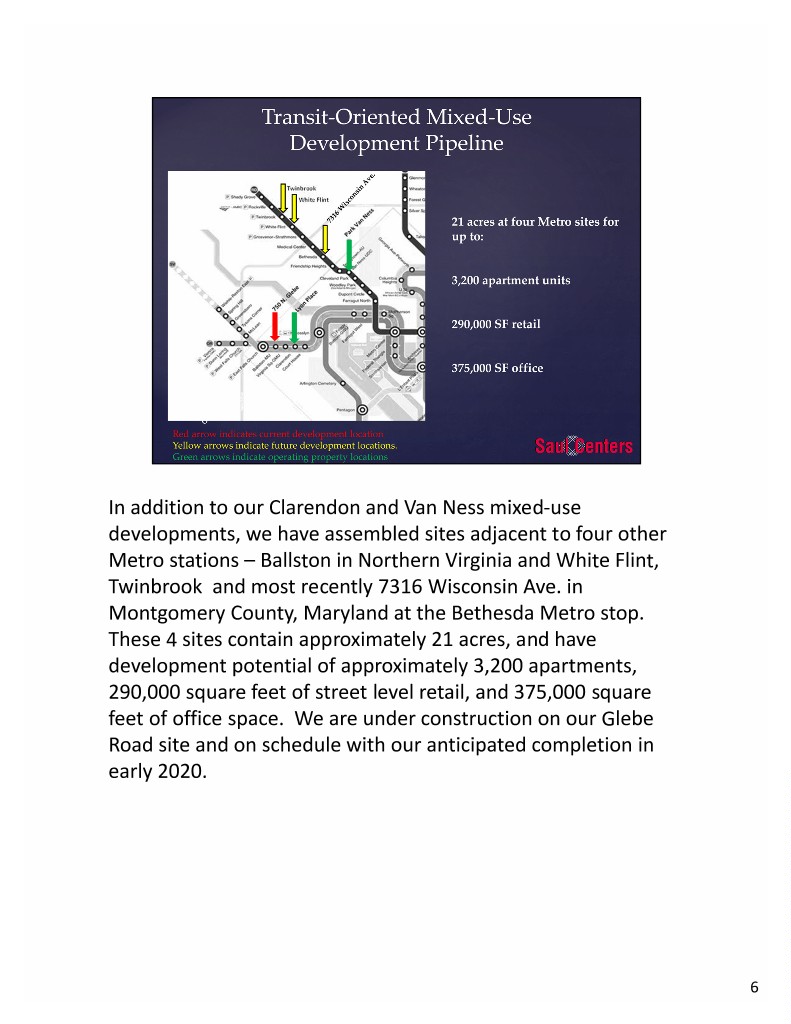
In addition to our Clarendon and Van Ness mixed‐use developments, we have assembled sites adjacent to four other Metro stations – Ballston in Northern Virginia and White Flint, Twinbrook and most recently 7316 Wisconsin Ave. in Montgomery County, Maryland at the Bethesda Metro stop. These 4 sites contain approximately 21 acres, and have development potential of approximately 3,200 apartments, 290,000 square feet of street level retail, and 375,000 square feet of office space. We are under construction on our Glebe Road site and on schedule with our anticipated completion in early 2020. 6

Our 271 luxury apartments at Park Van Ness on Connecticut Avenue reached stabilized leasing of 91% in June 2017. Since then, the leasing percentage has averaged a very solid 96%. 7
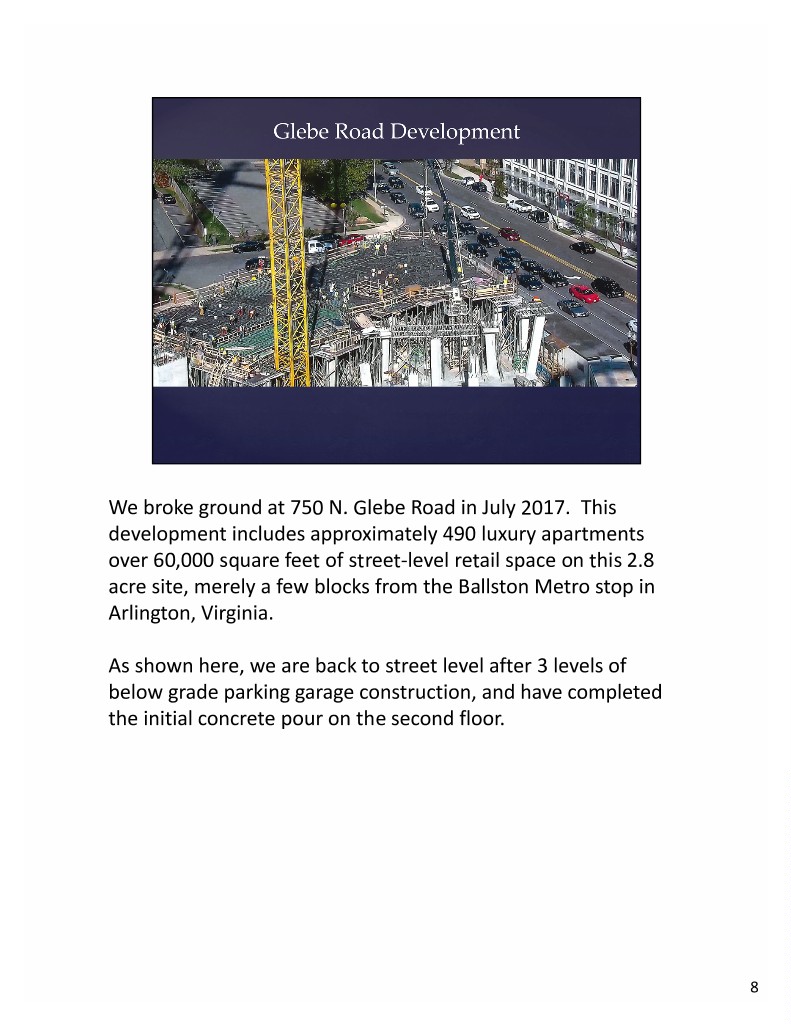
We broke ground at 750 N. Glebe Road in July 2017. This development includes approximately 490 luxury apartments over 60,000 square feet of street‐level retail space on this 2.8 acre site, merely a few blocks from the Ballston Metro stop in Arlington, Virginia. As shown here, we are back to street level after 3 levels of below grade parking garage construction, and have completed the initial concrete pour on the second floor. 8
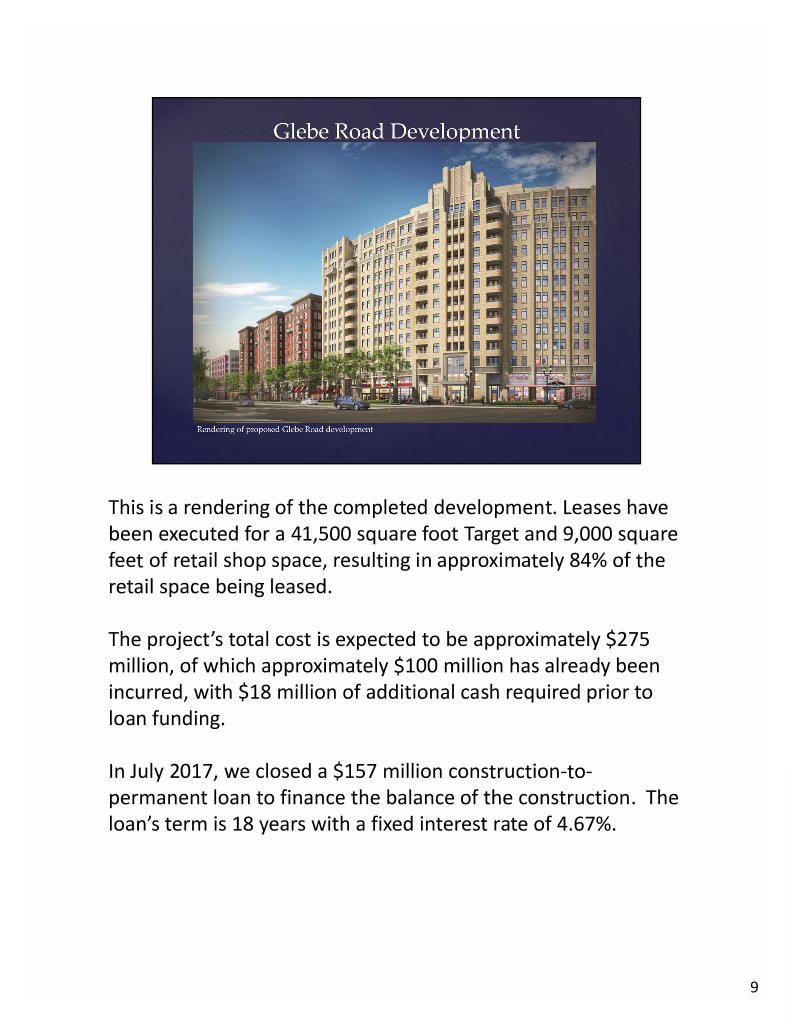
This is a rendering of the completed development. Leases have been executed for a 41,500 square foot Target and 9,000 square feet of retail shop space, resulting in approximately 84% of the retail space being leased. The project’s total cost is expected to be approximately $275 million, of which approximately $100 million has already been incurred, with $18 million of additional cash required prior to loan funding. In July 2017, we closed a $157 million construction‐to‐ permanent loan to finance the balance of the construction. The loan’s term is 18 years with a fixed interest rate of 4.67%. 9
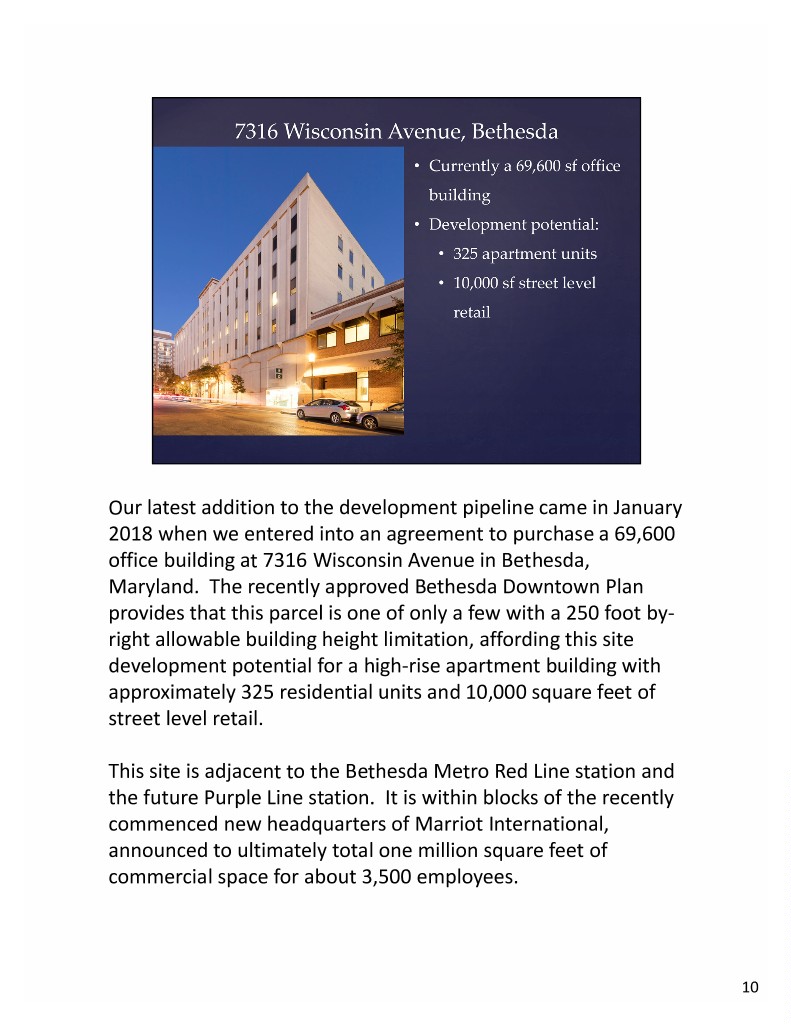
Our latest addition to the development pipeline came in January 2018 when we entered into an agreement to purchase a 69,600 office building at 7316 Wisconsin Avenue in Bethesda, Maryland. The recently approved Bethesda Downtown Plan provides that this parcel is one of only a few with a 250 foot by‐ right allowable building height limitation, affording this site development potential for a high‐rise apartment building with approximately 325 residential units and 10,000 square feet of street level retail. This site is adjacent to the Bethesda Metro Red Line station and the future Purple Line station. It is within blocks of the recently commenced new headquarters of Marriot International, announced to ultimately total one million square feet of commercial space for about 3,500 employees. 10
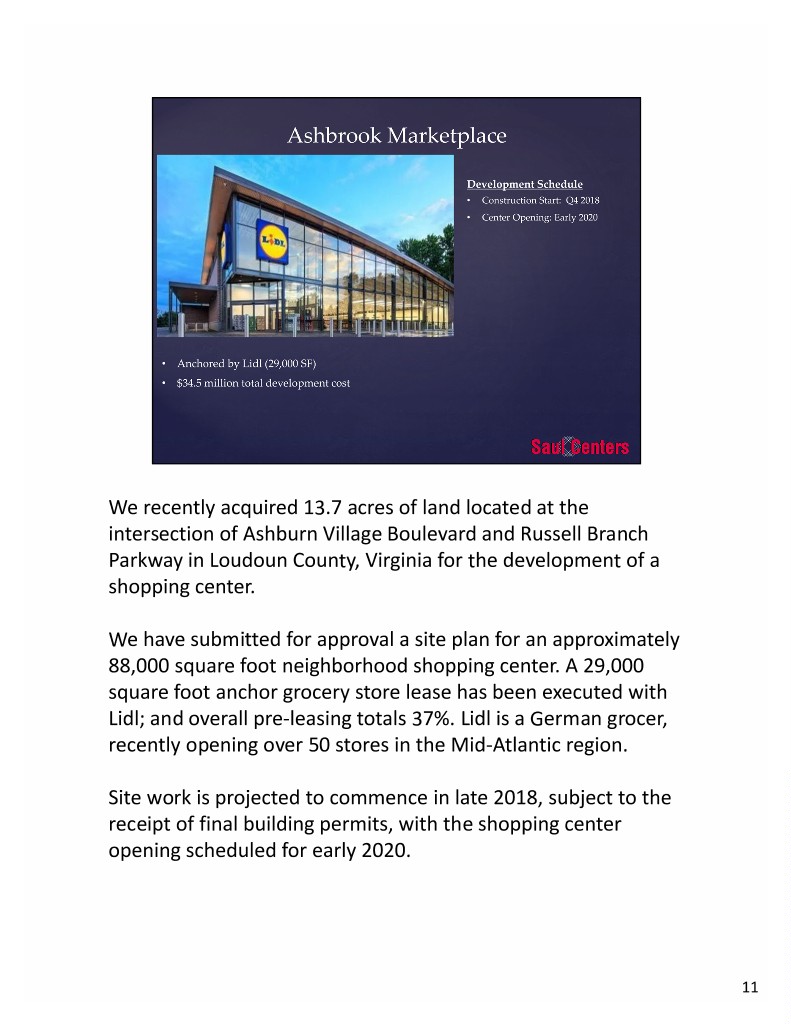
We recently acquired 13.7 acres of land located at the intersection of Ashburn Village Boulevard and Russell Branch Parkway in Loudoun County, Virginia for the development of a shopping center. We have submitted for approval a site plan for an approximately 88,000 square foot neighborhood shopping center. A 29,000 square foot anchor grocery store lease has been executed with Lidl; and overall pre‐leasing totals 37%. Lidl is a German grocer, recently opening over 50 stores in the Mid‐Atlantic region. Site work is projected to commence in late 2018, subject to the receipt of final building permits, with the shopping center opening scheduled for early 2020. 11
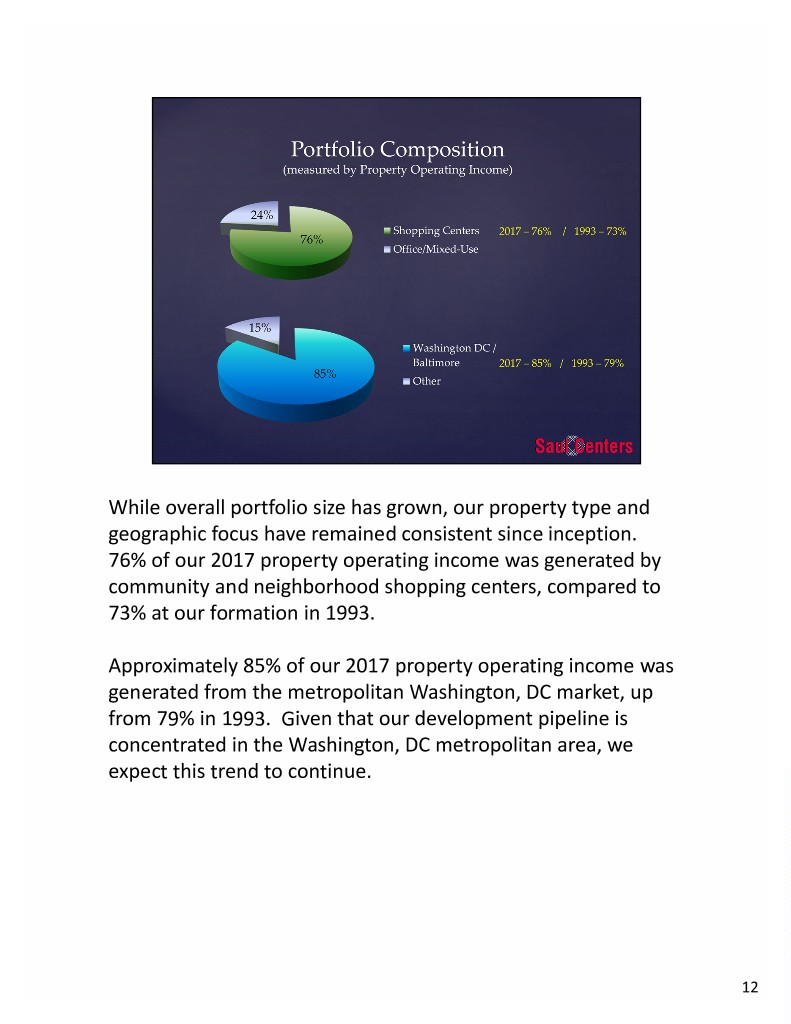
While overall portfolio size has grown, our property type and geographic focus have remained consistent since inception. 76% of our 2017 property operating income was generated by community and neighborhood shopping centers, compared to 73% at our formation in 1993. Approximately 85% of our 2017 property operating income was generated from the metropolitan Washington, DC market, up from 79% in 1993. Given that our development pipeline is concentrated in the Washington, DC metropolitan area, we expect this trend to continue. 12

Beginning in 1993, we were a company of 29 properties containing 5.3 million square feet of retail and office space. As a result of core property redevelopment, supplemented with acquisitions and new developments, we now have 55 operating properties with approximately 9.2 million square feet. Property operating income of $43 million in 1994 has increased to over $171 million in 2017, a 5.9% compounded annual growth rate over our 24 year history. 13
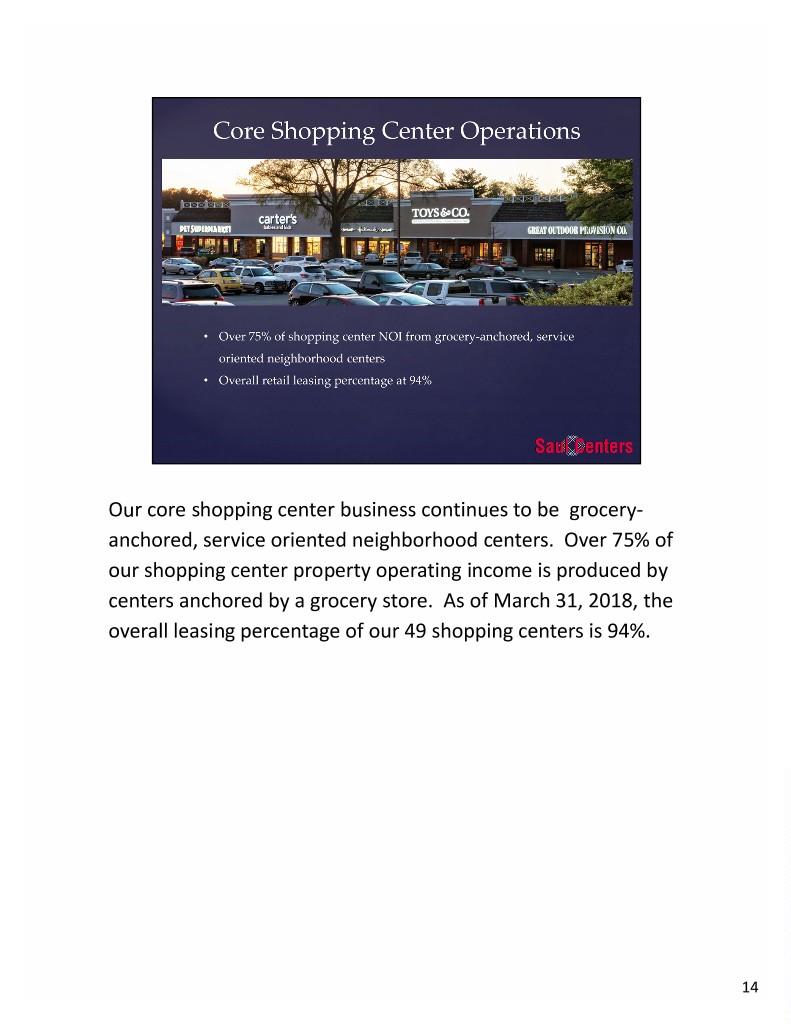
Our core shopping center business continues to be grocery‐ anchored, service oriented neighborhood centers. Over 75% of our shopping center property operating income is produced by centers anchored by a grocery store. As of March 31, 2018, the overall leasing percentage of our 49 shopping centers is 94%. 14

Our retail leasing percentage averaged over 95% for 2017 and 94.2% for the most recent quarter of 2018. Successful leasing of small shop space has been a large contributor to our overall retail leasing percentage improvement since 2011. 15

We define small shops as in‐line spaces of less than 10,000 square feet. Small shop leasing has averaged 91% over the last 5 years. Rental income of small shops is an important contributor to cash flow growth. While small shops comprised only 31% of our retail square footage, they contributed 49% of our retail annual base rent in 2017. 16
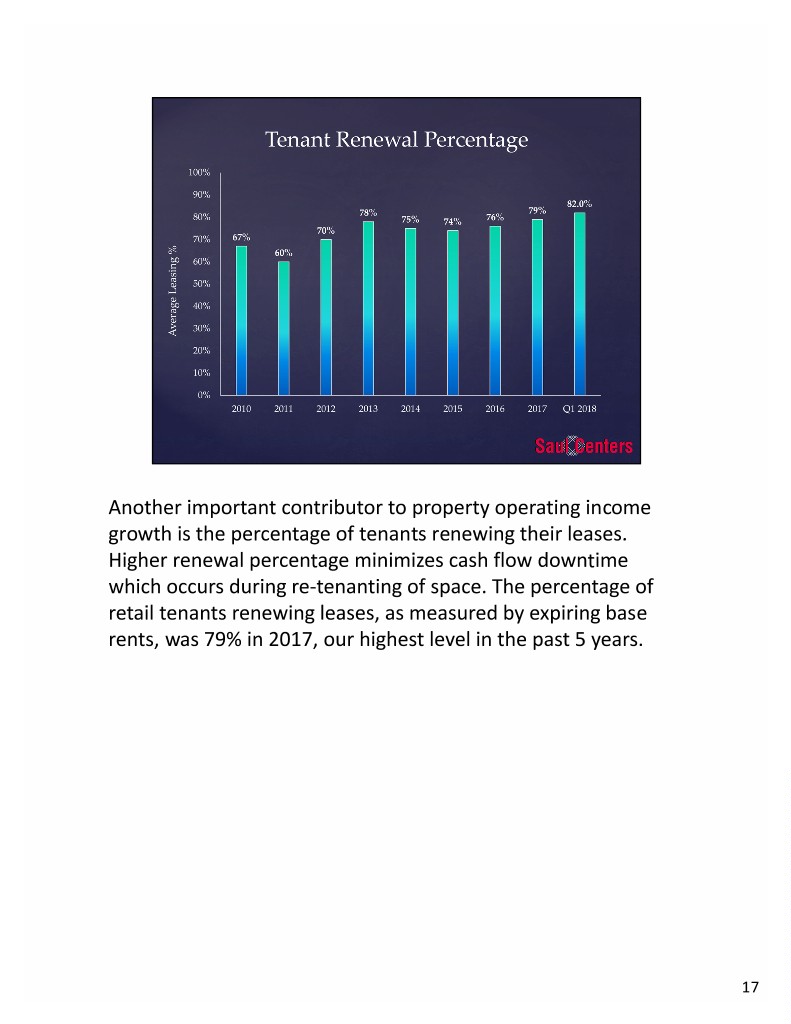
Another important contributor to property operating income growth is the percentage of tenants renewing their leases. Higher renewal percentage minimizes cash flow downtime which occurs during re‐tenanting of space. The percentage of retail tenants renewing leases, as measured by expiring base rents, was 79% in 2017, our highest level in the past 5 years. 17
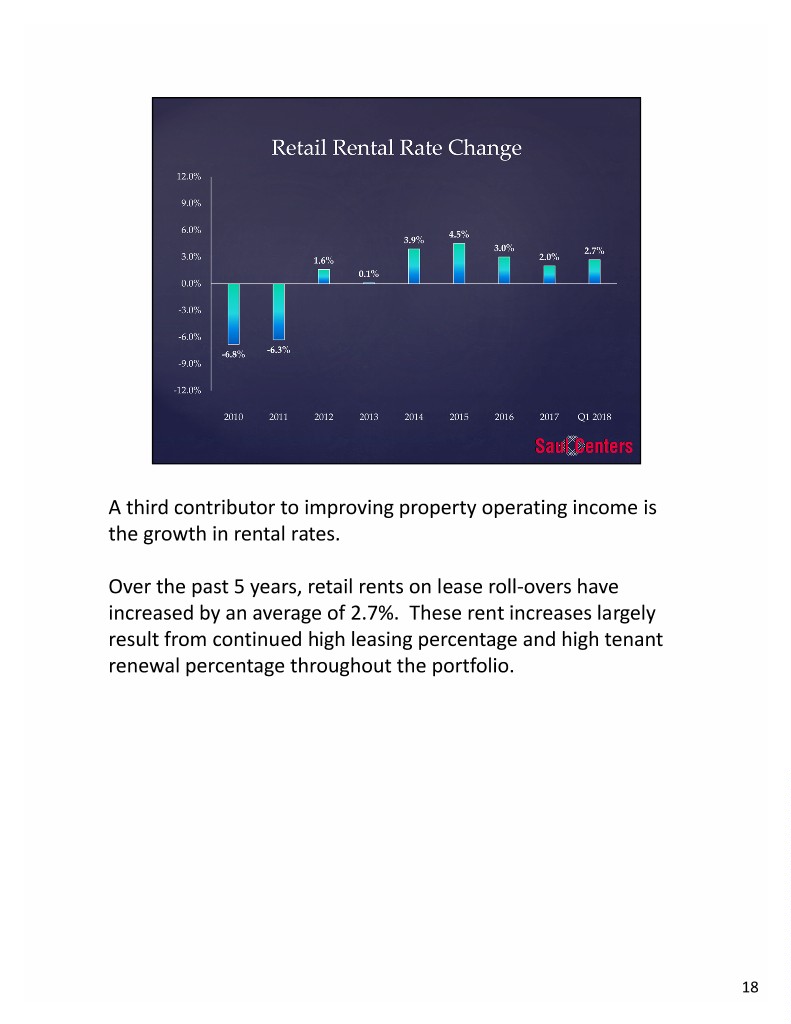
A third contributor to improving property operating income is the growth in rental rates. Over the past 5 years, retail rents on lease roll‐overs have increased by an average of 2.7%. These rent increases largely result from continued high leasing percentage and high tenant renewal percentage throughout the portfolio. 18

Retail same property operating income has grown an average of over 3.6% annually over the past 5 years. 19
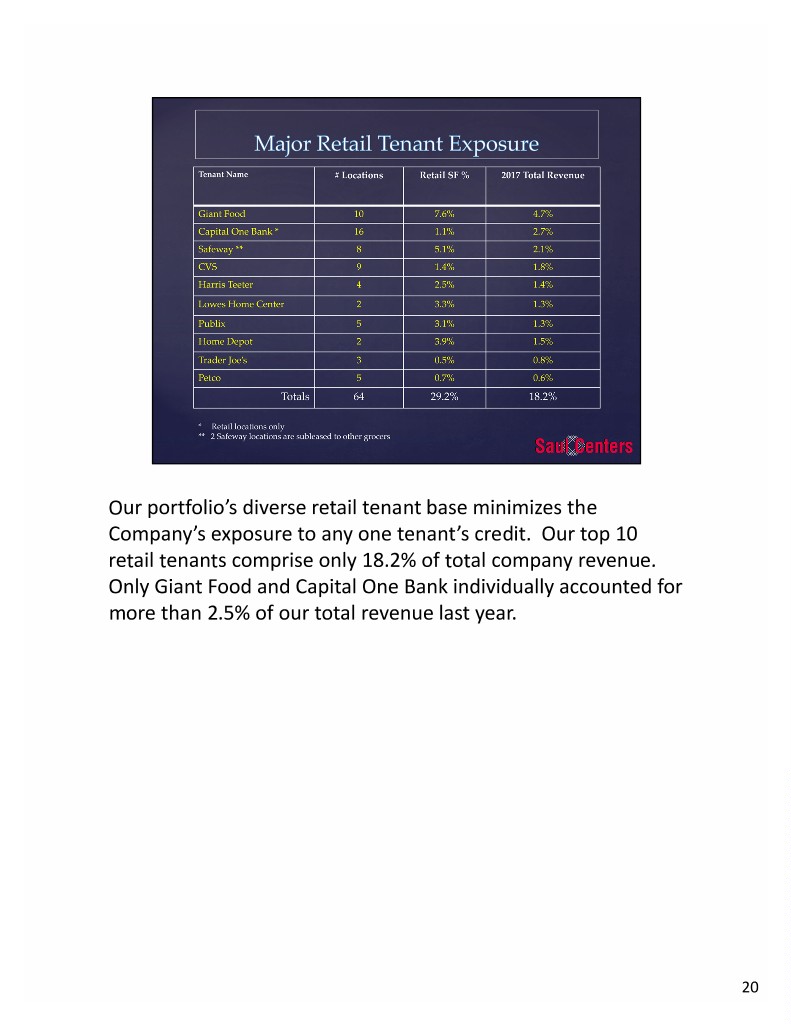
Our portfolio’s diverse retail tenant base minimizes the Company’s exposure to any one tenant’s credit. Our top 10 retail tenants comprise only 18.2% of total company revenue. Only Giant Food and Capital One Bank individually accounted for more than 2.5% of our total revenue last year. 20

Although Amazon and other internet retailers are impacting some retail sectors, service and entertainment uses such as food & drug, restaurant, medical, fitness and pet services remain in demand. As a result, we have been able to maintain stable occupancy levels in our grocery‐anchored, service‐oriented shopping centers. 21

A sampling of major retailers which have been subjects of recent negative media attention or bankruptcy are shown here. Saul Centers has over 1,000 tenant leases in our 49 shopping centers, with exposure to only 2 stores of the retailers mentioned above. 22

We recently commenced construction on a 16,000 square foot small shop expansion of Burtonsville Town Square. The expansion is estimated to cost approximately $5.7 million. Delivery is projected in late 2018, and leases are under negotiation for 55% of this space. 23
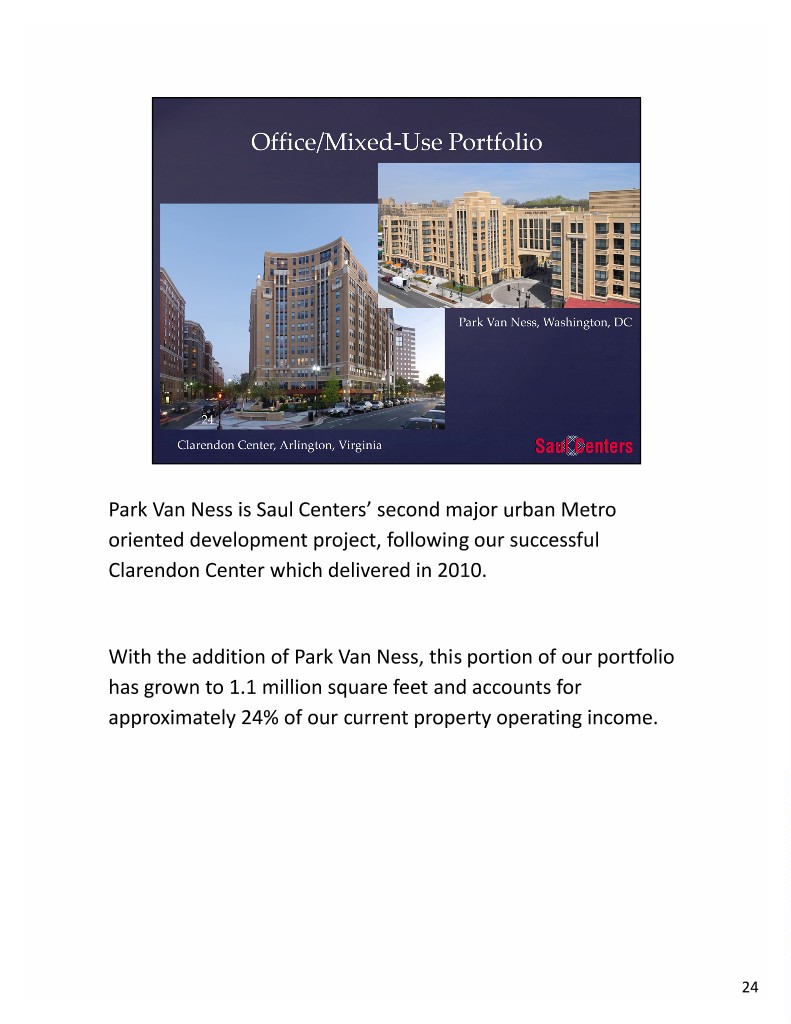
Park Van Ness is Saul Centers’ second major urban Metro oriented development project, following our successful Clarendon Center which delivered in 2010. With the addition of Park Van Ness, this portion of our portfolio has grown to 1.1 million square feet and accounts for approximately 24% of our current property operating income. 24
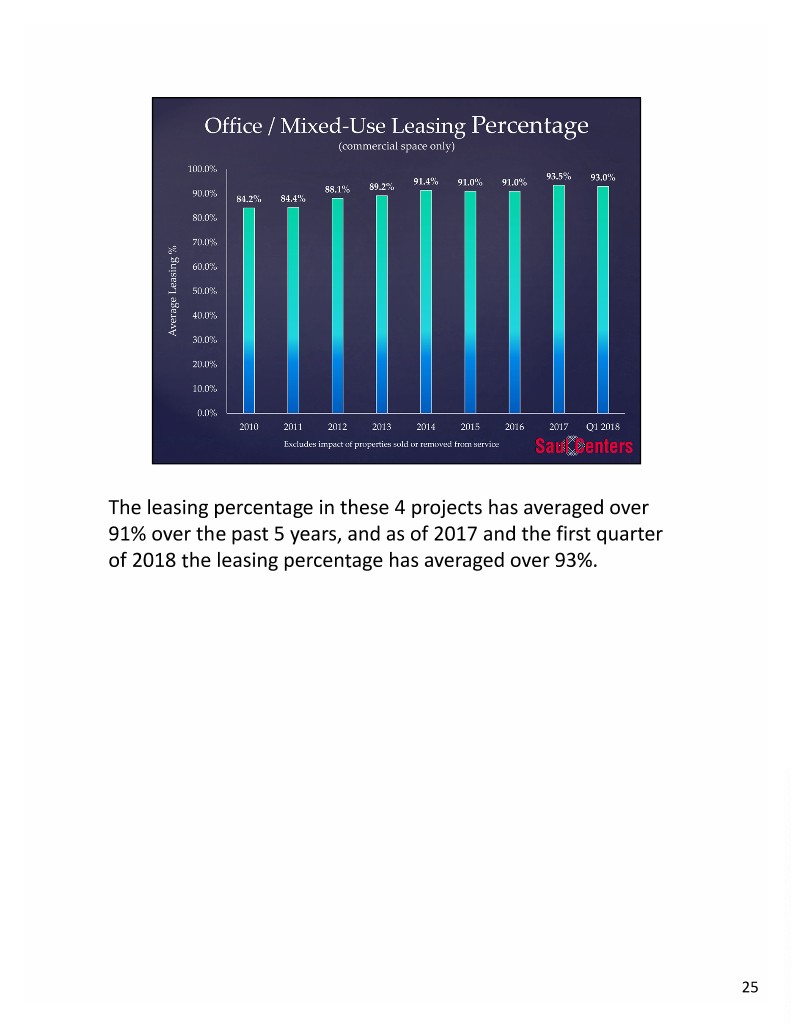
The leasing percentage in these 4 projects has averaged over 91% over the past 5 years, and as of 2017 and the first quarter of 2018 the leasing percentage has averaged over 93%. 25

This is the company’s sixth consecutive year of FFO growth, with 2017 up 4.9% per share from 2016. We have raised the dividend annually every year since 2013. We most recently increased the dividend in January 2018, by 2.0%, to the current annualized rate of $2.08 per share, our historically highest level. 26

Our dividend payout ratio has stayed relatively steady over the past 5 years, at an average of just under 60%. This conservative payout policy allows us to retain operating cash flow to fund portions of our planned future acquisition, redevelopment and development activities, providing a source of capital for our future growth. 27

We began in 1993 with a $500 million total capitalization, split evenly between debt and equity – 50% leveraged. Currently, as of March 2018, our total capitalization is approximately $2.6 billion and, with $973 million of debt, our leverage is 36% debt to total capitalization. A long‐term holder of our stock since our August 1993 IPO has received a 10.4% compounded annual total return, including both dividends and price appreciation. This compares to a compounded annual return of the S&P 500 of 9.6%. 28

We remain committed to, and confident in, the long‐term growth prospects for our retail and mixed‐use properties. Our balance sheet is strong, and we are prepared for new opportunities moving forward. I now welcome any questions you may have. Adjournment (after questions) 29
