Attached files
| file | filename |
|---|---|
| EX-32.2 - EXHIBIT 32.2 - Jones Lang LaSalle Income Property Trust, Inc. | exhibit322may2018.htm |
| EX-32.1 - EXHIBIT 32.1 - Jones Lang LaSalle Income Property Trust, Inc. | exhibit321may2018.htm |
| EX-31.2 - EXHIBIT 31.2 - Jones Lang LaSalle Income Property Trust, Inc. | exhibit312may2018.htm |
| EX-31.1 - EXHIBIT 31.1 - Jones Lang LaSalle Income Property Trust, Inc. | exhibit311may2018.htm |
UNITED STATES
SECURITIES AND EXCHANGE COMMISSION
Washington, D.C. 20549
_________________________________
FORM 10-Q
_________________________________
☒ | QUARTERLY REPORT PURSUANT TO SECTION 13 OR 15(d) OF THE SECURITIES EXCHANGE ACT OF 1934 |
For the quarterly period ended March 31, 2018
OR
☐ | TRANSITION REPORT PURSUANT TO SECTION 13 OR 15(d) OF THE SECURITIES EXCHANGE ACT OF 1934 |
For the transition period from to
Commission file number: 000-51948
_________________________________

Jones Lang LaSalle Income Property Trust, Inc.
(Exact name of registrant as specified in its charter)
_________________________________
Maryland | 20-1432284 | |
(State or other jurisdiction of incorporation or organization) | (I.R.S. Employer Identification Number) | |
333 West Wacker Drive, Chicago IL, 60606
(Address of principal executive offices, including Zip Code)
(312) 897-4000
(Registrant’s telephone number, including area code)
N/A
(Former name or former address, if changed since last report)
_________________________________
Indicate by check mark whether the registrant (1) has filed all reports required to be filed by Section 13 or 15(d) of the Securities Exchange Act of 1934 during the preceding 12 months (or for such shorter period that the registrant was required to file such reports), and (2) has been subject to such filing requirements for the past 90 days. YES ☒ NO ☐
Indicate by check mark whether the registrant has submitted electronically and posted on its corporate Web site, if any, every Interactive Data File required to be submitted and posted pursuant to Rule 405 of Regulation S-T (§232.405 of this chapter) during the preceding 12 months (or for such shorter period that the registrant was required to submit and post such files). YES ☒ NO ☐
Indicate by check mark whether the registrant is a large accelerated filer, an accelerated filer, a non-accelerated filer, a smaller reporting company, or an emerging growth company.
Large accelerated filer | ☐ | Accelerated filer | ☐ | |||
Non-accelerated filer | ☒ | Smaller reporting company | ☐ | |||
Emerging growth company | ☐ | |||||
If an emerging growth company, indicate by check mark if the registrant has elected not to use the extended transition period for complying with any new or revised financial accounting standards provided pursuant to Section 13(a) of the Exchange Act. ☐
Indicate by check mark whether the registrant is a shell company (as defined in Rule 12b-2 of the Exchange Act). YES ¨ NO ☒
The number of shares of the registrant’s Common Stock, $.01 par value, outstanding on May 11, 2018 were 69,718,639 shares of Class A Common Stock, 38,757,224 shares of Class M Common Stock, 10,905,932 of Class A-I Common Stock, 7,440,228 of Class M-I Common Stock and 7,531,714 shares of Class D Common Stock.
Jones Lang LaSalle Income Property Trust, Inc.
INDEX
PAGE NUMBER | |
2
Item 1. Financial Statements.
Jones Lang LaSalle Income Property Trust, Inc.
CONSOLIDATED BALANCE SHEETS
$ in thousands, except per share amounts
March 31, 2018 | December 31, 2017 | |||||||
(Unaudited) | ||||||||
ASSETS | ||||||||
Investments in real estate: | ||||||||
Land (including from VIEs of $25,441 and $28,847, respectively) | $ | 388,853 | $ | 388,849 | ||||
Buildings and equipment (including from VIEs of $155,596 and $178,452, respectively) | 1,466,886 | 1,465,448 | ||||||
Less accumulated depreciation (including from VIEs of $(24,392) and $(23,379), respectively) | (121,432 | ) | (112,132 | ) | ||||
Net property and equipment | 1,734,307 | 1,742,165 | ||||||
Investment in unconsolidated real estate affiliates | 131,736 | 132,639 | ||||||
Real estate fund investment | 94,563 | 93,670 | ||||||
Investments in real estate and other assets held for sale | — | 45,116 | ||||||
Net investments in real estate | 1,960,606 | 2,013,590 | ||||||
Cash and cash equivalents (including from VIEs of $4,731 and $5,835, respectively) | 40,647 | 39,700 | ||||||
Restricted cash (including from VIEs of $43,269 and $465, respectively) | 46,364 | 2,536 | ||||||
Tenant accounts receivable, net (including from VIEs of $1,634 and $1,416, respectively) | 3,657 | 4,955 | ||||||
Deferred expenses, net (including from VIEs of $338 and $316, respectively) | 9,451 | 9,723 | ||||||
Acquired intangible assets, net (including from VIEs of $6,541 and $11,249, respectively) | 98,161 | 103,226 | ||||||
Deferred rent receivable, net (including from VIEs of $1,078 and $1,065, respectively) | 17,476 | 16,874 | ||||||
Prepaid expenses and other assets (including from VIEs of $109 and $125, respectively) | 9,524 | 6,503 | ||||||
TOTAL ASSETS | $ | 2,185,886 | $ | 2,197,107 | ||||
LIABILITIES AND EQUITY | ||||||||
Mortgage notes and other debt payable, net (including from VIEs of $99,903 and $99,988, respectively) | $ | 858,450 | $ | 879,022 | ||||
Liabilities held for sale | — | 407 | ||||||
Accounts payable and other accrued expenses (including from VIEs of $1,908 and $1,839, respectively) | 13,600 | 18,473 | ||||||
Accrued offering costs | 74,874 | 76,583 | ||||||
Distributions payable | 14,976 | 14,232 | ||||||
Accrued interest (including from VIEs of $364 and $361, respectively) | 1,909 | 2,360 | ||||||
Accrued real estate taxes (including from VIEs of $915 and $1,666, respectively) | 5,077 | 5,195 | ||||||
Advisor fees payable | 1,667 | 2,929 | ||||||
Acquired intangible liabilities, net | 18,816 | 19,649 | ||||||
TOTAL LIABILITIES | 989,369 | 1,018,850 | ||||||
Commitments and contingencies | — | — | ||||||
Equity: | ||||||||
Class A common stock: $0.01 par value; 200,000,000 shares authorized; 69,424,705 and 69,482,276 shares issued and outstanding at March 31, 2018 and December 31, 2017, respectively | 694 | 695 | ||||||
Class M common stock: $0.01 par value; 200,000,000 shares authorized; 38,551,532 and 37,913,989 shares issued and outstanding at March 31, 2018 and December 31, 2017, respectively | 386 | 379 | ||||||
Class A-I common stock: $0.01 par value; 200,000,000 shares authorized; 10,838,736 and 10,957,660 shares issued and outstanding at March 31, 2018 and December 31, 2017, respectively | 108 | 110 | ||||||
Class M-I common stock: $0.01 par value; 200,000,000 shares authorized; 7,192,314 and 7,421,466 shares issued and outstanding at March 31, 2018 and December 31, 2017, respectively | 72 | 74 | ||||||
Class D common stock: $0.01 par value; 200,000,000 shares authorized; 7,531,714 and 7,531,714 shares issued and outstanding at March 31, 2018 and December 31, 2017, respectively | 75 | 75 | ||||||
Additional paid-in capital (net of offering costs of $135,877 and $133,753 as of March 31, 2018 and December 31, 2017, respectively) | 1,522,790 | 1,522,123 | ||||||
Distributions to stockholders | (271,796 | ) | (256,811 | ) | ||||
Accumulated deficit | (63,573 | ) | (96,217 | ) | ||||
Total Jones Lang LaSalle Income Property Trust, Inc. stockholders’ equity | 1,188,756 | 1,170,428 | ||||||
Noncontrolling interests | 7,761 | 7,829 | ||||||
Total equity | 1,196,517 | 1,178,257 | ||||||
TOTAL LIABILITIES AND EQUITY | $ | 2,185,886 | $ | 2,197,107 | ||||
The abbreviation “VIEs” above means consolidated Variable Interest Entities.
See notes to consolidated financial statements.
3
Jones Lang LaSalle Income Property Trust, Inc.
CONSOLIDATED STATEMENTS OF OPERATIONS AND COMPREHENSIVE INCOME (LOSS)
$ in thousands, except share and per share amounts
(Unaudited)
Three Months Ended March 31, 2018 | Three Months Ended March 31, 2017 | ||||||
Revenues: | |||||||
Minimum rents | $ | 34,023 | $ | 31,696 | |||
Tenant recoveries and other rental income | 8,059 | 8,000 | |||||
Total revenues | 42,082 | 39,696 | |||||
Operating expenses: | |||||||
Real estate taxes | 6,478 | 6,074 | |||||
Property operating expenses | 7,140 | 6,564 | |||||
Provision for doubtful accounts | 42 | 18 | |||||
Property general and administrative | 390 | 281 | |||||
Advisor fees | 4,822 | 4,719 | |||||
Company level expenses | 723 | 761 | |||||
Depreciation and amortization | 14,847 | 14,024 | |||||
Total operating expenses | 34,442 | 32,441 | |||||
Operating income | 7,640 | 7,255 | |||||
Other income and (expenses): | |||||||
Interest expense | (5,729 | ) | (6,616 | ) | |||
Income (loss) from unconsolidated real estate affiliates and fund investments | 1,115 | (1,261 | ) | ||||
Gain on disposition of property | 29,665 | — | |||||
Total other income and (expenses) | 25,051 | (7,877 | ) | ||||
Net income (loss) | 32,691 | (622 | ) | ||||
Less: Net income attributable to the noncontrolling interests | (47 | ) | (120 | ) | |||
Net income (loss) attributable to Jones Lang LaSalle Income Property Trust, Inc. | $ | 32,644 | $ | (742 | ) | ||
Net income (loss) attributable to Jones Lang LaSalle Income Property Trust, Inc. per share-basic and diluted: | |||||||
Class A | 0.25 | (0.01 | ) | ||||
Class M | 0.25 | (0.01 | ) | ||||
Class A-I | 0.25 | (0.01 | ) | ||||
Class M-I | 0.25 | (0.01 | ) | ||||
Class D | 0.25 | (0.01 | ) | ||||
Weighted average common stock outstanding-basic and diluted | 133,231,349 | 135,359,651 | |||||
Other comprehensive gain (loss): | |||||||
Foreign currency translation adjustment | — | (4 | ) | ||||
Total other comprehensive gain (loss) | — | (4 | ) | ||||
Net comprehensive income (loss) | $ | 32,644 | $ | (746 | ) | ||
See notes to consolidated financial statements.
4
Jones Lang LaSalle Income Property Trust, Inc.
CONSOLIDATED STATEMENT OF EQUITY
$ in thousands, except share and per share amounts
(Unaudited)
Common Stock | Additional Paid In Capital | Distributions to Stockholders | Accumulated Deficit | Noncontrolling Interests | Total Equity | |||||||||||||||||||||
Shares | Amount | |||||||||||||||||||||||||
Balance, January 1, 2018 | 133,307,105 | $ | 1,333 | $ | 1,522,123 | $ | (256,811 | ) | $ | (96,217 | ) | $ | 7,829 | $ | 1,178,257 | |||||||||||
Issuance of common stock | 2,174,924 | 21 | 25,550 | — | — | — | 25,571 | |||||||||||||||||||
Repurchase of shares | (1,943,028 | ) | (19 | ) | (22,759 | ) | — | — | — | (22,778 | ) | |||||||||||||||
Offering costs | — | — | (2,124 | ) | — | — | — | (2,124 | ) | |||||||||||||||||
Net income | — | — | — | — | 32,644 | 47 | 32,691 | |||||||||||||||||||
Cash distributed to noncontrolling interests | — | — | — | — | — | (115 | ) | (115 | ) | |||||||||||||||||
Distributions declared per share ($0.13) | — | — | — | (14,985 | ) | — | — | (14,985 | ) | |||||||||||||||||
Balance, March 31, 2018 | 133,539,001 | $ | 1,335 | $ | 1,522,790 | $ | (271,796 | ) | $ | (63,573 | ) | $ | 7,761 | $ | 1,196,517 | |||||||||||
See notes to consolidated financial statements.
5
Jones Lang LaSalle Income Property Trust, Inc.
CONSOLIDATED STATEMENTS OF CASH FLOWS
$ in thousands (Unaudited)
Three Months Ended March 31, 2018 | Three Months Ended March 31, 2017 | |||||||
CASH FLOWS FROM OPERATING ACTIVITIES: | ||||||||
Net income (loss) | $ | 32,691 | $ | (622 | ) | |||
Adjustments to reconcile net income to net cash provided by operating activities: | ||||||||
Depreciation and amortization (loss) | 14,520 | 13,812 | ||||||
Gain on disposition of property and extinguishment of debt | (29,665 | ) | — | |||||
Provision for doubtful accounts | 42 | 18 | ||||||
Straight line rent | (637 | ) | (808 | ) | ||||
(Income) loss from unconsolidated real estate affiliates and fund investments | (1,115 | ) | 1,222 | |||||
Distributions from unconsolidated real estate affiliates and fund investments | 1,125 | 3,413 | ||||||
Net changes in assets, liabilities and other | (3,452 | ) | 1,323 | |||||
Net cash provided by operating activities | 13,509 | 18,358 | ||||||
CASH FLOWS FROM INVESTING ACTIVITIES: | ||||||||
Purchase of real estate investments | — | (1,029 | ) | |||||
Proceeds from sale of real estate investments and fixed assets | 74,478 | — | ||||||
Capital improvements and lease commissions | (6,808 | ) | (3,435 | ) | ||||
Deposits for investments under contract | — | (11 | ) | |||||
Distributions from unconsolidated real estate affiliates | — | 50 | ||||||
Net cash provided by (used in) investing activities | 67,670 | (4,425 | ) | |||||
CASH FLOWS FROM FINANCING ACTIVITIES: | ||||||||
Issuance of common stock | 15,943 | 14,093 | ||||||
Repurchase of shares | (22,812 | ) | (15,399 | ) | ||||
Offering costs | (3,833 | ) | (3,698 | ) | ||||
Distributions to stockholders | (4,930 | ) | (4,555 | ) | ||||
Distributions paid to noncontrolling interests | (115 | ) | (1,103 | ) | ||||
Contributions received from noncontrolling interests | — | 1,139 | ||||||
Draws on credit facility | — | 15,000 | ||||||
Payment on credit facility | (20,000 | ) | (10,000 | ) | ||||
Principal payments on mortgage notes and other debt payable | (853 | ) | (22,045 | ) | ||||
Net cash used in financing activities | (36,600 | ) | (26,568 | ) | ||||
Net increase (decrease) in cash, cash equivalents and restricted cash | 44,579 | (12,635 | ) | |||||
Effect of exchange rates | — | (2 | ) | |||||
Cash, cash equivalents and restricted cash at the beginning of the period | 42,432 | 47,749 | ||||||
Cash, cash equivalents and restricted cash at the end of the period | $ | 87,011 | $ | 35,112 | ||||
Reconciliation of cash, cash equivalents and restricted cash shown per Consolidated Balance Sheets to cash, cash equivalents and restricted per Consolidated Statements of Cash Flows | ||||||||
Cash and cash equivalents | $ | 40,647 | $ | 32,333 | ||||
Restricted cash | 46,364 | 2,462 | ||||||
Restricted cash included in assets held for sale | — | 317 | ||||||
Cash, cash equivalents and restricted cash at the end of the period | $ | 87,011 | $ | 35,112 | ||||
Supplemental disclosure of cash flow information: | ||||||||
Interest paid | $ | 8,377 | $ | 6,493 | ||||
Non-cash activities: | ||||||||
Write-offs of receivables | $ | (19 | ) | $ | 35 | |||
Write-offs of retired assets and liabilities | 2,161 | 4,583 | ||||||
Change in liability for capital expenditures | 4,924 | 373 | ||||||
Net liabilities transferred at sale of real estate investment | 659 | — | ||||||
Change in issuance of common stock receivable and redemption of common stock payable | 288 | 543 | ||||||
Change in accrued offering costs | (1,709 | ) | (1,822 | ) | ||||
6
Jones Lang LaSalle Income Property Trust, Inc.
NOTES TO CONSOLIDATED FINANCIAL STATEMENTS
$ in thousands, except per share amounts
NOTE 1—ORGANIZATION
General
Except where the context suggests otherwise, the terms “we,” “us,” “our” and the “Company” refer to Jones Lang LaSalle Income Property Trust, Inc. The terms “Advisor” and “LaSalle” refer to LaSalle Investment Management, Inc.
Jones Lang LaSalle Income Property Trust, Inc. is an externally advised, daily valued perpetual-life real estate investment trust ("REIT") that owns and manages a diversified portfolio of apartment, industrial, office, retail and other properties located in the United States. Over time our real estate portfolio may be further diversified on a global basis through the acquisition of properties outside of the United States and may be complemented by investments in real estate-related debt and equity securities. We were incorporated on May 28, 2004 under the laws of the State of Maryland. We believe that we have operated in such a manner to qualify to be taxed as a REIT for federal income tax purposes commencing with the taxable year ended December 31, 2004, when we first elected REIT status. As of March 31, 2018, we owned interests in a total of 68 properties, located in 19 states.
On April 1, 2018, we converted to an “UPREIT” structure by contributing substantially all of our assets to JLLIPT Holdings LP, a Delaware limited partnership (our “operating partnership”), of which we are the initial limited partner and JLLIPT Holdings GP, LLC (our wholly owned subsidiary) is the sole general partner. We refer to this re-structuring as the “contribution.” An “Umbrella Partnership Real Estate Investment Trust,” which we refer to as an “UPREIT,” is a REIT that holds all or substantially all of its assets through a partnership in which a REIT holds an interest. We converted to this structure to facilitate tax-free contributions of properties to our operating partnership in exchange for limited partnership interests in our operating partnership. A transfer of property directly to a REIT in exchange for shares of common stock of a REIT is generally a taxable transaction to the transferring property owner. In an UPREIT structure, a property owner who desires to defer taxable gain on the disposition of his property may transfer the property to our operating partnership in exchange for limited partnership interests in the operating partnership and defer taxation of gain until the limited partnership interests are disposed of in a taxable transaction.
On January 16, 2015, our follow-on Registration Statement on Form S-11 was declared effective by the Securities and Exchange Commission (the "SEC") (Commission File No. 333-196886) with respect to our continuous public offering of up to $2,700,000 in any combination of shares of our Class A, Class M, Class A-I and Class M-I common stock, consisting of up to $2,400,000 of shares offered in our primary offering and up to $300,000 in shares offered pursuant to our distribution reinvestment plan (the “First Extended Public Offering”). We reserve the right to terminate the First Extended Public Offering at any time and to extend the First Extended Public Offering term to the extent permissible under applicable law. As of March 31, 2018, we have raised aggregate gross proceeds from the sale of shares of our Class A, Class M, Class A-I and Class M-I common stock in our First Extended Public Offering of $1,107,882.
On January 12, 2018, we filed a Registration Statement on Form S-11 with the SEC (Commission File No. 333-222533) to register a public offering of up to $3,000,000 in any combination of shares of our Class A, Class M, Class A-I and Class M-I common stock, consisting of up to $2,700,000 of shares offered in our primary offering and up to $300,000 in shares offered pursuant to our distribution reinvestment plan (the “Second Extended Public Offering”). As of May 11, 2018, the Second Extended Public Offering has not been declared effective.
On March 3, 2015, we commenced a private offering (the "Private Offering") of up to $350,000 in shares of our Class D common stock with an indefinite duration. As of March 31, 2018, we have raised aggregate gross proceeds from the sale of our Class D shares in our Private Offering of $68,591.
As of March 31, 2018, 69,424,705 shares of Class A common stock, 38,551,532 shares of Class M common stock, 10,838,736 shares of Class A-I common stock, 7,192,314 shares of Class M-I common stock, and 7,531,714 shares of Class D common stock were outstanding and held by a total of 12,682 stockholders.
LaSalle acts as our advisor pursuant to the second amended and restated advisory agreement between us and LaSalle (the “Advisory Agreement”). On May 8, 2018, we renewed our Advisory Agreement with our Advisor for a one-year term expiring on June 5, 2019. Our Advisor, a registered investment advisor with the SEC, has broad discretion with respect to our investment decisions and is responsible for selecting our investments and for managing our investment portfolio pursuant to the terms of the Advisory Agreement. Our executive officers are employees of and compensated by our Advisor. We have no employees, as all operations are managed by our Advisor.
7
LaSalle is a wholly-owned, but operationally independent subsidiary of our sponsor, Jones Lang LaSalle Incorporated ("JLL" or our "Sponsor"), a New York Stock Exchange-listed professional services firm that specializes in real estate and investment management. Affiliates of our sponsor invested an aggregate of $50,200 (with a current value of $60,735) through purchases of shares of our common stock.
NOTE 2—SUMMARY OF SIGNIFICANT ACCOUNTING POLICIES
Basis of Presentation and Principles of Consolidation
The accompanying consolidated financial statements have been prepared in accordance with U.S. generally accepted accounting principles (“GAAP”), the instructions to Form 10-Q and Rule 10-01 of Regulation S-X and include the accounts of our wholly owned subsidiaries, consolidated variable interest entities ("VIE") and the unconsolidated investment in real estate affiliate accounted for under the equity method of accounting. We consider the authoritative guidance of accounting for investments in common stock, investments in real estate ventures, investors accounting for an investee when the investor has the majority of the voting interest but the minority partners have certain approval or veto rights, determining whether a general partner or general partners as a group controls a limited partnership or similar entity when the limited partners have certain rights and the consolidation of VIEs in which we own less than a 100% interest. All significant intercompany balances and transactions have been eliminated in consolidation.
On December 20, 2017, we entered into a purchase agreement structured as a reverse 1031 exchange in order to acquire Mason Mill Distribution Center in Buford, Georgia. We loaned the qualified intermediary $30,980 to acquire the property as replacement property pursuant to the applicable Internal Revenue Service guidance. The intermediary acquiring Mason Mill Distribution Center was deemed to be a VIE for which we are deemed to be the primary beneficiary as we have the ability to direct the activities of the entity that most significantly impact its economic performance and we have all of the risks and rewards of ownership. On February 5, 2018, we sold Station Nine Apartments for $75,000 less closing costs using the sale to complete the reverse 1031 exchange for Mason Mill Distribution Center. Mason Mill Distribution Center was no longer considered a VIE on this date. As of March 31, 2018, $42,752 of the sale proceeds from Station Nine Apartments remain with the intermediary as we intend to complete a 1031 forward exchange. Parenthetical disclosures are shown on our Consolidated Balance Sheets regarding the amounts of VIE assets and liabilities that are consolidated. As of March 31, 2018, our VIEs include The District at Howell Mill, The Edge at Lafayette, Grand Lakes Marketplace and Townlake of Coppell due to the limited partnership structures and our partners having limited participation rights and no kick-out rights. The creditors of our VIEs do not have general recourse to us.
Noncontrolling interests represent the minority members’ proportionate share of the equity in our VIEs. At acquisition, the assets, liabilities and noncontrolling interests were measured and recorded at the estimated fair value. Noncontrolling interests will increase for the minority members’ share of net income of these entities and contributions and decrease for the minority members’ share of net loss and distributions. As of March 31, 2018, noncontrolling interests represented the minority members’ proportionate share of the equity of the entities listed above as VIEs.
Certain of our joint venture agreements include provisions whereby, at certain specified times, each party has the right to initiate a purchase or sale of its interest in the joint ventures at an agreed upon fair value. Under these provisions, we are not obligated to purchase the interest of our outside joint venture partners.
The accompanying unaudited interim consolidated financial statements have been prepared in accordance with the accounting policies described in the consolidated financial statements and related notes included in our Form 10-K filed with the SEC on March 8, 2018 (our “2017 Form 10-K”) and should be read in conjunction with such consolidated financial statements and related notes. The following notes to these interim consolidated financial statements highlight changes to the notes included in the December 31, 2017 audited consolidated financial statements included in our 2017 Form 10-K and present interim disclosures as required by the SEC.
The interim financial data as of March 31, 2018 and for the three months ended March 31, 2018 and 2017 is unaudited. In our opinion, the interim data includes all adjustments, consisting only of normal recurring adjustments, necessary for a fair statement of the results for the interim periods.
Allowance for Doubtful Accounts
An allowance for doubtful accounts is provided against the portion of accounts receivable and deferred rent receivable that is estimated to be uncollectible. Such allowance is reviewed periodically based upon our recovery experience. At March 31, 2018 and December 31, 2017, our allowance for doubtful accounts was $396 and $296, respectively.
8
Restricted Cash
Restricted cash includes amounts established pursuant to various agreements for loan escrow accounts, loan commitments and property sale proceeds. When we sell a property, we can elect to enter into a like-kind exchange pursuant to the applicable Internal Revenue Service guidance whereby the proceeds from the sale are placed in escrow with a qualified intermediary until a replacement property can be purchased. At March 31, 2018, we had $42,752 of sale proceeds included in restricted cash on our Consolidated Balance Sheet.
Deferred Expenses
Deferred expenses consist of lease commissions. Lease commissions are capitalized and amortized over the term of the related lease as a component of depreciation and amortization expense. Accumulated amortization of deferred expenses at March 31, 2018 and December 31, 2017 was $4,153 and $3,816, respectively.
Acquisitions
We have allocated a portion of the purchase price of our acquisitions to acquired intangible assets, which include acquired in-place lease intangibles, acquired above-market in-place lease intangibles and acquired ground lease intangibles, which are reported net of accumulated amortization of $50,649 and $47,130 at March 31, 2018 and December 31, 2017, respectively, on the accompanying Consolidated Balance Sheets. The acquired intangible liabilities represent acquired below-market in-place leases, which are reported net of accumulated amortization of $9,025 and $8,300 at March 31, 2018 and December 31, 2017, respectively, on the accompanying Consolidated Balance Sheets.
Assets and Liabilities Measured at Fair Value
The Financial Accounting Standards Board’s (“FASB”) guidance for fair value measurement and disclosure states that fair value is an exit price, representing the amount that would be received to sell an asset or paid to transfer a liability in an orderly transaction between market participants. As such, fair value is a market-based measurement that should be determined based on assumptions that market participants would use in pricing an asset or liability. As a basis for considering assumptions, authoritative guidance establishes a three-tier fair value hierarchy, which prioritizes the inputs used in measuring fair value as follows:
• | Level 1—Inputs are quoted prices (unadjusted) in active markets for identical assets or liabilities that we have access to at the measurement date. |
• | Level 2—Observable inputs, other than quoted prices included in Level 1 that are observable for the asset or liability, either directly or indirectly. Level 2 inputs are those in markets for which there are few transactions, the prices are not current, little public information exists or instances where prices vary substantially over time or among brokered market makers. |
• | Level 3—Unobservable inputs for the asset or liability. Unobservable inputs are those inputs that reflect our own assumptions that market participants would use to price the asset or liability based on the best available information. |
The authoritative guidance requires the disclosure of the fair value of our financial instruments for which it is practicable to estimate that value. The guidance does not apply to all balance sheet items. Market information as available or present value techniques have been utilized to estimate the amounts required to be disclosed. Since such amounts are estimates, there can be no assurance that the disclosed value of any financial instrument could be realized by immediate settlement of the instrument.
Our real estate fund investment is accounted for under the fair value option and falls within Level 3 of the hierarchy. The fair value is recorded based upon changes in the net asset value of the limited partnership as determined from the financial statements of the real estate fund. During the three months ended March 31, 2018 and 2017 we recorded an increase in fair value of $893 and a decrease in fair value of $2,117, respectively, in our investment in the NYC Retail Portfolio (see Note 4-Unconsolidated Real Estate Affiliates and Fund Investments).
We have estimated the fair value of our mortgage notes and other debt payable reflected on the Consolidated Balance Sheets at amounts that are based upon an interpretation of available market information and valuation methodologies (including discounted cash flow analysis with regard to fixed rate debt) for similar loans made to borrowers with similar credit ratings and for the same maturities. The fair value of our mortgage notes and other debt payable using Level 2 inputs was $8,052 lower and $4,051 higher than the aggregate carrying amounts at March 31, 2018 and December 31, 2017, respectively. Such fair value estimates are not necessarily indicative of the amounts that would be realized upon disposition of our mortgage notes payable.
9
Derivative Financial Instruments
We record all derivatives on the Consolidated Balance Sheets at fair value in prepaid expenses and other assets or accounts payable and other accrued expenses. Changes in the fair value of our derivatives are recorded as a component of interest expense on our Consolidated Statements of Operations and Comprehensive Income (Loss) as we have not designated our derivative instruments as hedges. Our objective in using interest rate derivatives is to manage our exposure to interest rate movements. To accomplish this objective, we use interest rate caps and swaps.
As of March 31, 2018, we had the following outstanding interest rate derivatives related to managing our interest rate risk:
Interest Rate Derivative | Number of Instruments | Notional Amount | ||||
Interest Rate Caps | 1 | $ | 17,680 | |||
Interest Rate Swaps | 6 | 171,400 | ||||
The fair value of our interest rate caps and swaps represent assets of $5,846 and $3,366 at March 31, 2018 and December 31, 2017, respectively.
Use of Estimates
The preparation of consolidated financial statements in conformity with GAAP requires us to make estimates and assumptions. These estimates and assumptions impact the reported amounts of assets and liabilities and the disclosure of contingent assets and liabilities at the date of the consolidated financial statements and the reported amounts of revenues and expenses during the reporting period. For example, significant estimates and assumptions have been made with respect to useful lives of assets, recoverable amounts of receivables, fair value of derivatives and real estate assets, initial valuations and related amortization periods of deferred costs and intangibles, particularly with respect to property acquisitions. Actual results could differ from those estimates.
Recently Adopted Accounting Pronouncements
Effective January 1, 2018, we adopted Accounting Standard Update 2014-09 Revenue from Contracts with Customers (Topic 606), which uses a five step model to recognize revenue from customer contracts in an effort to increase consistency and comparability throughout global capital markets and across industries. The model requires identification of the contract, identification of any separate performance obligations in the contract, determination and allocation of the total transaction price, and recognition of revenue as the performance obligation is satisfied. The new standard replaced most existing revenue guidance within U.S. GAAP. Our arrangements with customers are principally determined to be leases (which are outside the scope of this new revenue guidance). We do account for certain point-of-sale transactions including daily parking (recorded in tenant recoveries and other rental income in our Consolidated Statement of Operations and Comprehensive Income) in accordance with the new revenue standard. The pattern and timing of revenue recognition for these point of sale transactions is consistent with prior accounting model. We adopted the standard using the cumulative effect transition method however the adoption did not result in a cumulative-effect adjustment.
Effective January 1, 2018, we adopted Accounting Standard Update 2017-05, Other Income-Gains and Losses from the Derecognition of Nonfinancial Assets, on a modified retrospective basis. This new pronouncement, which added guidance for partial sales of nonfinancial assets and clarified the scope of Subtopic 610-20, Gains and Losses from the Derecognition of Nonfinancial Assets, applies to the derecognition of all nonfinancial assets (including sale of real estate transactions) for which the counterparty is not a customer. The sale of real estate is reported in gain on disposition of property on our Consolidated Statements of Operations and Comprehensive Income (Loss). The adoption of this pronouncement did not have a material effect on our financial statements and did not result in a cumulative-effect adjustment.
Effective January 1, 2018, we adopted Accounting Standard Update 2016-15 Statement of Cash Flows (Topic 230). The new guidance was intended to reduce the existing diversity in practice of how certain cash receipts and cash payments are presented and classified in the statement of cash flows. The core principle of the standard required the classification of eight specific issues identified under ASC 230 to be presented as either financing, investing or operating, or some combination thereof, depending upon the nature of the issue. The adoption of this pronouncement did not have a material effect on our financial statements and related disclosures.
Effective January 1, 2018, we adopted Accounting Standard Update 2016-18 Statement of Cash Flows (Topic 230) – Restricted Cash. The new guidance required that restricted cash be included as a component of total cash and cash equivalents as presented on the statement of cash flows. The standard resulted in a decrease in net cash used in investing activities from ($5,237) to ($4,425) for the three months ended March 31, 2017.
10
NOTE 3—PROPERTY
The primary reason we make acquisitions of real estate investments in the apartment, industrial, office, retail and other property sectors is to invest capital contributed by stockholders in a diversified portfolio of real estate assets. There were no consolidated properties acquired during the three months ended March 31, 2018.
Disposition
On February 5, 2018, we sold Station Nine Apartments for approximately $75,000 less closing costs. We recorded a gain on the sale of the property in the amount of $29,665.
NOTE 4—UNCONSOLIDATED REAL ESTATE AFFILIATES AND FUND INVESTMENTS
Unconsolidated Real Estate Affiliates
Chicago Parking Garage
Chicago Parking Garage is a 366 stall, multi-level parking facility located in a large mixed-use property in Chicago, Illinois owned as a condominium interest. In accordance with authoritative guidance, Chicago Parking Garage is accounted for as an investment in an unconsolidated real estate affiliate. At March 31, 2018 and December 31, 2017, the carrying amount of our investment in Chicago Parking Garage was $17,094 and $17,046, respectively.
Pioneer Tower
On June 28, 2016, we acquired Pioneer Tower, a 17 story, 296,000 square foot multi-tenant office property in Portland, Oregon for approximately $121,750 using cash on hand. Pioneer Tower sits atop a retail property owned by an independent third party. The land under the property is owned as a condominium interest with the owner of the retail property. In accordance with authoritative guidance, Pioneer Tower is accounted for as an investment in an unconsolidated real estate affiliate. At March 31, 2018 and December 31, 2017, the carrying amount of our investment in Pioneer Tower was $114,642 and $115,593, respectively.
Summarized Combined Statements of Operations—Unconsolidated Real Estate Affiliates—Equity Method Investments
Three Months Ended March 31, 2018 | Three Months Ended March 31, 2017 | |||||||
Total revenues | $ | 3,013 | $ | 2,986 | ||||
Total operating expenses | 2,790 | 2,728 | ||||||
Net income | $ | 223 | $ | 258 | ||||
Real Estate Fund Investment
NYC Retail Portfolio
On December 8, 2015, a wholly-owned subsidiary of the Company acquired an approximate 28% interest in a newly formed limited partnership, Madison NYC Core Retail Partners, L.P., which acquired an approximate 49% interest in entities that initially owned 15 retail properties located in the greater New York City area (the “NYC Retail Portfolio”), the result of which is that we own an approximate 14% interest in the NYC Retail Portfolio. The purchase price for such portion was approximately $85,600 including closing costs. In December 2017, the 51% owner of the NYC Retail Portfolio entered into an agreement to sell their interest to a group of investors including some existing investors in the NYC Retail Portfolio along with some new investors. The transaction will take place over a period not to exceed two years and will be structured in the form of a series of like-kind exchanges funded by the new investor group. We chose not to increase our investment in the NYC Retail Portfolio. As of March 31, 2018, the NYC Retail Portfolio owned 13 retail properties totaling approximately 2,451,000 square feet across urban infill locations in Manhattan, Brooklyn, Queens, the Bronx, Staten Island and New Jersey.
At acquisition we made the election to account for our interest in the NYC Retail Portfolio under the fair value option. This fair value election was made as the investment is in the form of a commingled fund with institutional partners where fair value accounting provides the most relevant information about the financial condition of the investment. We record increases and decreases in our investment each reporting period based on the change in the fair value of the investment as estimated by the general partner. Critical inputs to NAV estimates include valuations of the underlying real estate assets which incorporate investment-specific assumptions such as discount rates, capitalization rates and rental growth rates. We did not consider adjustments to NAV estimates provided by the general partner, including adjustments for any restrictions to the transferability of ownership interests embedded within the investment agreement to which we are a party, to be necessary based upon (1) our
11
understanding of the methodology utilized and inputs incorporated to estimate NAV at the investment level, (2) consideration of market demand for the retail assets held by the venture, and (3) contemplation of real estate and capital markets conditions in the localities in which the venture operates. The Company has no unfunded commitments. Our investment in the NYC Retail Portfolio is presented on our Consolidated Balance Sheets within real estate fund investment. Changes in the fair value of our investment as well as cash distributions received are recorded on our Consolidated Statements of Operations and Comprehensive Income (Loss) within income from unconsolidated real estate affiliates and fund investments. As of March 31, 2018 and December 31, 2017, the carrying amount of our investment in the NYC Retail Portfolio was $94,563 and $93,670, respectively. During the three months ended March 31, 2018 we recorded an increase in the fair value of our investment in the NYC Retail Portfolio of $893 and received no cash distributions. During the three months ended March 31, 2017 we recorded a decrease in the fair value of our investment in the NYC Retail Portfolio of $2,117 and we received a distribution of income totaling $637. This cash distribution increased equity in income of unconsolidated real estate affiliates and fund investments. On January 17, 2017, a 116,000 square foot retail property in the NYC Retail Portfolio was sold and its mortgage loan extinguished.
Summarized Statement of Operations - NYC Retail Portfolio Investment - Fair Value Option Investment
Three Months Ended: | |||||||
March 31, 2018 | March 31, 2017 | ||||||
Total revenue | $ | 1,871 | $ | 3,450 | |||
Net investment income | 1,512 | 3,119 | |||||
Net change in unrealized gain (loss) on investment in real estate venture | 2,959 | (7,650 | ) | ||||
Net income (loss) | $ | 4,471 | $ | (4,531 | ) | ||
NOTE 5—MORTGAGE NOTES AND OTHER DEBT PAYABLE
Mortgage notes and other debt payable have various maturities through 2054 and consist of the following:
Mortgage notes and other debt payable | Maturity Date | Interest Rate | Amount payable as of | |||||||||
March 31, 2018 | December 31, 2017 | |||||||||||
Mortgage notes payable | December 1, 2018 - March 1, 2054 | 3.00% - 5.30% | $ | 665,059 | $ | 665,912 | ||||||
Credit facility | ||||||||||||
Revolving line of credit | May 26, 2020 | 3.23% | 100,000 | 120,000 | ||||||||
Term loans | May 26, 2022 | 3.10% | 100,000 | 100,000 | ||||||||
TOTAL | $ | 865,059 | $ | 885,912 | ||||||||
Net debt discount on assumed debt and debt issuance costs | (6,609 | ) | (6,890 | ) | ||||||||
Mortgage notes and other debt payable, net | $ | 858,450 | $ | 879,022 | ||||||||
Aggregate future principal payments of mortgage notes and other debt payable as of March 31, 2018 are as follows:
Year | Amount | |||
2018 | $ | 20,959 | ||
2019 | 13,717 | |||
2020 | 176,075 | |||
2021 | 29,295 | |||
2022 | 107,314 | |||
Thereafter | 517,699 | |||
Total | $ | 865,059 | ||
Credit Facility
On May 26, 2017, we entered into a credit agreement providing for a $250,000 revolving line of credit and unsecured term loan with a syndicate of six lenders led by JPMorgan Chase Bank, N.A., Bank of America, N.A., and PNC Bank, National Association. The $250,000 credit facility (the "Credit Facility") consists of a $200,000 revolving line of credit (the “Revolving Line of Credit”) and a $50,000 term loan (the “Term Loan”). On August 4, 2017, we expanded our Credit Facility to $300,000. The additional $50,000 borrowing was in the form of a five-year Term Loan maturing on May 26, 2022. The primary interest
12
rate is based on LIBOR, plus a margin ranging from 1.25% to 2.00% depending on our leverage ratio or alternatively, we can choose to borrow at a “base rate” equal to (i) the highest of (a) the Federal Funds Rate plus 0.5%, (b) the prime rate announced by JPMorgan Chase Bank, N.A., and (c) LIBOR plus 1.0%, plus (ii) a margin ranging from 0.25% to 1.00% for base rate loans. The maturity date of the Revolving Line of Credit is May 26, 2020 and contains two 12-month extension options that we may exercise upon (i) payment of an extension fee equal to 0.15% of the gross capacity under the Revolving Line of Credit at the time of the extension, and (ii) compliance with the other conditions set forth in the credit agreement. We intend to use the Revolving Line of Credit to cover short-term capital needs, for new property acquisitions and working capital. We may not draw funds on our Credit Facility if we (i) experience a material adverse effect, which is defined to include, among other things, (a) a material adverse effect on the business, assets, operations or financial condition of the Company taken as a whole; (b) the ability of any loan party to perform any of its obligations under any loan document; or (c) a material adverse effect upon the validity or enforceability of any loan document or (ii) are in default, as that term is defined in the agreement, including a default under certain other loan agreements and/or guarantees entered into by us or our subsidiaries. As of March 31, 2018, we believe no material adverse effects had occurred.
Borrowings under the Credit Facility are guaranteed by us and certain of our subsidiaries. The Credit Facility requires the maintenance of certain financial covenants, including: (i) unencumbered property pool leverage ratio; (ii) debt service coverage ratio; (iii) maximum total leverage ratio; (iv) fixed charges coverage ratio; (v) minimum net asset value; (vi) maximum secured debt ratio; (vii) maximum secured recourse debt ratio; (viii) maximum permitted investments; and (ix) unencumbered property pool criteria. The Credit Facility provides the flexibility to move assets in and out of the unencumbered property pool during the term of the Credit Facility. At March 31, 2018, we had $100,000 outstanding under the Revolving Line of Credit at a blended rate of 3.23% (LIBOR + 1.35%) and $100,000 outstanding under the Term Loans at LIBOR + 1.30%. We swapped the LIBOR portion of our $100,000 in Term Loans to a blended fixed rate of 1.80% (all in rate of 3.10% at March 31, 2018).
Covenants
At March 31, 2018, we were in compliance with all debt covenants.
Debt Issuance Costs
Debt issuance costs are capitalized, and presented net of mortgage notes and other debt payable, and amortized over the terms of the respective agreements as a component of interest expense. Accumulated amortization of debt issuance costs at March 31, 2018 and December 31, 2017 was $3,688 and $3,377, respectively.
NOTE 6—COMMON STOCK
We have five classes of common stock: Class A, Class M, Class A-I, Class M-I, and Class D. The fees payable to LaSalle Investment Management Distributors, LLC, an affiliate of our Advisor and the dealer manager for our offerings (the "Dealer Manager"), with respect to each outstanding share of each class, as a percentage of net asset value ("NAV"), are as follows:
Selling Commission (1) | Dealer Manager Fee (2) | |||
Class A Shares (3) | up to 3.0% | 1.05% | ||
Class M Shares | None | 0.30% | ||
Class A-I Shares | up to 1.5% | 0.30% | ||
Class M-I Shares (3) | None | 0.05% | ||
Class D Shares (4) | up to 1.0% | None | ||
(1) | Selling commissions are paid on the date of sale of our common stock. |
(2) | We accrue all future dealer manager fees up to the ten percent regulatory limitation as accrued offering costs on our Consolidated Balance Sheets on the date of sale of our common stock. For NAV calculation purposes, dealer manager fees are accrued daily, on a continuous basis equal to 1/365th of the stated fee. |
(3) | Effective April 1, 2018, we decreased the Dealer Manager Fee on Class A shares from 1.05% to 0.85% and eliminated the Dealer Manager Fee on Class M-I shares. |
(4) | Shares of Class D common stock are only being offered pursuant to a private offering. |
The selling commissions and dealer manager fees are offering costs and are recorded as a reduction of additional paid in capital.
13
Stock Transactions
The stock transactions for each of our classes of common stock for the three months ended March 31, 2018 were as follows:
Shares of Class A Common Stock | Shares of Class M Common Stock | Shares of Class A-I Common Stock | Shares of Class M-I Common Stock | Shares of Class D Common Stock | ||||||||||
Balance, December 31, 2017 | 69,482,276 | 37,913,989 | 10,957,660 | 7,421,466 | 7,531,714 | |||||||||
Issuance of common stock | 818,027 | 1,096,010 | 65,806 | 195,081 | — | |||||||||
Repurchase of common stock | (875,598 | ) | (458,467 | ) | (184,730 | ) | (424,233 | ) | — | |||||
Balance, March 31, 2018 | 69,424,705 | 38,551,532 | 10,838,736 | 7,192,314 | 7,531,714 | |||||||||
Stock Issuances
The stock issuances for our classes of common stock, including those issued through our distribution reinvestment plan, for the three months ended March 31, 2018 were as follows:
Three Months Ended | ||||||
March 31, 2018 | ||||||
# of shares | Amount | |||||
Class A Shares | 818,027 | $ | 9,665 | |||
Class M Shares | 1,096,010 | 12,880 | ||||
Class A-I Shares | 65,806 | 772 | ||||
Class M-I Shares | 195,081 | 2,254 | ||||
Total | $ | 25,571 | ||||
Share Repurchase Plan
Our share repurchase plan allows stockholders, subject to a one-year holding period, with certain exceptions, to request that we repurchase all or a portion of their shares of common stock on a daily basis at that day's NAV per share, limited to 5% of aggregate Company NAV per quarter. For the three months ended March 31, 2018, we repurchased 1,943,028 shares of common stock in the amount of $22,778. During the three months ended March 31, 2017, we repurchased 1,402,899 shares of common stock in the amount of $15,875.
Distribution Reinvestment Plan
Pursuant to our distribution reinvestment plan, holders of shares of any class of our common stock may elect to have their cash distributions reinvested in additional shares of our common stock at the NAV per share applicable to the class of shares being purchased on the distribution date. For the three months ended March 31, 2018, we issued 795,606 shares of common stock for $9,311 under the distribution reinvestment plan. For the three months ended March 31, 2017, we issued 887,721 shares of common stock for $10,010 under the distribution reinvestment plan.
Earnings Per Share
We compute net income per share for Class A, Class M, Class A-I, Class M-I and Class D common stock using the two-class method. Our Advisor may earn a performance fee (see Note 7- Related Party Transactions), which may impact the net income of each class of common stock differently. In periods where no performance fee is recognized in our Consolidated Statements of Operations and Comprehensive Income (Loss), the net income (loss) per share will be the same for each class of common stock.
Basic and diluted net income per share for each class of common stock is computed using the weighted-average number of common shares outstanding during the period for each class of common stock. We have not issued any dilutive or potentially dilutive securities, and thus the basic and diluted net income (loss) per share for a given class of common stock is the same for each period presented.
The following table sets forth the computation of basic and diluted net income (loss) per share for each of our Class A, Class M, Class A-I, Class M-I and Class D common stock:
14
Three Months Ended March 31, 2018 | ||||||||||||||||||||
Class A | Class M | Class A-I | Class M-I | Class D | ||||||||||||||||
Basic and diluted net income per share: | ||||||||||||||||||||
Allocation of net income per share before performance fee | $ | 17,024 | $ | 9,366 | $ | 2,667 | $ | 1,743 | $ | 1,844 | ||||||||||
Weighted average number of common shares outstanding | 69,471,681 | 38,229,153 | 10,879,108 | 7,119,693 | 7,531,714 | |||||||||||||||
Basic and diluted net income per share: | $ | 0.25 | $ | 0.25 | $ | 0.25 | $ | 0.25 | $ | 0.25 | ||||||||||
Three Months Ended March 31, 2017 | ||||||||||||||||||||
Class A | Class M | Class A-I | Class M-I | Class D | ||||||||||||||||
Basic and diluted net loss per share: | ||||||||||||||||||||
Allocation of net loss per share before performance fee | $ | (383 | ) | $ | (202 | ) | $ | (72 | ) | $ | (41 | ) | $ | (44 | ) | |||||
Weighted average number of common shares outstanding | 70,009,919 | 36,763,841 | 13,067,220 | 7,555,178 | 7,963,493 | |||||||||||||||
Basic and diluted net loss per share: | $ | (0.01 | ) | $ | (0.01 | ) | $ | (0.01 | ) | $ | (0.01 | ) | $ | (0.01 | ) | |||||
Organization and Offering Costs
Organization and offering costs include, but are not limited to, legal, accounting and printing fees and personnel costs of our Advisor attributable to our organization, preparation of the registration statement, registration and qualification of our common stock for sale with the SEC and in the various states and filing fees incurred by our Advisor. LaSalle agreed to fund our organization and offering expenses for the Second Extended Public Offering until the registration statement is determined effective by the SEC, following which time we will commence reimbursing LaSalle over 36 months. Following the First Extended Public Offering commencement date, we began paying directly or reimbursing LaSalle if it pays on our behalf any organization and offering costs incurred during the First Extended Public Offering period (other than selling commissions and dealer manager fees) as and when incurred. After the termination of the First Extended Public Offering, LaSalle has agreed to reimburse us to the extent that the organization and offering costs that we incur exceed 15% of our gross proceeds from the First Extended Public Offering. Organization costs are expensed, whereas offering costs are recorded as a reduction of capital in excess of par value. As of March 31, 2018 and December 31, 2017, LaSalle had paid $1,062 and $1,049, respectively, of organization and offering costs on our behalf which we had not yet been reimbursed. These costs are included in Accrued offering costs on the Consolidated Balance Sheets.
NOTE 7—RELATED PARTY TRANSACTIONS
On October 1, 2012, we entered into a first amended and restated advisory agreement with LaSalle (the"Advisory Agreement"), pursuant to which we pay a fixed advisory fee of 1.25% of our NAV calculated daily. The Advisory Agreement allows for a performance fee to be earned for each share class based on the total return of that share class during the calendar year. The performance fee is calculated as 10% of the return in excess of 7% per annum. On May 8, 2018, we renewed our Advisory Agreement for a one year term expiring on June 5, 2019.
Fixed advisory fees for the three months ended March 31, 2018 and 2017 were $4,822 and $4,719, respectively. There were no performance fees for the three months ended March 31, 2018 and 2017. Included in Advisor fees payable at March 31, 2018 was $1,667 of fixed fee expense. Included in Advisor fees payable for the year ended December 31, 2017 was $1,660 of fixed fee and $1,269 of performance fee expense.
We pay Jones Lang LaSalle Americas, Inc. (“JLL Americas”), an affiliate of our Advisor, for property management, leasing, mortgage brokerage and sales brokerage services performed at various properties we own. For the three months ended March 31, 2018 and 2017, JLL Americas was paid $215 and $186, respectively, for property management and leasing services.
We pay the Dealer Manager selling commissions and dealer manager fees in connection with our offerings. For the three months ended March 31, 2018 and 2017, we paid the Dealer Manager selling commissions and dealer manager fees totaling $2,469 and $2,500, respectively. A majority of the selling commissions and dealer manager fees are reallowed to participating broker-dealers. Included in Accrued offering costs, at March 31, 2018 and December 31, 2017 were $73,812 and $75,301 of future dealer manager fees payable, respectively.
As of March 31, 2018 and December 31, 2017, we owed $1,062 and $1,049, respectively, for organization and offering costs paid by LaSalle (see Note 6-Common Stock). These costs are included in Accrued offering costs.
15
NOTE 8—COMMITMENTS AND CONTINGENCIES
We are involved in various claims and litigation matters arising in the ordinary course of business, some of which involve claims for damages. Many of these matters are covered by insurance, although they may nevertheless be subject to deductibles or retentions. Although the ultimate liability for these matters cannot be determined, based upon information currently available, we believe the ultimate resolution of such claims and litigation will not have a material adverse effect on our financial position, results of operations or liquidity.
From time to time, we have entered into contingent agreements for the acquisition and financing of properties. Such acquisitions and financings are subject to satisfactory completion of due diligence or meeting certain leasing or occupancy thresholds.
We are subject to fixed ground lease payments on South Beach Parking Garage of $100 per year until September 30, 2021 and these payments will increase every five years thereafter by the lesser of 12% or the cumulative CPI over the previous five year period. We are also subject to a variable ground lease payment calculated as 2.5% of revenue. The lease expires September 30, 2041 and has a ten-year renewal option.
The operating agreement for Townlake of Coppell allows the unrelated third party joint venture partner, owning a 10% interest, to put their interest to us at a market determined value for a period of 90 days beginning in 2019.
16
NOTE 9—SEGMENT REPORTING
We have five reportable operating segments: apartment, industrial, office, retail and other properties. Consistent with how our chief operating decision makers evaluate performance and manage our properties, the financial information summarized below is presented by operating segment and reconciled to net income (loss) for the three months ended March 31, 2018 and 2017.
Apartment | Industrial | Office | Retail | Other | Total | |||||||||||||||||||
Assets as of March 31, 2018 | $ | 553,875 | $ | 485,489 | $ | 262,759 | $ | 569,953 | $ | 20,792 | $ | 1,892,868 | ||||||||||||
Assets as of December 31, 2017 | 599,794 | 489,112 | 263,883 | 575,093 | 20,845 | 1,948,727 | ||||||||||||||||||
Three Months Ended March 31, 2018 | ||||||||||||||||||||||||
Revenues: | ||||||||||||||||||||||||
Minimum rents | $ | 11,222 | $ | 7,608 | $ | 6,358 | $ | 8,769 | $ | 66 | $ | 34,023 | ||||||||||||
Tenant recoveries and other rental income | 1,143 | 2,609 | 653 | 3,038 | 616 | 8,059 | ||||||||||||||||||
Total revenues | $ | 12,365 | $ | 10,217 | $ | 7,011 | $ | 11,807 | $ | 682 | $ | 42,082 | ||||||||||||
Operating expenses: | ||||||||||||||||||||||||
Real estate taxes | $ | 2,095 | $ | 1,993 | $ | 745 | $ | 1,532 | $ | 113 | $ | 6,478 | ||||||||||||
Property operating expenses | 3,265 | 650 | 1,352 | 1,664 | 209 | 7,140 | ||||||||||||||||||
Provision for doubtful accounts | — | — | — | 42 | — | 42 | ||||||||||||||||||
Total segment operating expenses | $ | 5,360 | $ | 2,643 | $ | 2,097 | $ | 3,238 | $ | 322 | $ | 13,660 | ||||||||||||
Operating income - Segments | $ | 7,005 | $ | 7,574 | $ | 4,914 | $ | 8,569 | $ | 360 | $ | 28,422 | ||||||||||||
Capital expenditures by segment | $ | 1,096 | $ | 159 | $ | 36 | $ | 568 | $ | 21 | $ | 1,880 | ||||||||||||
Reconciliation to net income | ||||||||||||||||||||||||
Operating income - Segments | $ | 28,422 | ||||||||||||||||||||||
Property general and administrative | 390 | |||||||||||||||||||||||
Advisor fees | 4,822 | |||||||||||||||||||||||
Company level expenses | 723 | |||||||||||||||||||||||
Depreciation and amortization | 14,847 | |||||||||||||||||||||||
Operating income | $ | 7,640 | ||||||||||||||||||||||
Other income and (expenses): | ||||||||||||||||||||||||
Interest expense | $ | (5,729 | ) | |||||||||||||||||||||
Income from unconsolidated real estate affiliates and fund investments | 1,115 | |||||||||||||||||||||||
Gain on disposition of property | 29,665 | |||||||||||||||||||||||
Total other income and (expenses) | $ | 25,051 | ||||||||||||||||||||||
Net income | $ | 32,691 | ||||||||||||||||||||||
Reconciliation to total consolidated assets as of March 31, 2018 | ||||||||||||||||||||||||
Assets per reportable segments | $ | 1,892,868 | ||||||||||||||||||||||
Investment in unconsolidated real estate affiliates, real estate fund investment and corporate level assets | 293,018 | |||||||||||||||||||||||
Total consolidated assets | $ | 2,185,886 | ||||||||||||||||||||||
Reconciliation to total consolidated assets as of December 31, 2017 | ||||||||||||||||||||||||
Assets per reportable segments | $ | 1,948,727 | ||||||||||||||||||||||
Investment in unconsolidated real estate affiliates, real estate fund investment and corporate level assets | 248,380 | |||||||||||||||||||||||
Total consolidated assets | $ | 2,197,107 | ||||||||||||||||||||||
17
Apartment | Industrial | Office | Retail | Other | Total | |||||||||||||||||||
Three Months Ended March 31, 2017 | ||||||||||||||||||||||||
Revenues: | ||||||||||||||||||||||||
Minimum rents | $ | 9,392 | $ | 7,672 | $ | 6,957 | $ | 7,606 | $ | 69 | $ | 31,696 | ||||||||||||
Tenant recoveries and other rental income | 1,055 | 2,472 | 1,286 | 2,523 | 664 | 8,000 | ||||||||||||||||||
Total revenues | $ | 10,447 | $ | 10,144 | $ | 8,243 | $ | 10,129 | $ | 733 | $ | 39,696 | ||||||||||||
Operating expenses: | ||||||||||||||||||||||||
Real estate taxes | $ | 1,515 | $ | 2,075 | $ | 937 | $ | 1,434 | $ | 113 | $ | 6,074 | ||||||||||||
Property operating expenses | 2,635 | 595 | 1,758 | 1,352 | 224 | 6,564 | ||||||||||||||||||
Provision for (recovery of) doubtful accounts | 11 | — | (3 | ) | 10 | — | 18 | |||||||||||||||||
Total segment operating expenses | $ | 4,161 | $ | 2,670 | $ | 2,692 | $ | 2,796 | $ | 337 | $ | 12,656 | ||||||||||||
Operating income - Segments | $ | 6,286 | $ | 7,474 | $ | 5,551 | $ | 7,333 | $ | 396 | $ | 27,040 | ||||||||||||
Capital expenditures by segment | $ | 318 | $ | 331 | $ | 1,624 | $ | 698 | $ | 183 | $ | 3,154 | ||||||||||||
Reconciliation to net loss | ||||||||||||||||||||||||
Operating income - Segments | $ | 27,040 | ||||||||||||||||||||||
Property general and administrative | 281 | |||||||||||||||||||||||
Advisor fees | 4,719 | |||||||||||||||||||||||
Company level expenses | 761 | |||||||||||||||||||||||
Depreciation and amortization | 14,024 | |||||||||||||||||||||||
Operating income | $ | 7,255 | ||||||||||||||||||||||
Other income and (expenses): | ||||||||||||||||||||||||
Interest expense | $ | (6,616 | ) | |||||||||||||||||||||
Loss from unconsolidated real estate affiliates and fund investments | (1,261 | ) | ||||||||||||||||||||||
Total other income and (expenses) | $ | (7,877 | ) | |||||||||||||||||||||
Net loss | $ | (622 | ) | |||||||||||||||||||||
18
NOTE 10—DISTRIBUTIONS PAYABLE
On March 6, 2018, our board of directors approved a gross dividend for the first quarter of 2018 of $0.13 per share to stockholders of record as of March 28, 2018. The dividend was paid on May 1, 2018. Class A, Class M, Class A-I, Class M-I and Class D stockholders received $0.13 per share, less applicable class-specific fees, if any.
NOTE 11— RECENTLY ISSUED ACCOUNTING PRONOUNCEMENTS
In February 2016, the FASB issued Accounting Standard Update 2016-02 Leases (ASC 842), which sets out the principles for the recognition, measurement, presentation and disclosure of leases for both parties to a contract (i.e. lessees and lessors). The FASB also issued an Exposure Draft on January 5, 2018 proposing to amend ASU 2016-02, which would provide lessors with a practical expedient, by class of underlying assets, to not separate non-lease components from the related lease components and, instead, to account for those components as a single lease component, if certain criteria are met. The new standard requires lessors to account for leases using an approach that is substantially equivalent to existing guidance for sales-type leases, direct financing leases and operating leases. The new standard requires lessees to apply a dual approach, classifying leases as either finance or operating leases based on the principle of whether or not the lease is effectively a financed purchase by the lessee. This classification will determine whether lease expense is recognized based on an effective interest method or on a straight line basis over the term of the lease. A lessee is also required to record a right-of-use asset and a lease liability for all leases with a term of greater than 12 months regardless of their classification. Leases with a term of 12 months or less will be accounted for similar to existing guidance for operating leases today. The update is expected to impact our consolidated financial statements as we have a ground lease arrangement for which we are the lessee. ASC 842 supersedes the previous leases standard, ASC 840 Leases. The standard is effective on January 1, 2019, with early adoption permitted. We currently believe the adoption of the standard will not have a material impact for leases where we are the lessor. We are the lessee on one ground lease which will require us to record a right-of-use asset and a lease liability. We have preliminarily concluded that the adoption of the standard will not have a material impact on the consolidated financial statements for leases where we are the lessee.
NOTE 12—SUBSEQUENT EVENTS
On April 1, 2018, we converted to an UPREIT by contributing substantially all of our assets to our operating partnership.
On April 1, 2018, we reduced the dealer manager fees on our Class A Shares from 1.05% to 0.85% of NAV and we completely eliminated the fee on Class M-I Shares, which was previously 0.05%.
On May 8, 2018, our board of directors approved a gross dividend for the second quarter of 2018 of $0.13 per share to stockholders of record as of June 28, 2018. The dividend will be paid on or around August 1, 2018. Class A, Class M, Class A-I, Class M-I and Class D stockholders will receive $0.13 per share, less applicable class-specific fees, if any.
On May 8, 2018, we renewed our Advisory Agreement for a one year term expiring on June 5, 2019.
* * * * * *
19
Item 2. | Management’s Discussion and Analysis of Financial Condition and Results of Operations. |
$ in thousands, except per share amounts
Cautionary Note Regarding Forward-Looking Statements
This Quarterly Report on Form 10-Q may contain forward-looking statements within the meaning of Section 21E of the Securities Exchange Act of 1934, as amended (the “Exchange Act”), and Section 27A of the Securities Act of 1933, as amended (the "Securities Act"), regarding, among other things, our plans, strategies and prospects, both business and financial. Forward-looking statements include, but are not limited to, statements that represent our beliefs concerning future operations, strategies, financial results or other developments. Forward-looking statements can be identified by the use of forward-looking terminology such as, but not limited to, “may,” “should,” “expect,” “anticipate,” “estimate,” “would be,” “believe,” or “continue” or the negative or other variations of comparable terminology. Because these forward-looking statements are based on estimates and assumptions that are subject to significant business, economic and competitive uncertainties, many of which are beyond our control or are subject to change, actual results could be materially different. Although we believe that our plans, intentions and expectations reflected in or suggested by these forward-looking statements are reasonable, we cannot assure you that we will achieve or realize these plans, intentions or expectations. Forward-looking statements are inherently subject to risks, uncertainties and assumptions. Readers are cautioned not to place undue reliance on these forward-looking statements, which speak only as of the date this Form 10-Q is filed with the SEC. Except as required by law, we do not undertake to update or revise any forward-looking statements contained in this Form 10-Q. Important factors that could cause actual results to differ materially from the forward-looking statements are disclosed in “Item 1A. Risk Factors,” “Item 1. Business” and “Item 7. Management’s Discussion and Analysis of Financial Condition and Results of Operations” contained in our 2017 Form 10-K and our periodic reports filed with the SEC.
Management Overview
The following Management’s Discussion and Analysis of Financial Condition and Results of Operations (“MD&A”) is intended to help the reader understand our results of operations and financial condition. This MD&A is provided as a supplement to, and should be read in conjunction with, our consolidated financial statements and the accompanying notes to the consolidated financial statements appearing elsewhere in this Form 10-Q. All references to numbered Notes are to specific notes to our Consolidated Financial Statements beginning on page 7 of this Form 10-Q, and the descriptions referred to are incorporated into the applicable portion of this section by reference. References to “base rent” in this Form 10-Q refer to cash payments made under the relevant lease(s), excluding real estate taxes and certain property operating expenses that are paid by us and are recoverable under the relevant lease(s) and exclude adjustments for straight-line rent revenue and above- and below-market lease amortization.
The discussions surrounding our Consolidated Properties refer to our wholly or majority owned and controlled properties, which as of March 31, 2018, were comprised of:
Apartment
• | The Edge at Lafayette, |
• | Townlake of Coppell, |
• | AQ Rittenhouse, |
• | Lane Parke Apartments, |
• | Dylan Point Loma, |
• | The Penfield, |
• | 180 North Jefferson, |
• | Jory Trail at the Grove (acquired in 2017) and |
• | The Reserve at Johns Creek (acquired in 2017). |
Industrial
• | Kendall Distribution Center, |
• | Norfleet Distribution Center, |
• | Suwanee Distribution Center, |
• | South Seattle Distribution Center, |
• | Grand Prairie Distribution Center, |
• | Charlotte Distribution Center, |
20
• | DFW Distribution Center, |
• | O'Hare Industrial Portfolio, |
• | Tampa Distribution Center, |
• | Aurora Distribution Center, |
• | Valencia Industrial Portfolio, |
• | Pinole Point Distribution Center and |
• | Mason Mill Distribution Center (acquired in 2017). |
Office
• | Monument IV at Worldgate, |
• | 111 Sutter Street, |
• | 140 Park Avenue and |
• | San Juan Medical Center. |
Retail
• | The District at Howell Mill, |
• | Grand Lakes Marketplace, |
• | Oak Grove Plaza, |
• | Rancho Temecula Town Center, |
• | Skokie Commons, |
• | Whitestone Market, |
• | Maui Mall, |
• | Silverstone Marketplace, |
• | Kierland Village Center, |
• | Timberland Town Center and |
• | Montecito Marketplace (acquired in 2017). |
Other
• | South Beach Parking Garage. |
Sold Properties
• | Railway Street Corporate Centre (transferred to lender in 2017), |
• | 14600 Sherman Way (sold in 2017), |
• | 14624 Sherman Way (sold in 2017), |
• | Joliet Distribution Center (sold in 2017) and |
• | Station Nine Apartments (sold in 2018). |
Discussions surrounding our Unconsolidated Properties refer to properties owned through joint venture arrangements or condominium interests, which were comprised of the Chicago Parking Garage, the NYC Retail Portfolio and Pioneer Tower (office) as of March 31, 2018.
Our primary business is the ownership and management of a diversified portfolio of apartment, industrial, office, retail and other properties primarily located in the United States. It is expected that over time our real estate portfolio will be further diversified on a global basis and will be complemented by investments in real estate-related assets.
We are managed by our Advisor, LaSalle Investment Management, Inc., a subsidiary of our Sponsor, Jones Lang LaSalle Incorporated (NYSE: JLL), a leading global financial and professional services firm that specializes in commercial real estate and investment management. We hire property management and leasing companies to provide the on-site, day-to-day management and leasing services for our properties. When selecting a property management or leasing company for one of our properties, we look for service providers that have a strong local market or industry presence, create portfolio efficiencies, have the ability to develop new business for us and will provide a strong internal control environment that will comply with our Sarbanes-Oxley Act of 2002 (“Sarbanes-Oxley”) internal control requirements. We currently use a mix of property management
21
and leasing service providers that include large national real estate service firms, including an affiliate of our Advisor and smaller local firms.
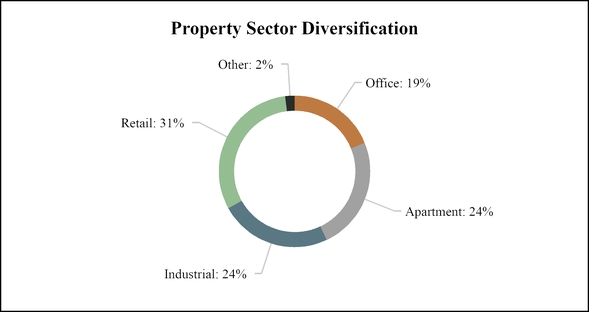
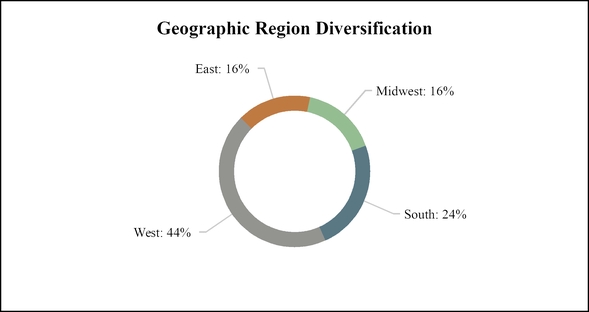
We seek to minimize risk and maintain stability of income and principal value through broad diversification across property sectors and geographic markets and by balancing tenant lease expirations and debt maturities across the real estate portfolio. Our diversification goals also take into account investing in sectors or regions we believe will create returns consistent with our investment objectives. Under normal conditions, we intend to pursue investments principally in well-located, well-leased properties within the apartment, industrial, office, retail and other sectors. We expect to actively manage the mix of properties and markets over time in response to changing operating fundamentals within each property sector and to changing economies and real estate markets in the geographic areas considered for investment. When consistent with our investment objectives, we also seek to maximize the tax efficiency of our investments through like-kind exchanges and other tax planning strategies.
The following charts summarize our portfolio diversification by property sector and geographic region based upon the fair value of our properties. These tables provide examples of how our Advisor evaluates our real estate portfolio when making investment decisions.
Estimated Percent of Fair Value as of March 31, 2018:
22
Our investments are not materially impacted by seasonality, despite certain of our retail tenants being impacted by seasonality. Percentage rents (rents computed as a percentage of tenant sales) that we earn from investments in retail properties may, in the future, be impacted by seasonality.
Use of Estimates
The preparation of financial statements in conformity with GAAP requires us to make estimates and assumptions. These estimates and assumptions impact the reported amounts of assets and liabilities and the disclosure of contingent assets and liabilities at the date of the financial statements and the reported amounts of revenues and expenses during the reporting period. For example, significant estimates and assumptions have been made with respect to the useful lives of assets, recoverable amounts of receivables, fair value of derivatives and real estate assets, initial valuations and related amortization periods of deferred costs and intangibles, particularly with respect to property acquisitions. Actual results could differ from those estimates.
Critical Accounting Policies
This MD&A is based upon our consolidated financial statements, which have been prepared in accordance with GAAP. The preparation of these consolidated financial statements requires management to make estimates and judgments that affect the reported amounts of assets, liabilities, revenues and expenses. Management bases its estimates on historical experience and assumptions that are believed to be reasonable under the circumstances, the results of which form the basis for making judgments about carrying value of assets and liabilities that are not readily apparent from other sources. Actual results may differ from these estimates under different assumptions or conditions. We believe there have been no significant changes during the three months ended March 31, 2018 to the items that we disclosed as our critical accounting policies and estimates under “Item 7. Management’s Discussion and Analysis of Financial Condition and Results of Operations” in our 2017 Form 10-K.
Initial Valuations and Estimated Useful Lives or Amortization Periods for Real Estate Investments and Intangibles
These estimates are particularly important as they are used for the allocation of purchase price between depreciable and non-depreciable real estate and other identifiable intangibles, including above, below and at-market leases. As a result, the impact of these estimates on our operations could be substantial. Significant differences in annual depreciation or amortization expense may result from the differing useful life or amortization periods related to such purchased assets and liabilities.
Impairment of Long-Lived Assets
Our estimate of the expected future cash flows used in testing for impairment is subjective and based on, among other things, our estimates regarding future market conditions, rental rates, occupancy levels, costs of tenant improvements, leasing commissions and other tenant concessions, assumptions regarding the residual value of our properties at the end of our anticipated holding period, discount rates and the length of our anticipated holding period. These assumptions could differ materially from actual results. If our strategy changes or if market conditions otherwise dictate a reduction in the holding period and an earlier sale date, an impairment loss could be recognized and such loss could be material.
23
Properties
Properties owned at March 31, 2018 are as follows:
Percentage Leased as of March 31, 2018 | ||||||||||
Property Name | Location | Acquisition Date | Ownership % | Net Rentable Square Feet | ||||||
Consolidated Properties: | ||||||||||
Apartment Segment: | ||||||||||
The Edge at Lafayette (1) | Lafayette, LA | January 15, 2008 | 78 | 207,000 | 92% | |||||
Townlake of Coppell (1) | Coppell, TX | May 22, 2015 | 90 | 351,000 | 93 | |||||
AQ Rittenhouse | Philadelphia, PA | July 30, 2015 | 100 | 92,000 | 96 | |||||
Lane Parke Apartments | Mountain Brook, AL | May 26, 2016 | 100 | 263,000 | 97 | |||||
Dylan Point Loma | San Diego, CA | August 9, 2016 | 100 | 204,000 | 94 | |||||
The Penfield | St. Paul, MN | September 22, 2016 | 100 | 245,000 | 98 | |||||
180 North Jefferson | Chicago, IL | December 1, 2016 | 100 | 217,000 | 98 | |||||
Jory Trail at the Grove | Wilsonville, OR | July 14, 2017 | 100 | 315,000 | 98 | |||||
The Reserve at Johns Creek | Johns Creek, GA | July 28, 2017 | 100 | 244,000 | 95 | |||||
Industrial Segment: | ||||||||||
Kendall Distribution Center | Atlanta, GA | June 30, 2005 | 100 | 409,000 | — | |||||
Norfleet Distribution Center | Kansas City, MO | February 27, 2007 | 100 | 702,000 | 100 | |||||
Suwanee Distribution Center | Suwanee, GA | June 28, 2013 | 100 | 559,000 | 100 | |||||
South Seattle Distribution Center: | ||||||||||
3800 1st Avenue South | Seattle, WA | December 18, 2013 | 100 | 162,000 | 100 | |||||
3844 1st Avenue South | Seattle, WA | December 18, 2013 | 100 | 101,000 | 100 | |||||
3601 2nd Avenue South | Seattle, WA | December 18, 2013 | 100 | 60,000 | 100 | |||||
Grand Prairie Distribution Center | Grand Prairie, TX | January 22, 2014 | 100 | 277,000 | 100 | |||||
Charlotte Distribution Center | Charlotte, NC | June 27, 2014 | 100 | 347,000 | 100 | |||||
DFW Distribution Center: | ||||||||||
4050 Corporate Drive | Grapevine, TX | April 15, 2015 | 100 | 441,000 | 100 | |||||
4055 Corporate Drive | Grapevine, TX | April 15, 2015 | 100 | 202,000 | 100 | |||||
O’Hare Industrial Portfolio: | ||||||||||
200 Lewis | Wood Dale, IL | September 30, 2015 | 100 | 31,000 | 100 | |||||
1225 Michael Drive | Wood Dale, IL | September 30, 2015 | 100 | 109,000 | 100 | |||||
1300 Michael Drive | Wood Dale, IL | September 30, 2015 | 100 | 71,000 | 100 | |||||
1301 Mittel Drive | Wood Dale, IL | September 30, 2015 | 100 | 53,000 | 100 | |||||
1350 Michael Drive | Wood Dale, IL | September 30, 2015 | 100 | 56,000 | 100 | |||||
2501 Allan Drive | Elk Grove, IL | September 30, 2015 | 100 | 198,000 | 91 | |||||
2601 Allan Drive | Elk Grove, IL | September 30, 2015 | 100 | 124,000 | 100 | |||||
Tampa Distribution Center | Tampa, FL | April 11, 2016 | 100 | 386,000 | 100 | |||||
Aurora Distribution Center | Aurora, IL | May 19, 2016 | 100 | 305,000 | 100 | |||||
Valencia Industrial Portfolio: | ||||||||||
28150 West Harrison Parkway | Valencia, CA | June 29, 2016 | 100 | 87,000 | 100 | |||||
28145 West Harrison Parkway | Valencia, CA | June 29, 2016 | 100 | 114,000 | 100 | |||||
28904 Paine Avenue | Valencia, CA | June 29, 2016 | 100 | 117,000 | 100 | |||||
24823 Anza Drive | Santa Clarita, CA | June 29, 2016 | 100 | 31,000 | 100 | |||||
25045 Tibbitts Avenue | Santa Clarita, CA | June 29, 2016 | 100 | 142,000 | 100 | |||||
Pinole Point Distribution Center: | ||||||||||
6000 Giant Road | Richmond, CA | September 8, 2016 | 100 | 252,000 | 100 | |||||
6015 Giant Road | Richmond, CA | September 8, 2016 | 100 | 225,000 | 100 | |||||
6025 Giant Road | Richmond, CA | December 29, 2016 | 100 | 41,000 | 100 | |||||
Mason Mill Distribution Center | Buford, GA | December 20, 2017 | 100 | 340,000 | 100 | |||||
24
Office Segment: | ||||||||||
Monument IV at Worldgate | Herndon, VA | August 27, 2004 | 100 | 228,000 | 100 | |||||
111 Sutter Street | San Francisco, CA | March 29, 2005 | 100 | 286,000 | 85 | |||||
140 Park Avenue | Florham Park, NJ | December 21, 2015 | 100 | 100,000 | 100 | |||||
San Juan Medical Center | San Juan Capistrano, CA | April 1, 2016 | 100 | 40,000 | 100 | |||||
Retail Segment: | ||||||||||
The District at Howell Mill (1) | Atlanta, GA | June 15, 2007 | 88 | 306,000 | 88 | |||||
Grand Lakes Marketplace (1) | Katy, TX | September 17, 2013 | 90 | 131,000 | 99 | |||||
Oak Grove Plaza | Sachse, TX | January 17, 2014 | 100 | 120,000 | 94 | |||||
Rancho Temecula Town Center | Temecula, CA | June 16, 2014 | 100 | 165,000 | 94 | |||||
Skokie Commons | Skokie, IL | May 15, 2015 | 100 | 97,000 | 98 | |||||
Whitestone Market | Austin, TX | September 30, 2015 | 100 | 145,000 | 97 | |||||
Maui Mall | Kahului, HI | December 22, 2015 | 100 | 235,000 | 95 | |||||
Silverstone Marketplace | Scottsdale, AZ | July 27, 2016 | 100 | 78,000 | 97 | |||||
Kierland Village Center | Scottsdale, AZ | September 30, 2016 | 100 | 118,000 | 99 | |||||
Timberland Town Center | Beaverton, OR | September 30, 2016 | 100 | 92,000 | 99 | |||||
Montecito Marketplace | Las Vegas, NV | August 8, 2017 | 100 | 190,000 | 99 | |||||
Other Segment: | ||||||||||
South Beach Parking Garage (2) | Miami Beach, FL | January 28, 2014 | 100 | 130,000 | N/A | |||||
Unconsolidated Properties: | ||||||||||
Chicago Parking Garage (3) | Chicago, IL | December 23, 2014 | 100 | 167,000 | N/A | |||||
NYC Retail Portfolio (4) | NY/NJ | December 8, 2015 | 14 | 2,451,000 | 95 | |||||
Pioneer Tower (5) | Portland, OR | June 28, 2016 | 100 | 296,000 | 90 | |||||
(1) | We own an interest in the joint venture that owns a fee interest in this property. |
(2) | The parking garage contains 343 stalls. This property is owned subject to a ground lease. |
(3) | We own a condominium interest in the building that contains a 366 stall parking garage. |
(4) | We own an approximate 14% interest in a portfolio of 13 urban infill retail properties located in the greater New York City area. |
(5) | We own a condominium interest in the building that contains a 17 story multi-tenant office property. |
Operating Statistics
We generally hold investments in properties with high occupancy rates leased to quality tenants under long-term, non-cancelable leases. We believe these leases are beneficial to achieving our investment objectives. The following table shows our operating statistics by property type for our consolidated properties as of March 31, 2018:
Number of Properties | Total Area (Sq Ft) | % of Total Area | Occupancy % | Average Minimum Base Rent per Occupied Sq Ft (1) | ||||||||||||
Apartment | 9 | 2,142,000 | 20 | % | 96 | % | $ | 22.18 | ||||||||
Industrial | 28 | 5,942,000 | 56 | 93 | 5.24 | |||||||||||
Office | 4 | 655,000 | 6 | 92 | 41.14 | |||||||||||
Retail | 11 | 1,675,000 | 16 | 95 | 20.64 | |||||||||||
Other | 1 | 130,000 | 1 | N/A | N/A | |||||||||||
Total | 53 | 10,544,000 | 100 | % | 94 | % | $ | 13.51 | ||||||||
(1) | Amount calculated as in-place minimum base rent for all occupied space at March 31, 2018 and excludes any straight line rents, tenant recoveries and percentage rent revenues. |
As of March 31, 2018, our average effective annual rent per square foot, calculated as average minimum base rent per occupied square foot less tenant concessions and allowances, was $12.68 for our consolidated properties.
25
Recent Events and Outlook
General Company and Market Commentary
On January 16, 2015, we commenced our First Extended Public Offering of up to $2,700,000 in any combination of Class A, Class M, Class A-I and Class M-I shares of common stock, consisting of up to $2,400,000 of shares in our primary offering and up to $300,000 of shares pursuant to our distribution reinvestment plan. We intend to offer shares of our common stock on a continuous basis for an indefinite period of time by filing a new registration statement before the end of each offering period, subject to regulatory approval. The per share purchase price varies from day-to-day and, on each day, equals our NAV per share for each class of common stock, plus, for Class A and Class A-I shares, applicable selling commissions. The Dealer Manager, LaSalle Investment Management Distributors, LLC, distributes shares of our common stock in our First Extended Public Offering. We intend to primarily use the net proceeds from the offering, after we pay the fees and expenses attributable to the offerings and our operations, to (1) grow and further diversify our portfolio by making investments in accordance with our investment strategy and policies, (2) repay indebtedness incurred under various financing instruments and (3) fund repurchases of our shares under our share repurchase plan.
On March 3, 2015, we commenced a private offering of up to $350,000 in shares of our Class D common stock with an indefinite duration. Proceeds from our private offering will be used for the same corporate purposes as the proceeds from the First Extended Public Offering.
On January 12, 2018, we filed a Registration Statement on Form S-11 with the SEC to register our Second Extended Public Offering of up to $3,000,000 in any combination of shares of our Class A, Class M, Class A-I and Class M-I common stock, consisting of up to $2,700,000 of shares offered in our primary offering and up to $300,000 in shares offered pursuant to our distribution reinvestment plan. As of May 11, 2018, the Second Extended Public Offering has not been declared effective.
Over the past five years we have acquired 65 properties (all of these consistent with our investment strategy), sold 30 non-strategic properties, reduced our Company leverage ratio, decreased our average interest rate on debt, and increased cash reserves and Company-wide liquidity, while also providing cash flow to our stockholders through our regular quarterly dividend payments.
Capital Raised and Use of Proceeds
As of March 31, 2018, we raised gross proceeds of over $1,540,000 from our offerings and private share sales since 2012. We used these proceeds along with proceeds from mortgage debt to acquire approximately $1,960,000 of real estate investments, deleverage the Company by repaying mortgage loans of approximately $397,000 and repurchase shares of our common stock for approximately $335,000.
Property Dispositions
On February 5, 2018, we sold Station Nine Apartments for approximately $75,000 less closing costs. We recorded a gain on the sale of the properties in the amount of $29,665.
Stock Repurchases
For the three months ended March 31, 2018, we repurchased $22,812 of shares of our common stock through the share repurchase plan.
Subsequent Events
On April 1, 2018, we converted to an UPREIT by contributing substantially all of our assets to our operating partnership. We converted to an UPREIT to allow us to acquire properties and grow the portfolio using partnership units in tax advantage exchanges with sellers.
On April 1, 2018, we reduced the dealer manager fees on our Class A Shares from 1.05% to 0.85% of NAV and we completely eliminated the fee on Class M-I Shares. As dealer manager fees are deducted quarterly from dividends paid to stockholders, these reductions in share class specific expenses effectively result in a comparable 5.9% increase in any future dividends paid to Class A stockholders and a 1.1% increase for Class M-I stockholders. These expense reductions will be reflected in our second quarter 2018 dividend declaration, payable on or around August 1, 2018.
On May 8, 2018, our board of directors approved a gross dividend for the second quarter of 2018 of $0.13 per share to stockholders of record as of June 28, 2018. The dividend will be paid on or around August 1, 2018. Class A, Class M, Class A-I, Class M-I and Class D stockholders will receive $0.13 per share, less applicable class-specific fees, if any.
On May 8, 2018, we renewed our Advisory Agreement for one year expiring on June 5, 2019.
26
Investment Objectives and Strategy
Our primary investment objectives are:
• | to generate an attractive level of current income for distribution to our stockholders; |
• | to preserve and protect our stockholders' capital investments; |
• | to achieve appreciation of our NAV over time; and |
• | to enable stockholders to utilize real estate as an asset class in diversified, long-term investment portfolios. |
We cannot ensure that we will achieve our investment objectives. Our charter places numerous limitations on us with respect to the manner in which we may invest our funds. In most cases, these limitations cannot be changed unless our charter is amended, which may require the approval of our stockholders.
The cornerstone of our investment strategy is to acquire and manage income-producing commercial real estate properties and real estate-related assets around the world. We believe this strategy enables us to provide our stockholders with a portfolio that is well-diversified across property type, geographic region and industry, both in the United States and internationally. It is our belief that adding international investments to our portfolio over time will serve as an effective tool to construct a well-diversified portfolio designed to provide our stockholders with stable distributions and attractive long-term risk-adjusted returns.
We believe that our broadly diversified portfolio benefits our stockholders by providing:
• | diversification of sources of income; |
• | access to attractive real estate opportunities currently in the United States and, over time, around the world; and |
• | exposure to a return profile that should have lower correlations with other investments. |
Since real estate markets are often cyclical in nature, our strategy allows us to more effectively deploy capital into property types and geographic regions where the underlying investment fundamentals are relatively strong or strengthening and away from those property types and geographic regions where such fundamentals are relatively weak or weakening. We intend to meet our investment objectives by selecting investments across multiple property types and geographic regions to achieve portfolio stability, diversification, current income and favorable risk-adjusted returns. To a lesser degree, we also intend to invest in debt and equity interests backed principally by real estate, which we refer to collectively as “real estate-related assets.”
We will leverage LaSalle's broad commercial real estate research and strategy platform and resources to employ a research-based investment philosophy focused on building a portfolio of commercial properties and real estate-related assets that we believe has the potential to provide stable income streams and outperform market averages over an extended holding period. Furthermore, we believe that having access to LaSalle and JLL's international organization and platform, with real estate professionals living and working full time throughout our global target markets, will be a valuable resource to us when considering and executing upon international investment opportunities.
Our board of directors has adopted investment guidelines for our Advisor to implement and actively monitor in order to allow us to achieve and maintain diversification in our overall investment portfolio. Our board of directors formally reviews our investment guidelines on an annual basis and our investment portfolio on a quarterly basis or, in each case, more often as they deem appropriate. Our board of directors reviews the investment guidelines to ensure that the guidelines are being followed and are in the best interests of our stockholders. Each such determination and the basis therefor shall be set forth in the minutes of the meetings of our board of directors. Changes to our investment guidelines must be approved by our board of directors but do not require notice to or the vote of stockholders.
We seek to invest:
• | up to 95% of our assets in properties; |
• | up to 25% of our assets in real estate-related assets; and |
• | up to 15% of our assets in cash, cash equivalents and other short-term investments. |
Notwithstanding the above, the actual percentage of our portfolio that is invested in each investment type may from time to time be outside these target levels due to numerous factors including, but not limited to, large inflows of capital over a short period of time, lack of attractive investment opportunities or increases in anticipated cash requirements for repurchase requests.
27
We expect to maintain a targeted Company leverage ratio (calculated as our share of total liabilities divided by our share of the fair value of total assets) of between 30% and 50%. We intend to use low leverage, or in some cases possibly no leverage, to finance new acquisitions in order to maintain our targeted Company leverage ratio. Our Company leverage ratio was 38% as of March 31, 2018.
2018 Key Initiatives
During 2018, we intend to use capital raised from our public and private offerings to make new acquisitions that will further our investment objectives and are consistent with our investment strategy. Likely acquisition candidates may include well-located, well-leased industrial properties, grocery-anchored community-oriented retail properties and apartment properties. We will look to acquire other property types when the opportunities and risk profile match our investment objectives and strategy. We will also attempt to further our geographic diversification. We will use debt financing to take advantage of the current favorable interest rate environment, while looking to keep the Company leverage ratio in the 30% to 50% range in the near term. We also intend to use our Revolving Line of Credit to allow us to efficiently manage our cash flows.
28
Results of Operations
General
Our revenues are primarily received from tenants in the form of fixed minimum base rents and recoveries of operating expenses. Our expenses primarily relate to the costs of operating and financing the properties. Our share of the net income or net loss from our unconsolidated real estate affiliates is included in income from unconsolidated affiliates and fund investments. We believe the following analysis of reportable segments provides important information about the operating results of our real estate investments, such as trends in total revenues or operating expenses that may not be as apparent in a period-over-period comparison of the entire Company. We group our investments in real estate assets from continuing operations into five reportable operating segments based on the type of property, which are apartment, industrial, office, retail and other. Operations from corporate level items and real estate assets sold are excluded from reportable segments.
Properties acquired or sold during any of the periods presented are presented within the recent acquisitions and sold properties line until the property has been owned for all periods presented. The properties currently presented within the recent acquisitions and sold properties line include the properties listed as either acquired or sold in the Management Overview section above. Properties owned for the three months ended March 31, 2018 and 2017 are referred to as our comparable properties.
Results of Operations for the Three Months Ended March 31, 2018 and 2017
Revenues
The following chart sets forth revenues by reportable segment for the three months ended March 31, 2018 and 2017:
Three Months Ended March 31, 2018 | Three Months Ended March 31, 2017 | $ Change | % Change | |||||||||||
Revenues: | ||||||||||||||
Minimum rents | ||||||||||||||
Apartment | $ | 8,585 | $ | 8,049 | $ | 536 | 6.7 | % | ||||||
Industrial | 7,206 | 7,481 | (275 | ) | (3.7 | ) | ||||||||
Office | 6,358 | 6,024 | 334 | 5.5 | ||||||||||
Retail | 7,780 | 7,606 | 174 | 2.3 | ||||||||||
Other | 66 | 69 | (3 | ) | (4.3 | ) | ||||||||
Comparable properties total | $ | 29,995 | $ | 29,229 | $ | 766 | 2.6 | % | ||||||
Recent acquisitions and sold properties | 4,028 | 2,467 | 1,561 | 63.3 | ||||||||||
Total minimum rents | $ | 34,023 | $ | 31,696 | $ | 2,327 | 7.3 | % | ||||||
Tenant recoveries and other rental income | ||||||||||||||
Apartment | $ | 883 | $ | 824 | $ | 59 | 7.2 | % | ||||||
Industrial | 2,497 | 2,368 | 129 | 5.4 | ||||||||||
Office | 653 | 772 | (119 | ) | (15.4 | ) | ||||||||
Retail | 2,763 | 2,524 | 239 | 9.5 | ||||||||||
Other | 616 | 664 | (48 | ) | (7.2 | ) | ||||||||
Comparable properties total | $ | 7,412 | $ | 7,152 | $ | 260 | 3.6 | % | ||||||
Recent acquisitions and sold properties | 647 | 848 | (201 | ) | (23.7 | ) | ||||||||
Total tenant recoveries and other rental income | $ | 8,059 | $ | 8,000 | $ | 59 | 0.7 | % | ||||||
Total revenues | $ | 42,082 | $ | 39,696 | $ | 2,386 | 6.0 | % | ||||||
Minimum rents at comparable properties increased by $766 for the three months ended March 31, 2018 as compared to the same period in 2017. The increase is primarily due to increases of $461 at Dylan Point Loma and $338 at 111 Sutter Street related to increased occupancy during the three months ended March 31, 2018 when compared to the same period in 2017. Partially offsetting these increases is a decrease of $322 at Kendall Distribution Center related to decreased occupancy during the three months ended March 31, 2018 as compared to the same period in 2017.
Tenant recoveries and other rental income relate mainly to real estate taxes and certain property operating expenses that are paid by us and are recoverable under the various tenants’ leases. Other rental income includes daily transient parking,
29
percentage rents and other non-recurring tenant charges. Tenant recoveries and other rental income at comparable properties increased by $260 for the three months ended March 31, 2018 as compared to the same period in 2017. The increase is primarily related to increased property operating expenses and real estate taxes during the three months ended March 31, 2018 when compared to the same period in 2017.
Operating Expenses
The following chart sets forth real estate taxes, property operating expenses and provisions for doubtful accounts by reportable segment, for the three months ended March 31, 2018 and 2017:
Three Months Ended March 31, 2018 | Three Months Ended March 31, 2017 | $ Change | % Change | ||||||||||||
Operating expenses: | |||||||||||||||
Real estate taxes | |||||||||||||||
Apartment | $ | 1,687 | $ | 1,355 | $ | 332 | 24.5 | % | |||||||
Industrial | 1,912 | 1,930 | (18 | ) | (0.9 | ) | |||||||||
Office | 745 | 735 | 10 | 1.4 | |||||||||||
Retail | 1,463 | 1,434 | 29 | 2.0 | |||||||||||
Other | 113 | 113 | — | — | |||||||||||
Comparable properties total | $ | 5,920 | $ | 5,567 | $ | 353 | 6.3 | % | |||||||
Recent acquisitions and sold properties | 558 | 507 | 51 | 10 | |||||||||||
Total real estate taxes | $ | 6,478 | $ | 6,074 | $ | 404 | 6.7 | % | |||||||
Property operating expenses | |||||||||||||||
Apartment | $ | 2,562 | $ | 2,291 | $ | 271 | 11.8 | % | |||||||
Industrial | 618 | 540 | 78 | 14.4 | |||||||||||
Office | 1,328 | 1,279 | 49 | 3.8 | |||||||||||
Retail | 1,478 | 1,352 | 126 | 9.3 | |||||||||||
Other | 209 | 224 | (15 | ) | (6.7 | ) | |||||||||
Comparable properties total | $ | 6,195 | $ | 5,686 | $ | 509 | 9.0 | % | |||||||
Recent acquisitions and sold properties | 945 | 859 | 86 | 10.0 | |||||||||||
Total property operating expenses | $ | 7,140 | $ | 6,545 | $ | 595 | 9.1 | % | |||||||
Provision for doubtful accounts | |||||||||||||||
Apartment | $ | — | $ | 12 | $ | (12 | ) | (100.0 | )% | ||||||
Retail | 42 | 11 | 31 | 281.8 | |||||||||||
Comparable properties total | $ | 42 | $ | 23 | $ | 19 | 82.6 | % | |||||||
Recent acquisitions and sold properties | — | (5 | ) | 5 | (100.0 | ) | |||||||||
Total provision for doubtful accounts | $ | 42 | $ | 18 | $ | 24 | 133.3 | % | |||||||
Total operating expenses | $ | 13,660 | $ | 12,637 | $ | 1,023 | 8.1 | % | |||||||
Real estate taxes at comparable properties increased by $353 for the three months ended March 31, 2018 as compared to the same period in 2017. The increase is primarily related to properties in the apartment segment having higher tax assessments during the three months ended March 31, 2018 as compared to the same period in 2017. Our properties are reassessed periodically by the taxing authorities, which may result in increases or decreases in the real estates taxes that we owe. Overall, we expect real estate taxes to increase over time; however, we utilize real estate tax consultants to attempt to control assessment increases.
Property operating expenses consist of the costs of ownership and operation of the real estate investments, many of which are recoverable under net leases. Examples of property operating expenses include insurance, utilities and repair and maintenance expenses. Property operating expenses at comparable properties increased $509 for the three months ended March 31, 2018 as compared to the same period in 2017. The apartment segment increase is primarily related to increases of $110 at 180 North Jefferson primarily due to higher leasing commissions and utility expenses and $91 at Townlake of Coppell due to higher repairs and maintenance expenses and turnover costs. Within our retail segment, $90 of the increase is related to
30
non-routine repair and maintenance and landscaping projects incurred during the three months ended March 31, 2018. The vacancy at 105 Kendall caused an increase of $50 in our industrial segment operating expenses as these expenses were previously the responsibility of the tenant.
Net provision for doubtful accounts relates to receivables deemed potentially uncollectible due to the age of the receivable or the status of the tenant. Provision for doubtful accounts at comparable properties increased slightly for the three months ended March 31, 2018 as compared to the same period in 2017. Our total provision for doubtful accounts continues to be a minimal percentage of total revenues.
The following chart sets forth expenses not directly related to the operations of the reportable segments for the three months ended March 31, 2018 and 2017:
Three Months Ended March 31, 2018 | Three Months Ended March 31, 2017 | $ Change | % Change | ||||||||||||
Property general and administrative | $ | 390 | $ | 281 | $ | 109 | 38.8 | % | |||||||
Advisor fees | 4,822 | 4,719 | 103 | 2.2 | |||||||||||
Company level expenses | 723 | 761 | (38 | ) | (5.0 | ) | |||||||||
Depreciation and amortization | 14,847 | 14,024 | 823 | 5.9 | |||||||||||
Interest expense | 5,729 | 6,616 | (887 | ) | (13.4 | ) | |||||||||
Income from unconsolidated affiliates and fund investments | (1,115 | ) | 1,261 | (2,376 | ) | (188.4 | ) | ||||||||
Gain on disposition of property | (29,665 | ) | — | (29,665 | ) | 100.0 | |||||||||
Total expenses | $ | (4,269 | ) | $ | 27,662 | $ | (31,931 | ) | (115.4 | )% | |||||
Property general and administrative expenses relate mainly to property expenses unrelated to the operations of the property. Property general and administrative expenses increased $109 primarily due to the acceleration of state franchise taxes related to the sale of Station Nine Apartments that occurred during the three months ended March 31, 2018.
Advisor fees relate to the fixed advisory and performance fees earned by the Advisor. Fixed fees increase or decrease based on changes in our NAV which will be primarily impacted by changes in capital raised and the value of our properties. The performance fee is accrued when the total return per share for a share class exceeds 7% for that calendar year, wherein our Advisor will receive 10% of the excess total return above the 7% threshold. The increase in advisor fees of $103 for the three months ended March 31, 2018 as compared to the same period of 2017 is related to the increase in our NAV attributable to capital raised over the past year.
Company level expenses relate mainly to our compliance and administration related costs. Company level expenses remained consistent for the three months ended March 31, 2018 as compared to the same period in 2017.
Depreciation and amortization expense is impacted by the values assigned to buildings, personal property and in-place lease assets as part of the initial purchase price allocation. The increase of $823 in depreciation and amortization expense for the three months ended March 31, 2018 as compared to the same period in 2017 is primarily related to our acquisitions that occurred in 2017.
Interest expense decreased by $887 for the three months ended March 31, 2018 as compared to the same period in 2017 primarily as a result of unrealized gains on our interest rate swaps more than offsetting the increase in interest expense on our Credit Facility, as a result of our higher outstanding balance.
Income from unconsolidated affiliates and fund investments relates to the income from Chicago Parking Garage and Pioneer Tower as well as changes in fair value and operating distributions received from our investment in the NYC Retail Portfolio. During the three months ended March 31, 2018, we recorded a $893 increase in the fair value of our investment in the NYC Retail Portfolio as compared to a $2,117 decrease in fair value during the same period of 2017.
Gain on disposition of property of $29,665 is related to the disposition of Station Nine Apartments during the three months ended March 31, 2018.
31
Funds From Operations
Consistent with real estate industry and investment community preferences, we consider funds from operations ("FFO") as a supplemental measure of the operating performance for a real estate investment trust and a complement to GAAP measures because it facilitates an understanding of the operating performance of our properties. The National Association of Real Estate Investment Trusts ("NAREIT") defines FFO as net income (loss) attributable to the Company (computed in accordance with GAAP), excluding gains or losses from cumulative effects of accounting changes, extraordinary items, impairment write-downs of depreciable real estate and sales of properties, plus real estate related depreciation and amortization and after adjustments for these items related to noncontrolling interests and unconsolidated affiliates.
FFO does not give effect to real estate depreciation and amortization because these amounts are computed to allocate the cost of a property over its useful life. Because values for well-maintained real estate assets have historically increased or decreased based upon prevailing market conditions, we believe that FFO and AFFO provide investors with an additional view of our operating performance. We also use Adjusted FFO ("AFFO") as a supplemental measure of operating performance. We define AFFO as FFO adjusted for straight-line rental income, amortization of above- and below-market leases, amortization of net discount on assumed debt, gains or losses on the extinguishment and modification of debt, performance fees based on the investment returns on shares of our common stock and acquisition expenses.
In order to provide a better understanding of the relationship between FFO, AFFO and GAAP net income, the most directly comparable GAAP financial reporting measure, we have provided reconciliations of GAAP net income attributable to Jones Lang LaSalle Income Property Trust, Inc. to FFO, and FFO to AFFO. FFO and AFFO do not represent cash flow from operating activities in accordance with GAAP, should not be considered alternatives to GAAP net income and are not measures of liquidity or indicators of the Company's ability to make cash distributions. We believe that to more comprehensively understand our operating performance, FFO and AFFO should be considered along with the reported net income attributable to Jones Lang LaSalle Income Property Trust, Inc. and our cash flows in accordance with GAAP, as presented in our consolidated financial statements. Our presentations of FFO and AFFO are not necessarily comparable to the similarly titled measures of other REITs due to the fact that not all REITs use the same definitions.
The following table presents a reconciliation of the most comparable GAAP amount of net income (loss) attributable to Jones Lang LaSalle Income Property Trust, Inc to NAREIT FFO for the periods presented:
Reconciliation of GAAP net income (loss) to NAREIT FFO | Three Months Ended March 31, 2018 | Three Months Ended March 31, 2017 | |||||
Net income (loss) attributable to Jones Lang LaSalle Income Property Trust, Inc. Common Stockholders (1) | $ | 32,644 | $ | (742 | ) | ||
Real estate depreciation and amortization (1) | 16,455 | 15,627 | |||||
Gain on disposition of property and unrealized gain on investment in unconsolidated real estate affiliate (1) | (30,557 | ) | 2,117 | ||||
NAREIT FFO attributable to Jones Lang LaSalle Income Property Trust, Inc. Common Stockholders | $ | 18,542 | $ | 17,002 | |||
Weighted average shares outstanding, basic and diluted | 133,231,349 | 135,359,651 | |||||
NAREIT FFO per share, basic and diluted | $ | 0.14 | $ | 0.13 | |||
(1) | Excludes amounts attributable to noncontrolling interests and includes our ownership share of both consolidated properties and unconsolidated real estate affiliates. |
We believe AFFO is useful to investors because it provides supplemental information regarding the performance of our portfolio over time.
32
The following table presents a reconciliation of NAREIT FFO to AFFO for the periods presented:
Reconciliation of NAREIT FFO to AFFO | Three Months Ended March 31, 2018 | Three Months Ended March 31, 2017 | |||||
NAREIT FFO attributable to Jones Lang LaSalle Income Property Trust, Inc. Common Stockholders | $ | 18,542 | $ | 17,002 | |||
Straight-line rental income (1) | (639 | ) | (960 | ) | |||
Amortization of above- and below-market leases (1) | (850 | ) | (862 | ) | |||
Amortization of net discount on assumed debt (1) | (35 | ) | (54 | ) | |||
Gain on derivative instruments and extinguishment or modification of debt (1) | (2,537 | ) | (217 | ) | |||
Adjustment for investment accounted for under the fair value option (2) | 1,060 | 377 | |||||
AFFO attributable to Jones Lang LaSalle Income Property Trust, Inc. Common Stockholders | $ | 15,541 | $ | 15,286 | |||
Weighted average shares outstanding, basic and diluted | 133,231,349 | 135,359,651 | |||||
AFFO per share, basic and diluted | $ | 0.12 | $ | 0.11 | |||
(1) | Excludes amounts attributable to noncontrolling interests and includes our ownership share of both consolidated properties and unconsolidated real estate affiliates. |
(2) | Represents the normal and recurring AFFO reconciling adjustments for the NYC Retail Portfolio. |
NAV as of March 31, 2018
The following table provides a breakdown of the major components of our NAV as of March 31, 2018:
March 31, 2018 | ||||||||||||||||||||||||
Component of NAV | Class A Shares | Class M Shares | Class A-I Shares | Class M-I Shares | Class D Shares | Total | ||||||||||||||||||
Real estate investments (1) | $ | 1,259,048 | $ | 700,734 | $ | 197,094 | $ | 130,798 | $ | 136,777 | $ | 2,424,451 | ||||||||||||
Debt | (482,203 | ) | (268,374 | ) | (75,485 | ) | (50,094 | ) | (52,384 | ) | (928,540 | ) | ||||||||||||
Other assets and liabilities, net | 37,109 | 20,653 | 5,809 | 3,855 | 4,031 | 71,457 | ||||||||||||||||||
Estimated enterprise value premium | None assumed | None assumed | None assumed | None assumed | None assumed | None assumed | ||||||||||||||||||
NAV | $ | 813,954 | $ | 453,013 | $ | 127,418 | $ | 84,559 | $ | 88,424 | $ | 1,567,368 | ||||||||||||
Number of outstanding shares | 69,424,705 | 38,551,532 | 10,838,736 | 7,192,314 | 7,531,714 | |||||||||||||||||||
NAV per share | $ | 11.72 | $ | 11.75 | $ | 11.76 | $ | 11.76 | $ | 11.74 | ||||||||||||||
(1) | The value of our real estate investments was greater than the historical cost by 7.4% as of March 31, 2018. |
The following table provides a breakdown of the major components of our NAV as of December 31, 2017:
December 31, 2017 | ||||||||||||||||||||||||
Component of NAV | Class A Shares | Class M Shares | Class A-I Shares | Class M-I Shares | Class D Shares | Total | ||||||||||||||||||
Real estate investments (1) | $ | 1,287,772 | $ | 704,255 | $ | 203,624 | $ | 137,921 | $ | 139,774 | $ | 2,473,346 | ||||||||||||
Debt | (493,261 | ) | (269,754 | ) | (77,995 | ) | (52,828 | ) | (53,538 | ) | (947,376 | ) | ||||||||||||
Other assets and liabilities, net | 16,276 | 8,901 | 2,573 | 1,742 | 1,766 | 31,258 | ||||||||||||||||||
Estimated enterprise value premium | None assumed | None assumed | None assumed | None assumed | None assumed | None assumed | ||||||||||||||||||
NAV | $ | 810,787 | $ | 443,402 | $ | 128,202 | $ | 86,835 | $ | 88,002 | $ | 1,557,228 | ||||||||||||
Number of outstanding shares | 69,482,276 | 37,913,989 | 10,957,660 | 7,421,466 | 7,531,714 | |||||||||||||||||||
NAV per share | $ | 11.67 | $ | 11.69 | $ | 11.70 | $ | 11.70 | $ | 11.68 | ||||||||||||||
(1) | The value of our real estate investments was greater than the historical cost by 6.9% as of December 31, 2017. |
The increase in NAV per share from December 31, 2017 to March 31, 2018, was related to a net increase of 0.46% in the value of our portfolio. Property operations for the three months ended March 31, 2018 had an insignificant impact on NAV as dividends declared offset property operations for the period. Our NAV for the different share classes is reduced by normal and recurring class-specific fees and offering and organization costs.
33
The following are key assumptions (shown on a weighted-average basis) that are used in the discounted cash flow models to estimate the value of our real estate investments as of March 31, 2018:
Apartment | Industrial | Office | Retail | Other (1) | Total Company | |||||||||||||
Exit capitalization rate | 5.36 | % | 5.73 | % | 5.74 | % | 5.69 | % | 6.25 | % | 5.64 | % | ||||||
Discount rate/internal rate of return (IRR) | 6.57 | 6.31 | 6.49 | 6.40 | 8.16 | 6.47 | ||||||||||||
Annual market rent growth rate | 3.05 | 3.00 | 2.79 | 3.10 | 3.31 | 3.01 | ||||||||||||
Holding period (years) | 10.00 | 10.00 | 10.00 | 10.00 | 21.97 | 10.20 | ||||||||||||
(1) | Other includes two standalone parking garages. South Beach Parking Garage is subject to a ground lease and the appraisal incorporates discounted cash flows over its remaining lease term and therefore does not utilize an exit capitalization rate. |
The following are key assumptions (shown on a weighted-average basis) that are used in the discounted cash flow models to estimate the value of our real estate investments as of December 31, 2017:
Apartment | Industrial | Office | Retail | Other (1) | Total Company | |||||||||||||
Exit capitalization rate | 5.40 | % | 5.75 | % | 5.71 | % | 5.66 | % | 6.25 | % | 5.64 | % | ||||||
Discount rate/internal rate of return (IRR) | 6.77 | 6.36 | 6.49 | 6.38 | 8.17 | 6.52 | ||||||||||||
Annual market rent growth rate | 3.13 | 3.00 | 2.79 | 3.12 | 3.41 | 3.03 | ||||||||||||
Holding period (years) | 10.00 | 10.00 | 10.00 | 10.00 | 22.30 | 10.19 | ||||||||||||
(1) | Other includes Chicago and South Beach parking garages. South Beach Parking Garage is subject to a ground lease and the appraisal incorporates discounted cash flows over its remaining lease term and therefore does not utilize an exit capitalization rate. |
While we believe our assumptions are reasonable, a change in these assumptions would impact the calculation of the value of our real estate investments. For example, assuming all other factors remain unchanged, the changes listed below would result in the following effects on our real estate investment value:
Input | March 31, 2018 | December 31, 2017 | ||||||
Discount Rate - weighted average | 0.25% increase | (1.9 | )% | (1.8 | )% | |||
Exit Capitalization Rate - weighted average | 0.25% increase | (2.6 | )% | (2.6 | ) | |||
Annual market rent growth rate - weighted average | 0.25% decrease | (1.3 | )% | (1.2 | ) | |||
The fair value of our mortgage notes and other debt payable was estimated to be approximately $10,819 lower and
$3,061 higher than the carrying values at March 31, 2018 and December 31, 2017, respectively. The NAV per share
would have increased by $0.08 and decreased by $0.02 per share at March 31, 2018 and December 31, 2017, respectively, if the
Company were to have included the fair value of its mortgage notes and other debt payable in its methodology to determine NAV.
Limitations and Risks
As with any valuation methodology, our methodology is based upon a number of estimates and assumptions that may not be accurate or complete. Our valuation methodology may not result in the determination of the fair value of our net assets as our mortgage notes and other debt payable are valued at cost. Different parties with different assumptions and estimates could derive a different NAV per share. Accordingly, with respect to our NAV per share, we can provide no assurance that:
• | a stockholder would be able to realize this NAV per share upon attempting to resell his or her shares; |
• | we would be able to achieve for our stockholders the NAV per share upon a listing of our shares of common stock on a national securities exchange, selling our real estate portfolio or merging with another company; or |
• | the NAV per share, or the methodologies relied upon to estimate the NAV per share, will be found by any regulatory authority to comply with any regulatory requirements. |
Furthermore, the NAV per share was calculated as of a particular point in time. The NAV per share will fluctuate over time in response to, among other things, changes in real estate market fundamentals, capital markets activities and attributes specific to the properties and leases within our portfolio.
34
Liquidity and Capital Resources
Our primary uses and sources of cash are as follows:
Uses | Sources | |||
Short-term liquidity and capital needs such as: | • | Operating cash flow, including the receipt of distributions of our share of cash flow produced by our unconsolidated real estate affiliates and fund investment | ||
• | Interest payments on debt | |||
• | Distributions to stockholders | • | Proceeds from secured loans collateralized by individual properties | |
• | Fees payable to our Advisor | |||
• | Minor improvements made to individual properties that are not recoverable through expense recoveries or common area maintenance charges to tenants | • | Proceeds from our Revolving Line of Credit | |
• | Sales of our shares | |||
• | General and administrative costs | • | Sales of real estate investments | |
• | Costs associated with our continuous public offering | • | Draws from lender escrow accounts | |
• | Other Company level expenses | |||
• | Lender escrow accounts for real estate taxes, insurance, and capital expenditures | |||
• | Fees payable to our Dealer Manager | |||
Longer-term liquidity and capital needs such as: | ||||
• | Acquisitions of new real estate investments | |||
• | Expansion of existing properties | |||
• | Tenant improvements and leasing commissions | |||
• | Debt repayment requirements, including both principal and interest | |||
• | Repurchases of our shares pursuant to our share repurchase plan | |||
• | Fees payable to our Advisor | |||
• | Fees payable to our Dealer Manager | |||
The sources and uses of cash for the three months ended March 31, 2018 and 2017 were as follows:
Three Months Ended March 31, 2018 | Three Months Ended March 31, 2017 | $ Change | ||||||||||
Net cash provided by operating activities | $ | 13,509 | $ | 18,358 | $ | (4,849 | ) | |||||
Net cash provided by (used in) investing activities | 67,670 | (4,425 | ) | 72,095 | ||||||||
Net cash used in financing activities | (36,600 | ) | (26,568 | ) | (10,032 | ) | ||||||
Cash provided by operating activities decreased $4,849 for the three months ended March 31, 2018 as compared to the same period in 2017. Cash from operating activities decreased during the three months ended March 31, 2018 as compared to the same period in 2017 primarily due to changes of $4,775 in our working capital, which include tenant accounts receivable, prepaid expenses and other assets, advisor fee payable and accounts payable and other accrued expenses.
Cash provided by (used in) investing activities increased by $72,095 for the three months ended March 31, 2018 as compared to the same period in 2017. The increase was primarily related to an increase in cash from the sale of Station Nine Apartments during the three months ended March 31, 2018.
Cash used in financing activities increased by $10,032 for the three months ended March 31, 2018 as compared to the same period in 2017. The change is primarily related to a decrease of $5,698 in net proceeds received from the sale of common stock during 2018 as compared to the same period in 2017. Additionally, there was an increase in net paydowns from mortgage note payables and other debt payable of $3,808 during the three months ended March 31, 2018 as compared to the same period in 2017.
35
Financing
We have relied primarily on fixed-rate financing, locking in what were favorable spreads between real estate income yields and mortgage interest rates and have tried to maintain a balanced schedule of debt maturities. We also use interest rate derivatives to manage our exposure to interest rate movements on our variable rate debt. The following consolidated debt table provides information on the outstanding principal balances and the weighted average interest rates at March 31, 2018 and December 31, 2017:
Consolidated Debt | ||||||||||||||
March 31, 2018 | December 31, 2017 | |||||||||||||
Principal Balance | Weighted Average Interest Rate | Principal Balance | Weighted Average Interest Rate | |||||||||||
Fixed | $ | 747,379 | 3.66 | % | $ | 748,232 | 3.66 | % | ||||||
Variable | 117,680 | 3.40 | 137,680 | 3.06 | ||||||||||
Total | $ | 865,059 | 3.63 | % | $ | 885,912 | 3.57 | % | ||||||
Covenants
At March 31, 2018, we were in compliance with all debt covenants.
Other Sources
On January 16, 2015, our First Extended Public Offering registration statement was declared effective with the SEC (Commission File No. 333-196886) to register up to $2,700,000 in any combination of shares of our Class A, Class M, Class A-I and Class M-I common stock, consisting of up to $2,400,000 of shares offered in our primary offering and up to $300,000 in shares offered pursuant to our distribution reinvestment plan. We intend to offer shares of our common stock on a continuous basis for an indefinite period of time by filing a new registration statement before the end of each three-year offering period, subject to regulatory approval. We intend to use the net proceeds from the First Extended Public Offering, which are not used to pay the fees and other expenses attributable to our operations, to (1) grow and further diversify our portfolio by making investments in accordance with our investment strategy and policies, (2) repay indebtedness incurred under various financing instruments and (3) fund repurchases under our share repurchase plan.
On March 3, 2015, we commenced the Private Offering of up to $350,000 in shares of our Class D common stock with an indefinite duration. Proceeds from our Private Offering will be used for the same corporate purposes as the proceeds of our First Extended Public Offering. We will reserve the right to terminate the Private Offering at any time and to extend the Private Offering term to the extent permissible under applicable law.
On January 12, 2018, we filed a registration statement on Form S-11 with the SEC (Commission File No. 333-222533) to register our Second Extended Public Offering of $3,000,000 in any combination of shares of our Class A, Class M, Class A-I and Class M-I common stock, consisting of up to $2,700,000 of shares offered in our primary offering and up to $300,000 in shares offered pursuant to our distribution reinvestment plan. As of May 11, 2018, the Second Extended Public Offering has not been declared effective. Proceeds from our Second Extended Public Offering will be used for the same corporate purposes as the proceeds of the First Extended Public Offering.
Contractual Cash Obligations and Commitments
From time to time, we enter into contingent agreements for the acquisition and financing of properties. Such acquisitions and financings are subject to satisfactory completion of due diligence or meeting certain leasing or occupancy thresholds.
We are subject to fixed ground lease payments on South Beach Parking Garage of $100 per year until September 30, 2021 and these payments will increase every five years thereafter by the lesser of 12% or the cumulative CPI over the previous five year period. We are also subject to a variable ground lease payment calculated as 2.5% of revenue. The lease expires September 30, 2041 and has a ten-year renewal option.
The operating agreement for Townlake of Coppell allows the unrelated third party joint venture partner, owning a 10% interest, to put their interest to us at a market determined value for a period of 90 days beginning in 2019.
36
Off Balance Sheet Arrangements
At March 31, 2018, we had approximately $109 in an outstanding letter of credit which is not reflected on our balance sheet. We have no other off balance sheet arrangements.
37
Distributions to Stockholders
To remain qualified as a REIT for federal income tax purposes, we must distribute or pay tax on 100% of our capital gains and distribute at least 90% of ordinary taxable income to stockholders.
The following factors, among others, will affect operating cash flow and, accordingly, influence the decisions of our board of directors regarding distributions:
• | scheduled increases in base rents of existing leases; |
• | changes in minimum base rents and/or overage rents attributable to replacement of existing leases with new or renewal leases; |
• | changes in occupancy rates at existing properties and procurement of leases for newly acquired or developed properties; |
• | necessary capital improvement expenditures or debt repayments at existing properties; and |
• | our share of distributions of operating cash flow generated by the unconsolidated real estate affiliates, less management costs and debt service on additional loans that have been or will be incurred. |
We anticipate that operating cash flow, cash on hand, proceeds from dispositions of real estate investments or refinancings will provide adequate liquidity to conduct our operations, fund general and administrative expenses, fund operating costs and interest payments and allow distributions to our stockholders in accordance with the REIT qualification requirements of the Internal Revenue Code of 1986, as amended.
Recently Issued Accounting Pronouncements
In February 2016, the FASB issued Accounting Standard Update 2016-02 Leases (ASC 842), which sets out the principles for the recognition, measurement, presentation and disclosure of leases for both parties to a contract (i.e. lessees and lessors). The FASB also issued an Exposure Draft on January 5, 2018 proposing to amend ASU 2016-02, which would provide lessors with a practical expedient, by class of underlying assets, to not separate non-lease components from the related lease components and, instead, to account for those components as a single lease component, if certain criteria are met. The new standard requires lessors to account for leases using an approach that is substantially equivalent to existing guidance for sales-type leases, direct financing leases and operating leases. The new standard requires lessees to apply a dual approach, classifying leases as either finance or operating leases based on the principle of whether or not the lease is effectively a financed purchase by the lessee. This classification will determine whether lease expense is recognized based on an effective interest method or on a straight line basis over the term of the lease. A lessee is also required to record a right-of-use asset and a lease liability for all leases with a term of greater than 12 months regardless of their classification. Leases with a term of 12 months or less will be accounted for similar to existing guidance for operating leases today. The update is expected to impact our consolidated financial statements as we have a ground lease arrangement for which we are the lessee. ASC 842 supersedes the previous leases standard, ASC 840 Leases. The standard is effective on January 1, 2019, with early adoption permitted. We currently believe the adoption of the standard will not have a material impact for leases where we are the lessor. We are the lessee on one ground lease which will require us to record a right-of-use asset and a lease liability. We have preliminarily concluded that the adoption of the standard will not have a material impact on the consolidated financial statements for leases where we are the lessee.
Item 3. | Quantitative and Qualitative Disclosures About Market Risk. |
We are subject to market risk associated with changes in interest rates in terms of our variable-rate debt and the price of new fixed-rate debt for refinancing of existing debt. We manage our interest rate risk exposure by obtaining fixed-rate loans where possible as well as by entering into interest rate cap and swap agreements. As of March 31, 2018, we had consolidated debt of $865,059, which included $117,680 of variable-rate debt. Including the $6,609 net debt discount on assumed debt and debt issuance costs, we have consolidated debt of $858,450 at March 31, 2018. We also entered into interest rate cap and swap agreements on $189,080 of debt which cap the LIBOR rate at between 1.0% and 3.3%. A 0.25% movement in the interest rate on the $117,680 of variable-rate debt would have resulted in a $294 annualized increase or decrease in consolidated interest expense and cash flow from operating activities.
38
We are subject to interest rate risk with respect to our fixed-rate financing in that changes in interest rates will impact the fair value of our fixed-rate financing. To determine fair market value, the fixed-rate debt is discounted at a rate based on an estimate of current lending rates, assuming the debt is outstanding through maturity and considering the collateral. At March 31, 2018, the fair value of our mortgage notes payable was estimated to be $8,052 lower than the carrying value of $865,059. If treasury rates were 0.25% higher at March 31, 2018, the fair value of our mortgage notes payable would have been $18,712 lower than the carrying value.
Item 4. | Controls and Procedures. |
Evaluation of Disclosure Controls and Procedures
Under the supervision and with the participation of our management, including our chief executive officer and chief financial officer, we conducted an evaluation of the effectiveness of the design and operation of our disclosure controls and procedures (as defined in Rules 13a-15(e) and 15d-15(e) under the Exchange Act), as of the end of the period covered by this report. Based on management’s evaluation as of March 31, 2018, our chief executive officer and chief financial officer concluded that our disclosure controls and procedures were effective to provide reasonable assurance that the information required to be disclosed by us in our reports that we file or submit under the Exchange Act is recorded, processed, summarized and reported within the time periods specified in the SEC’s rules and forms and such information is accumulated and communicated to management, including our chief executive officer and chief financial officer, as appropriate, to allow timely decisions regarding required disclosure.
Changes in Internal Control Over Financial Reporting
There were no changes to our internal control over financial reporting during the quarter ended March 31, 2018 that have materially affected, or are reasonably likely to materially affect, our internal control over financial reporting.
PART II
OTHER INFORMATION
Item 1. | Legal Proceedings. |
We are involved in various claims and litigation matters arising in the ordinary course of business, some of which involve claims for damages. Many of these matters are covered by insurance, although they may nevertheless be subject to deductibles or retentions. Although the ultimate liability for these matters cannot be determined, based upon information currently available, we believe the ultimate resolution of such claims and litigation will not have a material adverse effect on our financial position, results of operations or liquidity.
Item 1A. | Risk Factors. |
The most significant risk factors applicable to the Company are described in Item 1A to our 2017 Form 10-K. There have been no material changes to those previously-disclosed risk factors.
Item 2. | Unregistered Sales of Equity Securities and Use of Proceeds. |
ISSUER PURCHASES OF EQUITY SECURITIES
Share Repurchase Plan
Our share repurchase plan limits repurchases during any calendar quarter to shares with an aggregate value (based on the repurchase price per share on the day the repurchase is effected) of 5% of the combined NAV of all classes of shares as of the last day of the previous calendar quarter, which means that in any 12-month period, we limit repurchases to approximately 20% of our total NAV. If the quarterly volume limitation is reached on or before the third business day of a calendar quarter, repurchase requests during the next quarter will be satisfied on a stockholder by stockholder basis, which we refer to as a “per stockholder allocation,” instead of a first-come, first-served basis. Pursuant to the per stockholder allocation, each of our stockholders would be allowed to request repurchase at any time during such quarter of a total number of shares not to exceed 5% of the shares of common stock the stockholder held as of the end of the prior quarter. The per stockholder allocation requirement will remain in effect for each succeeding quarter for which the total repurchases for the immediately preceding
39
quarter exceeded four percent of our NAV on the last business day of such preceding quarter. If total repurchases during a quarter for which the per stockholder allocation applies are equal to or less than four percent of our NAV on the last business day of such preceding quarter, then repurchases will again be first-come, first-served for the next succeeding quarter and each quarter thereafter.
During the three months ended March 31, 2018, we repurchased 1,943,028 shares of common stock under the share repurchase plan.
Period | Total Number of Shares Redeemed | Average Price Paid per Share | Total Number of Shares Purchased as Part of Publicly Announced Plans or Programs | Maximum Number of Shares that May Yet Be Purchased Pursuant to the Program (1) | ||||
January 1 - January 31, 2018 | 1,214,709 | $11.71 | 1,214,709 | — | ||||
February 1 - February 28, 2018 | 351,646 | 11.73 | 351,646 | — | ||||
March 1 - March 31, 2018 | 376,673 | 11.77 | 376,673 | — | ||||
(1) Redemptions are limited as described above.
UNREGISTERED SALES OF EQUITY SECURITIES
On March 3, 2015, we commenced the Private Offering of up to $350,000 in shares of our Class D common stock with an indefinite duration. No Class D shares were issued during the three months ended March 31, 2018.
Item 3. | Defaults Upon Senior Securities. |
Not applicable.
Item 4. | Mine Safety Disclosures. |
Not applicable.
Item 5. | Other Information. |
None.
Item 6. | Exhibits. |
Exhibit No. | Description | |
Certification of Chief Executive Officer Pursuant to Section 302 of the Sarbanes-Oxley Act of 2002. | ||
Certification of Chief Financial Officer Pursuant to Section 302 of the Sarbanes-Oxley Act of 2002. | ||
Certification of Chief Executive Officer Pursuant to Section 906 of the Sarbanes-Oxley Act of 2002. | ||
Certification of Chief Financial Officer Pursuant to Section 906 of the Sarbanes-Oxley Act of 2002. | ||
101.INS | XBRL Instance Document | |
101.SCH | XBRL Schema Document | |
101.CAL | XBRL Calculation Linkbase Document | |
101.DEF | Definition Linkbase Document | |
101.LAB | XBRL Labels Linkbase Document | |
101.PRE | XBRL Presentation Linkbase Document | |
40
SIGNATURES
Pursuant to the requirements of Section 13 or 15(d) of the Securities Exchange Act of 1934, the Registrant, Jones Lang LaSalle Income Property Trust, Inc., has duly caused this report to be signed on its behalf by the undersigned, thereunto duly authorized.
JONES LANG LASALLE INCOME PROPERTY TRUST, INC. | |||
Date: | May 11, 2018 | By: | /s/ C. Allan Swaringen |
C. Allan Swaringen | |||
President, Chief Executive Officer | |||
JONES LANG LASALLE INCOME PROPERTY TRUST, INC. | |||
Date: | May 11, 2018 | By: | /s/ Gregory A. Falk |
Gregory A. Falk | |||
Chief Financial Officer and Treasurer | |||
41