Attached files
| file | filename |
|---|---|
| 8-K - 8-K MAY 2018 CHFC INVESTOR PRESENTATION - TCF FINANCIAL CORP | a8-kmay2018investorpresent.htm |

Realizing our Ever Greater David T. Provost Potential Chief Executive Officer Thomas C. Shafer Vice Chairman, Chief Executive Officer of Chemical Bank Dennis L. Klaeser EVP and Chief Financial Officer Katie S. Wendt EVP and Chief Accounting Officer
Forward-Looking Statements This presentation and the accompanying presentation by management contains forward-looking statements that are based on management's beliefs, assumptions, current expectations, estimates and projections about the financial services industry, the economy and Chemical Financial Corporation ("Chemical"). Words and phrases such as "anticipates," "believes," "continue," "estimates," "expects," "forecasts," "future," "intends," "is likely," "judgment," "look ahead," "look forward," "on schedule," "on track," "opinion," "opportunity," "plans," "potential," "predicts," "probable," "projects," "should," "strategic," "trend," "will," and variations of such words and phrases or similar expressions are intended to identify such forward- looking statements. These statements include, among others, statements regarding our core strategies and disciplines, statements about our big four initiatives and the implementation thereof and other statements about expected developments or events. All statements referencing future time periods are forward-looking. Management's determination of the provision and allowance for loan losses; the carrying value of acquired loans, goodwill and mortgage servicing rights; the fair value of investment securities (including whether any impairment on any investment security is temporary or other-than-temporary and the amount of any impairment); and management's assumptions concerning pension and other postretirement benefit plans involve judgments that are inherently forward-looking. There can be no assurance that future loan losses will be limited to the amounts estimated. All of the information concerning interest rate sensitivity is forward-looking. The future effect of changes in the financial and credit markets and the national and regional economies on the banking industry, generally, and on Chemical, specifically, are also inherently uncertain. Forward-looking statements are based upon current beliefs and expectations and involve substantial risks and uncertainties that could cause actual results to differ materially from those expressed or implied by such forward-looking statements. Accordingly, such statements are not guarantees of future performance and involve certain risks, uncertainties and assumptions ("risk factors") that are difficult to predict with regard to timing, extent, likelihood and degree of occurrence. Therefore, actual results and outcomes may materially differ from what may be expressed or forecasted in such forward-looking statements. Chemical undertakes no obligation to update, amend or clarify forward-looking statements, whether as a result of new information, future events or otherwise. Risk factors include, without limitation: • Chemical's ability to attract and retain new commercial lenders and other bankers as well as key operations staff in light of competition for experienced employees in the banking industry; • Operational and regulatory challenges associated with our information technology system and policies and procedures in light of our rapid growth and pending systems conversion in 2018; • Chemical's ability to grow its deposits while reducing the number of physical branches that it operates; • Economic conditions (both generally and in our markets) may be less favorable than expected, which could result in, among other things, a deterioration in credit quality, a reduction in demand for credit and a decline in real estate values; • A general decline in the real estate and lending markets, particularly in our market areas, could negatively affect our financial results; • Increased cybersecurity risk, including potential network breaches, business disruptions, or financial losses; • Restrictions or condition imposed by our regulators on our operations may make it more difficult for us to achieve our goals or obtain regulatory approvals for future acquisitions; • Legislative or regulatory changes, including changes in accounting standards and compliance requirements, may adversely affect us; • Changes in the interest rate environment may reduce margins or the volumes or values of the loans we make or have acquired; and • Economic, governmental, or other factors may prevent the projected population, residential, and commercial growth in the markets in which we operate. In addition, risk factors include, but are not limited to, the risk factors described in Item 1A of Chemical’s most recent Annual Report on Form 10-K or disclosed in documents filed or furnished by the Company with or to the SEC after the filing of such Annual Report on Form 10-K. These and other factors are representative of the risk factors that may emerge and could cause a difference between an ultimate actual outcome and a preceding forward-looking statement.
Non-GAAP Financial Measures Non-GAAP Financial Measures This presentation and the accompanying presentation by management contain certain non-GAAP financial disclosures that are not in accordance with U.S. generally accepted accounting principles ("GAAP"). Such non-GAAP financial measures include Chemical’s tangible shareholders' equity to tangible assets ratio, tangible book value per share, presentation of net interest income and net interest margin on a fully taxable equivalent basis, operating expenses-core (which excludes merger and restructuring expenses and impairment of income tax credits), operating expenses-efficiency ratio (which excludes merger and restructuring expenses, impairment of income tax credits and amortization of intangibles), the adjusted efficiency ratio (which excludes significant items, merger and restructuring expenses, impairment of income tax credits, loan servicing rights change in fair value gains (losses), amortization of intangibles, net interest income FTE adjustments, (losses) gains from sale of investment securities and closed branch locations) and other information presented excluding significant items, including net income, diluted earnings per share, return on average assets and return on average shareholders' equity. Chemical uses non-GAAP financial measures to provide meaningful, supplemental information regarding its operational results and to enhance investors’ overall understanding of Chemical’s financial performance. The limitations associated with non-GAAP financial measures include the risk that persons might disagree as to the appropriateness of items comprising these measures and that different companies might calculate these measures differently. These disclosures should not be considered an alternative to Chemical’s GAAP results. See the Appendix included with this presentation for a reconciliation of the non-GAAP financial measures to the most directly comparable GAAP financial measures. 3
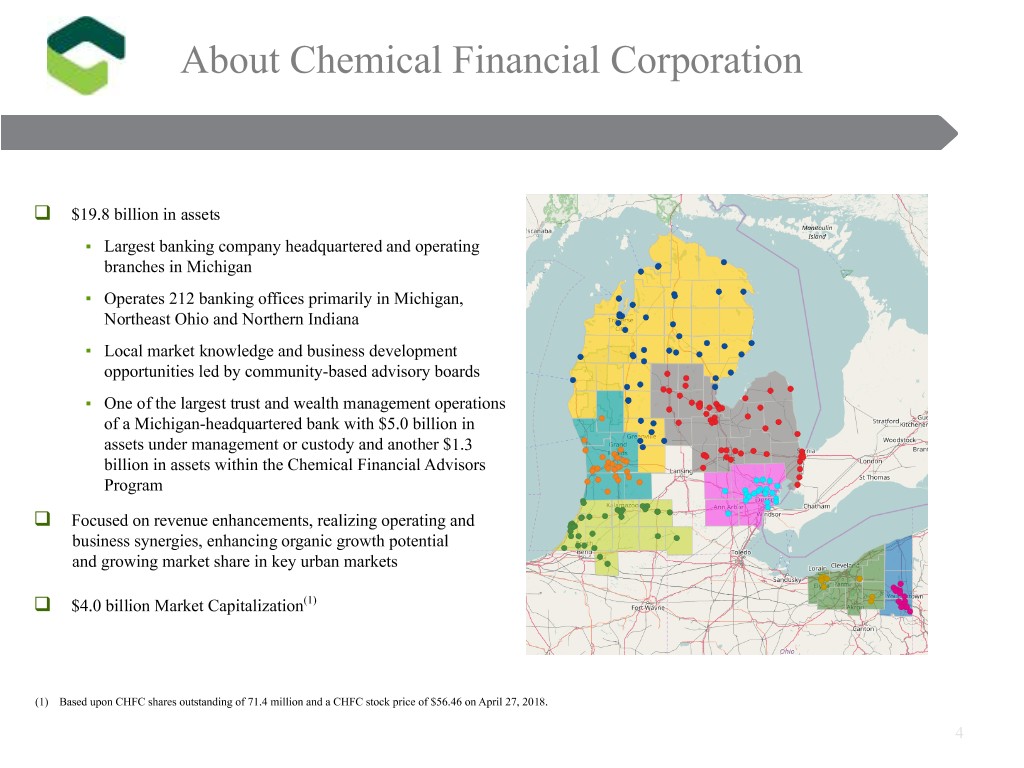
About Chemical Financial Corporation q $19.8 billion in assets ▪ Largest banking company headquartered and operating branches in Michigan ▪ Operates 212 banking offices primarily in Michigan, Northeast Ohio and Northern Indiana ▪ Local market knowledge and business development opportunities led by community-based advisory boards ▪ One of the largest trust and wealth management operations of a Michigan-headquartered bank with $5.0 billion in assets under management or custody and another $1.3 billion in assets within the Chemical Financial Advisors Program q Focused on revenue enhancements, realizing operating and business synergies, enhancing organic growth potential and growing market share in key urban markets q $4.0 billion Market Capitalization(1) (1) Based upon CHFC shares outstanding of 71.4 million and a CHFC stock price of $56.46 on April 27, 2018. 4

Overview [Map on left side of page, Emphasize our strategy of ü The largest banking company headquartered in Michigan being the Premier Midwest 1 ü Scalable core strategies and disciplines Community Bank same style. ü Proven organic growth initiatives Demonstrated track record of (1) 2 ü Leadership in EPS growth among peers organic growth ü Total return out-performed (peers and indices) (1) [same setup, ü ROAA 1.44%, ROAE 10.5%, ROATCE(2) 18.6%, low efficiency ratio 3 Strong performance metrics and ü Delivering on projected merger benefits profitability should drive upside ü Consistent EPS growth performance Ohio / ü Market share growth ü Revenue enhancements Michigan Realizing our ever greater potential 4 ü Concentrate on achieving cost savings and exploiting business synergy opportunities ü Continue to build out and enhance risk management practices and then regional (1) Source: S&P Global Market Intelligence (2) ROATCE is a non-GAAP financial measure. Refer to the Appendix for a reconciliation of non-GAAP financial measures. 5 markets (same as following page) Show: Rank, branches, dms, market share Show: GDP For each state and % of gdp in each region, same
Scalable Core Strategies & Disciplines q “Local” community bank ▪ Strong belief in the community banking concept ▪ Community-driven leadership, rapid local response ▪ Emphasis on building relationships ▪ We know our markets; what works, and what does not work q Strong credit culture ▪ Diversification ▪ In-depth knowledge of our customers and markets ▪ Underwriting discipline q Low cost, stable, core funding – starts at relationship level q Expense management and control q Clean balance sheet, solid capital ratios and intense focus on effective capital deployment q Identify, hire, motivate and retain talented individuals to carry out our relationship strategies q Sustain long-term growth through combination of organic and acquisitive growth ▪ Higher lending limits provide enhanced middle market lending growth opportunities ▪ Opportunities for fee income growth from Wealth Management and Mortgage Banking synergies ▪ Enhancing preparedness for future acquisitive growth opportunities in Michigan, Ohio, and Indiana 6
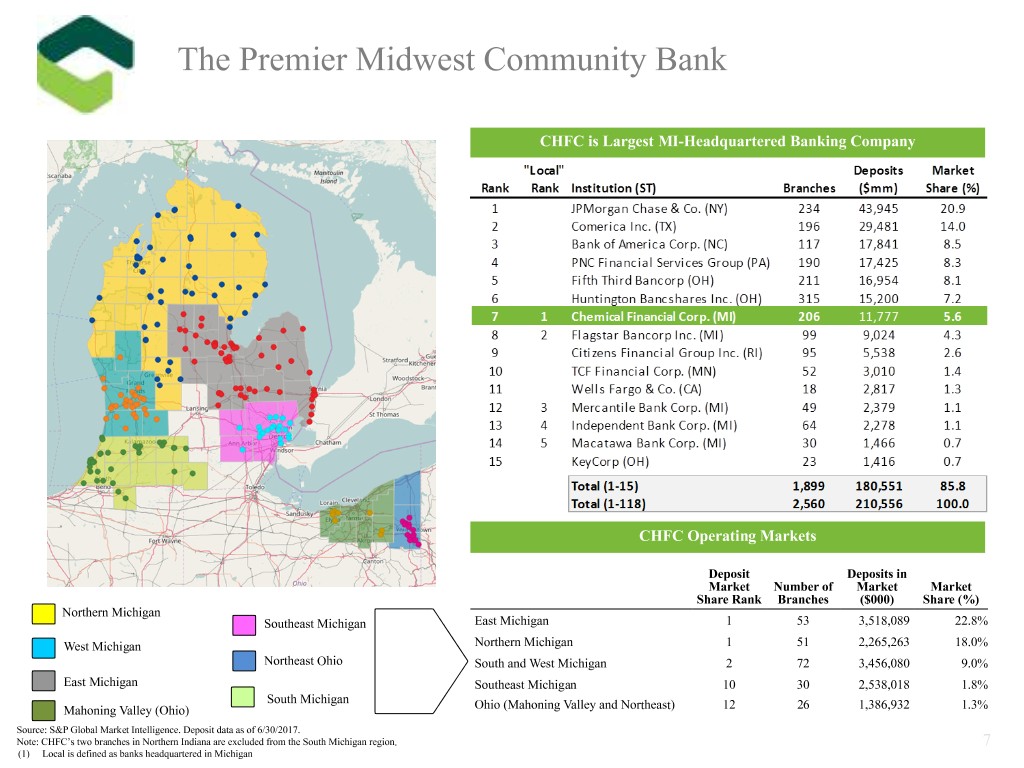
The Premier Midwest Community Bank CHFC is Largest MI-Headquartered Banking Company CHFC Operating Markets Deposit Deposits in Market Number of Market Market Share Rank Branches ($000) Share (%) Northern Michigan Southeast Michigan East Michigan 1 53 3,518,089 22.8% West Michigan Northern Michigan 1 51 2,265,263 18.0% Northeast Ohio South and West Michigan 2 72 3,456,080 9.0% East Michigan Southeast Michigan 10 30 2,538,018 1.8% South Michigan Mahoning Valley (Ohio) Ohio (Mahoning Valley and Northeast) 12 26 1,386,932 1.3% Source: S&P Global Market Intelligence. Deposit data as of 6/30/2017. Note: CHFC’s two branches in Northern Indiana are excluded from the South Michigan region. 7 (1) Local is defined as banks headquartered in Michigan
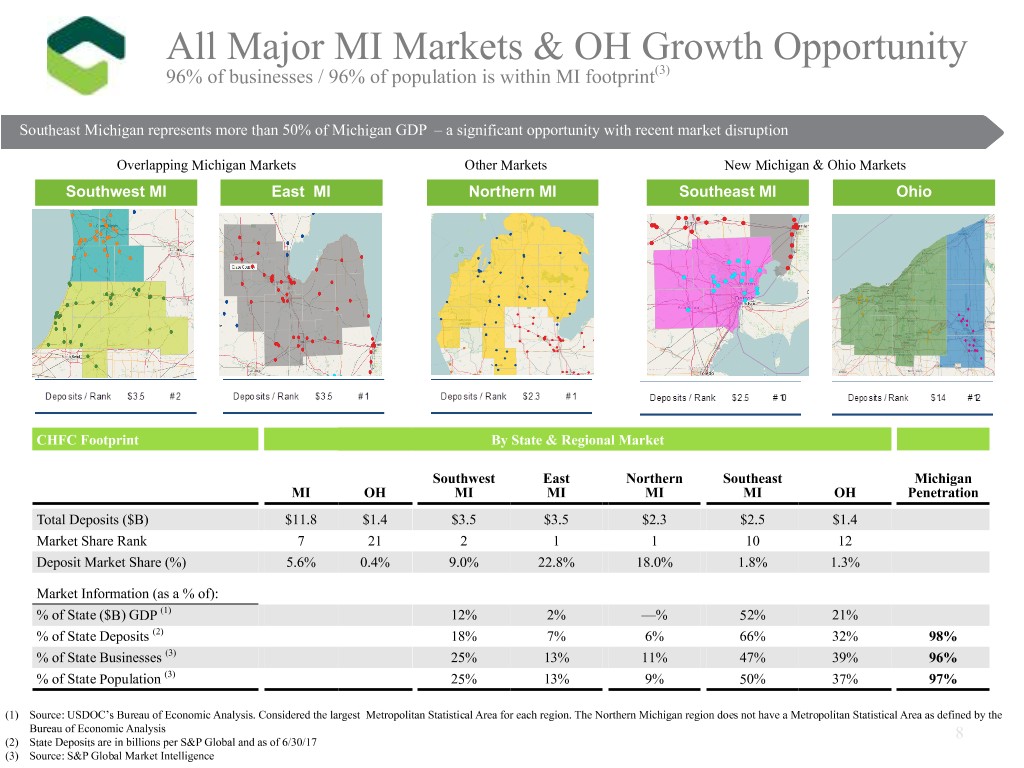
All Major MI Markets & OH Growth Opportunity 96% of businesses / 96% of population is within MI footprint(3) Southeast Michigan represents more than 50% of Michigan GDP – a significant opportunity with recent market disruption Overlapping Michigan Markets Other Markets New Michigan & Ohio Markets Southwest MI East MI Northern MI Southeast MI Ohio CHFC Footprint By State & Regional Market Southwest East Northern Southeast Michigan MI OH MI MI MI MI OH Penetration Total Deposits ($B) $11.8 $1.4 $3.5 $3.5 $2.3 $2.5 $1.4 Market Share Rank 7 21 2 1 1 10 12 Deposit Market Share (%) 5.6% 0.4% 9.0% 22.8% 18.0% 1.8% 1.3% Market Information (as a % of): % of State ($B) GDP (1) 12% 2% —% 52% 21% % of State Deposits (2) 18% 7% 6% 66% 32% 98% % of State Businesses (3) 25% 13% 11% 47% 39% 96% % of State Population (3) 25% 13% 9% 50% 37% 97% (1) Source: USDOC’s Bureau of Economic Analysis. Considered the largest Metropolitan Statistical Area for each region. The Northern Michigan region does not have a Metropolitan Statistical Area as defined by the Bureau of Economic Analysis 8 (2) State Deposits are in billions per S&P Global and as of 6/30/17 (3) Source: S&P Global Market Intelligence
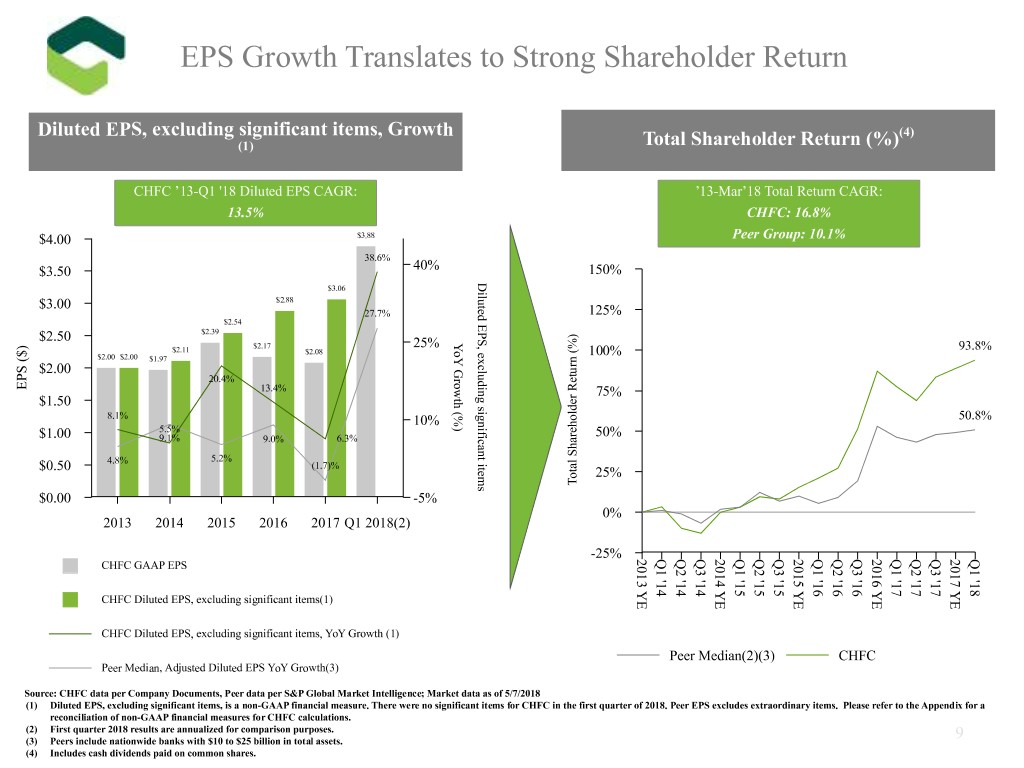
EPS Growth Translates to Strong Shareholder Return Diluted EPS, excluding significant items, Growth (4) (1) Total Shareholder Return (%) CHFC ’13-Q1 '18 Diluted EPS CAGR: ’13-Mar’18 Total Return CAGR: 13.5% CHFC: 16.8% $4.00 $3.88 Peer Group: 10.1% 38.6% $3.50 40% 150% Diluted EPS, excluding significant items $3.06 $3.00 $2.88 27.7% 125% $2.54 $2.39 $2.50 YoY Growth (%) ) $2.17 25% $2.11 $2.08 93.8% $ $2.00 $2.00 100% ( $1.97 S $2.00 P 20.4% E 13.4% 75% $1.50 8.1% 10% 50.8% 5.5% $1.00 9.1% 9.0% 6.3% 50% 4.8% 5.2% $0.50 (1.7)% 25% Total Shareholder Return (%) Total $0.00 -5% 0% 2013 2014 2015 2016 2017 Q1 2018(2) -25% 2 Q Q Q 2 Q Q Q 2 Q Q Q 2 Q Q Q 2 Q 0 0 0 0 0 CHFC GAAP EPS 1 2 3 1 2 3 1 2 3 1 2 3 1 1 1 1 1 1 ' ' ' ' ' ' ' ' ' ' ' ' ' 3 4 5 6 7 1 1 1 1 1 1 1 1 1 1 1 1 1 4 4 4 5 5 5 6 6 6 7 7 7 8 Y Y Y Y Y CHFC Diluted EPS, excluding significant items(1) E E E E E CHFC Diluted EPS, excluding significant items, YoY Growth (1) Peer Median(2)(3) CHFC Peer Median, Adjusted Diluted EPS YoY Growth(3) Source: CHFC data per Company Documents, Peer data per S&P Global Market Intelligence; Market data as of 5/7/2018 (1) Diluted EPS, excluding significant items, is a non-GAAP financial measure. There were no significant items for CHFC in the first quarter of 2018. Peer EPS excludes extraordinary items. Please refer to the Appendix for a reconciliation of non-GAAP financial measures for CHFC calculations. (2) First quarter 2018 results are annualized for comparison purposes. (3) Peers include nationwide banks with $10 to $25 billion in total assets. 9 (4) Includes cash dividends paid on common shares.
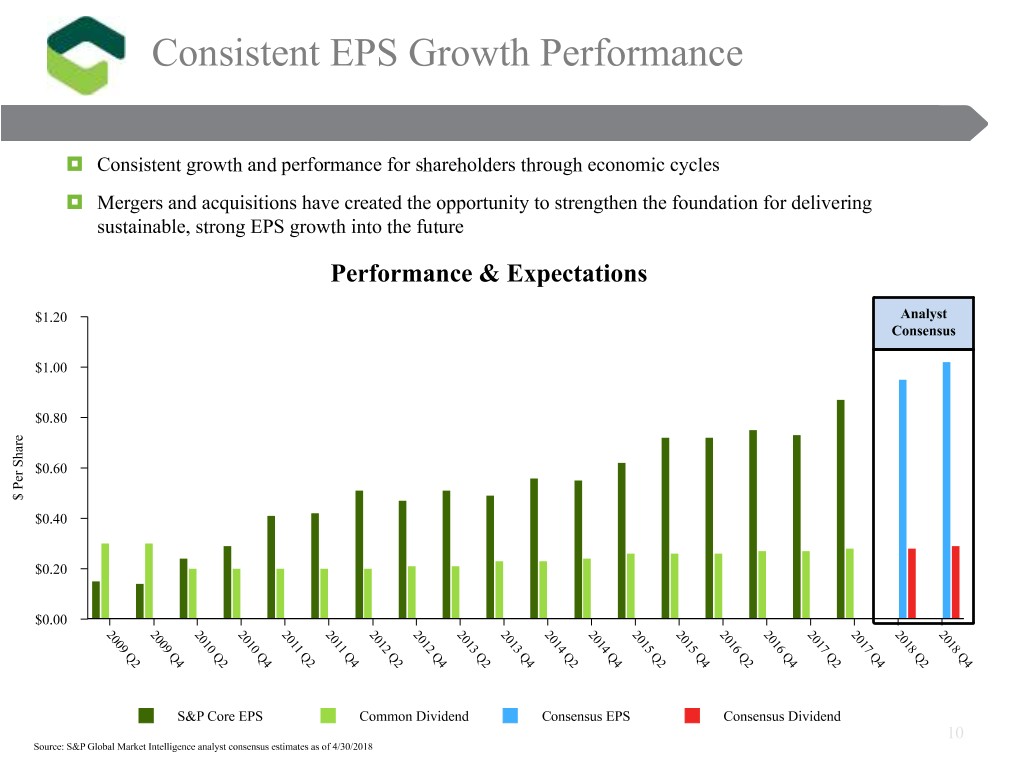
Consistent EPS Growth Performance Consistent EPS Growth Performance • Consistent growth and performance for shareholders through economic cycles • Mergers and acquisitions have created the opportunity to strengthen the foundation for delivering sustainable, strong EPS growth into the future Performance & Expectations $1.20 Analyst Consensus $1.00 $0.80 e r a h S r $0.60 e P $ $0.40 $0.20 $0.00 2 2 2 2 2 2 2 2 2 2 2 2 2 2 2 2 2 2 2 2 0 0 0 0 0 0 0 0 0 0 0 0 0 0 0 0 0 0 0 0 0 0 1 1 1 1 1 1 1 1 1 1 1 1 1 1 1 1 1 1 9 9 0 0 1 1 2 2 3 3 4 4 5 5 6 6 7 7 8 8 Q Q Q Q Q Q Q Q Q Q Q Q Q Q Q Q Q Q Q Q 2 4 2 4 2 4 2 4 2 4 2 4 2 4 2 4 2 4 2 4 S&P Core EPS Common Dividend Consensus EPS Consensus Dividend 10 Source: S&P Global Market Intelligence analyst consensus estimates as of 4/30/2018
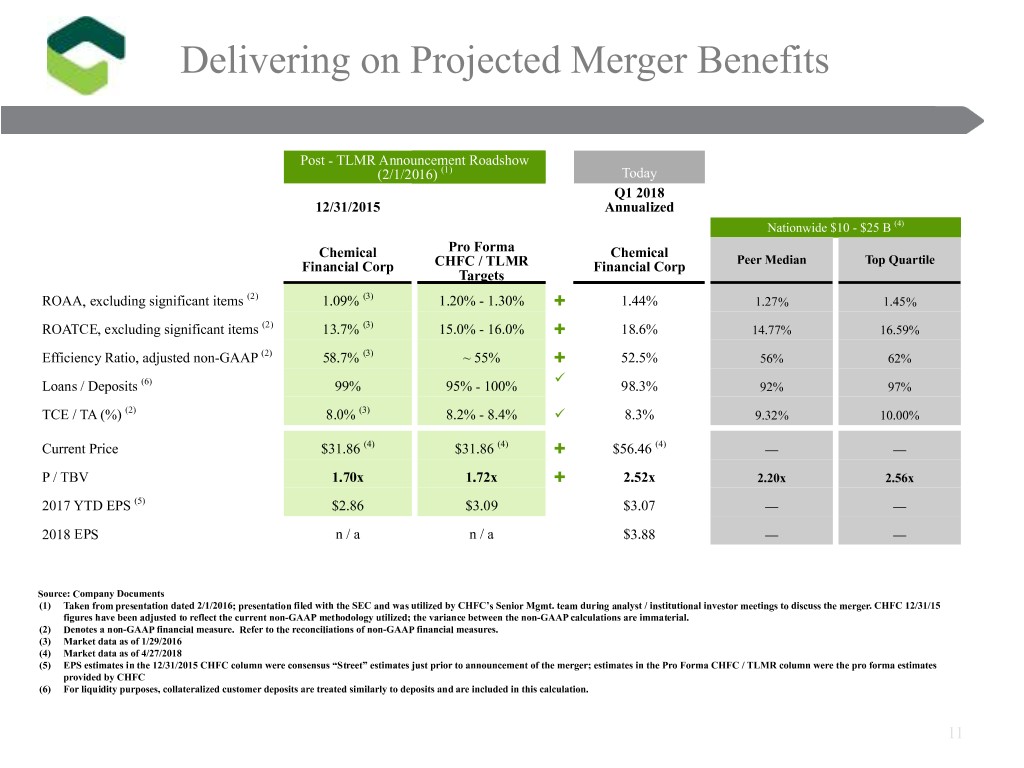
Delivering on Projected Merger Benefits Post - TLMR Announcement Roadshow (2/1/2016) (1) Today Q1 2018 12/31/2015 Annualized Nationwide $10 - $25 B (4) Chemical Pro Forma Chemical Financial Corp CHFC / TLMR Financial Corp Peer Median Top Quartile Targets ROAA, excluding significant items (2) 1.09% (3) 1.20% - 1.30% À 1.44% 1.27% 1.45% ROATCE, excluding significant items (2) 13.7% (3) 15.0% - 16.0% À 18.6% 14.77% 16.59% Efficiency Ratio, adjusted non-GAAP (2) 58.7% (3) ~ 55% À 52.5% 56% 62% ü Loans / Deposits (6) 99% 95% - 100% 98.3% 92% 97% TCE / TA (%) (2) 8.0% (3) 8.2% - 8.4% ü 8.3% 9.32% 10.00% Current Price $31.86 (4) $31.86 (4) À $56.46 (4) — — P / TBV 1.70x 1.72x À 2.52x 2.20x 2.56x 2017 YTD EPS (5) $2.86 $3.09 $3.07 — — 2018 EPS n / a n / a $3.88 — — Source: Company Documents (1) Taken from presentation dated 2/1/2016; presentation filed with the SEC and was utilized by CHFC’s Senior Mgmt. team during analyst / institutional investor meetings to discuss the merger. CHFC 12/31/15 figures have been adjusted to reflect the current non-GAAP methodology utilized; the variance between the non-GAAP calculations are immaterial. (2) Denotes a non-GAAP financial measure. Refer to the reconciliations of non-GAAP financial measures. (3) Market data as of 1/29/2016 (4) Market data as of 4/27/2018 (5) EPS estimates in the 12/31/2015 CHFC column were consensus “Street” estimates just prior to announcement of the merger; estimates in the Pro Forma CHFC / TLMR column were the pro forma estimates provided by CHFC (6) For liquidity purposes, collateralized customer deposits are treated similarly to deposits and are included in this calculation. 11
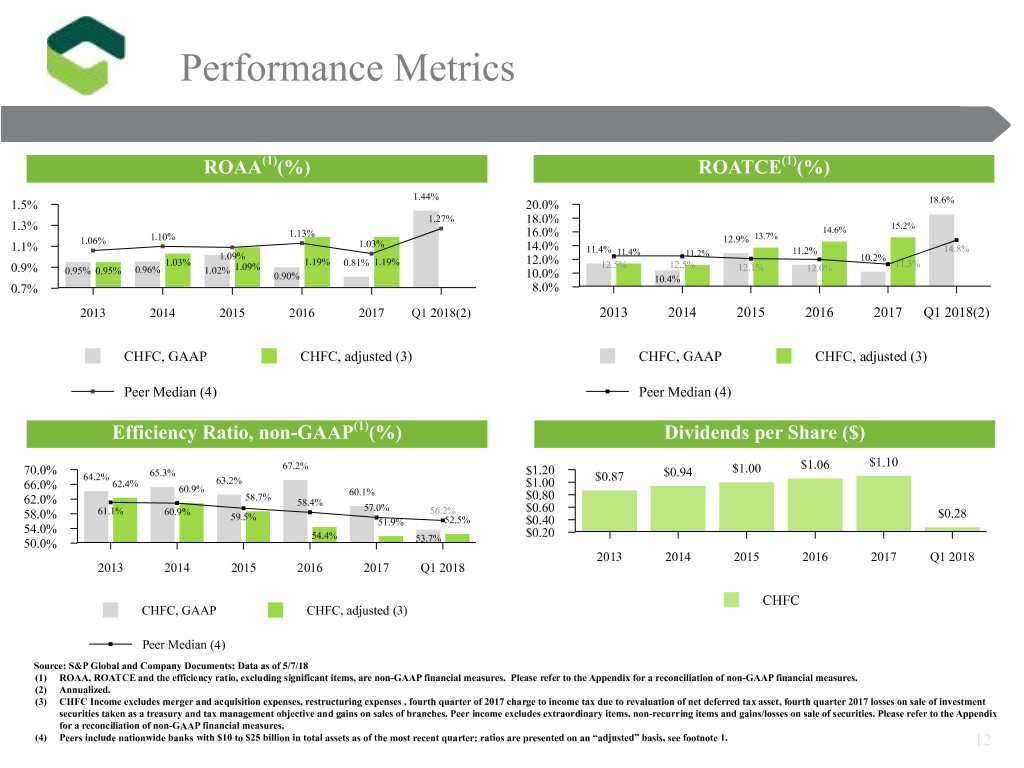
Performance Metrics ROAA(1)(%) ROATCE(1)(%) 1.44% 1.5% 20.0% 18.6% 1.27% 18.0% 1.3% 14.6% 15.2% 1.10% 1.13% 16.0% 13.7% 1.06% 1.03% 12.9% 1.1% 14.0% 11.4% 11.4% 11.2% 14.8% 1.09% 11.2% 10.2% 1.03% 1.19% 0.81% 1.19% 12.0% 12.5% 12.5% 11.3% 0.9% 0.95% 0.95% 0.96% 1.02% 1.09% 12.1% 12.0% 0.90% 10.0% 10.4% 0.7% 8.0% 2013 2014 2015 2016 2017 Q1 2018(2) 2013 2014 2015 2016 2017 Q1 2018(2) CHFC, GAAP CHFC, adjusted (3) CHFC, GAAP CHFC, adjusted (3) Peer Median (4) Peer Median (4) Efficiency Ratio, non-GAAP(1)(%) Dividends per Share ($) $1.10 70.0% 67.2% $1.20 $1.00 $1.06 64.2% 65.3% $0.87 $0.94 66.0% 62.4% 63.2% $1.00 60.9% 60.1% 58.7% $0.80 62.0% 58.4% 61.1% 60.9% 57.0% 56.2% $0.60 58.0% 59.5% $0.28 51.9% 52.5% $0.40 54.0% 54.4% $0.20 50.0% 53.7% 2013 2014 2015 2016 2017 Q1 2018 2013 2014 2015 2016 2017 Q1 2018 CHFC CHFC, GAAP CHFC, adjusted (3) Peer Median (4) Source: S&P Global and Company Documents; Data as of 5/7/18 (1) ROAA, ROATCE and the efficiency ratio, excluding significant items, are non-GAAP financial measures. Please refer to the Appendix for a reconciliation of non-GAAP financial measures. (2) Annualized. (3) CHFC Income excludes merger and acquisition expenses, restructuring expenses , fourth quarter of 2017 charge to income tax due to revaluation of net deferred tax asset, fourth quarter 2017 losses on sale of investment securities taken as a treasury and tax management objective and gains on sales of branches. Peer income excludes extraordinary items, non-recurring items and gains/losses on sale of securities. Please refer to the Appendix for a reconciliation of non-GAAP financial measures. (4) Peers include nationwide banks with $10 to $25 billion in total assets as of the most recent quarter; ratios are presented on an “adjusted” basis, see footnote 1. 12
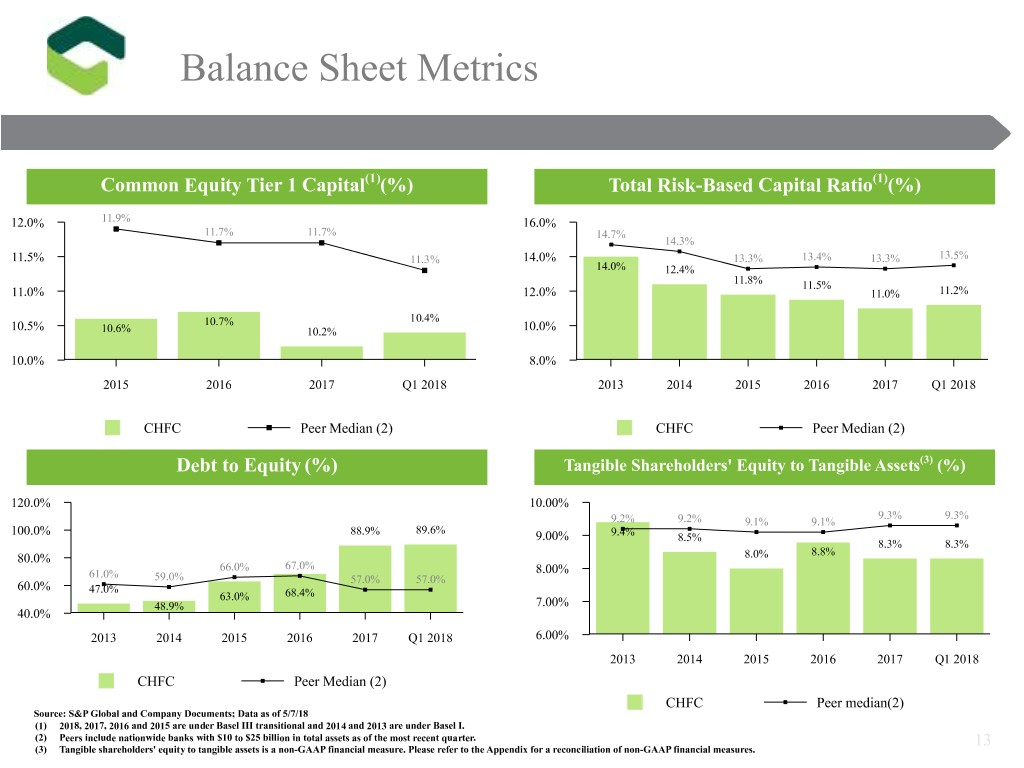
Balance Sheet Metrics Common Equity Tier 1 Capital(1)(%) Total Risk-Based Capital Ratio(1)(%) 12.0% 11.9% 16.0% 11.7% 11.7% 14.7% 14.3% 11.5% 11.3% 14.0% 13.3% 13.4% 13.3% 13.5% 14.0% 12.4% 11.8% 11.5% 11.0% 12.0% 11.0% 11.2% 10.7% 10.4% 10.5% 10.6% 10.2% 10.0% 10.0% 8.0% 2015 2016 2017 Q1 2018 2013 2014 2015 2016 2017 Q1 2018 CHFC Peer Median (2) CHFC Peer Median (2) Debt to Equity (%) Tangible Shareholders' Equity to Tangible Assets(3) (%) 120.0% 10.00% 9.3% 9.3% 9.2% 9.2% 9.1% 9.1% 100.0% 88.9% 89.6% 9.00% 9.4% 8.5% 8.3% 8.3% 8.8% 80.0% 8.0% 66.0% 67.0% 8.00% 61.0% 59.0% 57.0% 57.0% 60.0% 47.0% 63.0% 68.4% 48.9% 7.00% 40.0% 2013 2014 2015 2016 2017 Q1 2018 6.00% 2013 2014 2015 2016 2017 Q1 2018 CHFC Peer Median (2) CHFC Peer median(2) Source: S&P Global and Company Documents; Data as of 5/7/18 (1) 2018, 2017, 2016 and 2015 are under Basel III transitional and 2014 and 2013 are under Basel I. (2) Peers include nationwide banks with $10 to $25 billion in total assets as of the most recent quarter. 13 (3) Tangible shareholders' equity to tangible assets is a non-GAAP financial measure. Please refer to the Appendix for a reconciliation of non-GAAP financial measures.

Closing Comments q Emphasize our strategy of being the Premier Midwest Community Bank through our Big Four Initiatives which represent our top four initiatives for this year ◦ Generating strategic organic loan and deposit growth ◦ Increasing our operating efficiency and accountability ◦ Developing an exceptional customer service model ◦ And creating the Chemical Culture q Implementation of our Big Four Initiatives ◦ Successful recruiting of who we believe to be the top commercial lenders to drive growth in West Michigan, Southeast Michigan and the Cleveland markets ◦ Targeting lending growth in products with higher returns, more complete customer relationships - middle market, commercial lending, commercial finance and asset-based lending ◦ Upgrading our core operating systems to assist our preparation for future growth, regulatory compliance and customer satisfaction 14
Supplemental Information
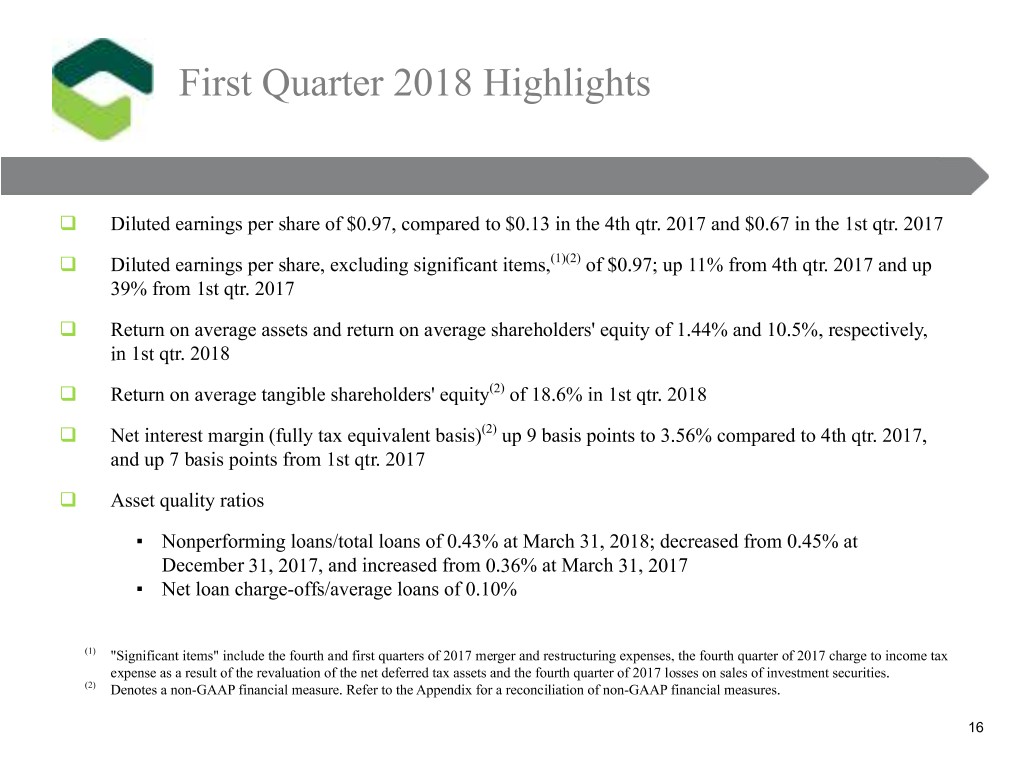
First Quarter 2018 Highlights q Diluted earnings per share of $0.97, compared to $0.13 in the 4th qtr. 2017 and $0.67 in the 1st qtr. 2017 q Diluted earnings per share, excluding significant items,(1)(2) of $0.97; up 11% from 4th qtr. 2017 and up 39% from 1st qtr. 2017 q Return on average assets and return on average shareholders' equity of 1.44% and 10.5%, respectively, in 1st qtr. 2018 q Return on average tangible shareholders' equity(2) of 18.6% in 1st qtr. 2018 q Net interest margin (fully tax equivalent basis)(2) up 9 basis points to 3.56% compared to 4th qtr. 2017, and up 7 basis points from 1st qtr. 2017 q Asset quality ratios ▪ Nonperforming loans/total loans of 0.43% at March 31, 2018; decreased from 0.45% at December 31, 2017, and increased from 0.36% at March 31, 2017 ▪ Net loan charge-offs/average loans of 0.10% (1) "Significant items" include the fourth and first quarters of 2017 merger and restructuring expenses, the fourth quarter of 2017 charge to income tax expense as a result of the revaluation of the net deferred tax assets and the fourth quarter of 2017 losses on sales of investment securities. (2) Denotes a non-GAAP financial measure. Refer to the Appendix for a reconciliation of non-GAAP financial measures. 16
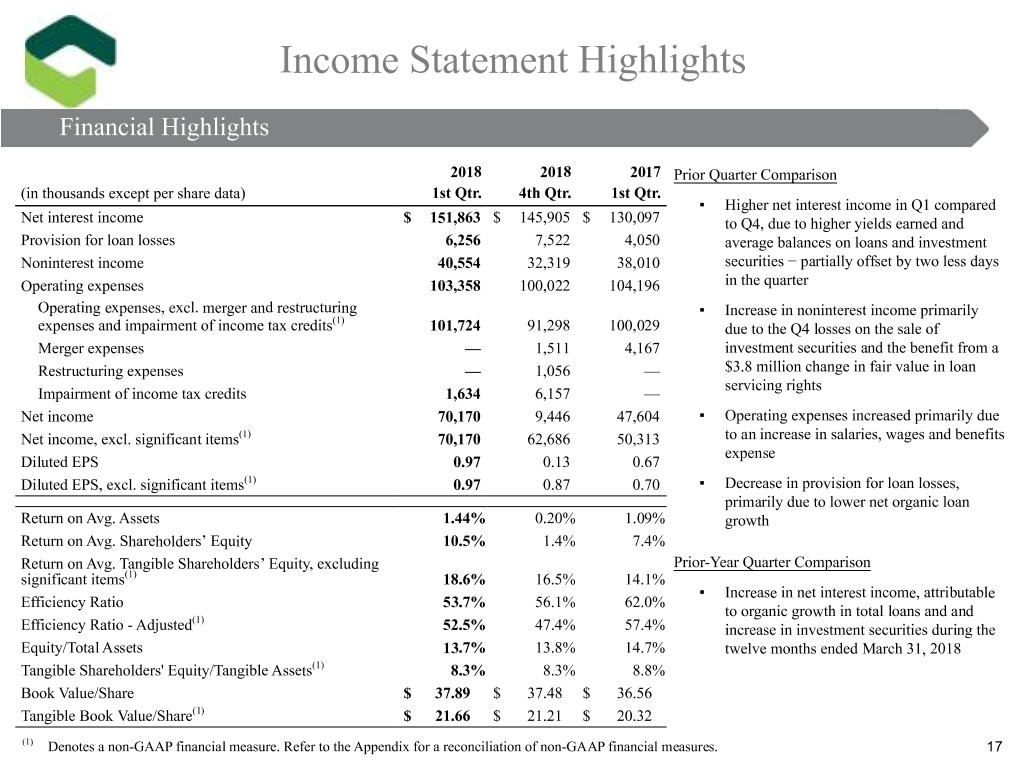
Income Statement Highlights FinancialFinancial Highlights Highlights 2018 2018 2017 Prior Quarter Comparison (in thousands except per share data) 1st Qtr. 4th Qtr. 1st Qtr. ▪ Higher net interest income in Q1 compared Net interest income $ 151,863 $ 145,905 $ 130,097 to Q4, due to higher yields earned and Provision for loan losses 6,256 7,522 4,050 average balances on loans and investment Noninterest income 40,554 32,319 38,010 securities − partially offset by two less days Operating expenses 103,358 100,022 104,196 in the quarter Operating expenses, excl. merger and restructuring ▪ Increase in noninterest income primarily (1) expenses and impairment of income tax credits 101,724 91,298 100,029 due to the Q4 losses on the sale of Merger expenses — 1,511 4,167 investment securities and the benefit from a Restructuring expenses — 1,056 — $3.8 million change in fair value in loan servicing rights Impairment of income tax credits 1,634 6,157 — Net income 70,170 9,446 47,604 ▪ Operating expenses increased primarily due Net income, excl. significant items(1) 70,170 62,686 50,313 to an increase in salaries, wages and benefits expense Diluted EPS 0.97 0.13 0.67 Diluted EPS, excl. significant items(1) 0.97 0.87 0.70 ▪ Decrease in provision for loan losses, primarily due to lower net organic loan Return on Avg. Assets 1.44% 0.20% 1.09% growth Return on Avg. Shareholders’ Equity 10.5% 1.4% 7.4% Return on Avg. Tangible Shareholders’ Equity, excluding Prior-Year Quarter Comparison significant items(1) 18.6% 16.5% 14.1% ▪ Increase in net interest income, attributable Efficiency Ratio 53.7% 56.1% 62.0% to organic growth in total loans and and (1) Efficiency Ratio - Adjusted 52.5% 47.4% 57.4% increase in investment securities during the Equity/Total Assets 13.7% 13.8% 14.7% twelve months ended March 31, 2018 Tangible Shareholders' Equity/Tangible Assets(1) 8.3% 8.3% 8.8% Book Value/Share $ 37.89 $ 37.48 $ 36.56 Tangible Book Value/Share(1) $ 21.66 $ 21.21 $ 20.32 (1) Denotes a non-GAAP financial measure. Refer to the Appendix for a reconciliation of non-GAAP financial measures. 17

Net Income NetNet IncomeIncome Trending Trending Upward Upward ($ Millions, ($ Millions, except EPS except data) EPS data) 2017 Total: $149.5(1); $219.6(2)(3) 2018 $70.2(2)(3) $62.7(2)(3) $1.20 $60.0 $53.3 $0.97(3) $50.3(2)(3) $1.00 $0.3 $0.65(3) $2.7 $13.8 $0.80 e (3) m $40.0 $0.70 o S c P n $70.2 $0.60 I E t e N $52.0 $47.6 $0.40 $20.0 $40.4 $0.20 $9.4 $0.0 $0.00 Q1 Q2 Q3 Q4 Q1 2017 2018 Significant items (after-tax) Net Income __ Diluted EPS, excluding significant items (non-GAAP) (3) (1)Net Income (2) Net Income, excluding significant items. 18 (3)Denotes a non-GAAP financial measure. Please refer to the Appendix for a reconciliation of non-GAAP financial measures.
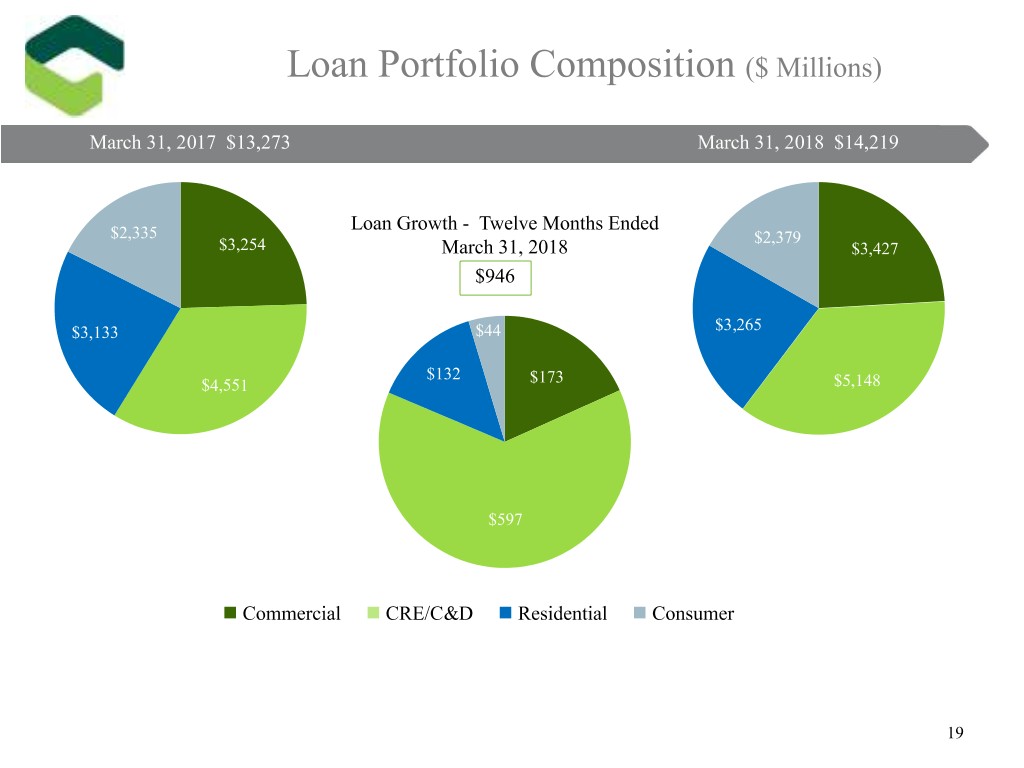
Loan Portfolio Composition ($ Millions) March 31, 2017 $13,273 March 31, 2018 $14,219 Loan Growth - Twelve Months Ended $2,335 $2,379 $3,254 March 31, 2018 $3,427 $946 $3,133 $44 $3,265 $132 $4,551 $173 $5,148 Total Loan Growth - $597 n Commercial n CRE/C&D n Residential n Consumer 19

Loan Growth ($ Millions) Quarterly LoanLoan Growth Growth Trends Trends $394 $400 $322 $300 $282 $166 $200 $64 $100 $0 Q1 Q2 Q3 Q4 Q1 2017 - $1,164 2018 - $64 Loan Growth - 2017 Total Loan Growth - 2018 YTD $1,164 $64 $(63) n $132 Commercial $12 $169 $41 $165 n CRE/C&D n Residential $74 $698 n Consumer 20

Loan Growth – Originated v. Acquired LoanLoan GrowthGrowth (Run-off) (Run-off) ($ ($Millions) Millions) Q1 2018 Q4 2017 Q1 2017 2017 Total Originated Loan Portfolio Commercial $ 78 $ 153 $ 88 $ 507 CRE/C&D 154 356 238 1,046 Residential 72 86 119 491 Consumer (39) (4) 56 244 Total Originated Loan Portfolio Growth $ 265 $ 591 $ 501 $ 2,288 Acquired Loan Portfolio Commercial $ (37) $ (87) $ (52) $ (338) CRE/C&D (80) (98) (64) (348) Residential (60) (55) (72) (326) Consumer (24) (29) (31) (112) Total Acquired Loan Portfolio Run-off $ (201) $ (269) $ (219) $ (1,124) Total Loan Portfolio Commercial $ 41 $ 66 $ 36 $ 169 CRE/C&D 74 258 174 698 Residential 12 31 47 165 Consumer (63) (33) 25 132 Total Loan Portfolio Growth $ 64 $ 322 $ 282 $ 1,164 21
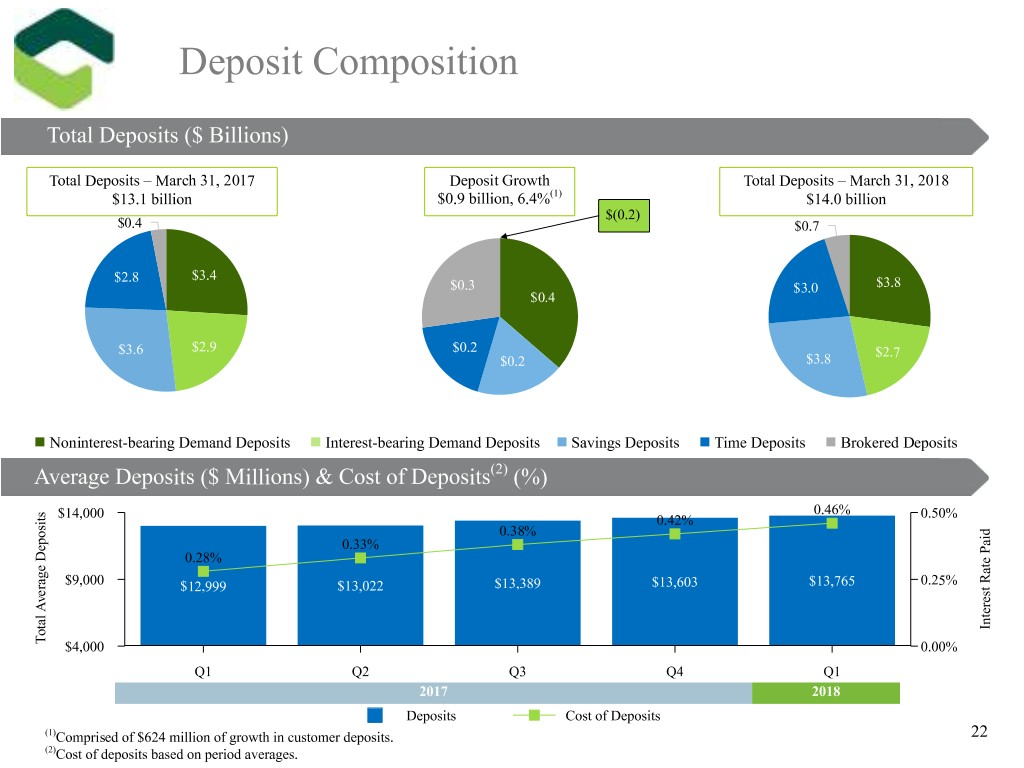
Deposit Composition TotalTotal DepositsDeposits ($ ($ Billions) Billions) Total Deposits – March 31, 2017 Deposit Growth Total Deposits – March 31, 2018 $13.1 billion $0.9 billion, 6.4%(1) $14.0 billion $(0.2) $0.4 $0.7 $2.8 $3.4 $0.3 $3.0 $3.8 $0.4 $3.6 $2.9 $0.2 $2.7 $0.2 $3.8 n Noninterest-bearing Demand Deposits n Interest-bearing Demand Deposits n Savings Deposits n Time Deposits n Brokered Deposits Average Deposits ($ Millions) & Cost of Deposits(2) (%) 0.46% s $14,000 0.50% t i 0.42% s d o 0.38% i p a e 0.33% P D 0.28% e t e a g R a $9,000 $13,765 0.25% r $13,603 $12,999 $13,022 $13,389 t e s v e r A e t l n a t I o T $4,000 0.00% Q1 Q2 Q3 Q4 Q1 2017 2018 Deposits Cost of Deposits (1)Comprised of $624 million of growth in customer deposits. 22 (2)Cost of deposits based on period averages.

Funding Breakdown ($ Billions) December 31, 2017 March 31, 2018 $16.4 billion $16.9 billion Average cost of wholesale Average cost of wholesale borrowings – 1.42% Interest and borrowings – 1.61% noninterest- n Deposits: bearing, checking, savings, money market n $2.9 Time Deposits $3.2 $0.4 $0.5 n Collateralized customer $10.0 deposits $10.2 $3.1 $3.0 n Wholesale borrowings (at March 31, 2018: brokered deposits - $0.7 billion, short and long term borrowings - $2.4 billion) Average Cost of Funds Q4 2017 – 0.56% Average Cost of Funds Q1 2018 – 0.64% 23

Credit Quality ($ Millions, unless otherwise noted) Provision for Loan Losses vs. Net Loan Losses (Originated loan portfolio) Provision for Loan Losses vs. Net Loan Losses $8.0 $8.1 $6.2 $6.3 $4.0 $3.5 $3.5 $3.4 $4.9 $4.1 $1.2 $1.4 $0.0 Q1 Q2 Q3 Q4 Q1 2017 2018 Provision for Loan Losses Net Loan Losses Nonperforming Loans (NPLs) and Allowance for Loan Losses (ALL) $120 $92 $95 $76 $73 $78 $60 $62 $63 $62 ALL $51 $44 $0 NPLs YE 2014 YE 2015 YE 2016 YE 2017 Q1 2018 Originated Loans ($ billions) $5.0 $5.8 $7.5 $9.8 $10.0 Acquired Loans ($ billions) 0.7 1.5 5.5 4.4 4.2 Total Loans ($ billions) $5.7 $7.3 $13.0 $14.2 $14.2 Total ALL $76 $73 $78 $92 $95 Originated ALL/ Originated Loans 1.51% 1.26% 1.05% 0.94% 0.95% NPLs/ Total Loans 0.89% 0.86% 0.34% 0.45% 0.43% Credit Mark as a % of Unpaid Principal on Acquired Loans 5.4% 4.4% 3.1% 2.4% 1.8% 24
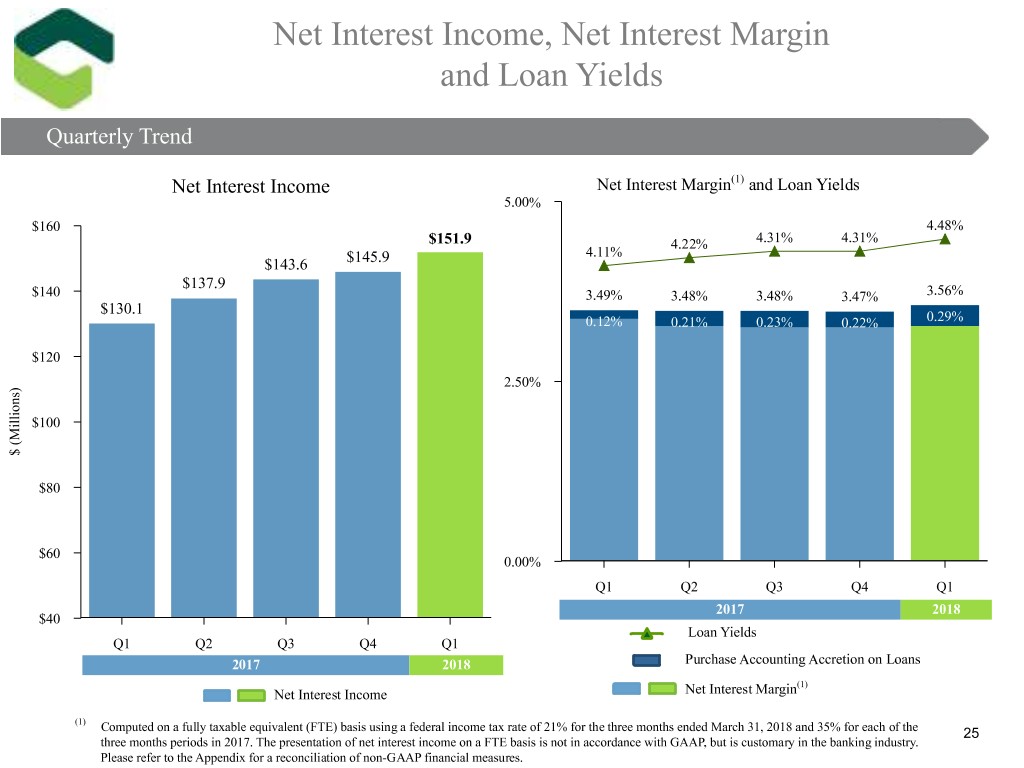
Net Interest Income, Net Interest Margin and Loan Yields Quarterly(Quarterly Trend Trend) Net Interest Income Net Interest Margin(1) and Loan Yields 5.00% $160 4.48% $151.9 4.22% 4.31% 4.31% 4.11% $143.6 $145.9 $137.9 $140 3.49% 3.48% 3.48% 3.47% 3.56% $130.1 0.12% 0.21% 0.23% 0.22% 0.29% $120 2.50% ) s n o i l l i $100 M ( $ $80 $60 0.00% Q1 Q2 Q3 Q4 Q1 2017 2018 $40 Loan Yields Q1 Q2 Q3 Q4 Q1 2017 2018 Purchase Accounting Accretion on Loans (1) Net Interest Income Net Interest Margin (1) Computed on a fully taxable equivalent (FTE) basis using a federal income tax rate of 21% for the three months ended March 31, 2018 and 35% for each of the 25 three months periods in 2017. The presentation of net interest income on a FTE basis is not in accordance with GAAP, but is customary in the banking industry. Please refer to the Appendix for a reconciliation of non-GAAP financial measures.

Non-Interest Income Quarterly Quarterly $50.0 $41.6 $40.5 $38.0 $9.9 $9.2 $32.1 $32.3 $12.5 ) $5.2 s $7.9 n $8.8 o i l l i $25.0 $8.0 M $8.5 ( $9.1 $ $7.0 $9.1 $5.8 $6.3 $6.2 $6.5 $15.0 $15.9 $11.6 $13.2 $8.8 $0.0 Q1 Q2 Q3 Q4 * Q1 2017 2018 Other Wealth Management Service Charges Net Gain on Sale of Loans and other Mortgage Banking Revenue * Significant items: Q4 2017 included a $7.6 million loss on investment securities. 26
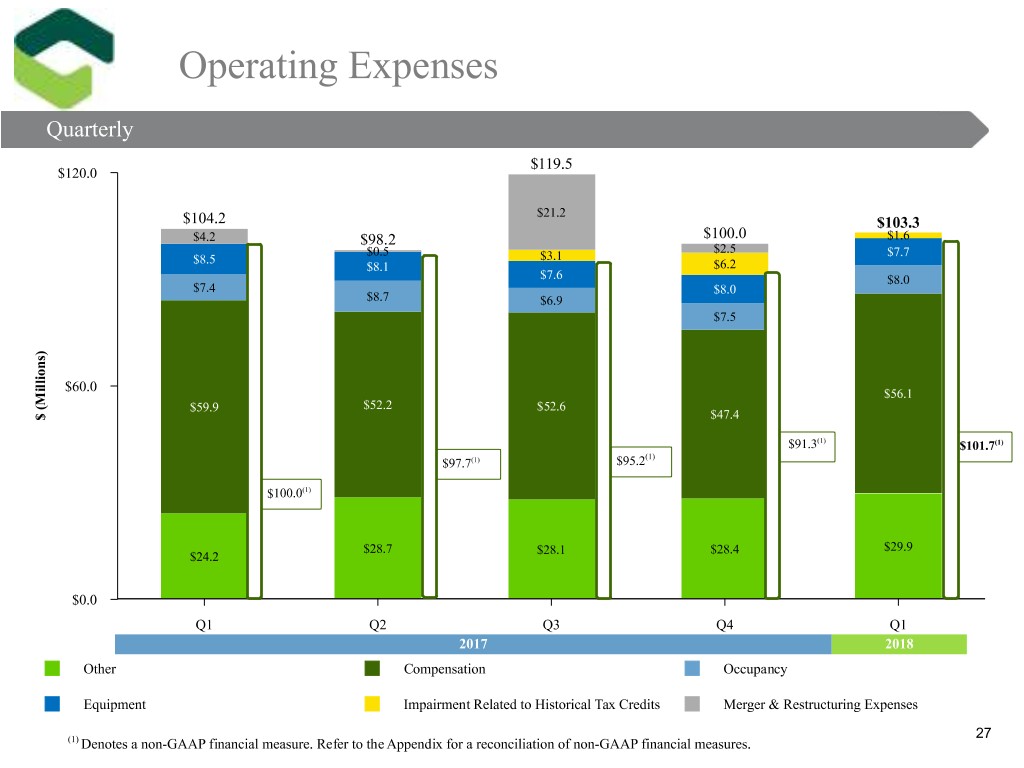
Operating Expenses Quarterly $119.5 $120.0 $21.2 $104.2 $103.3 $4.2 $98.2 $100.0 $1.6 $0.5 $2.5 $7.7 $8.5 $3.1 $8.1 $6.2 $7.6 $8.0 $7.4 $8.0 $8.7 $6.9 $7.5 ) s n o i l l i $60.0 $56.1 M ( $59.9 $52.2 $52.6 $ $47.4 $91.3(1) $101.7(1) (1) $97.7(1) $95.2 $100.0(1) $28.7 $28.1 $28.4 $29.9 $24.2 $0.0 Q1 Q2 Q3 Q4 Q1 2017 2018 Other Compensation Occupancy Equipment Impairment Related to Historical Tax Credits Merger & Restructuring Expenses 27 (1) Denotes a non-GAAP financial measure. Refer to the Appendix for a reconciliation of non-GAAP financial measures.

Capital Tangible Book Value and Capital Ratios Peer Average CHFC CHFC 12/31/2017(1) 12/31/2017 3/31/2017 Tangible Book Value / Share(2) NA $21.21 $21.66 Tangible Common Equity / Tangible Assets(2) 8.6% 8.3% 8.3% Tier 1 Capital(3) 11.3% 10.2% 10.4% Total Risk-Based Capital(3) 13.2% 11.0% 11.2% Tangible Book Value per Share(2) (TBV) Roll Forward $2.63 $20.32 $21.66 $20 $(1.11) $(0.05) $(0.13) $10 $0 7 g ds j. g 8 201 rin en Ad rin 201 1, ctu vid CI ctu 1, r 3 stru Di O stru r 3 Ma Re A Re Ma @ nd nd @ BV er a er a BV T erg erg T x. M M e (E com t In ) Ne ses pen Ex (1)Source S&P Global – Peers include nationwide banks with $10 to $25 billion in total assets as of the most recent quarter. (2)Denotes a non-GAAP financial measure. Refer to the Appendix for a reconciliation of non-GAAP financial measures. 28 (3)Estimated at March 31, 2018
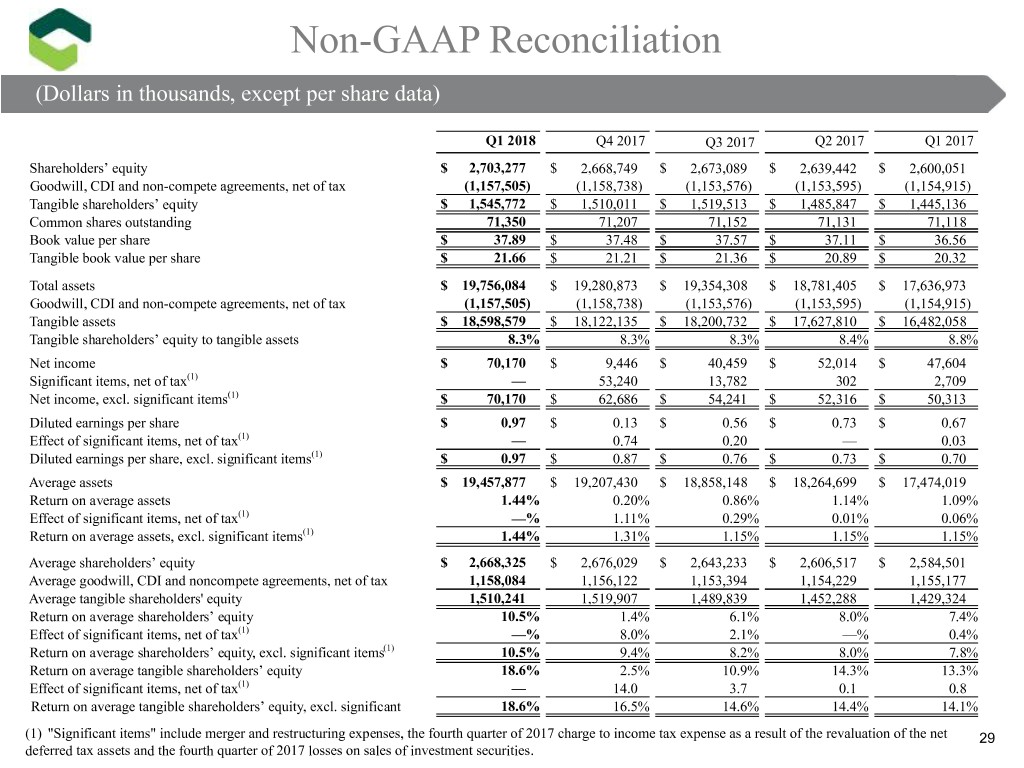
Non-GAAP Reconciliation (Dollars in thousands, except per share data) Q1 2018 Q4 2017 Q3 2017 Q2 2017 Q1 2017 Shareholders’ equity $ 2,703,277 $ 2,668,749 $ 2,673,089 $ 2,639,442 $ 2,600,051 Goodwill, CDI and non-compete agreements, net of tax (1,157,505) (1,158,738) (1,153,576) (1,153,595) (1,154,915) Tangible shareholders’ equity $ 1,545,772 $ 1,510,011 $ 1,519,513 $ 1,485,847 $ 1,445,136 Common shares outstanding 71,350 71,207 71,152 71,131 71,118 Book value per share $ 37.89 $ 37.48 $ 37.57 $ 37.11 $ 36.56 Tangible book value per share $ 21.66 $ 21.21 $ 21.36 $ 20.89 $ 20.32 Total assets $ 19,756,084 $ 19,280,873 $ 19,354,308 $ 18,781,405 $ 17,636,973 Goodwill, CDI and non-compete agreements, net of tax (1,157,505) (1,158,738) (1,153,576) (1,153,595) (1,154,915) Tangible assets $ 18,598,579 $ 18,122,135 $ 18,200,732 $ 17,627,810 $ 16,482,058 Tangible shareholders’ equity to tangible assets 8.3% 8.3% 8.3% 8.4% 8.8% Net income $ 70,170 $ 9,446 $ 40,459 $ 52,014 $ 47,604 Significant items, net of tax(1) — 53,240 13,782 302 2,709 Net income, excl. significant items(1) $ 70,170 $ 62,686 $ 54,241 $ 52,316 $ 50,313 Diluted earnings per share $ 0.97 $ 0.13 $ 0.56 $ 0.73 $ 0.67 Effect of significant items, net of tax(1) — 0.74 0.20 — 0.03 Diluted earnings per share, excl. significant items(1) $ 0.97 $ 0.87 $ 0.76 $ 0.73 $ 0.70 Average assets $ 19,457,877 $ 19,207,430 $ 18,858,148 $ 18,264,699 $ 17,474,019 Return on average assets 1.44% 0.20% 0.86% 1.14% 1.09% Effect of significant items, net of tax(1) —% 1.11% 0.29% 0.01% 0.06% Return on average assets, excl. significant items(1) 1.44% 1.31% 1.15% 1.15% 1.15% Average shareholders’ equity $ 2,668,325 $ 2,676,029 $ 2,643,233 $ 2,606,517 $ 2,584,501 Average goodwill, CDI and noncompete agreements, net of tax 1,158,084 1,156,122 1,153,394 1,154,229 1,155,177 Average tangible shareholders' equity 1,510,241 1,519,907 1,489,839 1,452,288 1,429,324 Return on average shareholders’ equity 10.5% 1.4% 6.1% 8.0% 7.4% Effect of significant items, net of tax(1) —% 8.0% 2.1% —% 0.4% Return on average shareholders’ equity, excl. significant items(1) 10.5% 9.4% 8.2% 8.0% 7.8% Return on average tangible shareholders’ equity 18.6% 2.5% 10.9% 14.3% 13.3% Effect of significant items, net of tax(1) — 14.0 3.7 0.1 0.8 Return on average tangible shareholders’ equity, excl. significant 18.6% 16.5% 14.6% 14.4% 14.1% (1) "Significant items" include merger and restructuring expenses, the fourth quarter of 2017 charge to income tax expense as a result of the revaluation of the net 29 deferred tax assets and the fourth quarter of 2017 losses on sales of investment securities.

Non-GAAP Reconciliation (Dollars in thousands, except per share data) Q1 2018 Q4 2017 Q3 2017 Q2 2017 Q1 2017 Efficiency Ratio: Total revenue – GAAP $ 192,417 $ 178,224 $ 175,750 $ 179,516 $ 168,107 Net interest income FTE adjustment 2,227 3,580 3,260 3,169 3,068 Significant items(1) (3,752) 7,569 4,040 1,725 429 Total revenue – non-GAAP $ 190,892 $ 189,373 $ 183,050 $ 184,410 $ 171,604 Operating expenses – GAAP $ 103,358 $ 100,022 $ 119,539 $ 98,237 $ 104,196 Merger and restructuring expenses — (2,567) (21,203) (465) (4,167) Impairment of income tax credits (1,634) (6,157) (3,095) — — Operating expenses, core – non-GAAP 101,724 91,298 95,241 97,772 100,029 Amortization of intangibles (1,439) (1,525) (1,526) (1,525) (1,513) Operating expenses, efficiency ratio -excluding merger & restructuring expenses, impairment of income tax credits and amortization of intangibles - non-GAAP $ 100,285 $ 89,773 $ 93,715 $ 96,247 $ 98,516 Efficiency ratio – GAAP 53.7% 56.1% 68.0% 54.7% 62.0% Efficiency ratio – adjusted – non-GAAP 52.5% 47.4% 51.2% 52.2% 57.4% Net Interest Margin: Net interest income – GAAP $ 151,863 $ 145,905 $ 143,628 $ 137,948 $ 130,097 Adjustments for tax equivalent interest: Loans 750 855 824 814 808 Investment securities 1,477 2,725 2,436 2,355 2,260 Total taxable equivalent adjustments 2,227 3,580 3,260 3,169 3,068 Net interest income (on a tax equivalent basis) $ 154,090 $ 149,485 $ 146,888 $ 141,117 $ 133,165 Average interest-earning assets $17,460,007 $ 17,138,285 $ 18,858,148 $ 18,264,699 $ 17,474,019 Net interest margin – GAAP 3.51% 3.39% 3.40% 3.41% 3.41% Net interest margin – on a tax-equivalent basis– non- GAAP 3.56% 3.47% 3.48% 3.48% 3.49% (1) "Significant items" include merger and restructuring expenses, the fourth quarter of 2017 charge to income tax expense as a result of the revaluation of the net 30 deferred tax assets and the fourth quarter of 2017 losses on sales of investment securities.
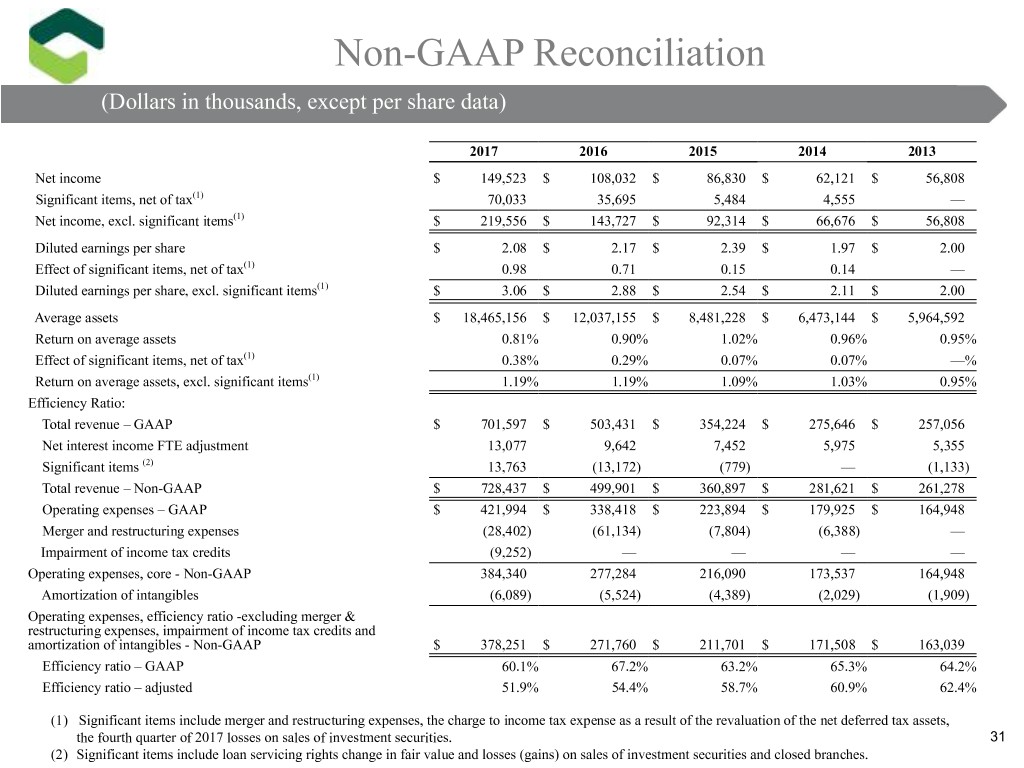
Non-GAAP Reconciliation (Dollars in thousands, except per share data) 2017 2016 2015 2014 2013 Net income $ 149,523 $ 108,032 $ 86,830 $ 62,121 $ 56,808 Significant items, net of tax(1) 70,033 35,695 5,484 4,555 — Net income, excl. significant items(1) $ 219,556 $ 143,727 $ 92,314 $ 66,676 $ 56,808 Diluted earnings per share $ 2.08 $ 2.17 $ 2.39 $ 1.97 $ 2.00 Effect of significant items, net of tax(1) 0.98 0.71 0.15 0.14 — Diluted earnings per share, excl. significant items(1) $ 3.06 $ 2.88 $ 2.54 $ 2.11 $ 2.00 Average assets $ 18,465,156 $ 12,037,155 $ 8,481,228 $ 6,473,144 $ 5,964,592 Return on average assets 0.81% 0.90% 1.02% 0.96% 0.95% Effect of significant items, net of tax(1) 0.38% 0.29% 0.07% 0.07% —% Return on average assets, excl. significant items(1) 1.19% 1.19% 1.09% 1.03% 0.95% Efficiency Ratio: Total revenue – GAAP $ 701,597 $ 503,431 $ 354,224 $ 275,646 $ 257,056 Net interest income FTE adjustment 13,077 9,642 7,452 5,975 5,355 Significant items (2) 13,763 (13,172) (779) — (1,133) Total revenue – Non-GAAP $ 728,437 $ 499,901 $ 360,897 $ 281,621 $ 261,278 Operating expenses – GAAP $ 421,994 $ 338,418 $ 223,894 $ 179,925 $ 164,948 Merger and restructuring expenses (28,402) (61,134) (7,804) (6,388) — Impairment of income tax credits (9,252) — — — — Operating expenses, core - Non-GAAP 384,340 277,284 216,090 173,537 164,948 Amortization of intangibles (6,089) (5,524) (4,389) (2,029) (1,909) Operating expenses, efficiency ratio -excluding merger & restructuring expenses, impairment of income tax credits and amortization of intangibles - Non-GAAP $ 378,251 $ 271,760 $ 211,701 $ 171,508 $ 163,039 Efficiency ratio – GAAP 60.1% 67.2% 63.2% 65.3% 64.2% Efficiency ratio – adjusted 51.9% 54.4% 58.7% 60.9% 62.4% (1) Significant items include merger and restructuring expenses, the charge to income tax expense as a result of the revaluation of the net deferred tax assets, the fourth quarter of 2017 losses on sales of investment securities. 31 (2) Significant items include loan servicing rights change in fair value and losses (gains) on sales of investment securities and closed branches.
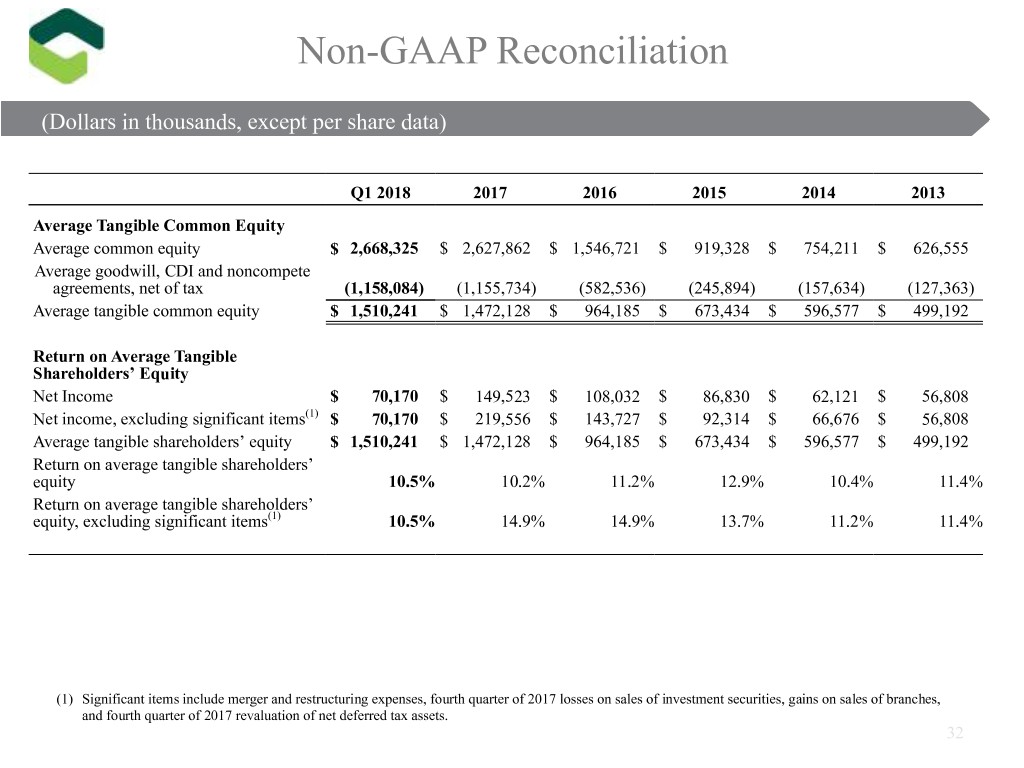
Non-GAAP Reconciliation (Dollars(Dollars inin thousands)thousands, except per share data) Q1 2018 2017 2016 2015 2014 2013 Average Tangible Common Equity Average common equity $ 2,668,325 $ 2,627,862 $ 1,546,721 $ 919,328 $ 754,211 $ 626,555 Average goodwill, CDI and noncompete agreements, net of tax (1,158,084) (1,155,734) (582,536) (245,894) (157,634) (127,363) Average tangible common equity $ 1,510,241 $ 1,472,128 $ 964,185 $ 673,434 $ 596,577 $ 499,192 Return on Average Tangible Shareholders’ Equity Net Income $ 70,170 $ 149,523 $ 108,032 $ 86,830 $ 62,121 $ 56,808 Net income, excluding significant items(1) $ 70,170 $ 219,556 $ 143,727 $ 92,314 $ 66,676 $ 56,808 Average tangible shareholders’ equity $ 1,510,241 $ 1,472,128 $ 964,185 $ 673,434 $ 596,577 $ 499,192 Return on average tangible shareholders’ equity 10.5% 10.2% 11.2% 12.9% 10.4% 11.4% Return on average tangible shareholders’ equity, excluding significant items(1) 10.5% 14.9% 14.9% 13.7% 11.2% 11.4% (1) Significant items include merger and restructuring expenses, fourth quarter of 2017 losses on sales of investment securities, gains on sales of branches, and fourth quarter of 2017 revaluation of net deferred tax assets. 32
