Attached files
| file | filename |
|---|---|
| 8-K - 8-K - RGC RESOURCES INC | a8k2ndquarterearningscall-.htm |

Second Quarter 2018
Earnings conference call
John S. D’Orazio, CEO
Paul W. Nester, CFO

Forward-Looking Statements
The statements in this presentation by RGC Resources, Inc. (the "company") that are not historical facts constitute
“forward-looking statements” made pursuant to the safe harbor provision of the Private Securities Litigation
Reform Act of 1995 that involve risks and uncertainties. These statements include the company's expectations
regarding earnings per share, EBITDA, future expansion opportunities, natural gas reserves and potential
discoverable natural gas reserves, technological advances in natural gas production, comparison of natural gas
consumption and natural gas production, cost of natural gas, including relativity to other fuel sources, demand for
natural gas, possibility of system expansion, general potential for customer growth, relationship of company with
primary regulator, future capital expenditures, current and future economic growth, estimated completion dates
for Mountain Valley Pipeline ("MVP") milestones, potential of MVP to provide additional source of natural gas,
additional capacity to meet future demands, increased capital spending and area expansion opportunity, potential
new customers and rate growth in potential expansion area. Management cautions the reader that these forward-
looking statements are only predictions and are subject to a number of both known and unknown risks and
uncertainties, and actual results may differ materially from those expressed or implied by these forward-looking
statements as a result of a number of factors. These factors include, without limitation, financial challenges
affecting expected earnings per share and EBITDA, technical, political or regulatory issues with natural gas
exploration, production or transportation, impact of increased natural gas demand on natural gas price, relative
cost of alternative fuel sources, lower demand for natural gas, regulatory, legal, technical, political or economic
issues frustrating system or area expansion, regulatory, legal, technical, political or economic issues that may
affect MVP, delay in completion of MVP, increase in cost to complete MVP, including by an increase in cost of raw
materials or labor to due economic factors or regulatory issues such as tariffs, economic challenges that may affect
the service area generally and customer growth or demand and deterioration of relationship with primary
regulator, and those risk factors described in the company’s most recent Annual Report on Form 10-K filed with
the Securities and Exchange Commission, which is available at www.sec.gov and on the company’s website at
www.rgcresources.com. The statements made in this presentation are based on information available to the
company as of the first day of the month set forth on the cover of this presentation and the company undertakes
no obligation to update any of the forward-looking statements after the date of this presentation.
Non-GAAP Measures: this presentation includes an estimate of Pre Tax Reform Earnings per Share, which is a non-
GAAP financial measure.
2

Agenda
Key Operational and Financial Highlights
2018 Outlook
Questions
3

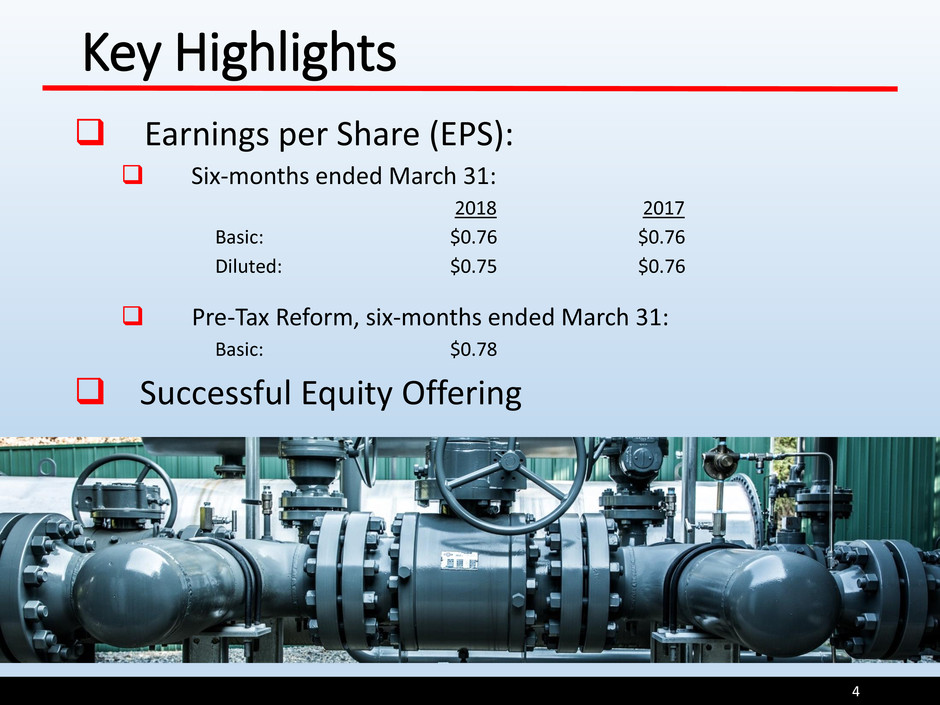
Key Highlights
Earnings per Share (EPS):
Six-months ended March 31:
2018 2017
Basic: $0.76 $0.76
Diluted: $0.75 $0.76
Pre-Tax Reform, six-months ended March 31:
Basic: $0.78
Successful Equity Offering
4

5
SAVE Rider
$2.4
Customer
Growth & System
Expansion
$1.3
Other Capital
$1.3
2017
2018
$0.5
$1.5
$2.5
$3.5
$4.5
$5.5
$6.5
$7.5
Total Capital Expenditures
Mi
lli
o
n
s
$2.0 million, or 29%
decrease in capital
spending
Roanoke Gas Q2 Capital Expenditures

6
SAVE Rider
$5.0
Customer Growth
& System
Expansion
$2.9
Other Capital
$2.5
2017
2018
$0.5
$2.5
$4.5
$6.5
$8.5
$10.5
$12.5
Total Capital Expenditures
Mi
lli
o
n
s
$1.5 million, or 13%
decrease in capital
spending
Roanoke Gas YTD Capital Expenditures

Customer Growth
58,600
58,800
59,000
59,200
59,400
59,600
59,800
60,000
60,200
60,400
60,600
2015 2016 2017 2018
Average Customers
(twelve-months ended March 31)
Consistent customer growth year over year since 2015
155 new customers in the second fiscal quarter
360 total new customers in the six months ended March 31, 2018
7

-
500
1,000
1,500
2,000
2,500
Residential Commercial Industrial
Th
o
u
san
d
s
Volumes Sold (DTH)
Q2 2017 Q2 2018
2018 vs 2017
Residential 31%
C&I 15%
Q2 Volume Growth
8

-
500
1,000
1,500
2,000
2,500
3,000
3,500
Residential Commercial Industrial
Th
o
u
san
d
s
Volumes Sold (DTH)
YTD 2017 YTD 2018
2018 vs 2017
Commercial 20%
Industrial 3%
Top 10 Customers 9%
YTD Volume Growth
9

10
RGC Midstream investment $35 million
FERC approved and construction in
progress
Targeted in-service date end of calendar
year 2018
MVP Southgate Project
Update
$5
$25
$5
$0
$10
$20
$30
2017A 2018E 2019E
($
m
m
)
RGC Midstream CapEx

11
70 mile natural gas pipeline system
20 and 16 inch steel underground pipe
Starts at TRANSCO 165 and extends into
central NC
Anchored by firm capacity commitment
from PSNC Energy
Same project partners as MVP
Southgate
Proposed Schedule
Ongoing: Public Participation
May 2018: FERC Pre-filing
Calendar Q4 2018: File FERC Application
Calendar Q1 2020: Begin Construction
Calendar Q4 2020: In-Service Date

Consolidated Financial Results
12

13
Capital Spend
MVP Investment
Earnings
2018 Outlook
45%
41%
14%
Roanoke Gas Fiscal 2018
CapEx Plan
SAVE Rider & Station Replacement $10.0
Customer Growth & System Expansion 9.0
Utility Maintenance 3.0
Total $22.0

14
