Attached files
UNITED STATES
SECURITIES AND EXCHANGE COMMISSION
Washington, D.C. 20549
FORM 10-Q
þ QUARTERLY REPORT PURSUANT TO SECTION 13 OR 15(d) OF THE SECURITIES EXCHANGE ACT OF 1934
For the quarterly period ended March 31, 2018
or
¨ TRANSITION REPORT PURSUANT TO SECTION 13 OR 15(d) OF THE SECURITIES EXCHANGE ACT OF 1934
For the transition period from _______________________ to __________________________
Commission File Number 001-31921

Compass Minerals International, Inc.
(Exact name of registrant as specified in its charter)
Delaware | 36-3972986 |
(State or other jurisdiction of incorporation or organization) | (I.R.S. Employer Identification Number) |
9900 West 109th Street
Suite 100
Overland Park, KS 66210
(913) 344-9200
(Address of principal executive offices, zip code and telephone number, including area code)
Indicate by check mark whether the registrant (1) has filed all reports required to be filed by Section 13 or 15(d) of the Securities Exchange Act of 1934 during the preceding 12 months (or for such shorter period that the registrant was required to file such reports), and (2) has been subject to such filing requirements for the past 90 days.
Yes: þ No: ¨
Indicate by check mark whether the registrant has submitted electronically and posted on its corporate Web site, if any, every Interactive Data File required to be submitted and posted pursuant to Rule 405 of Regulation S-T (§232.405 of this chapter) during the preceding 12 months (or for such shorter period that the registrant was required to submit and post such files).
Yes: þ No: ¨
Indicate by check mark whether the registrant is a large accelerated filer, an accelerated filer, a non-accelerated filer, or a smaller reporting company. See the definitions of “large accelerated filer,” “accelerated filer” and “smaller reporting company” in Rule 12b-2 of the Exchange Act.
Large accelerated filer þ | Accelerated filer ¨ | Non-accelerated filer ¨ | Smaller reporting company ¨ |
Emerging growth company ¨ | |||
If an emerging growth company, indicate by check mark if the registrant has elected not to use the extended transition period for complying with any new or revised financial accounting standards provided pursuant to Section 13(a) of the Exchange Act. ¨
Indicate by check mark whether the registrant is a shell company (as defined in Rule 12b-2 of the Exchange Act).
Yes: ¨ No: þ
The number of shares outstanding of the registrant’s common stock, $0.01 par value per share, as of April 27, 2018, was 33,850,352 shares.
COMPASS MINERALS INTERNATIONAL, INC.
TABLE OF CONTENTS
Page | ||
PART I. FINANCIAL INFORMATION | ||
PART II. OTHER INFORMATION | ||
1
PART I. FINANCIAL INFORMATION
Item 1. Financial Statements
COMPASS MINERALS INTERNATIONAL, INC.
CONSOLIDATED BALANCE SHEETS
(in millions, except share data)
(Unaudited) | |||||||
March 31, 2018 | December 31, 2017 | ||||||
ASSETS | |||||||
Current assets: | |||||||
Cash and cash equivalents | $ | 44.5 | $ | 36.6 | |||
Receivables, less allowance for doubtful accounts of $10.8 in 2018 and $10.9 in 2017 | 275.0 | 344.5 | |||||
Inventories | 217.2 | 289.9 | |||||
Other | 59.8 | 66.5 | |||||
Total current assets | 596.5 | 737.5 | |||||
Property, plant and equipment, net | 1,124.8 | 1,138.1 | |||||
Intangible assets, net | 138.0 | 143.6 | |||||
Goodwill | 402.8 | 405.0 | |||||
Investment in equity method investee | 24.6 | 24.6 | |||||
Other | 126.1 | 122.2 | |||||
Total assets | $ | 2,412.8 | $ | 2,571.0 | |||
LIABILITIES AND STOCKHOLDERS’ EQUITY | |||||||
Current liabilities: | |||||||
Current portion of long-term debt | $ | 32.3 | $ | 32.1 | |||
Accounts payable | 109.0 | 123.5 | |||||
Accrued expenses | 64.4 | 54.4 | |||||
Accrued salaries and wages | 18.6 | 23.9 | |||||
Income taxes payable | 21.1 | 25.9 | |||||
Accrued interest | 5.7 | 8.2 | |||||
Total current liabilities | 251.1 | 268.0 | |||||
Long-term debt, net of current portion | 1,218.2 | 1,330.4 | |||||
Deferred income taxes, net | 125.0 | 127.0 | |||||
Other noncurrent liabilities | 149.4 | 151.0 | |||||
Commitments and contingencies (Note 9) | |||||||
Stockholders’ equity: | |||||||
Common stock: $0.01 par value, 200,000,000 authorized shares; 35,367,264 issued shares | 0.4 | 0.4 | |||||
Additional paid-in capital | 103.7 | 102.5 | |||||
Treasury stock, at cost — 1,517,797 shares at March 31, 2018 and 1,539,763 shares at December 31, 2017 | (2.9 | ) | (2.9 | ) | |||
Retained earnings | 660.8 | 672.5 | |||||
Accumulated other comprehensive loss | (92.9 | ) | (77.9 | ) | |||
Total stockholders’ equity | 669.1 | 694.6 | |||||
Total liabilities and stockholders’ equity | $ | 2,412.8 | $ | 2,571.0 | |||
The accompanying notes are an integral part of the consolidated financial statements.
2
COMPASS MINERALS INTERNATIONAL, INC.
CONSOLIDATED STATEMENTS OF OPERATIONS
(Unaudited, in millions, except share and per share data)
Three Months Ended March 31, | |||||||
2018 | 2017 | ||||||
Sales | $ | 437.9 | $ | 387.8 | |||
Shipping and handling cost | 120.1 | 93.7 | |||||
Product cost | 252.4 | 212.5 | |||||
Gross profit | 65.4 | 81.6 | |||||
Selling, general and administrative expenses | 38.8 | 40.2 | |||||
Operating earnings | 26.6 | 41.4 | |||||
Other expense (income): | |||||||
Interest expense | 13.7 | 13.7 | |||||
Net loss in equity investee | 0.1 | — | |||||
Other, net | (4.2 | ) | (0.1 | ) | |||
Earnings before income taxes | 17.0 | 27.8 | |||||
Income tax expense | 4.4 | 6.3 | |||||
Net earnings | $ | 12.6 | $ | 21.5 | |||
Basic net earnings per common share | $ | 0.37 | $ | 0.63 | |||
Diluted net earnings per common share | $ | 0.37 | $ | 0.63 | |||
Weighted-average common shares outstanding (in thousands): | |||||||
Basic | 33,836 | 33,802 | |||||
Diluted | 33,836 | 33,803 | |||||
Cash dividends per share | $ | 0.72 | $ | 0.72 | |||
The accompanying notes are an integral part of the consolidated financial statements.
3
COMPASS MINERALS INTERNATIONAL, INC.
CONSOLIDATED STATEMENTS OF COMPREHENSIVE (LOSS) INCOME
(Unaudited, in millions)
Three Months Ended March 31, | |||||||
2018 | 2017 | ||||||
Net earnings | $ | 12.6 | $ | 21.5 | |||
Other comprehensive income (loss): | |||||||
Unrealized gain from change in pension obligations, net of tax of $0.0 in both 2018 and 2017 | 0.1 | 0.1 | |||||
Unrealized loss on cash flow hedges, net of tax of $0.3 in both 2018 and 2017 | (0.5 | ) | (0.5 | ) | |||
Cumulative translation adjustment | (14.4 | ) | 14.8 | ||||
Comprehensive (loss) income | $ | (2.2 | ) | $ | 35.9 | ||
The accompanying notes are an integral part of the consolidated financial statements.
4
COMPASS MINERALS INTERNATIONAL, INC.
CONSOLIDATED STATEMENT OF STOCKHOLDERS’ EQUITY
For the three months ended March 31, 2018
(Unaudited, in millions)
Common Stock | Additional Paid-In Capital | Treasury Stock | Retained Earnings | Accumulated Other Comprehensive Loss | Total | ||||||||||||||||||
Balance, December 31, 2017 | $ | 0.4 | $ | 102.5 | $ | (2.9 | ) | $ | 672.5 | $ | (77.9 | ) | $ | 694.6 | |||||||||
Comprehensive income (loss) | 12.6 | (14.8 | ) | (2.2 | ) | ||||||||||||||||||
Stranded tax effect from tax reform | 0.2 | (0.2 | ) | — | |||||||||||||||||||
Dividends on common stock | 0.1 | (24.5 | ) | (24.4 | ) | ||||||||||||||||||
Stock-based compensation | 1.1 | 1.1 | |||||||||||||||||||||
Balance, March 31, 2018 | $ | 0.4 | $ | 103.7 | $ | (2.9 | ) | $ | 660.8 | $ | (92.9 | ) | $ | 669.1 | |||||||||
The accompanying notes are an integral part of the consolidated financial statements.
5
COMPASS MINERALS INTERNATIONAL, INC.
CONSOLIDATED STATEMENTS OF CASH FLOWS
(Unaudited, in millions)
Three Months Ended March 31, | |||||||
2018 | 2017 | ||||||
Cash flows from operating activities: | |||||||
Net earnings | $ | 12.6 | $ | 21.5 | |||
Adjustments to reconcile net earnings to net cash flows provided by operating activities: | |||||||
Depreciation, depletion and amortization | 34.3 | 28.4 | |||||
Finance fee amortization | 0.6 | 0.6 | |||||
Stock-based compensation | 1.1 | 1.3 | |||||
Deferred income taxes | 0.3 | (1.2 | ) | ||||
Gain on settlement of acquisition-related contingent consideration | — | (1.9 | ) | ||||
Other, net | 0.4 | (2.6 | ) | ||||
Changes in operating assets and liabilities: | |||||||
Receivables | 68.9 | 97.9 | |||||
Inventories | 71.3 | 44.4 | |||||
Other assets | 0.5 | (2.8 | ) | ||||
Accounts payable and accrued expenses | (17.8 | ) | (61.0 | ) | |||
Other liabilities | 0.8 | 0.6 | |||||
Net cash provided by operating activities | 173.0 | 125.2 | |||||
Cash flows from investing activities: | |||||||
Capital expenditures | (23.0 | ) | (21.0 | ) | |||
Other, net | (0.6 | ) | (1.3 | ) | |||
Net cash used in investing activities | (23.6 | ) | (22.3 | ) | |||
Cash flows from financing activities: | |||||||
Proceeds from revolving credit facility borrowings | 63.8 | 18.3 | |||||
Principal payments on revolving credit facility borrowings | (186.2 | ) | (101.7 | ) | |||
Proceeds from issuance of long-term debt | 16.0 | 10.9 | |||||
Principal payments on long-term debt | (5.6 | ) | (21.3 | ) | |||
Acquisition-related contingent consideration payment | — | (14.7 | ) | ||||
Dividends paid | (24.5 | ) | (24.4 | ) | |||
Deferred financing costs | (0.3 | ) | — | ||||
Proceeds received from stock option exercises | — | 0.2 | |||||
Other, net | — | 0.7 | |||||
Net cash used in financing activities | (136.8 | ) | (132.0 | ) | |||
Effect of exchange rate changes on cash and cash equivalents | (4.7 | ) | 0.6 | ||||
Net change in cash and cash equivalents | 7.9 | (28.5 | ) | ||||
Cash and cash equivalents, beginning of the year | 36.6 | 77.4 | |||||
Cash and cash equivalents, end of period | $ | 44.5 | $ | 48.9 | |||
Supplemental cash flow information: | |||||||
Interest paid, net of amounts capitalized | $ | 14.7 | $ | 14.4 | |||
Income taxes paid, net of refunds | $ | 5.0 | $ | 12.1 | |||
The accompanying notes are an integral part of the consolidated financial statements.
6
COMPASS MINERALS INTERNATIONAL, INC.
NOTES TO CONSOLIDATED FINANCIAL STATEMENTS
(Unaudited)
1. | Accounting Policies and Basis of Presentation: |
Compass Minerals International, Inc. (“CMI”), through its subsidiaries (collectively, the “Company”), is a leading producer of essential minerals that solve nature’s challenges, including salt for winter roadway safety and other consumer, industrial and agricultural uses, specialty plant nutrition minerals that improve the quality and yield of crops, and specialty chemicals for water treatment and other industrial processes. The Company’s principal products are salt, consisting of sodium chloride and magnesium chloride, sulfate of potash (“SOP”), various micronutrient products, and specialty chemicals for water treatment and other industrial processes. The Company’s production sites are located in the United States (“U.S.”), Canada, Brazil and the United Kingdom (the “U.K.”). Except where otherwise noted, references to North America include only the continental U.S. and Canada, and references to the U.K. include only England, Scotland and Wales. References to “Compass Minerals,” “our,” “us” and “we” refer to CMI and its consolidated subsidiaries. The Company also provides records management services to businesses located in the U.K. In October 2016, the Company acquired Produquímica Indústria e Comércio S.A. (“Produquímica”), which operates two primary businesses in Brazil – agricultural productivity and chemical solutions.
CMI is a holding company with no significant operations other than those of its wholly-owned subsidiaries. The consolidated financial statements include the accounts of CMI and its wholly-owned subsidiaries. All significant intercompany balances and transactions have been eliminated in consolidation.
The Company uses the equity method of accounting for equity securities when it has significant influence or when it has more than a minor ownership interest or more than minor influence over an investee’s operations but does not have a controlling financial interest. Initial investments are recorded at cost (including certain transaction costs) and are adjusted by the Company’s share of the investees’ undistributed earnings and losses.
The accompanying unaudited consolidated financial statements have been prepared in accordance with U.S. generally accepted accounting principles (“U.S. GAAP”) for interim financial information and with the instructions to Form 10-Q and Article 10 of Regulation S-X. Accordingly, they do not include all of the information and footnotes required by U.S. GAAP for complete financial statements. These unaudited consolidated financial statements should be read in conjunction with the consolidated financial statements of the Company for the year ended December 31, 2017, as filed with the Securities and Exchange Commission in its Annual Report on Form 10-K. In the opinion of management, all adjustments, consisting of normal recurring adjustments considered necessary for a fair presentation, have been included.
The Company experiences a substantial amount of seasonality in its sales with respect to its deicing salt products. As a result, sales and operating income are generally higher in the first and fourth quarters and lower during the second and third quarters of each year. In particular, sales of highway and consumer deicing salt and magnesium chloride products vary based on the severity of the winter conditions in areas where the products are used. Following industry practice in North America and the U.K., the Company seeks to stockpile sufficient quantities of deicing salt throughout the second, third and fourth quarters to meet the estimated requirements for the upcoming winter season. Production of deicing salt can also vary based on the severity or mildness of the preceding winter season. Due to the seasonal nature of the deicing product lines, operating results for the interim periods are not necessarily indicative of the results that may be expected for the full year.
The Company’s plant nutrition business is also seasonal. For example, the strongest demand for the Company’s plant nutrition products in Brazil typically occurs during the spring planting season. As a result, the Company and its customers generally build inventories during the low demand periods of the year to ensure timely product availability during the peak sales season. The seasonality of this demand results in the Company’s sales volumes and sales for the Plant Nutrition South America segment usually being the highest during the third and fourth quarters of each year (as the spring planting season begins in September in Brazil).
Significant Accounting Policies
The Company’s significant accounting policies are detailed in “Note 2 – Summary of Significant Accounting Policies” within Item 8 of the Company’s Annual Report on Form 10-K for the year ended December 31, 2017. Significant changes to these accounting policies as a result of adopting ASU 2014-09, Revenue from Contracts with Customers (Topic 606), can be found in “Note 2 – Revenues.”
7
Recent Accounting Pronouncements
In February 2018, the Financial Accounting Standards Board (the “FASB”) issued guidance to address income tax accounting treatment of tax effects within accumulated other comprehensive income (“AOCI”) due to the enactment of the U.S. Tax Cuts and Jobs Act (the “Act”). This guidance allows entities to elect to reclassify tax effects of the change in U.S. income tax rates from AOCI to retained earnings. The guidance is effective for periods beginning after December 15, 2018, although early adoption is permitted. The Company early adopted this standard in the first quarter of 2018 and has elected to reclassify to retained earnings the effect of the change in the U.S. income tax rate on items remaining in AOCI as of the enactment date of the Act. The Company reclassified $0.2 million to retained earnings from AOCI as a result of the Company’s cash flow hedges. See the Consolidated Statement of Stockholders’ Equity for details on the reclassification.
In August 2017, the FASB issued guidance which amends the current hedge accounting model and requires certain new or modified disclosures to enable entities to better portray the economics of their risk management activities in their financial statements. The modifications include a tabular disclosure related to the effect on the income statement of fair value and cash flow hedges and eliminate the requirement to disclose the ineffective portion of the change in fair value of hedging instruments. The amendments also require new tabular disclosures related to cumulative basis adjustments for fair value hedges. The guidance is effective for fiscal years beginning after December 15, 2018 and interim periods within those fiscal years, although early adoption is permitted. The Company is currently assessing the impact this guidance will have on its consolidated financial statements.
In March 2017, the FASB issued guidance on the presentation of net periodic pension and postretirement benefit costs in the income statement and on the components eligible for capitalization. This guidance requires that an entity report the service cost component of the net periodic benefit costs in the same income statement line item as other compensation costs arising from services rendered by employees during the period. The non-service-cost components of net periodic benefit costs are to be presented in the income statement separately from the service cost components and outside a subtotal of income from operations. The guidance also allows for the capitalization of the service cost components, when applicable. The guidance is effective for annual periods beginning after December 15, 2017, including interim periods within those annual periods. The Company adopted this guidance in the first quarter of 2018. The impact of the adoption was not material to the Company’s consolidated financial statements.
In January 2017, the FASB issued guidance to simplify the accounting for goodwill impairment. The guidance removes Step 2 of the goodwill impairment test, which requires a hypothetical purchase price allocation. A goodwill impairment will now be the amount by which a reporting unit’s carrying value exceeds its fair value, not to exceed the carrying amount of goodwill. All other goodwill impairment guidance remains largely unchanged. The guidance is effective for fiscal years beginning after December 15, 2019, including interim periods within those fiscal years. Early adoption is permitted for annual and interim goodwill impairment testing dates after January 1, 2017. The Company is still evaluating the impact of adopting this guidance.
In August 2016, the FASB issued guidance to clarify how certain cash receipts and payments should be presented and classified in the statement of cash flows. The guidance is effective for fiscal years beginning after December 15, 2017, including interim periods within those fiscal years, and early adoption is permitted. The Company adopted this guidance in the first quarter of 2018 using the retrospective transition method, as required by the new standard. Adoption of this new standard did not have a material impact on the Company’s Consolidated Statements of Cash Flows.
In June 2016, the FASB issued guidance for estimating credit losses on certain types of financial instruments, including trade receivables, by introducing an approach based on expected losses. The expected loss approach will require entities to incorporate considerations of historical information, current information and reasonable and supportable forecasts. The guidance is effective for fiscal years beginning after December 15, 2019, including interim periods within those fiscal years, requires a modified retrospective transition method and early adoption is permitted. The Company is currently evaluating the impact of the adoption of this guidance on its consolidated financial statements.
In February 2016, the FASB issued guidance which requires lessees to recognize on their balance sheet a right-of-use asset which represents a lessee’s right to use the underlying asset. Under this guidance, an entity must also recognize a lease liability which represents a lessee’s obligation to make lease payments for the right to use the asset. In addition, the standard requires expanded qualitative and quantitative disclosures. The guidance is effective for fiscal years beginning after December 15, 2018, including interim periods within those fiscal years, and requires a modified retrospective transition method. The Company is currently in the process of gathering its lease contracts and evaluating the impact of the adoption of this guidance on its consolidated financial statements.
8
2. Revenues:
In May 2014, the FASB issued new guidance, "Revenue from Contracts with Customers." The new guidance provides a single, comprehensive model for recognizing revenue from contracts with customers. The new revenue recognition model supersedes existing guidance and requires revenue recognition to depict the transfer of promised goods or services to customers in an amount that reflects the consideration an entity expects to receive in exchange for those goods or services. The Company adopted the new guidance effective January 1, 2018 using the modified retrospective transition method, which requires the cumulative effect of adoption, if any, to be recognized as an adjustment to opening retained earnings in the period of adoption. The Company’s revenue arrangements generally consist of a single performance obligation to transfer promised goods or services. As a result, the Company did not identify any material differences in the amount and timing of revenue recognition for its revenue streams. Accordingly, the Company did not record any transition adjustment upon adoption of the new guidance.
Substantially all of the Company’s revenue will continue to be recognized at a point-in-time when control of the goods transfers to the customer. The adoption of the guidance results in expanded disclosures regarding the nature, amount, timing and uncertainty of revenues and cash flows from contracts with customers.
Revenue Recognition
Nature of Products and Services
The Company’s Salt segment products include salt and magnesium chloride for use in road deicing and dust control, food processing, water softeners, and agricultural and industrial applications. The Company’s plant nutrition products include SOP, specialty plant nutrients, and magnesium chloride for agricultural purposes and chemicals for the industrial chemical industry. In the U.K., the Company operates a records management business utilizing excavated areas of the Winsford salt mine with one other location in London, England.
Identifying the Contract
The Company accounts for a customer contract when there is approval and commitment from both parties, the rights of the parties and payment terms are identified, the contract has commercial substance and collectability of consideration is probable.
Identifying the Performance Obligations
At contract inception, the Company assesses the goods and services it has promised to its customers and identifies a performance obligation for each promise to transfer to the customer a distinct good or service (or bundle of goods or services). Determining whether products and services are considered distinct performance obligations that should be accounted for separately or aggregated together may require significant judgment.
Identifying and Allocating the Transaction Price
The Company’s revenues are measured based on consideration specified in the customer contract, net of any sales incentives and amounts collected on behalf of third parties such as sales taxes. In certain cases, the Company’s customer contracts may include promises to transfer multiple products and services to a customer. For multiple-element arrangements, the Company generally allocates the transaction price to each performance obligation in proportion to its stand-alone selling price.
When Performance Obligations Are Satisfied
The vast majority of the Company’s revenues are recognized at a point in time when the performance obligations are satisfied based upon transfer of control of the product or service to a customer. To determine when the control of goods is transferred, the Company typically assesses, among other things, the shipping terms of the contract, as shipping is an indicator of transfer of control. Some of the Company’s products are sold when the control of the goods transfers to the customer at the time of shipment. There are also instances when the Company provides shipping services to deliver its products. Shipping and handling costs that occur before the customer obtains control of the goods are deemed to be fulfillment activities and are accounted for as fulfillment costs. The Company has made an accounting policy election to recognize any shipping and handling costs that are incurred after the customer obtains control of the goods as fulfillment costs which are accrued at the time of revenue recognition.
Significant Payment Terms
The customer contract states the final terms of the sale, including the description, quantity and price of each product or service purchased. Payment is typically due in full within 30 days of delivery. As a practical expedient, the Company does not adjust the consideration for the effects of a significant financing component if the Company expects, at contract inception, that the period between when the good or service is transferred to the customer and when the customer pays for that good or service will be one year or less.
9
Refunds, Returns and Warranties
The Company’s products are generally not sold with a right of return and the Company does not generally provide credits or incentives, which may be required to be accounted for as variable consideration when estimating the amount of revenue to be recognized. The Company uses historical experience to estimate accruals for refunds due to manufacturing or other defects.
Practical Expedients and Accounting Policy Elections
Upon adoption of the new guidance, the Company elected: (i) to exclude disclosures of transaction prices allocated to remaining performance obligations when the Company recognized such revenue for all periods prior to the date of initial application of the new guidance, (ii) not to adjust the amount of consideration for the effects of a significant financing component when the Company expects, at contract inception, that the period between the Company's transfer of a product or service to a customer and when the customer pays for that product or service will be one year or less, (iii) to expense costs to obtain a contract as incurred for costs when the Company expects that the amortization period would have been one year or less, (iv) not to recast revenue for customer contracts that begin and end in the same fiscal period, and (v) not to assess whether promised goods or services are performance obligations if they are immaterial in the context of the customer contract.
See Note 10 for disaggregation of revenue by segment, type and geographical region.
3. | Acquisition: |
Background and Financing
On December 16, 2015, Compass Minerals do Brasil Ltda., a wholly owned subsidiary of the Company (“Compass Minerals Brazil”), entered into (i) a subscription agreement and other covenants (as amended, the “Subscription Agreement”) with certain Produquímica shareholders and Produquímica and (ii) a share purchase and sale agreement and other covenants (the “Purchase Agreement”) with certain Produquímica shareholders and Produquímica. Pursuant to the Subscription Agreement and the Purchase Agreement, Compass Minerals Brazil acquired 35% of the issued and outstanding capital stock of Produquímica on December 23, 2015, for R$452.4 million Brazilian reais (“R” or “BRL”), or $114.1 million U.S. dollars at closing, and paid additional consideration of $4.7 million in the second quarter of 2016 related to Produquímica’s 2015 financial performance.
The Subscription Agreement also contained a put right (the “Put”), allowing the Produquímica shareholders to sell the remainder of their interests in Produquímica to Compass Minerals Brazil. On August 12, 2016, Produquímica shareholders notified Compass Minerals Brazil of their exercise of the Put. On October 3, 2016, the Company acquired the remaining 65% of the issued and outstanding capital stock of Produquímica.
The Company entered into a new $100.0 million term loan tranche in the fourth quarter of 2015 to fund the acquisition of the 35% of Produquímica’s equity. In September 2016, the Company entered into a new $450.0 million term loan tranche to fund the acquisition of the remaining 65% of Produquímica’s equity. See Note 8 for more information regarding these financings.
Based in São Paulo, Brazil, Produquímica operates two primary businesses – agricultural productivity and chemical solutions. The agricultural productivity division manufactures and distributes a broad offering of specialty plant nutrition solution-based products. These include micronutrients, controlled release fertilizers and other specialty supplements that are used in direct soil and foliar applications, as well as through irrigation systems and for seed treatment. Many of these products are developed through Produquímica’s research and development capabilities. Produquímica also manufactures and markets specialty chemicals used primarily in the industrial chemical and water treatment industries in Brazil. The acquisition broadens the Company’s geographic scope of operations and expands its specialty plant nutrition portfolio while reducing the Company’s dependence on winter weather conditions.
Purchase Price Allocation
The Company accounted for the Produquímica acquisition as a business combination in accordance with U.S. GAAP. The accounting guidance for business combinations requires estimates and judgments regarding expectations for future cash flows of the acquired entity as well as other valuation assumptions and an allocation to the net assets acquired. The fair values assigned to tangible and intangible assets acquired and liabilities assumed, including contingent consideration, are based on management’s best estimates. As of September 30, 2017, the purchase price allocation was finalized.
10
A summary of the acquisition-date fair value of the consideration transferred is presented in the table below:
Fair Value of Consideration Transferred (in millions) | October 3, 2016 | ||
Cash paid at closing | $ | 317.1 | |
Additional cash due at closing | 20.6 | ||
Fair value of contingent consideration | 31.4 | ||
Fair value of 35% equity investment | 178.7 | ||
Total | $ | 547.8 | |
The calculation of the purchase price at closing was based in part on an estimate of full-year 2016 operating results of Produquímica. As of the acquisition closing date, some of the periods included in the 2016 operating results of Produquímica had not ended and actual results were not known. The portion of the purchase price which was based on management’s estimate of results relating to periods which occurred after the closing date was classified as contingent consideration. There were no thresholds or tiers in the payment structure, and management used an income approach to estimate the acquisition date fair value of the contingent consideration. As of the closing date, the Company had estimated the fair value of contingent consideration to be $31.4 million.
During the first quarter of 2017, the purchase price was adjusted based on the final full-year 2016 operating results of Produquímica, and a final payment was made to the Produquímica shareholders. The difference between the estimated closing date fair value of the contingent consideration and the final amount paid resulted in the recognition of a gain of $1.9 million in the first quarter of 2017, which was included as a component of operating earnings in the Company’s Plant Nutrition South America segment.
Prior to the acquisition closing date, the Company accounted for its 35% interest in Produquímica as an equity method investment. The acquisition-date fair value of the previously held equity investment was $178.7 million and is included in the consideration transferred. To measure the acquisition closing date fair value of the equity interest, the Company utilized a market-based approach which relied on Level 3 inputs (see Note 13 for a discussion of the levels in the fair value hierarchy). The Company recognized a $59.3 million non-cash gain during the fourth quarter of 2016 as a result of remeasuring its prior equity interest in Produquímica held before the business combination.
Under the acquisition method of accounting, the total purchase price was allocated on a preliminary basis to Produquímica’s assets and liabilities based upon their estimated fair value as of the closing date of the acquisition. During the first nine months of 2017, the Company adjusted the preliminary purchase price allocation based on additional information obtained regarding facts and circumstances which existed as of the acquisition date. These adjustments resulted in a decrease of $3.6 million to goodwill, a decrease of $4.4 million to other noncurrent liabilities and an increase of $0.8 million to net deferred income taxes. Additionally, during the third quarter of 2017 in connection with finalizing the accounting for the acquisition, the Company recorded an adjustment increasing depreciation expense by $1.9 million. This adjustment resulted from finalizing the Company’s estimate of the useful lives of acquired tangible assets.
11
Based upon the final purchase price and the updated valuation, the final purchase price allocation is presented in the table below:
Recognized amounts of identifiable assets acquired and liabilities assumed (in millions): | Purchase Price Allocation | ||
Cash and cash equivalents | $ | 73.8 | |
Accounts receivable | 89.4 | ||
Inventories | 77.1 | ||
Other current assets | 13.7 | ||
Property, plant and equipment | 189.4 | ||
Intangible assets | 81.2 | ||
Investment in equity method investee | 24.5 | ||
Other noncurrent assets | 6.9 | ||
Accounts payable | (27.1 | ) | |
Accrued expenses | (40.3 | ) | |
Current portion of long-term debt | (129.6 | ) | |
Other current liabilities | (14.0 | ) | |
Long-term debt, net of current portion | (62.0 | ) | |
Deferred income taxes, net | (66.0 | ) | |
Other noncurrent liabilities | (21.9 | ) | |
Total identifiable net assets | 195.1 | ||
Goodwill | 352.7 | ||
Total fair value of business combination | $ | 547.8 | |
The total purchase price in excess of the net identifiable assets has been recognized as goodwill in the amount of $352.7 million and has been assigned to the Company’s Plant Nutrition South America segment. The goodwill recognized is attributable primarily to expected synergies with the Company’s existing plant nutrition business and the assembled workforce of Produquímica. The future deductibility of the goodwill for income tax purposes is uncertain at this time.
The Company determined that the book value of the accounts receivables included in the purchase price allocation approximates their fair value due to their short-term nature. The gross contractual amounts of the receivables exceeded their fair value by the amount of an allowance for doubtful accounts of approximately $8 million.
In connection with the acquisition, the Company acquired identifiable intangible assets which consisted principally of trade names, developed technologies and customer relationships. The fair values were determined using Level 3 inputs (see Note 13 for a discussion of the levels in the fair value hierarchy). The fair values of the identifiable intangible assets were estimated using an income approach method.
The estimated fair values and weighted average amortization period of the identifiable intangible assets are presented in the table below:
Estimated Fair Value (in millions) | Weighted-Average Amortization Period (in years) | |||
Trade names | $ | 36.9 | 11.0 | |
Developed technology | 37.5 | 5.3 | ||
Customer relationships | 6.8 | 13.5 | ||
Total identifiable intangible assets | $ | 81.2 | 8.6 | |
Impact on Operating Results
During the three months ended March 31, 2018 and 2017, respectively, Produquímica contributed revenues of $66.3 million and $61.3 million, respectively, and net losses of $2.7 million and $2.6 million, respectively, to the Company.
12
4. | Inventories: |
Inventories consist of the following (in millions):
March 31, 2018 | December 31, 2017 | ||||||
Finished goods | $ | 130.0 | $ | 208.4 | |||
Raw materials and supplies | 87.2 | 81.5 | |||||
Total inventories | $ | 217.2 | $ | 289.9 | |||
5. | Property, Plant and Equipment, Net: |
Property, plant and equipment, net, consists of the following (in millions):
March 31, 2018 | December 31, 2017 | ||||||
Land, buildings and structures, and leasehold improvements | $ | 560.7 | $ | 552.5 | |||
Machinery and equipment | 995.9 | 942.3 | |||||
Office furniture and equipment | 53.5 | 53.1 | |||||
Mineral interests | 172.3 | 173.1 | |||||
Construction in progress | 143.1 | 213.4 | |||||
1,925.5 | 1,934.4 | ||||||
Less accumulated depreciation and depletion | (800.7 | ) | (796.3 | ) | |||
Property, plant and equipment, net | $ | 1,124.8 | $ | 1,138.1 | |||
6. | Goodwill and Intangible Assets, Net: |
Aggregate amortization expense for the Company’s finite-lived intangible assets was $4.1 million for both three-month periods ended March 31, 2018 and 2017, respectively.
The Company had goodwill of $402.8 million and $405.0 million as of March 31, 2018 and December 31, 2017, respectively, in its Consolidated Balance Sheets. Of these amounts, $55.7 million and $57.3 million as of March 31, 2018 and December 31, 2017, respectively, were recorded in the Company’s Plant Nutrition North America segment, and $340.9 million and $341.6 million as of March 31, 2018 and December 31, 2017, respectively, were recorded in the Company’s Plant Nutrition South America segment. The remaining amounts in both periods were immaterial and recorded in the Company’s Salt segment and corporate and other. The change in goodwill between December 31, 2017 and March 31, 2018 was primarily due to the impact from translating foreign-denominated amounts to U.S. dollars.
7. | Income Taxes: |
The Company’s effective income tax rate differs from the U.S. statutory federal income tax rate primarily due to U.S. statutory depletion, state income taxes (net of federal tax benefit), foreign income tax rate differentials, foreign mining taxes and interest expense recognition differences for book and tax purposes. The Company’s effective rate is impacted by permanent tax deductions which have a less favorable impact as pretax income increases.
The Company has recorded a one-time mandatory tax on unremitted foreign earnings of $55.2 million (recorded in the fourth quarter of 2017) offset by $8.6 million ($8.4 million recorded in the fourth quarter of 2017) of benefit related to the remeasurement of the Company’s deferred tax liabilities at the new income tax rate in accordance with the Act (which is commonly referred to as “U.S. tax reform”), enacted on December 22, 2017. The Company believes the $46.6 million net charge represents a reasonable estimate; however, this amount is provisional and additional work is necessary to do a more detailed analysis of historical foreign earnings as well as any potential corresponding adjustments.
In addition, the Company is still evaluating the Global Low-Taxed Intangible Income provisions of the Act and their impact, if any, on its consolidated financial statements. As a result, the Company has not included an estimate of any potential tax exposure related to this item as of March 31, 2018.
13
The Company had $45.7 million and $46.1 million as of March 31, 2018 and December 31, 2017, respectively, of gross foreign federal net operating loss (“NOL”) carryforwards that have no expiration date. In addition, the Company had $5.5 million and $5.7 million as of March 31, 2018 and December 31, 2017, respectively, of gross foreign federal NOL carryforwards which expire beginning in 2033 and $0.7 million as of March 31, 2018 and December 31, 2017 of tax-effected state NOL carryforwards which expire beginning in 2033.
Canadian provincial tax authorities have challenged tax positions claimed by one of the Company’s Canadian subsidiaries and have issued tax reassessments for years 2002-2012. The reassessments are a result of ongoing audits and total $103.6 million, including interest, through March 31, 2018. The Company disputes these reassessments and will continue to work with the appropriate authorities in Canada to resolve the dispute. There is a reasonable possibility that the ultimate resolution of this dispute, and any related disputes for other open tax years, may be materially higher or lower than the amounts the Company has reserved for such disputes. In connection with this dispute, local regulations require the Company to post security with the tax authority until the dispute is resolved. The Company has posted collateral in the form of a $65.0 million performance bond, has paid $38.0 million to the Canadian tax authorities (most of which is recorded in other assets in its Consolidated Balance Sheets) and the remaining balance of $0.6 million, which is necessary to proceed with future appeals or litigation, is expected to be addressed later this year.
The Company expects that it will be required by local regulations to provide security for additional interest on the above unresolved disputed amounts and for any future reassessments issued by these Canadian tax authorities in the form of cash, letters of credit, performance bonds, asset liens or other arrangements agreeable with the tax authorities until the disputes are resolved.
The Company expects that the ultimate outcome of these matters will not have a material impact on its results of operations or financial condition. However, the Company can provide no assurance as to the ultimate outcome of these matters, and the impact could be material if they are not resolved in the Company’s favor. As of March 31, 2018, the Company believes it has adequately reserved for these reassessments.
Additionally, the Company has other uncertain tax positions as well as assessments and disputed positions with taxing authorities in its various jurisdictions, which are consistent with those matters disclosed in the Company’s Annual Report on Form 10-K for the year ended December 31, 2017.
Settlement
In the fourth quarter of 2017, the Company, the Canadian Revenue Authority and the U.S. Internal Revenue Service reached a settlement agreement on transfer pricing issues for the Company’s 2007-2012 tax years. As a result of this settlement, the Company recognized $13.8 million of tax expense in its 2017 Consolidated Statements of Operations related to the Company’s Canadian tax positions for the years 2007-2016. The agreement resulted in intercompany cash payments from the Company’s U.S. subsidiary to its Canadian subsidiary of $85.7 million during the first quarter of 2018.
In addition, the Company will make tax payments to Canadian taxing authorities of $22.7 million with a corresponding tax refund due from U.S. taxing authorities of $22.8 million. The timing of the refund is expected to lag the payment to the Canadian tax authorities by one year or more. Additionally, the reassessed Canadian tax, penalties and interest for the Company for years 2007 and 2008 of approximately $34.2 million are effectively resolved.
14
8. | Long-term Debt: |
Long-term debt consists of the following (in millions):
March 31, 2018 | December 31, 2017 | ||||||
Term Loans due July 2021 | $ | 835.2 | $ | 837.4 | |||
Revolving Credit Facility due July 2021 | 46.5 | 168.9 | |||||
4.875% Senior Notes due July 2024 | 250.0 | 250.0 | |||||
Rabobank Loan due November 2019 | 21.1 | 21.1 | |||||
Banco Itaú Loans due May 2019 to April 2020 | 1.7 | 1.9 | |||||
Financiadora de Estudos e Projetos Loan due November 2023 | 12.5 | 13.1 | |||||
Banco do Brasil Loan due February 2018 | — | 0.2 | |||||
Banco do Brasil Loan due May 2018 and September 2018 | 0.6 | — | |||||
Banco Santander Loan due September 2019 | 19.5 | 19.6 | |||||
Banco Santander Loan due November 2019 | 24.1 | 24.1 | |||||
Banco Itaú Loan due March 2019 | 10.0 | 12.4 | |||||
3.7% Banco Itaú Loan due March 2020 | 15.4 | — | |||||
Banco Scotiabank Loan due September 2019 | 20.5 | 20.5 | |||||
1,257.1 | 1,369.2 | ||||||
Less unamortized debt issuance costs | (6.6 | ) | (6.7 | ) | |||
Total debt | 1,250.5 | 1,362.5 | |||||
Less current portion | (32.3 | ) | (32.1 | ) | |||
Long-term debt | $ | 1,218.2 | $ | 1,330.4 | |||
In September 2017, the Company entered into an amendment to its credit agreement, which increased the maximum allowed leverage ratio under the credit agreement through September 2018. In connection with this amendment, the Company paid fees totaling $0.6 million ($0.1 million was recorded as an expense and $0.5 million was capitalized as deferred financing costs).
In the second half of 2017, the Company refinanced $54.3 million of its Brazilian loans using proceeds from approximately $87 million of new loans. The new variable rate loans bear interest rates ranging from 108.7% and 118% of CDI, an overnight inter-bank lending rate in Brazil, and mature in September and November 2019. In the first quarter of 2018, the Company entered into a new U.S. dollar denominated loan which matures in March 2020. No material fees were paid in connection with these transactions. A portion of the loans are denominated in U.S. dollars and a portion of the loans are denominated in Brazilian reais. The Company has also entered into foreign currency agreements whereby the Company agreed to swap interest and principal payments on the loans denominated in U.S. dollars for principal and interest payments denominated in Brazilian reais, Produquímica’s functional currency (see Note 12 for further discussion).
As of March 31, 2018, the term loans and revolving credit facility under the credit agreement were secured by substantially all existing and future U.S. assets, the Goderich mine in Ontario, Canada, and capital stock of certain subsidiaries.
9. | Commitments and Contingencies: |
The Company was involved in proceedings alleging unfair labor practices at its Cote Blanche, Louisiana mine. This matter arose out of a labor dispute between the Company and the United Steelworkers Union over the terms of a contract for certain employees at the mine. These employees initiated a strike that began on April 7, 2010 and ended on June 15, 2010. In September 2012, the U.S. National Labor Relations Board (the “NLRB”) issued a decision finding that the Company had committed unfair labor practices in connection with the labor dispute. Under the ruling, the Company is responsible for back pay to affected employees as a result of changes made in union work rules and past practices beginning April 1, 2010. In the fourth quarter of 2013, this ruling was upheld by an appeals court. As of December 31, 2016, the Company had recorded a reserve of $7.4 million in its consolidated financial statements related to expected payments, including interest, required to resolve the dispute.
15
In March 2017, the Company reached a settlement with the United Steelworkers Union and the NLRB with respect to this matter. Under the terms of the agreement, the Company paid $7.7 million to the affected employees in the second quarter of 2017. As a result of the settlement, the Company recognized an immaterial loss in its consolidated financial statements in 2017.
The Wisconsin Department of Agriculture, Trade and Consumer Protection (“DATCP”) has information indicating that agricultural chemicals are present within the subsurface area of the Company’s Kenosha, Wisconsin plant. The agricultural chemicals were used by previous owners and operators of the site. None of the identified chemicals have been used in association with the Company’s operations since it acquired the property in 2002. DATCP directed the Company to conduct further investigations into the possible presence of agricultural chemicals in soil and ground water at the Kenosha plant. The Company has completed initial on-property investigations and has provided the findings to DATCP. All investigations and mitigation activities to date, and any potential future remediation work, are being conducted under the Wisconsin Agricultural Chemical Cleanup Program (the “ACCP”), which provides for reimbursement of some of the costs. The Company may seek participation by, or cost reimbursement from, other parties responsible for the presence of any agricultural chemicals found in soil and ground water at this site if the Company does not receive an acknowledgment of no further action and is required to conduct further investigation or remedial work that may not be eligible for reimbursement under the ACCP.
The Company conducts business operations in several countries and is subject to various federal and local labor, social security, environmental and tax laws. While the Company believes it complies with such laws, they are complex and subject to interpretation. In addition to the tax assessments discussed in Note 7, the Company’s Brazilian subsidiaries are party to administrative tax proceedings and claims which totaled $18.2 million and $18.1 million as of March 31, 2018 and December 31, 2017, respectively, and relate primarily to value added tax, state tax (ICMS) and social security tax (PIS and COFINS) assessments. The Company has assessed the likelihood of a loss at less than probable and therefore, has not established a reserve for these matters. The Company also assumed liabilities for labor-related matters in connection with the acquisition of Produquímica, which are primarily related to compensation, labor benefits and consequential tax claims and totaled $10.0 million and $10.5 million as of March 31, 2018 and December 31, 2017, respectively. The Company believes the maximum exposure for these other labor matters totaled approximately $40 million and $41 million as of March 31, 2018 and December 31, 2017, respectively.
The Company is also involved in legal and administrative proceedings and claims of various types from the ordinary course of the Company’s business.
Management cannot predict the outcome of legal claims and proceedings with certainty. Nevertheless, management believes that the outcome of legal proceeding and claims, which are pending or known to be threatened, even if determined adversely, will not, individually or in the aggregate, have a material adverse effect on the Company’s results of operations, cash flows or financial position.
10. | Operating Segments: |
The Company’s reportable segments are strategic business units that offer different products and services, and each business requires different technology and marketing strategies. The Company has three reportable segments: Salt, Plant Nutrition North America and Plant Nutrition South America. The Salt segment produces and markets salt and magnesium chloride for use in road deicing and dust control, food processing, water softeners and agricultural and industrial applications. SOP crop nutrients, industrial-grade SOP, micronutrients and magnesium chloride for agricultural purposes are produced and marketed through the Plant Nutrition North America segment. This segment operates two primary businesses in Brazil – agricultural productivity and chemical solutions. See Note 3 for a further discussion of the acquisition. The agricultural productivity division manufactures and distributes a broad offering of specialty plant nutrition solution-based products that are used in direct soil and foliar applications, as well as through irrigation systems and for seed treatment. The Company’s Plant Nutrition South America segment also manufactures and markets specialty chemicals for the industrial chemical industry.
16
Segment information is as follows (in millions):
Three Months Ended March 31, 2018 | Salt | Plant Nutrition North America | Plant Nutrition South America | Corporate & Other(a) | Total | |||||||||||||||
Sales to external customers | $ | 315.9 | $ | 52.9 | $ | 66.3 | $ | 2.8 | $ | 437.9 | ||||||||||
Intersegment sales | — | 0.2 | 0.4 | (0.6 | ) | — | ||||||||||||||
Shipping and handling cost | 109.5 | 6.4 | 4.2 | — | 120.1 | |||||||||||||||
Operating earnings (loss) | 34.1 | 4.9 | 0.8 | (13.2 | ) | 26.6 | ||||||||||||||
Depreciation, depletion and amortization | 14.7 | 11.3 | 5.9 | 2.4 | 34.3 | |||||||||||||||
Total assets (as of end of period) | 885.7 | 580.0 | 816.8 | 130.3 | 2,412.8 | |||||||||||||||
Three Months Ended March 31, 2017 | Salt | Plant Nutrition North America | Plant Nutrition South America | Corporate & Other(a) | Total | |||||||||||||||
Sales to external customers | $ | 274.8 | $ | 49.2 | $ | 61.3 | $ | 2.5 | $ | 387.8 | ||||||||||
Intersegment sales | — | 0.9 | — | (0.9 | ) | — | ||||||||||||||
Shipping and handling cost | 83.0 | 6.7 | 4.0 | — | 93.7 | |||||||||||||||
Operating earnings (loss) | 45.4 | 7.6 | 1.8 | (13.4 | ) | 41.4 | ||||||||||||||
Depreciation, depletion and amortization | 12.9 | 8.9 | 5.3 | 1.3 | 28.4 | |||||||||||||||
Total assets (as of end of period) | 854.4 | 583.4 | 834.7 | 50.8 | 2,323.3 | |||||||||||||||
Disaggregated revenue by product type is as follows (in millions):
Three Months Ended March 31, 2018 | Salt | Plant Nutrition North America | Plant Nutrition South America | Corporate & Other(a) | Total | |||||||||||||||
Highway Deicing Salt | $ | 235.4 | $ | — | $ | — | $ | — | $ | 235.4 | ||||||||||
Consumer & Industrial Salt | 80.5 | — | — | — | 80.5 | |||||||||||||||
SOP and Specialty Plant Nutrients | — | 53.1 | 39.9 | — | 93.0 | |||||||||||||||
Industrial Chemicals | — | — | 26.8 | — | 26.8 | |||||||||||||||
Eliminations & Other | — | (0.2 | ) | (0.4 | ) | 2.8 | 2.2 | |||||||||||||
Sales to external customers | $ | 315.9 | $ | 52.9 | $ | 66.3 | $ | 2.8 | $ | 437.9 | ||||||||||
(a) | Corporate and other includes corporate entities, records management operations and other incidental operations and eliminations. Operating earnings (loss) for corporate and other includes indirect corporate overhead, including costs for general corporate governance and oversight, as well as costs for the human resources, information technology, legal and finance functions. |
The Company’s revenue by geographic area is as follows (in millions):
Revenue | Three Months Ended March 31, 2018 | |||
United States(a) | $ | 242.2 | ||
Canada | 90.8 | |||
Brazil | 65.6 | |||
United Kingdom | 36.7 | |||
Other | 2.6 | |||
Total Revenue | $ | 437.9 | ||
(a) United States sales exclude product sold to foreign customers at U.S. ports. | ||||
17
11. | Stockholders’ Equity and Equity Instruments: |
In May 2015, the Company’s stockholders approved the 2015 Incentive Award Plan (the “2015 Plan”), which authorizes the issuance of 3,000,000 shares of Company common stock. Since the date the 2015 Plan was approved, the Company ceased issuing equity awards under the 2005 Incentive Award Plan (the “2005 Plan”). The 2005 Plan and 2015 Plan allow for grants of equity awards to executive officers, other employees and directors, including restricted stock units (“RSUs”), performance stock units (“PSUs”), stock options and deferred stock units. The grants occur following approval by the compensation committee of the Company’s board of directors, with the amount and terms communicated to employees shortly thereafter.
Options
Substantially all stock options granted under the 2005 Plan and 2015 Plan vest ratably, in tranches, over a four-year service period. Unexercised options expire after seven years. Options do not have dividend or voting rights. Upon vesting, each option can be exercised to purchase one share of the Company’s common stock. The exercise price of options is equal to the closing stock price on the grant date.
To estimate the fair value of options on the grant date, the Company uses the Black-Scholes option valuation model. Award recipients are grouped according to expected exercise behavior. Unless better information is available to estimate the expected term of the options, the estimate is based on historical exercise experience. The risk-free rate, using U.S. Treasury yield curves in effect at the time of grant, is selected based on the expected term of each group. The Company’s historical stock price is used to estimate expected volatility.
RSUs
Substantially all of the RSUs granted under the 2005 Plan and 2015 Plan vest after three years of service, entitling the holders to one share of common stock for each vested RSU. Unvested RSUs do not have voting rights but are entitled to receive non-forfeitable dividends (generally after a performance hurdle has been satisfied for the year of the grant) or other distributions equal to those declared on the Company’s common stock for RSUs that are earned as a result of the satisfaction of the performance hurdle. The closing stock price on the grant date is used to determine the fair value of RSUs.
PSUs
Substantially all of the PSUs granted under the 2005 Plan and 2015 Plan are either total shareholder return PSUs (“TSR PSUs”) or return on invested capital PSUs (“ROIC PSUs”). The actual number of shares of the Company’s common stock that may be earned with respect to TSR PSUs is calculated by comparing the Company’s total shareholder return to the total shareholder return for each company comprising the Russell 3000 Index (for TSR PSUs granted in 2017 and earlier) or the Company’s peer group (for TSR PSUs granted in 2018) over the three-year performance period and may range from 0% to 150% of the target number of shares based upon the attainment of these performance conditions. The actual number of shares of common stock that may be earned with respect to ROIC PSUs is calculated based on the average of the Company’s annual return on invested capital for each year in the three-year performance period and may range from 0% to 200% of the target number of shares based upon the attainment of these performance conditions.
PSUs represent a target number of shares of the Company’s common stock that may be earned before adjustment based upon the attainment of certain performance conditions. Holders of PSUs do not have voting rights but are entitled to receive non-forfeitable dividends or other distributions equal to those declared on the Company’s common stock for PSUs that are earned, which are paid when the shares underlying the PSUs are paid.
To estimate the fair value of the TSR PSUs on the grant date, the Company uses a Monte-Carlo simulation model, which simulates future stock prices of the Company as well as the companies comprising the Russell 3000 Index. This model uses historical stock prices to estimate expected volatility and the Company’s correlation to the Russell 3000 Index. The risk-free rate was determined using the same methodology as the option valuations as discussed above. The Company’s closing stock price on the grant date was used to estimate the fair value of the ROIC PSUs. The Company will adjust the expense of the ROIC PSUs based upon its estimate of the number of shares that will ultimately vest at each interim date during the vesting period.
During the three months ended March 31, 2018, the Company reissued the following number of shares from treasury stock: no shares related to the exercise of stock options, 15,080 shares related to the release of RSUs which vested, 2,753 shares related to the release of PSUs which vested and 4,314 shares related to stock payments. The Company recognized a tax deficiency of $0.1 million from its equity compensation awards as an increase to income tax expense during the first three months of 2018. During the first three months of 2018 and 2017, the Company recorded $1.1 million and $1.3 million, respectively, of compensation
18
expense pursuant to its stock-based compensation plans. No amounts have been capitalized. The following table summarizes stock-based compensation activity during the three months ended March 31, 2018:
Stock Options | RSUs | PSUs(a) | |||||||||||||||||||
Number | Weighted-average exercise price | Number | Weighted-average fair value | Number | Weighted-average fair value | ||||||||||||||||
Outstanding at December 31, 2017 | 562,877 | $ | 75.89 | 70,856 | $ | 74.63 | 112,036 | $ | 79.48 | ||||||||||||
Granted | — | — | — | — | — | — | |||||||||||||||
Exercised(b) | — | — | — | — | — | — | |||||||||||||||
Released from restriction(b) | — | — | (15,080 | ) | 89.58 | (2,753 | ) | 78.92 | |||||||||||||
Cancelled/expired | (26,075 | ) | 81.94 | (1,344 | ) | 72.63 | (28,440 | ) | 96.97 | ||||||||||||
Outstanding at March 31, 2018 | 536,802 | $ | 75.60 | 54,432 | $ | 70.53 | 80,843 | $ | 73.35 | ||||||||||||
(a) | Until they vest, PSUs are included in the table at the target level at their grant date and at that level represent one share of common stock per PSU. The performance period for the 2015 PSU grant ended in 2017. The Company cancelled 25,897 PSUs in 2018 related to the 2015 PSU grant. |
(b) | Common stock issued for exercised options and for vested and earned RSUs and PSUs was issued from treasury stock. |
Other Comprehensive Income (Loss)
The Company’s comprehensive income (loss) is comprised of net earnings, net amortization of the unrealized loss of the pension obligation, the change in the unrealized gain (loss) on natural gas and foreign currency swap cash flow hedges, and foreign currency translation adjustments. The components of and changes in accumulated other comprehensive income (loss) (“AOCI”) as of and for the three months ended March 31, 2018 and 2017, are as follows (in millions):
Three Months Ended March 31, 2018(a) | Gains and (Losses) on Cash Flow Hedges | Defined Benefit Pension | Foreign Currency | Total | |||||||||||
Beginning balance | $ | (0.9 | ) | $ | (3.9 | ) | $ | (73.1 | ) | $ | (77.9 | ) | |||
Other comprehensive loss before reclassifications(b) | (0.2 | ) | — | (14.4 | ) | (14.6 | ) | ||||||||
Amounts reclassified from accumulated other comprehensive loss | (0.3 | ) | 0.1 | — | (0.2 | ) | |||||||||
Net current period other comprehensive income (loss) | (0.5 | ) | 0.1 | (14.4 | ) | (14.8 | ) | ||||||||
Reclassification of stranded tax out of AOCI to retained earnings(c) | (0.2 | ) | — | — | (0.2 | ) | |||||||||
Ending balance | $ | (1.6 | ) | $ | (3.8 | ) | $ | (87.5 | ) | $ | (92.9 | ) | |||
Three Months Ended March 31, 2017(a) | Gains and (Losses) on Cash Flow Hedges | Defined Benefit Pension | Foreign Currency | Total | |||||||||||
Beginning balance | $ | 0.6 | $ | (3.7 | ) | $ | (101.8 | ) | $ | (104.9 | ) | ||||
Other comprehensive income (loss) before reclassifications(b) | (0.5 | ) | — | 14.8 | 14.3 | ||||||||||
Amounts reclassified from accumulated other comprehensive loss | — | 0.1 | — | 0.1 | |||||||||||
Net current period other comprehensive income (loss) | (0.5 | ) | 0.1 | 14.8 | 14.4 | ||||||||||
Ending balance | $ | 0.1 | $ | (3.6 | ) | $ | (87.0 | ) | $ | (90.5 | ) | ||||
(a) | With the exception of the cumulative foreign currency translation adjustment, for which no tax effect is recorded, the changes in the components of accumulated other comprehensive income (loss) presented in the tables above are reflected net of applicable income taxes. |
(b) | The Company recorded foreign exchange (gains) losses of $(4.4) million and $7.2 million in the three months ended March 31, 2018 and 2017, respectively, in accumulated other comprehensive loss related to intercompany notes which were deemed to be of long-term investment nature. |
(c) | In the first quarter of 2018, the Company adopted guidance which allows entities to reclassify tax effects of the change in U.S. income tax rates from AOCI to retained earnings (see Note 1). |
19
The amounts reclassified from AOCI to expense for the three months ended March 31, 2018 and 2017, are shown below (in millions):
Three Months Ended March 31, 2018 | Three Months Ended March 31, 2017 | Line Item Impacted in the Consolidated Statement of Operations | |||||||
Gains and (losses) on cash flow hedges: | |||||||||
Natural gas instruments | $ | — | $ | — | Product cost | ||||
Foreign currency swaps | (0.5 | ) | — | Interest expense | |||||
Income tax expense (benefit) | 0.2 | — | |||||||
Reclassifications, net of income taxes | (0.3 | ) | — | ||||||
Amortization of defined benefit pension: | |||||||||
Amortization of loss | $ | 0.1 | $ | 0.1 | Product cost | ||||
Income tax expense (benefit) | — | — | |||||||
Reclassifications, net of income taxes | 0.1 | 0.1 | |||||||
Total reclassifications, net of income taxes | $ | (0.2 | ) | $ | 0.1 | ||||
12. | Derivative Financial Instruments: |
The Company is subject to various types of market risks, including interest rate risk, foreign currency exchange rate transaction and translation risk and commodity pricing risk. Management may take actions to mitigate the exposure to these types of risks, including entering into forward purchase contracts and other financial instruments. Currently, the Company manages a portion of its commodity pricing and foreign currency exchange rate risks by using derivative instruments. The Company does not seek to engage in trading activities or take speculative positions with any financial instrument arrangement. The Company has entered into natural gas derivative instruments and foreign currency derivative instruments with counterparties it views as creditworthy. However, the Company does attempt to mitigate its counterparty credit risk exposures by, among other things, entering into master netting agreements with some of these counterparties.The Company records derivative financial instruments as either assets or liabilities at fair value in the Consolidated Balance Sheets.
Derivatives qualify for treatment as hedges when there is a high correlation between the change in fair value of the derivative instrument and the related change in value of the underlying hedged item. Depending on the exposure being hedged, the Company must designate the hedging instrument as a fair value hedge, a cash flow hedge or a net investment in foreign operations hedge. For the qualifying derivative instruments that have been designated as hedges, the effective portion of the change in fair value is recognized through earnings when the underlying transaction being hedged affects earnings, allowing a derivative’s gains and losses to offset related results from the hedged item in the statements of operations. Any ineffectiveness related to these hedges was not material for any of the periods presented. For derivative instruments that have not been designated as hedges, the entire change in fair value is recorded through earnings in the period of change.
Natural Gas Derivative Instruments
Natural gas is consumed at several of the Company’s production facilities, and a change in natural gas prices impacts the Company’s operating margin. The Company’s objective is to reduce the earnings and cash flow impacts of changes in market prices of natural gas by fixing the purchase price of up to 90% of its forecasted natural gas usage. It is the Company’s policy to consider hedging portions of its natural gas usage up to 36 months in advance of the forecasted purchase. As of March 31, 2018, the Company had entered into natural gas derivative instruments to hedge a portion of its natural gas purchase requirements through December 2019. As of March 31, 2018 and December 31, 2017, the Company had agreements in place to hedge forecasted natural gas purchases of 2.0 million and 2.6 million MMBtus, respectively. All natural gas derivative instruments held by the Company as of March 31, 2018 and December 31, 2017 qualified and were designated as cash flow hedges. As of March 31, 2018, the Company expects to reclassify from accumulated other comprehensive loss to earnings during the next twelve months $0.9 million of net losses on derivative instruments related to its natural gas hedges.
Foreign Currency Derivatives Not Designated as Hedges
In February 2018, the Company entered into a forward instrument to swap currency denominated in Brazilian reais to Canadian dollars for the amounts borrowed under an intercompany note. The instrument matures in November 2018 and is for a notional amount of approximately $20 million U.S. dollars. The objective of the instrument is to mitigate the foreign currency fluctuation risk related to holding debt denominated in a currency other than Produquímica’s functional currency. The instrument is not
20
designated as a hedge. During the three months ended March 31, 2018, the Company recognized a gain of $0.3 million in its Consolidated Statements of Operations for the change in fair value of the swap agreements not designated as hedges.
Foreign Currency Swaps Designated as Hedges
The Company has entered into U.S. dollar-denominated debt instruments to provide funds for its operations in Brazil (see Note 8 for more information). The Company may also concurrently enter into foreign currency swap agreements whereby the Company agrees to swap interest and principal payments on loans denominated in U.S. dollars for principal and interest payments denominated in Brazilian reais, Produquímica’s functional currency. The objective of the swap agreements is to mitigate the foreign currency fluctuation risk related to holding debt denominated in a currency other than Produquímica’s functional currency. As of March 31, 2018, the Company had swap agreements in place to hedge $46.2 million of loans denominated in currencies other than Produquímica’s functional currency. Payments on these loans are due on various dates extending through March 2020. As of March 31, 2018, these foreign currency swap derivative instruments qualified and were designated as cash flow hedges. As of March 31, 2018, the Company expects to reclassify from accumulated other comprehensive loss to earnings during the next twelve months $0.8 million of net gains on derivative instruments related to these foreign currency swap agreements.
The following tables present the fair value of the Company’s hedged items as of March 31, 2018 and December 31, 2017 (in millions):
Asset Derivatives | Liability Derivatives | |||||||||||
Derivatives designated as hedging instruments: | Balance Sheet Location | March 31, 2018 | Balance Sheet Location | March 31, 2018 | ||||||||
Commodity contracts | Other current assets | $ | — | Accrued expenses | $ | 0.9 | ||||||
Commodity contracts | Other assets | — | Other noncurrent liabilities | 0.5 | ||||||||
Swap contracts | Other current assets | 0.8 | Accrued expenses | — | ||||||||
Swap contracts | Other assets | 0.3 | Other noncurrent liabilities | — | ||||||||
Total derivatives designated as hedging instruments(a) | 1.1 | 1.4 | ||||||||||
Derivatives not designated as hedging instruments: | ||||||||||||
Forward contracts | Other current assets | $ | 0.3 | Accrued expenses | $ | — | ||||||
Total derivatives not designated as hedging instruments | 0.3 | — | ||||||||||
Total derivatives(b) | $ | 1.4 | $ | 1.4 | ||||||||
(a) | The Company has master netting agreements with its commodity hedge counterparties and accordingly has netted in its Consolidated Balance Sheets an immaterial amount receivable from one counterparty. |
(b) | The Company has commodity hedge and foreign currency agreements with two and three counterparties, respectively. Amounts recorded as liabilities for the Company’s commodity contracts are payable to two counterparties. The amounts recorded as receivables for the Company’s swap contracts are receivable from two counterparties. The amounts recorded as receivables for the Company’s forward contracts are due from one counterparty. |
Asset Derivatives | Liability Derivatives | |||||||||||
Derivatives designated as hedging instruments: | Balance Sheet Location | December 31, 2017 | Balance Sheet Location | December 31, 2017 | ||||||||
Commodity contracts | Other current assets | $ | — | Accrued expenses | $ | 1.0 | ||||||
Commodity contracts | Other assets | — | Other noncurrent liabilities | 0.4 | ||||||||
Swap contracts | Other current assets | 0.9 | Accrued expenses | — | ||||||||
Swap contracts | Other assets | 0.4 | Other noncurrent liabilities | — | ||||||||
Total derivatives designated as hedging instruments(a)(b) | $ | 1.3 | $ | 1.4 | ||||||||
(a) | The Company has master netting agreements with its commodity hedge counterparties and accordingly has netted in its Consolidated Balance Sheets less than $0.1 million of its commodity contracts that are in a receivable position against its contracts in payable positions. |
(b) | The Company has both commodity hedge and foreign currency swap agreements with two counterparties each. Amounts recorded as liabilities for the Company’s commodity contracts are payable to both counterparties, and amounts recorded as assets for the Company’s swap contracts are receivable from both counterparties. |
21
13. | Fair Value Measurements: |
The Company’s financial instruments are measured and reported at their estimated fair value. Fair value is the price that would be received upon the sale of an asset or paid to transfer a liability in an orderly transaction. When available, the Company uses quoted prices in active markets to determine the fair values for its financial instruments (Level 1 inputs) or, absent quoted market prices, observable market-corroborated inputs over the term of the financial instruments (Level 2 inputs). The Company does not have any unobservable inputs that are not corroborated by market inputs (Level 3 inputs) other than those described in Note 3.
The Company holds marketable securities associated with its defined contribution and pre-tax savings plans, which are valued based on readily available quoted market prices. The Company also held short-term investments which were classified as trading securities with any gains or losses recognized through earnings. The Company sold these investments during the first quarter of 2017. The Company utilizes derivative instruments to manage its risk of changes in natural gas prices and its risk of changes in foreign currency exchange rates (see Note 12). The fair value of the natural gas and foreign currency swap derivative instruments are determined using market data of forward prices for all of the Company’s contracts.
The estimated fair values for each type of instrument are presented below (in millions):
March 31, 2018 | Level One | Level Two | Level Three | ||||||||||||
Asset Class: | |||||||||||||||
Mutual fund investments in a non-qualified retirement plan(a) | $ | 1.8 | $ | 1.8 | $ | — | $ | — | |||||||
Derivatives – foreign currency instruments, net | 1.4 | — | 1.4 | — | |||||||||||
Total Assets | $ | 3.2 | $ | 1.8 | $ | 1.4 | $ | — | |||||||
Liability Class: | |||||||||||||||
Liabilities related to non-qualified retirement plan | $ | (1.8 | ) | $ | (1.8 | ) | $ | — | $ | — | |||||
Derivatives – natural gas instruments, net | (1.4 | ) | — | (1.4 | ) | — | |||||||||
Total Liabilities | $ | (3.2 | ) | $ | (1.8 | ) | $ | (1.4 | ) | $ | — | ||||
(a) | Includes mutual fund investments of approximately 25% in common stock of large-cap U.S. companies, 20% in common stock of small to mid-cap U.S. companies, 5% in international companies, 15% in bond funds, 15% in short-term investments and 20% in blended funds. |
December 31, 2017 | Level One | Level Two | Level Three | ||||||||||||
Asset Class: | |||||||||||||||
Mutual fund investments in a non-qualified savings plan(a) | $ | 2.2 | $ | 2.2 | $ | — | $ | — | |||||||
Derivatives – foreign currency swaps, net | 1.3 | — | 1.3 | — | |||||||||||
Total Assets | $ | 3.5 | $ | 2.2 | $ | 1.3 | $ | — | |||||||
Liability Class: | |||||||||||||||
Liabilities related to non-qualified savings plan | $ | (2.2 | ) | $ | (2.2 | ) | $ | — | $ | — | |||||
Derivatives – natural gas instruments, net | (1.4 | ) | — | (1.4 | ) | — | |||||||||
Total Liabilities | $ | (3.6 | ) | $ | (2.2 | ) | $ | (1.4 | ) | $ | — | ||||
(a) | Includes mutual fund investments of approximately 30% in the common stock of large-cap U.S. companies, 15% in the common stock of small to mid-cap U.S. companies, 5% in the common stock of international companies, 10% in bond funds, 20% in short-term investments and 20% in blended funds. |
Cash and cash equivalents, accounts receivable (net of allowance for bad debts) and payables are carried at cost, which approximates fair value due to their liquid and short-term nature. The Company’s investments related to its nonqualified retirement plan of $1.8 million and $2.2 million at March 31, 2018 and December 31, 2017, respectively, are stated at fair value based on quoted market prices. As of March 31, 2018 and December 31, 2017, the estimated amount a third-party would pay for the Company’s fixed-rate 4.875% senior notes due July 2024, based on available trading information (Level 2), totaled $245.3 million and $246.9 million, respectively, compared with the aggregate principal amount at maturity of $250.0 million. The estimated amount a third-party would pay at March 31, 2018 and December 31, 2017 for the amounts outstanding under the Company’s term loans and revolving credit facility, based upon available bid information received from the Company’s lender (Level 2), totaled $871.1 million and $989.5 million, respectively, compared with the aggregate principal balance of $881.7 million and $1.01 billion, respectively. The loans assumed in the Produquímica acquisition have floating rates and their fair value approximates their carrying value.
22
14. | Earnings per Share: |
The Company calculates earnings per share using the two-class method. The two-class method requires allocating the Company’s net earnings to both common shares and participating securities. The following table sets forth the computation of basic and diluted earnings per common share (in millions, except for share and per-share data):
Three months ended March 31, | |||||||
2018 | 2017 | ||||||
Numerator: | |||||||
Net earnings | $ | 12.6 | $ | 21.5 | |||
Less: net earnings allocated to participating securities(a) | (0.1 | ) | (0.1 | ) | |||
Net earnings available to common shareholders | $ | 12.5 | $ | 21.4 | |||
Denominator (in thousands): | |||||||
Weighted-average common shares outstanding, shares for basic earnings per share | 33,836 | 33,802 | |||||
Weighted-average awards outstanding(b) | — | 1 | |||||
Shares for diluted earnings per share | 33,836 | 33,803 | |||||
Net earnings per common share, basic | $ | 0.37 | $ | 0.63 | |||
Net earnings per common share, diluted | $ | 0.37 | $ | 0.63 | |||
(a) | Weighted participating securities include RSUs and PSUs that receive non-forfeitable dividends and consist of 163,000 and 157,000 wighted participating securities for the three months ended March 31, 2018 and 2017, respectively. |
(b) | For the calculation of diluted earnings per share, the Company uses the more dilutive of either the treasury stock method or the two-class method to determine the weighted-average number of outstanding common shares. In addition, the Company had 618,000 and 487,000 weighted-average equity awards outstanding for the three months ended March 31, 2018 and 2017, respectively. |
15. | Subsequent Event: |
The collective bargaining agreement for the Company’s Goderich mine, the Company’s largest North American production site, expired on March 31, 2018. The Company has been negotiating the terms of a new collective bargaining agreement with the union since early March 2018 and Goderich mine union members went on strike on April 27, 2018. The Company has implemented contingency plans and expects to operate the Goderich mine at or near its planned operating rates for the balance of 2018. Currently, the Company expects a minimal impact on Salt production costs resulting from the strike. However, the Company cannot predict how long the strike will last or whether an agreement will be reached with respect to the collective bargaining agreement. The strike and any other labor disruption could negatively impact the Company’s operations, its ability to produce or sell its products, its ability to service customers and its ability to recruit and retain personnel, and could result in significant additional costs as well as adversely affect its reputation, financial condition and operating results. In addition, the Company may be unable to successfully implement its contingency plans for continued operations at the Goderich mine and may incur additional costs associated with ongoing negotiations or any final agreement with the union.
23
Item 2. Management’s Discussion and Analysis of Financial Condition and Results of Operations
All statements, other than statements of historical fact, contained in this Quarterly Report on Form 10-Q constitute “forward-looking statements” within the meaning of the Private Securities Litigation Reform Act of 1995.
Forward-looking statements relate to future events or our future financial performance, and involve known and unknown risks, uncertainties, and other factors that may cause our actual results, levels of activity, performance or achievements to be materially different from any future results, levels of activity, performance or achievements expressed or implied by these forward-looking statements. Factors that could cause actual results to differ materially from those expressed or implied by the forward-looking statements include, but are not limited to, the following: risks related to our mining and industrial operations; geological conditions; dependency on a limited number of key production and distribution facilities and critical equipment; strikes, other forms of work stoppage or slowdown or other union activities, including the Goderich mine strike, the length of the Goderich mine strike, any inability to successfully implement our contingency plans and any costs associated with ongoing negotiations or any final agreement with the union; weather conditions; the inability to fund necessary capital expenditures or successfully complete capital projects; supply constraints or price increases for energy and raw materials used in our production processes; our indebtedness and ability to pay our indebtedness; restrictions in our debt agreements that may limit our ability to operate our business or require accelerated debt payments; tax liabilities; financial assurance requirements; the inability of our customers to access credit or a default by our customers of trade credit extended by us or financing we have guaranteed; restrictions on or ability to pay dividends; the impact of competition on the sales of our products; risks associated with our international operations and sales; the impact of anticipated changes in plant nutrition product prices and customer application rates; conditions in the agricultural sector and supply and demand imbalances for competing plant nutrition products; increasing costs or a lack of availability of transportation services; the seasonal demand for our products; our rights and governmental authorizations to mine and operate our properties; compliance with foreign and U.S. laws and regulations applicable to our international operations; compliance with environmental, health and safety laws and regulations; environmental liabilities; misappropriation or infringement claims relating to intellectual property; product liability claims and product recalls; inability to obtain required product registrations or increased regulatory requirements; changes in industry standards and regulatory requirements; our ability to successfully implement our strategies; our ability to expand our business through acquisitions, integrate acquired businesses and realize anticipated benefits from acquisitions; the ability to access and control our computer systems and information technology or the inability to protect confidential data; the loss of key personnel; domestic and international general business and economic conditions; and other risks referenced from time to time in this report and our other filings with the Securities and Exchange Commission (the “SEC”), including the “Risk Factors” section of our Annual Report on Form 10-K for the year ended December 31, 2017.
In some cases, you can identify forward-looking statements by terminology such as “may,” “might,” “will,” “should,” “could,” “expects,” “intends,” “plans,” “anticipates,” “believes,” “estimates,” “predicts,” “potential,” “continue,” the negative of these terms or other comparable terminology. Forward-looking statements include without limitation statements about our expected outlook, including expected sales, sales volumes, operating margins, market dynamics, depreciation expense and revenues; the seasonal distribution of working capital requirements; our reinvestment of foreign earnings outside the U.S.; our ability to optimize cash accessibility, minimize tax expense and meet debt service requirements; outcomes of matters with taxing authorities; and the seasonality of our business. These forward-looking statements are only predictions. Actual events or results may differ materially.
Although we believe that the expectations reflected in the forward-looking statements are reasonable, we cannot guarantee future results, levels of activity, performance or achievements. We undertake no duty to update any of the forward-looking statements after the date hereof or to reflect the occurrence of unanticipated events.
Unless the context requires otherwise, references to the “Company,” “Compass Minerals,” “our,” “us” and “we” refer to Compass Minerals International, Inc. (“CMI,” the parent holding company) and its consolidated subsidiaries. Except where otherwise noted, references to North America include only the continental United States (the “U.S.”) and Canada, and references to the United Kingdom (the “U.K.”) include only England, Scotland and Wales. Except where otherwise noted, all references to tons refer to “short tons” and all amounts are in U.S. dollars. One short ton equals 2,000 pounds.
Critical Accounting Estimates
Preparation of our consolidated financial statements in accordance with U.S. generally accepted accounting principles (“U.S. GAAP”) requires management to make estimates and assumptions that affect the reported amounts of assets, liabilities, revenues and expenses. Management believes the most complex and sensitive judgments result primarily from the need to make estimates about matters that are inherently uncertain. Management’s Discussion and Analysis and Note 2 to the Consolidated Financial Statements included in our Annual Report on Form 10-K for the year ended December 31, 2017 describe the significant accounting estimates and policies used in preparation of our consolidated financial statements. For a description of our critical accounting
24
policies and estimates affecting revenue recognition, see Note 2 to our Consolidated Financial Statements included in this Quarterly Report on Form 10-Q. Actual results in these areas could differ from management’s estimates.
Company Overview
Compass Minerals is a leading producer of essential minerals, including salt, sulfate of potash (“SOP”) specialty fertilizer and magnesium chloride. As of March 31, 2018, we operated 22 production and packaging facilities, including:
• | The largest rock salt mine in the world in Goderich, Ontario, Canada; |
• | The largest dedicated rock salt mine in the U.K. in Winsford, Cheshire; |
• | A solar evaporation facility located in Ogden, Utah, which is both the largest SOP production site and the largest solar salt production site in the Western Hemisphere; |
• | Several mechanical evaporation facilities producing consumer and industrial salt; and |
• | Several facilities producing essential agricultural nutrients and specialty chemicals in Brazil. |
Our salt business provides highway deicing salt to customers in North America and the U.K. as well as consumer deicing and water conditioning products, ingredients used in consumer and commercial food preparation, and other salt-based products for consumer, agricultural and industrial applications in North America. In the U.K., we operate a records management business utilizing excavated areas of our Winsford salt mine with one other surface location in London, England.
Our plant nutrition business produces and markets specialty plant nutrition products worldwide to distributors and retailers of crop inputs, as well as growers. Our principal plant nutrition product in our Plant Nutrition North America segment is SOP, which we market under the trade name Protassium+. We also sell various premium micronutrient products under our Wolf Trax brand.
Our Plant Nutrition South America segment operates two primary businesses in Brazil—agricultural productivity, which manufactures and distributes a broad offering of specialty plant nutrition solution-based products; and chemical solutions, which manufactures and markets specialty chemicals, primarily for the water treatment industry and for use in other industrial processes.
Consolidated Results of Operations
The following is a summary of our consolidated results of operations for the three months ended March 31, 2017 and 2018. The following discussion should be read in conjunction with the information contained in our consolidated financial statements and the notes thereto included in this Quarterly Report on Form 10-Q.
25
THREE MONTHS ENDED MARCH 31
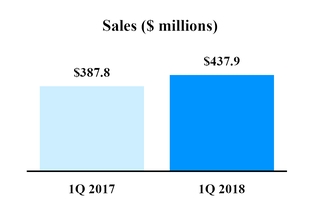
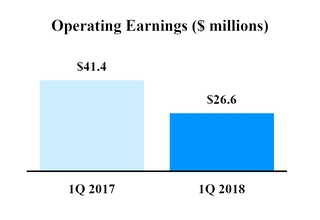
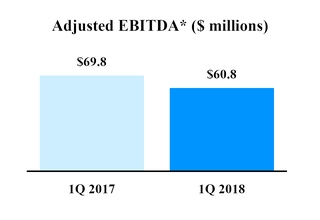
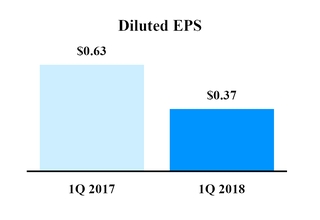
* Refer to “—Sensitivity Analysis Related to EBITDA and Adjusted EBITDA” for a reconciliation to the most directly comparable U.S. GAAP financial measure and the reasons we use this non-GAAP measure.
COMMENTARY: THREE MONTHS ENDED MARCH 31, 2017 AND 2018
• | Total sales increased 13%, or $50.1 million, due to increases in all three segments. |
• | Operating earnings decreased 36%, or $14.8 million, due to declines in all three segments. |
• | Earnings before interest, taxes, depreciation and amortization (“EBITDA”)* adjusted for items management believes are not indicative of our ongoing operating performance (“Adjusted EBITDA”)* decreased 13%, or $9.0 million. |
• | Diluted earnings per share decreased 41%, or $0.26. |
THREE MONTHS ENDED MARCH 31
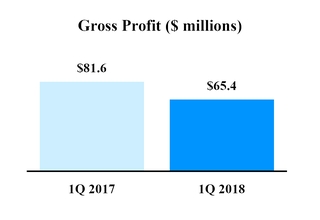
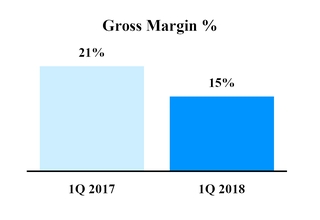
26
COMMENTARY: THREE MONTHS ENDED MARCH 31, 2017 AND 2018
Gross Profit: Decreased 20%, or $16.2 million; Gross Margin decreased 6 percentage points
• | Salt segment gross profit decreased $11.6 million primarily due to increased per-unit product costs and higher shipping and handling costs. |
• | The plant nutrition business, on a combined basis, contributed $4.8 million to the decrease in gross profit. The Plant Nutrition North America segment gross profit decreased $2.9 million primarily due to higher per-unit costs which were partially offset by lower per-unit shipping and handling costs. The Plant Nutrition South America segment gross profit decreased $1.9 million as a result of a $1.9 million gain recognized in the first quarter of 2017 due to the finalization of contingent consideration related to the acquisition of Produquímica. |
OTHER EXPENSES AND INCOME
COMMENTARY: THREE MONTHS ENDED MARCH 31, 2017 AND 2018
SG&A: Decreased $1.4 million, which represented a 1.5 percentage point of sales decrease to 8.9% from 10.4%
• | The decrease in SG&A expense was primarily due to a decrease in marketing and advertising spending in our Salt and Plant Nutrition South America segments and a decrease in costs related to the restructuring actions taken in 2017. The decrease in SG&A was partially offset by an increase in corporate depreciation expense related to a significant software system upgrade implemented in the second quarter of 2017. |
Other Income, net: Increased $4.1 million from $0.1 million to $4.2 million
• | We realized foreign exchange gains of $3.1 million in the first quarter of 2018 and foreign exchange losses of $1.1 million in the first quarter of 2017. |
Income Tax Expense: Decreased $1.9 million from an expense of $6.3 million to expense of $4.4 million
• | The decrease in income tax expense was primarily due to lower pretax income in the first quarter of 2018 partially offset by an increase in the effective tax rate. |
• | Our income tax provision in both periods differs from the U.S. statutory rate primarily due to U.S. statutory depletion, state income taxes, foreign income, mining and withholding taxes and interest expense recognition differences for tax and financial reporting purposes. |
• | Our effective tax rate increased from 23% in the first quarter of 2017 to 26% in the first quarter of 2018, primarily due to a reduction in certain tax valuation allowances in the first quarter of 2017 related to the acquired Produquimica business, which was partially offset by lower federal rates due to the U.S. Tax Cuts and Jobs Act. |
Operating Segment Performance
The following financial results represent consolidated financial information with respect to sales from our Salt, Plant Nutrition North America and Plant Nutrition South America segments. The results of operations of the consolidated records management business and other incidental revenues include sales of $2.8 million and $2.5 million for the first quarter of 2018 and 2017, respectively. These revenues are not material to our consolidated financial results and are not included in the following operating segment financial data.
THREE MONTHS ENDED MARCH 31
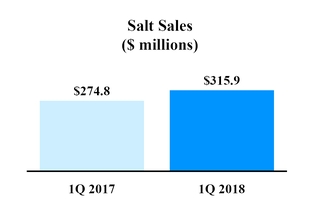
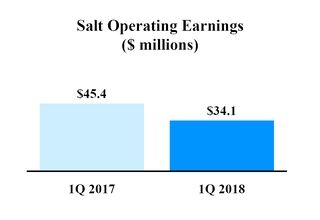
27
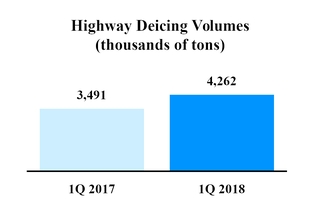
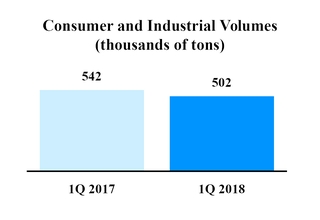
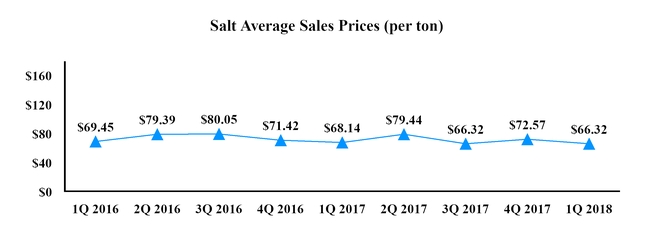
1Q 2018 | 1Q 2017 | ||||||
Salt Sales (in millions) | $ | 315.9 | $ | 274.8 | |||
Salt Operating Earnings (in millions) | $ | 34.1 | $ | 45.4 | |||
Salt Sales Volumes (thousands of tons) | |||||||
Highway deicing | 4,262 | 3,491 | |||||
Consumer and industrial | 502 | 542 | |||||
Total tons sold | 4,764 | 4,033 | |||||
Average Salt Sales Price (per ton) | |||||||
Highway deicing | $ | 55.24 | $ | 55.25 | |||
Consumer and industrial | $ | 160.26 | $ | 151.25 | |||
Combined | $ | 66.32 | $ | 68.14 | |||
COMMENTARY: THREE MONTHS ENDED MARCH 31, 2017 AND 2018
• | Salt sales increased 15%, or $41.1 million, primarily due to higher deicing sales volumes which was partially offset by lower consumer and industrial sales volumes. |
• | Salt average sales prices decreased 3% due to product sales mix, as highway deicing products which have a lower average sales price were a higher proportion of total sales in the current period. |
• | Highway deicing average sales prices were flat. Consumer and industrial average sales prices increased 6% due to an improvement in product sales mix and price increases taken over the last 12 months. |
• | Salt sales volumes increased 18%, or 731,000 tons, and contributed approximately $37 million to the increase in Salt segment sales. Highway deicing sales volumes increased 22% as a result of significantly above average winter weather in the U.K. and more winter weather events in North America in the first quarter of 2018 compared to the prior year. Consumer and industrial sales volumes decreased 7%. |
• | Salt operating earnings decreased 25%, or $11.3 million, due to higher per-unit product and logistics costs as well as higher-cost inventory produced in 2017 and sold in the first quarter of 2018. The higher per-unit product and logistics |
28
costs resulted from lower production at our Goderich mine due to a ceiling fall that occurred last year, leading to deliveries of salt from our Cote Blanche, Louisiana mine to our Northern markets.
THREE MONTHS ENDED MARCH 31
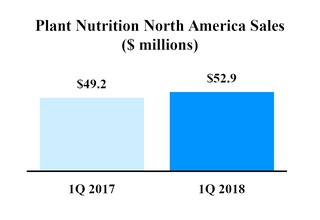
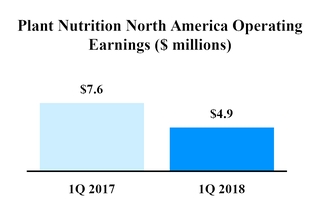
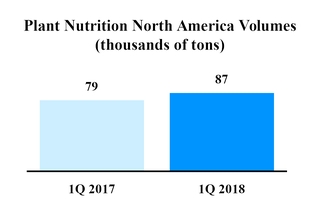
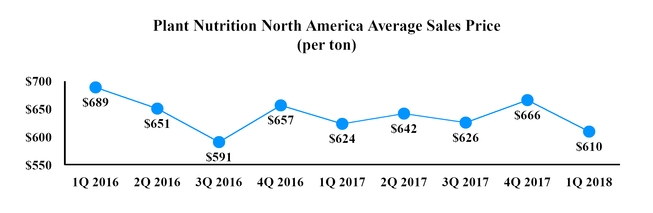
1Q 2018 | 1Q 2017 | ||||||
Plant Nutrition North America Sales (in millions) | $ | 52.9 | $ | 49.2 | |||
Plant Nutrition North America Operating Earnings (in millions) | $ | 4.9 | $ | 7.6 | |||
Plant Nutrition North America Sales Volumes (thousands of tons) | 87 | 79 | |||||
Plant Nutrition North America Average Sales Price (per ton) | $ | 610 | $ | 624 | |||
29
COMMENTARY: THREE MONTHS ENDED MARCH 31, 2017 AND 2018
• | Plant Nutrition North America sales increased 8%, or $3.7 million. |
• | Plant Nutrition North America sales volumes increased 10%, or 8,000 tons, and contributed approximately $5 million to the increase in Plant Nutrition North America sales. The increase in sales volumes was primarily driven by an increase in SOP sales volumes. |
• | The 2% decrease in Plant Nutrition North America average sales price partially offset the increase in Plant Nutrition North America sales by approximately $1 million. The decrease in average sales price was primarily due to decreases in the average sales prices for our micronutrient products. |
• | Plant Nutrition North America operating earnings decreased 36%, or $2.7 million, primarily due to higher depreciation expense associated with commissioning new production assets at our Ogden facility and higher-cost carryover inventory produced in 2017 and sold in the first quarter of 2018. |
THREE MONTHS ENDED MARCH 31
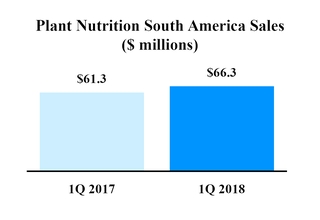
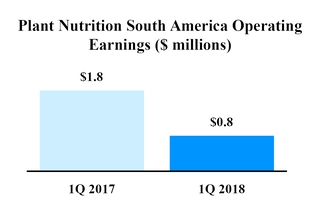
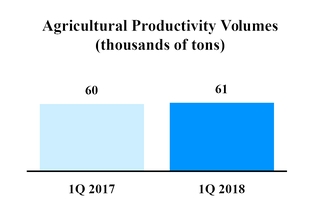
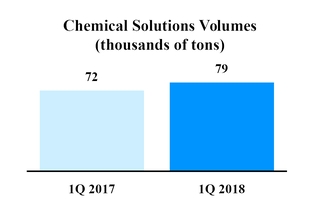
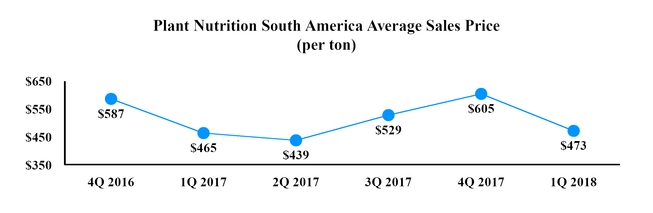
30
1Q 2018 | 1Q 2017 | ||||||
Plant Nutrition South America Sales (in millions) | $ | 66.3 | $ | 61.3 | |||
Plant Nutrition South America Operating Earnings (in millions) | $ | 0.8 | $ | 1.8 | |||
Plant Nutrition South America Sales Volumes (thousands of tons) | |||||||
Agricultural productivity | 61 | 60 | |||||
Chemical solutions | 79 | 72 | |||||
Total tons sold | 140 | 132 | |||||
Average Plant Nutrition South America Sales Price (per ton) | |||||||
Agricultural productivity | $ | 646 | $ | 599 | |||
Chemical solutions | $ | 339 | $ | 354 | |||
Combined | $ | 473 | $ | 465 | |||
COMMENTARY: THREE MONTHS ENDED MARCH 31, 2017 AND 2018
• | Plant Nutrition South America sales increased 8%, or $5.0 million. |
• | Plant Nutrition South America sales volumes increased 6%, or 8,000 tons, and contributed approximately $3 million to the increase in Plant Nutrition South America sales. The increase in sales volumes was primarily driven by an increase in sales of chemical solutions products. |
• | A 2% increase in Plant Nutrition South America average sales price contributed approximately $2 million to the Plant Nutrition South America sales increase. The increase in average sales price was primarily due to an 8% increase in agriculture product sales prices, partially offset by a 4% decrease in chemical solutions product prices due to shifts in product sales mix. |
• | Plant Nutrition South America operating earnings decreased 56%, or $1.0 million, as a result of a $1.9 million gain recognized in the first quarter of 2017 due to the finalization of contingent consideration related to the acquisition of Produquímica and a weaker Brazilian reais versus the U.S. dollar. |
Outlook
• | Winter weather events in North America in April 2018 combined with continued strong demand in the U.K. are expected to increase second quarter 2018 Salt sales from those in the same period of the prior year. We expect Salt sales volumes to range from 11.8 million to 12.6 million tons in 2018. |
• | Salt segment operating margins in the the second quarter of 2018 are expected to improve from those experienced in the first quarter of 2018. |
• | The winter weather in the 2017-2018 season is expected to result in favorable market dynamics for salt producers in the upcoming highway deicing bid season. |
• | Plant Nutrition North America sales volumes are expected to range from 320,000 to 350,000 tons in 2018. |
• | Plant Nutrition North America operating margins in the second quarter of 2018 are expected to be similar to those experienced in the first quarter of 2018. Lower sales, particularly micronutrients, and higher depreciation expense are expected to pressure second quarter Plant Nutrition North America operating margins. |
• | We expect 2018 Plant Nutrition South America sales volumes to range from 700,000 to 900,000 tons. |
• | We expect revenues in the first half of 2018 to be higher than those in 2017 and second quarter operating margins to be higher than the same period in 2017 for our Plant Nutrition South America segment. |
Liquidity and Capital Resources
Historically, our cash flows from operating activities have generally been adequate to fund our basic operating requirements, ongoing debt service and sustaining investment in property, plant and equipment. We have also used cash generated from operations to fund capital expenditures which strengthen our operational position, pay dividends, fund smaller acquisitions and repay our debt. To a certain extent, our ability to meet our short- and long-term liquidity and capital needs is subject to general economic, financial, competitive, legislative, regulatory, weather, effects of climate change, geological variations in our mine deposits and other factors that are beyond our control. Historically, our working capital requirements have been the highest in the fourth quarter and lowest in the second quarter. As a result of the Produquímica acquisition (described in Note 3 to our Consolidated Financial Statements), we expect a less seasonal distribution of working capital requirements. When needed, we may fund short-term working capital requirements by accessing our $300 million revolving credit facility.
31
We have been able to manage our cash flows generated and used across Compass Minerals to permanently reinvest earnings in our foreign jurisdictions or efficiently repatriate those funds to the U.S. As of March 31, 2018, we had $32.2 million of cash and cash equivalents (in our Consolidated Balance Sheets) that was either held directly or indirectly by foreign subsidiaries. Due to our ability to generate adequate levels of domestic cash flow on an annual basis, it is our current intention to permanently reinvest our foreign earnings outside of the U.S. In December 2017, U.S. tax reform legislation was enacted, including a one-time mandatory tax on previously deferred foreign earnings. As a result, in December 2017 we recorded tax expense of $55.2 million related to this one-time tax, which will be paid over an eight-year period. As of December 31, 2017, all non-U.S. undistributed earnings were subject to the one-time mandatory tax in the U.S. with the exception of outside basis differences of $59.3 million related to our Brazilian entities. We review our tax circumstances on a regular basis with the intent of optimizing cash accessibility and minimizing tax expense.
In addition, the amount of permanently reinvested earnings is influenced by, among other things, the profits generated by our foreign subsidiaries and the amount of investment in those same subsidiaries. The profits generated by our domestic and foreign subsidiaries are impacted by the transfer price charged on the transfer of our products between them. As discussed in Note 7 to our Consolidated Financial Statements, our calculated transfer price on certain products between one of our foreign subsidiaries and a domestic subsidiary has been challenged by Canadian federal and provincial governments. In the fourth quarter of 2017, we reached a federal settlement with Canadian and U.S. tax authorities related to our transfer pricing issues for our 2007-2012 tax years. The agreement resulted in intercompany cash payments from our U.S. subsidiary to our Canadian subsidiary of $85.7 million in the first quarter of 2018. In addition, we will make tax payments to Canadian taxing authorities of $22.7 million with a corresponding tax refund due from U.S. taxing authorities of $22.8 million. The timing of the refund is expected to lag the payment to the Canadian tax authorities by a year or more. There are ongoing challenges by Canadian provincial taxing authorities regarding our transfer prices of certain items. The final resolution of these challenges may not occur for several years. We currently expect the outcome of these matters will not have a material impact on our results of operations. However, it is possible the resolution could materially impact the amount of earnings attributable to our domestic and foreign subsidiaries, which could impact the amount of permanently reinvested foreign earnings as well as future cash flows from our domestic operations. See Note 7 to our Consolidated Financial Statements for a discussion regarding our Canadian tax reassessments and settlement.
In September 2017, we entered into an amendment to our credit agreement to increase the maximum allowed leverage ratio under the credit agreement through September 2018. In connection with this amendment, we paid fees totaling $0.6 million ($0.1 million was recorded as an expense and $0.5 million was capitalized as deferred financing costs).
In the second half of 2017, we refinanced $54.3 million of loans we assumed in the Produquímica acquisition using proceeds from approximately $87 million of new loans. The new variable-rate loans bear interest rates ranging from 108.7% and 118% of CDI and mature in September and November 2019. In the first quarter of 2018, we entered into a new U.S. dollar denominated loan which matures in March 2020. No material fees were paid in connection with these transactions. A portion of the loans are denominated in U.S. dollars and a portion of the loans are denominated in Brazilian reais. We have also entered into foreign currency swap agreements whereby we agreed to swap interest and principal payments on the loans denominated in U.S. dollars for principal and interest payments denominated in Brazilian reais, Produquímica’s functional currency. See Note 12 to our Consolidated Financial Statements for a discussion of our foreign currency swap agreements.
Cash and cash equivalents as of March 31, 2018 of $44.5 million, increased $7.9 million from December 31, 2017. We generated $173.0 million of operating cash flows in the first three months of 2018. In the first three months of 2018, we used cash on hand and cash flows from operations to make net payments on our debt of $112.0 million, fund capital expenditures of $23.0 million and pay dividends on our common stock of $24.5 million.
As of March 31, 2018, we had $1.26 billion of indebtedness, consisting of $250.0 million outstanding under our 4.875% Notes, $881.7 million of borrowings outstanding under our senior secured credit facilities (consisting of term loans and a revolving credit facility), including $46.5 million borrowed against our revolving credit facility, and $125.4 million of debt related to Produquímica. We had $8.4 million of outstanding letters of credit as of March 31, 2018, which reduced our revolving credit facility borrowing availability to $245.1 million.
Our debt service obligations could, under certain circumstances, materially affect our financial condition and impair our ability to operate our business or pursue our business strategies. As a holding company, CMI’s investments in its operating subsidiaries constitute substantially all of its assets. Consequently, our subsidiaries conduct substantially all of our consolidated operating activities and own substantially all of our operating assets. The principal source of the cash needed to pay our obligations is the cash generated from our subsidiaries’ operations and their borrowings. Our subsidiaries are not obligated to make funds available to CMI. Furthermore, we must remain in compliance with the terms of our credit agreement governing our term loans and revolving credit facility, including the total leverage ratio and interest coverage ratio, in order to make payments on our debt or pay dividends to our stockholders. We must also comply with the terms of our indenture governing our senior notes. Although we are in compliance
32
with our debt covenants as of March 31, 2018, we can make no assurance that we will remain in compliance with these ratios nor can we make any assurance that the agreements governing the current and future indebtedness of our subsidiaries will permit our subsidiaries to provide us with sufficient dividends, distributions or loans to fund scheduled interest payments on our debt when due. If we consummate an additional acquisition, our debt service requirements could increase. Furthermore, we may need to refinance all or a portion of our indebtedness on or before maturity; however, we cannot provide assurance that we will be able to refinance any of our indebtedness on commercially reasonable terms or at all.
The table below provides a summary of our cash flows by category:
THREE MONTHS ENDED MARCH 31, 2018 | THREE MONTHS ENDED MARCH 31, 2017 |
Operating Activities: | |
» Net earnings were $12.6 million. | » Net earnings were $21.5 million. |
» Non-cash depreciation and amortization expense was $34.3 million. | » Non-cash depreciation and amortization expense was $28.4 million. |
» Working capital items were a source of operating cash flows of $123.7 million. | » Working capital items were a source of operating cash flows of $79.1 million. |
Investing Activities: | |
» Net cash flows used by investing activities included $23.0 million of capital expenditures. | » Net cash flows used by investing activities included $21.0 million of capital expenditures. |
Financing Activities: | |
» Net cash flows used by financing activities included the payment of dividends of $24.5 million. » In addition, we had net payments on our debt of $112.0 million. | » Net cash flows used by financing activities included the payment of dividends of $24.4 million. » In addition, we had net payments on our debt of $93.8 million. » We also paid $14.7 million for the final payment related to the Produquímica acquisition. |
Other Matters
See Notes 7 , 9 and 15 to our Consolidated Financial Statements for a discussion regarding labor (including the status of labor negotiations and the strike at our Goderich, Ontario mine), environmental and litigation matters.
Sensitivity Analysis Related to EBITDA and Adjusted EBITDA
Management uses a variety of measures to evaluate our performance. While our consolidated financial statements, taken as a whole, provide an understanding of our overall results of operations, financial condition and cash flows, we analyze components of the consolidated financial statements to identify certain trends and evaluate specific performance areas. In addition to using U.S. GAAP financial measures, such as gross profit, net earnings and cash flows generated by operating activities, management uses EBITDA and Adjusted EBITDA. Both EBITDA and Adjusted EBITDA are non-GAAP financial measures used to evaluate the operating performance of our core business operations, because our resource allocation, financing methods, cost of capital and income tax positions are managed at a corporate level apart from the activities of the operating segments and our operating facilities are located in different taxing jurisdictions, which can cause considerable variation in net earnings. We also use these measures to assess our operating performance and return on capital, and to evaluate potential acquisitions or other capital projects. These measures are not calculated under U.S. GAAP and should not be considered in isolation or as a substitute for net earnings, cash flows or other financial data prepared in accordance with U.S. GAAP or as a measure of our overall profitability or liquidity. EBITDA and Adjusted EBITDA exclude interest expense, income taxes and depreciation and amortization, each of which are an essential element of our cost structure and cannot be eliminated. Furthermore, Adjusted EBITDA excludes other cash and non-cash items including restructuring costs and other (income) expense. Our borrowings are a significant component of our capital structure and interest expense is a continuing cost of debt. We are also required to pay income taxes, a required and ongoing consequence of our operations. We have a significant investment in capital assets and depreciation and amortization reflect the utilization of those assets in order to generate revenues. Consequently, any measure that excludes these elements has material limitations. While EBITDA and Adjusted EBITDA are frequently used as measures of operating performance, these terms are not necessarily comparable to similarly titled measures of other companies due to the potential inconsistencies in the method of calculation.
33
The calculation of EBITDA and Adjusted EBITDA as used by management is set forth in the table below (in millions):
Three Months Ended March 31, | |||||||
2018 | 2017 | ||||||
Net earnings | $ | 12.6 | $ | 21.5 | |||
Interest expense | 13.7 | 13.7 | |||||
Income tax expense | 4.4 | 6.3 | |||||
Depreciation, depletion and amortization | 34.3 | 28.4 | |||||
EBITDA | 65.0 | 69.9 | |||||
Adjustments to EBITDA: | |||||||
Other income, net | (4.2 | ) | (0.1 | ) | |||
Adjusted EBITDA | $ | 60.8 | $ | 69.8 | |||
Recent Accounting Pronouncements
See Note 1 to our Consolidated Financial Statements for a discussion of recent accounting pronouncements.
Effects of Currency Fluctuations
Our operations outside of the U.S. are conducted primarily in Canada, Brazil and the U.K. Therefore, our results of operations are subject to both currency transaction risk and currency translation risk. We incur currency transaction risk whenever we or one of our subsidiaries enter into either a purchase or sales transaction using a currency other than the local currency of the transacting entity. With respect to currency translation risk, our financial condition and results of operations are measured and recorded in the relevant local currency and then translated into U.S. dollars for inclusion in our historical consolidated financial statements. Exchange rates between these currencies and the U.S. dollar have fluctuated significantly from time to time and may do so in the future. The majority of revenues and costs are denominated in U.S. dollars, with Canadian dollars, Brazilian reais and British pounds sterling also being significant. Significant changes in the value of the Canadian dollar, Brazilian reais or British pound sterling relative to the U.S. dollar could have a material effect on our financial condition.
Although inflation has not had a significant impact on our operations, our efforts to recover cost increases due to inflation may be hampered as a result of the competitive industries and countries in which we operate.
Seasonality
We experience a substantial amount of seasonality in our sales. Our sales of our salt deicing products are seasonal. Consequently, our Salt sales and operating income are generally higher in the first and fourth quarters and lower during the second and third quarters of each year. In particular, sales of highway and consumer deicing salt and magnesium chloride products vary based on the severity of the winter conditions in areas where the product is used. Following industry practice in North America, we seek to stockpile sufficient quantities of deicing salt in the second, third and fourth quarters to meet the estimated requirements for the winter season.
Our plant nutrition business is also seasonal. The strongest demand for our Plant Nutrition South America products in Brazil typically occurs during the spring planting season. As a result, we and our customers generally build inventories during the low demand periods of the year to ensure timely product availability during the peak sales season. The seasonality of this demand results in our sales volumes and net sales for our Plant Nutrition South America segment usually being the highest during the third and fourth quarters of each year (as the spring planting season begins in September in Brazil).
Item 3. Quantitative and Qualitative Disclosures About Market Risk
Our business is subject to various types of market risks that include interest rate risk, foreign currency exchange rate risk and commodity pricing risk. Management has taken actions to mitigate our exposure to commodity pricing and foreign currency exchange rate risk by entering into natural gas derivative instruments and foreign currency swaps. We may take further actions to mitigate our exposure to interest rates, exchange rates and changes in the cost of transporting our products due to variations in our contracted carriers’ cost of fuel, which is typically diesel fuel. However, there can be no assurance that our hedging activities will eliminate or substantially reduce these risks. We do not enter into any financial instrument arrangements for speculative purposes. Our market risk exposure related to these items has not changed materially since December 31, 2017.
34
Item 4. Controls and Procedures
Evaluation of Disclosure Controls and Procedures
As of the end of the period covered by this Quarterly Report on Form 10-Q, an evaluation of the effectiveness of the design and operation of the Company’s disclosure controls and procedures (as defined in Rule 13a-15(e) under the Securities Exchange Act of 1934, as amended (the “Exchange Act”)) was performed under the supervision and with the participation of the Company’s management, including the Chief Executive Officer and Chief Financial Officer. Based on that evaluation, the Company’s Chief Executive Officer and Chief Financial Officer concluded that the Company’s disclosure controls and procedures were effective as of March 31, 2018 to ensure that information required to be disclosed in the reports it files and submits under the Exchange Act is recorded, processed, summarized and reported within the time periods specified in the SEC’s rules and forms.
For this purpose, disclosure controls and procedures include controls and procedures designed to ensure that information that is required to be disclosed under the Exchange Act is accumulated and communicated to the Company’s management, including the Chief Executive Officer and Chief Financial Officer, as appropriate to allow timely decisions regarding required disclosure.
Changes in Internal Control Over Financial Reporting
Beginning January 1, 2018, the Company implemented new guidance related to revenue recognition. Though adoption of the new guidance was not deemed to have a material effect on the amounts reported in its consolidated financial statements, the Company has implemented internal controls to monitor and analyze those business practices that, if changed, could have a material impact on the consolidated financial statements under the new guidance.
35
PART II. OTHER INFORMATION
Item 1. Legal Proceedings
We are involved in the legal proceedings described in Note 7 and Note 9 to our Consolidated Financial Statements and, from time to time, various routine legal proceedings and claims arising from the ordinary course of our business. These primarily involve tax assessments, disputes with former employees and contract labor, commercial claims, product liability claims, personal injury claims and workers’ compensation claims. Management cannot predict the outcome of legal proceedings and claims with certainty. Nevertheless, management believes that the outcome of legal proceedings and claims, which are pending or known to be threatened, even if determined adversely, will not, either individually or in the aggregate, have a material adverse effect on our results of operations, cash flows or financial condition. There have been no material developments since December 31, 2017 with respect to our legal proceedings, except as described in Note 7 and Note 9 to our Consolidated Financial Statements.
Item 1A. Risk Factors
For a discussion of the risk factors applicable to Compass Minerals, please refer to Part I, Item 1A. “Risk Factors” in our Annual Report on Form 10-K for the year ended December 31, 2017. Except for the risk factor set forth below, there have been no material changes to our risk factors as disclosed in such Annual Report.
Strikes, other forms of work stoppage or slowdown and other union activities could disrupt our business and negatively impact our financial results.
Approximately 50% of our workforce in the U.S., Canada and the U.K. and approximately 30% of our global workforce was represented by collective bargaining agreements as of December 31, 2017. Of our 12 collective bargaining agreements in effect on January 1, 2018, four have expired or will expire in 2018, five will expire in 2019, one will expire in 2020, one will expire in 2021 and one will expire in 2022. In addition, trade union membership is mandatory in Brazil, where approximately 40% of our global workforce is located. Unsuccessful contract negotiations or adverse labor relations at any of our locations could result in strikes, work stoppages and work slowdowns, which could disrupt our business and operations.
The collective bargaining agreement for our Goderich mine, our largest North American production site, expired on March 31, 2018. We have been negotiating the terms of a new collective bargaining agreement with the union since early March 2018 and the union members went on strike on April 27, 2018. We cannot predict how long the strike will last or whether an agreement will be reached with respect to the collective bargaining agreement. We may be unable to successfully implement our contingency plans for continued operations at the Goderich mine and may incur additional costs associated with ongoing negotiations or any final agreement with the union. Additionally, if our contingency plans or a new collective bargaining agreement significantly increase our labor costs relative to our competitors, our ability to compete may be materially and adversely affected.
The Goderich mine strike, the terms of any new collective bargaining agreement for our Goderich mine or any other labor disruption at the Goderich mine or any of our other sites could negatively impact our operations, our ability to produce or sell our products, our ability to service customers and our ability to recruit and retain personnel, and could result in significant additional costs as well as adversely affect our reputation, financial condition and operating results.
Item 2. Unregistered Sales of Equity Securities and Use of Proceeds
None.
Item 3. Defaults Upon Senior Securities
None.
Item 4. Mine Safety Disclosures
Information concerning mine safety violations or other regulatory matters required by Section 1503(a) of the Dodd-Frank Wall Street Reform and Consumer Protection Act and Item 104 of Regulation S-K is included in Exhibit 95 to this Quarterly Report on Form 10-Q.
36
Item 5. Other Information
None.
Item 6. Exhibits
Exhibit No. | Exhibit Description | |
101** | The following financial statements from the Company’s Quarterly Report on Form 10-Q for the quarter ended March 31, 2018, formatted in Extensive Business Reporting Language (XBRL): (i) Consolidated Balance Sheets, (ii) Consolidated Statements of Operations, (iii) Consolidated Statements of Comprehensive (Loss) Income, (iv) Consolidated Statement of Stockholders’ Equity, (v) Consolidated Statements of Cash Flows, and (vi) the Notes to the Consolidated Financial Statements. | |
* Filed herewith | ||
** Furnished herewith | ||
37
SIGNATURES
Pursuant to the requirements of the Securities Exchange Act of 1934, the registrant has duly caused this report to be signed on its behalf by the undersigned, thereunto duly authorized.
COMPASS MINERALS INTERNATIONAL, INC. | |||
Date: May 2, 2018 | By: | /s/ James D. Standen | |
James D. Standen | |||
Chief Financial Officer | |||
(Principal Financial and Accounting Officer) | |||
38