Attached files
| file | filename |
|---|---|
| EX-31.4 - EX-31.4 - DYNEGY INC. | d532160dex314.htm |
| EX-31.3 - EX-31.3 - DYNEGY INC. | d532160dex313.htm |
| EX-23.1 - EX-23.1 - DYNEGY INC. | d532160dex231.htm |
Table of Contents
UNITED STATES
SECURITIES AND EXCHANGE COMMISSION
Washington, D.C. 20549
FORM 10-K/A
(Amendment No. 1)
☒ ANNUAL REPORT PURSUANT TO SECTION 13 OR 15(d) OF THE SECURITIES EXCHANGE ACT OF 1934
For the fiscal year ended December 31, 2017
☐ TRANSITION REPORT PURSUANT TO SECTION 13 OR 15(d) OF THE SECURITIES EXCHANGE ACT OF 1934
For the transition period from to
DYNEGY INC.
(Exact name of registrant as specified in its charter)
| Commission File Number |
State of Incorporation |
I.R.S. Employer Identification No. | ||
| 001-33443 | Delaware | 20-5653152 | ||
| 601 Travis, Suite 1400 | ||||
| Houston, Texas | 77002 | |||
| (Address of principal executive offices) |
(Zip Code) | |||
(713) 507-6400
(Registrant’s telephone number, including area code)
Securities registered pursuant to Section12(b) of the Act:
| Title of each class |
Name of each exchange on which registered | |||
| Dynegy’s common stock, $0.01 par value | New York Stock Exchange | |||
| Dynegy’s warrants, exercisable for common stock at an exercise price of $35 per share |
New York Stock Exchange | |||
Securities registered pursuant to Section12(g) of the Act:
| None |
||||
| (Title of Class) |
Indicate by check mark if the registrant is a well-known seasoned issuer, as defined in Rule 405 of the Securities Act. Yes ☒ No ☐
Indicate by check mark if the registrant is not required to file reports pursuant to Section 13 or Section 15(d) of the Exchange Act. Yes ☐ No ☒
Indicate by check mark whether the registrant (1) has filed all reports required to be filed by Section 13 or 15(d) of the Securities Exchange Act of 1934 during the preceding 12 months (or for such shorter period that the registrant was required to file such reports), and (2) has been subject to such filing requirements for the past 90 days. Yes ☒ No ☐
Indicate by check mark whether the registrant has submitted electronically and posted on its corporate web site, if any, every Interactive Data File required to be submitted and posted pursuant to Rule 405 of Regulation S-T (§232.405 of this chapter) during the preceding 12 months (or for such shorter period that the registrant was required to submit and post such files). Yes ☒ No ☐
Indicate by check mark if disclosure of delinquent filers pursuant to Item 405 of Regulation S-K is not contained herein, and will not be contained, to the best of registrant’s knowledge, in definitive proxy or information statements incorporated by reference in Part III of this Form 10-K or any amendment to this Form 10-K. ☒
Indicate by check mark whether the registrant is a large accelerated filer, an accelerated filer, a non-accelerated filer, a smaller reporting company, or an emerging growth company. See definitions of “large accelerated filer,” “accelerated filer,” “smaller reporting company” and “emerging growth company” in Rule 12b-2 of the Exchange Act.
| Large accelerated filer ☒ | Accelerated filer ☐ | |
| Non-accelerated filer ☐ | Smaller reporting company ☐ | |
| (Do not check if a smaller reporting company) | Emerging growth company ☐ |
If an emerging growth company, indicate by check mark if the registrant has elected not to use the extended transition period for complying with any new or revised financial accounting standards provided pursuant to Section 13(a) of the Exchange Act. ☐
Indicate by check mark whether the registrant is a shell company (as defined in Rule 12b-2 of the Exchange Act). Yes ☐ No ☒
As of June 30, 2017, the aggregate market value of the Dynegy Inc. common stock held by non-affiliates of the registrant was $918,348,807 based on the closing sale price as reported on the New York Stock Exchange.
Indicate by check mark whether the registrant filed all documents and reports required to be filed by Sections 12, 13 or 15(d) of the Securities Exchange Act of 1934 subsequent to the distribution of securities under a plan confirmed by a court. Yes ☒ No ☐
Number of shares outstanding of Dynegy Inc.’s class of common stock, as of the latest practicable date: Common stock, $0.01 par value per share, 0 shares outstanding as of April 26, 2018.
DOCUMENTS INCORPORATED BY REFERENCE
None.
Table of Contents
DYNEGY INC.
FORM 10-K/A
| Page | ||||||
| Item 10. |
Directors, Executive Officers and Corporate Governance | 2 | ||||
| Item 11. |
Executive Compensation | 12 | ||||
| Item 12. |
Security Ownership of Certain Beneficial Owners and Management and Related Stockholder Matters | 46 | ||||
| Item 13. |
Certain Relationships and Related Transactions, and Director Independence | 47 | ||||
| Item 14. |
Principal Accounting Fees and Services | 48 | ||||
| Item 15. |
Exhibits and Financial Statement Schedules | 50 | ||||
| 61 | ||||||
i
Table of Contents
This Amendment No. 1 to Form 10-K (this “Amendment”) amends the Annual Report on Form 10-K for the fiscal year ended December 31, 2017 (“fiscal 2017”) of Dynegy Inc., as originally filed with the Securities and Exchange Commission (“SEC”) on February 22, 2018 (the “Original Form 10-K”). We are filing this Amendment to present the information required by Part III of Form 10-K that was previously omitted from the Original Form 10-K in reliance on General Instruction G(3) to Form 10-K because a definitive proxy statement containing such information will not be filed within 120 days after the end of fiscal 2017. This Amendment restates in their entirety Items 10, 11, 12, 13 and 14 of the Original Form 10-K and the exhibit index set forth in Part IV of the Original Form 10-K and includes certain exhibits as noted thereon. The cover page of the Original Form 10-K is also amended to delete the reference to the incorporation by reference of the registrant’s definitive proxy statement.
An amended Exhibit 23.1 is being filed herewith to include the signature of Ernst & Young LLP, which was inadvertently omitted from that exhibit filed with the Original Form 10-K. In addition, Item 15 of Part IV has been amended to include new certifications pursuant to Section 302 of the Sarbanes-Oxley Act of 2002 by our principal executive officer and principal financial officer as required by Rule 12b-15 under the Securities Exchange Act of 1934, as amended (the “Exchange Act”). Because no financial statements have been included in this Amendment and this Amendment does not contain or amend any disclosure with respect to Items 307 and 308 of Regulation S-K, paragraphs 3, 4, and 5 of the certifications have been omitted. The certifications pursuant to Section 302 of the Sarbanes-Oxley Act of 2002 of our principal executive officer and principal financial officer are filed with this Amendment as Exhibits 31.3 and 31.4 hereto.
Except as expressly set forth herein, this Amendment does not otherwise update information in the Original Form 10-K to reflect facts or events occurring subsequent to the filing date of the Original Form 10-K. This Amendment should be read in conjunction with the Original Form 10-K and with the registrant’s filings with the SEC subsequent to the filing of the Original Form 10-K.
Unless the context indicates otherwise, throughout this report, the terms “Dynegy,” “the Company,” “we,” “us,” “our,” and “ours” are used to refer to Dynegy Inc. and its direct and indirect subsidiaries. Terms used but not defined herein are as defined in the Original Form 10-K.
Merger with and into Vistra Energy & Expected Form 15 Filing
On April 9, 2018 (the “Closing Date”), pursuant to the Merger Agreement, Dynegy merged with and into Vistra Energy Corp. (“Vistra Energy”), with Vistra Energy continuing as the surviving corporation (the “Merger”). The combined company will operate under the name “Vistra Energy Corp.” and will continue to be a Delaware corporation. At the effective time of the Merger (the “Merger Effective Time”), each issued and outstanding share of the Company’s common stock, par value $0.01 per share (“Dynegy Common Stock”) (other than shares owned by Vistra Energy or its wholly owned subsidiaries, held in treasury by the Company or held by a wholly owned subsidiary of the Company, which shares were automatically cancelled and ceased to exist) was automatically converted into the right to receive 0.652 shares of Vistra Energy’s common stock, par value $0.01 per share (“Vistra Energy Common Stock”, and such ratio of Dynegy Common Stock to Vistra Energy Common Stock, the “Exchange Ratio”). Unless the context indicates otherwise, information presented herein is as of April 8, 2018.
As a result of the Merger, Dynegy intends to file a Form 15 with respect to all of its registered classes of securities immediately following the filing of this Amendment to terminate the registration of such securities under Section 12(g) of the Exchange Act and suspend the duty of Dynegy to file reports under Sections 13 and 15(d) of the Exchange Act. As a result of such termination and suspension, Dynegy will no longer be required to file reports under Sections 13 and 15(d) of the Exchange Act. Prior to the filing of such Form 15, SEC rules and regulations require Dynegy to first file this Amendment in order to complete Dynegy’s Original Form 10-K and be current in its Exchange Act reporting obligations. After the filing of this Amendment, Dynegy no longer intends to file any reports under Sections 13 and 15(d) of the Exchange Act.
1
Table of Contents
Item 10. Directors, Executive Officers and Corporate Governance
DIRECTORS
As a result of the Merger and pursuant to the Merger Agreement, on April 9, 2018 the Company merged with and into Vistra Energy, with Vistra Energy as the surviving corporation. In connection with the Merger, Hilary E. Ackerman, Paul M. Barbas and John R. Sult were appointed to the Vistra Energy board of directors. The remaining members of the Company’s board of directors ceased serving in such capacity at the Merger Effective Time. Set forth below is certain information concerning each of the Company’s directors as of April 8, 2018.
|
Robert C. Flexon, 59 Director since 2011
|
President and Chief Executive Officer
Current Public Directorship:
Westmoreland Coal Company
Prior Experience:
• UGI Corporation—Chief Financial Officer
• Foster Wheeler AG—Chief Executive Officer, Board Director
• NRG Energy—Chief Financial Officer, Chief Operating Officer
• Hercules and ARCO—various financial roles
Mr. Flexon, who oversaw Dynegy’s turnaround in 2012, brings executive management and operating experience in many areas of the energy business, including wholesale power generation. Mr. Flexon also has a broad background in accounting and finance, and significant corporate financial expertise and management experience as a result of his service as a chief financial officer and other senior financial leadership positions.
Mr. Flexon has served as President and Chief Executive Officer since July 2011 and a director of Dynegy since June 2011. Prior to joining Dynegy, Mr. Flexon served as the Chief Financial Officer of UGI Corporation, a distributor and marketer of energy products and related services from February 2011 to July 2011. Mr. Flexon was the Chief Executive Officer of Foster Wheeler AG from June to October 2010 and the President and Chief Executive Officer of Foster Wheeler USA from November 2009 to May 2010. Prior to joining Foster Wheeler, Mr. Flexon was Executive Vice President and Chief Financial Officer of NRG Energy, Inc. from February to November 2009. Mr. Flexon previously served as Executive Vice President and Chief Operating Officer of NRG Energy from March 2008 to February 2009 and as its Executive Vice President and Chief Financial Officer from 2004 to 2008. Prior to joining NRG Energy, Mr. Flexon held executive positions with Hercules, Inc. and various key positions, including General Auditor, with Atlantic Richfield Company. Mr. Flexon holds a Bachelor of Science degree in Accounting from Villanova University. Mr. Flexon served on the public board of directors of Foster Wheeler from 2006 until 2009 and from May to October 2010 and is currently serving on the Boards of Westmoreland Coal Company and Genesys Works-Houston, an organization that transforms the lives of disadvantaged high school students through meaningful work experience. | |
|
|

2
Table of Contents
|
Pat Wood III, 55 Director since 2012
|
Chairman of the Board
Current Public Directorships:
Quanta Services Inc. and SunPower Corp.
Prior Experience:
• Federal Energy Regulatory Commission—Chairman • Public Utility Commission of Texas—Chairman • Baker Botts L.L.P.—Attorney • Arco Indonesia—Associate Project Engineer
Mr. Wood currently serves as our Board’s non-executive Chairman. Mr. Wood brings significant strategic and operational management experience to the Board. Mr. Wood holds a Bachelor of Science in Civil Engineering and a Juris Doctor degree, and has demonstrated strong leadership skills through ten years of regulatory leadership in the energy sector. Mr. Wood brings a unique perspective from and extensive knowledge with regard to the energy regulatory process and energy policy development at the government level, his years of service as a director of other public and private companies, and his energy infrastructure development expertise.
Mr. Wood is serving as the Board’s non-executive Chairman and has served as a principal of Wood3 Resources, an energy infrastructure developer, since July 2005. From 2001 until July 2005, Mr. Wood served as chairman of the Federal Energy Regulatory Commission. From 1995 until 2001, he chaired the Public Utility Commission of Texas. Prior to 1995, Mr. Wood was an attorney with Baker Botts L.L.P., a global law firm, and an associate project engineer with Arco Indonesia, an oil and gas company, in Jakarta. Mr. Wood currently serves on the public boards of directors of Quanta Services Inc. and SunPower Corp. |

3
Table of Contents
|
Hilary E. Ackermann, 62 Director since 2012
|
Current Private Directorships:
Credit Suisse Holdings (USA), Inc.
Hartford Funds (as detailed below)
Prior Experience:
• Goldman Sachs Bank USA—Chief Risk Officer; Chaired Operational Risk, Credit Risk and Middle Market Loan Committees; Vice Chair of Bank Risk Committee; Chair GS Group level Operational Risk Committee • Goldman Sachs & Co—Managing Director, Credit Risk Management & Advisory • Swiss Bank Corporation—Assistant Department Head • Apollo Investment Corporation—Board Director
Ms. Ackermann brings extensive experience assessing credit for major banking institutions, covering a variety of industries including the power generation, electrical utilities and natural resources sectors, as well as in depth coverage of commodities trading including, oil, natural gas and power as a risk manager. Ms. Ackerman currently serves as our Chair of the Finance and Commercial Oversight Committee and, as chair, she contributes significantly to the review and evaluation of our business strategy, capital structure and risk management goals.
Ms. Ackermann was Chief Risk Officer with Goldman Sachs Bank USA from October 2008 to 2011. In this role, she managed Credit, Market and Operational Risk for Goldman Sachs’s commercial bank; developed the bank’s risk management infrastructure including policies and procedures and processes; maintained ongoing relationship with bank regulators including New York Fed, NY State Banking Department and the FDIC; chaired Operational risk, Credit risk and Middle Market Loan Committees; served as Vice Chair of Bank Risk Committee; was a member of Community Investment, Business Standards and New Activities Committees; was a member of GS Group level Credit Policy and Capital Committees; and chaired GS Group level Operational Risk Committee. Ms. Ackermann served as Managing Director, Credit Department of Goldman, Sachs & Co. from January 2002 until October 2008, as VP, Credit Department from 1989 to 2001, and as an Associate in the Credit Department from 1985 to 1988. Prior to joining Goldman, Sachs, Ms. Ackermann served as Assistant Department Head of Swiss Bank Corporation from 1981 until 1985. Ms. Ackermann currently serves on the private board of directors of Credit Suisse Holdings (USA), Inc. and each of Hartford Series Fund, Inc., Hartford HLS Series Fund II, Inc., The Hartford Mutual Funds, Inc. and The Hartford Mutual Funds II, Inc. and previously served on the public board of directors of Apollo Investment Corporation. |

4
Table of Contents
|
Paul M. Barbas, 61 Director since 2012
|
Current Public Directorship:
El Paso Electric Co.
Prior Experience:
• DPL Inc. and DP&L—President and Chief Executive Officer; Board Director • Chesapeake Utilities Corporation—Executive Vice President & Chief Operating Officer; Vice President; • Chesapeake Service Company—President; • Allegheny Power—Executive Vice President; President of Ventures unit • Pepco Holdings, Inc.—Board Director
Mr. Barbas brings extensive utility, management and oversight experience, having served in executive management positions with various utility and other companies. He also has a broad background in finance and marketing and brings a strong understanding of power operations and energy markets. He contributes significantly to the oversight responsibilities on matters relating to executive compensation and compensation strategy and serves as our Compensation and Human Resources Committee chair.
Mr. Barbas was President and Chief Executive Officer of DPL Inc. and its principal subsidiary, The Dayton Power and Light Company (DP&L), from October 2006 until December 2011. He also served on the board of directors of DPL Inc. and DP&L. He previously served as Executive Vice President and Chief Operating Officer of Chesapeake Utilities Corporation, a diversified utility company engaged in natural gas distribution, transmission and marketing, propane gas distribution and wholesale marketing and other related services from 2005 until October 2006, as Executive Vice President from 2004 until 2005, and as President of Chesapeake Service Company and Vice President of Chesapeake Utilities Corporation, from 2003 until 2004. From 2001 until 2003, he was Executive Vice President of Allegheny Power, responsible for the operational and strategic functions of a $2.7 billion company serving 1.6 million customers with 3,200 employees. He joined Allegheny Energy in 1999 as President of its Ventures unit. Mr. Barbas serves on the board of El Paso Electric Co. and also formerly served on the public board of Pepco Holdings, Inc. | |
|
Richard Lee Kuersteiner, 78 Director since 2012
|
Prior Experience:
• Commander, Navy Judge Advocate General’s Corps; Managing Attorney, Navy Office of the General Counsel; Special Assistant United States Attorney; NASA Attorney; Assistant Florida Attorney General; and earlier, Law Clerk to a U. S. District Court Judge • Franklin Templeton Investments—Associate General Counsel; Director of Restructuring; Managing Corporate Counsel • Dex Media, Inc.—Board Director
Mr. Kuersteiner has a broad background in corporate governance and complex restructuring transactions and has been a long-standing member of the Stanford Institutional Investors Forum. He has employed his more than 40 years of legal experience by facilitating the restructuring of over 100 major corporations and has served on, or chaired, numerous official creditors’ committees, which provides the Board with a unique analytical view from the perspective of a large institutional investor. He leads the Board’s corporate governance review and oversight processes and serves as our Corporate Governance and Nominating Committee chair and as a member of the Compensation and Human Resources Committee.
Mr. Kuersteiner was a member of the Franklin Templeton Investments legal department in San Mateo, California from 1990 until May 2012. At Franklin he served in various capacities including as Associate General Counsel and Director of Restructuring and Managing Corporate Counsel. For many years he also was an officer of virtually all of the Franklin, Templeton and Mutual Series funds. In February 2010 he joined the board of R H Donnelley successor, Dex One Corporation, and served until completion of his term in May 2014. Mr. Kuersteiner also serves on the Town of Hillsborough, CA, Financial Advisory Committee and on its Investment Subcommittee. |


5
Table of Contents
|
Jeffrey S. Stein, 48 Director since 2012
|
Founder and Managing Partner of Stein Advisors LLC
Current Public Directorships:
Ambac Financial Group, Inc.—Chairman of the Board; and Westmoreland Coal Company
Prior Experience:
• Durham Asset Management LLC—Co-Founder and Principal; Co-Director of Research • The Delaware Bay Company, Inc.—Co-Director of Research • Shearson Lehman Brothers—Associate/Assistant Vice President in Capital Preservation & Restructuring Group • Granite Ridge Holdings, LLC, MLR Petroleum LLC, US Power Generating Company and KGen Power Corporation—Board Director
Mr. Stein is an investment professional with over 25 years of experience in the high yield, distressed debt and special situations equity asset classes who has substantial experience investing in the merchant power and regulated electric utility industries. Mr. Stein has invested in numerous power companies representing a broad array of power plants diversified by fuel source, position on the dispatch curve, geographic location and technology. Mr. Stein has been actively involved in the hedging, refinancing, restructuring and sale of various power assets. Mr. Stein has served on the private boards of other merchant power companies, and in such capacity has focused on capital allocation, plant operating and financial performance, capital structure optimization, asset acquisitions and dispositions, corporate strategy, risk management and investor communications.
Mr. Stein is Founder and Managing Partner of Stein Advisors LLC, a financial advisory firm that provides consulting services to institutional investors. Previously Mr. Stein was a Co-Founder and Principal of Durham Asset Management LLC, a global event-driven distressed debt and special situations equity asset management firm. From January 2003 through December 2009, Mr. Stein served as Co-Director of Research at Durham responsible for the identification, evaluation and management of investments for the various Durham portfolios. From July 1997 to December 2002, Mr. Stein served as Co-Director of Research at The Delaware Bay Company, Inc., a boutique research and investment banking firm focused on the distressed debt and special situations equity asset classes. From September 1991 to August 1995, Mr. Stein was an Associate/Assistant Vice President at Shearson Lehman Brothers in the Capital Preservation & Restructuring Group. Mr. Stein currently serves as Chairman of the Board of Ambac Financial Group, Inc. (NASDAQ: AMBC) and as a director on the board of Westmoreland Coal Company (NYSE: WLB). He also serves as a board observer on the board of TORM plc (NASDAQ CPH: TRMD A). Mr. Stein previously served as a director on the boards of Granite Ridge Holdings, LLC, MLR Petroleum LLC, US Power Generating Company and KGen Power Corporation. | |

6
Table of Contents
|
John R. Sult, 58 Director since 2012
|
Current Public Directorship:
Jagged Peak Energy, Inc.
Prior Experience:
• Marathon Oil Corporation—Executive Vice President and Chief Financial Officer
• El Paso Corporation—Executive Vice President and Chief Financial Officer; Senior Vice President and Chief Financial Officer; Senior Vice President and Controller; Chief Accounting Officer • El Paso Pipeline GP Company, L.L.C.—Executive Vice President, Chief Financial Officer and Director; Senior Vice President and Chief Financial Officer; Senior Vice President, Chief Financial Officer and Controller • El Paso Pipeline Group—Senior Vice President, Chief Financial Officer and Controller • Halliburton Energy Services—Vice President and Controller • Arthur Andersen LLP—Audit Partner
Mr. Sult, through his experience in senior executive financial positions with large public companies, brings significant knowledge of accounting, capital structures, finance, financial reporting, strategic planning and forecasting. Mr. Sult has extensive knowledge of the energy industry. Further, he has served as an audit partner at a major accounting firm, which, in addition to his other experience, qualifies him as an “audit committee financial expert.” He currently serves as the chair of the Audit Committee and, as the chair, he contributes significantly to the oversight of the integrity of our financial statements, internal controls and ethics and compliance functions.
Mr. Sult served as Executive Vice President and Chief Financial Officer of Marathon Oil Corporation from September 2013 to August 2016. He was Executive Vice President and Chief Financial Officer of El Paso Corporation from March 2010 until May 2012. He previously served as Senior Vice President and Chief Financial Officer from November 2009 until March 2010, and as Senior Vice President and Controller from November 2005 until November 2009. Mr. Sult served as Executive Vice President, Chief Financial Officer and director of El Paso Pipeline GP Company, L.L.C., the general partner of El Paso Pipeline Partners, L.P., from July 2010 until May 2012, as Senior Vice President and Chief Financial Officer from November 2009 until July 2010, and as Senior Vice President, Chief Financial Officer and Controller from August 2007 until November 2009. Mr. Sult also served as Chief Accounting Officer of El Paso Corporation and as Senior Vice President, Chief Financial Officer and Controller of El Paso’s Pipeline Group from November 2005 to November 2009. Prior to joining El Paso, Mr. Sult served as Vice President and Controller of Halliburton Energy Services from August 2004 until October 2005. Prior to joining Halliburton, Mr. Sult managed an independent consulting practice that provided a broad range of finance and accounting advisory services and assistance to public companies in the energy industry. Prior to private practice, Mr. Sult was an audit partner with Arthur Andersen LLP. Mr. Sult currently serves on the board of directors and as chair of the audit committee of Jagged Peak Energy, Inc. | |

EXECUTIVE OFFICERS
Below is certain information regarding each of Dynegy’s executive officers as of April 8, 2018 other than Robert C. Flexon, whose biographical information is presented under “Directors” above. Each executive officer of the Company, including Mr. Flexon, ceased serving in the positions indicated at the Merger Effective Time.
7
Table of Contents
|
Mario E. Alonso, 47 Served since 2001
|
Executive Vice President and General Manager Plant Operations (ERCOT & CAISO) and Supply Chain
Mr. Alonso has served as Executive Vice President and General Manager, Plant Operations (ERCOT & CAISO) and Supply Chain since October 2016. In the role, he is responsible for optimizing plant operations for Dynegy’s generating assets in Texas and California as well as managing the Company’s Supply Chain function. He previously served as Executive Vice President, Strategic Development from February 2014 to October 2016 and Vice President, Strategic Development from June 2012 to February 2014. Mr. Alonso also served as Vice President and Treasurer from July 2011 to June 2012, Vice President—Strategic Planning from December 2008 to July 2011 and Managing Director—Strategic Planning from June 2007 to December 2008. Prior to June 2007, Mr. Alonso served in various roles within the Company’s Strategic Planning and Treasury Departments. Prior to joining Dynegy in 2001, Mr. Alonso was with Enron Corporation. Mr. Alonso earned his Bachelor of Science in Commerce from the University of Virginia and his MBA from the University of Virginia Darden School of Business. | |
| Carolyn J. Burke, 50 Served since 2011
|
Executive Vice President, Strategy and Administration
Ms. Burke has served as Executive Vice President, Strategy, since October 2016, and Administration since September, 2017. In this role, she leads Dynegy’s strategic planning and Dynegy’s clean technology strategy. She also oversees Human Resources and Information Technology and serves as the Chief Integration Officer, held since October 2014, with overall responsibility for integration management. Ms. Burke served as Executive Vice President, Business Operations and Systems from July 2015 to October 2016 with overall responsibility for Procurement, Safety, Environmental, Information Technology, Construction & Engineering, Outage Services and PRIDE—Dynegy’s signature continuous margin and process improvement program. Ms. Burke served as Executive Vice President and Chief Administrative Officer from August 2011 to October 2014. Prior to joining Dynegy, Ms. Burke served as Global Controller for J.P. Morgan’s Global Commodities business from March 2008 to August 2011. Ms. Burke served as NRG Energy Inc.’s Vice President and Corporate Controller from September 2006 to March 2008 and its Executive Director of Planning and Analysis from April 2004 to September 2006. Early in her career, Ms. Burke held various key financial roles at Yale University, the University of Pennsylvania and at Atlantic Richfield Company (now British Petroleum). Ms. Burke graduated from Wellesley College with a BA in Economics and Political Science and earned her MBA at The University Chicago Booth School of Business. She currently serves on the board of directors for Aqua America. | |
| Julius Cox, 46 Served since 2001
|
Executive Vice President and Chief Transformation Officer
Mr. Cox has served as Executive Vice President and Chief Transformation officer since September, 2017. Mr. Cox is is responsible for leading Dynegy’s earnings and cost improvement efforts focusing on Generation, Supply Chain, Capital Expenditure and Working Capital. He served as Executive Vice President and Chief Administrative Officer from October 2014 to September 2017. Mr. Cox served as Vice President, Human Resources & Business Services from May 2012 to October 2014, Vice President, Human Resources from January 2006 to May 2012 and Managing Director—HR Business Services from May 2004 to January 2006. Prior to 2004, Mr. Cox served in various roles in Dynegy’s HR Business Partner and Compensation functions. Prior to joining Dynegy in 2001, Mr. Cox was a consultant at Arthur Andersen LLP and has also held various roles in human resources at Shell Oil and Neiman Marcus. Mr. Cox earned his Bachelor of Business Administration and a Master of Science in HR Management degrees from Texas A&M University. Mr. Cox serves on the Human Resources Committee of the Collaborative for Children, an organization dedicated to increasing the quality of early education in Greater Houston. |


8
Table of Contents
| Martin W. Daley, 62 Served since 2001
|
Executive Vice President and Chief Operating Officer
Mr. Daley has served as Executive Vice President & Chief Operating Officer since October 2016 and is responsible for all aspects of plant operations, safety and environmental for Dynegy’s national fleet of generating assets. Mr. Daley served as our Executive Vice President—Plant Operations, Gas from April 2015 to October 2016. He also served as Vice President and General Manager, Gas Operations from July 2011 to April 2015, Managing Director, Asset Management—Eastern Region from March 2007 to June 2011, and as Senior Director, Regulatory Affairs & Administrative Services from February 2001 to March 2007. Prior to joining Dynegy in February 2001, Mr. Daley held various positions within Central Hudson Gas & Electric, including Superintendent—General Plant Services, Plant Services Supervisor, Production facilities, and Corporate Environmental Affairs. He earned his Bachelor of Science in Environmental Science from Marist College. | |
| Dean M. Ellis, 48 Served since 2009
|
Executive Vice President, Regulatory and Government Affairs
Mr. Ellis has served as Executive Vice President, Regulatory and Government Affairs since September 2017 and as Senior Vice President, Regulatory and Government Affairs from October 2016 to September 2017. In this role he is responsible for Dynegy’s wholesale and retail market policy as well as environmental policy and government outreach. From June 2012 to October 2016 he led Dynegy’s regulatory affairs efforts for the Company, and from 2009 through June 2012, he worked in asset management and regulatory oversight roles in the Company’s Northeast Region. Prior to joining Dynegy in 2009, Mr. Ellis held various roles in electric power planning, engineering, project management and construction for organizations including the New York Independent System Operator and Central Hudson Gas & Electric. He participates on a variety of boards and holds positions of leadership, earned his Bachelor of Science degree in Electric Power Engineering from Rensselaer Polytechnic Institute, and is a licensed professional engineer. | |
| Clint C. Freeland, 49 Served since 2011
|
Executive Vice President and Chief Financial Officer
Mr. Freeland has served as Executive Vice President and Chief Financial Officer since July 2011. Mr. Freeland is responsible for Dynegy’s financial affairs, including finance and accounting, treasury, tax and banking and credit agency relationships. Prior to joining Dynegy, Mr. Freeland served as Senior Vice President, Strategy & Financial Structure of NRG Energy, Inc. from February 2009 to July 2011. Mr. Freeland served as NRG’s Senior Vice President and Chief Financial Officer from February 2008 to February 2009 and its Vice President and Treasurer from April 2006 to February 2008. Prior to joining NRG, Mr. Freeland held various key financial roles within the energy sector. Mr. Freeland graduated from Sewanee, the University of the South and earned his MBA at Vanderbilt University’s Owen Graduate School of Management. | |


9
Table of Contents
| Catherine C. James, 52 Served since 2011
|
Executive Vice President and General Counsel Ms. James has served as Executive Vice President and General Counsel since September 2011. Ms. James is responsible for all legal affairs, including legal services supporting Dynegy’s operational, commercial and corporate areas, as well as ethics and compliance. Prior to joining Dynegy, Ms. James served as General Counsel for NRG Gulf Coast and Reliant Energy in August 2011. Ms. James served as General Counsel for NRG Texas and Reliant Energy from August 2010 to August 2011 and as General Counsel for NRG Texas from November 2007 to August 2010. Prior to joining NRG Energy, Inc., Ms. James held various key legal roles at Calpine Corporation, Reliant Energy, The Coastal Corporation and Chevron. She is on the Board of Directors of New Hope Housing, an organization that provides life-stabilizing, affordable, and permanent housing with support services for people who live on limited incomes. She is a member of the Junior League of Houston. Ms. James earned a Bachelor of Arts degree from Smith College and Juris Doctor from the University of Texas School of Law. | |
| Henry D. Jones, 57 Served since 2013
|
Executive Vice President and Chief Commercial Officer
Mr. Jones has served as Executive Vice President and Chief Commercial Officer since April 2013. Mr. Jones is responsible for Dynegy’s commercial and asset management functions for its power generation business. In addition, Mr. Jones leads a team that develops and executes both hedging and term contracting options for the entire fleet. Prior to joining Dynegy, Mr. Jones served as Managing Director, North American Power and Gas Sales, and Origination at Deutsche Bank starting in May 2010, and managed Deutsche Bank’s North American Power and Gas trading activity starting in August 2012. Prior to joining Deutsche Bank, Mr. Jones was the Chief Operating Officer and Head of Trading at EDF Trading North America from August 2009 to February 2010, Head of Electricity Trading at EDF Trading Markets Limited from August 2008 to July 2009, and Director of Renewable Fuels Trading from July 2007 to July 2008. Mr. Jones was an investor, co-founder and chairman of Renewable Fuel Supply Limited from December 2003 to July 2007. Prior to 2003, Mr. Jones served in a variety of commercial positions with several domestic and international energy companies, including AEP Energy Services Ltd. and Duke Energy Corporation. He earned his Bachelor of Science degree in Marketing and his MBA from Oklahoma State University. | |
| Sheree M. Petrone, 61 Served since 2013
|
Executive Vice President, Retail
Ms. Petrone has served as our Executive Vice President, Retail since April 2015. Ms. Petrone is responsible for leading and overseeing all aspects of Dynegy’s retail electric sales business, including business development, customer care and operations. Ms. Petrone also serves as President of Dynegy’s retail businesses, Dynegy Retail and Homefield Energy. Ms. Petrone served as Vice President, Retail from August 2013 to April 2015. Prior to joining Dynegy in August 2013, Ms. Petrone held various senior leadership positions within Exelon Corporation from March 1999 to June 2013, including Vice President, Commercial Integration, Energy Trading & Marketing, Vice President, Fuels, Environmental Trading and Marketing, Vice President, Retail Energy Company (Exelon Energy), and Director of Finance and Planning (PECO Energy). Ms. Petrone also held business development roles with Trigen, a cogeneration project developer majority owned by Suez Lyonnaise des Eaux from May 1987 to March 1999. She received an MBA from Drexel University and holds a Bachelor of Arts degree in Chemistry and Art History from the University of Delaware. She serves as a board member for the Illinois State Chamber of Commerce, Magee Rehabilitation Hospital Foundation and the Vox Populi Artist Collective. | |


10
Table of Contents
AUDIT COMMITTEE
As of April 8, 2018, the members of the Audit Committee were: John R. Sult (Chair), Paul Barbas and Hilary Ackerman. Each member of the Audit Committee was independent as such term is defined in the NYSE and SEC rules. The Board had determined that each member of the Audit Committee possessed the necessary level of financial literacy required to enable him or her to serve effectively as an Audit Committee member, and all members qualified as Audit Committee Financial Experts, including our designated Financial Expert, Mr. Sult, our Audit Committee Chair. No Audit Committee member served on more than three audit committees of public companies, including our Audit Committee.
CODE OF BUSINESS CONDUCT AND ETHICS
Our Code of Business Conduct and Ethics applies to all of our directors, officers and employees. The key principles of this code include acting legally and ethically, notifying appropriate persons upon becoming aware of issues, obtaining confidential advice and dealing fairly with our stakeholders.
CODE OF ETHICS FOR SENIOR FINANCIAL PROFESSIONALS
Our Code of Ethics for Senior Financial Professionals applies to our Chief Executive Officer, Chief Financial Officer, Chief Accounting Officer and other designated senior financial professionals. The key principles of this code include acting legally and ethically, promoting honest business conduct and providing timely and meaningful financial disclosures to our stockholders.
SECTION 16(a) BENEFICIAL OWNERSHIP REPORTING COMPLIANCE
Section 16(a) of the Exchange Act requires our executive officers, directors and persons who own more than 10% of our equity securities to file reports of ownership and changes in ownership with the SEC and the NYSE. Executive officers, directors and greater than 10% stockholders are required by SEC regulations to furnish us with copies of all Section 16(a) forms they file. Based solely upon a review of the copies of such forms furnished to us in 2017 and upon written representations that no Forms 5 were required, we believe that all persons subject to these reporting requirements filed the required reports on a timely basis.
11
Table of Contents
Item 11. Executive Compensation
COMPENSATION DISCUSSION AND ANALYSIS
The following discussion should be read together with the compensation tables and disclosures for our named executive officers included under “Executive Compensation.” The following discussion contains statements regarding future company performance targets and goals. These targets and goals are disclosed in the limited context of our compensation programs and should not be considered as statements of our expectations or estimates of results or other guidance; to that end, these targets and goals will not be subject to updates.
INTRODUCTION
This section explains our executive compensation program, including philosophy, policies, practices and key compensation decisions for 2017 as it relates to our named executive officers, or Named Executive Officers. Compensation for our Named Executive Officers is further described in the Summary Compensation Tables and other compensation tables contained in this Amendment No. 1 to the Company’s Annual Report on Form 10-K.
2017 Named Executive Officers
| Name | Title | |
| Robert C. Flexon | President and Chief Executive Officer | |
| Clint C. Freeland | Executive Vice President and Chief Financial Officer | |
| Carolyn J. Burke | Executive Vice President, Strategy & Administration | |
| Catherine C. James | Executive Vice President and General Counsel | |
| Henry D. Jones | Executive Vice President and Chief Commercial Officer |
These Named Executive Officers, together with our other senior executives whose compensation is determined by the Compensation Committee and our Board, are referred to as our “Executive Management Team”.
12
Table of Contents
EXECUTIVE SUMMARY
The Compensation Committee is committed to sound compensation and corporate governance practices. It further believes the decisions regarding 2017 compensation were made to ensure continued alignment of executive compensation with the Company’s results, strategic, operational and financial accomplishments and the long-term interests of our stockholders.
Our long-term incentive, or LTI, awards are substantially performance-based aligned with stockholder interests. Our short-term incentive, or STI, plan is designed to reward the achievement of annual performance objectives critical to Dynegy’s success. These objectives are determined annually based on an in-depth strategic planning process with the Board of Directors and the Executive Management Team and progress is reviewed frequently throughout the year. For 2017, the objectives were categorized across five critical success factors weighted as follows for the purposes of determining STI funding for the year (Operations: 20% weighting; Strengthen the Balance Sheet: 30% weighting; Commercial and Retail: 25% weighting; Regulatory: 20% weighting; and Workforce Positioned to Succeed: 5% weighting).
The Compensation Committee and full Board reviewed LTI performance unit metrics and progress along the above STI objectives throughout the year and the Company’s and Named Executive Officers accomplishments in these areas impacted our compensation decisions and pay outcomes in 2017 as described below:
| ● | Our STI plan achieved a quantitative result equal to 100.5% of target based on results relative to our pre-established goals. |
| ● | The Compensation Committee had continued the use of performance shares as the largest component of the 2017 LTI awards for our Named Executive Officers. |
| ● | The PSUs granted in 2015 (covering the 2015-2017 performance period) resulted in no payment, as the Company’s total stockholder return, or TSR, performance threshold was not achieved. |
| ● | PSUs granted in 2016 and 2017 included a second performance metric: cumulative Free Cash Flow, or FCF. This second metric was added to enhance the line of sight for our management team, further align pay and performance and in response to feedback we received from some of our largest stockholders. |
BUSINESS STRATEGY AND COMPANY PERFORMANCE
The Compensation Committee believes that our compensation plans and policies are well-designed and structured to ensure that the compensation of our Named Executive Officers supports our compensation philosophy and objectives, which focus on pay and performance, alignment with stockholder value and market competiveness. This is especially important as the Compensation Committee balances executive compensation decisions that reward performance, while recognizing the challenges stockholders in the Independent Power Producer, or IPP, industry have faced.
During 2017, we proactively managed aspects of our business that were within our direct control, including strengthening the balance sheet, cost management, operations and portfolio management, and took an active and vocal leadership role on the regulatory front at the state and national level. Notable highlights from the past year include:
| ● | Repaid/refinanced $1.25 billion of the 2019 debt maturity and repriced secured debt twice, reducing LIBOR spread by 1.25% and saving $25 million in interest expense per year. |
| ● | Completed the GENCO subsidiary financial restructuring, eliminating $825 million of unsecured Genco bonds in exchange for a portion of cash, notes and warrants. |
| ● | Closed the Engie acquisition and exceeded the synergy target of $90 million. |
| ● | Achieved top decile safety performance and significantly reduced the severity of injuries (SIF) across the fleet. |
| ● | Exercised cost management measures across the fleet to help mitigate margin losses due to market decline and/or reliability issues. |
13
Table of Contents
| ● | Completed a series of divestitures in order to reduce debt balances resulting in $785 million in proceeds from asset sales. |
| ● | Completed the JOU unwind transactions with AEP and AES to improve operating efficiencies. |
| ● | Completed the Brayton Point decommissioning and sale. |
| ● | Our self-improvement program, PRIDE (Producing Results through Innovation by Dynegy Employees) exceeded the pre-established targets set for 2017, achieving $165 million in balance sheet improvements and $89 million in identified EBITDA enhancements. |
| ● | Initiated our Earnings and Cost Improvement program targeting $100 million in savings for 2018. |
Summary of the Key Features of our Executive Compensation Program
| We Do... | We Do Not... | |||
|
|
|
 Offer supplemental executive retirement plan benefits
Pay for Performance
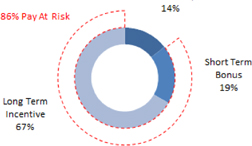
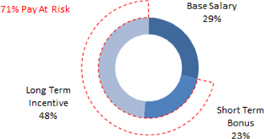
The total compensation for each Named Executive Officer provides reasonable upside potential based on performance as well as risk of no payment when performance objectives are not achieved. Our compensation structure includes a competitive base salary and performance based STI and LTI awards that are aligned with stockholder interests.
For 2017, the mix of pay across base salary, STI, and LTI for the CEO and the other Named Executive Officers was heavily weighted towards at-risk pay. As the two charts below illustrate, a total of 86% of total compensation allocated to Mr. Flexon, and 71% of the total compensation allocated to the other NEOs, was at-risk.
14
Table of Contents
| 2017 CEO Total Compensation | 2017 Total NEO Total Compensation | |
|
| |
Reported and Realizable Pay
The transformation of our portfolio began in 2013 with the acquisition of Ameren Energy Resources and has been accelerated through a series of acquisitions culminating with the completion of the ENGIE Acquisition in early 2017. During the latter half of this time period, we have seen the continuation of a low commodity price environment, significant shifts in the regulatory environment and a change in the stock price valuation for companies in the IPP sector. Over the course of this time period, the Compensation Committee has sought to structure our executive compensation programs to reward our Named Executive Officers for the accomplishment of strategic and annual business objectives, while demonstrating alignment with sustainable long-term stockholder value.
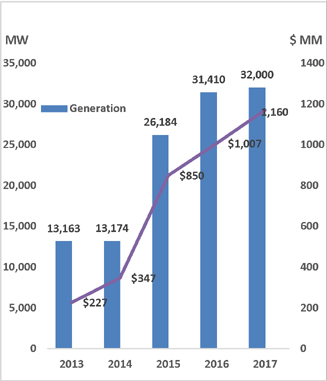
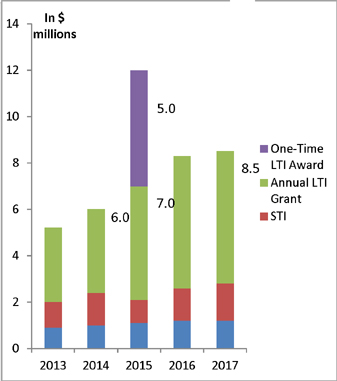
Reported Pay. In the first quarter of each year, the Compensation Committee establishes the annual compensation opportunities for the Named Executives. Decisions regarding base salary, annual STI targets and LTI awards are based on competitive pay levels and practices, Dynegy’s prior year performance, the executives’ individual performance, and progress on the execution of the Company’s strategic plan. Since our emergence from bankruptcy in 2012, Dynegy has made significant progress in enhancing the Company’s ability to generate long-term value for stockholders. The impact of acquisitions and other portfolio management decisions, cost reduction efforts, the realization of operational efficiencies and other actions within management’s control has positioned the Company for future success. Chart 1 illustrates the nearly 5X growth in Adjusted EBITDA1 and generation capacity since 2013. In recognition of these results, during this time period the Compensation Committee has made moderate increases to Mr. Flexon’s annual total compensation (excluding the one-time equity grant made in May 2015 in connection with execution of his amended employment contract), as shown in Chart 2.
1 We define Adjusted EBITDA as EBITDA adjusted to exclude (i) gains or losses on the sale of certain assets, (ii) the impacts of mark-to-market changes on derivatives related to our generation portfolio, as well as warrants, (iii) the impact of impairment charges: certain amounts such as those associated with the acquisitions, dispositions, and restructurings (v) non-cash compensation expenses (vi) gains or losses related to modification or extinguishment of debt, and (vii) other material or unusual items. For a reconciliation of Adjusted EBITDA to net income, the most directly comparable GAAP financial measure, for fiscal years 2015, 2016 and 2017, see “Part II, Item 7. Management’s Discussion and Analysis of Financial Condition and Results of Operations—Results of Operations” of the Original Form 10-K and for a reconciliation of Adjusted EBITDA to net income for fiscal years 2013 and 2014, see “Part II, Item 7. Management’s Discussion and Analysis of Financial Condition and Results of Operations—Results of Operations” of our Annual Report on Form 10-K for the fiscal year ended 2014.
15
Table of Contents
| Chart 1 - Growth in Generation Capacity and Adjusted EBITDA
|
Chart 2 - 2013-2017 – Reported CEO Compensation | |
|
|
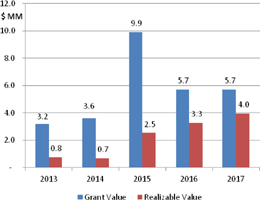
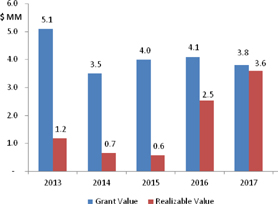
Realizable Pay. The Compensation Committee believes that both the mix and design of LTI award vehicles delivered to the Named Executive Officers establish strong alignment with stockholders, and such awards are working as intended. The average realizable value of these awards is approximately 40% of their reported value, as measured on December 31, 2017.
| Chart 1 - Grant Value of LTI Previously Awarded to the CEO vs. Realizable Value (as of Dec 31, 2017)
|
Chart 2 – Average Grant Value of LTI Previously Awarded to the other NEOs vs. Realizable Value (as of Dec 31, 2017) | |
|
|
16
Table of Contents
Note: Realizable Pay is defined using the following facts and assumptions:
| (1) | Dynegy closing stock price of $11.85 as of December 31, 2017. |
| (2) | 2013, 2014 and 2015 PSUs resulted in no payment. |
| (3) | Assumes 2016 and 2017 PSUs vest at target |
| (4) | Chart 1 includes a one-time RSU grant to Mr. Flexon in May 2015 in connection with the renewal of his employment agreement. |
EXECUTIVE COMPENSATION PROGRAM OVERVIEW
Philosophy and Objectives of our Executive Compensation Programs
The executive compensation program, administered by the Compensation Committee, is designed to attract, motivate and retain a highly qualified Executive Management Team capable of effectively managing and growing our business. Our executive compensation program reflects a fundamental belief that rewards should be competitive, both in elements and amount, with the broad labor market in which we compete for executive talent and commensurate with the Company and the individual executive’s performance. The primary objectives of our executive compensation program are:
| ● | Pay for Performance—Our total compensation for each individual provides reasonable upside potential for exceptional performance; as well as risk of no payment, with respect to incentive compensation, when performance objectives are not achieved. Our variable pay programs are designed as forward-looking incentives that reflect individual and corporate performance during the year under review. |
| ● | Alignment with Stockholder Value—Our LTI awards encourage share price improvement and a strong link to stockholder interests. Our compensation programs are designed and administered to maximize stockholder value. |
| ● | Market Competiveness—Our overall compensation strategy recognizes that attraction and retention of key talent is critical. A market competitive pay program is necessary to the attainment of our stated business goals and objectives and to the creation of value for our stockholders. |
The Compensation Committee considers these objectives in making decisions regarding the design of our executive compensation program, as well as the level and structure of pay for our Named Executive Officers.
Elements of our Executive Compensation Program
The Compensation Committee strives to promote a pay for performance culture. The executive compensation program was designed to incorporate three primary elements: base salary, STI, and LTI awards.
| Element | Key Characteristics | Pay at Risk | ||
| Base Salary |
● Reflects each Named Executive Officer’s scope, experience, qualifications, and impact on the Company’s business results |
No | ||
| Short-Term Incentive Awards |
● Designed to motivate the achievement of short-term business results critical to our success and achievement of long-term value creation for our stockholders ● Based on annual performance against specific identified financial, strategic, and operational goals |
Yes; payout is based on achievement of pre-established company goals and individual performance factors; no payout occurs if threshold performance goals are not achieved |
17
Table of Contents
| Element | Key Characteristics | Pay at Risk | ||
|
Long-Term Incentive Awards |
● Structured to achieve multiple objectives, including: the attraction and retention of executive talent; alignment of executives’ financial interests with the interests of stockholders; and rewarding the achievement of long-term strategic performance ● Delivered through a mix of award vehicles |
Yes; payout strongly linked to Dynegy’s stock price performance; decline in stock price will reduce the value of LTI awards and an increase in stock price will enhance the value of LTI awards | ||
|
Performance Share Units |
● Largest portion of total LTI mix ● Performance measured over a 3-year period, across two metrics: ● 50% based on TSR relative to peers ● 50% based on Dynegy’s cumulative FCF2 ● Award payouts are capped if Dynegy’s absolute TSR is negative |
Yes; value linked to Dynegy’s TSR relative to peers and FCF | ||
|
Restricted Stock Units |
● Subject to three-year vesting |
Yes; value linked to Dynegy’s stock price | ||
|
Stock Options |
● Subject to three-year vesting |
Yes; value present only when Dynegy’s stock price increases above the strike price (stock price on the day of grant) |
Peer Group and Benchmarking
The Compensation Committee uses compensation benchmarking data to provide a competitive market context to its decisions regarding compensation for the Named Executive Officers. To assist the Compensation Committee with setting 2017 target compensation levels, Meridian Compensation Partners, LLC, or Meridian, prepared a benchmarking review to assess the competitiveness of each element of compensation for the Named Executive Officers, and to provide information regarding incentive plan designs and pay practices within the energy industry.
The Compensation Committee reviewed and discussed the benchmarking data, and used the data to inform its compensation decisions. The Compensation Committee believes the combination of these two data perspectives offers an appropriate and credible basis for benchmarking the compensation of the Named Executive Officers. The Committee will continue to evaluate this approach and available data sources, and make changes as appropriate.
2 We define Free Cash Flow in the 2017 award agreements as cash flow from operations less non-discretionary maintenance and environmental capital expenditures, the cash impact of acquisition-related fees and financing costs plus the return of restricted cash. Free Cash Flow also includes receipts or payments related to interest rate swaps, excludes the impact of changes in collateral and working capital and excludes certain capital costs related to compliance with environmental requirements.
18
Table of Contents
The benchmarking approach for the 2017-2018 benchmarking cycle uses two sources of market data to assess the competitiveness of Dynegy’s executive compensation program—information contained in the public disclosures of a selected group of peer companies, and data from the 2017 Equilar Executive Compensation Survey database.
Selection of the peer companies presents certain challenges due to the limited number of directly comparable companies. Dynegy operates in competitive wholesale and retail markets as an IPP. Given the relatively small number of direct competitors, the Committee has expanded the peer group to include companies from three segments of the power generation industry—publicly traded independent power producers, electric utilities and multi-utilities who both possess competitive power generation operations— to provide a more robust and statistically significant peer group. Specific factors considered in selection of the peer group include:
| ● | Financial and Operational Metrics—assets, revenues, market capitalization, enterprise value; |
| ● | Operational Scope—merchant generation capacity, industry segment, commercial, retail and commodity focus; |
| ● | Market-Based Factors—labor market requirements (e.g., finance, operations, commercial), competition for executive talent, comparability of pay data; and |
| ● | External stockholder and governance evaluations of Dynegy’s pay levels and practices. |
The resulting selection of peer companies attempts to balance the above considerations with the need to identify companies that similarly face the unique challenges of the power generation market. The 2017 peer group consists of nine companies, plus Dynegy, that operate merchant power businesses, with revenues ranging from $1.4 billion to $28.6 billion (median revenues of $10.2 billion).
| Peer Companies | ||||
| IPPs | Electric Utilities | Multi-Utilities | ||
|
● AES Corporation ● Calpine Corporation ● Capital Power Corporation ● NRG Energy Inc. ● TransAlta Corporation |
● Entergy Corporation ● Exelon Corporation ● First Energy Corporation |
● Public Service Enterprise Group Inc. | ||
In 2017, one company was removed from the peer group (Talen Energy), while one firm was added (TransAlta Corporation). These changes were intended to further refine the benchmarking group, however our peer group is still comprised of companies that vary with respect to their core business model. The IPP peers operate portfolios that generate power in competitive, deregulated markets, while the utility peer companies operate portfolios that are also supported by a regulated rate base. Additionally, the increase in state regulatory actions, that in some instances have resulted in out-of-market subsidies for utility-owned generation facilities, have further contributed to uneven competitive landscape across the companies that comprise our peer group.
The Compensation Committee reviews benchmark compensation data for the Named Executive Officers, based on position matches developed from analyses of publicly-disclosed data from the peer group companies and supplemental benchmark data derived from the Equilar Executive Compensation Survey. This survey analysis included data from 32 energy industry companies with median revenues of $6.6 billion and 187 general industry companies with median revenues of $4.7 billion. A listing of the companies included in the survey data is provided in the table in Annex A.
The Compensation Committee does not target specific percentiles within the benchmark data provided by these sources when making compensation decisions. Rather, the Compensation Committee determines the appropriate competitive positioning for each Named Executive Officer based on a variety of factors including market data, individual expertise and individual performance and corporate performance.
19
Table of Contents
Stockholder Outreach and Say on Pay Results
Dynegy has maintained regular, year-round engagement with top stockholders through investor relations activities involving several members of our executive management team. These activities include quarterly earnings calls, conferences, face-to-face visits and other communication channels. Our outreach efforts, which covered updates to our strategic focus, executive compensation and overall governance practices, included discussions with several of our largest stockholders. These discussions provided feedback, on a number of areas, in support of the overall structure of our executive compensation program, and also highlighted the need to continue to more clearly explain the link between our business results with executive compensation decisions. We focused on such suggested disclosures and incorporated a number of suggested changes herein. We designed 2017 pay to address some stockholder concerns resulting in 80% Say on Pay results in 2017.
The primary participants in these discussions were our Compensation Committee Chair, our Chief Administrative Officer and members of our Human Resources, Legal and Investor Relations teams.
2017 COMPENSATION
Base Salary
The Compensation Committee considers job responsibilities, external benchmark data, internal pay equity, and individual performance to determine the level of base salary for each Named Executive Officer. In early 2017, the Compensation Committee reviewed these factors and base salaries for the Named Executive Officers and approved increases as indicated below:
| Percentage | ||||||||
| Named Executive Officer |
2016 Base Salary | 2017 Base Salary | Increase | |||||
|
Robert Flexon |
$1,200,000 | $1,240,000 | 3 | % | ||||
|
Clint Freeland |
$587,000 | $602,000 | 3 | % | ||||
|
Carolyn Burke |
$530,000 | $547,000 | 3 | % | ||||
|
Catherine James |
$525,000 | $542,000 | 3 | % | ||||
|
Henry Jones |
$527,100 | $560,000 | 6 | % | ||||
The Compensation Committee recommended increases for Mr. Flexon, Mr. Freeland, Ms. Burke, Ms. James, and Mr. Jones consistent with the merit adjustment budget that was provided to non-represented employees and comparable to the peer market levels relative to their individual performance. The Compensation Committee sought to adjust Mr. Jones’s salary upward in the competitive benchmark range commensurate with his experience and performance, and as such recommended a base salary adjustment, which was subsequently approved by the full Board.
Short-Term Incentive (STI) Plan
The Dynegy Inc. Incentive Compensation Plan, or STI Plan, serves as a variable, at-risk mechanism to reward our Named Executive Officers and other eligible employees for the achievement of annual performance objectives critical to our success. The STI Plan emphasizes pay for performance by providing cash awards for the achievement of pre-determined levels of Company performance. Annual STI awards are paid from a performance-based bonus pool designed to fund STI awards paid to our Named Executive Officers and other executives as determined through the STI Plan, and to allow for full tax deductibility of such STI awards.
20
Table of Contents
Individual STI Targets. The Compensation Committee reviews the STI target bonus opportunities for each Named Executive Officer on an annual basis, and may make adjustments to reflect changes in an individual role or to maintain competitive alignment. The Compensation Committee believes the target STI opportunities for 2017 were appropriately positioned relative to competitive benchmark levels and remain unchanged from 2016. The 2017 STI targets for each of the Named Executive Officers, expressed as a percentage of base salary, were as follows:
| Named Executive Officer | Target STI Opportunity (percent of base pay) | |
| Robert Flexon |
125% | |
| Clint Freeland |
75% | |
| Carolyn Burke |
75% | |
| Catherine James |
75% | |
| Henry Jones |
75% |
21
Table of Contents
The design of the STI Plan provided each of our Named Executive Officers with the opportunity to earn up to a maximum of 200% of their individual STI target, based on the Company’s performance relative to pre-established performance components and levels of achievement.
STI Performance Objectives. Each year, the Board of Directors, the Executive Management Team, and internal and external subject matter experts convene to review, discuss and determine the Company’s five-year Strategic Plan. The key priorities required to accomplish our strategic plan form the basis for our annual business objectives, which we refer to as Critical Success Factors. Each of the Critical Success Factors is weighted, and performance is measured against year-end performance to determine the overall funding for the STI program.
For 2017, the Committee approved five Critical Success Factors that were identified in the Strategic Plan to form the basis of performance goals under the STI Plan (see table below). These Critical Success Factors were focused on being the safest, most reliable, lowest-cost platform in the industry while optimizing the portfolio through PRIDE, strengthening the balance sheet, and reducing debt. Performance goals under Strengthen Balance Sheet, Commercial & Retail, Operations, and Workforce Positioned to Succeed (which collectively had an 80% weighting) included quantifiable performance metrics. In contrast, the performance goals under Regulatory (which had a 20% weighting) included subjective performance metrics. At the start of the year, the Committee established specific goals that defined threshold, target and maximum performance levels. Details regarding the specific performance goals are provided below in the section called “2017 STI Results”.
| Critical Success Factors | Weighting | |
| Strengthen Balance Sheet |
30% | |
| Operations |
20% | |
| Commercial & Retail |
25% | |
| Regulatory |
20% | |
| Workforce Positioned to Succeed |
5% |
Throughout the year, the Compensation Committee was provided with updates on progress against these performance goals. At the end of the year, the Compensation Committee reviewed achieved performance and determines the percentage of target payout earned as a result of this performance.
STI Funding Gate. In order for our annual STI Plan to be funded at any performance level, a minimum level of performance must be first achieved. In the first quarter of each year, the Compensation Committee established this “funding gate” based on a key financial performance metric. If this funding gate metric is not achieved, the STI program will not be funded, resulting in no STI payout to any employee, including our Named Executive Officers. For 2017, the Compensation Committee approved the funding gate of $47 million of FCF.
2017 STI Results. In February 2018, the Compensation Committee determined that the 2017 funding gate had been successfully achieved. The Compensation Committee then reviewed the Company’s performance relative to the 2017 Critical Success Factors and performance metrics and certified the quantitative result as 100.5% of target. The performance results were reviewed and confirmed by the Company’s Internal Audit team. The detailed performance results relative to the Critical Success Factors are summarized below:
22
Table of Contents
| Strengthen the Balance Sheet (30%) | Weight | Achievement | ||||||||||
| Financial Performance (40%) |

|
Adjusted EBITDA - $1,170MM | 50.0 | % | 50.0 | % | ||||||

|
FCF - $417MM | 50.0 | % | 200.0 | % | |||||||
| Liability Management Part I (30%) |

|
Closed sale of Armstron, Troy, Milford, MA, Dighton, and Lee generating $785MM, Brayton Pt $8MM, Cash benefit avoidance $62MM | 100.0 | % | 100.0 | % | ||||||
| Liability Management Part II (30%) |
|
GENCO/IPH consolidation completed as of Feb 2017. JOU swap and AEP complete, FERC approval for JOU rationalization with AES; Two tranches of PJM Capacity Forward Sale executed; Big three spending delayed two years improving 2017 and 2018 cash flow by $178M. | 100.0 | % | 150.0 | % | ||||||
| Operations (20%) | Weight | Achievement | ||||||||||
| Safety (includes ENGIE plants) (30%) |
|
Above target (25 OSHA recordables) performance | 60.0 | % | 150.0 | % | ||||||
|
|
Above target (4 VPP applications) completion | 10.0 | % | 150.0 | % | |||||||
|
|
Maximum achievement with 11 GAP Assessments completed | 10.0 | % | 200.0 | % | |||||||
|
|
100% of safety action plans submitted for Dynegy and ENGIE | 10.0 | % | 200.0 | % | |||||||
|
|
All quarterly reports completed | 10.0 | % | 150.0 | % | |||||||
|
|
Above target performance with 4 notice of violations at Dynegy plants | 25.0 | % | 150.0 | % | |||||||
| Environmental, NERC & CCB (10%) |
|
Above target performance with 3 notice of violations at ENGIE plants | 25.0 | % | 150.0 | % | ||||||
|
|
Coal Combustion Byproducts recycled at 79.4% - target | 50.0 | % | 100.0 | % | |||||||
| Achieve targeted reliability performance across the fleet (includeds ENGIE) (30%) |
|
LOC - $72.6MM, below target | 100.0 | % | 75.0 | % | ||||||
| Achieve Maximo performance metric (10%) |
|
Above target; entire fleet had 90% of critical performance metrics completed | 100.0 | % | 150.0 | % | ||||||
|
|
PRIDE - $87 MM EBITDA (maximum achievement) | 25.0 | % | 200.0 | % | |||||||
| Achieve targeted PRIDE performance on EBITDA and Balance Sheet (10%) |
|
PRIDE - $165MM Balance Sheet (maximum achievement) | 25.0 | % | 200.0 | % | ||||||
|
|
ENGIE - $91MM EBITDA (target achievement) | 25.0 | % | 100.0 | % | |||||||
|
|
ENGIE - $29MM Balance sheet (target achievement) | 25.0 | % | 100.0 | % | |||||||
| Improve strategic sourcing capabilities by effectively classifying all direct spend (~ $726M); includes ENGIE (10%) |
|
Achieved increased spend capture from current levels (5%) to target level (75%) | 100.0 | % | 100.0 | % | ||||||
| Commercial & Retail (25%) | Weight | Achievement | ||||||||||
|
|
Total MISO bilateral contracts, origination, exports PY 17/18 auction and/or incremental 2017 retail capacity sales above threshold at $64MM | 50.0 | % | 50.0 | % | |||||||
| Capacity Sales (50%) |

|
Total ISO-NE bilateral contracts and/or origination capacity sales below threshold at $21MM | 30.0 | % | 0.0 | % | ||||||
|
|
Total PJM bilateral contracts and/or origination capacity sales below threshold at $0 | 20.0 | % | 0.0 | % | |||||||
| Energy Sales (15%) |
|
Energy Sales Below Target | 100.0 | % | 50.0 | % | ||||||
| Fuel Procurement (excludes ENGIE) (10%) |
|
Fuel Procurement 60% of firm transportation and/or delivered natural gas is now secured | 100.0 | % | 150.0 | % | ||||||
| Retail (25%) |

|
EBITDA - below target by ($21MM) Variances driven by lower volumes due to weather and price competition especially IL. Lower volumes and the liquidation of excess hedge levels | 50.0 | % | 0.0 | % | ||||||
|
|
Forward sales at 54.7 MM TWh exceeding target by 4.7TWh | 50.0 | % | 150.0 | % | |||||||
23
Table of Contents
| Regulatory (20%) | Weight | Achievement | ||||||||||
| Out-of-Market Subsidies (40%) |
|
DYN is actively funding campaigns in CT, NJ, PA, OH. NY and IL litigation under apeal | 100.0 | % | 100.0 | % | ||||||
| Market Design (40%) |
|
PJM & ISONE: DYN actively participating in stakeholder processes on the capacity and energy market reforms | 100.0 | % | 100.0 | % | ||||||
| Actively engage in Federal policy development and implementation (20%) |
|
DYN actively worked to obtain a stay and reconsideration on the ELG rule; in addition, DYN is continuing to work wih the Illinois EPA staff on a combined Illinois MPS group | 100.0 | % | 100.0 | % | ||||||
|
Workforce Positioned to Succeed (5%)
|
Weight
|
Achievement
|
||||||||||
| Conduct Inspired Energy sessions (50%) |
|
Training on culture shaping initiative 100% completed at all locations | 100.0 | % | 100.0 | % | ||||||
| Conduct live ethics and compliance sessions (50%) |
|
Live ethics and compliance training sessions were conducted at 10 ENGIE plants | 100.0 | % | 100.0 | % | ||||||
The table below summarizes the actual achievement under each Critical Success Factor and the resulting weighted performance factor.
| Critical Success Factors | Target Weighting |
Actual Achievement |
Weighted Performance Factor |
|||||||||
|
Operations |
20 | % | 123.0 | % | 24.6 | % | ||||||
|
Strengthen the Balance Sheet |
30 | % | 125.0 | % | 37.50 | % | ||||||
|
Commercial & Retail |
25 | % | 53.80 | % | 13.40 | % | ||||||
|
Regulatory |
20 | % | 100.0 | % | 20.0 | % | ||||||
|
Worforce Positioned to Succeed |
5 | % | 100.0 | % | 5.0 | % | ||||||
|
Total Achievement Result |
100.5 | % | ||||||||||
|
Compensation Committee Recommendation |
100.0 | % | ||||||||||
Approved 2017 STI Awards. In February 2017, the Compensation Committee approved the STI awards for our Named Executive Officers as set forth in the below table. The awards for Mr. Freeland, Ms. Burke, Ms. James and Mr. Jones were recommended by Mr. Flexon and reviewed and approved by the Compensation Committee. The award levels reflect the contributions each made relative to the 2017 Critical Success Factors and assessment of their individual performance during the year. Mr. Flexon’s award was recommended by the Compensation Committee and approved by the full Board. All awards for the Named Executive Officers were above target and the quantitative result. The Compensation Committee and Board’s review of individual performance and contributions resulted in final payouts above the 100% funding percentage.
Robert Flexon: As Chief Executive Officer, Mr. Flexon led the organization through its efforts to grow the business in what we believe are the most attractive competitive markets. Additional accomplishments in 2017 included:
| ● | Drove the balance sheet improvement through multiple debt refinancings, $785 million in asset sales, and $87 million and $165 million in EBITDA and Balance Sheet improvements, respectively. |
| • | Negotiated and reached agreement with the Genco creditor group which resulted in the extinguishment of over $600 million in debt. |
| • | Led and directed the Vistra negotiations and activities which led to overwhelming shareholder approval. |
| • | Responsible for our culture shaping efforts, including safety programs. Safety performance in 2017 was the best performing year since 2010. |
Clint Freeland:
As EVP and Chief Financial Officer, Mr. Freeland leads the finance organization, which achieved the following in 2017:
| • | Successfully provided financing and financial integration of the ENGIE acquisition and the financial framework and analysis for Vistra transaction and for IPH/Genco restructuring. |
| • | Orchestrated the repayment/refinancing of $1.25 billion of the 2019 debt maturity. |
24
Table of Contents
| • | Led repricing DYN’s ~$2 billion secured debt twice, saving $25MM/yr. in interest expense. |
| • | Supported PRIDE and ECI initiatives and analysis. |
Carolyn Burke:
As EVP, Strategy & Administration, Ms. Burke leads the Company’s strategic planning activities. She has also taken on additional responsibilities of administration functions including Human Resources and Information Technology. Other accomplishments included:
| • | Led Dynegy’s M&A activities, including the Vistra combination analysis and synergy identification. |
| • | Successful integration of ENGIE capturing $90+mm in synergies. |
| • | Completed asset sales of Lee, Dighton, Milford, Armstrong and Troy and JOU rationalization. |
| • | Established robust strategic planning process that clearly delineated strategic priorities. |
| • | Developed culture of project management supported by sponsored project management teams. |
Catherine James:
As EVP and General Counsel, Ms. James leads the Company’s legal team that played a key role in 2017, navigating the organization through a number of challenging and complex matters, which included:
| • | Led legal management of Dynegy’s M&A activities, including the Vistra transaction, ENGIE acquisition, and due diligence, negotiation, documentation, and regulatory approvals for the sales of Lee, Dighton, Milford, Armstrong and Troy and consolidation of the JOU ownership in Zimmer and Miami Fort. |
| • | Led legal efforts to achieve the restructuring of $825mm of debt at GENCO and provided legal support for numerous other financings during year. |
| • | Successful management of litigation, including denial of class certification in the Gas Index case, dismissal of Section 16(b) lawsuit brought by JD Jordan, and Schaefer spoliation claim. |
Hank Jones:
As EVP and Chief Commercial Officer, Mr. Jones oversaw significant improvements in the organization in 2017. Specific achievements included:
| • | Successfully managed active hedging program which reduced earnings volatility and locked in significant economic value. |
| • | Execution of fuel procurement and logistics strategy, securing firm delivery of natural gas for 60% of our average daily fuel burn and reducing our year on year delivered coal cost by approximately $65 million. |
| • | Secured $120 million in forward capacity sales outside of auction process, creating increased future earnings certainty. |
| • | Successfully obtained rail and coal commercial modifications to reduced costs and to provide additional operational flexibility. |
| Named Executive Officer | STI Target % |
STI Target $ |
2017 STI Funding (based on Performance Achievement Percentage (100.5%) |
Actual 2017 STI Award Value |
2017 STI Award as a Percentage of Target |
|||||||||||||||
| Robert Flexon |
125 | % | 1,540,385 | 1,548,087 | 1,600,000 | 104 | % | |||||||||||||
| Clint Freeland |
75 | % | 449,337 | 451,584 | 475,000 | 106 | % | |||||||||||||
| Carolyn Burke |
75 | % | 407,799 | 409,838 | 475,000 | 116 | % | |||||||||||||
| Catherine James |
75 | % | 404,049 | 406,069 | 430,000 | 106 | % | |||||||||||||
| Henry Jones |
75 | % | 415,255 | 417,332 | 420,000 | 101 | % | |||||||||||||
25
Table of Contents
Long-Term Incentive (LTI) Awards
Our LTI awards focus on the attainment of long-term performance goals and objectives, which are deemed instrumental in creating value for stockholders and supporting retention incentives for our executives. The Compensation Committee reviews the LTI targets each year for competitive alignment. The Compensation Committee also reviews market trends related to the award mix and determines the appropriate target LTI value and mix of equity instruments considering market benchmark data.
In February 2017, the Compensation Committee approved each Named Executive Officer’s 2017 target grant value and the allocation of this value among the following LTI awards (based on award values): 35% RSUs, 25% stock options, and 40% PSUs. The Compensation Committee believes this mix of LTI instruments provides performance incentives that are aligned with stockholder interest and retention incentives for our Named Executive Officers.
The awards for Mr. Freeland, Ms. Burke, Ms. James and Mr. Jones were recommended by Mr. Flexon and reviewed and approved by the Compensation Committee. The award levels reflect the contributions each have made and Mr. Flexon’s and the Compensation Committee’s desire to both retain each Named Executive Officer and ensure continued alignment with long-term stockholders’ interests. Mr. Flexon’s award was recommended by the Compensation Committee and approved by the full Board. In determining the award level, the Compensation Committee took into account Mr. Flexon’s efforts and contributions in leading the Company, successful execution on critical objectives and the importance of retaining him.
The table below illustrates the 2017 LTI award grant value for each of the Named Executive Officers.
| Named Executive Officer |
Target Grant Value of 2017 Long-term Incentive Award(1) |
Stock Option Value |
Restricted Stock Unit Value |
Performance Share Unit Target Value |
||||||||||||
|
Robert Flexon |
$5,232,000 | $1,308,000 | $1,831,200 | $2,092,800 | ||||||||||||
|
Clint Freeland |
$900,000 | $225,000 | $315,000 | $360,000 | ||||||||||||
|
Carolyn Burke |
$850,000 | $212,500 | $297,500 | $340,000 | ||||||||||||
|
Catherine James |
$850,000 | $212,500 | $297,500 | $340,000 | ||||||||||||
|
Henry Jones |
$900,000 | $225,000 | $315,000 | $360,000 | ||||||||||||
| (1) | Note that the actual amount realized under these LTI awards may materially differ from the grant values shown in the chart above. |
Performance Share Units. The PSUs granted to our Named Executive Officers in 2017 may be earned over a three-year performance period starting on January 1, 2017 based on our performance across two metrics, each weighted 50%: 1) our Total Shareholder Return (TSR) relative to a selected group of energy industry peer companies, and 2) cumulative Free Cash Flow relative to pre-established goals. The Compensation Committee selected TSR as a performance measure because it aligns with the long-term interests of our stockholders. The energy industry peer companies selected for TSR are the same as the companies disclosed under the prior “Peer Group and Benchmarking” section. Free Cash Flow was selected because it represents a critical measure used by our stockholders to assess the strength of our business and success of our strategic efforts. The Compensation Committee set Free Cash Flow goals that were designed to be reasonably achievable but challenging. The number of PSUs granted to each Named Executive Officer was based on the PSU Target Value shown above divided by the closing stock price of our common stock on the day of grant.
Set forth below are the key provisions of PSUs granted to our Named Executive Officers in 2017.
| PSUs | ● 50% relative TSR vs. peer group companies | |
26
Table of Contents
|
● 50% cumulative FCF vs. pre-established goals in Strategic Plan | ||
| Payout | ● Dynegy 3-year Cumulative TSR percentile ranking and cumulative FCF calculated at the end of the performance period and applied to a pre-established payout scale to determine the number of earned/vested PSUs ● Payout opportunity of 0-200% of granted PSUs at target ● Earned PSUs are intended to be settled in shares | |
| Calculation | ● TSR calculated using an average stock price at the beginning and end of the performance period. ● 20-day average stock price calculation will be based on a period that is +/- 10 days around the measurement dates. ● If absolute TSR is negative, the PSU award will be capped at 100% of the target number of PSUs granted, regardless of relative TSR positioning. ● Cumulative FCF adjusted to account for acquisitions and divestitures | |
| Percentile Rank Relative TSR | Payout % of Target (# of Shares) | |
| 90th percentile + |
200% | |
| 75th percentile |
175% | |
| 50th percentile |
100% | |
| 25th percentile |
50% | |
| <25th percentile |
0% |
Restricted Stock Units. The number of RSUs granted to each Named Executive Officer was based on the RSU Value shown above divided by the closing stock price of our common stock on the day of grant. Each RSU corresponds in value to a single share of our common stock. RSU awards will vest in three equal annual installments starting on the first anniversary of the award’s grant date. On each vesting date, the number of RSUs that vest will be settled and paid in a corresponding number of shares of our common stock.
Stock Options. The number of stock options granted to each Named Executive Officer was based on the Stock Option Value shown above divided by the Black Scholes value of a single option determined on the day of grant. Stock options granted to each Named Executive Officer allows for the purchase of a fixed number of shares of our common stock at a fixed price (i.e., exercise price) over a ten-year period. The exercise price is set at the closing price of a share of our common stock on the date of grant. The stock options vest in three equal annual installments, on the anniversary date of the grant, over the three-year vesting period.
Effect of Merger on Outstanding LTI Awards
Under the Merger Agreement, we agreed that at Merger Effective Time, each outstanding stock option would be converted into an option to purchase shares of Vistra Energy Common Stock, on the same terms and conditions that were applicable under such stock options immediately prior to the effective time (including any accelerated vesting provisions), equal to the product of (A) the total number of shares of Dynegy common stock subject to such stock option and (B) the Exchange Ratio, rounded down to the nearest whole number of shares of Vistra Energy Common Stock. The per-share exercise price of each converted Vistra Energy option would be equal to the quotient determined by dividing (1) the exercise price per share applicable to the Dynegy option by (2) the Exchange Ratio, rounded up to the nearest whole cent.
At the Merger Effective Time, each outstanding RSU would be converted into a number of Vistra Energy restricted stock units equal to the product of (A) the number of Dynegy RSUs held by such holder immediately prior to the effective time and (B) the Exchange Ratio, and remain outstanding on the same terms and conditions as were applicable to such award prior to the effective time (including any accelerated vesting provisions).
27
Table of Contents
At the Merger Effective Time, each outstanding PSU would be converted into the right to receive a number of shares of Vistra Energy Common Stock (and cash in lieu of fractional shares to be paid by the surviving corporation to the holder) equal to the product of (A) the total number of shares of Dynegy common stock that would be payable in respect of such Dynegy PSU (1) in the case of Dynegy PSUs granted in 2015, at the actual level of performance applicable to such Dynegy PSU as determined in accordance with the applicable award agreement and (2) in the case of Dynegy PSUs granted in 2016 and 2017, (x) at the actual level of performance applicable to such portion of such Dynegy PSU that relates to total stockholder return, as determined in accordance with the applicable award agreement, and (y) at the target level of performance applicable to such portion of such Dynegy PSU that relates to free cash flow, and (B) the Exchange Ratio.
Additionally, on December 19, 2017, the Board approved the acceleration of vesting of restricted stock units granted to Messrs. Flexon and Jones in 2015 that were otherwise scheduled to vest on March 3, 2018 and April 20, 2018 for Mr. Flexon and March 3, 2018 for Mr. Jones. The Board approved the accelerated vesting of such grants, and the related withholding of shares to pay taxes, in order to mitigate potential adverse tax consequences of Section 280G of the Internal Revenue Code in connection with the pending Merger.
Retirement Benefit Plans
Our Named Executive Officers, similar to all employees, participate in our two qualified retirement plans: the Dynegy Inc. 401(k) Plan and the Dynegy Inc. Retirement Plan. The Dynegy 401(k) Plan provides for a dollar-for-dollar match for each dollar contributed (on a pre-tax basis) up to 5% of salary (with such elective contributions capped at $18,000 for 2017). Our matching contributions to the Dynegy 401(k) Plan vest at a rate of 50% per year of service.
The Dynegy Inc. Retirement Plan provides a monthly benefit at retirement. The amount of the retirement benefit is based, in part, on amounts contributed by the Company to each participant’s retirement account. The contribution rate is equal to 6% of a participant’s salary (with such salary capped at $265,000 for plan purposes for 2017).
Our Named Executive Officers are all fully vested in the 401(k) and Retirement Plans and do not participate in any supplemental executive retirement plans.
Executive Perquisites
For 2017, each Named Executive Officer is eligible to receive an annual reimbursement for reasonable costs incurred for individual tax and financial planning advice up to $10,000. The total value of perquisites for each of our Named Executive Officers represents less than 1% of their total compensation in 2017. On an annual basis, the Compensation Committee reviews executive perquisites.
Executive Agreements
Mr. Flexon was the sole Named Executive Officer who had an employment agreement with the Company which was amended to extend an additional term. The remaining Named Executive Officers were covered under Executive Participation Agreements, which replaced these executive officers’ employment agreements. These agreements provided a specific level of participation under our executive Severance and Change in Control Plans, which cannot be modified without consent from each individual Named Executive Officer.
Severance and Change in Control
We maintain a Severance Pay Plan under which specified payments and benefits would be provided to the Named Executive Officers in connection with a change in control. The Severance Pay Plan provides for payment of certain severance benefits in the event of a termination. The change in control severance benefits for our Named Executive Officers include a “double trigger” provision required to receive any severance payment. We believe these arrangements are important competitive benefits that assist in the attraction and retention of critical talent. Please read “Executive Compensation—Potential Payments Upon Termination or Change in Control” for further details on our Severance Pay Plan.
28
Table of Contents
GOVERNANCE OF OUR EXECUTIVE COMPENSATION PRACTICES
Role of Compensation Committee
The Compensation Committee has overall responsibility for reviewing and approving the principal terms of any employment, change of control, severance, or other like agreement between the Company and its executive officers. The Compensation Committee established the overall compensation strategy and reviews such strategy at least annually for alignment with our business strategy and with similar programs offered by our competitors to ensure compensation arrangements are designed to provide incentives that are consistent with our stakeholders of the Company but do not encourage senior executives to take excessive risks that threaten the value of the Company.
Role of Compensation Consultant
As set forth in its charter, the Compensation Committee has the authority to retain or obtain the advice of a compensation consultant, and shall be directly responsible for the appointment, compensation and oversight of the work of the consultant. Since 2012, the Compensation Committee has retained Meridian as its independent advisor. Meridian is an independent compensation consulting firm and does not provide any other services to the Company outside of matters pertaining to executive and director compensation and related corporate governance matters. Meridian reports directly to the Compensation Committee, which is the sole party responsible for determining the scope of services performed by Meridian, the directions given to Meridian regarding the performance of those services, and the approval of the payment of invoices for those services. The Compensation Committee utilized Meridian in 2017 to provide information, analyses, and advice regarding executive compensation matters.
The Compensation Committee determined that the services provided by Meridian to the Compensation Committee during 2017 did not give rise to any conflicts of interest. The Compensation Committee made this determination by assessing the independence of Meridian under the applicable rules adopted by the SEC and incorporated into the NYSE Corporate Governance Listing Standards. In making this assessment, the Compensation Committee also considered Meridian’s written correspondence to the Compensation Committee that affirmed the independence of Meridian and the partners, consultants and employees who provide services to the Compensation Committee on executive and director compensation matters.
Stock Ownership Guidelines
We have established Stock Ownership Guidelines for officers to provide further alignment of interests among our executive officers and our stockholders. These guidelines are mandatory for all members of the executive management team and other officers. Executives are required to achieve ownership levels within five years of hire or appointment. For those executives in place at bankruptcy emergence on October 1, 2012, the five year ramp up period was reset to the emergence date. Individuals holding the following titles are included in this group: Chief Executive Officer and President, Executive Vice President, Senior Vice President and Vice President. The shares counted for purposes of the stock ownership guidelines include shares owned outright, unvested restricted shares, vested stock options (in-the-money), and other share-based equivalents that may be used by Dynegy from time to time. All officers, including our Named Executive officers are restricted from divesting any securities until their ownership multiples are attained, except to make a required tax payment, and must maintain their ownership level after any such transaction. The table below sets forth the ownership levels set for our Named Executive Officers, expressed as a multiple of annual base salary.
| Named Executive Officer | Stock Ownership Multiple (Multiple of Annual Base Salary) |
|||
| Robert Flexon |
5x | |||
| Clint Freeland |
3x | |||
| Carolyn Burke |
3x | |||
| Catherine James |
3x | |||
| Henry Jones |
3x |
29
Table of Contents
Risk Assessment
The Compensation Committee annually conducts an incentive risk assessment to ensure the structure and design of our Compensation programs are not reasonably likely to result in excessive risk taking that could have a material adverse impact on the company.
Potential Impact of Restatements and Ability to Claw Back Compensation Awards
The Compensation Committee has a mechanism to address any restatements, if they occur, that may impact our key financial metrics and our financial performance. The Compensation Committee will take action, as it determines to be appropriate, with respect to STI awards or other incentive or equity compensation awards to the extent such specified performance targets were not achieved in light of a restatement, which could include seeking to recover amounts paid. We believe this mechanism allows for remedial action to be taken if executive compensation is awarded for achievement of financial performance that is later determined not to have been achieved and further aligns our Named Executive Officers’ interests with those of our stockholders.
Tax and Accounting Considerations
Section 162(m) of the Internal Revenue Code imposes a $1 million limit on the amount that a publicly-traded corporation may deduct for compensation paid to the Chief Executive Officer or one of the company’s other three most highly compensated executives (other than the Chief Financial Officer) who is employed on the last day of the year. “Performance-based compensation,” as defined under Internal Revenue Service rules and regulations, was excluded from this $1 million limitation. Our compensation programs are structured to support organizational goals and priorities and shareholder interests. In making compensation decisions for 2017, the Compensation Committee considered the implications of Section 162(m) of the Internal Revenue Code.
The Tax Reform and Jobs Act of 2017 (the “Act”) eliminated the ability of companies to rely on the “performance-based“ compensation exception under Section 162(m) and the $1 million limitation on deductibility generally was expanded to include all named executive officers (including the principal financial officer). As a result, beginning in 2018, we will longer be able to take a deduction for any compensation paid to our named executive officers in excess of $1 million unless the compensation originally qualified for the “performance-based” compensation exception and qualifies for transition relief applicable to certain arrangements in place on November 2, 2017. Despite the Compensation Committee’s efforts to structure the executive compensation in a manner intended to be exempt from Section 162(m) and therefore not subject to its deduction limits, because of ambiguities and uncertainties as to the application and interpretation of Section 162(m) and the regulations issued thereunder as amended by the Act, including the uncertain scope of the transition relief under the Act, no assurance can be given that compensation intended to satisfy the requirements for exemption from Section 162(m) in fact will. Further, the Compensation Committee reserves the right to modify compensation that was initially intended to be exempt from Section 162(m) if it determines that such modifications are consistent with Dynegy’s business needs.
In general, our philosophy is to seek to preserve the tax deductibility of executive compensation only to the extent practicable and consistent with the overall compensation objectives discussed above. We do not make compensation determinations based on the accounting treatment of any particular type of award.
30
Table of Contents
CEO PAY RATIO
We identified the median employee by examining 2017 W-2 wages obtained from internal payroll records for all employees, excluding our CEO, who were employed by us on October 31, 2017. We included all employees, whether employed on a full-time or part-time basis. As of October 31, 2017 we analyzed 2,522 employees. We did not make any assumptions, adjustments, or estimates with respect to the W-2 wages, and we did not annualize the compensation for any employees that were not employed by us for all of 2017. We believe the use of W-2 wages is the most appropriate compensation measure since it reflects actual wages.
After identifying the median employee based on W-2 wages, we calculated annual 2017 compensation for the median employee using the same methodology used to calculate the chief executive officer’s total compensation as reflected in the Summary Compensation Table below. The median employee’s annual 2017 compensation was as follows:
| Name | Year | Salary | Bonus | Stock Awards |
Non-Equity Incentive Plan Compensation |
Change in Pension Value and Nonqualified Deferred Compensation Earnings |
All Other Compensation |
Total | ||||||||||||||||||||||||
| Median Employee |
2017 | $115,258 | $— | $5,205 | $9,405 | $5,894 | $10,437 | $146,199 | ||||||||||||||||||||||||
The annual total compensation of our Chief Executive Officer, as reported in the Summary Compensation Table below, was $8,569,751.
Our 2017 ratio of Chief Executive Officer total compensation to the median employee’s total compensation is reasonably estimated to be 58.62:1.
COMPENSATION AND HUMAN RESOURCES COMMITTEE REPORT
Our executive compensation program is administered and reviewed by the Compensation Committee, which consists of Messrs. Barbas (Chairman), Kuersteiner and Stein, all of whom are independent directors as such term is defined in the NYSE and SEC Rules. The Compensation Committee has reviewed and discussed the Compensation Discussion and Analysis required by Item 402(b) of Regulation S-K with management and, based on such review and discussion, the Compensation Committee recommended to the Board that the Compensation Discussion and Analysis be included in this Amendment No. 1 to the Company’s Annual Report on Form 10-K.
This report is submitted by the members of the Compensation Committee of the Board [as of April 8, 2018]:
Paul M. Barbas, Chairman
Richard L. Kuersteiner
Jeffrey S. Stein
COMPENSATION AND HUMAN RESOURCES COMMITTEE
INTERLOCKS AND INSIDER PARTICIPATION
Messrs. Barbas, Kuersteiner and Stein served on the Compensation Committee during fiscal 2017. None of these members is a current or former officer or employee of Dynegy or any of its subsidiaries, is involved in any relationship requiring disclosure as an interlocking executive officer or director, or had any relationship requiring disclosure under Item 404 of Regulation S-K.
31
Table of Contents
EXECUTIVE COMPENSATION
SUMMARY COMPENSATION TABLE FOR 2015, 2016 AND 2017
The following table sets forth certain information regarding the compensation earned by or awarded to our Named Executive Officers for 2015, 2016 and 2017 (with information only for the years during which each individual was named a Named Executive Officer):
| Name and Principal Position |
Year | Salary(1) | Bonus(2) | Stock Awards(3) |
Option Awards(3) |
Non-Equity Incentive Plan Comp.(4) |
Change in Pension Value and Nonqualified Deferred Compensation Earnings(5) |
All Other Comp.(6) |
Total | |||||||||||||||||||||||||||
| Robert Flexon |
2015 | $1,080,769 | $— | $8,716,574 | $1,172,504 | $1,028,500 | $19,239 | $39,449 | $12,057,035 | |||||||||||||||||||||||||||
| President & |
2016 | $1,180,769 | $— | $4,357,798 | $1,362,500 | $1,357,884 | $19,671 | $40,204 | $8,318,826 | |||||||||||||||||||||||||||
| Chief Executive Officer |
2017 | $1,232,308 | $51,913 | $4,367,621 | $1,308,001 | $1,548,087 | $20,053 | $41,768 | $8,569,751 | |||||||||||||||||||||||||||
| Clint Freeland |
2015 | $560,385 | $— | $871,700 | $275,001 | $336,021 | $17,874 | $31,739 | $2,092,720 | |||||||||||||||||||||||||||
| Executive Vice President & |
2016 | $583,731 | $— | $821,395 | $256,816 | $400,000 | $18,176 | $31,615 | $2,111,733 | |||||||||||||||||||||||||||
| Chief Financial Officer |
2017 | $599,115 | $23,416 | $751,313 | $225,000 | $451,584 | $18,418 | $32,173 | $2,101,020 | |||||||||||||||||||||||||||
| Carolyn Burke |
2015 | $512,115 | $— | $713,201 | $225,003 | $326,378 | $17,728 | $33,565 | $1,827,990 | |||||||||||||||||||||||||||
| Executive Vice President, |
2016 | $527,115 | $— | $741,628 | $231,877 | $370,000 | $18,040 | $33,548 | $1,922,208 | |||||||||||||||||||||||||||
| Strategic Development |
2017 | $543,731 | $65,162 | $709,581 | $212,501 | $409,838 | $18,308 | $35,233 | $1,994,354 | |||||||||||||||||||||||||||
| Catherine James |
2015 | $507,115 | $— | $713,201 | $225,003 | $304,079 | $17,658 | $36,106 | $1,803,162 | |||||||||||||||||||||||||||
| Executive Vice President, |
2016 | $522,115 | $— | $734,630 | $229,692 | $365,000 | $17,976 | $36,308 | $1,905,721 | |||||||||||||||||||||||||||
| General Counsel |
2017 | $538,731 | $23,931 | $709,581 | $212,501 | $406,069 | $18,255 | $37,252 | $1,946,320 | |||||||||||||||||||||||||||
| Henry Jones |
2015 | $507,115 | $— | $713,201 | $225,003 | $323,191 | $16,907 | $33,795 | $1,819,212 | |||||||||||||||||||||||||||
| Executive Vice President & |
2016 | $523,812 | $— | $842,943 | $263,550 | $360,000 | $17,284 | $34,349 | $2,041,938 | |||||||||||||||||||||||||||
| Chief Commercial Officer |
2017 | $553,673 | $2,669 | $751,313 | $225,000 | $417,331 | $17,690 | $34,549 | $2,002,226 | |||||||||||||||||||||||||||
| (1) | Amounts include salary earned for a full 12 months. Actual salary earned in any calendar year may vary from the annual base salary due to timing of pay cycles and time of service. |
| (2) | Represents additional discretionary amounts paid to the Named Executive Officers above amounts actually earned pursuant to the STI Plan. |
| (3) | The amounts shown under “Stock Awards” for 2015, 2016 and 2017 reflect the aggregate grant date fair value for RSUs and PSUs (using the Monte Carlo valuation model) calculated in accordance with FASB ASC Topic 718. The amounts shown under “Option/SAR Awards” for 2015, 2016 and 2017 reflect the aggregate grant date fair value for options (using the Black Scholes valuation model) calculated in accordance with FASB ASC Topic 718. Please read the discussion of the assumptions used in such valuation in Notes 15 and 17 of the Notes to Consolidated Financial Statements in our Original Form 10-K. |
| For 2015, RSUs and stock options have a three-year ratable vesting schedule, with 1/3 of each award vesting each year beginning on March 3, 2016. For 2016, RSUs and stock options have a three-year ratable vesting schedule, with 1/3 of each award vesting each year beginning on March 8, 2017. For 2017, RSUs and stock options have a three-year ratable vesting schedule, with 1/3 of each award vesting each year beginning on March 1, 2018. The PSUs for 2015, 2016 and 2017 require performance goals to be attained over a three-year period following the granting of the opportunity for any actual award to be earned. For the grant date fair value of the PSUs, the value reported in the table is based on the probable outcome of the performance conditions as of the grant date using the Monte Carlo valuation model. Based on the share price at grant and assuming the maximum market and financial performance conditions are achieved, the maximum value of the PSUs granted in fiscal year 2015, payable following completion of the 2015-2017 performance period are: Mr. Flexon $3,752,038, Mr. Freeland $880,015, Ms. Burke $720,008, Ms. James $720,008 and Mr. Jones $720,008. The performance criteria for the 2015 PSUs were not met resulting in no payment, thereby reducing the total value realization of the 2015 PSUs. For fiscal year 2016, payable following completion of the 2016-2018 performance period are: Mr. Flexon $4,360,021, Mr. Freeland $821,811, Ms. Burke $742,008, Ms. James $735,002 and Mr. Jones $843,380. For fiscal year 2017, payable following completion of the 2017-2019 performance period are: Mr. Flexon $4,185,605, Mr. Freeland $720,004, Ms. Burke $680,016, Ms. James $680,016 and Mr. Jones $720,004. Please read “Compensation Discussion and Analysis—Executive Compensation Program Overview—Reported and Realizable Pay” above for further discussion of value realization of LTI awards. |
| Please also read “Compensation Discussion and Analysis—2017 Compensation—Long-term Incentive Awards” for a breakdown of the 2017 LTI award grant date values for RSUs, stock options and PSUs for each Named Executive Officer. |
| (4) | The amounts shown under “Non-Equity Incentive Plan Compensation” for 2015, 2016 and 2017 reflect cash bonuses awarded under the STI Plan. The 2015 incentive payments were earned in 2015 and paid in March 2016, the 2016 incentive payments were earned in 2016 and paid in March 2017 and the 2017 incentive payments were earned in 2017 and were partially paid in December 2017 and March 2018. To mitigate the potential impact of Section 280G with respect to the pending Merger on Dynegy and the named executive officers, on December 19, 2017, the Board approved payment during 2017 of 75% of the annual bonus that it expected it would have otherwise paid to each respective named executive officer in early 2018. |
32
Table of Contents
| (5) | The amounts shown for the Named Executive Officers reflect changes in pension value under the Retirement Plan and the Dynegy Inc. Restoration Pension Plan, as amended, or the Restoration Pension Plan. |
| (6) | The amounts shown as “All Other Compensation” for 2015, 2016 and 2017 are identified in the following table: |
| Name | Year | Perquisites and Other Personal Benefits ($)(1) |
Tax Reimbursements ($) |
401(k) Plan Contributions |
Restoration 401(k) Savings Plan Contributions |
Portable Retirement Plan Contributions |
Restoration Pension Plan Contributions |
Life Insurance Premiums |
Total | |||||||||||||||||||||||||||
| Robert Flexon |
2015 | $— | $— | $13,250 | $— | $15,900 | $— | $10,299 | $39,449 | |||||||||||||||||||||||||||
| 2016 | $— | $— | $13,250 | $— | $15,900 | $— | $11,054 | $40,204 | ||||||||||||||||||||||||||||
| 2017 | $— | $— | $13,500 | $— | $16,200 | $— | $12,068 | $41,768 | ||||||||||||||||||||||||||||
| Clint Freeland |
2015 | $— | $— | $9,385 | $— | $15,900 | $— | $6,454 | $31,739 | |||||||||||||||||||||||||||
| 2016 | $— | $— | $9,133 | $— | $15,900 | $— | $6,582 | $31,615 | ||||||||||||||||||||||||||||
| 2017 | $— | $— | $9,117 | $— | $16,200 | $— | $6,856 | $32,173 | ||||||||||||||||||||||||||||
| Carolyn Burke |
2015 | $— | $— | $11,550 | $— | $15,900 | $— | $6,115 | $33,565 | |||||||||||||||||||||||||||
| 2016 | $— | $— | $11,360 | $— | $15,900 | $— | $6,288 | $33,548 | ||||||||||||||||||||||||||||
| 2017 | $— | $— | $11,408 | $— | $16,200 | $— | $7,625 | $35,233 | ||||||||||||||||||||||||||||
| Catherine James |
2015 | $— | $— | $13,250 | $— | $15,900 | $— | $6,956 | $36,106 | |||||||||||||||||||||||||||
| 2016 | $— | $— | $13,250 | $— | $15,900 | $— | $7,158 | $36,308 | ||||||||||||||||||||||||||||
| 2017 | $— | $— | $13,500 | $— | $16,200 | $— | $7,552 | $37,252 | ||||||||||||||||||||||||||||
| Henry Jones |
2015 | $— | $— | $8,683 | $— | $15,900 | $— | $9,212 | $33,795 | |||||||||||||||||||||||||||
| 2016 | $— | $— | $8,958 | $— | $15,900 | $— | $9,491 | $34,349 | ||||||||||||||||||||||||||||
| 2017 | $— | $— | $8,299 | $— | $16,200 | $— | $10,050 | $35,549 | ||||||||||||||||||||||||||||
| (1) | For 2015, 2016 and 2017, the Named Executive Officers did not receive perquisites that exceeded the $10,000 threshold for reporting purposes. |
GRANTS OF PLAN-BASED AWARDS IN 2017
The following table sets forth certain information with respect to each grant of an award made to the Named Executive Officers in 2017 under the 2012 Long Term Incentive Plan:
| Estimated Possible Payments Under Non-Equity Incentive Plan Awards(1) |
Estimated Future Payouts Under Equity Incentive Plan Awards(2) |
All Other Stock Awards: Number of Shares of |
All Other Option/SAR Awards: Number of Securities Underlying |
Exercise or Base Price of Option/ |
Grant Date Fair Value of Stock and |
|||||||||||||||||||||||||||||||||||||||
| Name | Grant Date |
Threshold | Target | Maximum | Threshold | Target | Maximum | Stock or Units(3) |
Options/ SARs(4) |
SAR Awards |
Option/SAR Awards(5) |
|||||||||||||||||||||||||||||||||
| Robert Flexon |
3/1/17 | $— | $1,550,000 | $— | 130,474 | 260,948 | 521,896 | 228,330 | 352,561 | $8.02 | $5,675,622 | |||||||||||||||||||||||||||||||||
| Clint Freeland |
3/1/17 | $— | $451,500 | $— | 22,444 | 44,888 | 89,776 | 39,277 | 60,647 | $8.02 | $976,313 | |||||||||||||||||||||||||||||||||
| Carolyn Burke |
3/1/17 | $— | $410,250 | $— | 21,198 | 42,395 | 84,790 | 37,095 | 57,278 | $8.02 | $922,083 | |||||||||||||||||||||||||||||||||
| Catherine James |
3/1/17 | $— | $406,500 | $— | 21,198 | 42,395 | 84,790 | 37,095 | 57,278 | $8.02 | $922,083 | |||||||||||||||||||||||||||||||||
| Henry Jones |
3/1/17 | $— | $420,000 | $— | 22,444 | 44,888 | 89,776 | 39,277 | 60,647 | $8.02 | $976,313 | |||||||||||||||||||||||||||||||||
| (1) | The amounts shown represent the awards that could be earned by the Named Executive Officers under the STI Plan for 2017. Mr. Flexon’s target is set at 125% of base salary and target is set at 75% of base salary for Messrs. Freeland and Jones and Mses. Burke and James. The actual payouts to eligible executives under the STI Plan were determined in February 2018 and are shown in the Summary Compensation Table under “Non-Equity Incentive Plan Compensation.” |
| (2) | In March 2017, PSUs were granted under the Dynegy Inc. Amended and Restated 2012 Long Term Incentive Plan, or 2012 Long Term Incentive Plan. The PSUs require performance goals to be attained over a three-year period, subject to certain exceptions, upon the granting of the opportunity for any actual award to be earned. For the grant date fair value of the PSUs, the value reported in the table is based on the probable outcome of the performance conditions as of the grant date, March 1, 2017, using the Monte Carlo valuation model. |
| (3) | The amounts shown under “All Other Stock Awards” for the Named Executive Officers reflect awards in the form of RSUs granted under the 2012 Long Term Incentive Plan. Each RSU represents a contingent right to receive one share of common stock. The RSUs granted on March 1, 2017 have a three-year ratable vesting schedule, subject to certain exceptions, with 1/3 of each award vesting each year beginning on March 1, 2018. |
| (4) | The amounts shown under “All Other Option/SAR Awards” reflect the number of shares of common stock underlying stock option awards granted to the Named Executive Officers under the 2012 Long Term Incentive Plan. The stock options have a three-year ratable vesting schedule, subject to certain exceptions, with 1/3 of each award vesting each year beginning on March 1, 2018. |
33
Table of Contents
| (5) | The amounts shown under “Grant Date Fair Value of Stock and Option Awards” reflect the grant date fair value for the RSUs, PSUs (using the Monte Carlo valuation model) and stock options (using the Black Scholes valuation model) computed in accordance with FASB ASC Topic 718. Please read the discussion of the assumptions used in such valuation in Notes 15 and 17 of the Notes to Consolidated Financial Statements in our Original Form 10-K. |
34
Table of Contents
OUTSTANDING EQUITY AWARDS AT 2017 FISCAL YEAR-END
Upon our emergence from bankruptcy in 2012 and pursuant to the plan of reorganization, all outstanding equity awards of the Company as of the effective date were cancelled. The following table sets forth certain information regarding unexercised option awards and unvested stock awards granted to each Named Executive Officer following emergence from bankruptcy that were outstanding as of December 31, 2017. The table does not include information regarding equity based awards related to 2017 performance that were or may be granted to the Named Executive Officers in 2018. The vesting schedules for each type of award are described in the footnotes to the table, and the vesting date for each award can be determined by referring to the grant date for each award in the table.
| Option/SAR Awards | Stock Awards | |||||||||||||||||||||||||||||||||||
| Name | Grant Date |
Number of Securities Underlying Unexercised Options/SARs Exercisable(1) |
Number of Securities Underlying Unexercised Options/SARs Unexercisable(1) |
Option/ SAR Exercise Price |
Option/ SAR Expiration Date |
Number of Shares or Units of Stock That Have Not Vested(2) |
Market Value of Shares or Units of Stock That Have Not Vested(3) |
Equity Incentive Plan Awards: Number of Unearned Shares, Units or Other Rights That Have Not Vested(4) |
Equity Incentive Plan Awards: Market or Payout Value of Unearned Shares, Units or Other Rights That Have Not Vested(3) |
|||||||||||||||||||||||||||
| Robert Flexon |
10/29/12 | 273,059 | — | $18.70 | 10/29/2022 | — | $— | — | $— | |||||||||||||||||||||||||||
| 3/18/13 | 101,352 | — | $23.10 | 3/18/2023 | — | $— | — | $— | ||||||||||||||||||||||||||||
| 3/3/14 | 139,594 | — | $23.03 | 3/3/2024 | — | $— | — | $— | ||||||||||||||||||||||||||||
| 3/3/15 | 99,323 | 49,661 | $27.24 | 3/3/2025 | — | $— | — | $— | ||||||||||||||||||||||||||||
| 5/11/15 | — | — | — | — | — | $— | — | $— | ||||||||||||||||||||||||||||
| 3/8/16 | 103,929 | 207,856 | $11.05 | 3/8/2026 | 115,083 | $1,363,734 | 197,286 | $2,337,839 | ||||||||||||||||||||||||||||
| 3/1/17 | — | 352,561 | $8.02 | 3/1/2027 | 228,330 | $2,705,711 | 456,659 | $5,411,409 | ||||||||||||||||||||||||||||
| Clint Freeland |
10/29/12 | 70,215 | — | $18.70 | 10/29/2022 | — | $— | — | $— | |||||||||||||||||||||||||||
| 3/18/13 | 33,784 | — | $23.10 | 3/18/2023 | — | $— | — | $— | ||||||||||||||||||||||||||||
| 3/3/14 | 34,899 | — | $23.03 | 3/3/2024 | — | $— | — | $— | ||||||||||||||||||||||||||||
| 3/3/15 | 23,296 | 11,647 | $27.24 | 3/3/2025 | 4,711 | $55,825 | — | $— | ||||||||||||||||||||||||||||
| 3/8/16 | 19,590 | 39,178 | $11.05 | 3/8/2026 | 21,692 | $257,050 | 37,186 | $440,654 | ||||||||||||||||||||||||||||
| 3/1/17 | — | 60,647 | $8.02 | 3/1/2027 | 39,277 | $465,432 | 78,554 | $1,629,014 | ||||||||||||||||||||||||||||
| Carolyn Burke |
10/29/12 | 70,215 | — | $18.70 | 10/29/2022 | — | $— | — | $— | |||||||||||||||||||||||||||
| 3/18/13 | 25,338 | — | $23.10 | 3/18/2023 | — | $— | — | $— | ||||||||||||||||||||||||||||
| 3/3/14 | 33,841 | — | $23.03 | 3/3/2024 | — | $— | — | $— | ||||||||||||||||||||||||||||
| 3/3/15 | 19,060 | 9,530 | $27.24 | 3/3/2025 | 3,854 | $45,670 | — | $— | ||||||||||||||||||||||||||||
| 3/8/16 | 17,687 | 35,374 | $11.05 | 3/8/2026 | 19,585 | $232,082 | 33,575 | $397,864 | ||||||||||||||||||||||||||||
| 3/1/17 | — | 57,278 | $8.02 | 3/1/2027 | 37,095 | $439,576 | 74.191 | $879,166 | ||||||||||||||||||||||||||||
| Catherine James |
10/29/12 | 70,215 | — | $18.70 | 10/29/2022 | — | $— | — | $— | |||||||||||||||||||||||||||
| 3/18/13 | 27,028 | — | $23.10 | 3/18/2023 | — | $— | — | $— | ||||||||||||||||||||||||||||
| 3/3/14 | 33,841 | — | $23.03 | 3/3/2024 | — | $— | — | $— | ||||||||||||||||||||||||||||
| 3/3/15 | 19,060 | 9,530 | $27.24 | 3/3/2025 | 3,854 | $45,670 | — | $— | ||||||||||||||||||||||||||||
| 3/8/16 | 17,521 | 35,040 | $11.05 | 3/8/2026 | 19,401 | $229,902 | 33,258 | $394,107 | ||||||||||||||||||||||||||||
| 3/1/17 | — | 57,278 | $8.02 | 3/1/2027 | 37,095 | $439,576 | 74,191 | $879,166 | ||||||||||||||||||||||||||||
| Henry Jones |
4/1/13 | 71,277 | — | $24.12 | 4/1/2023 | — | $— | — | $— | |||||||||||||||||||||||||||
| 3/3/14 | 33,841 | — | $23.03 | 3/3/2024 | — | $— | — | $— | ||||||||||||||||||||||||||||
| 3/3/15 | 19,060 | 9,530 | $27.24 | 3/3/2025 | — | $— | — | $— | ||||||||||||||||||||||||||||
| 3/8/16 | 20,103 | 40,206 | $11.05 | 3/8/2026 | 22,261 | $263,793 | 38,162 | $452,220 | ||||||||||||||||||||||||||||
| 3/1/17 | — | 60,647 | $8.02 | 3/1/2027 | 39,277 | $465,432 | 78,554 | $930,865 | ||||||||||||||||||||||||||||
| (1) | Stock options have a three-year ratable vesting schedule, subject to certain exceptions, with 1/3 of each award vesting each year. |
| (2) | RSUs have a three-year ratable vesting schedule, subject to certain exceptions, with 1/3 of each award vesting each year. On December 19, 2017, the Board approved the acceleration of vesting of restricted stock units granted to Messrs. Flexon and Jones in 2015 that were otherwise scheduled to vest on March 3, 2018 and April 20, 2018 for Mr. Flexon and March 3, 2018 for Mr. Jones. The Board approved the accelerated vesting of such grants, and the related withholding of shares to pay taxes, in order to mitigate potential adverse tax consequences of Section 280G of the Internal Revenue Code in connection with the pending Merger. |
35
Table of Contents
| (3) | The market value of the RSUs and PSUs (at “target” level) is based on the closing market price of our common stock on December 29, 2017 of $11.85. The performance criteria for the 2015 PSUs were not met resulting in no payment, thereby reducing the total value realization of the 2015 PSUs. Please read “Compensation Discussion and Analysis—Executive Compensation Program Overview—Reported and Realizable Pay” above for further discussion of value realization of LTI awards. |
| (4) | The PSUs require performance goals to be attained over a three-year period, subject to certain exceptions, upon the granting of the opportunity for any actual award to be earned. The PSUs are payable, if performance criteria are met, in common stock. |
36
Table of Contents
OPTION EXERCISES AND STOCK VESTED IN 2017
The following table sets forth certain information regarding the exercise of options and the vesting of stock awards by each Named Executive Officer during 2017:
| Name | Option Awards | Stock Awards | ||||||||||||||
| Number of Shares Acquired on Exercise (#) |
Value Realized on Exercise ($) |
Number of Shares Acquired on Vesting(1) (#) |
Value Realized on Vesting ($) |
|||||||||||||
| Robert Flexon (2) |
— | $— | 270,384 | $2,755,137 | ||||||||||||
| Clint Freeland |
— | $— | 20,333 | $161,294 | ||||||||||||
| Carolyn Burke |
— | $— | 18,279 | $144,972 | ||||||||||||
| Catherine James |
— | $— | 18,186 | $144,263 | ||||||||||||
|
Henry Jones (2) |
— | $— | 23,470 | $199,365 | ||||||||||||
| (1) | Number of shares acquired are pre-tax and do not account for shares withheld to pay taxes. |
| (2) | On December 19, 2017, the Board approved the acceleration of vesting of restricted stock units granted to Messrs. Flexon and Jones in 2015 that were otherwise scheduled to vest on March 3, 2018 and April 20, 2018 for Mr. Flexon and March 3, 2018 for Mr. Jones. The Board approved the accelerated vesting of such grants, and the related withholding of shares to pay taxes, in order to mitigate potential adverse tax consequences of Section 280G of the Internal Revenue Code in connection with the pending Merger. |
PENSION BENEFITS
The following table sets forth certain information with respect to the Retirement Plan and Restoration Pension Plan, except as otherwise noted, as they provide for payment at, following, or in connection with retirement for the Named Executive Officers as of December 31, 2017:
| Name | Plan Name | Number of Years Credited Service(1) |
Present Value of Accumulated Benefit |
Payments During Last Fiscal Year |
||||||||||
| Robert Flexon |
Retirement Plan | 6.5 | $ | 118,359 | — | |||||||||
| Restoration Pension Plan | $ | 16,736 | — | |||||||||||
| Clint Freeland |
Retirement Plan | 6.5 | $ | 116,171 | — | |||||||||
| Restoration Pension Plan | $ | — | — | |||||||||||
| Carolyn Burke |
Retirement Plan | 6.3 | $ | 111,187 | — | |||||||||
| Restoration Pension Plan | $ | — | — | |||||||||||
| Catherine James |
Retirement Plan | 6.3 | $ | 108,820 | — | |||||||||
| Restoration Pension Plan | $ | — | — | |||||||||||
| Henry Jones |
Retirement Plan | 4.8 | $ | 83,357 | — | |||||||||
| Restoration Pension Plan | $ | — | — | |||||||||||
| (1) | Dynegy’s allocations to the Retirement Plan for the PRB component of that plan vest at a rate of 33%, 67% and 100% after completion of each year of service over three years. Our allocations to the Restoration Pension Plan vested at the same rate as under the PRB component of the Retirement Plan. Effective January 1, 2012, participation in the Restoration Pension Plan was frozen, and benefit accruals were suspended. |
Our Named Executive Officers are eligible for qualified pension benefits under the Retirement Plan. The pension benefit is based on the PRB portion of the Retirement Plan, which provides a defined benefit that grows each year at a variable rate (30-year Treasury rate). This benefit, which was introduced in 2001, provides an annual contribution of 6% of each eligible employee’s salary, including each Named Executive Officer’s salary, capped at $270,000 for 2017. Our Named Executive Officers were eligible in 2011 to participate in the Restoration Pension Plan, which is an unfunded, nonqualified plan designed to provide an allocation or benefit to certain employees that are highly compensated and whose company pension contributions are limited under certain Internal Revenue Service, or IRS, requirements for qualified plans. Under the Restoration Pension Plan the allocations or benefits were intended to supplement or make up for what affected employees would have received under the Retirement Plan but for the IRS limitations. The participation in the Restoration Pension plan was frozen, effective for periods on and after January 1, 2012, and benefit accruals have also been suspended.
37
Table of Contents
The present values of accumulated benefits payable to each of the Named Executive Officers under the Retirement Plan and Restoration Pension Plan were determined using assumptions consistent with those used in Note 17 of the Notes to Consolidated Financial Statements in our Original Form 10-K.
POTENTIAL PAYMENTS UPON TERMINATION OR CHANGE IN CONTROL
We have entered into certain agreements and maintain certain plans, as described below, which require us to provide specified payments and benefits to our Named Executive Officers as a result of severance eligible events, a change in control, retirement, death, and disability.
In connection with the Merger, certain executive officers of Dynegy (including its current named executive officers) may become entitled to payments and benefits that may be treated as “excess parachute payments” within the meaning of Section 280G of the Internal Revenue Code of 1986, as amended (“Section 280G”). To mitigate the potential impact of Section 280G on Dynegy and the named executive officers, on December 19, 2017, Dynegy’s Board of Directors approved (i) payment during 2017 of 75% of the annual bonus that it presently expects would otherwise be paid to each respective named executive officer in early 2018 and (ii) the immediate vesting and settlement of 173,650 restricted stock units previously granted to Mr. Flexon and 3,854 restricted stock units previously granted to Mr. Jones. Those restricted stock units were granted in 2015 and were otherwise scheduled to vest, in the case of Mr. Flexon, on March 3, 2018 and April 20, 2018, and, in the case of Mr. Jones, on March 3, 2018.
Also, on December 19, 2017, Dynegy entered into an acknowledgment (the “Acknowledgment) with the named executive officers. Each named executive officer agreed to repay the accelerated annual bonus payment amounts to the extent it was subsequently determined that the right to payment would have been forfeited before payment otherwise would have been made in the ordinary course.
For information regarding the treatment of outstanding LTI awards in connection with the Merger, see “Compensation Discussion and Analysis—2017 Compensation—Effect of Merger on Outstanding LTI Awards”
Employment Agreement
Robert Flexon. Mr. Flexon’s employment agreement commenced on July 11, 2011 and on May 6, 2015 was amended and restated through April 30, 2018. Under the amended and restated agreement, Mr. Flexon’s base salary was initially set at $1,100,000, subject to review by the Board from time to time for increases. He participates in our STI Plan with a current target award of 125%, of his base salary subject to review by the Board from time to time for increases. In connection with execution of the amended and restated agreement, Mr. Flexon received a restricted stock unit award grant on May 11, 2015 with a grant date value of $5,000,000, which, as stated above, vested on December 19, 2017. On October 29, 2017, the board of directors of Dynegy approved and entered into an amendment to the Amended and Restated Employment Agreement. The amendment extended the term of Mr. Flexon’s employment agreement for an additional term, which shall commence on May 1, 2018 and conclude on April 30, 2019.
Furthermore, Mr. Flexon is eligible to receive additional annual award grants pursuant to our LTI programs and he participates in our other employee benefit plans and programs, including severance benefits described below. If Mr. Flexon is terminated for any reason as described in his employment agreement, we are obligated to pay or provide to Mr. Flexon (or his estate, if applicable) in a lump sum within 30 days following such termination, or at such other time prescribed by any applicable plan: (1) any base salary payable to him pursuant to the agreement, accrued up to and including the date on which Mr. Flexon’s employment terminates; (2) any employee benefits to which he is entitled upon termination of his employment in accordance with the terms and conditions of the applicable plans; (3) reimbursement for any unreimbursed business expenses incurred prior to his date of termination; and (4) payment for accrued but unused vacation time as of the date of his termination, in accordance with our policies.
In connection with the consummation of the Merger, Mr. Flexon received the amounts to which he was entitled pursuant to his employment agreement as described above.
38
Table of Contents
Participation Agreements
On October 28, 2015, the EVPs entered into Participation Agreements. Simultaneous with the commencement of the Participation Agreements all existing EVP employment agreements, including the Named Executive Officers’ agreements, were terminated. The Participation Agreements provide for guaranteed participation rights and protections in certain compensation and benefits plans, including our LTI programs and the Severance Pay Plan.
Voluntary Resignation and Termination for Cause
Except as otherwise described under “Severance Eligible Terminations” and “Change in Control,” our Named Executive Officers are not entitled to payments or benefits in connection with a voluntary resignation or termination for cause, other than payments for amounts due before such termination. Under our company policy applicable to all employees, a Named Executive Officer terminated under such circumstances would be entitled to vacation pay accrued up to the month of termination. A Named Executive Officer would be able to exercise any options vested before the date of termination upon termination for cause and for a 90-day period after the date of termination upon a voluntary resignation, or through the end of the option term, if less. Vested options that were not exercised before the date of termination, in the case of termination for cause, or before the end of the 90-day period, or end of the option term if less, in the case of voluntary resignation, unvested options, RSUs and PSUs would all be forfeited as a result of termination in accordance with the applicable award agreement.
39
Table of Contents
Severance Eligible Terminations
Any outstanding stock options, RSUs, phantom stock units, PSUs and other equity based awards previously granted to our executives will vest based upon the applicable LTI award agreement.
In addition, pursuant to our Severance Pay Plan, our executives are entitled to payment of severance benefits if their employment is terminated due to an involuntary termination without cause or upon a “good reason” termination. A good reason termination is defined as a voluntary resignation following a material reduction in the nature or scope of the executive’s authority or duties, a material diminution in the executive’s base salary or STI target, or a change in the location of the executive’s principal place of employment by 50 miles or more. Severance benefits for executives under the Severance Pay Plan, which are payable in a lump sum, include:
| • | for the Chief Executive Officer and Executive Vice President, 200% of compensation (defined as base salary plus target bonus); |
| • | for any Senior Vice President or Vice President, 100% of compensation (defined as base salary plus target bonus); |
| • | the executive shall be eligible to receive a pro-rata bonus payment (determined by actual performance of the Company), which shall be paid at the same time as STI payments are made if the executives termination occurs on or after July 1. In addition, the executive shall be eligible to receive any STI payment for the prior year that has not been paid as of the termination date; |
| • | continued participation in our group health care plan that provides medical and dental for 24 months for a Chief Executive Officer and Executive Vice President and 12 months for a Senior Vice President and Vice President, provided the executive continues to pay premiums at active employee rates, with such coverage ending immediately upon the executive obtaining new employment and eligibility for similar coverage; |
| • | benefits resulting from a change of control would be cut back if doing so would result in greater after-tax proceeds to an executive absent such cut back “Best Net provision”. Otherwise, the executive would receive payment of all change of control related benefits and would be responsible for paying any excise tax incurred under Internal Revenue Code section 280(G); and |
| • | outplacement assistance benefits, as determined by the plan administrator, for a period of time equal to the minimum number of months of base pay such executive is entitled to receive under the Executive Severance Pay Plan (but in any event not beyond the end of the second calendar year following the calendar year in which the executive terminated employment), with such benefits paid directly to the outplacement assistance provider and not to the executive in a lump sum. |
The foregoing benefits may be subject to the following material conditions or obligations:
| • | non-competition, non-disclosure, non-disparagement, and non-solicitation requirements; and |
| • | execution and performance of a release and waiver of liability agreement with respect to his or her employment and termination. |
Change in Control
In the event of a change in control or Corporate Change, the RSUs and option awards granted under the 2012 Long Term Incentive Plan require a double trigger, both the occurrence of a Corporate Change and an involuntary termination, to vest. For PSUs, upon a Corporate Change, the Named Executive Officers would be entitled to receive payment as prescribed by the award agreement regardless of whether the Named Executive Officer is terminated.
In addition, each of our executives is entitled to severance benefits if, no earlier than 60 days before and in connection with or within two years after a change in control, such executive is subject to an involuntary termination or termination for good reason, as defined in the Severance Pay Plan. A good reason termination is defined as a voluntary resignation following a material reduction in the nature or scope of the executive’s authority or duties, a material diminution in the executive’s base salary or STI target, or a change in the location of the executive’s principal place of employment by 50 miles or more.
40
Table of Contents
Change in control benefits under the Severance Pay Plan include:
| • | for the Chief Executive Officer, 299% of compensation (defined as base salary plus target bonus); |
| • | for any Executive Vice President, 250% of compensation (defined as base salary plus target bonus); |
| • | for any Senior Vice President or Vice President, 150% of compensation (defined as base salary plus target bonus); |
| • | the executive shall be eligible to receive a pro-rata bonus payment, which shall be paid at the same time as STI payments. In addition, the executive shall be eligible to receive any STI payment for the prior year that has not been paid as of the termination date; |
| • | continued participation in our group health care plan that provides medical and dental for 36 months for a Chief Executive Officer, 30 months for an Executive Vice President and 18 months for a Senior Vice President or Vice President, provided the executive continues to pay premiums at active employee rates, with such coverage ending immediately upon the executive obtaining new employment and eligibility for similar coverage; |
| • | benefits resulting from a change of control would be cut back if doing so would result in greater after-tax proceeds to an executive absent such cut back “Best Net provision”. Otherwise, the executive would receive payment of all change of control related benefits and would be responsible for paying any excise tax incurred under Internal Revenue Code section 280(G); and |
| • | outplacement assistance benefits at least equivalent to those that would have been provided to the Named Executive Officer before the change in control (but in any event not beyond the end of the second calendar year following the calendar year in which the executive terminated employment), with such benefits paid directly to the outplacement assistance provider and not to the executive in a lump sum. |
The foregoing benefits may be subject to the following material conditions or obligations:
| • | non-competition, non-disclosure, non-disparagement, and non-solicitation requirements; and |
| • | execution and performance of a release and waiver of liability agreement with respect to his or her employment and termination. |
Retirement
As of December 31, 2017, none of our Named Executive Officers have reached eligibility age for payments upon retirement.
Disability or Death
All of our employees may elect to participate in our disability policy, and any participating employee would be entitled to long-term disability benefits under such disability policy if he or she paid any required premiums. All of our Named Executive Officers have elected to participate in our disability policy. Under such policy, all employees at the level of Vice President or above are entitled to 12 months of the monthly base salary that is in effect on the date that the employee is determined to be disabled. Additionally, employees at the level of Vice President or above are also provided with additional basic life insurance coverage as supplemental life insurance equal to 12 months of monthly base salary.
Further, in the event of death, the medical, dental and vision benefits that we maintained for the deceased employee at the level of Vice President or above and his or her family would be maintained for 12 months after the date of death, provided that such employee’s covered dependents continue to pay the required premiums. Such employee’s Dynegy 401(k) Plan distributions and Retirement Plan benefits would generally be paid to his or her beneficiary. Health benefits in the event of disability vary depending on the type of disability.
In addition, each Named Executive Officer’s equity based awards would vest upon death or disability in accordance with the applicable LTI award agreement.
41
Table of Contents
Potential Payments and Benefits
The following tables describe the estimated potential payments we would have been required to make to our Named Executive Officers under the severance and change in control plans, as applicable, upon termination of their employment under various circumstances. The following assumptions and general principles apply with respect to these tables:
| • | The amounts shown assume the applicable termination event took place on December 29, 2017, the last business day of the year; accordingly, values associated with LTI awards made in March 2018 are not included; |
| • | The price per share used to calculate the value of the equity based payments is the closing price of our common stock on December 29, 2017 of $11.85; |
| • | The amounts shown as “Base salary” under the “Severance Eligible Termination” and “Change in Control” columns are the lump sum cash payments described above as compensation under “—Severance Eligible” and “—Change in Control,” respectively; |
| • | The amounts shown as “Short-term Incentive Bonus” under the “Severance Eligible Termination” and “Change in Control” columns are calculated based upon achieving target; however, actual results could differ based upon Company performance; |
| • | The amounts shown for “Medical, dental and vision benefits” under the “Severance eligible terminations” column assume that the applicable Named Executive Officer continued to participate in our group health care for the maximum period of time permitted for such Named Executive Officer under the Executive Severance Pay Plan; and |
| • | The amounts shown for “Accidental death & dismemberment insurance proceeds” under the “Disability” column represent the maximum payment available under the applicable accidental death and disability policy. The actual value could be lower depending on the type of disability. Under the “Death” column is the maximum payment if death occurred from an accident covered under the applicable accidental death and disability policy. |
|
Voluntary
|
Severance
|
Change
in
|
Disability
|
Death
|
||||||||||||||||
| Robert Flexon
|
||||||||||||||||||||
| Base salary |
$— | $5,580,000 | $8,342,100 | $1,240,000 | $— | |||||||||||||||
| Short-term incentive bonus |
— | 1,550,000 | 1,550,000 | — | — | |||||||||||||||
| Vested/accelerated stock options |
83,143 | 1,599,737 | 1,599,737 | 1,599,737 | 1,599,737 | |||||||||||||||
| Accelerated restricted stock units |
— | 4,069,444 | 4,069,444 | 4,069,444 | 4,069,444 | |||||||||||||||
| Accelerated performance units(3) |
— | 3,041,739 | 6,246,182 | 6,246,182 | 6,246,182 | |||||||||||||||
| Incremental non-qualified pension |
12,414 | 12,414 | 12,414 | 12,414 | 12,414 | |||||||||||||||
| Medical, dental and vision benefits |
— | 33,233 | 49,850 | — | 33,233 | |||||||||||||||
| Life insurance proceeds |
— | — | — | — | 2,480,000 | |||||||||||||||
| Accidental death & dismemberment insurance proceeds |
— | — | — | 2,480,000 | 2,480,000 | |||||||||||||||
| Out-placement services |
— | 20,000 | 20,000 | — | — | |||||||||||||||
| Total |
$95,557 | $15,906,567 | $21,889,727 | $15,647,777 | $16,921,010 | |||||||||||||||
42
Table of Contents
| Voluntary Resignation / For Cause Termination(1) |
Severance Eligible Termination(2) |
Change in Control(2) |
Disability | Death | ||||||||||||||||
| Clint Freeland
|
||||||||||||||||||||
| Base salary |
$— | $2,107,000 | $2,633,750 | $602,000 | $— | |||||||||||||||
| Short-term incentive bonus |
— | 451,500 | 451,500 | — | — | |||||||||||||||
| Vested/accelerated stock options |
15,672 | 279,292 | 279,292 | 279,292 | 279,292 | |||||||||||||||
| Accelerated restricted stock units |
— | 778,308 | 778,308 | 778,308 | 778,308 | |||||||||||||||
| Accelerated performance units(3) |
— | 594,613 | 1,163,990 | 1,163,990 | 1,163,990 | |||||||||||||||
| Incremental non-qualified pension |
— | — | — | — | — | |||||||||||||||
| Medical, dental and vision benefits |
— | 16,617 | 41,542 | — | 16,617 | |||||||||||||||
| Life insurance proceeds |
— | — | — | — | 1,204,000 | |||||||||||||||
| Accidental death & dismemberment insurance proceeds |
— | — | — | 1,204,000 | 1,204,000 | |||||||||||||||
| Out-placement services |
— | 20,000 | 20,000 | — | — | |||||||||||||||
| Total |
$15,672 | $4,247,330 | $5,368,382 | $4,027,590 | $4,646,207 | |||||||||||||||
| Carolyn Burke
|
||||||||||||||||||||
| Base salary |
$— | $1,914,500 | $2,393,125 | $547,000 | $— | |||||||||||||||
| Short-term incentive bonus |
— | 410,250 | 410,250 | — | — | |||||||||||||||
| Vested/accelerated stock options |
14,150 | 245,905 | 245,905 | 245,905 | 245,905 | |||||||||||||||
| Accelerated restricted stock units |
— | 717,328 | 717,328 | 717,328 | 717,328 | |||||||||||||||
| Accelerated performance units(3) |
— | 527,729 | 1,056,854 | 1,056,854 | 1,056,854 | |||||||||||||||
| Incremental non-qualified pension |
— | — | — | — | — | |||||||||||||||
| Medical, dental and vision benefits |
— | 5,687 | 14,216 | — | 5,687 | |||||||||||||||
| Life insurance proceeds |
— | — | — | — | 1,094,000 | |||||||||||||||
| Accidental death & dismemberment insurance proceeds |
— | — | — | 1,094,000 | 1,094,000 | |||||||||||||||
| Out-placement services |
— | 20,000 | 20,000 | — | — | |||||||||||||||
| Total |
$14,150 | $3,841,399 | $4,857,679 | $3,661,087 | $4,213,774 | |||||||||||||||
| Catherine James
|
||||||||||||||||||||
| Base salary |
$— | $1,897,000 | $2,371,250 | $542,000 | $— | |||||||||||||||
| Short-term incentive bonus |
— | 406,500 | 406,500 | — | — | |||||||||||||||
| Vested/accelerated stock options |
14,017 | 261,424 | 261,424 | 261,424 | 261,424 | |||||||||||||||
| Accelerated restricted stock units |
— | 715,148 | 715,148 | 715,148 | 715,148 | |||||||||||||||
| Accelerated performance units(3) |
— | 525,458 | 1,053,098 | 1,053,098 | 1,053,098 | |||||||||||||||
| Incremental non-qualified pension |
— | — | — | — | — | |||||||||||||||
| Medical, dental and vision benefits |
— | 5,471 | 13,676 | — | 5,471 | |||||||||||||||
| Life insurance proceeds |
— | — | — | — | 1,084,000 | |||||||||||||||
| Accidental death & dismemberment insurance proceeds |
— | — | — | 1,084,000 | 1,084,000 | |||||||||||||||
| Out-placement services |
— | 20,000 | 20,000 | — | — | |||||||||||||||
| Total |
$14,017 | $3,831,000 | $4,841,095 | $3,655,669 | $4,203,139 | |||||||||||||||
43
Table of Contents
| Voluntary Resignation / For Cause Termination(1) |
Severance Eligible Termination(2) |
Change in Control(2) |
Disability | Death | ||||||||||||||||
| Henry Jones
|
||||||||||||||||||||
| Base salary |
$— | $1,960,000 | $2,450,000 | $560,000 | $— | |||||||||||||||
| Short-term incentive bonus |
— | 420,000 | 420,000 | — | — | |||||||||||||||
| Vested/accelerated stock options |
16,082 | 280,525 | 280,525 | 280,525 | 280,525 | |||||||||||||||
| Accelerated restricted stock units |
— | 729,225 | 729,225 | 729,225 | 729,225 | |||||||||||||||
| Accelerated performance units(3) |
— | 568,801 | 1,140,752 | 1,140,752 | 1,140,752 | |||||||||||||||
| Incremental non-qualified pension |
— | — | — | — | — | |||||||||||||||
| Medical, dental and vision benefits |
— | 16,617 | 41,542 | — | 16,617 | |||||||||||||||
| Life insurance proceeds |
— | — | — | — | 1,120,000 | |||||||||||||||
| Accidental death & dismemberment insurance proceeds |
— | — | — | 1,120,000 | 1,120,000 | |||||||||||||||
| Out-placement services |
— | 20,000 | 20,000 | — | — | |||||||||||||||
| Total |
$16,082 | $3,995,168 | $5,082,044 | $3,830,503 | $4,407,119 | |||||||||||||||
| (1) | The Named Executive Officers would be able to exercise any options vested before the day of termination for cause or for a 30-day period after the date of termination upon a voluntary resignation, or through the end of the option term, if less. If Mr. Flexon’s Employment Agreement, as amended, terminates according to its terms, Mr. Flexon would be able to exercise any options within 10 years from the effective date of the option. |
| (2) | The Named Executive Officers are eligible to participate in the Severance Pay Plan. Under the Severance Pay Plan, in the event an Involuntary Termination occurs each is eligible to receive 200% his or her compensation (annual base salary plus target STI award). The executives shall also be eligible to receive a pro-rata bonus payment (determined by actual performance of the Company), which shall be paid at the same time as STI payments are made if the executives termination occurs on or after July 1. The Severance Pay Plan also provides for medical, dental, and vision benefits at the active employee rates for 24 months. Under the Change in Control provision of the Severance Pay Plan, in the event of an Involuntary Termination, Mr. Flexon is eligible to receive a severance payment equal to 299% his compensation (annual base salary plus target STI award), a pro-rata bonus payment (determined by actual performance of the Company), which shall be paid at the same time as STI payments are made, 36 months of medical, dental, and vision benefits coverage at the active employee rates. Messrs. Freeland and Jones and Mses. Burke and James are eligible to receive a severance payment equal to 250% their compensation (annual base salary plus target STI award), a pro-rata bonus payment (determined by actual performance of the Company), which shall be paid at the same time as STI payments are made, and 30 months of medical, dental, and vision benefits coverage at the active employee rates. In the event of a change in control and subsequent Involuntary Termination, the Named Executive Officers will also have accelerated vesting treatment on the Incremental non-qualified pension. Outplacement services are made available under both plans for all eligible employees. |
| (3) | Under the PSU award agreements granted in 2015, the Named Executive Officers would be entitled to a pro-rata vesting of the PSUs at the “target” level of the award for an involuntary termination without cause. Under the PSU award agreements granted in 2016 and 2017, the Named Executive Officers would be entitled to, upon an involuntary termination without cause, vesting of the PSUs upon completion of the performance period based solely upon the actual level of performance of the Company. Upon a Corporate Change for awards issued in 2015, 2016 and 2017, each Named Executive Officer would be entitled to receive payment as prescribed by the award agreement regardless of whether he or she is terminated. For purposes of this table, the value for a corporate change was calculated using the “target” level. |
44
Table of Contents
DIRECTOR COMPENSATION
DIRECTOR COMPENSATION FOR 2017
The key terms of our non-management independent director compensation include the following:
| Board Annual Retainer (paid in cash) |
● $75,000; paid in quarterly installments. | |||
| Committee Annual Retainers (paid in cash) |
Chair (paid in quarterly installments)
● Audit—$25,000
● Compensation—$20,000
● Finance & Commercial Oversight—$20,000
● Nominating—$15,000
|
Members (paid in quarterly installments)
● Audit—$10,000
● Compensation—$10,000
● Finance & Commercial Oversight—$10,000
● Nominating—$5,000 | ||
| Annual Equity Award |
● Annual award value of $110,000 to be granted in RSUs using the closing stock price on the grant date.
● Annual awards to be granted on the date of Dynegy’s Annual Stockholder Meeting with one year vesting from the date of grant.
| |||
| Non-Executive Chairman Annual Retainer |
● Additional retainer of $150,000.
● Deliver through a mix of cash (50%), paid in quarterly installments, and RSUs (50%).
● RSUs to be granted on the date of Dynegy’s Annual Stockholder Meeting with one year vesting from the date of grant.
| |||
| Other(1) |
● Reimbursement for reasonable out-of-pocket expenses incurred in connection with travel to and from, and attendance at, meetings of the Board or its committees and related activities, including director education courses and materials. | |||
| (1) | From February to November 2017, Tyler Reeder served on the Board. Mr. Reeder, as the Designated Director as defined in the Investor Rights Agreement, was not compensated for his service on the Board, but he did receive the same reimbursement of reasonable out-of-pocket expenses as our other non-management directors received. |
The following table sets forth certain information regarding the compensation earned by or awarded to each non-management independent director who served on our Board in 2017. The Designated Director and Directors who are also employees of Dynegy are not compensated for their services as directors.
| Name | Fees Earned or Paid in Cash |
Stock Awards(1) |
Option Awards |
Non-Equity Incentive Plan Compensation |
Change in Pension Value and Nonqualified Deferred Compensation Earnings |
All Other Compensation |
Total | |||||||||||||||||||||
| Pat Wood III(2)(3) |
$155,000 | $185,000 | $— | $— | $— | $— | $340,000 | |||||||||||||||||||||
| Hilary E. Ackermann |
$105,000 | $110,000 | $— | $— | $— | $— | $215,000 | |||||||||||||||||||||
| Paul M. Barbas |
$105,000 | $110,000 | $— | $— | $— | $— | $215,000 | |||||||||||||||||||||
|
Richard L. Kuersteiner |
$100,000 | $110,000 | $— | $— | $— | $— | $210,000 | |||||||||||||||||||||
| Jeffrey S. Stein(3) |
$100,000 | $110,000 | $— | $— | $— | $— | $210,000 | |||||||||||||||||||||
| John R. Sult |
$110,000 | $110,000 | $— | $— | $— | $— | $220,000 | |||||||||||||||||||||
| Tyler Reeder |
$— | $— | $— | $— | $— | $— | $— | |||||||||||||||||||||
| (1) | Directors received an annual award granted under 2012 Long Term Incentive Plan in RSUs on May 18, 2017 with a vesting date of May 18, 2018. The values shown under “Stock Awards” reflect the aggregate grant date fair value computed in accordance with FASB ASC Topic 718. The aggregate number of restricted stock units outstanding as of December 31, 2017 for our non-employee directors was as follows: 46,391 restricted stock units for Mr. Wood, 18,545 restricted stock units for Ms. Ackerman, 21,022 restricted stock units for Mr. Barbas, 15,152 restricted stock units for Mr. Kuersteiner, 21,591 restricted stock units for Mr. Stein and 27,461 restricted stock units for Mr. Sult. |
| (2) | Mr. Wood is serving as our non-executive Chairman of the Board. |
45
Table of Contents
| (3) | Messrs. Wood, Barbas, Stein and Sult and Ms. Ackermann each have deferred receipt of the amount realized from the vesting of the RSUs granted on May 18, 2017 until their separation from service as a director of Dynegy. |
Item 12. Security Ownership of Certain Beneficial Owners and Management and Related Stockholder Matters
SECURITY OWNERSHIP OF CERTAIN BENEFICIAL OWNERS AND MANAGEMENT
On the Closing Date, the Company merged with and into Vistra Energy, with Vistra Energy continuing as the surviving corporation. At the Merger Effective Time, each issued and outstanding share of Dynegy Common Stock (other than shares owned by Vistra Energy or its wholly owned subsidiaries, held in treasury by the Company or held by a wholly owned subsidiary of the Company, which shares were automatically cancelled and ceased to exist) was automatically converted into the right to receive 0.652 shares of Vistra Energy Common Stock.
As of the Merger Effective Time, each outstanding Dynegy stock option was automatically converted into an option to purchase shares of Vistra Energy Common Stock, on the same terms and conditions that were applicable under such Dynegy stock option immediately prior to the Merger Effective Time (including any accelerated vesting provisions), equal to the product of (A) the total number of shares of Dynegy Common Stock subject to such Dynegy stock option and (B) the Exchange Ratio, rounded down to the nearest whole number of shares of Vistra Energy Common Stock. The per-share exercise price of each converted Vistra Energy stock option is equal to the quotient determined by dividing (1) the exercise price per share applicable to the Dynegy stock option by (2) the Exchange Ratio, rounded up to the nearest whole cent.
As of the Merger Effective Time, each outstanding award of restricted stock units with respect to shares of Dynegy Common Stock other than Dynegy phantom stock units (“Dynegy RSUs”) was automatically converted into a number of restricted stock units with respect to shares of Vistra Energy Common Stock (“Vistra RSUs”) equal to the product of (A) the number of Dynegy RSUs held by such holder immediately prior to the Merger Effective Time and (B) the Exchange Ratio, and remains outstanding on the same terms and conditions as were applicable to such award prior to the Merger Effective Time (including any accelerated vesting provisions).
As of the Merger Effective Time, each outstanding Dynegy performance stock unit (a “Dynegy PSU”) was automatically converted into the right to receive from Vistra Energy, at the Merger Effective Time, a number of shares of Vistra Energy Common Stock (and cash in lieu of fractional shares to be paid by the surviving corporation to the holder) equal to the product of (A) the total number of shares of Dynegy Common Stock that would be payable in respect of such Dynegy PSU (1) in the case of Dynegy PSUs with respect to which the Merger Effective Time occurred after the first twelve months of the applicable performance period, (x) at the actual level of performance applicable to such portion of such Dynegy PSU that relates to total stockholder return, as determined in accordance with the applicable award agreement, and (y) at the target level of performance applicable to such portion of such Dynegy PSU that relates to free cash flow, and (2) in the case of Dynegy PSUs with respect to which the Merger Effective Time occurred within the first twelve months of the applicable performance period, (x) at the target level of performance applicable to such portion of such Dynegy PSU that relates to total stockholder return, as determined in accordance with the applicable award agreement, and (y) at the target level of performance applicable to such portion of such Dynegy PSU that relates to free cash flow, and (B) the Exchange Ratio.
As of the Merger Effective Time, each outstanding Dynegy phantom stock unit was automatically converted into phantom stock units relating to the number of shares of Vistra Energy Common Stock equal to the product of (A) one share of Dynegy Common Stock and (B) the Exchange Ratio, and remains outstanding on the same terms and conditions as were applicable to such award immediately prior to the Merger Effective Time.
As of the Merger Effective Time, the number of hypothetical shares of Dynegy Common Stock credited to the company deferral account of each participant in Dynegy’s deferred compensation plan which company deferral account had an outstanding balance as of immediately prior to the Merger Effective Time was automatically converted into that number of hypothetical shares of Vistra Energy Common Stock equal to the product of (A) the total number of hypothetical shares of Dynegy Common Stock credited to such company deferral account and (B) the Exchange Ratio, and such company deferral account has the same terms and conditions as were applicable to such company deferral account immediately prior to the Merger Effective Time.
46
Table of Contents
As a result of the Merger, none of the company’s directors or executive officers, nor any other person, held shares of Dynegy Common Stock as of April 26, 2018 or had the right to acquire shares of Dynegy Common Stock within 60 days of April 26, 2018.
Item 13. Certain Relationships and Related Transactions, and Director Independence
REVIEW AND APPROVAL OF TRANSACTIONS WITH RELATED PERSONS
Our Board adopted a written policy relating to the approval of transactions with related parties. In general, for purposes of this policy, a related party transaction is a transaction to which we are a party, or a material amendment to any such transaction, and with respect to which a related party is directly, or to our knowledge, indirectly, a party. Under our policy, a “related party” is an executive officer, director or nominee for director of ours, a person known to us to be the beneficial owner of more than 5% of our voting securities, an immediate family member of an executive officer, director, nominee for director or 5% stockholder, and any entity owned or controlled by any of the foregoing individuals or in which any such individual serves as an executive officer or general partner or, together with any other such individuals, owns 10% or more of the equity interests of such an entity. Our policy requires the Audit Committee or, at the Board’s discretion, a majority of directors disinterested from the transaction, to review and approve related party transactions. In reviewing and approving any related party transaction or material amendments to any such transaction, the Audit Committee must satisfy itself that it has been fully informed as to the related party’s relationship and interest and as to the material facts of the transaction and must determine that the related party transaction is fair to us.
A copy of our related party transactions policy is available on our web site at https://www.dynegy.com/investors/leadership-governance/corporate-governance/governance-documents.
AFFIRMATIVE DETERMINATIONS REGARDING DIRECTOR INDEPENDENCE AND OTHER MATTERS
The Board previously determined that each of the following directors who served in 2017 is “independent” as such term is defined in the NYSE Listed Company Standards:
Pat Wood III
Hilary E. Ackermann
Paul M. Barbas
Richard L. Kuersteiner
Jeffrey S. Stein
John R. Sult
The Board has also determined that each member of the Audit Committee, the Compensation and Human Resources Committee, or Compensation Committee, and the Nominating Committee meets the independence requirements applicable to those committees prescribed by the NYSE and the SEC. The Board has further determined that more than one of the members of the Audit Committee, including its current Chairman, Mr. Sult, are “audit committee financial experts” as such term is defined in Item 407(d) of the SEC’s Regulation S-K.
The Nominating Committee reviewed the answers to annual questionnaires completed by the directors and nominees as well as the above described legal standards for Board and committee member independence and the criteria applied to determine “audit committee financial expert” status. On the basis of this review, the Nominating Committee made its recommendation to the full Board and the Board made its independence and “audit committee financial expert” determinations after consideration of the Nominating Committee’s recommendation and a review of the materials made available to the Nominating Committee.
47
Table of Contents
Item 14. Principal Accountant Fees and Services
PRINCIPAL ACCOUNTING FEES AND SERVICES
Ernst & Young LLP (“EY”) served as our independent registered public accountants for the years ending December 31, 2017 and 2016. Set forth below is a summary of the fees we paid EY for professional services rendered for the years ended December 31, 2017 and 2016.
| (in thousands) |
2017 | 2016 | ||||||||
| Audit Fees(1) |
$4,929 | $4,110 | ||||||||
| Audit Related Fees(2) |
578 | 320 | ||||||||
| Tax Fees(3) |
93 | 54 | ||||||||
| All Other Fees |
— | — | ||||||||
| Total Fees |
$5,600 | $4,484 |
| (1) | Audit fees relate to the audit of Dynegy’s financial statements and the effectiveness of our internal control over financial reporting for the years ended December 31, 2017 and 2016. Audit Fees increased in 2017 primarily due to costs associated with the purchase accounting of the Engie acquisition in 2017, as well as the implementation of the new Revenue Accounting Standards. |
| (2) | Audit related fees include fees of $10,000 and $0 in 2017 and 2016, respectively, for the audits of separate financial statements of certain of our consolidated subsidiaries and/or equity method investments. Additionally, 2017 and 2016 fees included $568,000 and $320,000, respectively, for services rendered related to Dynegy Inc. registration statements. |
| (3) | Tax fees include fees of $93,000 and $54,000 in 2017 and 2016, respectively, related to advisory services for federal and state tax returns. |
All of the fees and services described above under the captions “Audit Fees,” “Audit Related Fees,” “Tax Fees” and “All Other Fees” were approved under the Audit Committee’s pre-approval policy and pursuant to Section 202 of SOX. None of the services described above were provided pursuant to the de minimus exception provided for in applicable SEC rules and regulations.
AUDIT COMMITTEE PRE-APPROVAL POLICY
The Audit Committee is responsible for appointing, setting compensation for and overseeing the work of our independent registered public accountants. The Audit Committee has established a policy requiring its pre-approval of all audit and permissible non-audit services to be provided by our independent registered public accountants in order to assure that the provision of such services does not impair the auditors’ independence. The policy, as amended, provides for the general pre-approval of specific types of services, gives detailed guidance to management as to the specific audit, audit related and tax services that are eligible for general pre-approval and provides specific fee limits for each such service type on an annual basis. The policy requires specific pre-approval of the annual audit engagement, statutory or subsidiary audits and all permissible non-audit services for which no general pre-approval exists. For both audit and non-audit pre- approvals, the Audit Committee considers whether such services are consistent with applicable law and SEC rules and regulations concerning auditor independence.
The Audit Committee Charter provides that the Audit Committee may delegate to the Audit Committee Chairman the authority to grant pre-approvals only if such approvals are presented to the Audit Committee at a subsequent meeting. The policy prohibits the Audit Committee from delegating to management such committee’s responsibility to pre-approve services performed by the independent registered public accountants. When we engage the independent registered public accountants to perform services based on a general pre- approval, our Chief Financial Officer or, in his absence, our Chief Accounting Officer is required to, as soon thereafter as reasonably practicable, notify the chairman of such engagement and provide a detailed description of the type and scope of services, proposed staffing, a budget of the proposed fees for such services and a general timetable for the performance of such services.
Requests for pre-approval of services must be detailed as to the particular services proposed to be provided and are to be submitted by our Chief Financial Officer or, in his or her absence, our Chief Accounting Officer. Generally, each such request must include a joint statement to the effect that neither the submitting officer nor the
48
Table of Contents
independent registered public accountants believe the proposed engagement would impair the auditors’ independence. In addition, each such request generally must include a detailed description of the type and scope of services, proposed staffing, a budget of the proposed fees for such services and a general timetable for the performance of such services.
49
Table of Contents
Item 15. Exhibits and Financial Statement Schedules
All financial statement schedules are omitted because of the absence of conditions under which they are required or because the required information is included in our consolidated financial statements or notes thereto, included in Part II, Item 8, of the Original Form 10-K. The exhibits filed as part of this Amendment are listed in the Exhibit Index below.
50
Table of Contents
Annex A
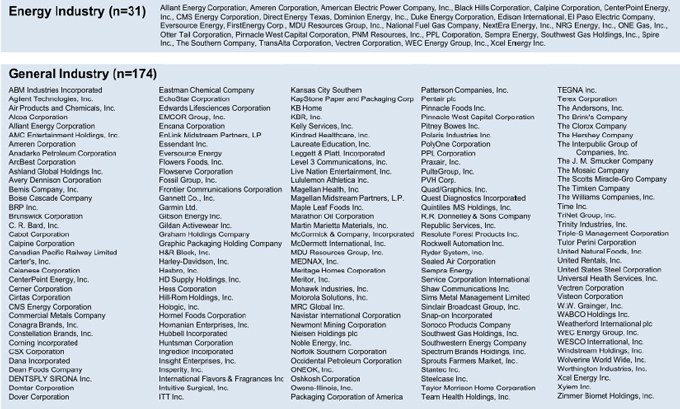
Energy Industry (n=31) Alliant Energy Corporation, Ameren Corporation, American Electric Power Company, Inc., Black Hills Corporation, Calpine Corporator CenterPoint Energy, Inc., CMS Energy Corporation, Direct Energy Texas, Dominion Energy, Inc., Duke Energy Corporation, Edison International, El Paso Electric Company, Eversource Energy, FirstEnergy Corp., MDU Resources Group, Inc.,, National Fuel Gas Company, NextEra Energy, inc, NRG Energy. Inc., ONE Gas Inc., Otter Tail Corporation. Pinnacle West Capital Corporation. PNM Resources. Inc., PPL Corporation. Sempra Energy. Southwest Gas Holdings. Inc., Spire Inc., The Southern Company, TransAJIa Corporation, Vectren Corporation, WEC Energy Group. Inc., Xcel Energy Inc. General Industry (n=174) ABM Industries Incorporated Eastman Chemical Company Kansas City Southern Patterson Companies. Inc. TEGNA Inc. Agilent Technologies. Inc. EchoStar Corporation KapStone Paper and Packaging Corp Pentair plc Terex Corporation Air Products and Chemicals, Inc. Edwards Lifesciences Corporation KB Home Pinnacle Foods Inc. The Andereons, Inc. Alcoa Corporation EMCOR Group. Inc. KBR, Inc. Pinnacle West Capital Corporation The Bnnfc’s Company Alliant Energy Corporation Encana Corporation Kelly Services. Inc. Pitney Bowes Inc. The Clorox Company AMC Entertainment Holdings. Inc. EnUnk Midstream Partners. LP Kindred Healthcare. Inc. Polaris Industries Inc. The Hershey Company Ameren Corporation Essendant Inc. Laureate Education, Inc. PoiyOne Corporation The Interpublic Group of Anadarko Petroleum Corporation Eversource Energy Leggett & Platt Incorporated PPL Corporabon Companies, Inc. ArcBest Corporation Flowers Foods. Inc. Level 3 Communications. Inc. Praxair, Inc. The J. M. Smucker Company Ashland Global Holdings Inc. FVwserve Corporation Live Nation Entertainment. Inc. PulteGroup. Inc. The Mosaic Company Avery Dennison Corporation Fossil Group, Inc. Lululemon Athletca Inc. PVH Corp. The Scotts Miracle-Gro Company Bemis Company. Inc. Frontier Communications Corporation Magellan Health Inc. Quad/Graphics, Inc. The Timken Company Boise Cascade Company Gannett Co.. Inc. Magellan Midstream Partners. L.P. Quest Diagnostics Incorporated The Williams Companies. Inc. BRP Inc. Garmln Ltd. Maple Leaf Foods Inc. Quin tiles IMS Holdings, Inc. Time Inc. Brunswick Corporation Gibson Energy Inc. Marathon Oil Corporation R.R. Donnelley & Sons Company TriNet Group. Inc C. R Bard, Inc. Gildan Activewear Inc. Martin Marietta Materials. Inc. Republic Services, Inc. Trinity Industries. Inc. Cabot Corporation Graham Holdtf>gs Company McCormick & Company, incorporated Resolute Forest Products Inc. Triple-S Management Corporation Calpine Corporation Graphic Packaging Holding Company McDermott International. Inc. Rockwell Automation Inc. T ulor Perim Corporation Canadian Pacific Railway Limited H&R Block, Inc. MDU Resources Group. Inc. Ryder System, Inc. United Natural Foods. Inc. Carter’s, Inc. Hartey-Davidson, Inc. MEDNAX, Inc. Sealed Air Corporation United Rentals. Inc. Cetanese Corporation Hasbro, Inc. Meritage Homes Corporation Sempra Energy United States Steel Corporation CenterPoint Energy, Inc. HD Supply Holdings, Inc. Meritor, Inc. Service Corporation International Universal Health Services, Inc. Cemer Corporation Hess Corporation Mohawk Industries. Inc. Shaw Communicator Inc. Vectren Corporation Dntas Corporation H*-Rom Holdings. Inc. Motorola Solutions. Inc. Sims Metal Management Limited Visteon Corporation CMS Energy Corporation Hologic, Inc. MRC Global Inc. Sinclair Broadcast Group, Inc. W W. Grainger, Inc. Commercial Metals Company Hormel Foods Corporator) Navistar Intematonal Corporation Snap-on Incorporated WABCO Holdings Inc. Conagra Brands. Inc. Hovnanian Enterprises Inc. Newmont Mining Corporation Sonoco Products Company Weatherford Intematonal plc Constellation Brands. Inc. Hubbetl Incorporated Nielsen Holdings plc Southwest Gas Holdings. Inc. WEC Energy Group, Inc. Corning Incorporated Huntsman Corporation Noble Energy. Inc. Southwestern Energy Company WESCO international, Inc. CSX Corporation Ingredion Incorporated Norfolk Southern Corporation Spectrum Brands Holdings, Inc. Windstream Holdings. Inc. Dana Incorporated Insight Enterprises. Inc. Occidental Petroleum Corporation Sprouts Farmers Market. Inc. Wolverine World Wide, Inc. Dean Foods Company Insperity. Inc. ONEOK. Inc. Stantec Inc. Worthington Industries, Inc. DENTSPLY SIRONA Inc. International Flavors & Fragrances Inc. Oshkosh Corporation Steelcase Inc. Xcel Energy Inc. Domtar Corporation Intuitive Surgical, Inc. Owens-IKnois. Inc. Taylor Morrison Home Corporation Xylem Inc. Dover Corporation ITT Inc. Packaging Corporation of America Team Health Holdings. Inc. Zimmer Biomet Holdings. Inc. 51
51
Table of Contents
EXHIBIT INDEX
| Exhibit Number |
Description | |
| 1.1 |
||
| 2.1 |
||
| 2.2 |
||
| 2.3 |
||
| 2.4 |
||
| 2.5 |
||
| 2.6 |
||
| 2.7 |
||
| 2.8 |
||
| 2.9 |
52
Table of Contents
| 2.10 |
||
| 2.11 |
||
| 2.12 |
||
| 2.13 |
||
| 2.14 |
||
| 2.15 |
||
| 2.16 |
||
| 2.17 |
||
| 2.18 |
||
| 2.19 |
||
| 2.20 |
||
| 2.21 |
||
| 2.22 |
||
| 2.23 |
||
| 2.24 |
||
| 3.1 |
53
Table of Contents
| 3.2 |
||
| 4.1 |
||
| 4.2 |
||
| 4.3 |
||
| 4.4 |
||
| 4.5 |
||
| 4.6 |
||
| 4.7 |
||
| 4.8 |
||
| 4.9 |
||
| 4.10 |
||
| 4.11 |
||
| 4.12 |
||
| 4.13 |
||
| 4.14 |
||
| 4.15 |
54
Table of Contents
| 4.16 |
||
| 4.17 |
||
| 4.18 |
||
| 4.19 |
||
| 4.20 |
||
| 4.21 |
||
| 4.22 |
||
| 4.23 |
||
| 4.24 |
||
| 4.25 |
||
| 4.26 |
||
| 4.27 |
||
| 4.28 |
||
| 4.29 |
||
| 4.30 |
55
Table of Contents
| 4.31 |
||
| 4.32 |
||
| 4.33 |
||
| 4.34 |
||
| 4.35 |
||
| 4.36 |
||
| 4.37 |
||
| 4.38 |
||
| 4.39 |
||
| 4.40 |
||
| 4.41 |
||
| 4.42 |
||
| 10.1 |
||
| 10.2 |
||
| 10.3 |
||
| 10.4 |
||
| 10.5 |
||
| 10.6 |
||
| 10.7 |
56
Table of Contents
| 10.8 |
||
| 10.9 |
||
| 10.10 |
||
| 10.11 |
||
| 10.12 |
||
| 10.13 |
||
| 10.14 |
||
| 10.15 |
||
| 10.16 |
||
| 10.17 |
||
| 10.18 |
||
| 10.19 |
||
| 10.20 |
||
| 10.21 |
||
| 10.22 |
||
| 10.23 |
||
| 10.24 |
||
| 10.25 |
||
| 10.26 |
||
| 10.27 |
||
| 10.28 |
||
| 10.29 |
||
| 10.30 |
||
| 10.31 |
57
Table of Contents
| 10.32 |
||
| 10.33 |
||
| 10.34 |
||
| 10.35 |
||
| 10.36 |
||
| 10.37 |
||
| 10.38 |
||
| 10.39 |
||
| 10.40 |
||
| 10.41 |
||
| 10.42 |
||
| 10.43 |
||
| 10.44 |
||
| 10.45 |
||
| 10.46 |
||
| 10.47 |
||
| 10.48 |
||
| 10.49 |
||
| 10.50 |
||
| 10.51 |
||
| 10.52 |
58
Table of Contents
| 10.53 |
||
| 10.54 |
||
| 10.55 |
||
| 10.56 |
||
| 10.57 |
||
| 10.58 |
||
| 10.59 |
||
| 10.60 |
||
| 10.61 |
||
| 10.62 |
||
| 10.63 |
||
| 10.64 |
||
| 10.65 |
||
| 10.66 |
||
| 10.67 |
||
| 10.68 |
||
| 10.69 |
||
| 10.70 |
||
| 10.71 |
59
Table of Contents
| 14.1 |
||
| +21.1 |
||
| ***+23.1 |
||
| +31.1 |
||
| +31.2 |
||
| ***31.3 |
||
| ***31.4 |
||
| †+32.1 |
||
| †+32.2 |
||
| **+101.INS |
XBRL Instance Document | |
| **+101.SCH |
XBRL Taxonomy Extension Schema Document | |
| **+101.CAL |
XBRL Taxonomy Extension Calculation Linkbase Document | |
| **+101.DEF |
XBRL Taxonomy Extension Definition Linkbase Document | |
| **+101.LAB |
XBRL Taxonomy Extension Label Linkbase Document | |
| **+101.PRE |
XBRL Taxonomy Extension Presentation Linkbase Document |
| * | Pursuant to Item 6.01(b)(2) of Regulation S-K exhibits and schedules are omitted. Dynegy agrees to furnish to the Commission supplementally a copy of any omitted schedule or exhibit upon request of the Commission. |
| ** | XBRL information is furnished and not filed for purposes of Section 11 and 12 of the Securities Act of 1933 and Section 18 of the Securities Exchange Act of 1934, and is not subject to liability under those sections, is not part of any registration statement or prospectus to which it relates and is not incorporated or deemed to be incorporated by reference into any registration statement, prospectus or other document. |
| *** | Filed herewith. |
| **** | Pursuant to a request for confidential treatment, portions of this Exhibit have been redacted and filed separately with the SEC as required by Rule 24b-2 under the Securities Exchange Act of 1934, as amended. |
| + | Previously filed. |
| † | Pursuant to Securities and Exchange Commission Release No. 33-8238, this certification will be treated as “accompanying” this report and not “filed” as part of such report for purposes of Section 18 of the Securities Exchange Act of 1934, as amended, or the Exchange Act, or otherwise subject to the liability of Section 18 of the Exchange Act, and this certification will not be deemed to be incorporated by reference into any filing under the Securities Act of 1933, as amended, or the Exchange Act. |
| †† | Management contract or compensation plan. |
60
Table of Contents
Pursuant to the requirements of Section 13 or 15(d) of the Securities Exchange Act of 1934, the registrant has duly caused this report to be signed on its behalf by the undersigned, the thereunto duly authorized.
| VISTRA ENERGY CORP. (as successor to DYNEGY INC.) | ||||||
| Date: April 27, 2018 | By: | /s/ Curtis A. Morgan | ||||
| Curtis A. Morgan | ||||||
| President and Chief Executive Officer of Vistra Energy Corp. (successor to Dynegy Inc.) | ||||||
61