Attached files
| file | filename |
|---|---|
| EX-99.1 - EX-99.1 - CALIFORNIA WATER SERVICE GROUP | a18-12282_1ex99d1.htm |
| 8-K - 8-K - CALIFORNIA WATER SERVICE GROUP | a18-12282_18k.htm |
California Water Service Group First-Quarter 2018 Earnings Call Presentation April 26, 2018

Forward-Looking Statements This presentation contains forward-looking statements within the meaning established by the Private Securities Litigation Reform Act of 1995 ("Act"). The forward-looking statements are intended to qualify under provisions of the federal securities laws for "safe harbor" treatment established by the Act. Forward-looking statements are based on currently available information, expectations, estimates, assumptions and projections, and management's judgment. Words such as would, expects, intends, plans, believes, estimates, assumes, anticipates, projects, predicts, forecasts or variations of such words or similar expressions are intended to identify forward-looking statements. The forward-looking statements are not guarantees of future performance. They are subject to uncertainty and changes in circumstances. Actual results may vary materially from what is contained in a forward-looking statement. Factors that may cause a result different than expected or anticipated include, but are not limited to: governmental and regulatory commissions' decisions; changes in regulatory commissions' policies and procedures; the timeliness of regulatory commissions' actions concerning rate relief; changes in tax laws, the interpretation of tax laws, and accounting policies; changes in construction costs and availability of resources; the ability to successfully implement conservation measures; changes in customer water use patterns; the impact of weather and climate on water sales and operating results; and, other risks and unforeseen events. When considering forward-looking statements, you should keep in mind the cautionary statements included in this paragraph, as well as the annual 10-K, Quarterly 10-Q, and other reports filed from time- to-time with the Securities and Exchange Commission (SEC). The Company assumes no obligation to provide public updates of forward-looking statements. 2
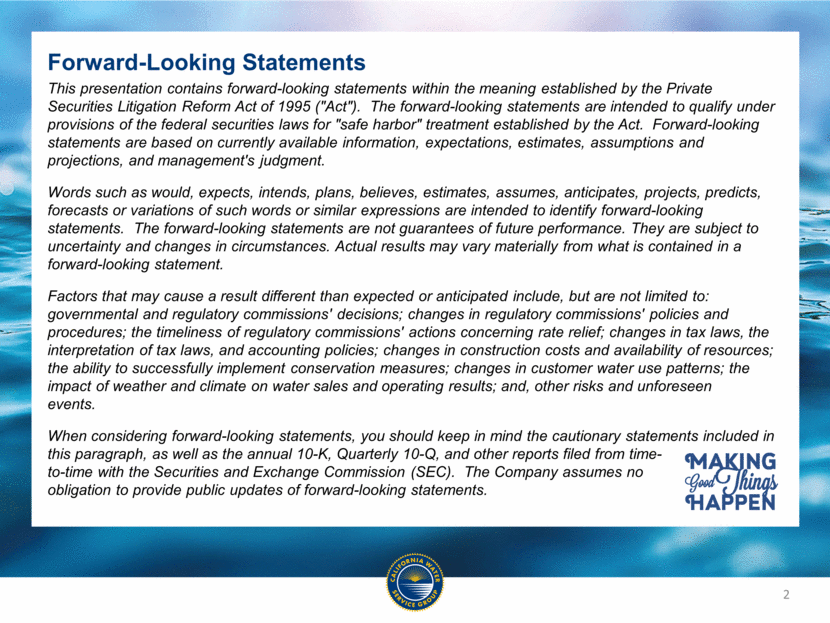
Marty Kropelnicki President & CEO Today’s Participants Tom Smegal Vice President, CFO & Treasurer 3
Presentation Overview Our Operating Priorities Financial Results and Highlights California Adopted Revenue by Month EPS Bridge Q1 2017 to Q1 2018 California Cost of Capital Decision Tax Cuts and Jobs Act 2018 California General Rate Case Status of Regulatory Mechanisms and Water Conditions Other Notes for 2018 Capital Investment History and Projection Regulated Rate Base of CWT Summary 4
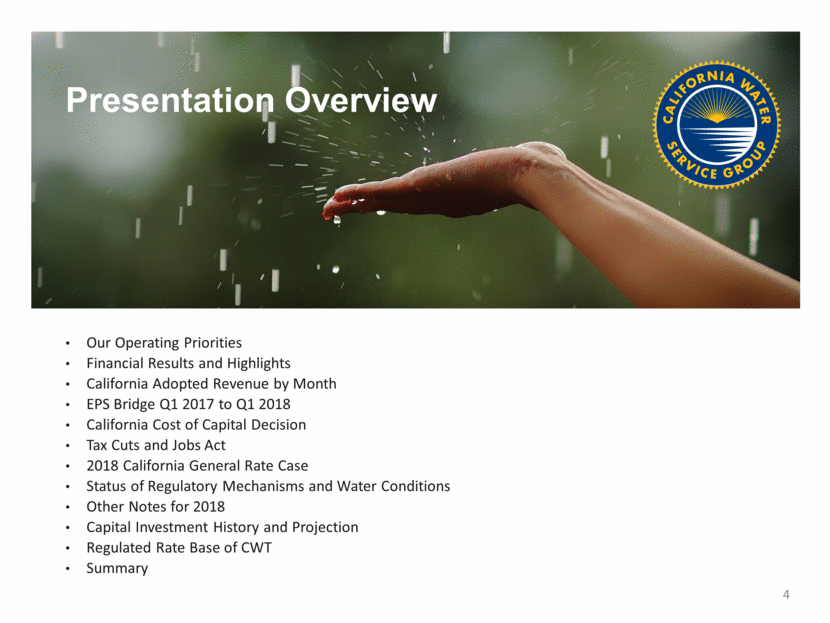
Our Operating Priorities 5
(amounts are in millions, except for EPS) Q1 2017 Q1 2018 Variance Operating Revenue $122.0 $132.2 8.4% Operating Expenses $111.5 $124.2 11.4% Net Interest $8.2 $8.7 5.9% Net Income (Loss) $1.1 ($2.5) Not Applicable EPS $0.02 ($0.05) Not Applicable Capital Investments $51.9 $70.7 36.3% Financial Results: First Quarter 6
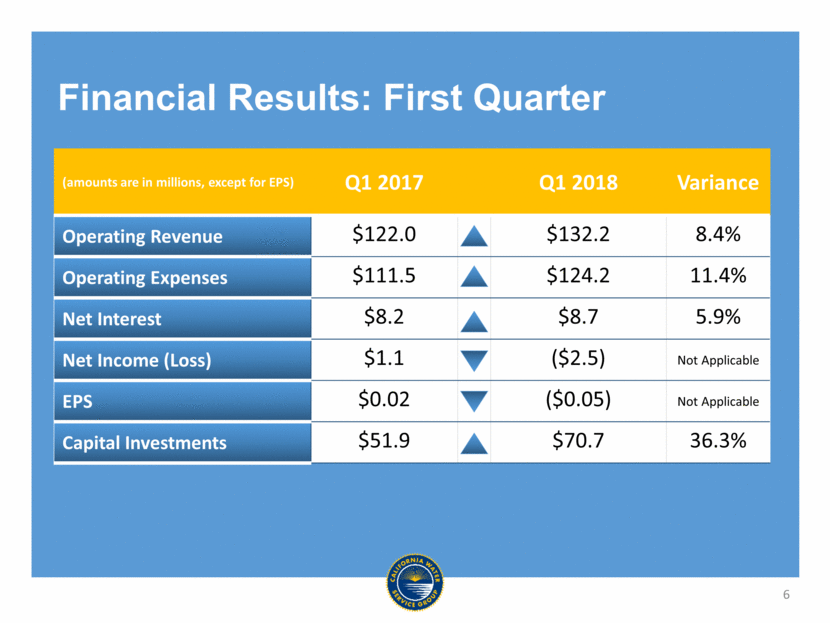
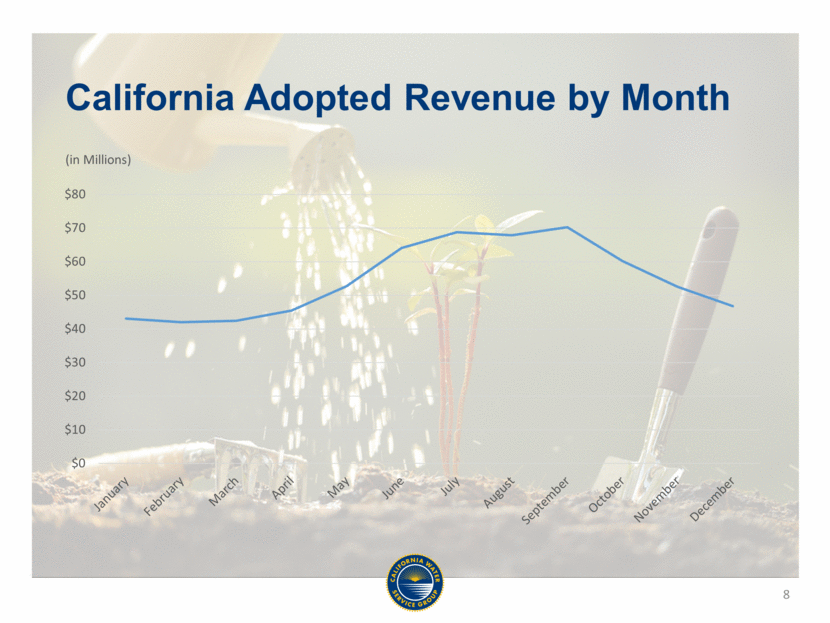
First quarter always leanest of the year for earnings and revenue due to seasonality in our business First quarter earnings decrease of $3.6 million largely attributable to: Factors outside Company’s immediate control, including: $1.5 million reduction in unrealized income from certain benefit plan investments, $0.8 million increase in uninsured loss expense, and $0.7 million reduction in unbilled revenue; these results may or may not be reflective of expenses in other time periods Changes in expenses that should continue throughout 2018, including: $1.5 million for depreciation & amortization, $0.7 million for employee wage expense, $0.6 million in property and other taxes, and $0.5 million in net interest expense Offsetting these items, Company had: general rate increases of $4.7 million offset by $1.2 million cost of capital reduction in California, as well as $0.7 million reduction to maintenance expenses Company- and developer-funded capital investments were $70.7 million, an increase of 36.3% compared to 2017 High spending in Q1 due to treatment for 1,2,3-trichloropropane at 34 sites in California to meet new water quality standard; Company still anticipates capital spending between $200-220 million in 2018 Q1 2018 Financial Highlights 7
California Adopted Revenue by Month (in Millions) 8
EPS Bridge Q1 2017 to Q1 2018 9
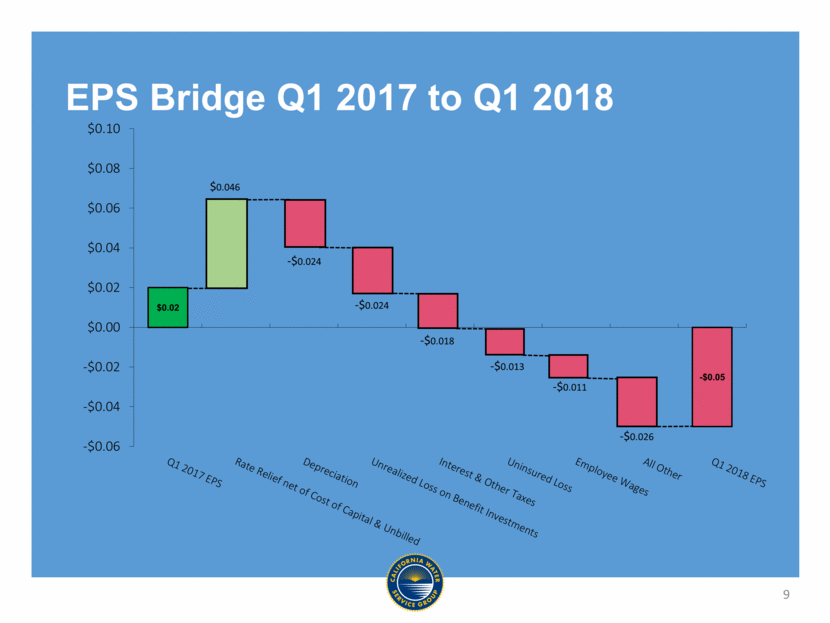
Notes on EPS Bridge Items Increased revenue includes California escalation increases net of California cost of capital revenue reduction effective January 1, 2018, as well as rate base offset rate relief and effect of Hawaii rate increases since corresponding period in 2017 Change in unbilled revenue accrual also included within revenue increases; change in unbilled revenue accrual reduced revenue $1.6 million in first quarter compared to reduction of $0.9 million in first quarter 2017; reduced accruals in first quarter 2018 were result of weather and other factors Increased depreciation consistent with additional capital investment placed into service in 2017 10
California Cost of Capital Decision On March 22, California Public Utilities Commission (CPUC) issued final decision in Company’s California cost of capital filing with three other water utilities Cal Water was authorized return on equity (ROE) of 9.20%, cost of debt of 5.51%, and capital structure including 53.4% equity Cost of capital adjustment will reduce customer rates by estimated $6.7 million in 2018, primarily due to lower weighted cost of debt achieved in Company’s financing program Decision retroactive to January 1, set authorized returns through 2020 CPUC also approved cost of capital adjustment mechanism that would trigger ROE adjustment with 100 bps change in Moody’s AA utility bond index 11
Tax Cuts and Jobs Act In all four of our state operations, Commissions initiated procedures to ensure customers benefit from tax reform Cal Water will incorporate initial change in customer rates to reflect lower federal rate in operations and elimination of Section 199 deductions in second quarter Company has recorded liability for excess tax expense collected in rates in our other state operations but does not anticipate changing customer rates until late 2018 Company expects to pay taxes in 2020 once prior year NOL exhausted Remeasurement of deferred income taxes at 12/31/17 resulted in excess deferred income tax liability of $108 million Remeasured deferred income taxes in all subsidiaries will generally be addressed in the next rate case filing in each jurisdiction 12
Cal Water will file its 2018 GRC in July Company anticipates requesting more capital than was awarded in last cycle, primarily due to replacement of aging infrastructure including transmission and distribution mains Company will begin to forecast preliminary capital investment and rate base growth for 2019 through 2022 with second quarter earnings release Rates would change effective January 1, 2020 Covers capital investments in 2019-2021 Company staff has been working for more than two years to prepare and support case Cal Water reviews capital needs on nine-year (three rate case) planning horizon and anticipates increasing replacement cycle capital needs through that period 2018 California General Rate Case 13
Status of Regulatory Mechanisms and Water Conditions Along with escalation filing, Cal Water received adjustment in adopted sales volumes through Sales Reconciliation Mechanism of 9% Recorded sales volumes in first quarter were 101% of new adopted sales volumes and WRAM receivable balance declined by $0.9 million, good sign that mechanism is working Cal Water began billing surcharges to recover $50.1 million in net WRAM/MCBA receivables in April 2018 California had close to “miracle March” with high rain and snow totals, leading to near-normal winter in 2017-2018 Snowpack is 44% of average and precipitation is 84% of average as of April 20, with good reservoir conditions Continuing shortfalls in snowpack, even in normal to wet years, are long-term water supply concern across California 14
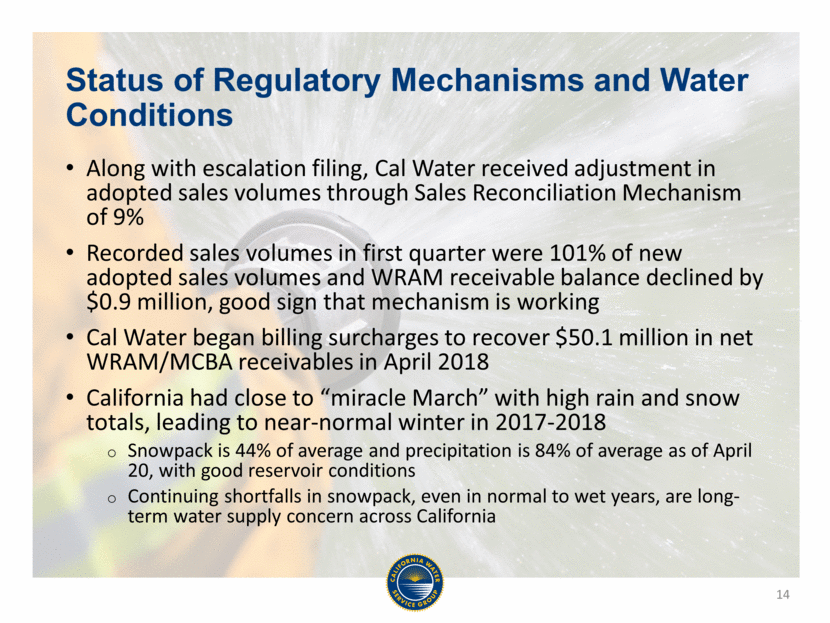
Net WRAM Receivable Balance (in millions; end-of-year balance except 2018) 15
Other Notes for 2018 Through January 1, CPUC had approved advice letter projects totaling additional $2.8 million annual revenue out of authorization of up to $30 million through 2019 No additional advice letter projects included in rates in first quarter We estimate 2018 effective tax rate of 23-25%, close to statutory rate of 28% due to reduced budget for repairs-eligible projects, though this could change as law gets interpreted Beginning with first quarter 2018, non-service components of pension expense are included with “other income and expense” as “other components of net periodic benefit cost” due to implementation of FASB ASU 2017-07 16
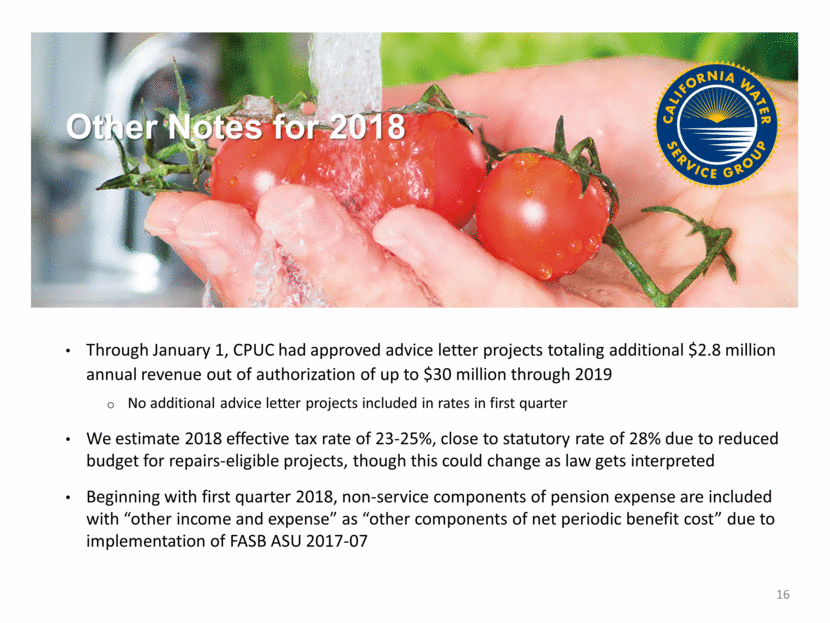
Capital Investment History and Projection (in millions) *2018 estimated capital investment is the midpoint in the Company’s stated range of $200-$220 million. CAGR = 12.9% (2007-2017) 17
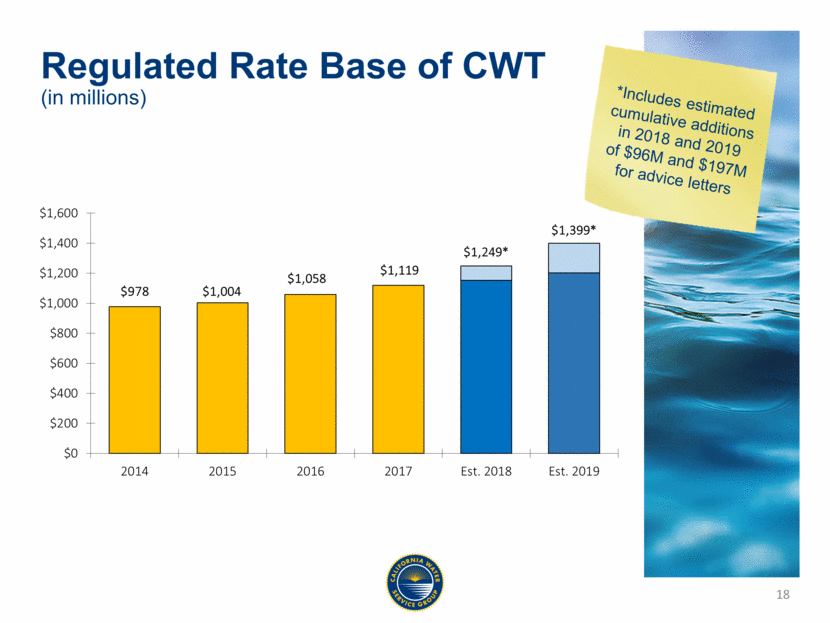
Regulated Rate Base of CWT Regulated Rate Base of CWT (in millions) *Includes estimated cumulative additions in 2018 and 2019 of $96M and $197M for advice letters 18
Summary Q1 typically close to breakeven for Company given our rate designs and usage patterns in our service territories While California cost of capital decision will reduce rates this year, we are pleased that CPUC moved significantly from its initial proposal We are seeing positive effects of our regulatory mechanisms, particularly sales reconciliation mechanism, which has started to reduce net WRAM/MCBA receivable balance We are focused on filing California General Rate Case on schedule in July 19
[LOGO]

