Attached files
| file | filename |
|---|---|
| 8-K - 8-K - 1Q18 EARNINGS RELEASE - ZIONS BANCORPORATION, NATIONAL ASSOCIATION /UT/ | zion-201803318xkcoverpage.htm |
| EX-99.2 - 1Q18 EARNINGS RELEASE SLIDE PRESENTATION - ZIONS BANCORPORATION, NATIONAL ASSOCIATION /UT/ | exh992earningspresentation1q.pdf |
ZIONS BANCORPORATION
Press Release – Page 1
April 23, 2018
Zions Bancorporation One South Main Salt Lake City, UT 84133 April 23, 2018 |  |
www.zionsbancorporation.com | |
First Quarter 2018 Financial Results: FOR IMMEDIATE RELEASE
Investor and Media Contact: James Abbott (801) 844-7637
Zions Bancorporation Reports: 1Q18 Net Earnings¹ of $231 million, diluted EPS of $1.09 |
compared with 1Q17 Net Earnings¹ of $129 million, diluted EPS of $0.61, and 4Q17 Net Earnings¹ of $114 million, diluted EPS of $0.54 |
FIRST QUARTER RESULTS
$1.09 | $231 million | 3.56% | 12.2% | |||
Earnings per diluted common share | Net Earnings 1 | Net interest margin (“NIM”) | Common Equity Tier 1 | |||
FIRST QUARTER HIGHLIGHTS² | ||
Net Interest Income and NIM | • | Net interest income was $542 million, up 11% |
• | NIM was 3.56% compared with 3.38% | |
Operating Performance | • | Pre-provision net revenue ("PPNR") was $273 million, up 27% |
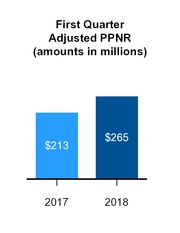
• | Adjusted PPNR³ was $265 million, up 24% | |
• | Noninterest expense was $412 million, compared with $414 million | |
• | Adjusted noninterest expense³ was $419 million, compared with $411 million | |
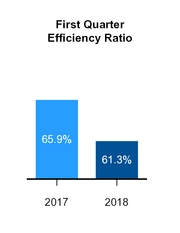
• | Efficiency ratio³ was 61.3%, compared with 65.9% | |
Loans and Credit Quality | • | Net loans and leases were $45.1 billion, up 5% |
• | Classified loans were $1.0 billion, down 30%; and nonperforming assets were $392 million, down 33% | |
• | Provision for credit losses was ($47) million, or $0.17 per share, compared with $18 million; the allowance reduction resulted from the sustained trend in improving credit quality, particularly in the oil and gas-related portfolio, and minimal incurred losses-to-date from Hurricane Harvey | |
• | Annualized net charge-offs were 0.05% of average loans, compared with 0.43% | |
Capital Returns | • | Return on average tangible common equity³ was 15.5%, compared with 8.8% |
• | Common stock repurchases of $115 million, 2.2 million shares, or 1.1% of shares outstanding as of December 31, 2017 | |
• | Common dividend increased to $0.20 per share from $0.08 per share | |
Notable Items | • | Interest income recoveries of $11 million, or $0.04 per share, from four loans in 1Q18 |
• | Effective tax rate declined to 22.7% in 1Q18 from 36.8% for all of 2017 as a result of recent tax reform | |
CEO COMMENTARY |
Harris H. Simmons, Chairman and CEO, commented, “Our first quarter results reflect continued strong positive operating leverage, with the result that adjusted pre-provision net revenue increased 19% over the first quarter of last year, even after excluding the positive impact of unusually large interest recoveries. Credit quality is also strong, as nonperforming assets have declined by a third over the past year, while net loans charged-off during the quarter were a modest 0.05%, annualized, of total loans and leases. Finally, tax reform reduced the effective tax rate to 23% from what has more typically been a rate in the mid-to-low 30% range. Business confidence and economic conditions across the western U.S. are strong, and we are optimistic about the year ahead.” |
OPERATING PERFORMANCE3 |
¹ Net Earnings is net earnings applicable to common shareholders. ² Comparisons noted in the bullet points are calculated for the current quarter versus the same prior-year period, unless otherwise specified. ³ For information on non-GAAP financial measures and why the Company presents these numbers, see pages 16-18. |
- more -
ZIONS BANCORPORATION
Press Release – Page 2
April 23, 2018
Comparisons noted in the sections below are calculated for the current quarter versus the same prior-year period, unless otherwise specified.
RESULTS OF OPERATIONS
Net Interest Income and Margin | |||||||||||||||||||||||||
1Q18 - 4Q17 | 1Q18 - 1Q17 | ||||||||||||||||||||||||
(In millions) | 1Q18 | 4Q17 | 1Q17 | $ | % | $ | % | ||||||||||||||||||
Interest and fees on loans | $ | 497 | $ | 477 | $ | 433 | $ | 20 | 4 | % | $ | 64 | 15 | % | |||||||||||
Interest on money market investments | 6 | 5 | 4 | 1 | 20 | 2 | 50 | ||||||||||||||||||
Interest on securities | 86 | 80 | 78 | 6 | 8 | 8 | 10 | ||||||||||||||||||
Total interest income | 589 | 562 | 515 | 27 | 5 | 74 | 14 | ||||||||||||||||||
Interest on deposits | 20 | 17 | 13 | 3 | 18 | 7 | 54 | ||||||||||||||||||
Interest on short and long-term borrowings | 27 | 19 | 13 | 8 | 42 | 14 | 108 | ||||||||||||||||||
Total interest expense | 47 | 36 | 26 | 11 | 31 | 21 | 81 | ||||||||||||||||||
Net interest income | $ | 542 | $ | 526 | $ | 489 | $ | 16 | 3 | $ | 53 | 11 | |||||||||||||
bps | bps | ||||||||||||||||||||||||
Net interest margin | 3.56 | % | 3.45 | % | 3.38 | % | 11 | 18 | |||||||||||||||||
Net interest income increased to $542 million in the first quarter of 2018 from $489 million. The $53 million, or 11%, increase in net interest income was primarily due to a $64 million increase in interest and fees on loans resulting from loan growth in commercial and consumer loans and increases in short-term interest rates, and an $8 million increase in interest on securities, resulting from a $907 million, or 6%, increase in the size of the average investment securities portfolio. Interest income was positively impacted in the first quarter by interest income recoveries, most notably four commercial loan interest income recoveries of $11 million. Interest expense increased $21 million, primarily due to a $14 million increase in interest on short and long-term borrowings and a $7 million increase in interest on deposits. The interest on short and long-term borrowings was impacted by both larger balances and higher rates.
The net interest margin increased to 3.56% in the first quarter of 2018 compared with 3.45% in the fourth quarter of 2017 and 3.38% in the same prior year period. The expansion of the margin was primarily due to a material expansion of the yield on earnings assets, which increased 31 basis points compared with the first quarter of 2017 and 18 basis compared with the fourth quarter of 2017. Compared with the fourth quarter of 2017, the taxable-equivalent yield on assets increased to 3.87% from 3.69% due to a 21 basis point increase in the average loan yield and an 11 basis point increase in the average securities yield. The decrease in the corporate tax rate from 35% to 21% decreased the taxable-equivalent yield on $3.1 billion of tax-exempt assets, which had a 3 basis point negative impact on the average yield of interest-earning assets. The previously-mentioned interest income recoveries positively impacted the loan yield by approximately 9 basis points and the net interest margin by approximately 7 basis points in the current quarter.
The rate paid on total deposits and interest-bearing liabilities increased 15 basis points from 0.18% for the first quarter of 2017 to 0.33% for the first quarter of 2018, primarily due to an increase in both the amount of interest-bearing liabilities and the rate paid on wholesale funding and deposits. The total cost of deposits for the first quarter of 2018 was 0.15%, compared with 0.13% and 0.10% for the fourth and first quarters of 2017, respectively.
- more -
ZIONS BANCORPORATION
Press Release – Page 3
April 23, 2018
Noninterest Income | |||||||||||||||||||||||||
1Q18 - 4Q17 | 1Q18 - 1Q17 | ||||||||||||||||||||||||
(In millions) | 1Q18 | 4Q17 | 1Q17 | $ | % | $ | % | ||||||||||||||||||
Service charges and fees on deposit accounts | $ | 42 | $ | 44 | $ | 42 | $ | (2 | ) | (5 | )% | $ | — | — | % | ||||||||||
Other service charges, commissions and fees | 55 | 56 | 49 | (1 | ) | (2 | ) | 6 | 12 | ||||||||||||||||
Wealth management and trust income | 12 | 12 | 10 | — | — | 2 | 20 | ||||||||||||||||||
Loan sales and servicing income | 6 | 6 | 7 | — | — | (1 | ) | (14 | ) | ||||||||||||||||
Capital markets and foreign exchange | 8 | 9 | 7 | (1 | ) | (11 | ) | 1 | 14 | ||||||||||||||||
Customer-related fees | 123 | 127 | 115 | (4 | ) | (3 | ) | 8 | 7 | ||||||||||||||||
Dividends and other investment income | 11 | 10 | 12 | 1 | 10 | (1 | ) | (8 | ) | ||||||||||||||||
Securities gains (losses), net | — | — | 5 | — | NM | (5 | ) | (100 | ) | ||||||||||||||||
Other | 4 | 2 | — | 2 | 100 | 4 | NM | ||||||||||||||||||
Total noninterest income | $ | 138 | $ | 139 | $ | 132 | $ | (1 | ) | (1 | ) | $ | 6 | 5 | |||||||||||
Total noninterest income for the first quarter of 2018 increased by $6 million, or 5%, to $138 million from $132 million, primarily due to an $8 million, or 7%, increase in customer-related fees, mainly related to customer interest rate swap management fees, loan syndication fees, wealth management and trust income, and municipal fees. Other noninterest income increased $4 million, primarily due to favorable credit valuations on client-related derivative instruments and net gains on sales of assets. These increases were partially offset by a $5 million decrease in securities gains as a result of increases in the market values of the Company’s Small Business Investment Company (“SBIC”) investments in the prior year period that did not recur in similar magnitudes in the first quarter of 2018.
Noninterest Expense | |||||||||||||||||||||||||
1Q18 - 4Q17 | 1Q18 - 1Q17 | ||||||||||||||||||||||||
(In millions) | 1Q18 | 4Q17 | 1Q17 | $ | % | $ | % | ||||||||||||||||||
Salaries and employee benefits | $ | 269 | $ | 253 | $ | 261 | $ | 16 | 6 | % | $ | 8 | 3 | % | |||||||||||
Occupancy, net | 31 | 29 | 34 | 2 | 7 | (3 | ) | (9 | ) | ||||||||||||||||
Furniture, equipment and software, net | 33 | 34 | 32 | (1 | ) | (3 | ) | 1 | 3 | ||||||||||||||||
Other real estate expense, net | — | — | — | — | NM | — | NM | ||||||||||||||||||
Credit-related expense | 7 | 6 | 7 | 1 | 17 | — | — | ||||||||||||||||||
Provision for unfunded lending commitments | (7 | ) | (1 | ) | (5 | ) | (6 | ) | (600 | ) | (2 | ) | (40 | ) | |||||||||||
Professional and legal services | 12 | 13 | 14 | (1 | ) | (8 | ) | (2 | ) | (14 | ) | ||||||||||||||
Advertising | 5 | 5 | 5 | — | — | — | — | ||||||||||||||||||
FDIC premiums | 13 | 13 | 12 | — | — | 1 | 8 | ||||||||||||||||||
Other | 49 | 65 | 54 | (16 | ) | (25 | ) | (5 | ) | (9 | ) | ||||||||||||||
Total noninterest expense | $ | 412 | $ | 417 | $ | 414 | $ | (5 | ) | (1 | ) | $ | (2 | ) | — | ||||||||||
Adjusted noninterest expense 1 | $ | 419 | $ | 415 | $ | 411 | $ | 4 | 1 | % | $ | 8 | 2 | % | |||||||||||
1 | For information on non-GAAP financial measures, see pages 16-18. |
Noninterest expense for the first quarter of 2018 was $412 million, compared with $414 million for the first quarter of 2017. Salaries and employee benefits increased $8 million primarily due to a $5 million increase in salaries and bonuses. As a result of the recent tax reform, the Company awarded salary increases to employees earning less than $50,000 per year, and committed to pay $1,000 bonuses in late 2018 to employees earning up to $100,000 and employed at the end of 2017. The increase in salary and employee benefits was also impacted by a $4 million increase in employee medical expenses.
- more -
ZIONS BANCORPORATION
Press Release – Page 4
April 23, 2018
Noninterest expense was reduced by slight decreases in occupancy, professional and legal services, and other noninterest expenses. Other noninterest expense during the fourth quarter of 2017 included a $12 million charitable contribution, which was attributable to the passing of the Tax Cut and Jobs Act (“the Act”).
Adjusted noninterest expense for the first quarter of 2018 increased $8 million, or 2%, to $419 million, compared with $411 million for the same prior year period. The main variance between noninterest expense and adjusted noninterest expense for the first quarter of 2018 is the provision for unfunded lending commitments, which was $(7) million, due primarily to continued credit quality improvement. The aforementioned 2% year-over-year increase is in line with our publicly-stated expectations that noninterest expense is likely to experience an increase in the low single-digit percentage range relative to the prior year.
Our efficiency ratio improved to 61.3% in the first quarter of 2018, compared with 61.6% in the fourth quarter of 2017 and 65.9% in the first quarter of 2017, continuing our trend and consistent with our goal of increasing revenue while controlling costs. For information on non-GAAP financial measures, see pages 16-18.
Income Taxes | |||||||||||||
Our income tax rate was 22.7% for the first quarter of 2018, compared with 52.5% for the fourth quarter of 2017 and 24.5% for the first quarter of 2017. The income tax rate for the first quarter of 2018 was positively impacted by the decrease in the corporate federal income tax rate to 21% from 35%, effective January 1, 2018, in addition to a $4 million benefit from the 2017 change in accounting for share-based compensation. The impact of the Act on the net deferred tax asset resulted in a non-cash charge of $47 million through income tax expense during the fourth quarter of 2017. The relatively low first quarter of 2017 tax rate was primarily driven by a one-time $14 million benefit to tax expense related to state tax adjustments, and a $4 million benefit from the implementation of the accounting for share-based compensation.
BALANCE SHEET ANALYSIS
Asset Quality | |||||||||||||||||||||||||
1Q18 - 4Q17 | 1Q18 - 1Q17 | ||||||||||||||||||||||||
(In millions) | 1Q18 | 4Q17 | 1Q17 | bps | bps | ||||||||||||||||||||
Ratio of nonperforming assets to loans and leases and other real estate owned | 0.87 | % | 0.93 | % | 1.37 | % | (6 | ) | (50 | ) | |||||||||||||||
Annualized ratio of net loan and lease charge-offs to average loans | 0.05 | % | 0.11 | % | 0.43 | % | (6 | ) | (38 | ) | |||||||||||||||
Ratio of allowance for loan losses to loans and leases, at period end | 1.05 | % | 1.16 | % | 1.27 | % | (11 | ) | (22 | ) | |||||||||||||||
$ | % | $ | % | ||||||||||||||||||||||
Classified loans | $ | 1,023 | $ | 1,133 | $ | 1,464 | $ | (110 | ) | (10 | )% | $ | (441 | ) | (30 | )% | |||||||||
Nonperforming assets | 392 | 418 | 588 | (26 | ) | (6 | )% | (196 | ) | (33 | )% | ||||||||||||||
Net loan and lease charge-offs | 5 | 12 | 46 | (7 | ) | (58 | )% | (41 | ) | (89 | )% | ||||||||||||||
Provision for credit losses | (47 | ) | (12 | ) | 18 | (35 | ) | (292 | )% | (65 | ) | (361 | )% | ||||||||||||
- more -
ZIONS BANCORPORATION
Press Release – Page 5
April 23, 2018
Asset quality continued to improve for the entire loan portfolio when compared with the prior quarter and the same prior year period, primarily due to improvements in the oil and gas-related portfolio and decreases in overall classified and nonperforming assets. Classified loans and nonperforming assets for the oil and gas-related portfolio decreased $357 million and $206 million, respectively, from the first quarter of 2017.
The Company recorded a $(47) million provision for credit losses during the first quarter of 2018, compared with $(12) million during the fourth quarter of 2017, and $18 million for the first quarter of 2017. The $(47) million provision is primarily the result of improving credit quality in the oil and gas-related portfolio and an additional reduction of the reserve established for Hurricane Harvey in the third quarter of 2017. The allowance for loan losses was $473 million at March 31, 2018, compared with $544 million at March 31, 2017, or 1.05% and 1.27% of loans and leases, respectively.
Loans and Leases | |||||||||||||||||||||||||
1Q18 - 4Q17 | 1Q18 - 1Q17 | ||||||||||||||||||||||||
(In millions) | 1Q18 | 4Q17 | 1Q17 | $ | % | $ | % | ||||||||||||||||||
Loans held for sale | $ | 90 | $ | 44 | $ | 128 | $ | 46 | 105 | % | $ | (38 | ) | (30 | ) | ||||||||||
Loans and leases: | |||||||||||||||||||||||||
Commercial | 23,140 | 22,926 | 21,556 | 214 | 1 | 1,584 | 7 | ||||||||||||||||||
Commercial real estate | 11,122 | 11,124 | 11,206 | (2 | ) | — | (84 | ) | (1 | ) | |||||||||||||||
Consumer | 10,821 | 10,730 | 9,980 | 91 | 1 | 841 | 8 | ||||||||||||||||||
Loans and leases, net of unearned income and fees | 45,083 | 44,780 | 42,742 | 303 | 1 | 2,341 | 5 | ||||||||||||||||||
Less allowance for loan losses | 473 | 518 | 544 | (45 | ) | (9 | ) | (71 | ) | (13 | ) | ||||||||||||||
Loans held for investment, net of allowance | $ | 44,610 | $ | 44,262 | $ | 42,198 | $ | 348 | 1 | $ | 2,412 | 6 | |||||||||||||
Loans and leases, net of unearned income and fees, increased $2.3 billion, or 5%, to $45.1 billion at March 31, 2018 from $42.7 billion at March 31, 2017, predominantly in commercial and industrial loans, which increased 6%, and 1-4 family residential loans, which increased 9%. Commercial real estate loans declined slightly from the prior year, primarily due to payoffs and moderate originations due to active management of credit risk concentrations over the past year. Unfunded lending commitments increased to $21.0 billion at March 31, 2018, compared with $19.4 billion at March 31, 2017.
Deposits | |||||||||||||||||||||||||
1Q18 - 4Q17 | 1Q18 - 1Q17 | ||||||||||||||||||||||||
(In millions) | 1Q18 | 4Q17 | 1Q17 | $ | % | $ | % | ||||||||||||||||||
Noninterest-bearing demand | $ | 23,909 | $ | 23,886 | $ | 24,410 | $ | 23 | — | % | $ | (501 | ) | (2 | )% | ||||||||||
Interest-bearing: | |||||||||||||||||||||||||
Savings and money market | 25,473 | 25,620 | 26,071 | (147 | ) | (1 | ) | (598 | ) | (2 | ) | ||||||||||||||
Time | 3,581 | 3,115 | 2,994 | 466 | 15 | 587 | 20 | ||||||||||||||||||
Total deposits | $ | 52,963 | $ | 52,621 | $ | 53,475 | $ | 342 | 1 | $ | (512 | ) | (1 | ) | |||||||||||
Total deposits decreased by $0.5 billion, or 1%, from $53.5 billion at March 31, 2017. Average total deposits decreased slightly to $52.0 billion for the first quarter of 2018 compared with $52.2 billion for the first quarter of
- more -
ZIONS BANCORPORATION
Press Release – Page 6
April 23, 2018
2017. Average noninterest bearing deposits decreased slightly to $23.4 billion for the first quarter of 2018, compared with $23.5 billion for the first quarter of 2017, and were 45% of average total deposits for both periods.
Shareholders’ Equity | |||||||||||||||||||||||||
1Q18 - 4Q17 | 1Q18 - 1Q17 | ||||||||||||||||||||||||
(In millions) | 1Q18 | 4Q17 | 1Q17 | $ | % | $ | % | ||||||||||||||||||
Shareholders’ equity: | |||||||||||||||||||||||||
Preferred Stock | $ | 566 | $ | 566 | $ | 710 | $ | — | — | % | $ | (144 | ) | (20 | )% | ||||||||||
Common Stock | 4,346 | 4,445 | 4,696 | (99 | ) | (2 | ) | (350 | ) | (7 | ) | ||||||||||||||
Retained earnings | 2,999 | 2,807 | 2,435 | 192 | 7 | 564 | 23 | ||||||||||||||||||
Accumulated other comprehensive income (loss) | (267 | ) | (139 | ) | (111 | ) | (128 | ) | (92 | ) | (156 | ) | (141 | ) | |||||||||||
Total shareholders' equity | $ | 7,644 | $ | 7,679 | $ | 7,730 | $ | (35 | ) | — | $ | (86 | ) | (1 | ) | ||||||||||
During the first quarter of 2018, the Company increased its common stock dividend to $0.20 cents per share from $0.16 cents per share in the fourth quarter of 2017. Common stock repurchases during the current quarter totaled $115 million, or 2.2 million shares, which is equivalent to 1.1% of common stock outstanding as of December 31, 2017. During the last four quarters the Company has repurchased $390 million, or 8.1 million shares, which is equivalent to 4.0% of common stock outstanding as of March 31, 2017. The Company has $120 million of buyback capacity remaining in its 2017 capital plan, which spans the timeframe of July 2017 to June 2018. Weighted average diluted shares decreased by 0.2 million compared with the first quarter of 2017, as repurchased shares more than offset the increased dilutive impact of warrants that have been outstanding since 2008 (“TARP” warrants - NASDAQ: ZIONZ) and 2010 (NASDAQ: ZIONW) and employee equity grants. During the first quarter of 2018, 3.2 million warrants were exercised. As of March 31, 2018, the Company had 2.6 million and 29.3 million warrants outstanding of ZIONZ (TARP) and ZIONW warrants, respectively. The ZIONZ warrants expire on November 14, 2018 and the ZIONW warrants expire on May 22, 2020.
Preferred stock decreased by $144 million from March 31, 2017 to March 31, 2018 as a result of the Company redeeming all outstanding shares of its 7.9% Series F Non-Cumulative Perpetual Preferred Stock during the second quarter of 2017. Preferred dividends are expected to be $34 million for all of 2018.
Tangible book value per common share increased to $30.76 at March 31, 2018, compared with $29.61. Basel III common equity tier 1 (“CET1”) capital was $6.3 billion at March 31, 2018, compared with $6.1 billion at March 31, 2017; the increase was primarily due to an $564 million increase in retained earnings partially offset by the previously mentioned share repurchases. The estimated Basel III CET1 capital ratio was 12.2% at both March 31, 2018 and at March 31, 2017. For information on non-GAAP financial measures, see pages 16-18.
- more -
ZIONS BANCORPORATION
Press Release – Page 7
April 23, 2018
Supplemental Presentation and Conference Call
Zions has posted a supplemental presentation to its website, which will be used to discuss these first quarter results at 5:30 p.m. ET this afternoon (April 23, 2018). Media representatives, analysts, investors, and the public are invited to join this discussion by calling 253-237-1247 (domestic and international) and entering the passcode 7987919, or via on-demand webcast. A link to the webcast will be available on the Zions Bancorporation website at zionsbancorporation.com. The webcast of the conference call will also be archived and available for 30 days.
About Zions Bancorporation
Zions Bancorporation is one of the nation's premier financial services companies with total assets exceeding $65 billion. Zions operates under local management teams and distinct brands in 11 western states: Arizona, California, Colorado, Idaho, Nevada, New Mexico, Oregon, Texas, Utah, Washington and Wyoming. The company is a national leader in Small Business Administration lending and public finance advisory services. In addition, Zions is included in the S&P 500 and NASDAQ Financial 100 indices. Investor information and links to local banking brands can be accessed at zionsbancorporation.com.
Forward-Looking Information
This earnings release includes forward-looking statements within the meaning of Section 21E of the Securities Exchange Act of 1934, as amended, or the Exchange Act. Statements in the earnings release that are based on other than historical information or that express Zions Bancorporation’s expectations regarding future events or determinations are forward-looking within the meaning of the Private Securities Litigation Reform Act of 1995. Forward-looking statements reflect, among other things, our current expectations, all of which are subject to known and unknown risks, uncertainties and other factors that may cause our actual results, performance or achievements, market trends, industry results or regulatory outcomes to differ materially from those expressed or implied by such forward-looking statements.
Without limiting the foregoing, the words “anticipates,” “believes,” “can,” “continue,” “could,” “estimates,” “expects,” “intends,” “may,” “might,” “plans,” “projects,” “should,” “would,” “targets,” “will” and the negative thereof and similar words and expressions are intended to identify forward-looking statements. Forward-looking statements by their nature address matters that are, to different degrees, uncertain, such as statements about future financial and operating results, the potential timing or consummation of the proposed transaction described in the presentation and receipt of regulatory approvals or determinations, or the anticipated benefits thereof, including, without limitation, future financial and operating results. Actual results and outcomes may differ materially from those presented, either expressed or implied, in the presentation. Important risk factors that may cause such material differences include, but are not limited to, the actual amount and duration of declines in the price of oil and gas; Zions’ ability to meet efficiency and noninterest expense goals; the rate of change of interest sensitive assets and liabilities relative to changes in benchmark interest rates; risks and uncertainties related to the ability to obtain shareholder and regulatory approvals or determinations, or the possibility that such approvals or determinations may
- more -
ZIONS BANCORPORATION
Press Release – Page 8
April 23, 2018
be delayed; the imposition by regulators of conditions or requirements that are not favorable to Zions; the ability of Zions Bancorporation to achieve anticipated benefits from the consolidation and regulatory determinations; and legislative, regulatory and economic developments that may diminish or eliminate the anticipated benefits of the consolidation. These risks, as well as other factors, are discussed in Zions Bancorporation’s most recent Annual Report on Form 10-K and Quarterly Report on Form 10-Q, filed with the Securities and Exchange Commission (SEC) and available at the SEC’s Internet site (https://www.sec.gov/), and other risks associated with the proposed transaction will be more fully discussed in the proxy statement that will be filed with the Securities and Exchange Commission in connection with the proposed transaction.
Except as required by law, Zions Bancorporation specifically disclaims any obligation to update any factors or to publicly announce the result of revisions to any of the forward-looking statements included herein to reflect future events or developments.
- more -
ZIONS BANCORPORATION
Press Release – Page 9
April 23, 2018
FINANCIAL HIGHLIGHTS
(Unaudited)
Three Months Ended | |||||||||||||||||||
(In millions, except share, per share, and ratio data) | March 31, 2018 | December 31, 2017 | September 30, 2017 | June 30, 2017 | March 31, 2017 | ||||||||||||||
BALANCE SHEET 1 | |||||||||||||||||||
Loans held for investment, net of allowance | $ | 44,610 | $ | 44,262 | $ | 43,615 | $ | 43,139 | $ | 42,198 | |||||||||
Total assets | 66,481 | 66,288 | 65,564 | 65,446 | 65,463 | ||||||||||||||
Deposits | 52,963 | 52,621 | 52,099 | 52,378 | 53,475 | ||||||||||||||
Total shareholders’ equity | 7,644 | 7,679 | 7,761 | 7,749 | 7,730 | ||||||||||||||
STATEMENT OF INCOME | |||||||||||||||||||
Net earnings applicable to common shareholders | $ | 231 | $ | 114 | $ | 152 | $ | 154 | $ | 129 | |||||||||
Net interest income | 542 | 526 | 522 | 528 | 489 | ||||||||||||||
Taxable-equivalent net interest income 2 | 547 | 535 | 531 | 537 | 497 | ||||||||||||||
Total noninterest income | 138 | 139 | 139 | 132 | 132 | ||||||||||||||
Total noninterest expense | 412 | 417 | 413 | 405 | 414 | ||||||||||||||
Adjusted pre-provision net revenue 2 | 265 | 259 | 251 | 268 | 213 | ||||||||||||||
Provision for loan losses | (40 | ) | (11 | ) | 5 | 7 | 23 | ||||||||||||
Provision for unfunded lending commitments | (7 | ) | (1 | ) | (4 | ) | 3 | (5 | ) | ||||||||||
Provision for credit losses | (47 | ) | (12 | ) | 1 | 10 | 18 | ||||||||||||
SHARE AND PER COMMON SHARE AMOUNTS | |||||||||||||||||||
Net earnings per diluted common share | $ | 1.09 | $ | 0.54 | $ | 0.72 | $ | 0.73 | $ | 0.61 | |||||||||
Dividends | 0.20 | 0.16 | 0.12 | 0.08 | 0.08 | ||||||||||||||
Book value per common share 1 | 35.92 | 36.01 | 36.03 | 35.54 | 34.65 | ||||||||||||||
Tangible book value per common share 1, 2 | 30.76 | 30.87 | 30.93 | 30.50 | 29.61 | ||||||||||||||
Weighted average common and common-equivalent shares outstanding (in thousands) | 210,243 | 209,681 | 209,106 | 208,183 | 210,405 | ||||||||||||||
Common shares outstanding (in thousands) 1 | 197,050 | 197,532 | 199,712 | 202,131 | 202,595 | ||||||||||||||
SELECTED RATIOS AND OTHER DATA | |||||||||||||||||||
Return on average assets | 1.45 | % | 0.74 | % | 0.97 | % | 1.03 | % | 0.88 | % | |||||||||
Return on average common equity | 13.3 | % | 6.3 | % | 8.3 | % | 8.6 | % | 7.5 | % | |||||||||
Tangible return on average tangible common equity 2 | 15.5 | % | 7.4 | % | 9.8 | % | 10.2 | % | 8.8 | % | |||||||||
Net interest margin | 3.56 | % | 3.45 | % | 3.45 | % | 3.52 | % | 3.38 | % | |||||||||
Cost of total deposits, annualized | 0.15 | % | 0.13 | % | 0.12 | % | 0.11 | % | 0.10 | % | |||||||||
Efficiency ratio 2 | 61.3 | % | 61.6 | % | 62.3 | % | 59.8 | % | 65.9 | % | |||||||||
Effective tax rate | 22.7 | % | 52.5 | % | 34.2 | % | 32.3 | % | 24.5 | % | |||||||||
Ratio of nonperforming assets to loans and leases and other real estate owned | 0.87 | % | 0.93 | % | 1.06 | % | 1.12 | % | 1.37 | % | |||||||||
Annualized ratio of net loan and lease charge-offs to average loans | 0.05 | % | 0.11 | % | 0.07 | % | 0.06 | % | 0.43 | % | |||||||||
Ratio of total allowance for credit losses to loans and leases outstanding 1 | 1.16 | % | 1.29 | % | 1.36 | % | 1.39 | % | 1.41 | % | |||||||||
Full-time equivalent employees | 10,122 | 10,083 | 10,041 | 10,074 | 10,004 | ||||||||||||||
CAPITAL RATIOS AND DATA 1 | |||||||||||||||||||
Common equity tier 1 capital | $ | 6,333 | $ | 6,239 | $ | 6,238 | $ | 6,217 | $ | 6,114 | |||||||||
Risk-weighted assets | $ | 51,779 | $ | 51,456 | $ | 51,043 | $ | 50,575 | $ | 50,016 | |||||||||
Tangible common equity ratio | 9.3 | % | 9.3 | % | 9.6 | % | 9.6 | % | 9.3 | % | |||||||||
Common equity tier 1 capital ratio | 12.2 | % | 12.1 | % | 12.2 | % | 12.3 | % | 12.2 | % | |||||||||
Tier 1 leverage ratio | 10.5 | % | 10.5 | % | 10.6 | % | 10.5 | % | 10.8 | % | |||||||||
Tier 1 risk-based capital ratio | 13.3 | % | 13.2 | % | 13.3 | % | 13.4 | % | 13.6 | % | |||||||||
Total risk-based capital ratio | 14.8 | % | 14.8 | % | 15.0 | % | 15.1 | % | 15.3 | % | |||||||||
1 | At period end. |
2 | For information on non-GAAP financial measures, see pages 16-18. |
- more -
ZIONS BANCORPORATION
Press Release – Page 10
April 23, 2018
CONSOLIDATED BALANCE SHEETS
(In millions, shares in thousands) | March 31, 2018 | December 31, 2017 | September 30, 2017 | June 30, 2017 | March 31, 2017 | ||||||||||||||
(Unaudited) | (Unaudited) | (Unaudited) | (Unaudited) | ||||||||||||||||
ASSETS | |||||||||||||||||||
Cash and due from banks | $ | 470 | $ | 548 | $ | 541 | $ | 481 | $ | 566 | |||||||||
Money market investments: | |||||||||||||||||||
Interest-bearing deposits | 717 | 782 | 765 | 1,167 | 1,761 | ||||||||||||||
Federal funds sold and security resell agreements | 696 | 514 | 467 | 427 | 363 | ||||||||||||||
Investment securities: | |||||||||||||||||||
Held-to-maturity, at amortized cost (approximate fair value $752, $762, $743, $774 and $803) | 768 | 770 | 746 | 775 | 815 | ||||||||||||||
Available-for-sale, at fair value | 14,896 | 15,161 | 15,242 | 15,341 | 15,606 | ||||||||||||||
Trading account, at fair value | 143 | 148 | 56 | 61 | 40 | ||||||||||||||
Total investment securities | 15,807 | 16,079 | 16,044 | 16,177 | 16,461 | ||||||||||||||
Loans held for sale | 90 | 44 | 71 | 53 | 128 | ||||||||||||||
Loans and leases, net of unearned income and fees | 45,083 | 44,780 | 44,156 | 43,683 | 42,742 | ||||||||||||||
Less allowance for loan losses | 473 | 518 | 541 | 544 | 544 | ||||||||||||||
Loans held for investment, net of allowance | 44,610 | 44,262 | 43,615 | 43,139 | 42,198 | ||||||||||||||
Other noninterest-bearing investments | 1,073 | 1,029 | 1,008 | 1,012 | 973 | ||||||||||||||
Premises, equipment and software, net | 1,098 | 1,094 | 1,083 | 1,069 | 1,047 | ||||||||||||||
Goodwill and intangibles | 1,016 | 1,016 | 1,017 | 1,019 | 1,021 | ||||||||||||||
Other real estate owned | 5 | 4 | 3 | 4 | 3 | ||||||||||||||
Other assets | 899 | 916 | 950 | 898 | 942 | ||||||||||||||
Total assets | $ | 66,481 | $ | 66,288 | $ | 65,564 | $ | 65,446 | $ | 65,463 | |||||||||
LIABILITIES AND SHAREHOLDERS’ EQUITY | |||||||||||||||||||
Deposits: | |||||||||||||||||||
Noninterest-bearing demand | $ | 23,909 | $ | 23,886 | $ | 24,011 | $ | 24,172 | $ | 24,410 | |||||||||
Interest-bearing: | |||||||||||||||||||
Savings and money market | 25,473 | 25,620 | 25,179 | 25,165 | 26,071 | ||||||||||||||
Time | 3,581 | 3,115 | 2,909 | 3,041 | 2,994 | ||||||||||||||
Total deposits | 52,963 | 52,621 | 52,099 | 52,378 | 53,475 | ||||||||||||||
Federal funds and other short-term borrowings | 4,867 | 4,976 | 4,624 | 4,342 | 3,137 | ||||||||||||||
Long-term debt | 383 | 383 | 383 | 383 | 383 | ||||||||||||||
Reserve for unfunded lending commitments | 51 | 58 | 59 | 63 | 60 | ||||||||||||||
Other liabilities | 573 | 571 | 638 | 531 | 678 | ||||||||||||||
Total liabilities | 58,837 | 58,609 | 57,803 | 57,697 | 57,733 | ||||||||||||||
Shareholders’ equity: | |||||||||||||||||||
Preferred stock, without par value, authorized 4,400 shares | 566 | 566 | 566 | 566 | 710 | ||||||||||||||
Common stock, without par value; authorized 350,000 shares; issued and outstanding 197,050, 197,532, 199,712, 202,131, and 202,595 shares | 4,346 | 4,445 | 4,552 | 4,660 | 4,696 | ||||||||||||||
Retained earnings | 2,999 | 2,807 | 2,700 | 2,572 | 2,435 | ||||||||||||||
Accumulated other comprehensive income (loss) | (267 | ) | (139 | ) | (57 | ) | (49 | ) | (111 | ) | |||||||||
Total shareholders’ equity | 7,644 | 7,679 | 7,761 | 7,749 | 7,730 | ||||||||||||||
Total liabilities and shareholders’ equity | $ | 66,481 | $ | 66,288 | $ | 65,564 | $ | 65,446 | $ | 65,463 | |||||||||
- more -
ZIONS BANCORPORATION
Press Release – Page 11
April 23, 2018
CONSOLIDATED STATEMENTS OF INCOME
(Unaudited)
Three Months Ended | |||||||||||||||||||
(In millions, except share and per share amounts) | March 31, 2018 | December 31, 2017 | September 30, 2017 | June 30, 2017 | March 31, 2017 | ||||||||||||||
Interest income: | |||||||||||||||||||
Interest and fees on loans | $ | 497 | $ | 477 | $ | 468 | $ | 469 | $ | 433 | |||||||||
Interest on money market investments | 6 | 5 | 5 | 5 | 4 | ||||||||||||||
Interest on securities | 86 | 80 | 84 | 84 | 78 | ||||||||||||||
Total interest income | 589 | 562 | 557 | 558 | 515 | ||||||||||||||
Interest expense: | |||||||||||||||||||
Interest on deposits | 20 | 17 | 15 | 14 | 13 | ||||||||||||||
Interest on short- and long-term borrowings | 27 | 19 | 20 | 16 | 13 | ||||||||||||||
Total interest expense | 47 | 36 | 35 | 30 | 26 | ||||||||||||||
Net interest income | 542 | 526 | 522 | 528 | 489 | ||||||||||||||
Provision for loan losses | (40 | ) | (11 | ) | 5 | 7 | 23 | ||||||||||||
Net interest income after provision for loan losses | 582 | 537 | 517 | 521 | 466 | ||||||||||||||
Noninterest income: | |||||||||||||||||||
Service charges and fees on deposit accounts | 42 | 44 | 42 | 43 | 42 | ||||||||||||||
Other service charges, commissions and fees | 55 | 56 | 55 | 56 | 49 | ||||||||||||||
Wealth management and trust income | 12 | 12 | 11 | 10 | 10 | ||||||||||||||
Loan sales and servicing income | 6 | 6 | 6 | 6 | 7 | ||||||||||||||
Capital markets and foreign exchange | 8 | 9 | 8 | 6 | 7 | ||||||||||||||
Customer-related fees | 123 | 127 | 122 | 121 | 115 | ||||||||||||||
Dividends and other investment income | 11 | 10 | 9 | 10 | 12 | ||||||||||||||
Securities gains (losses), net | — | — | 5 | 2 | 5 | ||||||||||||||
Other | 4 | 2 | 3 | (1 | ) | — | |||||||||||||
Total noninterest income | 138 | 139 | 139 | 132 | 132 | ||||||||||||||
Noninterest expense: | |||||||||||||||||||
Salaries and employee benefits | 269 | 253 | 251 | 240 | 261 | ||||||||||||||
Occupancy, net | 31 | 29 | 35 | 32 | 34 | ||||||||||||||
Furniture, equipment and software, net | 33 | 34 | 32 | 32 | 32 | ||||||||||||||
Other real estate expense, net | — | — | (1 | ) | — | — | |||||||||||||
Credit-related expense | 7 | 6 | 7 | 8 | 7 | ||||||||||||||
Provision for unfunded lending commitments | (7 | ) | (1 | ) | (4 | ) | 3 | (5 | ) | ||||||||||
Professional and legal services | 12 | 13 | 15 | 14 | 14 | ||||||||||||||
Advertising | 5 | 5 | 6 | 6 | 5 | ||||||||||||||
FDIC premiums | 13 | 13 | 15 | 13 | 12 | ||||||||||||||
Other | 49 | 65 | 57 | 57 | 54 | ||||||||||||||
Total noninterest expense | 412 | 417 | 413 | 405 | 414 | ||||||||||||||
Income before income taxes | 308 | 259 | 243 | 248 | 184 | ||||||||||||||
Income taxes | 70 | 136 | 83 | 80 | 45 | ||||||||||||||
Net income | 238 | 123 | 160 | 168 | 139 | ||||||||||||||
Preferred stock dividends | (7 | ) | (9 | ) | (8 | ) | (12 | ) | (10 | ) | |||||||||
Preferred stock redemption | — | — | — | (2 | ) | — | |||||||||||||
Net earnings applicable to common shareholders | $ | 231 | $ | 114 | $ | 152 | $ | 154 | $ | 129 | |||||||||
Weighted average common shares outstanding during the period: | |||||||||||||||||||
Basic shares (in thousands) | 196,722 | 198,648 | 200,332 | 201,822 | 202,347 | ||||||||||||||
Diluted shares (in thousands) | 210,243 | 209,681 | 209,106 | 208,183 | 210,405 | ||||||||||||||
Net earnings per common share: | |||||||||||||||||||
Basic | $ | 1.16 | $ | 0.57 | $ | 0.75 | $ | 0.76 | $ | 0.63 | |||||||||
Diluted | 1.09 | 0.54 | 0.72 | 0.73 | 0.61 | ||||||||||||||
- more -
ZIONS BANCORPORATION
Press Release – Page 12
April 23, 2018
Loan Balances Held for Investment by Portfolio Type
(Unaudited)
(In millions) | March 31, 2018 | December 31, 2017 | September 30, 2017 | June 30, 2017 | March 31, 2017 | ||||||||||||||
Commercial: | |||||||||||||||||||
Commercial and industrial | $ | 14,125 | $ | 14,003 | $ | 14,041 | $ | 13,850 | $ | 13,368 | |||||||||
Leasing | 371 | 364 | 343 | 387 | 404 | ||||||||||||||
Owner occupied | 7,345 | 7,288 | 7,082 | 7,095 | 6,973 | ||||||||||||||
Municipal | 1,299 | 1,271 | 1,073 | 871 | 811 | ||||||||||||||
Total commercial | 23,140 | 22,926 | 22,539 | 22,203 | 21,556 | ||||||||||||||
Commercial real estate: | |||||||||||||||||||
Construction and land development | 2,099 | 2,021 | 2,170 | 2,186 | 2,123 | ||||||||||||||
Term | 9,023 | 9,103 | 8,944 | 9,012 | 9,083 | ||||||||||||||
Total commercial real estate | 11,122 | 11,124 | 11,114 | 11,198 | 11,206 | ||||||||||||||
Consumer: | |||||||||||||||||||
Home equity credit line | 2,792 | 2,777 | 2,745 | 2,697 | 2,638 | ||||||||||||||
1-4 family residential | 6,768 | 6,662 | 6,522 | 6,359 | 6,185 | ||||||||||||||
Construction and other consumer real estate | 599 | 597 | 558 | 560 | 517 | ||||||||||||||
Bankcard and other revolving plans | 488 | 509 | 490 | 478 | 459 | ||||||||||||||
Other | 174 | 185 | 188 | 188 | 181 | ||||||||||||||
Total consumer | 10,821 | 10,730 | 10,503 | 10,282 | 9,980 | ||||||||||||||
Loans and leases, net of unearned income and fees | $ | 45,083 | $ | 44,780 | $ | 44,156 | $ | 43,683 | $ | 42,742 | |||||||||
Nonperforming Assets
(Unaudited)
(In millions) | March 31, 2018 | December 31, 2017 | September 30, 2017 | June 30, 2017 | March 31, 2017 | ||||||||||||||
Nonaccrual loans1 | $ | 387 | $ | 414 | $ | 465 | $ | 486 | $ | 585 | |||||||||
Other real estate owned | 5 | 4 | 3 | 4 | 3 | ||||||||||||||
Total nonperforming assets | $ | 392 | $ | 418 | $ | 468 | $ | 490 | $ | 588 | |||||||||
Ratio of nonperforming assets to loans1 and leases and other real estate owned | 0.87 | % | 0.93 | % | 1.06 | % | 1.12 | % | 1.37 | % | |||||||||
Accruing loans past due 90 days or more | $ | 16 | $ | 22 | $ | 30 | $ | 19 | $ | 30 | |||||||||
Ratio of accruing loans past due 90 days or more to loans1 and leases | 0.04 | % | 0.05 | % | 0.07 | % | 0.04 | % | 0.07 | % | |||||||||
Nonaccrual loans and accruing loans past due 90 days or more | $ | 403 | $ | 436 | $ | 495 | $ | 505 | $ | 615 | |||||||||
Ratio of nonaccrual loans and accruing loans past due 90 days or more to loans1 and leases | 0.89 | % | 0.97 | % | 1.12 | % | 1.15 | % | 1.43 | % | |||||||||
Accruing loans past due 30-89 days | $ | 98 | $ | 120 | $ | 99 | $ | 98 | $ | 137 | |||||||||
Restructured loans included in nonaccrual loans | 86 | 87 | 115 | 137 | 131 | ||||||||||||||
Restructured loans on accrual | 143 | 139 | 133 | 167 | 167 | ||||||||||||||
Classified loans | 1,023 | 1,133 | 1,248 | 1,317 | 1,464 | ||||||||||||||
1 Includes loans held for sale.
- more -
ZIONS BANCORPORATION
Press Release – Page 13
April 23, 2018
Allowance for Credit Losses
(Unaudited)
Three Months Ended | |||||||||||||||||||
(In millions) | March 31, 2018 | December 31, 2017 | September 30, 2017 | June 30, 2017 | March 31, 2017 | ||||||||||||||
Allowance for Loan Losses | |||||||||||||||||||
Balance at beginning of period | $ | 518 | $ | 541 | $ | 544 | $ | 544 | $ | 567 | |||||||||
Additions: | |||||||||||||||||||
Provision for losses | (40 | ) | (11 | ) | 5 | 7 | 23 | ||||||||||||
Deductions: | |||||||||||||||||||
Gross loan and lease charge-offs | (26 | ) | (27 | ) | (25 | ) | (35 | ) | (57 | ) | |||||||||
Recoveries | 21 | 15 | 17 | 28 | 11 | ||||||||||||||
Net loan and lease charge-offs | (5 | ) | (12 | ) | (8 | ) | (7 | ) | (46 | ) | |||||||||
Balance at end of period | $ | 473 | $ | 518 | $ | 541 | $ | 544 | $ | 544 | |||||||||
Ratio of allowance for loan losses to loans1 and leases, at period end | 1.05 | % | 1.16 | % | 1.23 | % | 1.25 | % | 1.27 | % | |||||||||
Ratio of allowance for loan losses to nonaccrual loans1 at period end | 131 | % | 129 | % | 120 | % | 115 | % | 99 | % | |||||||||
Annualized ratio of net loan and lease charge-offs to average loans | 0.05 | % | 0.11 | % | 0.07 | % | 0.06 | % | 0.43 | % | |||||||||
Reserve for Unfunded Lending Commitments | |||||||||||||||||||
Balance at beginning of period | $ | 58 | $ | 59 | $ | 63 | $ | 60 | $ | 65 | |||||||||
Provision charged (credited) to earnings | (7 | ) | (1 | ) | (4 | ) | 3 | (5 | ) | ||||||||||
Balance at end of period | $ | 51 | $ | 58 | $ | 59 | $ | 63 | $ | 60 | |||||||||
Total Allowance for Credit Losses | |||||||||||||||||||
Allowance for loan losses | $ | 473 | $ | 518 | $ | 541 | $ | 544 | $ | 544 | |||||||||
Reserve for unfunded lending commitments | 51 | 58 | 59 | 63 | 60 | ||||||||||||||
Total allowance for credit losses | $ | 524 | $ | 576 | $ | 600 | $ | 607 | $ | 604 | |||||||||
Ratio of total allowance for credit losses to loans1 and leases outstanding, at period end | 1.16 | % | 1.29 | % | 1.36 | % | 1.39 | % | 1.41 | % | |||||||||
1 Does not include loans held for sale.
- more -
ZIONS BANCORPORATION
Press Release – Page 14
April 23, 2018
Nonaccrual Loans by Portfolio Type
(Unaudited)
(In millions) | March 31, 2018 | December 31, 2017 | September 30, 2017 | June 30, 2017 | March 31, 2017 | ||||||||||||||
Loans held for sale | $ | 26 | $ | 12 | $ | 13 | $ | 12 | $ | 34 | |||||||||
Commercial: | |||||||||||||||||||
Commercial and industrial | $ | 140 | $ | 195 | $ | 257 | $ | 278 | $ | 358 | |||||||||
Leasing | 8 | 8 | 8 | 10 | 13 | ||||||||||||||
Owner occupied | 80 | 90 | 85 | 86 | 89 | ||||||||||||||
Municipal | 1 | 1 | 1 | 1 | 1 | ||||||||||||||
Total commercial | 229 | 294 | 351 | 375 | 461 | ||||||||||||||
Commercial real estate: | |||||||||||||||||||
Construction and land development | 5 | 4 | 6 | 6 | 7 | ||||||||||||||
Term | 57 | 36 | 41 | 37 | 38 | ||||||||||||||
Total commercial real estate | 62 | 40 | 47 | 43 | 45 | ||||||||||||||
Consumer: | |||||||||||||||||||
Home equity credit line | 14 | 13 | 11 | 11 | 9 | ||||||||||||||
1-4 family residential | 54 | 55 | 40 | 43 | 35 | ||||||||||||||
Construction and other consumer real estate | 1 | — | 1 | 1 | 1 | ||||||||||||||
Bankcard and other revolving plans | 1 | — | 1 | — | — | ||||||||||||||
Other | — | — | 1 | 1 | — | ||||||||||||||
Total consumer | 70 | 68 | 54 | 56 | 45 | ||||||||||||||
Total nonaccrual loans | $ | 387 | $ | 414 | $ | 465 | $ | 486 | $ | 585 | |||||||||
Net Charge-Offs by Portfolio Type
(Unaudited)
(In millions) | March 31, 2018 | December 31, 2017 | September 30, 2017 | June 30, 2017 | March 31, 2017 | ||||||||||||||
Commercial: | |||||||||||||||||||
Commercial and industrial | $ | — | $ | 10 | $ | 4 | $ | 11 | $ | 45 | |||||||||
Leasing | 1 | — | — | — | — | ||||||||||||||
Owner occupied | 1 | — | — | 2 | 1 | ||||||||||||||
Municipal | — | — | — | — | — | ||||||||||||||
Total commercial | 2 | 10 | 4 | 13 | 46 | ||||||||||||||
Commercial real estate: | |||||||||||||||||||
Construction and land development | (2 | ) | — | — | (8 | ) | (2 | ) | |||||||||||
Term | — | 1 | 2 | — | 1 | ||||||||||||||
Total commercial real estate | (2 | ) | 1 | 2 | (8 | ) | (1 | ) | |||||||||||
Consumer: | |||||||||||||||||||
Home equity credit line | 1 | — | — | 1 | (1 | ) | |||||||||||||
1-4 family residential | 2 | (1 | ) | 1 | — | (1 | ) | ||||||||||||
Construction and other consumer real estate | — | (1 | ) | — | — | — | |||||||||||||
Bankcard and other revolving plans | 2 | 2 | — | 1 | 3 | ||||||||||||||
Other | — | 1 | 1 | — | — | ||||||||||||||
Total consumer loans | 5 | 1 | 2 | 2 | 1 | ||||||||||||||
Total net charge-offs | $ | 5 | $ | 12 | $ | 8 | $ | 7 | $ | 46 | |||||||||
- more -
ZIONS BANCORPORATION
Press Release – Page 15
April 23, 2018
CONSOLIDATED AVERAGE BALANCE SHEETS, YIELDS AND RATES
(Unaudited)
Three Months Ended | ||||||||||||||||||||
March 31, 2018 | December 31, 2017 | March 31, 2017 | ||||||||||||||||||
(In millions) | Average balance | Average yield/rate 1 | Average balance | Average yield/rate 1 | Average balance | Average yield/rate 1 | ||||||||||||||
ASSETS | ||||||||||||||||||||
Money market investments | $ | 1,495 | 1.70 | % | $ | 1,363 | 1.50 | % | $ | 1,983 | 0.93 | % | ||||||||
Securities: | ||||||||||||||||||||
Held-to-maturity | 789 | 3.54 | % | 719 | 3.99 | % | 847 | 3.90 | % | |||||||||||
Available-for-sale | 14,948 | 2.18 | % | 15,008 | 2.04 | % | 14,024 | 2.14 | % | |||||||||||
Trading account | 102 | 4.00 | % | 72 | 4.11 | % | 61 | 3.75 | % | |||||||||||
Total securities | 15,839 | 2.25 | % | 15,799 | 2.14 | % | 14,932 | 2.24 | % | |||||||||||
Loans held for sale | 51 | 3.94 | % | 64 | 4.16 | % | 132 | 3.22 | % | |||||||||||
Loans held for investment 2: | ||||||||||||||||||||
Commercial | 23,040 | 4.70 | % | 22,698 | 4.40 | % | 21,606 | 4.22 | % | |||||||||||
Commercial real estate | 11,065 | 4.67 | % | 11,070 | 4.54 | % | 11,241 | 4.27 | % | |||||||||||
Consumer | 10,759 | 3.94 | % | 10,574 | 3.84 | % | 9,719 | 3.82 | % | |||||||||||
Total loans held for investment | 44,864 | 4.51 | % | 44,342 | 4.30 | % | 42,566 | 4.14 | % | |||||||||||
Total interest-earning assets | 62,249 | 3.87 | % | 61,568 | 3.69 | % | 59,613 | 3.56 | % | |||||||||||
Cash and due from banks | 592 | 613 | 974 | |||||||||||||||||
Allowance for loan losses | (523 | ) | (539 | ) | (566 | ) | ||||||||||||||
Goodwill and intangibles | 1,016 | 1,017 | 1,022 | |||||||||||||||||
Other assets | 3,032 | 3,038 | 2,952 | |||||||||||||||||
Total assets | $ | 66,366 | $ | 65,697 | $ | 63,995 | ||||||||||||||
LIABILITIES AND SHAREHOLDERS’ EQUITY | ||||||||||||||||||||
Interest-bearing deposits: | ||||||||||||||||||||
Savings and money market | $ | 25,296 | 0.19 | % | $ | 25,272 | 0.17 | % | $ | 25,896 | 0.14 | % | ||||||||
Time | 3,280 | 1.00 | % | 3,023 | 0.81 | % | 2,856 | 0.59 | % | |||||||||||
Total interest-bearing deposits | 28,576 | 0.28 | % | 28,295 | 0.23 | % | 28,752 | 0.19 | % | |||||||||||
Borrowed funds: | ||||||||||||||||||||
Federal funds and other short-term borrowings | 5,707 | 1.54 | % | 4,527 | 1.26 | % | 2,924 | 0.71 | % | |||||||||||
Long-term debt | 383 | 5.83 | % | 383 | 5.71 | % | 521 | 5.92 | % | |||||||||||
Total borrowed funds | 6,090 | 1.81 | % | 4,910 | 1.60 | % | 3,445 | 1.50 | % | |||||||||||
Total interest-bearing liabilities | 34,666 | 0.55 | % | 33,205 | 0.44 | % | 32,197 | 0.33 | % | |||||||||||
Noninterest-bearing deposits | 23,417 | 24,038 | 23,460 | |||||||||||||||||
Total deposits and interest-bearing liabilities | 58,083 | 0.33 | % | 57,243 | 0.25 | % | 55,657 | 0.18 | % | |||||||||||
Other liabilities | 656 | 668 | 632 | |||||||||||||||||
Total liabilities | 58,739 | 57,911 | 56,289 | |||||||||||||||||
Shareholders’ equity: | ||||||||||||||||||||
Preferred equity | 566 | 566 | 710 | |||||||||||||||||
Common equity | 7,061 | 7,220 | 6,996 | |||||||||||||||||
Total shareholders’ equity | 7,627 | 7,786 | 7,706 | |||||||||||||||||
Total liabilities and shareholders’ equity | $ | 66,366 | $ | 65,697 | $ | 63,995 | ||||||||||||||
Spread on average interest-bearing funds | 3.32 | % | 3.25 | % | 3.23 | % | ||||||||||||||
Net yield on interest-earning assets | 3.56 | % | 3.45 | % | 3.38 | % | ||||||||||||||
1 Rates are calculated using amounts in thousands and taxable-equivalent rates used where applicable. The taxable-equivalent rates used are the rates that were applicable at the time of each respective reporting period.
2 Net of unearned income and fees, net of related costs. Loans include nonaccrual and restructured loans.
- more -
ZIONS BANCORPORATION
Press Release – Page 16
April 23, 2018
GAAP to Non-GAAP Reconciliations
(Unaudited)
This press release presents non-GAAP financial measures, in addition to GAAP financial measures, to provide investors with additional information. The adjustments to reconcile from the applicable GAAP financial measures to the non-GAAP financial measures are presented in the following schedules. The Company considers these adjustments to be relevant to ongoing operating results and provide a meaningful base for period-to-period and company-to-company comparisons. These non-GAAP financial measures are used by management to assess the performance and financial position of the Company and for presentations of Company performance to investors. The Company further believes that presenting these non-GAAP financial measures will permit investors to assess the performance of the Company on the same basis as that applied by management.
Non-GAAP financial measures have inherent limitations, and are not required to be uniformly applied by individual entities. Although non-GAAP financial measures are frequently used by stakeholders to evaluate a company, they have limitations as an analytical tool and should not be considered in isolation or as a substitute for analysis of results reported under GAAP.
The following are non-GAAP financial measures presented in this press release and a discussion of why management uses these non-GAAP measures:
Tangible Book Value per Common Share – this schedule also includes “tangible common equity.” Tangible book value per common share is a non-GAAP financial measure that management believes provides additional useful information about the level of tangible equity in relation to outstanding shares of common stock. Management believes the use of ratios that utilize tangible equity provides additional useful information because they present measures of those assets that can generate income.
Return on Average Tangible Common Equity – this schedule also includes “net earnings applicable to common shareholders, excluding the effects of the adjustments, net of tax” and “average tangible common equity.” Return on average tangible common equity is a non-GAAP financial measure that management believes provides useful information about the Company’s use of shareholders’ equity. Management believes the use of ratios that utilize tangible equity provides additional useful information because they present measures of those assets that can generate income.
Efficiency Ratio – this schedule also includes “adjusted noninterest expense,” “taxable-equivalent net interest income,” “adjusted taxable-equivalent revenue,” and “adjusted pre-provision net revenue (“PPNR”).” The methodology of determining the efficiency ratio may differ among companies. Management makes adjustments to exclude certain items as identified in the subsequent schedules which it believes allows for more consistent comparability among periods. Management believes the efficiency ratio provides useful information regarding the cost of generating revenue. Adjusted noninterest expense provides a measure as to how well the Company is managing its expenses, and adjusted PPNR enables management and others to assess the Company’s ability to generate capital to cover credit losses through a credit cycle. Taxable-equivalent net interest income allows management to assess the comparability of revenue arising from both taxable and tax-exempt sources.
- more -
ZIONS BANCORPORATION
Press Release – Page 17
April 23, 2018
GAAP to Non-GAAP Reconciliations
(Unaudited)
(In millions, except shares and per share amounts) | March 31, 2018 | December 31, 2017 | September 30, 2017 | June 30, 2017 | March 31, 2017 | |||||||||||||||
Tangible Book Value per Common Share | ||||||||||||||||||||
Total shareholders’ equity (GAAP) | $ | 7,644 | $ | 7,679 | $ | 7,761 | $ | 7,749 | $ | 7,730 | ||||||||||
Preferred stock | (566 | ) | (566 | ) | (566 | ) | (566 | ) | (710 | ) | ||||||||||
Goodwill and intangibles | (1,016 | ) | (1,016 | ) | (1,017 | ) | (1,019 | ) | (1,021 | ) | ||||||||||
Tangible common equity (non-GAAP) | (a) | $ | 6,062 | $ | 6,097 | $ | 6,178 | $ | 6,164 | $ | 5,999 | |||||||||
Common shares outstanding (in thousands) | (b) | 197,050 | 197,532 | 199,712 | 202,131 | 202,595 | ||||||||||||||
Tangible book value per common share (non-GAAP) | (a/b) | $ | 30.76 | $ | 30.87 | $ | 30.93 | $ | 30.50 | $ | 29.61 | |||||||||
Three Months Ended | ||||||||||||||||||||
(Dollar amounts in millions) | March 31, 2018 | December 31, 2017 | September 30, 2017 | June 30, 2017 | March 31, 2017 | |||||||||||||||
Return on Average Tangible Common Equity | ||||||||||||||||||||
Net earnings applicable to common shareholders (GAAP) | $ | 231 | $ | 114 | $ | 152 | $ | 154 | $ | 129 | ||||||||||
Adjustments, net of tax: | ||||||||||||||||||||
Amortization of core deposit and other intangibles | — | 1 | 1 | 1 | 1 | |||||||||||||||
Net earnings applicable to common shareholders, excluding the effects of the adjustments, net of tax (non-GAAP) | (a) | $ | 231 | $ | 115 | $ | 153 | $ | 155 | $ | 130 | |||||||||
Average common equity (GAAP) | $ | 7,061 | $ | 7,220 | $ | 7,230 | $ | 7,143 | $ | 6,996 | ||||||||||
Average goodwill and intangibles | (1,016 | ) | (1,017 | ) | (1,018 | ) | (1,020 | ) | (1,022 | ) | ||||||||||
Average tangible common equity (non-GAAP) | (b) | $ | 6,045 | $ | 6,203 | $ | 6,212 | $ | 6,123 | $ | 5,974 | |||||||||
Number of days in quarter | (c) | 90 | 92 | 92 | 91 | 90 | ||||||||||||||
Number of days in year | (d) | 365 | 365 | 365 | 365 | 365 | ||||||||||||||
Return on average tangible common equity (non-GAAP) | (a/b/c)*d | 15.5 | % | 7.4 | % | 9.8 | % | 10.2 | % | 8.8 | % | |||||||||
- more -
ZIONS BANCORPORATION
Press Release – Page 18
April 23, 2018
GAAP to Non-GAAP Reconciliations
(Unaudited)
Three Months Ended | ||||||||||||||||||||
(In millions) | March 31, 2018 | December 31, 2017 | September 30, 2017 | June 30, 2017 | March 31, 2017 | |||||||||||||||
Efficiency Ratio | ||||||||||||||||||||
Noninterest expense (GAAP) | (a) | $ | 412 | $ | 417 | $ | 413 | $ | 405 | $ | 414 | |||||||||
Adjustments: | ||||||||||||||||||||
Severance costs | — | 1 | 1 | — | 5 | |||||||||||||||
Other real estate expense | — | — | (1 | ) | — | — | ||||||||||||||
Provision for unfunded lending commitments | (7 | ) | (1 | ) | (4 | ) | 3 | (5 | ) | |||||||||||
Amortization of core deposit and other intangibles | — | 1 | 2 | 2 | 2 | |||||||||||||||
Restructuring costs | — | 1 | 1 | 1 | 1 | |||||||||||||||
Total adjustments | (b) | (7 | ) | 2 | (1 | ) | 6 | 3 | ||||||||||||
Adjusted noninterest expense (non-GAAP) | (a-b)=(c) | $ | 419 | $ | 415 | $ | 414 | $ | 399 | $ | 411 | |||||||||
Net interest income (GAAP) | (d) | $ | 542 | $ | 526 | $ | 522 | $ | 528 | $ | 489 | |||||||||
Fully taxable-equivalent adjustments | (e) | 5 | 9 | 9 | 9 | 8 | ||||||||||||||
Taxable-equivalent net interest income (non-GAAP) | (d+e)=(f) | 547 | 535 | 531 | 537 | 497 | ||||||||||||||
Noninterest income (GAAP) | (g) | 138 | 139 | 139 | 132 | 132 | ||||||||||||||
Combined income (non-GAAP) | (f+g)=(h) | 685 | 674 | 670 | 669 | 629 | ||||||||||||||
Adjustments: | ||||||||||||||||||||
Fair value and nonhedge derivative income | 1 | — | — | — | — | |||||||||||||||
Securities gains (losses), net | — | — | 5 | 2 | 5 | |||||||||||||||
Total adjustments | (i) | 1 | — | 5 | 2 | 5 | ||||||||||||||
Adjusted taxable-equivalent revenue (non-GAAP) | (h-i)=(j) | $ | 684 | $ | 674 | $ | 665 | $ | 667 | $ | 624 | |||||||||
Pre-provision net revenue (PPNR) | (h)-(a) | $ | 273 | $ | 257 | $ | 257 | $ | 264 | $ | 215 | |||||||||
Adjusted PPNR (non-GAAP) | (j-c) | 265 | 259 | 251 | 268 | 213 | ||||||||||||||
Efficiency ratio (non-GAAP) | (c/j) | 61.3 | % | 61.6 | % | 62.3 | % | 59.8 | % | 65.9 | % | |||||||||
# # #