Attached files
| file | filename |
|---|---|
| EX-99.1 - EXHIBIT 99.1 - IBERIABANK CORP | a8-k41918strategicgoalsxdo.htm |
| 8-K - 8-K - IBERIABANK CORP | a8-k41918strategicgoalsxco.htm |
2020 Strategic Goals
2 0 1 8
S u s t a i n a b l e , P r o f i t a b l e G r o w t h
Exhibit 99.2
Forward-Looking Statements And
Non-GAAP Financial Measures
2
To the extent that statements in this PowerPoint presentation relate to future plans, objectives, financial results or
performance of IBERIABANK Corporation, these statements are deemed to be forward-looking statements within the meaning of the
Private Securities Litigation Reform Act of 1995. Such statements, which are based on management’s current information, estimates
and assumptions and the current economic environment, are generally identified by the use of the words “plan”, “believe”, “expect”,
“intend”, “anticipate”, “estimate”, “project” or similar expressions. The Company’s actual strategies, results and financial condition in
future periods may differ materially from those currently expected due to various risks and uncertainties. Forward-looking statements
are subject to numerous assumptions, risks and uncertainties that change over time and could cause actual results or financial
condition to differ materially from those expressed in or implied by such statements. Consequently, no forward-looking statement
can be guaranteed. Except to the extent required by applicable law or regulation, the Company undertakes no obligation to revise or
update publicly any forward-looking statement for any reason.
This PowerPoint presentation contains financial information determined by methods other than in accordance with GAAP.
The Company’s management uses these non-GAAP financial measures in their analysis of the Company’s performance. These
measures typically adjust GAAP performance measures to exclude the effects of the amortization of intangibles and include the tax
benefit associated with revenue items that are tax-exempt, as well as adjust income available to common shareholders for certain
significant activities or transactions that in management’s opinion can distort period-to-period comparisons of the Company’s
performance. Since the presentation of these GAAP performance measures and their impact differ between companies, management
believes presentations of these non-GAAP financial measures provide useful supplemental information that is essential to a proper
understanding of the operating results of the Company’s core businesses. These non-GAAP disclosures should not be viewed as a
substitute for operating results determined in accordance with GAAP, nor are they necessarily comparable to non-GAAP performance
measures that may be presented by other companies. Reconciliations of GAAP to non-GAAP disclosures are included as tables in the
Company’s press release dated April 19, 2018 and Annual Report on Form 10-K for the fiscal year ended December 31, 2017. Refer to
the supplemental tables in the press release and Annual Report for these reconciliations.
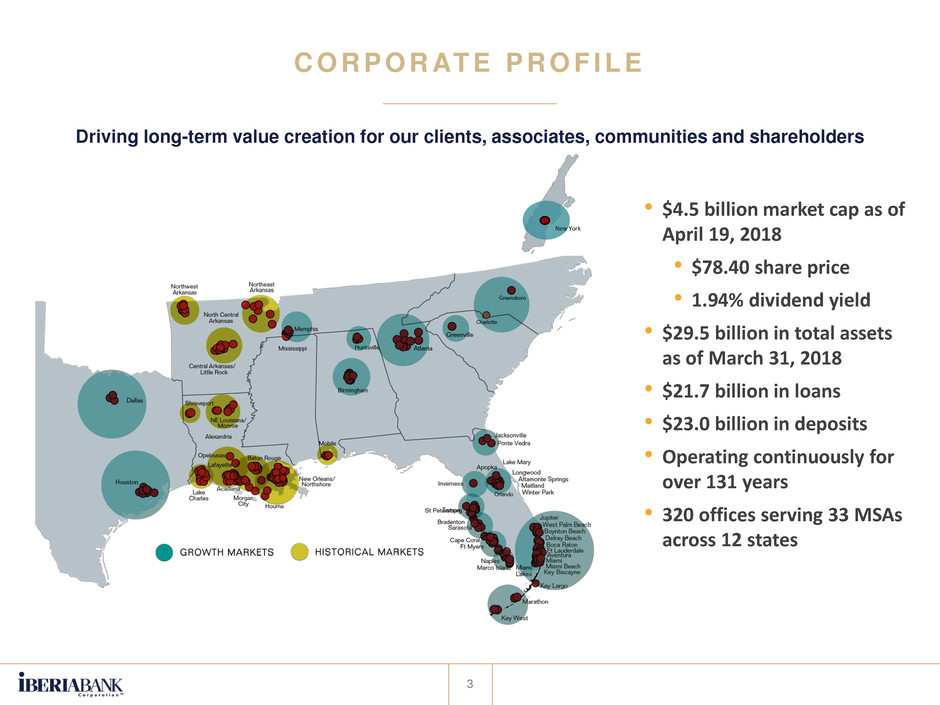
Driving long-term value creation for our clients, associates, communities and shareholders
C O R P O R AT E P R O F I L E
3
New York
• $4.5 billion market cap as of
April 19, 2018
• $78.40 share price
• 1.94% dividend yield
• $29.5 billion in total assets
as of March 31, 2018
• $21.7 billion in loans
• $23.0 billion in deposits
• Operating continuously for
over 131 years
• 320 offices serving 33 MSAs
across 12 states
4
IBERIABANK’s Mission Statement
• Provide exceptional value-based client
services
• Great place to work
• Growth that is consistent with high
performance
• Shareholder-focused
• Strong sense of community
IBERIABANK’s Strategy
• Relationship-driven commercial and
private banking business
• Market-centric, people-driven approach
in attractive Southeastern markets
• Building long-term A-list client
relationships through service and care
• “Branch-lite” delivery model with focus
on operating efficiency
• Diversification across asset classes,
business lines and geographies
C O R P O R AT E P R O F I L E
Driving long-term value creation for our clients, associates, communities and shareholders
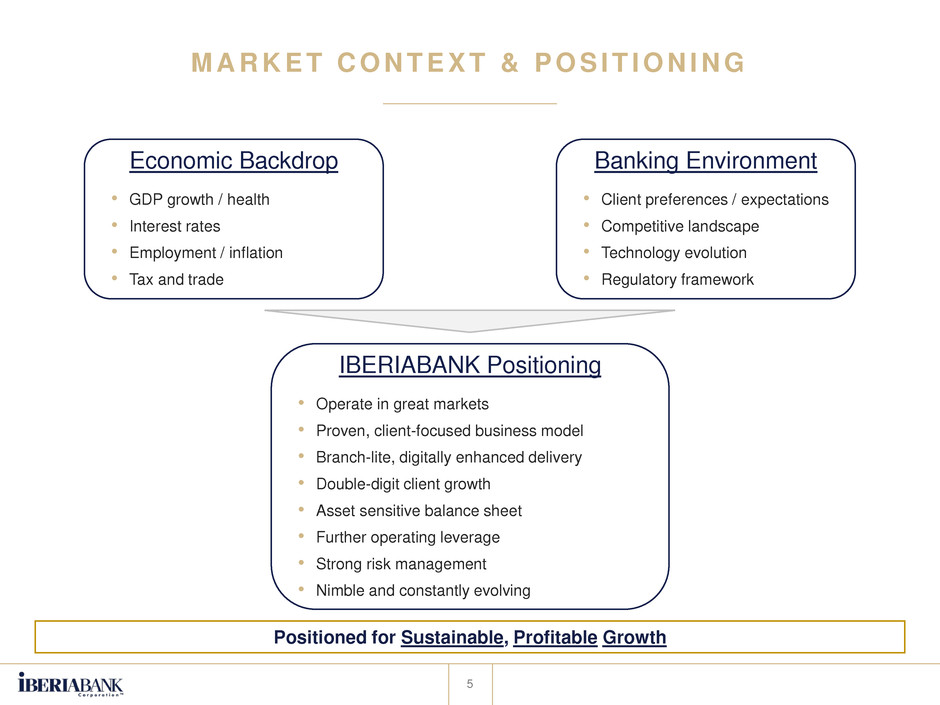
M A R K E T C O N T E X T & P O S I T I O N I N G
5
Economic Backdrop
Positioned for Sustainable, Profitable Growth
Banking Environment
• GDP growth / health
• Interest rates
• Employment / inflation
• Tax and trade
• Client preferences / expectations
• Competitive landscape
• Technology evolution
• Regulatory framework
IBERIABANK Positioning
• Operate in great markets
• Proven, client-focused business model
• Branch-lite, digitally enhanced delivery
• Double-digit client growth
• Asset sensitive balance sheet
• Further operating leverage
• Strong risk management
• Nimble and constantly evolving
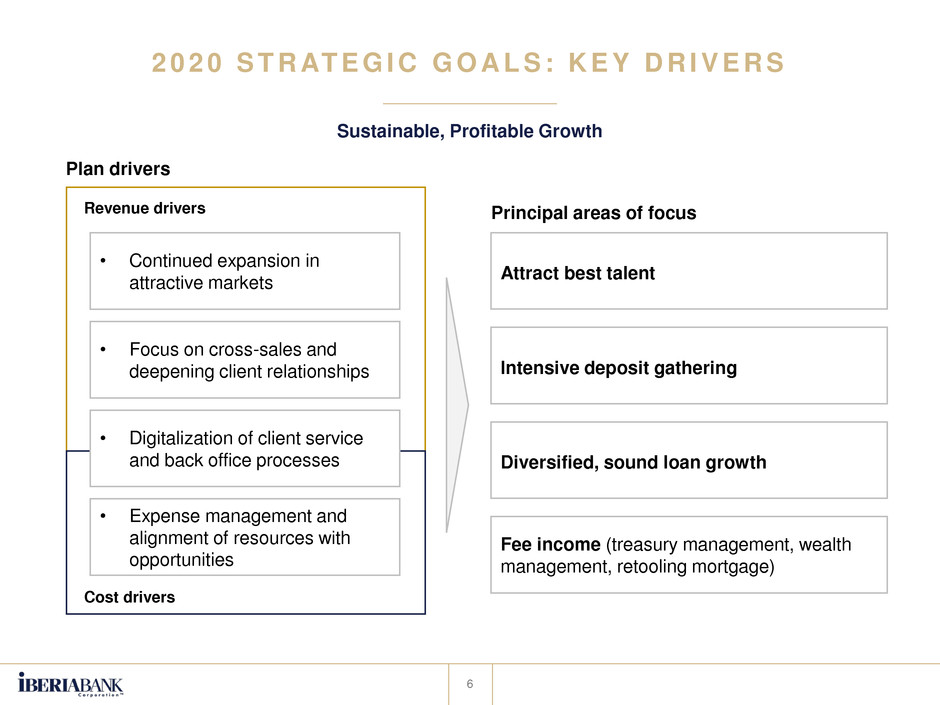
2 0 2 0 S T R AT E G I C G O A L S : K E Y D R I V E R S
6
Revenue drivers
Cost drivers
• Continued expansion in
attractive markets
• Focus on cross-sales and
deepening client relationships
• Digitalization of client service
and back office processes
• Expense management and
alignment of resources with
opportunities
Plan drivers
Principal areas of focus
Fee income (treasury management, wealth
management, retooling mortgage)
Diversified, sound loan growth
Intensive deposit gathering
Attract best talent
Sustainable, Profitable Growth
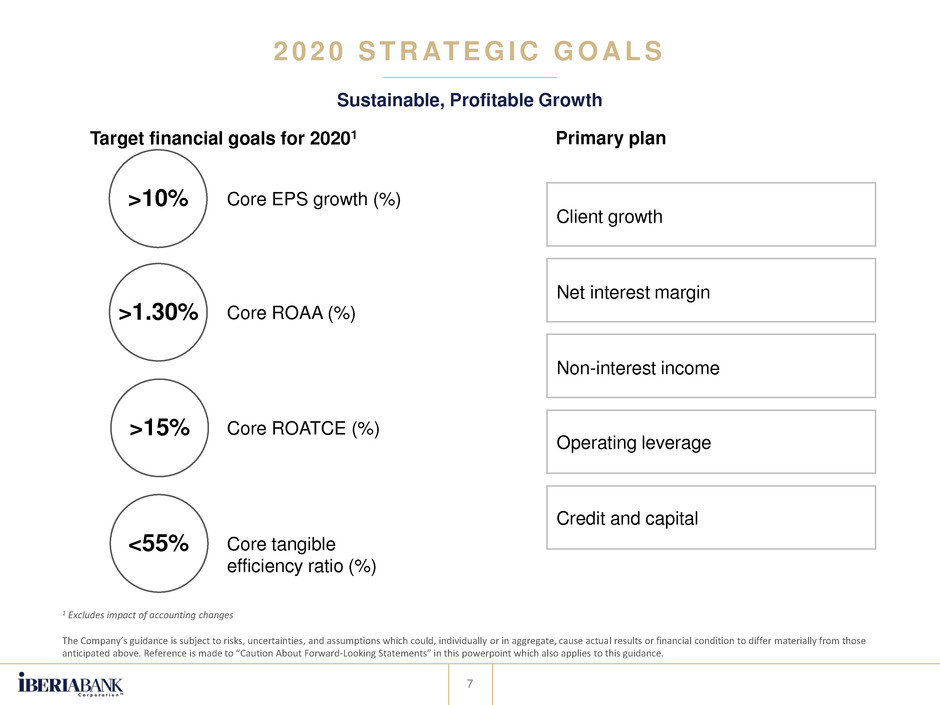
>1.30% Core ROAA (%)
2 0 2 0 S T R AT E G I C G O A L S
7
>15%
<55%
Primary planTarget financial goals for 20201
Core ROATCE (%)
Core tangible
efficiency ratio (%)
Sustainable, Profitable Growth
>10% Core EPS growth (%)
Operating leverage
Non-interest income
Net interest margin
Client growth
Credit and capital
1 Excludes impact of accounting changes
The Company’s guidance is subject to risks, uncertainties, and assumptions which could, individually or in aggregate, cause actual results or financial condition to differ materially from those
anticipated above. Reference is made to “Caution About Forward-Looking Statements” in this powerpoint which also applies to this guidance.
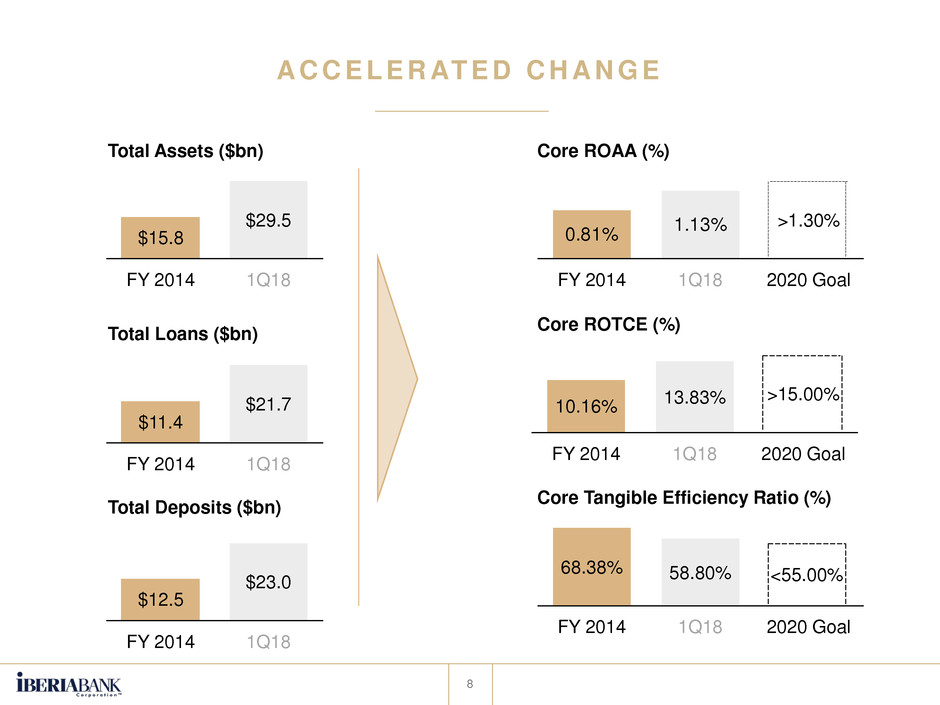
A C C E L E R AT E D C H A N G E
8
1Q18
$29.5
FY 2014
$15.8
Total Assets ($bn)
Total Loans ($bn)
Total Deposits ($bn)
0.81%
1.13%
1Q18FY 2014
>1.30%
2020 Goal
Core ROAA (%)
1Q18
13.83%
FY 2014
10.16%
2020 Goal
>15.00%
Core ROTCE (%)
1Q18
58.80%
FY 2014
68.38%
2020 Goal
<55.00%
Core Tangible Efficiency Ratio (%)
1Q18
$21.7
FY 2014
$11.4
1Q18
$23.0
FY 2014
$12.5
