Attached files
| file | filename |
|---|---|
| EX-32.2 - EX-32.2 - Destination Maternity Corp | dest-ex322_8.htm |
| EX-32.1 - EX-32.1 - Destination Maternity Corp | dest-ex321_12.htm |
| EX-31.2 - EX-31.2 - Destination Maternity Corp | dest-ex312_7.htm |
| EX-31.1 - EX-31.1 - Destination Maternity Corp | dest-ex311_11.htm |
| EX-23 - EX-23 - Destination Maternity Corp | dest-ex23_6.htm |
| EX-21 - EX-21 - Destination Maternity Corp | dest-ex21_286.htm |
| EX-10.47 - EX-10.47 - Destination Maternity Corp | dest-ex1047_241.htm |
| EX-3.2 - EX-3.2 - Destination Maternity Corp | dest-ex32_10.htm |
UNITED STATES
SECURITIES AND EXCHANGE COMMISSION
Washington, D.C. 20549
FORM 10-K
(Mark One)
|
☒ |
ANNUAL REPORT PURSUANT TO SECTION 13 OR 15(d) OF THE SECURITIES EXCHANGE ACT OF 1934 |
For the fiscal year ended February 3, 2018
or
|
☐ |
TRANSITION REPORT PURSUANT TO SECTION 13 OR 15(d) OF THE SECURITIES EXCHANGE ACT OF 1934 |
For the transition period from to
Commission file number 0-21196
Destination Maternity Corporation
(Exact name of Registrant as specified in its charter)
|
Delaware |
|
13-3045573 |
|
(State or other jurisdiction |
|
(IRS Employer |
|
|
|
|
|
232 Strawbridge Drive Moorestown, New Jersey |
|
08057 |
|
(Address of principal executive offices) |
|
(Zip Code) |
(856) 291-9700
(Registrant’s telephone number, including area code)
Securities registered pursuant to Section 12(b) of the Act:
|
Title of each class |
|
Name of each exchange on which registered |
|
Common Stock, par value $.01 per share |
|
The NASDAQ Stock Market LLC |
Securities registered pursuant to Section 12(g) of the Act:
Series B Junior Participating Preferred Stock Purchase Rights
(Title of class)
Indicate by check mark if the Registrant is a well-known seasoned issuer, as defined in Rule 405 of the Securities Act. Yes ☐ No ☒
Indicate by check mark if the Registrant is not required to file reports pursuant to Section 13 or Section 15(d) of the Act. Yes ☐ No ☒
Indicate by check mark whether the Registrant (1) has filed all reports required to be filed by Section 13 or 15(d) of the Securities Exchange Act of 1934 during the preceding 12 months (or for such shorter period that the Registrant was required to file such reports), and (2) has been subject to such filing requirements for the past 90 days. Yes ☒ No ☐ Indicate by check mark whether the registrant has submitted electronically and posted on its corporate Web site, if any, every Interactive Data File required to be submitted and posted pursuant to Rule 405 of Regulation S-T during the preceding 12 months (or for such shorter period that the registrant was required to submit and post such files). Yes ☒ No ☐
Indicate by check mark if disclosure of delinquent filers pursuant to Item 405 of Regulation S-K is not contained herein and will not be contained, to the best of Registrant’s knowledge, in definitive proxy or information statements incorporated by reference in Part III of this Form 10-K or any amendment to this Form 10-K. ☐
Indicate by check mark whether the Registrant is a large accelerated filer, an accelerated filer, a non-accelerated filer, smaller reporting company or an emerging growth company. See the definitions of “large accelerated filer,” “accelerated filer,” “smaller reporting company,” and “emerging growth company” in Rule 12b-2 of the Exchange Act.
|
Large accelerated filer |
☐ |
Accelerated filer |
☐ |
|
Non-accelerated filer |
☐ (Do not check if a smaller reporting company) |
Smaller reporting company |
☒ |
|
Emerging growth company |
☐ |
|
|
If an emerging growth company, indicate by check mark if the registrant has elected not to use the extended transition period for complying with any new or revised financial accounting standards provided pursuant to Section 13(1) of the Exchange Act ☐
Indicate by check mark whether the Registrant is a shell company (as defined in Rule 12b-2 of the Act). Yes ☐ No ☒
The aggregate market value of the voting and non-voting common equity held by non-affiliates computed using $1.71, the price at which the common equity was last sold as of July 28, 2017 (the last trading day of the Registrant’s most recently completed second fiscal quarter), was approximately $24,000,000.
On April 6, 2018 there were 14,677,265 shares of the Registrant’s common stock, $.01 par value, outstanding.
DOCUMENTS INCORPORATED BY REFERENCE
Portions of the Registrant’s Proxy Statement to be filed with the Securities and Exchange Commission in connection with our next Annual Meeting of Stockholders (the “Proxy Statement”) are incorporated by reference into Part III of this Form 10-K.
|
|
|
|
|
Page No. |
|
|
|
|
|
|
|
|
|
|
|
|
|
Item 1. |
|
|
2 |
|
|
Item 1A. |
|
|
10 |
|
|
Item 1B. |
|
|
25 |
|
|
Item 2. |
|
|
26 |
|
|
Item 3. |
|
|
26 |
|
|
Item 4. |
|
|
26 |
|
|
|
|
|
|
|
|
|
|
|
|
|
|
Item 5. |
|
|
27 |
|
|
Item 6. |
|
|
29 |
|
|
Item 7. |
|
Management’s Discussion and Analysis of Financial Condition and Results of Operations |
|
33 |
|
Item 7A. |
|
|
49 |
|
|
Item 8. |
|
|
50 |
|
|
Item 9. |
|
Changes in and Disagreements with Accountants on Accounting and Financial Disclosure |
|
50 |
|
Item 9A. |
|
|
50 |
|
|
|
|
|
|
|
|
|
|
|
|
|
|
Item 10. |
|
|
51 |
|
|
Item 11. |
|
|
51 |
|
|
Item 12. |
|
Security Ownership of Certain Beneficial Owners and Management and Related Stockholder Matters |
|
51 |
|
Item 13. |
|
Certain Relationships and Related Transactions, and Director Independence |
|
51 |
|
Item 14. |
|
|
51 |
|
|
|
|
|
|
|
|
|
|
|
|
|
|
Item 15. |
|
|
52 |
|
|
Item 16. |
|
|
56 |
We define our fiscal year as the 52 or 53 week period ending on the Saturday closest to January 31. This annual report is for the 53 week fiscal year ended February 3, 2018 (fiscal 2017). The fiscal years ended January 31, 2017 (fiscal 2016) and January 30, 2016 (fiscal 2015) consisted of 52 weeks. In December 2014 we announced a change of our fiscal year end from September 30 to the Saturday closest to January 31. We had a transition period from October 1, 2014 through January 31, 2015 and filed a Transition Report on Form 10-Q for such transition period. References in this Form 10-K to our fiscal years prior to fiscal 2015 refer to the fiscal years ended on September 30 in those years.
As used in this report, the term “retail locations” includes our stores and leased departments and excludes international franchised locations. As used in this report, “stores” means our stand-alone stores that we operate in the United States, Canada and Puerto Rico. As used in this report, the term “GAAP” refers to generally accepted accounting principles in the United States.
Overview
We are the leading designer and omni-channel retailer of maternity apparel in the United States, with the only nationwide chain of maternity apparel specialty stores, as well as a deep and expansive assortment available through multiple online distribution points, including our three brand-specific websites. As of February 3, 2018 we operate 1,124 retail locations, including 487 stores in the United States, Canada and Puerto Rico, and 637 leased departments located within department stores and baby specialty stores throughout the United States and in Puerto Rico. We also sell our merchandise on the Internet, primarily through our Motherhood.com, APeaInThePod.com and DestinationMaternity.com websites. We also sell our merchandise through our Canadian website, MotherhoodCanada.ca, through Amazon.com in the United States, and through websites of certain of our retail partners, including Macys.com. Our 487 stores operate under three retail nameplates: Motherhood Maternity®, A Pea in the Pod® and Destination Maternity®. We also operate 637 leased departments within leading retailers such as Macy’s®, buybuy BABY® and Boscov’s®. Generally we are the exclusive maternity apparel provider in our leased department locations.
We maintain our leading position through our two key brands, which enable us to reach a broad range of maternity customers. Through our stores and certain of our leased departments, we offer maternity apparel under one or both of our two primary brands, Motherhood Maternity (“Motherhood” or “Motherhood Maternity”) at value prices and A Pea in the Pod (“Pea” or “A Pea in the Pod”) at both contemporary and premium prices. Our A Pea in the Pod Collection® (“Pea Collection”) is the distinctive premier maternity apparel line within the A Pea in the Pod brand, featuring exclusive designer label product at premium prices.
We believe that one of our key competitive advantages is our ability to fulfill, in a high-service store environment, all of an expectant or nursing mother’s clothing needs, including casual and career wear, formal attire, lingerie, sportswear and outerwear, in sizes that cover all trimesters of the maternity cycle. We believe that our vertically-integrated business model enables us to offer the broadest assortment of fashionable maternity apparel. We design and contract the manufacture of over 90% of the merchandise we sell using factories located throughout the world, predominantly outside of the United States.
In fiscal 2017 we opened seven stores and closed 35 stores, primarily consisting of closings of underperforming stores. In recent years we have evaluated our retail store base to identify and, in many cases, close underperforming stores where we can do so without disproportionate exit cost.
Currently, we operate 28 stores and five leased departments in Canada, including 24 Motherhood stores, three Destination Maternity combo stores and one Destination Maternity superstore, and a Motherhood website under a Canadian URL (MotherhoodCanada.ca). In addition, we have international store and product supply relationships in the Middle East, South Korea, Mexico, Israel and India. As of February 3, 2018, we have 188 international franchised locations, comprised of 15 stand-alone stores 173 shop-in-shop locations, in which we have a Company-branded department operated by our franchise partners within other retail stores.
We believe that our customers, particularly first-time mothers, are entering a new life stage that drives widespread changes in purchasing needs and behavior, thus making our maternity customer and her family a highly-valued demographic for a range of consumer products and services companies. As a result, we have been able to expand and leverage the relationship we have with our customers and generate incremental revenues and earnings by offering other value-added baby and parent-related products and services through a variety of marketing partnership programs utilizing our extensive opt-in customer database and various in-store marketing initiatives.
2
The Company was founded in 1982 as a mail-order maternity apparel catalog. We began operating retail stores in 1985 and completed our initial public offering in 1993. To address multiple price points in maternity apparel and improve operating productivity, we acquired Motherhood Maternity and A Pea in the Pod in 1995 and acquired other maternity apparel specialty chains from 1994 to 2001. Since the acquisitions of Motherhood Maternity and A Pea in the Pod, we have developed and grown these brands. Also, since the 1990s we have partnered with other retailers to sell our products through maternity apparel departments within their stores.
Industry Overview
We are unaware of any reliable external data on the size of the maternity apparel business. We believe that there is an opportunity to grow our business by selling maternity clothes to those pregnant women who currently purchase loose-fitting or larger-sized non-maternity clothing as a substitute or partial substitute for maternity wear. We also believe that our business can grow by reducing the amount of “hand-me-down” and “borrowing” associated with maternity apparel, particularly in the value-priced segment. Additionally, although we are not wholly unaffected by external factors (such as fluctuations in the birth rate), we believe that the demand for maternity apparel is relatively stable when compared to non-maternity apparel.
Our Competitive Strengths
We are the leader in maternity apparel. We are the leading designer and omni-channel retailer of maternity apparel in the United States, with the only nationwide chain of maternity apparel specialty stores, as well as a deep and expansive assortment available through multiple online distribution points, including our three brand-specific websites. We believe that our brands are the most recognized in maternity apparel. We have established a broad and diverse distribution network, with stores and leased departments in a wide range of geographic areas and retailing venues (both within and outside of the United States), as well as e-commerce sales through our own brand-specific web-sites, and third-party e-commerce sites includingMacys.com and Amazon.com. In addition, we have a leading position across all major price points of maternity apparel through our retail store nameplates and our brands. Our exclusive focus on maternity apparel and our leadership position enable us to gain a comprehensive understanding of the needs of our maternity customers and keep abreast of fashion and product developments that meet her style.
We offer a comprehensive assortment of maternity apparel and accessories. A primary consideration for expectant mothers shopping for maternity clothes is product assortment, as pregnant women typically need to replace at least a portion of their wardrobe. We believe that we offer the widest selection of merchandise in the maternity apparel business. We also offer product for multiple seasons, as pregnant women’s clothing needs vary depending on their due date. Our ability to offer a broad assortment of product is due, in large part, to our vertically-integrated business model, which includes our extensive in-house design and contract manufacturing capabilities.
We are vertically integrated. We design and contract for the manufacture of over 90% of the merchandise we sell. We believe that vertical integration enables us to offer the broadest assortment of maternity apparel, to respond quickly to fashion trends, to ensure product quality, to improve product gross margins and to optimize in-stock levels.
We are able to enhance our leadership position by distributing our products through multiple distribution points, including online as well as through our leased department relationships. In addition to our 487 stores, we distribute our product online through our ecommerce websites (Motherhood.com, APeaInThePod.com, DestinationMaternity.com and MotherhoodCanada.ca) and third party websites (such as Amazon.com and Macys.com), as well as through our 637 leased departments located within department stores and baby specialty stores throughout the United States and in Puerto Rico, namely Macy’s, buybuy BABY and Boscov’s. Generally we are the exclusive maternity apparel provider in our leased department locations. We believe that we have an opportunity to increase the sales and profit we generate from our current online distribution points and leased department relationships by growing and improving our performance in these channels. In addition we believe we have the opportunity to increase our sales and profit further through the select addition of new digital and brick and mortar distribution points with new retail partners.
We have an experienced management team. We have an executive management team with significant experience in all aspects of the retail and apparel business, including our interim Chief Executive Officer (“CEO”) Melissa Payner-Gregor, who has over 20 years of experience in specialty retail, our Chief Financial Officer (“CFO”), David Stern, who has over 15 years of senior financial management experience, including over nine years of experience with retail organizations, and our Chief Administrative Officer, Ronald Masciantonio, who has over a decade of senior management experience at Destination Maternity. Our executive management team is complemented by experienced specialty retail executives across all disciplines of our Company.
3
We believe that our brands are the most recognized brands in the maternity apparel business. We sell our merchandise under the following two distinct brands:
|
Brand |
Brand Positioning |
|
Typical |
|
Motherhood Maternity |
Expansive on-trend fashion assortment ranging from wardrobe essentials to special occasion; offering quality merchandise at affordable value prices |
|
$10 - $50 |
|
A Pea in the Pod |
Contemporary, fashion-forward assortment including a curated selection of exclusive designer labels at better and premium prices |
|
$25 - $300 |
Motherhood Maternity. Our Motherhood Maternity brand serves the moderate priced portion of the maternity apparel business, which has the greatest number of customers. The Motherhood brand is positioned with an expansive on-trend fashion assortment ranging from wardrobe essentials to special occasion, offering quality merchandise at affordable value. We believe that the Motherhood customer shops at moderate-priced department stores, specialty stores and discount stores when she is not expecting.
A Pea in the Pod. Our A Pea in the Pod brand is a contemporary, fashion-forward assortment including a curated selection of exclusive designer labels at better and premium pricing, offering customers fashionable maternity pieces that reflect her uncompromising sense of style in both casual and career apparel. In our stores that carry A Pea in the Pod brand merchandise, we also offer exclusive maternity versions of select styles from well-known designer and contemporary brands, where we have assisted in developing these maternity versions. We believe that the typical Pea customer shops at upscale department stores and specialty apparel chains when she is not expecting, with the Pea Collection customer typically shopping at higher-end department stores and designer boutiques when she is not expecting.
Retail Nameplates
We sell maternity apparel through our stores, and our leased department and licensed brand relationships, identified in the table below.
|
Store Nameplate |
|
Description of Target Location |
|
Brand(s) Carried |
|
Typical Apparel Price Range |
|
Average Size (Sq. Ft.) |
|
Stores: |
|
|
|
|
|
|
|
|
|
|
|
|
|
|
|
|
|
|
|
Motherhood Maternity |
|
Mid-priced and moderate regional malls, strip and power centers, and central business districts |
|
Motherhood |
|
$10 - $50 |
|
1,800 |
|
A Pea in the Pod |
|
Mid-priced and high-end regional malls, lifestyle centers, central business districts and some stand-alone stores in affluent street locations |
|
Pea (including, in some cases, Pea Collection) |
|
$25 - $300 |
|
2,100 |
|
Destination Maternity |
|
Combo stores located in mid-priced regional malls and lifestyle centers |
|
Motherhood; Pea (including, in some cases, Pea Collection) |
|
$10 - $300 |
|
Combo stores 2,900 |
|
|
|
Superstores located primarily in outdoor and power centers and central business districts |
|
|
|
|
|
Superstores 5,700 |
|
Leased Departments: |
|
|
|
|
|
|
|
|
|
|
|
|
|
|
|
|
|
|
|
Macy’s |
|
Mid-priced regional malls |
|
Motherhood; Pea (including, in some cases, Pea Collection) |
|
$10 - $300 |
|
— |
|
buybuy BABY |
|
Big box power centers |
|
Motherhood; Pea |
|
$10 - $115 |
|
— |
|
Boscov’s |
|
Mid-priced and moderate regional malls |
|
Motherhood |
|
$10 - $50 |
|
— |
4
The following table sets forth our store count by nameplate as of February 3, 2018.
|
Store Nameplate |
|
Number of Stores |
|
||
|
Motherhood Maternity |
|
|
385 |
|
|
|
A Pea in the Pod |
|
|
27 |
|
|
|
Destination Maternity: |
|
|
|
|
|
|
Combo stores |
|
|
43 |
|
|
|
Superstores |
|
|
32 |
|
|
|
Total Destination Maternity stores |
|
|
75 |
|
|
|
Total stores (1) |
|
|
487 |
|
|
|
(1) |
Excludes leased departments and international franchised locations. |
We believe our ability to lease attractive real estate locations is enhanced due to the brand awareness of our concepts, our multiple price point approach, our highly sought-after maternity customer and our real estate management and procurement capabilities. We are the only maternity apparel retailer to provide mall operators with differently priced retail concepts, depending on the mall’s target demographics. We are also able to provide varied store formats for malls whose maternity customers seek a wide range of price alternatives. In addition, in the case of multi-mall operators, we have the flexibility to provide several stores across multiple malls.
Motherhood Maternity Stores. Motherhood Maternity is our largest chain with 385 stores as of February 3, 2018. Our Motherhood Maternity brand serves the moderate priced portion of the maternity apparel business, which has the greatest number of customers. The Motherhood brand is positioned with an expansive on-trend fashion assortment ranging from wardrobe essentials to special occasion, offering quality merchandise at affordable value. Motherhood stores average approximately 1,800 square feet and are located primarily in mid-priced and moderate regional malls, strip and power centers, and central business districts. Motherhood stores include 96 outlet locations that carry Motherhood-branded merchandise as well as some closeout merchandise. In fiscal 2017 we opened five new Motherhood stores including outlets and closed 29 Motherhood stores including outlets. As of February 03, 2018, we operated 24 Motherhood stores in Canada and believe that market opportunities may permit us to open additional stores in Canada in the future.
A Pea in the Pod Stores. As of February 3, 2018, we had 27 A Pea in the Pod stores. Our A Pea in the Pod brand is a contemporary, fashion-forward assortment including a curated selection of exclusive designer labels at better and premium pricing, offering customers fashionable maternity pieces. A Pea in the Pod stores average approximately 2,100 square feet and are located in mid-priced regional malls, lifestyle centers and central business districts while others are located in upscale venues, including Beverly Hills, Water Tower Place (Chicago), South Coast Plaza (Orange County, California) and Newbury Street (Boston). In fiscal 2017 we opened two Pea stores and closed one Pea store.
Destination Maternity Stores. As of February 3, 2018, we had 75 Destination Maternity nameplate stores averaging approximately 4,200 square feet, including 43 Destination Maternity combo stores and 32 Destination Maternity superstores. Our Destination Maternity stores carry both of our primary brands (Motherhood and Pea). Our Destination Maternity combo stores are larger (average of approximately 2,900 square feet) than our single-brand stores. Our Destination Maternity superstores carry both of our primary brands, plus an expanded line of maternity-related accessories, nursing products, health and fitness products, books, and body and nutritional products. Our Destination Maternity superstores also typically feature a “relax area” for husbands and shoppers alike, and an inside play area for the pregnant mom’s toddlers and young children. Destination Maternity superstores average approximately 5,700 square feet for the 32 stores open as of February 3, 2018. In fiscal 2017 we did not open any Destination Maternity stores and closed five Destination Maternity stores.
Leased Departments. In addition to the stores we operate, we have arrangements with department stores and baby specialty stores, including Macy’s, buybuy BABY and Boscov’s to operate maternity apparel departments in their stores. Generally, we are the exclusive maternity apparel provider in our leased department locations. We staff these leased departments at varying levels and maintain control of the pricing and promotional terms, as well as the timing and degree of the markdowns of our merchandise that is sold in the leased departments. We operate our leased departments during the same hours and days as the host store and are responsible for replenishment of the merchandise in the leased departments. These leased departments typically involve the lease partner collecting all of the revenue from the leased department. The revenue is remitted to us, less a fixed percentage of the net sales earned by the lease partner as stipulated in each agreement.
5
The following table sets forth our leased department count by retail partner as of February 3, 2018.
|
Retail Partner |
|
Number of Leased Departments |
|
||
|
Macy’s |
|
|
475 |
|
|
|
buybuy BABY |
|
|
116 |
|
|
|
Boscov’s |
|
|
46 |
|
|
|
Total leased departments (1) |
|
|
637 |
|
|
|
(1) |
Excludes international franchised locations. |
International. Currently, we operate 28 stores and five leased departments in Canada, including 24 Motherhood stores, three Destination Maternity combo stores and one Destination Maternity superstore, and a Motherhood website under a Canadian URL (MotherhoodCanada.ca).
We have a franchise agreement with Multi Trend, a member of the Al-Homaizi Group, covering six key markets in the Middle East. As of February 3, 2018, our Motherhood and Pea merchandise is offered in 14 franchise stores operating in the Middle East.
We have a franchise agreement with Agabang & Company to sell our brands in South Korea. Our Motherhood and Pea merchandise is available for sale in maternity shop-in-shops operated by Agabang in its Agabang Gallery and Nextmom stores (which carry infant and children’s apparel and non-apparel merchandise, as well as maternity apparel) and other retail stores, and in franchise stores in South Korea. As of February 3, 2018, our Motherhood and Pea merchandise is offered in 38 shop-in-shops and one franchise store in South Korea.
We have a franchise agreement with El Puerto de Liverpool, S.A.B. de C.V., the largest department store company in Mexico. Our Motherhood and Pea merchandise is available for sale primarily in maternity shop-in-shops located in Liverpool’s department stores (which carry a wide range of products, including infant and children’s apparel and non-apparel merchandise, as well as maternity apparel) throughout Mexico. As of Feburary3, 2018 our Motherhood and Pea merchandise is offered in 102 shop-in-shops in Mexico.
We have a franchise agreement with H&O Fashion Ltd., one of Israel's largest and dominant fashion-retail chains. Our Motherhood and Pea merchandise is offered through shop-in-shops in select H&O stores. As of February 03, 2018, our Motherhood and Pea merchandise is offered in 33 shop-in-shops in Israel.
We have a franchise agreement with Rhea Retail Private Limited, a leader in the sale of women’s, children’s, and infants’ clothing and accessories in India, however, as of February 3, 2018, our merchandise is not offered in any locations.
We continue to evaluate other international sales opportunities. As our franchise relationships to date demonstrate, our initial international strategy has primarily consisted of franchising, licensing or similar arrangements with foreign partners. Our future international strategy may include increased e-commerce distribution, franchising or licensing arrangements with foreign partners, as well as potentially entering into wholesale business arrangements, entering into joint ventures or developing our own operations in certain countries.
Internet Operations
We sell our merchandise on the Internet primarily through our brand-specific websites, Motherhood.com and APeaInThePod.com, as well as through our DestinationMaternity.com website. We also sell our merchandise through our Canadian website, MotherhoodCanada.ca, as well as through Amazon.com and Macys.com in the United States. We believe that many pregnant women, particularly millennials, use the Internet to find maternity-related information and to purchase maternity clothes. Our websites are therefore important tools for educating existing and potential customers about our brands and driving traffic to our stores. Our marketing and technology capabilities and the replenishment capabilities of our distribution facilities and stores enable us to incorporate Internet design, operations and fulfillment into our existing operations. Our brand-specific sites were re-launched in in the first quarter of 2017 after a complete re-platforming of each of our sites through integration with a best-in-class enterprise cloud commerce solution. The provider is the category-defining leader of enterprise cloud commerce solutions used by a variety of best-in-class Internet retailers, including a significant number of fashion focused specialty retailers. We believe this integration is currently helping and will continue to help us keep current with the ever-changing digital landscape while focusing our efforts on our core merchandising and operational strengths. We believe that our Internet operations (both through our existing ecommerce distribution points and, perhaps, new ecommerce distribution points) represent a continued growth opportunity for us to increase sales and profit in all channels.
6
We believe our customers, particularly first-time mothers, are entering a new life stage that drives widespread changes in purchasing needs and behavior, thus making our maternity customer and her family a highly-valued demographic for a range of consumer products and services companies. We have been able to leverage the relationship we have with our customers to earn incremental revenues. We expect to continue to expand and leverage the relationship we have with our customers and earn incremental revenues through a variety of marketing partnership programs utilizing our extensive opt-in customer database and various in-store and online marketing initiatives, which help introduce our customers to various baby and parent-related products and services offered by leading third-party consumer products companies.
Operations
Merchandising Operations Teams. To obtain maximum efficiencies, we are organized primarily along functional lines, such as merchandising, design, planning and allocation, and production. Our merchandising, design, and planning and allocation teams are organized on a brand-specific basis. Each brand team is led by the head merchant and includes a brand-specific head designer and head planner. These teams are also supported by centralized production, purchasing, marketing and other necessary professionals.
Store Operations. The typical maternity customer, especially the first-time mother, seeks more advice and assistance than the typical non-maternity customer. Therefore, we aim to employ passionate, skilled and inspirational store team members who are trained to provide the high level of attentive service and reassurance needed by our customers. Our goal is to provide a boutique or personalized level of service that differentiates us from our competitors. Our centralized merchandising, store operations and visual presentation departments also enable our field leadership and store team members to focus primarily on selling and maintaining consistency from store to store on their appearance and operational execution. In addition, our visual presentation department coordinates with the merchandising department to develop floor-sets, design store display windows and place marketing materials to better define and enhance the product presentation.
The field/store leadership reporting structure consists of regional directors, district managers, leased area managers and store managers. Generally, these members of the field/store leadership team are each eligible to receive incentive-based compensation related to store, district and regional performance for both our stores and leased department groups.
Merchandising, Design and Inventory Planning and Allocation
Merchandising. Our product styling decisions are based on current fashion trends, as well as input from our designers and outside vendors as we seek to create fashionable product that flatters and comfortably fits the pregnant woman’s body, allowing her to maintain her pre-pregnancy sense of style. We strive to maintain an appropriate balance between introducing new and proven styles, as well as between basic essential wardrobe pieces and fashion items. Each brand has its own team of merchants and designers. The merchandising and design teams each report to our Senior Vice President of Merchandising and Design.
Design. The design of our products begins with a review of global runway trends, current non-maternity retail fashion trends, fashion reporting service information and fabric samples. The designers review our best-selling items from prior seasons and integrate current fashion ideas from the non-maternity apparel business.
Planning and Allocation. Our inventory planning and allocation department is responsible for planning future inventory purchases and pricing, as well as targeting overall inventory levels and turnover. We establish target inventories for storefronts within each channel with the goals of optimizing our merchandise assortment and turnover, maintaining adequate depth of merchandise by style and managing closeout and end-of-season merchandise consolidation. Our planning and allocation team continually monitors and responds to consumer demand through utilization of available tools. Our capabilities to perform these tasks were significantly enhanced with the implementation of our new cloud-based allocation tool and related processes in fiscal 2016. The planning and allocation department reports to our Senior Vice President of Planning and Allocation.
Production and Distribution
Our direct supply chain manufactures over 90% of our apparel, predominantly outside of the United States. In fiscal 2017 we continued to focus on the supply chain reducing the number of factories and balance our global footprint, to improve costs, streamline operations, ensure quality and improve speed to market. We maintain the flexibility to add new contractors, if necessary, to fulfill our sourcing needs. No individual vendor/factory represents a material portion of our production. A majority of our merchandise is purchased “full package” as finished product made to our specifications, typically utilizing our designs. Substantially all the merchandise produced outside of the United States is paid for in US dollars.
7
Our production personnel work with our supply chain to ensure, compliance with our design specifications and timely delivery of finished goods from concept through to finished product. We use a third-party consulting firm to help monitor working conditions at our contractors’ facilities on a global basis ensuring social compliance standards are followed.
Finished garments from manufacturers and vendors are received at our distribution center in Florence, New Jersey. Garments are inspected and then channeled into our automated storage and retrieval devices, as well as traditional bulk storage. The Florence distribution facility utilizes a fully-integrated equipment and software system capable of servicing all business channels. This integrated system allows for optimum inventory utilization, rapid replenishment and extremely accurate fulfillment of all orders. Retail location replenishment decisions are made based upon target inventories established by our planning and allocation department and individual retail location sales data and were enhanced with the implementation of our new cloud-based allocation tool. Freight is routed through small parcel carriers while utilizing zone-skipping methodologies, which improves cost effectiveness and speed to market.
Since 2003 we have been certified to participate in Customs-Trade Partnership Against Terrorism (“C-TPAT”), a United States Department of Homeland Security sponsored program, with United States Customs and Border Protection (“U.S. Customs”), through which we implement and monitor our procedures to manage the security of our supply chain as part of the effort to protect the United States and our imported products against potential acts of terrorism. Since 2005 we have been certified to participate in the Importer Self-Assessment Program (“ISA”), a U.S. Customs program available only to C-TPAT participants with strong internal controls. Through our participation in the ISA program, we assume responsibility for monitoring our own compliance activities with applicable U.S. Customs regulations in exchange for certain benefits, which may help increase efficiency in importing. These benefits include exemption from certain government audits, increased speed of cargo release from U.S. Customs, front of the line access to U.S. Customs cargo exams, enhanced prior disclosure rights from U.S. Customs in the event of alleged trade violations, availability of voluntary additional compliance guidance from U.S. Customs, and less intrusive government oversight of trade compliance. In 2010 we were granted Tier 3 Status within the C-TPAT program, the highest level of recognition currently available. Our Tier 3 Status was revalidated in January 2018. In 2013 we participated in a revalidation of our C-TPAT process in Vietnam with U.S. Customs.
In 2007 we were accepted to participate in the U.S. Customs and Border Protection’s Drawback Compliance Program. The benefits of this program include 1) waiver of prior notice where we do not have to notify U.S. Customs at the time of export of product to Canada and 2) accelerated payment privileges to receive drawback refunds of United States import duties previously paid within 30 days of filing the claim for refund, with respect to goods we export from the United States that we previously imported into the United States.
Information Technology Systems
Historically, our information technology systems have been developed in-house or highly customized versions of external software with our custom Enterprise Resource Planning (“ERP”) system serving as the central brain of most of our systems, including our core merchandising system. Our current ERP system manages our production inventories, documentation, purchase orders and scheduling. In addition, we have an in-house developed Internet-based point-of-sale system that provides daily access to financial and merchandising information in addition to payment processing. This point-of-sale system feeds information back to the ERP for use in our core merchandising tasks.
Although our current systems, including our in-house developed ERP and point of sale systems, are serviceable and adequate to meet our business needs, we continue to move forward with plans for modernization of our technology portfolio. In fiscal 2016 we completed the implementation of a best-in-class tool for inventory allocation. In addition, we have implemented a market leading payment processing solution which greatly improves the security of cardholder data and enables EMV-compliant payment processing in our stores. We also did substantial work in implementing our new web platform and re-launching each of our ecommerce sites, which went live in the first quarter of fiscal 2017.
Given the importance of our information technology systems, we continue to take extensive measures to ensure their responsiveness and security. Our hardware and communications systems are based on a redundant and multiprocessing architecture, which allows their continued operation on a parallel system in the event that there is a disruption within the primary system. We have two data centers supporting our business functions: one in our corporate headquarters location in Moorestown, New Jersey and the second in our distribution center in Florence, New Jersey. The data centers communicate via diverse broadband connections using multiple service providers. In addition, our software programs and data are backed up and securely stored off-site.
Advertising and Marketing
Our advertising and marketing program serves to strengthen the power of our brands, to drive traffic to our stores, to increase customer loyalty and word-of-mouth referrals, and to support our e-commerce platforms. The key objectives of our marketing strategy are helping every new customer discover our brands and recognize us as the authority in maternity fashion; motivating her to purchase; reaffirming that her decision to shop with us was the right one; and creating a memorable experience that she will share.
8
We understand that our customers have a limited window of need, so we target our messaging through a robust customer relationship management (CRM) program that utilizes focused email messaging and traditional direct-mail advertising. In addition, we advertise on her favorite websites and provide social media content to ensure that our messaging reaches and engages her. On our own e-commerce sites we have additional marketing opportunities through exclusive sales and on-site features that help our customer discover the right fashion to fit her style based on her pregnancy stage.
In our stores we use inspirational imagery and informative signage to enhance each customer’s shopping experience and to encourage her to buy. Our in-store signage provides visuals of seasonal collections and new styles. Our publicity efforts generate editorial coverage locally and nationally in a variety of media formats for our brands. In addition, our public relations efforts and partnerships with bloggers, celebrities and other third parties expand our reach.
Competition
Our business is highly competitive and characterized by low barriers to entry, especially online. The following are several factors important to competing successfully in the retail apparel industry: ability to anticipate fashion trends and customer preferences; product procurement and pricing; breadth of selection in sizes, colors and styles of merchandise; inventory control; quality of merchandise; store design and location; visual presentation and advertising; customer service; and reputation. We face competition in our maternity apparel lines from various sources, including department stores, specialty retail chains, discount stores, independent retail stores and catalog and Internet-based retailers, from both new and existing competitors. Many of our competitors are larger and have substantially greater financial and other resources than us. Our better and premium-priced merchandise faces a highly fragmented competitive landscape that includes locally based, single unit retailers, as well as a handful of multi-unit maternity operations. In the value-priced maternity apparel business, we currently face competition on a nationwide basis from retailers such as Gap®, H&M®, Old Navy®, Target® and Wal-Mart®. Substantially all these competitors also sell maternity apparel on their websites. We also face increasing competition from Internet-based retailers such as ASOS, Pink Blush, Zulily and Hatch.
Employees
As of February 3, 2018, we had approximately 1,100 full-time and 2,600 part-time employees. None of our employees are covered by a collective bargaining agreement. We consider our employee relations to be good.
Executive Officers of the Company
The following table sets forth the name, age and position of each of our executive officers:
|
Name |
|
Age |
|
Position |
|
Melissa Payner-Gregor |
|
59 |
|
Interim Chief Executive Officer |
|
David Stern |
|
51 |
|
Executive Vice President & Chief Financial Officer |
|
Ronald J. Masciantonio |
|
41 |
|
Executive Vice President & Chief Administrative Officer |
Melissa Payner-Gregor was appointed Interim Chief Executive Officer on January 3, 2018. Ms. Payner-Gregor has served as a director of the Destination Maternity Board since August 2009. Prior to her appointment Ms. Payner-Gregor was working as a consultant for several retail/e-commerce companies. She served as an advisor to Bluefly, Inc. in 2015, having previously served as the company’s Chief Executive Officer from 2004 to 2012 and as President in 2003. Prior to joining Bluefly, Ms. Payner-Gregor held senior management positions with prominent retail and consumer products companies, including Chief Executive Officer and President of Spiegel Catalog and President of Chico’s FAS.
David Stern has served as our Executive Vice President & Chief Financial Officer since August 2016. From 2012 to 2016 Mr. Stern served as Executive Vice President – Chief Financial Officer of Pep Boys – Manny, Moe & Jack. Prior to joining Pep Boys, Mr. Stern served as Executive Vice President, Chief Administrative Officer and Chief Financial Officer of A.C. Moore Arts and Crafts. From 2007 until 2009, Mr. Stern held roles at Coldwater Creek, including Vice President, Financial Planning and Analysis and Corporate Controller. From 2000 to 2007 Mr. Stern was the Chief Financial Officer of Petro Services. Mr. Stern began his career as an internal auditor and gained experience as a financial analyst, accounting manager and corporate controller at several companies, including Delhaize America, before joining Petro Services. Mr. Stern is a member of the Board of Directors of Beck Supplies, Inc. and is a member of the Board of Directors and Chairman of the Finance Committee of Camp Ockanickon, a not-for-profit organization. Mr. Stern has earned a Master of Business Administration degree from Wake Forest University, and has earned a Certified Public Accountant designation.
Ronald J. Masciantonio has served as our Executive Vice President & Chief Administrative Officer since November 2012. From November 2012 to August 2013 Mr. Masciantonio also served as our General Counsel. From November 2011 until November 2012 Mr. Masciantonio served as our Executive Vice President & General Counsel, having previously served as our Senior Vice President & General Counsel from April 2010 to November 2011 and, prior to that, as our Vice President & General Counsel from August 2006. In August 2006 Mr. Masciantonio rejoined us, after having previously served as our Assistant General Counsel from February 2004 to May 2005. From May 2005 to August 2006 Mr. Masciantonio was Assistant General Counsel, North America for
9
Taylor Nelson Sofres, N.A., a market research company with global headquarters in London, England. Prior to joining us originally in February 2004 Mr. Masciantonio was an Associate at the law firm of Pepper Hamilton LLP in Philadelphia, Pennsylvania from September 2001 to February 2004. Mr. Masciantonio earned a Juris Doctorate legal degree from Temple University School of Law in Philadelphia, Pennsylvania. Mr. Masciantonio is also Vice Chairman Finance & Treasurer of the Chamber of Commerce of Southern Jersey.
Our executive officers are appointed annually by our Board of Directors and serve at the discretion of the Board of Directors. There are no family relationships among any of our executive officers.
Intellectual Property
We own trademark and service mark rights that we believe are sufficient to conduct our business as currently operated. We own several trademarks, including Destination Maternity Corporation®, A Pea in the Pod®, A Pea in the Pod Collection®, Motherhood®, Motherhood Maternity®, Destination Maternity®, Motherhood Maternity Outlet® and Secret Fit Belly®.
Seasonality
Our business, like that of many other retailers, is seasonal. Our quarterly net sales were historically highest in the peak Spring selling season during our third fiscal quarter that previously ended on June 30 of our fiscal years that ended on September 30. Under our 4-5-4 retail fiscal calendar ending on the Saturday nearest January 31 of each year, the peak Spring selling season generally occurs during our first and second fiscal quarters. Given the historically higher sales level in that timeframe and the relatively fixed nature of most of our operating expenses, we have typically generated a very significant percentage of our full year operating income and net income during the calendar months of March through May. Results for any quarter are not necessarily indicative of the results that may be achieved for a full fiscal year. Quarterly results may fluctuate materially depending upon, among other things, increases or decreases in comparable sales, the timing of new store openings and closings, new leased department openings and closings, net sales and profitability contributed by new stores and leased departments, the timing of the fulfillment of purchase orders under our product and license arrangements, adverse weather conditions, shifts in the timing of certain holidays and promotions, changes in inventory and production levels and the timing of deliveries of inventory, and changes in our merchandise mix.
Securities and Exchange Commission Filings
Our Securities and Exchange Commission (“SEC”) filings are available free of charge on our website, investor.destinationmaternity.com. Our annual reports on Form 10-K, quarterly reports on Form 10-Q, current reports on Form 8-K and amendments to those reports are posted on our website as soon as practicable after we furnish such materials to the SEC.
You should consider carefully all of the information set forth or incorporated by reference in this document, and in particular, the following risk factors associated with our business and forward-looking information in this document (see also “Forward-Looking Statements” included in Item 7. Management’s Discussion and Analysis of Financial Condition and Results of Operations). The risks described below are not the only ones we face. Additional risks not presently known to us or that we do not currently consider significant may also have an adverse effect on us. If any of the risks below actually occur, our business, results of operations, cash flows, financial condition or stock price could suffer.
Our performance may be affected by general economic conditions and financial difficulties.
Our performance is subject to worldwide economic conditions and their impact on levels of consumer spending. Some of the factors that have, or have had, an impact on discretionary consumer spending include general economic conditions, employment, consumer debt, changes in personal net worth based on changes in securities market price levels, residential real estate and mortgage markets, taxation, healthcare costs, fuel and energy prices, interest rates, credit availability, consumer confidence and other macroeconomic factors.
10
The worldwide apparel industry is heavily influenced by general economic cycles. Apparel retailing is a cyclical industry that is heavily dependent upon the overall level of consumer spending. Purchases of specialty apparel and related goods tend to be highly correlated with the cycles of the levels of disposable income of consumers. As a result, any substantial deterioration in general economic conditions could materially and adversely affect our net sales and results of operations. Downturns, or the expectation of a downturn, in general economic conditions could materially and adversely affect consumer spending patterns, our sales and our results of operations.
Consumer purchases of discretionary items generally decline during recessionary periods and other periods where disposable income is adversely affected. Any downturn in the economy may affect consumer purchases of our merchandise and have an adverse impact on our sales, results of operations and cash flow. Because apparel generally is a discretionary purchase, declines in consumer spending may have a more negative effect on apparel retailers than on other retailers. A decline in consumer spending may negatively affect our profitability.
Future increases in interest rates or other tightening of the credit markets, or future turmoil in the financial markets, could make it more difficult for us to access funds, to refinance our indebtedness (if necessary), to enter into agreements for new indebtedness, or to obtain funding through the issuance of our securities. Any such adverse changes in the credit or financial markets could also impact the ability of our suppliers to access liquidity, or could result in the insolvency of suppliers, which in turn could lead to their failure to deliver our merchandise. Worsening economic conditions could also result in difficulties for financial institutions (including bank failures) and other parties that we may do business with, which could potentially impair our ability to access financing under existing arrangements or to otherwise recover amounts as they become due under our other contractual arrangements. Additionally, either as a result of, or independent of, any financial difficulties and economic weakness in the United States, material fluctuations in currency exchange rates could have a negative impact on our business.
Our sales, comparable sales and quarterly results of operations have fluctuated in the past and can be expected to continue to fluctuate in the future, and as a result, the market price of our common stock may fluctuate or decline substantially.
Our sales, comparable sales and quarterly results of operations have fluctuated in the past and can be expected to continue to fluctuate in the future and are affected by a variety of factors, including:
|
|
• |
customer traffic and conversion in our retail locations and e-commerce web-sites; |
|
|
• |
the timing of the fulfillment of purchase orders under our wholesale arrangements; |
|
|
• |
any disruption to our operations that may arise in connection with the implementation of system enhancements; |
|
|
• |
the extent of cannibalization of sales volume of some of our existing retail locations by new retail locations in the same geographic markets or by our e-commerce websites; |
|
|
• |
changes in our merchandise mix; |
|
|
• |
any repositioning of our brands; |
|
|
• |
general economic conditions and, in particular, the retail sales environment; |
|
|
• |
calendar shifts, including shifts of holiday or seasonal periods, occurring in a given calendar period; |
|
|
• |
changes in pregnancy rates and birth rates; |
|
|
• |
actions of competitors; |
|
|
• |
the level of success and/or actions of anchor tenants where we have stores, leased department or wholesale relationships; |
|
|
• |
the impact, timing and success of our efforts to expand our product category offerings through various channels of business; |
|
|
• |
the opening of new stores, the closing of existing stores, and the success of our leased department and wholesale relationships; |
|
|
• |
the timing of new store openings, and leased department and international franchised business openings; |
|
|
• |
fashion trends; and |
|
|
• |
weather conditions and seasonality. |
If, at any time, our sales, comparable sales or quarterly results of operations decline or do not meet the expectations of investors, the price of our common stock could decline substantially.
11
Our business depends on sustained demand for maternity clothing and is sensitive to birth rates, women’s fashion trends, economic conditions and consumer spending.
Our business depends upon sustained demand for maternity clothing. Our future performance will be subject to a number of factors beyond our control, including demographic changes, fashion trends, economic conditions, consumer spending and general health concerns that may impact the number of pregnant women. If demand for maternity clothing were to decline for any reason, such as a decrease in the number of pregnancies, our operating results could be materially and adversely affected. For example, according to the United States Census Bureau and United States Centers for Disease Control and Prevention, births declined a total of approximately 8.6% from calendar 2007 to calendar 2016. Although recent statistics suggest that this trend has slowed or reversed, if this trend had continued it could negatively affect our business and results of operations. Additionally, our operating results could be materially and adversely affected if certain non-maternity women’s apparel fashions have a more pregnancy-friendly fit. For example, at times, when fashion trends favored, we have been negatively impacted by the popularity of many looser-fitting fashion trends in the non-maternity women’s apparel market, such as maxi dresses, baby doll dresses, active bottoms with elastic waists, other soft knit elastic-waist bottoms and shorts, and oversized peasant-style woven tops, all of which can more readily fit a pregnant woman than typical non-maternity fashions, and could thus be purchased in numerous non-maternity retail stores. Downturns, or the expectation of a downturn, in general economic conditions could materially and adversely affect consumer spending patterns, our business, financial condition and results of operations. In addition, the specialty apparel retail business historically has been subject to cyclical variations. Consumer purchases of specialty apparel products, including maternity wear, may decline during recessionary periods and at other times when disposable income is lower. Declines in consumer spending patterns may have a more negative effect on apparel retailers than some other retailers. Therefore, we may not be able to maintain our historical sales and earnings, or remain as profitable, if there is a decline in consumer spending patterns. A prolonged economic downturn could have a material adverse impact on our business and results of operations.
Our business depends on effective marketing and high customer traffic.
We have many initiatives in our marketing programs particularly with regard to our ecommerce websites, and our social media presence. If our competitors increase their spending on marketing, if our marketing expenses increase, if our marketing becomes less effective than that of our competitors, if search engine algorithms change to our detriment, or if we do not adequately leverage technology and data analytics capabilities needed to generate concise competitive insight, we could experience a material adverse effect on our results of operations. A failure to sufficiently innovate or maintain adequate, effective and efficient marketing strategies could inhibit our ability to maintain brand relevance and drive increased sales. In addition, U.S. and foreign laws and regulations that make it more difficult or costly to digitally market may impact our ability to maintain brand relevance and drive increased sales.
We depend heavily on locating our stores in successful shopping malls in order to generate customer traffic. Sales at these stores are derived, in part, from the volume of traffic in those malls. We cannot control the development of new shopping malls, the availability or cost of appropriate locations within existing or new shopping malls or the success of existing or new mall stores.
The success of all of our mall stores will depend, in part, on the ability of each mall’s anchor tenants, such as large department stores, other tenants and area attractions to generate consumer traffic in the vicinity of our stores, and the popularity of malls as shopping destinations. Our sales volume and mall traffic have been and may in the future be adversely affected by, among other things, economic downturns in a particular area, the closing of anchor tenants, competition from e-commerce retailers, non-mall retailers and other malls where we do not have stores, increases in gasoline prices and the closing or decline in popularity of other stores in the malls in which we are located. Many malls are experiencing significantly lower levels of customer traffic than in the past, driven by overall poor economic conditions as well as the closure of certain mall anchor tenants. An uncertain economic outlook could curtail new shopping mall development, decrease shopping mall traffic, reduce the number of hours that shopping mall operators keep their shopping malls open or force them to cease operations entirely. A continued reduction in mall traffic as a result of these or any other factors could have a material adverse effect on our business, results of operations and financial condition.
Our success depends on our ability to identify and respond to fashion trends on a timely basis.
The apparel industry is subject to rapidly changing fashion trends and shifting consumer demands. Accordingly, our success depends on the priority that our target customers place on fashion and our ability to anticipate, identify and capitalize on emerging fashion trends. Our ability or our failure to anticipate, identify or react appropriately to changes in styles or trends could lead to, among other things, excess inventories and higher markdowns, as well as the decreased appeal of our brands. Particular fashion trends, or an inaccuracy of our forecasts regarding fashion trends, could have a material adverse effect on our business, financial condition and results of operations. For example, at times, when fashion trends favored, we have been negatively impacted by the popularity of many looser-fitting fashion trends in the non-maternity women’s apparel market, such as maxi dresses, baby doll dresses, active bottoms with elastic waists, other soft knit elastic-waist bottoms and shorts, and oversized peasant-style woven tops, all of which can more readily fit a pregnant woman than typical non-maternity fashions, and could thus be purchased in numerous non-maternity retail stores.
12
Our failure to successfully manage and expand our e-commerce business and its connectivity with our brick-and-mortar stores experience could have a material adverse impact on our business.
The expansion of our ecommerce business is one of our key strategic initiatives, as is furthering the connectivity between our ecommerce and brick-and-mortar stores (including, without limitation, through our fulfill from store and buy-online-pickup-in-store initiatives). The successful operation of our e-commerce business depends on our ability to maintain the efficient and uninterrupted operation of our online order-taking and our fulfillment operations, and on our ability to provide a shopping experience that will generate orders and return visits to our sites and stores, including by updating our e-commerce platform to stay abreast of changing consumer shopping habits such as the significantly increased use of mobile devices to shop online. Risks associated with our e-commerce business include:
|
|
• |
risks associated with the failure of the computer systems that operate our website including, among others, inadequate system capacity, security breaches, computer viruses, human error, changes in programming, system upgrades or migration of these services to new systems; |
|
|
• |
risks associated with any failure to development processes and procedures to properly handle ecommerce initiated transactions in our brick-and-mortar stores; |
|
|
• |
unforeseen delays in technology implementation or otherwise which cause us to fail to timely implement or enhance our omnichannel initiatives such as fulfill from store and buy-online-pickup-in-store); |
|
|
• |
disruptions in telephone service or power outages; |
|
|
• |
reliance on third parties for computer hardware and software, updates as well as delivery of merchandise to our customers; |
|
|
• |
rapid technology changes and changes in consumer shopping habits such as the significantly increased use of mobile devices and apps to shop online; |
|
|
• |
credit card fraud; |
|
|
• |
the diversion of sales from our retail locations and other distribution points; |
|
|
• |
natural disasters or adverse weather conditions; |
|
|
• |
changes in applicable federal and state regulations; |
|
|
• |
negative reviews on social media; |
|
|
• |
liability for online content; and |
|
|
• |
consumer privacy and information security concerns and regulation. |
Problems in any one or more of these areas could have a material adverse effect on our financial position, results of operations and cash flows, and could damage our reputation and brand.
We may not be successful in maintaining and expanding our business.
Any future growth depends significantly on:
|
|
• |
our ability to successfully establish and operate through new distribution points (which could include additional digital as well as brick-and-mortar locations); |
|
|
• |
our ability to improve and expand our e-commerce business in an increasingly competitive environment (including by gaining the benefits from, and mitigating the risks of, our various e-commerce initiatives); |
|
|
• |
our ability to successfully maintain our current, leased department relationships, and to operate such leased department relationships on a profitable basis; |
|
|
• |
the success and profitability of our wholesale, including our ability to successfully establish new, and to maintain our current, wholesale relationships; and |
|
|
• |
the success and profitability of our efforts to expand our product category offerings. |
13
This growth, if it occurs, will place increased demands on our management, operational and administrative resources. These increased demands and operating complexities could cause us to operate our business less effectively, which, in turn, could cause a deterioration in our financial performance and negatively impact our growth. Any planned growth will also require that we continually monitor and upgrade our management information and other systems, as well as our procurement and distribution infrastructure.
Our ability to establish and operate new stores and our leased department relationships successfully depends on many factors, including, among others, our ability to:
|
|
• |
identify and obtain suitable distribution points (both digital and brick-and-mortar), the availability of which is outside of our control; |
|
|
• |
negotiate favorable terms with third parties for such distribution (whether they be landlords, additional leased department partners, additional wholesale partners or digital distribution partners); |
|
|
• |
source sufficient levels of inventory to meet the additional distribution needs; |
|
|
• |
successfully address competition, merchandising and distribution challenges; and |
|
|
• |
hire, train and retain a sufficient number of qualified personnel to manage and operate such additional distribution opportunities. |
The success and profitability of our e-commerce business depends on many factors, including, those identified previously above as well as, our ability to:
|
|
• |
drive traffic to our retail websites through our, digital marketing and search engine optimization initiatives, and convert such traffic to sales efficiently and effectively; |
|
|
• |
changes in federal or state regulation that may impose restrictions on e-commerce or make e-commerce more costly, including privacy or other consumer protection laws; |
|
|
• |
breaches of Internet security; and |
|
|
• |
failure to keep up with changes in technology. |
There can be no assurance that we will be able to grow our business and achieve our goals. For example, as part of Macy’s previously announced closure of approximately 100 stores, early in fiscal 2017 Macy’s completed closure of 68 stores, which included 59 locations where we had a leased department within the store. Even if we succeed in establishing new stores, further developing our leased department relationships, and further expanding our wholesale relationships, we cannot assure that these initiatives will achieve planned revenue or profitability levels in the time periods estimated by us, or at all. If any of these initiatives fails to achieve or is unable to sustain acceptable revenue and profitability levels, we may incur significant costs.
Our Share price may be volatile and could decline substantially.
The market price of our common stock has been, and is expected to continue to be, volatile, both because of actual and perceived changes in our financial results and prospects, and because of general volatility in the stock market. The factors that could cause fluctuations in our share price may include, among other factors discussed in this section, the following:
|
|
• |
actual or anticipated variations in the financial results and prospects of our business or other companies in the retail business; |
|
|
• |
changes in financial estimates by Wall Street research analysts; |
|
|
• |
actual or anticipated changes in the United States economy or the retailing environment; |
|
|
• |
changes in the market valuations of other specialty apparel or retail companies; |
|
|
• |
announcements by our competitors or us; |
|
|
• |
mergers or other business combinations involving us; |
|
|
• |
additions and departures of key personnel; |
|
|
• |
changes in accounting principles; |
|
|
• |
the passage of legislation or other developments affecting us or our industry; |
|
|
• |
the trading volume of our common stock in the public market; |
|
|
• |
changes in economic conditions; |
14
|
|
• |
natural disasters, terrorist acts, acts of war or periods of civil unrest; and |
|
|
• |
the realization of some or all of the risks described in this section entitled “Risk Factors.” |
In addition, the stock markets have experienced significant price and trading volume fluctuations from time to time, and the market prices of the equity securities of retailers have been extremely volatile and are sometimes subject to sharp price and trading volume changes. These broad market fluctuations may materially and adversely affect the market price of our common stock.
Changes to federal, state or provincial income tax legislation could have a material adverse effect on our business and results of operations
From time to time, new tax legislation is adopted by the federal government and various states or other regulatory bodies. Significant changes in tax legislation could adversely affect our business or results of operations in a material way. On December 22, 2018, the U.S. government enacted comprehensive tax legislation commonly referred to as the Tax Cuts and Jobs Act (the "TCJA"). The changes included in the TCJA are broad and complex. The final transition impacts of the TCJA may differ from the estimates provided elsewhere in this report, possibly materially, due to, among other things, changes in interpretations of the TCJA, any legislative action to address questions that arise because of the TCJA, any changes in accounting standards for income taxes or related interpretations in response to the TCJA, or any updates or changes to estimates we have utilized to calculate the transition impacts, including impacts from changes to current year earnings estimates. As these and other tax laws and related regulations change, our financial results could be materially impacted. Give the unpredictability of possible changes and their potential interdependency, it is very difficult to assess whether the overall effect of such potential tax changes would be cumulatively positive or negative for our earnings and cash flow, but such changes could adversely impact our financial results.
Changes in accounting standards could significantly affect our results of operations and the presentation of those results.
Changes in accounting standards, including new interpretations and applications of accounting standards, may have adverse effects on our financial condition, results of operations, and liquidity. The Financial Accounting Standards Board ("FASB") have issued and/or adopted new pronouncements that proposes numerous significant changes to current accounting standards. These new standards could significantly change the presentation of financial information and our results of operations. Additionally, the new standards may require us to make systems and other changes that increase our operating costs. Specifically, implementing the new accounting standards related to leases could require us to make significant changes to our lease management system or other accounting systems.
Our business, financial condition and results of operations may be materially and adversely impacted at any time by a significant number of competitors.
We operate in a highly competitive environment characterized by few barriers to entry. We compete against department stores, specialty retail chains, discount stores, independent retail stores and catalog and Internet-based retailers. Many of our competitors are larger and have substantially greater financial and other resources than us. Further, we do not typically advertise using television and radio media and thus do not reach customers through means our competitors may use. Our mid- and premium-priced merchandise faces a highly fragmented competitive landscape that includes locally-based, single-unit retailers, as well as a handful of multi-unit maternity operations. In the value-priced maternity apparel business, we face competition on a nationwide basis from retailers such as Gap, H&M, Old Navy, Target and Wal-Mart. Substantially all of these competitors also sell maternity apparel on their websites. We also face increasing competition from Internet-based retailers such as ASOS, Pink Blush, Zulily and Hatch, as well as various competitors who sell through marketplace sites. Our business, financial condition and results of operations may be materially and adversely affected by this competition, including the potential for increased competition in the future. For example, the maternity apparel business has previously experienced oversupply conditions due to increased competition, which resulted in a greater level of industry-wide markdowns and markdowns recognized by us on sales from our retail locations. There can be no assurance that these conditions will not occur again or worsen.
15
Our relationships with third-party retailers may not be successful.
We cannot guarantee successful results from or the continuation of our leased department relationships with third-party retailers such as Macy’s, buybuy BABY and Boscov’s or any of our wholesale relationships. Under our agreements with our retail partners, those partners do not make any promises or representations as to the potential amount of business we can expect from the sale of our product through their distribution points. The success of our business third-party retailers is highly dependent on the actions and decisions of such third-party retailers, which are outside of our control. The retailers could limit the merchandise carried, close stores, go out of business or terminate their agreements with us. Our failure to properly manage our third-party retailer business (including any failure by us in timely delivering goods to any third-party retailer or any failure to respond to the actions of, or changes in, business conditions at third-party retailers) would have a direct impact on the profitability and continuation of these relationships.
Our relationships with third-party retailers may be terminated at any time.
We cannot guarantee the continuation of our relationships with third-party retailers. Such retailers can discontinue our products at any time and offer a competitor’s maternity apparel products, or none at all. The contractual commitments of our retailer customers are not long-term in nature. Continued positive relations with a retailer depend upon various factors, including price, customer service, consumer demand and competition. Certain of our third-party retailer partners have multiple vendor policies and may seek to offer a competitor’s products or services at new or existing locations. If any significant retailer materially reduces, terminates or is unwilling to expand its relationship with us, or requires price reductions or other adverse modifications in our selling terms, our sales would suffer.
Additionally, most major retailers continually evaluate and often modify their in-store retail strategies, including product placement, store set-up and design, promotions and demographic targets. Our business could suffer significant setbacks in net sales and operating income if one or more of our major retail customers modified its current retail strategy resulting in a termination or reduction of its business relationship with us, a reduction in store penetration or an unfavorable product placement within such retailer’s stores, any or all of which could materially adversely affect our business, financial condition, results of operations and cash flows.
We may not be successful in maintaining and expanding our marketing partnership programs.
We cannot guarantee successful results from the continuation of, or the expansion of, our marketing partnership programs which utilize our opt-in customer database and various in-store marketing initiatives. The success of our marketing partnership programs is highly dependent on the actions and decisions of the third-party consumer products companies to whom we provide these services. Should these third-party consumer products companies decide to limit the services provided by us, go out of business or terminate their agreements with us, our business, financial condition and results of operations could be materially and adversely affected. Further, there is no guarantee that we will be able to expand this part of our business through agreements with new third parties. In addition, our ability to provide the services is highly dependent on our successful collection of opt-in customer data (which is a direct result of customer traffic to our stores and, to a lesser extent, our websites) as well as applicable law relating to the collection and transfer of the personally identifiable information of our customers. A failure on our part to collect adequate amounts of customer data or any change in state, local or federal law which further restricts our ability to collect this information could cause us to terminate or limit the services we can provide to the third-party consumer products companies and would ultimately adversely affect our revenue from these relationships. Further, although we believe there may be an opportunity to more actively market our full customer database to a much broader range of consumer products and services companies that market to families with children, we cannot guarantee that these efforts will be successful.
We require a significant amount of cash to fund our operations and future growth.
Our ability to fund our operations and future growth, depends upon our ability to generate cash. Our success in generating cash depends upon the results of our operations and the amount of cash we use in investing activities, as well as upon general economic, financial, competitive and other factors beyond our control.
An inability to generate sufficient cash could have important consequences. For example, it could:
|
|
• |
increase our vulnerability to general adverse economic and industry conditions; |
|
|
• |
limit our flexibility in planning for, or reacting to, changes in our business and the industry in which we operate; |
|
|
• |
place us at a competitive disadvantage compared to our competitors; |
|
|
• |
limit our ability to borrow money; |
|
|
• |
make it more difficult for us to open new stores or improve or expand existing stores; |
16
|
|
• |
require us to incur significant additional indebtedness; and |
|
|
• |
make it more difficult for us to pursue strategic acquisitions, alliances and partnerships. |
If we do not comply with the terms of our existing debt agreements, and such debt agreements cannot be amended or replaced with new indebtedness, we may be in default of our obligations under such debt agreements.
Our existing debt agreements (including our credit facility and our term loan agreement) contain a number of affirmative and negative covenants and representations and warranties. We have, in the past, been required to seek waivers of compliance with, or amendments of, certain of the financial covenants in the debt agreements, and we may be required to seek such waivers or amendments in the future. Our ability to meet these financial covenants may be affected by events beyond our control, and there can be no assurance that the lenders will grant any required waivers under, or amendments to, the debt agreements if for any reason we are unable to meet the requirements of such covenants.
If we fail to comply with covenants, representations or warranties under our debt agreements and do not either receive a waiver or amendment from our lenders or refinance the indebtedness subject to such agreements, such failure could trigger a default under our debt agreements. If we default, the lenders under those debt agreements could declare all borrowings owed to them, including accrued interest and other fees, to be due and payable, which declaration could have an adverse impact on our business and results of operations.
Our variable rate indebtedness subjects us to interest rate risk, which could cause our debt service obligations to increase significantly.
Our $25.0 million term loan bears interest at a variable rate equal to a LIBOR rate plus 9.00%. Borrowings under our $50.0 million revolving credit facility bear interest at a variable rate equal to, at our election, either the lender’s base rate plus 0.50%, or a LIBOR rate plus 1.50%. Additional borrowings under our revolving credit facility, which could significantly increase in the future, would bear interest at a variable rate. We have exposure for the variable interest rate indebtedness under these debt instruments and, as a result, an increase in interest rates could result in a substantial increase in interest expense, especially if borrowings under our revolving credit facility increase.
The terms of our debt instruments impose financial and operating restrictions.
Our term loan and credit facility agreements each contain restrictive covenants that limit our ability to engage in activities that may be in our long-term best interests. These covenants limit or restrict, among other things, our ability to:
|
|
• |
incur additional indebtedness; |
|
|
• |
pay dividends or make other distributions in respect of our equity securities, or purchase or redeem capital stock, or make certain investments; |
|
|
• |
have our subsidiaries pay dividends, make loans or transfer assets to us; |
|
|
• |
sell assets, including the capital stock of our subsidiaries; |
|
|
• |
enter into any transactions with our affiliates; |
|
|
• |
transfer any capital stock of any subsidiary or permit any subsidiary to issue capital stock; |
|
|
• |
create liens; |
|
|
• |
enter into certain sale/leaseback transactions; |
|
|
• |
effect a consolidation or merger or transfer of all or substantially all of our assets; and |
|
|
• |
engage in other lines of business unless substantially related or incidental to our existing business. |
17
These limitations and restrictions may materially and adversely affect our ability to finance our future operations or capital needs or engage in other business activities that may be in our best interests. In addition, our ability to borrow under the credit facility is subject to the borrowing base requirements of both our term loan and our credit facility agreements. If we breach any of the covenants under our term loan and credit facility agreements, we may be in default under either or both of these agreements. If we default, the lenders under our term loan agreement and the lender under our credit facility agreement could declare all borrowings owed to them, including accrued interest and other fees, to be due and payable. Moreover, our term loan and credit facility agreements provide the lenders considerable discretion to impose reserves or availability blocks, which could materially impair the amount of borrowings that would otherwise be available to us. There can be no assurance that the lenders under the term loan and credit facility agreements will not impose such actions during the term of the debt facility and further, were they to do so, the resulting impact of this action could materially and adversely impair our liquidity.
We depend on our senior leadership team and may not be able to retain or replace these employees or recruit additional qualified personnel, which would harm our business.
Our business and success is materially dependent on attracting and retaining members of our senior leadership team to formulate and execute the Company’s strategic and business plans. In particular, although we currently have a director serving as our interim Chief Executive Officer, we are currently without a permanent Chief Executive Officer. The failure to recruit and hire a new Chief Executive Officer in a timely manner, or the loss of the services of any of our other senior executives, particularly during this transitionary period, could have a material adverse effect on our business and prospects. Leadership changes can be inherently difficult to manage and may cause material disruption to our business or management team. Changes in senior management could lead to an environment that lacks inspiration and/or a lack of commitment by our employees, which could have a material adverse effect on our business.
Our operations in international markets, and our earnings in those markets, may be affected by legal, regulatory, political and economic risks.
We design and contract the manufacture of over 90% of the merchandise we sell using factories located throughout the world, predominantly outside of the United States. As a result, our business is subject to risks associated with international operations. These risks include the burdens of complying with foreign laws and regulations, unexpected changes in tariffs, taxes or regulatory requirements, and political unrest and corruption.
Regulatory changes could limit the countries in which we sell, produce or source our products or significantly increase the cost of operating in or obtaining materials originating from certain countries. Restrictions imposed by such changes can have a particular impact on our business when, after we have moved our operations to a particular location, new unfavorable regulations are enacted in that area or favorable regulations currently in effect are changed.
Countries in which our products are manufactured or sold may from time to time impose additional new regulations, or modify existing regulations, including:
|
|
• |
changes in duties, taxes, tariffs and other charges on imports; |
|
|
• |
limitations on the quantity of goods which may be imported into the United States from a particular country; |
|
|
• |
requirements as to where products and/or inputs are manufactured or sourced; |
|
|
• |
creation of export licensing requirements, imposition of restrictions on export quantities or specification of minimum export pricing and/or export prices or duties; |
|
|
• |
limitations on foreign owned businesses; or |
|
|
• |
government actions to cancel contracts, re-denominate the official currency, renounce or default on obligations, renegotiate terms unilaterally or expropriate assets. |
In addition, political and economic changes or volatility, geopolitical regional conflicts, terrorist activity, political unrest, civil strife, acts of war, public corruption and other economic or political uncertainties could interrupt and negatively affect our business operations. All of these factors could result in increased costs or decreased revenues and could materially and adversely affect our product sales, financial condition and results of operations.
18
Recently, political discourse in the United States has increasingly focused on ways to discourage United States corporations from outsourcing manufacturing and production activities to foreign jurisdictions. Tax proposals may include changes, which could, if implemented, have an adverse impact on us, or new import tariffs, which could adversely affect us because we sell products that are principally manufactured outside the United States. It has also been suggested that the United States may materially modify or withdraw from some of its existing trade agreements. Any of these actions, if ultimately enacted, could adversely affect our results of operations or profitability. Further, our image, the reputation of our brands and our stock price may be adversely affected if we are publicly singled out for criticism by government officials as a result of our foreign operations.
We are also subject to the U.S. Foreign Corrupt Practices Act, in addition to the anti-corruption laws of the foreign countries in which we operate. Although we implement policies and procedures designed to promote compliance with these laws, our employees, contractors and agents, as well as those companies to which we outsource certain of our business operations, may take actions in violation of our policies. Any such violation could result in sanctions or other penalties and have an adverse effect on our business, reputation and operating results.
We may not actually collect the incentive package benefits offered to us in connection with the relocations of our headquarters and distribution facility.
In fiscal 2015 we completed the relocation of our corporate headquarters and distribution operations from Philadelphia, Pennsylvania to southern New Jersey. To help us offset the costs of these relocations, the Board of the New Jersey Economic Development Authority approved us for an incentive package of $40 million in benefits, over a 10-year period, from the State of New Jersey under the Grow New Jersey Assistance Program. In order to receive the benefits of the incentive package we need to meet certain levels of annual jobs and other requirements. If we do not meet these job levels or other requirements on an annual basis, we will not receive some or all of the benefits. Our inability to receive these benefits could have a material adverse impact on our business and results of operations.
We are heavily dependent on our information technology systems and our ability to effectively maintain and upgrade these systems from time to time. Upgrades to our inventory planning and allocation systems and e-commerce platform may not be successful.
Historically, the operation of our vertically-integrated business model relied heavily on our internally-developed information technology systems (“IT Systems”). In particular, we have relied on point-of-sale terminals, which provide information to our core merchandise system used to track sales and inventory, and on our Internet websites through which we sell merchandise to our customers. In order to ensure that our systems are adequate to handle our anticipated business growth and are upgraded as necessary to effectively manage our store inventory and our e-commerce operations, we decided to augment our internal IT Systems with best-in-class third party solutions. In fiscal 2016 we completed the implementation of a best-in-class tool for inventory allocation. In the first quarter of fiscal 2017 we re-platformed our historically internally-managed e-commerce website to a leading third-party digital commerce solution provider, to be integrated with a third-party e-commerce order management system. The cost of these system upgrades and enhancements was significant. There can be no assurance that our investment in these new systems will be successful or that the transition to these new systems will not result in disruptions to our business. If these systems are not successful or if we suffer any such disruptions, our business and results of operations could be materially and adversely affected.
We have two data centers supporting our business functions: one in our corporate headquarters location in Moorestown, New Jersey and the second in our distribution center in Florence, New Jersey. Although our software programs and data are backed up and securely stored off-site, our servers and computer systems, and our operations are vulnerable to damage or interruption from:
|
|
• |
fire, flood and other natural disasters; |
|
|
• |
power loss, computer systems failures, Internet and telecommunications or data network failures; |
|
|
• |
operator negligence, and improper operation by or supervision of employees; |
|
|
• |
physical and electronic loss of data or security breaches, misappropriation and similar events; and |
|
|
• |
computer viruses. |
Any disruption in the operation of our IT Systems, the loss of employees knowledgeable about such systems or our failure to continue to effectively modify such systems could interrupt our operations or interfere with our ability to monitor inventory, which could result in reduced net sales and affect our operations and financial performance. Our business and results of operations could be materially and adversely affected if our servers and systems were inoperable, inaccessible, or inadequate. In addition, any interruption in the operation of our Internet websites could cause us to lose sales due to the inability of customers to purchase merchandise from us through our websites during such interruption.
19
From time to time, we improve and upgrade our IT Systems and the functionality of our Internet websites. For example, we completed the implementation of a new planning and allocation tool and we re-platformed our retail websites from a customized in-house system to a SaaS platform. If we are unable to maintain and upgrade our systems, to integrate new and updated systems, or to successfully re-platform our Internet websites in an efficient and timely manner, our business and results of operations could be materially and adversely affected.
Failure to improve and adapt our inventory management practices to evolving business needs could adversely affect our business.
We design and contract the manufacture of over 90% of the merchandise we sell using factories located throughout the world, predominantly outside of the United States. Fluctuations in the maternity apparel retail market impact the levels of inventory we hold, as merchandise is typically ordered from our contract manufacturers well in advance of the applicable selling season and frequently before fashion trends are confirmed by customer purchases. In addition, the nature of the retail maternity apparel business requires us to carry a significant amount of inventory. As a result, we are vulnerable to demand and pricing shifts and to suboptimal selection and timing of merchandise purchases. In the past, we have not always predicted our customers’ preferences and acceptance levels of our merchandise with accuracy. If sales do not meet expectations, too much inventory may cause excessive markdowns and, therefore, lower than planned margins.
Our current strategic initiatives (which include further expansion of our ecommerce business, increasing the connectivity between our ecommerce business and our brick-and-mortar stores, and our expansion of our wholesale business) further emphasize the importance of increasing the efficiency and responsiveness of our supply chain. These initiatives will challenge our systems and operational approach. If we are unable to adopt our supply chain to meet the demands of these initiatives successfully our operating results could be materially adversely affected.
As an apparel retailer, we rely on numerous third parties in the supply chain to produce and deliver the products that we sell, and our business may be negatively impacted by disruptions in the supply chain.
If we lose the services of one or more of our significant suppliers or one or more of them fail to meet our product needs, we may be unable to obtain replacement merchandise in a timely manner. If our existing suppliers cannot meet our increased needs and we cannot locate alternative supply sources, we may be unable to obtain sufficient quantities of the most popular items at attractive prices, which could negatively impact our sales and results of operations. We obtain apparel and other merchandise from foreign sources, both purchased directly in foreign markets and indirectly through domestic vendors with foreign sources. To the extent that any of our vendors are located overseas or rely on overseas sources for a large portion of their products, any event causing a disruption of imports, including the imposition of import restrictions, could harm our ability to source product. This disruption could materially limit the merchandise that we would have available for sale and reduce our sales and earnings. The flow of merchandise from our vendors could also be materially and adversely affected by financial or political instability, or war, in or affecting any of the countries in which the goods we purchase are manufactured or through which they flow. Trade restrictions in the form of tariffs or quotas, embargoes and customs restrictions that are applicable to the products that we sell also could affect the import of those products and could increase the cost and reduce the supply of products available to us. Any material increase in tariff levels, or any material decrease in quota levels or available quota allocation, could negatively impact our business. Further, changes in tariffs or quotas for merchandise imported from individual foreign countries could lead us to shift our sources of supply among various countries. Any such shift we undertake in the future could result in a disruption of our sources of supply and/or an increase in product costs, and lead to a reduction in our sales and earnings. Supply chain security initiatives undertaken by the United States government that impede the normal flow of product could also negatively impact our business. In addition, decreases in the value of the United States dollar against foreign currencies could increase the cost of products that we purchase from overseas vendors.
We also face a variety of other risks generally associated with relying on vendors that do business in foreign markets and import merchandise from abroad, such as:
|
|
• |
political instability or the threat of terrorism, particularly in countries where our vendors source merchandise; |
|
|
• |
enhanced security measures at United States and foreign ports, which could delay delivery of imports; |
|
|
• |
imposition of new or supplemental duties, taxes and other charges on imports; |
|
|
• |
delayed receipt or non-delivery of goods due to the failure of foreign-source suppliers to comply with applicable import regulations; |
|
|
• |
delayed receipt or non-delivery of goods due to organized labor strikes or unexpected or significant port congestion at United States ports; and |
|
|
• |
local business practice and political issues, including issues relating to compliance with domestic or international labor standards, which may result in adverse publicity. |
20
The United States may impose new initiatives that adversely affect the trading status of countries where apparel is manufactured. These initiatives may include retaliatory duties or other trade sanctions that, if enacted, would increase the cost of products imported from countries where our vendors acquire merchandise. Any of these factors could have a material adverse effect on our business and results of operations.
We could be materially and adversely affected if our distribution operations are disrupted.
To support our distribution of product throughout the world, we currently operate a distribution facility in Florence, New Jersey. Finished garments from contractors and other manufacturers are inspected and stored in our distribution facility. We do not have other distribution facilities to support our distribution needs. If our distribution facility were to shut down or otherwise become inoperable or inaccessible for any reason (such as due to natural disasters, like Hurricane Sandy, which affected our region in early fiscal 2013), we could incur significantly higher costs and longer lead times associated with the distribution of our products to our stores and to our third-party retailers during the time it takes to reopen or replace this facility. In light of our strategic emphasis on rapid replenishment as a competitive strength, a distribution disruption might have a disproportionately adverse effect on our operations and profitability relative to other retailers. In addition, the loss or material disruption of service from any of our shippers for any reason, whether due to freight difficulties, strikes, natural disaster or other difficulties at our principal transport providers or otherwise, could have a material adverse impact on our business and results of operations.
We could be materially and adversely affected if we are unable to obtain sufficient raw materials or maintain satisfactory manufacturing arrangements.
We do not own any manufacturing facilities and therefore depend on third parties to manufacture our products. We place our orders for production of merchandise and raw materials by purchase order and do not have any long-term contracts with any manufacturer or supplier. We compete with many other companies, many of which are larger and have substantially greater financial and other resources than us, for production facilities and raw materials. Furthermore, we have received in the past, and may receive in the future, shipments of products from manufacturers that fail to conform to our quality control standards or environmental standards. In such event, unless we are able to obtain replacement products in a timely manner, we may lose sales. We have no ability to control the environmental compliance (including compliance with climate change requirements) of these third-party manufacturers. If we fail to maintain favorable relationships with these third parties, or if we cannot obtain an adequate supply of quality raw materials on commercially reasonable terms, it could have a material adverse impact on our business, financial condition and results of operations.
Fluctuations in commodity prices could result in an increase in component costs, delivery costs and overall product costs.
The results of our business operations could suffer due to significant increases or volatility in the prices of certain commodities, including but not limited to cotton, wool and other ingredients used in the production of fabric and accessories, as well as fuel, oil and natural gas. In addition, increases in the price of food and food commodities may result in increased labor rates related to textile and apparel production. Increases in prices of these commodities or other inflationary pressures may result in significant cost increases for our raw materials, product components and finished products, as well as increases in the cost of distributing merchandise to our retail locations and shipping products to our customers. For example, in the latter part of fiscal 2011 and for most of fiscal 2012, we experienced product cost of sales increases due, in part, to the increased cost of cotton as well as, to a lesser extent, increased labor rates in certain production countries. To the extent we are unable to offset any such increased costs through value engineering and similar initiatives, or through price increases, our profitability, cash flows and financial condition may be materially and adversely impacted. If we choose to increase prices to offset the increased costs, our unit sales volumes could be adversely impacted.
21
Our quarterly operating results and inventory levels may fluctuate significantly as a result of seasonality in our business.
Our business, like that of other retailers, is seasonal. Results for any quarter are not necessarily indicative of the results that may be achieved for a full fiscal year. Quarterly results may fluctuate materially depending upon, among other things, increases or decreases in comparable sales, the timing of new retail location openings, the timing of retail location closings, net sales and profitability contributed by new retail locations, the timing of the fulfillment of purchase orders under our product, license brand and international business arrangements, adverse weather conditions, shifts in the timing of certain holidays and promotions, changes in inventory and production levels and the timing of deliveries of inventory, and changes in our merchandise mix. Our quarterly net sales were historically highest in the peak Spring selling season during our third fiscal quarter that previously ended on June 30 of our fiscal years that ended on September 30. Under our new 4-5-4 retail fiscal calendar ending on the Saturday nearest January 31, of each year, the peak Spring selling season will generally occur during our new first and second fiscal quarters. Given the historically higher sales level in that timeframe and the relatively fixed nature of most of our operating expenses, we have typically generated a very significant percentage of our full year operating income and net income during the calendar months of March through May. Thus, any factors which result in a material reduction of our sales during the first and second fiscal quarters could have a material adverse effect on our results of operations for our fiscal year as a whole. Seasonal fluctuations in sales also affect our inventory levels, as we usually order merchandise in advance of peak selling periods and sometimes before new fashion trends are confirmed by customer purchases. We must carry a significant amount of inventory, especially before the peak Spring selling season. If we are not successful in selling our inventory during this period, we may be forced to rely on markdowns or promotional sales to sell the excess inventory or we may not be able to sell the inventory at all, which could have a material adverse effect on our business, financial condition and results of operations.
Changes in regulatory and statutory laws, such as increases in the minimum wage, proposed changes to overtime requirements, and new health care laws, and the costs of compliance and non-compliance with such laws, may result in increased costs to our business.
Labor is a primary component in the cost of operating our business. Increased labor costs, whether due to competition, unionization, increased minimum wage, overtime requirements, state unemployment rates, employee benefits costs, employment taxes, or otherwise, may adversely impact our operating expenses. A considerable amount of our store team members are paid at rates related to the federal or state minimum wage and any changes to the minimum wage rate may increase our operating expenses. A number of states and cities in which we do business have recently increased or are considering increasing the minimum wage, with increases generally phased over several years depending upon the size of the employer. We are subject to the Fair Labor Standards Act, which governs such matters as minimum wages, overtime and other working conditions, along with the ADA, family leave mandates and a variety of other laws enacted by the states that govern these and other employment law matters. The Department of Labor is also proposing changes to the technical requirements for classification of employees deemed to be exempt from the overtime requirements of the Fair Labor Standards Act that could increase the number of employees eligible to receive overtime pay. Increases in minimum wages and overtime pay could significantly increase our costs, and our ability to offset these increases through price increases is limited. Changes in labor laws could also increase the likelihood of some or all of our employees being subjected to greater organized labor influence. If a significant portion of our employees were to become unionized, it could have an adverse effect on our business and financial results.
The Patient Protection and Affordable Care Act (the “ACA”) requires employers such as us to provide health insurance for all qualifying employees or pay penalties for not providing coverage. These costs were incurred beginning in fiscal 2016; however, there is no assurance that we will be able to absorb and/or pass through the costs of future heath care legislation in a manner that will not adversely impact our results or operations. Additionally, there are ongoing efforts to modify or eliminate the ACA. It is unknown what form any such modifications or any law proposed to replace the ACA would take, and how or whether it may affect our business in the future.
In addition to employment laws, we are also subject to a wide range of federal, state, provincial and local laws and regulations, including those affecting public companies, product manufacture and sale, and employment matters in the jurisdictions in which we operate, as well as foreign laws and regulations governing our franchisor-franchisee relationships. Compliance with new, complex and changing laws may cause our expenses to increase. In addition, any non-compliance with laws or regulations could result in penalties, fines, product recalls and enforcement actions or otherwise restrict our ability to market certain products or attract or retain employees, which could adversely affect our business, financial condition and results of operations.
22
If an independent contract manufacturer violates labor or other laws, or is accused of violating any such laws, or if their labor practices diverge from those generally accepted as ethical, it could harm our business and brand image.
While we maintain policies and guidelines with respect to labor practices that independent manufacturers that produce goods for us are contractually required to follow, and while we have an independent firm and Company employees inspect certain manufacturing sites to monitor compliance, we cannot control the actions of such manufacturers or the public’s perceptions of them, nor can we assure that these manufacturers will conduct their businesses using ethical or legal labor practices. Apparel companies can be held jointly liable for the wrongdoings of the manufacturers of their products. While many of our independent manufacturers are routinely monitored by buying representatives, who assist us in the areas of compliance, garment quality and delivery, we do not control the manufacturers’ business practices or their employees’ employment conditions, and manufacturers act in their own interest which may be in a manner that results in negative public perceptions of us, and/or employee allegations against us, or court determinations that we are jointly liable. Violations of law by our importers, buying agents, independent manufacturers or distributors could result in delays in shipments and receipt of goods and could subject us to fines or other penalties, any of which could restrict our business activities, increase our operating expenses or cause our sales to decline.
We may be unable to protect our trademarks and other intellectual property and may be subject to liability if we are alleged to have infringed on another party’s intellectual property.
We believe that our trademarks, service marks and other intellectual property are important to our continued success and our competitive position due to their recognition with our customers. We devote substantial resources to the establishment and protection of our trademarks, service marks and other intellectual property. Although we actively protect our intellectual property, there can be no assurance that the actions that we have taken to establish and protect our trademarks, service marks and other intellectual property, including our rights in our IT Systems and our proprietary rights in products for which we have applied for or received patent protection will be adequate to prevent imitation of our marks, products or services by others or to prevent others from seeking to block sales of our products as a violation of their trademarks, service marks or other proprietary rights. Also, others may assert rights in, or ownership of, our trademarks and other proprietary rights or may allege that we have or are infringing on their intellectual property rights and we may not be able to successfully resolve these types of conflicts. In addition, the laws of certain foreign countries may not protect our trademarks and proprietary rights to the same extent as do the laws of the United States. We cannot assure that these registrations will prevent imitation of our name, merchandising concept, store design or private label merchandise, or the infringement of our other intellectual property rights by others. Imitation of our name, merchandising concept, store design or private label merchandise in a manner that projects lesser quality or carries a negative connotation of our brand image could have a material adverse effect on our business, financial condition and results of operations. Additionally, the high expense in both prosecuting and defending against, and potential liability related to, alleged infringements of intellectual property rights could be substantial and could have a material adverse effect on our business, financial condition and results of operations.
A cybersecurity incident could have a negative impact on our business and results of operations.
A cyber-attack may bypass the security for our IT Systems causing an IT System security breach and lead to a material disruption of our IT Systems and/or the loss of business information and/or Internet sales. Such a cyber-attack could result in any of the following:
|
|
• |
theft, destruction, loss, misappropriation or release of confidential data or intellectual property; |
|
|
• |
operational or business delays resulting from the disruption of IT Systems and subsequent clean-up and mitigation activities; |
|
|
• |
negative publicity resulting in reputation or brand damage with our customers, partners or industry peers; and |
|
|
• |
loss of sales generated through our Internet websites through which we sell merchandise to customers, to the extent these websites are affected by a cyber-attack. |
As a result, our business and results of operations could be materially and adversely affected.
23
If climate change laws or regulations were to become applicable to our business, or if any third party with whom we have a leased department or international business relationship imposed reporting or other obligations on us due to their own compliance programs, we could incur additional expense to meet the requirements and our failure to comply could have a material adverse effect on our business.
With respect to manufacturing within the United States, United States Environmental Protection Agency (“EPA”) greenhouse gas (“GHG”) emission reporting rules require certain United States manufacturers to report GHG emissions. These rules are unlikely to require reporting of our third-party contract apparel manufacturers because the amount of emissions from retail stores and apparel manufacturing facilities are currently estimated to be below the EPA reporting threshold. With respect to manufacturing outside of the United States, international treaties, such as the Kyoto Protocol and the Copenhagen Protocol, do not currently require the countries in which our non-United States contract apparel manufacturers are located to control GHG emissions and it is unlikely that climate change requirements in the foreseeable future will require significant GHG emission reductions on our non-United States contract apparel manufacturers. Our manufacturers are required to follow all applicable laws, including climate change laws. If domestic or international laws or regulations were expanded to require GHG emission reporting or reduction by us or our third-party contract apparel manufacturers, or if we engage third-party contract manufacturers in countries that have existing GHG emission reporting or reduction laws or regulations, we would need to expend financial and other resources to comply with such regulations and/or monitor our third-party contract apparel manufacturers’ compliance with such regulations. In addition, we cannot control the actions of our third-party manufacturers or the public’s perceptions of them, nor can we assure that these manufacturers will conduct their businesses using climate change proactive or sustainable practices. Violations of climate change laws or regulations by third parties with whom we do business could result in negative public perception of us and/or delays in shipments and receipt of goods, and could subject us to fines or other penalties, any of which could restrict our business activities, increase our operating expenses or cause our sales to decline.
Some retailers have adopted “sustainability” or other policies that encourage or require suppliers to report and/or reduce GHG emissions. No third party with whom we have a leased department, licensed brand or international franchise relationship currently requires us to report GHG emissions to them. However, we expect that certain of these third parties may do so in the future, which would require us to expend financial and other resources to comply with such requirements. In addition, if such requirements are imposed on us, our relationship with such third parties could be damaged if we were unable to comply.
War, acts of terrorism or other types of mall violence or the threat of any such hostilities may negatively impact availability of merchandise and otherwise adversely impact our business.
Most of our stores are located in shopping malls. Any threat of terrorist attacks or actual terrorist events, or other types of mall violence, such as shootings in malls, particularly in public areas, could lead to lower customer traffic in shopping malls. In addition, our ability to obtain merchandise available for sale and consumer demand for our merchandise may be negatively affected. Local authorities or mall management could close shopping malls in response to security concerns. Mall closures, as well as lower customer traffic due to security concerns, could result in decreased sales. Additionally, the armed conflicts and civil unrest in the Middle East, or the threat, escalation or commencement of war or other armed conflict elsewhere, could significantly diminish consumer spending, and result in decreased sales for us. Decreased sales could have a material adverse effect on our business, financial condition and results of operations.
A substantial portion of our merchandise is imported from other countries. In addition, we not only generate sales in the United States and Canada through our own retail locations, but also in foreign countries through our leased department or international franchise relationships. If goods become difficult or impossible to import into the United States, and if we cannot obtain such merchandise from other sources at similar costs, our sales and profit margins may be materially and adversely affected. Further, if consumer demand in any country where we do business is negatively affected, our sales in such country would suffer. In the event that commercial transportation is curtailed or substantially delayed, our business may be materially and adversely impacted, as we may have difficulty shipping merchandise to our main distribution facility, retail locations, and international business partners, as well as fulfilling Internet orders.
Our charter documents contain certain anti-takeover provisions, and we are entitled to certain other protective provisions under Delaware law.
We are a Delaware corporation and the anti-takeover provisions of Delaware law impose various impediments to the ability of a third party to acquire control of the Company, even if a change of control would be beneficial to our existing stockholders. In addition, our amended and restated certificate of incorporation and bylaws contain provisions that may discourage, delay or prevent a merger or acquisition involving us that our stockholders may consider favorable by, among other things:
|
|
• |
authorizing the issuance of preferred stock, the terms of which may be determined at the discretion of our Board of Directors; |
|
|
• |
restricting the ability of stockholders to call special meetings of stockholders; and |
|
|
• |
establishing advance notice requirements for nominations for election to our Board of Directors or for proposing matters that can be acted on by stockholders at meetings. |
24
These provisions may also reduce the market value of our common stock.
We have been and may continue to be the subject of actions taken by so-called “activist” stockholders, which may cause us to incur substantial costs which could harm our business and which could adversely affect our operating results and financial condition.
We have been and may continue to be the subject of actions taken by so-called “activist” stockholders. Future actions may include, but are not limited to, making public demands that we consider certain strategic alternatives for the Company, engaging in public campaigns to attempt to influence our corporate governance and/or our management, and commencing proxy contests to attempt to elect the activists’ representatives or others to our Board of Directors. Responding to actions by activist stockholders can be costly and time-consuming, disrupting our operations and diverting the attention of management and our employees. Such actions may materially harm our relationships with current and potential customers, current and potential stockholders, current and potential lenders, and others, may otherwise materially harm our business, and may adversely affect our operating results and financial condition. In addition, the perceived uncertainties as to our future direction also could affect the market price and volatility of our securities.
The increase in our sales and marketing efforts that target markets outside the United States and Canada expose us to additional risks associated with international operations.
Although an immaterial amount of our sales are currently derived from international sales outside of Canada, we have franchise arrangements in the Middle East, South Korea, Mexico, Israel and India. International operations and sales subject us to risks and challenges that we would otherwise not face if we conducted our business only in the United States. For example, we may depend on third parties to market our products through foreign sales channels, and we may be challenged by laws and business practices favoring local competitors. In addition, our ability to succeed in foreign markets will depend on our ability to protect our intellectual property. We must also adapt our pricing structure to address different pricing environments and may face difficulty in enforcing revenue collection internationally. To the extent emerging markets are a part of our international growth strategy, the developing nature of these markets presents a number of risks. Deterioration of social, political, labor or economic conditions in a specific country or region and difficulties in staffing and managing foreign operations may also materially and adversely affect our operations or financial results or those of our franchisees. Operations outside the United States may be affected by changes in trade protection laws, policies and measures, and other regulatory requirements affecting trade and investment, including the Foreign Corrupt Practices Act and local laws prohibiting corrupt payments. To the extent we achieve significant sales outside of the United States in the future, we may have significant exposure to fluctuating foreign currency exchange rates.
Although our initial international strategy has consisted primarily of franchising, licensing or similar arrangements with foreign partners, for certain markets we may consider direct investment in international operations, such as by entering into joint ventures or developing our own operations in certain countries. This approach will expose us to the risks identified above with respect to franchising as well as to the risk of loss of our direct investment (such as, for example, loss on investments made through capital contributions in a joint venture, and/or in connection with capital expenditures to develop our own operations in certain countries). Further, the risk of direct investment in a joint venture in which we are a minority owner presents the unique risk of having a significant investment in a business that is controlled by, and effectively operated by, an unrelated third party.
We could have failures in our system of internal controls causing us to inaccurately report our financial results or to fail to prevent fraud.
We maintain a documented system of internal controls which is reviewed and monitored by management, who meet regularly with our Audit Committee of the Board of Directors. We believe we have a well-designed system to maintain adequate internal controls over the business. We cannot assure you that there will not be any control deficiencies in the future. Should we become aware of any significant deficiencies or material weaknesses, we would report them to the Audit Committee and recommend prompt remediation. We devote significant resources to document, test, monitor and improve our internal controls and will continue to do so; however, we cannot be certain that these measures will ensure that our controls are adequate in the future or that adequate controls will be effective in preventing fraud. If we fail to maintain an effective system of internal controls, we may not be able to accurately report our financial results or prevent fraud. Any failures in the effectiveness of our internal controls could have a material adverse effect on our financial condition or operating results or cause us to fail to meet reporting obligations.
Not applicable.
25
In 2013 we entered into a Lease Agreement (“HQ Lease”) to lease a 74,000 square foot Class A office building located Moorestown, New Jersey. After completion of renovations, we moved into this facility in 2015 and it now serves as our corporate headquarters. The HQ Lease had an initial term of eleven years with an option to extend for an additional ten years at the expiration of the initial term. In fiscal 2017 this lease was amended to extend the expiration date to December 2023.
In 2013 we entered into a Single-Tenant Industrial Lease (“DC Lease”) to lease a new 406,000 square foot build-to-suit building located in Florence, New Jersey. After completion of building construction and the installation and testing of our fully-integrated material handling equipment and software system, in 2015 we completed the move into our distribution center. The DC Lease has a term of 15 years. In addition, we have three option periods, each for five years, to extend the DC Lease for a total of an additional 15 years after the expiration of the initial term. We believe that our facilities will be adequate to support our anticipated distribution needs. In the event we need additional space to meet our future distribution needs, we believe that such space would be readily available.
Previously our principal executive offices and distribution facility were located in Philadelphia, Pennsylvania. To help us offset the costs of our relocations, the Board of the New Jersey Economic Development Authority (“NJEDA”) approved us for an incentive package of up to $40 million in benefits, over a 10-year period, from the State of New Jersey under the Grow New Jersey Assistance Program (“Grow NJ”).
Our facilities are subject to state and local regulations that range from building codes to health and safety regulations.
We lease our store premises for initial terms averaging from five to ten years. Certain leases allow us to terminate or reduce our obligations at specified points in time in the event that the applicable store does not achieve a specified sales volume. Some of our store leases also provide for contingent payments based on sales volume, escalations of the base rent, as well as increases in operating costs, marketing costs and real estate taxes.
As of February 3, 2018, the following numbers of store leases are set to expire during our future fiscal years ending on the Saturday nearest January 31 of each year, as listed in the table below. We do not expect the expiration of any leases to have a material adverse impact on our business or operations.
|
Fiscal Year Leases Expire |
|
|
Number of Stores |
|
|
2018 |
|
|
143 |
|
|
2019 |
|
|
97 |
|
|
2020 |
|
|
51 |
|
|
2021 |
|
|
35 |
|
|
2022 |
|
|
28 |
|
|
2023 and later |
|
|
133 |
|
|
Total |
|
|
487 |
In addition to the stores we operate, we have arrangements with department and specialty stores, including Macy’s, buybuy BABY and Boscov’s to operate maternity apparel departments in their stores. These leased departments typically involve the retail partner collecting all of the revenue from the leased department. The revenue is remitted to us, less a fixed percentage of the net sales earned by the retail partner as stipulated in the agreement. We provide at least some amount of staffing for each of the leased departments, with the amount varying depending on the specific arrangement. Generally, under each of our leased department agreements, our retail partner has the right to terminate any or all of our rights to operate our leased departments in their stores subject to varying notice requirements.
From time to time, we are named as a defendant in legal actions arising from our normal business activities. Litigation is inherently unpredictable and although the amount of any liability that could arise with respect to currently pending actions cannot be accurately predicted, we do not believe that the resolution of any pending action will have a material adverse effect on our financial position, results of operations or liquidity.
Not applicable.
26
|
Item 5. |
Market for Registrant’s Common Equity, Related Stockholder Matters and Issuer Purchases of Equity Securities |
Our common stock is traded on the Nasdaq Global Select Market under the symbol “DEST.” The following table sets forth for the periods indicated below the reported high and low sales prices of our common stock, as reported on the Nasdaq Global Select Market, and the per share amount of cash dividends paid on our common stock:
|
|
|
Market Prices |
|
|||||||
|
|
|
High |
|
|
Low |
|
||||
|
Fiscal Year Ended February 3, 2018: |
|
|
|
|
|
|
|
|
|
|
|
Quarter ended February 3, 2018 |
|
$ |
3.45 |
|
|
$ |
2.05 |
|
|
|
|
Quarter ended October 28, 2017 |
|
|
3.06 |
|
|
|
1.02 |
|
|
|
|
Quarter ended July 29, 2017 |
|
|
4.98 |
|
|
|
1.61 |
|
|
|
|
Quarter ended April 29, 2017 |
|
|
5.88 |
|
|
|
3.18 |
|
|
|
|
|
|
|
|
|
|
|
|
|
|
|
|
Fiscal Year Ended January 28, 2017: |
|
|
|
|
|
|
|
|
|
|
|
Quarter ended January 28, 2017 |
|
$ |
|
8.42 |
|
|
$ |
4.83 |
|
|
|
Quarter ended October 29, 2016 |
|
|
|
7.63 |
|
|
|
4.90 |
|
|
|
Quarter ended July 30, 2016 |
|
|
|
7.17 |
|
|
|
5.03 |
|
|
|
Quarter ended April 30, 2016 |
|
|
|
10.24 |
|
|
|
6.12 |
|
|
As of April 11, 2017, there were 1,107 holders of record and 2,296 estimated beneficial holders of our common stock.
Our Term Loan Agreement, originally entered into in March 2016 and subsequently amended, prohibits the payment of dividends through February 1, 2021. Accordingly, no cash dividends were paid by the Company during fiscal 2016 or fiscal 2017. We intend to retain all future earnings to finance the growth of our business, and do not, therefore, anticipate paying any cash dividends on our common stock in the foreseeable future. Future cash dividends, if any, will be determined by our Board of Directors and will be based upon our earnings, capital requirements, financial condition, debt covenants and other factors deemed relevant by our Board of Directors.
Under our Amended and Restated 2005 Equity Incentive Plan (the “2005 Plan”) awards may be granted in the form of options, stock appreciation rights, restricted stock, restricted stock units or deferred stock units. Up to 3,550,000 shares of our common stock may be issued in respect of awards under our 2005 Plan. No more than 2,250,000 of those shares are permitted to be issued in respect of restricted stock, restricted stock units or deferred stock units, with a limit of 177,500 shares that may be issued with service requirements of less than one year.
The following table provides information about purchases by us during the quarter ended February 3, 2018 of equity securities that are registered by us pursuant to Section 12 of the Exchange Act:
|
Period |
|
Total |
|
|
Average Price |
|
|
Total Number of |
|
|
Maximum |
|
||||||||
|
October 29, 2017 to November 25, 2017 |
|
|
|
829 |
|
|
|
$ |
|
2.87 |
|
|
|
|
— |
|
|
|
— |
|
|
November 26, 2017 to December 30, 2017 |
|
|
|
3,420 |
|
|
|
$ |
|
2.62 |
|
|
|
|
— |
|
|
|
— |
|
|
December 31, 2017 to February 3, 2018 |
|
|
|
— |
|
|
|
$ |
|
— |
|
|
|
|
— |
|
|
|
— |
|
|
Total |
|
|
|
4,249 |
|
|
|
$ |
|
|
|
|
|
|
— |
|
|
|
— |
|
|
(1) |
Represents shares repurchased directly from certain employees to satisfy income tax withholding obligations for such employees in connection with stock options that were exercised and restricted stock awards that vested during the period. |
27
The graph below compares the cumulative total stockholder return on our common stock for the period from September 30, 2012 to February 3, 2018 with the cumulative total return of the Standard & Poor’s 500 Index and the Standard & Poor’s 500 Apparel Retail Index. The comparison assumes $100 was invested on September 30, 2011 in our common stock and in each of the foregoing indices and assumes reinvestment of dividends. The stock performance shown in the graph is not intended to forecast or be indicative of future performance.
COMPARISON OF CUMULATIVE TOTAL RETURN
Among Destination Maternity Corporation, the S&P 500 Index
and the S&P 500 Apparel Retail Index
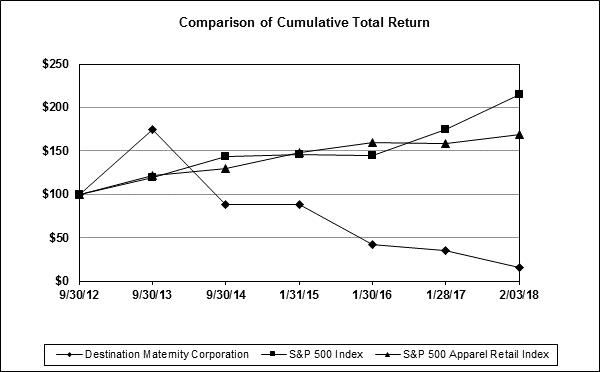
Fiscal periods ended as follows:
|
|
|
Year Ended |
|
|
Four Months Ended |
|
|
Year Ended |
|
|||||||||||||||||||
|
|
|
September 30, 2012 |
|
|
September 30, 2013 |
|
|
September 30, 2014 |
|
|
January 31, 2015 |
|
|
January 30, 2016 |
|
|
January 28, 2017 |
|
|
February 3, 2018 |
|
|||||||
|
Destination Maternity Corporation |
|
$ |
100.00 |
|
|
$ |
175.06 |
|
|
$ |
88.04 |
|
|
$ |
88.39 |
|
|
$ |
42.31 |
|
|
$ |
35.67 |
|
|
$ |
15.12 |
|
|
S&P 500 Index |
|
$ |
100.00 |
|
|
$ |
119.34 |
|
|
$ |
142.89 |
|
|
$ |
145.44 |
|
|
$ |
144.47 |
|
|
$ |
174.62 |
|
|
$ |
214.49 |
|
|
S&P 500 Apparel Retail Index |
|
$ |
100.00 |
|
|
$ |
121.82 |
|
|
$ |
129.68 |
|
|
$ |
147.97 |
|
|
$ |
159.15 |
|
|
$ |
158.59 |
|
|
$ |
169.12 |
|
28
The following tables set forth selected consolidated statement of operations data, operating data, other consolidated financial data, and consolidated balance sheet data as of and for the periods indicated. The selected consolidated statement of operations and balance sheet data for each of the periods presented below are derived from our consolidated financial statements. You should read this information in conjunction with “Management’s Discussion and Analysis of Financial Condition and Results of Operations” and our consolidated financial statements and the related notes included elsewhere in this report.
|
|
|
Year Ended |
|
|
Four Months Ended |
|
|
Year Ended |
|
|||||||||||||||
|
|
|
February 3, 2018 |
|
|
January 28, 2017 |
|
|
January 30, 2016 |
|
|
January 31, 2015 |
|
|
September 30, 2014 |
|
|
September 30, 2013 |
|
||||||
|
|
|
|
(in thousands, except per share amounts) |
|
||||||||||||||||||||
|
Consolidated Statement of Operations Data: |
|
|
|
|
|
|
|
|
|
|
|
|
|
|
|
|
|
|
|
|
|
|
|
|
|
Net sales |
|
$ |
406,207 |
|
|
$ |
433,699 |
|
|
$ |
498,753 |
|
|
$ |
165,644 |
|
|
$ |
516,959 |
|
|
$ |
540,259 |
|
|
Cost of goods sold |
|
|
192,355 |
|
|
|
206,271 |
|
|
|
252,713 |
|
|
|
96,667 |
|
|
|
247,501 |
|
|
|
249,298 |
|
|
Gross profit |
|
|
213,852 |
|
|
|
227,428 |
|
|
|
246,040 |
|
|
|
68,977 |
|
|
|
269,458 |
|
|
|
290,961 |
|
|
Selling, general and administrative expenses |
|
|
218,656 |
|
|
|
223,881 |
|
|
|
246,914 |
|
|
|
86,688 |
|
|
|
250,253 |
|
|
|
252,026 |
|
|
Store closing, asset impairment and asset disposal (income) expenses |
|
|
6,292 |
|
|
|
2,768 |
|
|
|
(2,084 |
) |
|
|
4,599 |
|
|
|
1,469 |
|
|
|
1,441 |
|
|
Other charges, net |
|
|
4,912 |
|
|
|
4,914 |
|
|
|
6,979 |
|
|
|
5,354 |
|
|
|
3,229 |
|
|
|
— |
|
|
Operating income (loss) |
|
|
(16,008 |
) |
|
|
(4,135 |
) |
|
|
(5,769 |
) |
|
|
(27,664 |
) |
|
|
14,507 |
|
|
|
37,494 |
|
|
Interest expense, net |
|
|
4,045 |
|
|
|
3,575 |
|
|
|
1,520 |
|
|
|
242 |
|
|
|
404 |
|
|
|
532 |
|
|
Loss on extinguishment of debt |
|
|
1,542 |
|
|
|
— |
|
|
|
— |
|
|
|
— |
|
|
|
— |
|
|
|
9 |
|
|
Income (loss) before income taxes |
|
|
(21,595 |
) |
|
|
(7,710 |
) |
|
|
(7,289 |
) |
|
|
(27,906 |
) |
|
|
14,103 |
|
|
|
36,953 |
|
|
Income tax provision (benefit) |
|
|
2 |
|
|
|
25,050 |
|
|
|
(2,806 |
) |
|
|
(10,526 |
) |
|
|
3,606 |
|
|
|
13,010 |
|
|
Net income (loss) |
|
$ |
(21,597 |
) |
|
$ |
(32,760 |
) |
|
$ |
(4,483 |
) |
|
$ |
(17,380 |
) |
|
$ |
10,497 |
|
|
$ |
23,943 |
|
|
Net income (loss) per share—Basic |
|
$ |
(1.57 |
) |
|
$ |
(2.39 |
) |
|
$ |
(0.33 |
) |
|
$ |
(1.28 |
) |
|
$ |
0.78 |
|
|
$ |
1.80 |
|
|
Average shares outstanding—Basic |
|
|
13,788 |
|
|
|
13,702 |
|
|
|
13,596 |
|
|
|
13,541 |
|
|
|
13,451 |
|
|
|
13,272 |
|
|
Net income (loss) per share—Diluted |
|
$ |
(1.57 |
) |
|
$ |
(2.39 |
) |
|
$ |
(0.33 |
) |
|
$ |
(1.28 |
) |
|
$ |
0.77 |
|
|
$ |
1.78 |
|
|
Average shares outstanding—Diluted |
|
|
13,788 |
|
|
|
13,702 |
|
|
|
13,596 |
|
|
|
13,541 |
|
|
|
13,572 |
|
|
|
13,439 |
|
29
|
|
|
Year Ended |
|
|
Four Months Ended |
|
|
Year Ended |
|
|||||||||||||||||
|
|
|
February 3, 2018 |
|
|
January 28, 2017 |
|
|
January 30, 2016 |
|
|
January 31, 2015 |
|
|
September 30, 2014 |
|
|
September 30, 2013 |
|
||||||||
|
|
|
|
(unaudited; in thousands, except operating data, ratios and per share amounts) |
|
||||||||||||||||||||||
|
Operating Data: |
|
|
|
|
|
|
|
|
|
|
|
|
|
|
|
|
|
|
|
|
|
|
|
|
||
|
Comparable sales increase (decrease) – reported basis (1) (2) (3) |
|
|
(1.5 |
)% |
|
|
(5.3 |
)% |
|
|
(1.5 |
)% |
|
|
(2.0 |
)% |
|
|
(3.7 |
)% |
|
|
2.6 |
% |
||
|
Comparable sales increase (decrease) – adjusted for calendar timing shift (1) (2) (3) |
|
|
N.A. |
|
|
|
N.A. |
|
|
|
N.A |
|
|
|
(2.7 |
)% |
|
|
(3.7 |
)% |
|
|
3.2 |
% |
||
|
Internet sales increase |
|
|
40.7 |
% |
|
|
9.0 |
% |
|
|
0.7 |
% |
|
|
13.8 |
% |
|
|
2.6 |
% |
|
|
13.3 |
% |
||
|
Average net sales per gross square foot (4) |
|
$ |
232 |
|
|
$ |
255 |
|
|
$ |
254 |
|
|
$ |
85 |
|
|
$ |
272 |
|
|
$ |
278 |
|
||
|
Average net sales per store (4) |
|
$ |
512,000 |
|
|
$ |
559,000 |
|
|
$ |
555,000 |
|
|
$ |
184,000 |
|
|
$ |
579,000 |
|
|
$ |
594,000 |
|
||
|
Gross store square footage at period end (5) |
|
|
1,053,000 |
|
|
|
1,131,000 |
|
|
|
1,164,000 |
|
|
|
1,226,000 |
|
|
|
1,233,000 |
|
|
|
1,285,000 |
|
||
|
Gross retail location square footage at period end (6) |
|
|
1,431,000 |
|
|
|
1,549,000 |
|
|
|
1,766,000 |
|
|
|
1,841,000 |
|
|
|
1,855,000 |
|
|
|
1,903,000 |
|
||
|
Number of retail locations at period end: |
|
|
|
|
|
|
|
|
|
|
|
|
|
|
|
|
|
|
|
|
|
|
|
|
||
|
Motherhood Maternity stores |
|
|
385 |
|
|
|
408 |
|
|
|
425 |
|
|
|
450 |
|
|
|
454 |
|
|
|
476 |
|
||
|
A Pea in the Pod stores |
|
|
27 |
|
|
|
26 |
|
|
|
23 |
|
|
|
24 |
|
|
|
25 |
|
|
|
31 |
|
||
|
Destination Maternity stores |
|
|
75 |
|
|
|
81 |
|
|
|
88 |
|
|
|
90 |
|
|
|
89 |
|
|
|
89 |
|
||
|
Total stores |
|
|
487 |
|
|
|
515 |
|
|
|
536 |
|
|
|
564 |
|
|
|
568 |
|
|
|
596 |
|
||
|
Leased departments |
|
|
637 |
|
|
|
705 |
|
|
|
1,279 |
|
|
|
1,311 |
|
|
|
1,326 |
|
|
|
1,311 |
|
||
|
Total retail locations |
|
|
1,124 |
|
|
|
1,220 |
|
|
|
1,815 |
|
|
|
1,875 |
|
|
|
1,894 |
|
|
|
1,907 |
|
||
|
|
|
|
|
|
|
|
|
|
|
|
|
|
|
|
|
|
|
|
|
|
|
|
|
|
||
|
Other Consolidated Financial Data: |
|
|
|
|
|
|
|
|
|
|
|
|
|
|
|
|
|
|
|
|
|
|
|
|
||
|
Adjusted EBITDA (7) (8) |
|
$ |
8,862 |
|
|
$ |
18,358 |
|
|
$ |
16,101 |
|
|
$ |
(16,815 |
) |
|
$ |
30,556 |
|
|
$ |
54,003 |
|
||
|
Adjusted EBITDA margin (adjusted EBITDA as a percentage of net sales) (8) |
|
|
2.2 |
% |
|
|
4.2 |
% |
|
|
3.2 |
% |
|
|
(10.2 |
)% |
|
|
5.9 |
% |
|
|
10.0 |
% |
||
|
Adjusted EBITDA before other charges (7) (8) |
|
|
13,010 |
|
|
|
23,272 |
|
|
|
22,847 |
|
|
|
(11,732 |
) |
|
|
36,768 |
|
|
|
54,003 |
|
||
|
Adjusted EBITDA margin before other charges (8) |
|
|
3.2 |
% |
|
|
5.4 |
% |
|
|
4.6 |
% |
|
|
(7.1 |
)% |
|
|
7.1 |
% |
|
|
10.0 |
% |
||
|
Adjusted net income (loss) (8) |
|
|
(10,193 |
) |
|
|
(1,946 |
) |
|
|
(168 |
) |
|
|
(14,109 |
) |
|
|
10,700 |
|
|
|
22,733 |
|
||
|
Adjusted net income (loss) per share—Diluted (8) |
|
|
(0.74 |
) |
|
|
(0.14 |
) |
|
|
(0.01 |
) |
|
|
(1.04 |
) |
|
|
0.79 |
|
|
|
1.69 |
|
||
|
Cash flows provided by operating activities |
|
|
8,867 |
|
|
|
10,711 |
|
|
|
16,094 |
|
|
|
3,831 |
|
|
|
25,845 |
|
|
|
42,153 |
|
||
|
Cash flows used in investing activities |
|
|
(6,667 |
) |
|
|
(12,785 |
) |
|
|
(29,400 |
) |
|
|
(21,866 |
) |
|
|
(29,544 |
) |
|
|
(16,022 |
) |
||
|
Cash flows provided by (used in) financing activities |
|
|
(3,426 |
) |
|
|
2,816 |
|
|
|
14,081 |
|
|
|
6,805 |
|
|
|
(8,279 |
) |
|
|
(23,926 |
) |
||
|
Capital expenditures |
|
|
(6,649 |
) |
|
|
(12,690 |
) |
|
|
(29,272 |
) |
|
|
(21,098 |
) |
|
|
(40,185 |
) |
|
|
(15,059 |
) |
||
|
|
|
|
|
|
|
|
|
|
|
|
|
|
|
|
|
|
|
|
|
|
|
|
|
|
||
|
Consolidated Balance Sheet Data (at end of period): |
|
|
|
|
|
|
|
|
|
|
|
|
|
|
|
|
|
|
|
|
|
|
|
|
||
|
Cash and cash equivalents |
|
$ |
1,635 |
|
|
$ |
2,859 |
|
|
$ |
2,116 |
|
|
$ |
1,349 |
|
|
$ |
12,580 |
|
|
$ |
24,555 |
|
||
|
Working capital |
|
|
15,715 |
|
|
|
26,483 |
|
|
|
15,851 |
|
|
|
37,433 |
|
|
|
56,276 |
|
|
|
75,276 |
|
||
|
Total assets |
|
|
162,582 |
|
|
|
175,987 |
|
|
|
219,074 |
|
|
|
220,060 |
|
|
|
230,533 |
|
|
|
207,981 |
|
||
|
Total debt |
|
|
36,589 |
|
|
|
43,033 |
|
|
|
40,599 |
|
|
|
15,000 |
|
|
|
— |
|
|
|
— |
|
||
|
Net (debt) cash (8) (9) |
|
|
(34,954 |
) |
|
|
(40,174 |
) |
|
|
38,483 |
) |
|
|
(13,651 |
) |
|
|
12,580 |
|
|
|
24,555 |
|
||
|
Stockholders’ equity |
|
|
40,668 |
|
|
|
61,150 |
|
|
|
92,898 |
|
|
|
106,002 |
|
|
|
125,521 |
|
|
|
122,633 |
|
||
|
N.A. |
Not applicable |
|
(1) |
Comparable sales figures represent comparable store sales and Internet sales. |
30
|
comparable sales from “at least 12 full months at the beginning of a period” to “at least 13 full months”; and (b) expressly providing that retail locations which are closed temporarily for 30 days or more will generally be excluded from comparable sales. We made these changes because we believe the new formulation is more typical of that used by other specialty retailers. In addition, comparable sales as determined under the revised definition will allow for easier reconciliation of monthly, quarterly and annual reporting. We have not restated prior period comparable sales figures because the changes would not be material in the aggregate considering the relatively minor changes to the definition. |
|
(3) |
Prior to the change in our fiscal year end, we reported sales on a calendar period basis, rather than on a “4-5-4 retail fiscal calendar” where each fiscal period starts on a Sunday and ends on a Saturday. Thus, for each calendar-based fiscal year, there is a “days adjustment calendar shift” which may help or hurt reported calendar-based fiscal year sales and comparable sales due to different days of the week typically contributing more sales than other days of the week. In order to quantify and eliminate the effect on reported comparable sales results of the “days adjustment calendar shift”, we also present comparable sales on a calendar-adjusted basis. For example, for the transition period calendar-adjusted comparable sales were measured for the period Wednesday, October 1, 2014 through Saturday, January 31, 2015 compared to the period Tuesday, October 1, 2013 through Friday, January 31, 2014, and for fiscal 2014 calendar-adjusted comparable sales were measured for the period Tuesday, October 1, 2013 through Tuesday, September 30, 2014 compared to the period Tuesday, October 2, 2012 through Tuesday, October 1, 2013. |
|
(4) |
Based on stores in operation by us during the entire period (which does not include leased department, licensed brand or international franchise relationships). |
|
(5) |
Based on stores in operation by us at the end of the period (which does not include leased department, licensed brand or international franchise relationships). |
|
(6) |
Based on all retail locations in operation at the end of the period (which does not include licensed brand or international franchise relationships). |
|
(7) |
Adjusted EBITDA represents operating income (loss) before deduction for the following non-cash charges: (i) depreciation and amortization expense; (ii) loss on impairment of tangible and intangible assets; (iii) loss (gain) on disposal of assets; and (iv) stock-based compensation expense. We have presented Adjusted EBITDA to enhance your understanding of our operating results. |
|
(8) |
Other consolidated financial and consolidated balance sheet data contain non-GAAP financial measures and ratios within the meaning of the SEC’s Regulation G, including: (i) Adjusted EBITDA, (ii) Adjusted EBITDA margin, (iii) Adjusted EBITDA before other charges, (iv) Adjusted EBITDA margin before other charges, (v) Adjusted net income (loss), (vi) Adjusted net income (loss) per share-Diluted, and (vii) Net (debt) cash. We believe that each of these non-GAAP financial measures and ratios provides useful information about our results of operations and/or financial position to both investors and management. Each non-GAAP financial measure and ratio is provided because we believe it is an important measure of financial performance used in the retail industry to measure operating results, to determine the value of companies within the industry and to define standards for borrowing from institutional lenders. We use each of these non-GAAP financial measures and ratios as a measure of the performance of the Company. In addition, certain of the Company’s cash and equity incentive compensation plans are based on our level of achievement of Adjusted EBITDA before other charges. We provide these non-GAAP financial measures and ratios to investors to assist them in performing their analysis of our historical operating results. The non-GAAP financial measures and ratios included in Other Consolidated Financial Data reflect a measure of our operating results before consideration of certain charges or credits, when applicable, and consequently, none of these measures and ratios should be construed as an alternative to net income or operating income as an indicator of our operating performance, or as an alternative to cash flows from operating activities as a measure of our liquidity, as determined in accordance with generally accepted accounting principles. We may calculate each of these non-GAAP financial measures and ratios differently than other companies. With respect to the non-GAAP financial measures included in Other Consolidated Financial Data, we have presented below a reconciliation of the non-GAAP financial measures to the most directly comparable GAAP financial measures. |
|
(9) |
Net (debt) cash represents cash and cash equivalents minus total debt. |
31
Reconciliation of Net Income (Loss) to Adjusted EBITDA
and Adjusted EBITDA Before Other Charges
(in thousands)
(unaudited)
|
|
|
Year Ended |
|
|
Four Months Ended |
|
|
Year Ended |
|
|||||||||||||||
|
|
|
February 3, 2018 |
|
|
January 28, 2017 |
|
|
January 30, 2016 |
|
|
January 31, 2015 |
|
|
September 30, 2014 |
|
|
September 30, 2013 |
|
||||||
|
Net income (loss) |
|
$ |
(21,597 |
) |
|
$ |
(32,760 |
) |
|
$ |
(4,483 |
) |
|
$ |
(17,380 |
) |
|
$ |
10,497 |
|
|
$ |
23,943 |
|
|
Add: income tax provision (benefit) |
|
|
2 |
|
|
|
25,050 |
|
|
|
(2,806 |
) |
|
|
(10,526 |
) |
|
|
3,606 |
|
|
|
13,010 |
|
|
Add: interest expense, net |
|
|
4,045 |
|
|
|
3,575 |
|
|
|
1,520 |
|
|
|
242 |
|
|
|
404 |
|
|
|
532 |
|
|
Add: loss on extinguishment of debt |
|
|
1,542 |
|
|
|
— |
|
|
|
— |
|
|
|
— |
|
|
|
— |
|
|
|
9 |
|
|
Operating income (loss) |
|
|
(16,008 |
) |
|
|
(4,135 |
) |
|
|
(5,769 |
) |
|
|
(27,664 |
) |
|
|
14,507 |
|
|
|
37,494 |
|
|
Add: depreciation and amortization expense |
|
|
17,592 |
|
|
|
18,032 |
|
|
|
17,231 |
|
|
|
5,223 |
|
|
|
15,197 |
|
|
|
12,424 |
|
|
Add: loss on impairment of long-lived assets |
|
|
5,775 |
|
|
|
2,388 |
|
|
|
1,662 |
|
|
|
4,444 |
|
|
|
1,136 |
|
|
|
786 |
|
|
Add: loss (gain) on disposal of assets |
|
|
349 |
|
|
|
272 |
|
|
|
193 |
|
|
|
109 |
|
|
|
(4,031 |
) |
|
|
528 |
|
|
Add: stock-based compensation expense |
|
|
1,154 |
|
|
|
1,801 |
|
|
|
2,784 |
|
|
|
1,073 |
|
|
|
3,747 |
|
|
|
2,771 |
|
|
Adjusted EBITDA |
|
|
8,862 |
|
|
|
18,358 |
|
|
|
16,101 |
|
|
|
(16,815 |
) |
|
|
30,556 |
|
|
|
54,003 |
|
|
Add: other charges (1) |
|
|
4,912 |
|
|
|
4,914 |
|
|
|
6,746 |
|
|
|
5,083 |
|
|
|
6,212 |
|
|
|
— |
|
|
Less: change in accounting principle |
|
|
(764 |
) |
|
|
— |
|
|
|
— |
|
|
|
— |
|
|
|
— |
|
|
|
— |
|
|
Adjusted EBITDA before other charges |
|
$ |
13,010 |
|
|
$ |
23,272 |
|
|
$ |
22,847 |
|
|
$ |
(11,732 |
) |
|
$ |
36,768 |
|
|
$ |
54,003 |
|
|
Adjusted EBITDA margin |
|
|
2.2 |
% |
|
|
4.2 |
% |
|
|
3.2 |
% |
|
|
(10.2 |
)% |
|
|
5.9 |
% |
|
|
10.0 |
% |
|
Adjusted EBITDA margin before other charges |
|
|
3.2 |
% |
|
|
5.4 |
% |
|
|
4.6 |
% |
|
|
(7.1 |
)% |
|
|
7.1 |
% |
|
|
10.0 |
% |
|
(1) |
For fiscal 2015, 2014 and the four months ended January 31, 2015 other charges excludes accelerated depreciation expense of $233, $1,127 and $271, respectively, included in depreciation and amortization expense above. For fiscal 2014 other charges excludes gain on sale of building of $4,110, included in gain on disposal of assets above. |
Reconciliation of Net Income (Loss) to Adjusted Net Income (Loss) and
Net Income (Loss) Per Share – Diluted to Adjusted Net Income (Loss) Per Share – Diluted
(in thousands, except per share amounts)
(unaudited)
|
|
|
Year Ended |
|
|
Four Months Ended |
|
|
Year Ended |
|
|||||||||||||||
|
|
|
February 3, 2018 |
|
|
January 28, 2017 |
|
|
January 30, 2016 |
|
|
January 31, 2015 |
|
|
September 30, 2014 |
|
|
September 30, 2013 |
|
||||||
|
Net income (loss) |
|
$ |
(21,597 |
) |
|
$ |
(32,760 |
) |
|
$ |
(4,483 |
) |
|
$ |
(17,380 |
) |
|
$ |
10,497 |
|
|
$ |
23,943 |
|
|
Add: other charges |
|
|
4,912 |
|
|
|
4,914 |
|
|
|
6,979 |
|
|
|
5,354 |
|
|
|
3,229 |
|
|
|
— |
|
|
Less: income tax effect of other charges (1) |
|
|
(1,764 |
) |
|
|
(1,858 |
) |
|
|
(2,664 |
) |
|
|
(2,028 |
) |
|
|
(1,202 |
) |
|
|
|
|
|
Add: loss on extinguishment of debt |
|
|
1,542 |
|
|
|
— |
|
|
|
— |
|
|
|
— |
|
|
|
— |
|
|
|
9 |
|
|
Less: income tax effect of loss on extinguishment of debt (2) |
|
|
(554 |
) |
|
|
— |
|
|
|
— |
|
|
|
— |
|
|
|
— |
|
|
|
(3 |
) |
|
Less: effect of change in accounting principle |
|
|
(764 |
) |
|
|
|
|
|
|
|
|
|
|
|
|
|
|
|
|
|
|
|
|
|
Add: tax effect of change in accounting principle (1) |
|
|
274 |
|
|
|
|
|
|
|
|
|
|
|
|
|
|
|
|
|
|
|
|
|
|
Add: deferred tax valuation allowance related to cumulative losses |
|
|
7,758 |
|
|
|
27,758 |
|
|
|
— |
|
|
|
— |
|
|
|
— |
|
|
|
— |
|
|
Less: reductions of state income tax expense, net of federal expense, related to settlements of uncertain income tax positions |
|
|
— |
|
|
|
— |
|
|
|
— |
|
|
|
(55 |
) |
|
|
(1,824 |
) |
|
|
— |
|
|
Less: recognition of state income tax benefits resulting from regulation changes |
|
|
— |
|
|
|
— |
|
|
|
— |
|
|
|
— |
|
|
|
— |
|
|
|
(1,216 |
) |
|
Adjusted net income (loss) |
|
$ |
(10,193 |
) |
|
$ |
(1,946 |
) |
|
$ |
(168 |
) |
|
$ |
(14,109 |
) |
|
$ |
10,700 |
|
|
$ |
22,733 |
|
|
Net income (loss) per share—Diluted |
|
$ |
(1.57 |
) |
|
$ |
(2.39 |
) |
|
$ |
(0.33 |
) |
|
$ |
(1.28 |
) |
|
$ |
0.77 |
|
|
$ |
1.78 |
|
|
Average shares outstanding—Diluted |
|
|
13,788 |
|
|
|
13,702 |
|
|
|
13,596 |
|
|
|
13,541 |
|
|
|
13,572 |
|
|
|
13,439 |
|
|
Adjusted net income (loss) per share—Diluted |
|
$ |
(0.74 |
) |
|
$ |
(0.14 |
) |
|
$ |
(0.01 |
) |
|
$ |
(1.04 |
) |
|
$ |
0.79 |
|
|
$ |
1.69 |
|
|
Average shares outstanding—Diluted |
|
|
13.788 |
|
|
|
13,702 |
|
|
|
13,596 |
|
|
|
13,541 |
|
|
|
13,572 |
|
|
|
13,439 |
|
|
(1) |
Income tax effect represents the difference in income tax provision calculated with and without the specified pretax expense. |
32
We define our fiscal year as the 52 or 53 week period ending on the Saturday closest to January 31. This annual report is for the 53 week fiscal year ended February 3, 2018 (fiscal 2017). The fiscal years ended January 31, 2017 (fiscal 2016) and January 30, 2016 (fiscal 2015) consisted of 52 weeks. In December 2014 we announced a change of our fiscal year end from September 30 to the Saturday closest to January 31. We had a transition period from October 1, 2014 through January 31, 2015 and filed a Transition Report on Form 10-Q for such transition period. References in this Form 10-K to our fiscal years prior to fiscal 2015 refer to the fiscal years ended on September 30 in those years.
Overview
The following discussion should be read in conjunction with the consolidated financial statements and their related notes included elsewhere in this report.
We are the leading designer and omni-channel retailer of maternity apparel in the United States, with the only nationwide chain of maternity apparel specialty stores, as well as a deep and expansive product assortment available through multiple online distribution points, including our three brand-specific websites. As of February 3, 2018, we operated 1,124 retail locations, including 487 stores in the United States, Canada and Puerto Rico, and 637 leased departments located within department stores and baby specialty stores throughout the United States and in Puerto Rico. We also sell our merchandise on the Internet, primarily through our Motherhood.com, APeaInThePod.com and DestinationMaternity.com websites. We also sell our merchandise through our Canadian website, MotherhoodCanada.ca, through Amazon.com in the United States, and through websites of certain of our retail partners, including Macys.com. Our 487 stores operate under three retail nameplates: Motherhood Maternity®, A Pea in the Pod® and Destination Maternity®. We also operate 637 leased departments within leading retailers such as Macy’s®, buybuy BABY® and Boscov’s®. Generally, we are the exclusive maternity apparel provider in our leased department locations.
Currently, we operate 28 stores and five leased departments in Canada, including 24 Motherhood stores, three Destination Maternity combo stores and one Destination Maternity superstore, and a Motherhood website under a Canadian URL (MotherhoodCanada.ca). In addition, we have international store and product supply relationships in the Middle East, South Korea, Mexico, Israel and India. As of February 3, 2018, we had 188 international franchised locations, comprised of 15 stand-alone stores 173 shop-in-shop locations, in which we have a Company-branded department operated by our franchise partners within other retail stores. We design and contract the manufacture of over 90% of the merchandise we sell using sewing factories located throughout the world, predominantly outside of the United States. Substantially all of the merchandise produced outside of the United States is paid for in United States dollars.
In assessing the performance of our business, we consider a variety of operational and financial measures. The key measures for determining how our business is performing are net income (loss) determined in accordance with generally accepted accounting principles (“net income (loss)”) and the corresponding net income (loss) (or earnings (loss)) per share (diluted), net income (loss) before certain charges or credits, when applicable, such as other charges, loss on extinguishment of debt and certain infrequent income tax adjustments (“adjusted net income (loss)”) and the corresponding earnings (loss) per share (diluted), Adjusted EBITDA, Adjusted EBITDA before other charges, net sales, and comparable sales (which consists of comparable store sales and Internet sales). Adjusted EBITDA represents operating income (loss) before deduction for the following non-cash charges: 1) depreciation and amortization expense, 2) loss on impairment of tangible and intangible assets, 3) loss (gain) on disposal of assets, and 4) stock-based compensation expense.
Comparable sales figures represent sales at retail locations (which does not include licensed brand or international franchise relationships) that have been in operation by us for at least 13 full months, as well as Internet sales. Our comparable sales figures generally do not include: 1) retail locations which change location type or format, 2) retail locations which are expanded, contracted or relocated if the square footage of the retail location has changed by 20% or more, or, if in the judgment of management, such expansion, contraction or relocation materially alters the comparability of the retail location (either with respect to the manner of its operation or otherwise), 3) in the case of relocations only, retail locations which are not in the same immediate geographical vicinity (such as, without limitation, the same mall, the same part of a mall, or the same street) after the relocation, 4) retail locations that have temporarily closed for any reason for 30 days or more, or 5) retail locations which, in the judgment of management, have undergone other significant changes which materially alter the comparability of the retail location (either with respect to the manner of its operation or otherwise) (such as, for example only, in the case of closure of retail locations in connection with the cessation of a leased department relationship where the manner of operation of such retail location has been materially altered prior to closure, or in the case of construction in, on or near a retail location, which significantly interferes with the customer traffic, visibility or operation of a retail location). Comparable sales exclude the 53rd week of sales for 53-week fiscal years. In the 52-week fiscal year subsequent to a 53-week fiscal year, we exclude the sales in the non-comparable week from the comparable sales calculation. There may be variations in the way in which other retailers calculate comparable sales. As a result, data in this quarterly report regarding our comparable sales may not be comparable to similar data made available by other retailers.
33
On December 19, 2016 we entered into the Merger Agreement, pursuant to which, subject to the satisfaction or waiver of certain conditions, a subsidiary of Orchestra would merge with and into the Company, with the Company surviving as a wholly-owned subsidiary of Orchestra. Despite substantial and sustained efforts by both parties since execution of the Merger Agreement, and in light of the challenges of satisfying applicable securities regulations in France and in the U.S. as well as the uncertainty as to whether those regulatory requirements could be satisfied without unreasonable effort and expense, particularly in connection with the completion of the registration and listing of Orchestra securities in the U.S., where such securities previously have not been publicly traded, the parties determined that it was in the best interests of their respective stockholders to terminate the Merger Agreement. Accordingly, on July 27, 2017 the Company, Orchestra, and certain other affiliates of Orchestra entered into a Termination Agreement pursuant to which the parties agreed to terminate the Merger Agreement and various ancillary agreements entered into in connection with and in contemplation of the Merger. Orchestra and the Company agreed to reimburse each other for certain costs incurred in connection with their effort to implement the Merger Agreement, with a net amount of $1.0 million paid to the Company on July 31, 2017. Orchestra and its affiliates last reported they continue to own 1.9 million shares of the outstanding common stock of Destination Maternity. In fiscal 2017 and fiscal 2016 we recognized $1.2 million and $3.2 million, respectively, of charges related to the Merger, including $0.6 million of charges in the third and fourth quarters of fiscal 2017 related to a contested proxy solicitation initiated by Orchestra.
Turnaround Plan
While we have succeeded in maintaining our leadership position within this specialty retail sector, in an effort to enhance our competitive position, in late fiscal 2014 we commenced a program, which we sometimes refer to as our “turnaround plan” or “turnaround” to actively focus on improving our business processes, key management personnel and planning resources. These efforts became increasingly challenged by a number of external factors and industry trends, including the overall weakness in the women's specialty apparel retail space as well as declining mall-based traffic. These challenges have led to a slower pace of progress than originally planned, resulting in a decline in net sales from fiscal 2016 and underperformance to 2017 expectations.
In order to address the challenges that we and other retailers are facing, we have taken decisive action to best position us for profitable, long-term growth, with a focus on improving inventory management, driving sales productivity, optimizing real estate, expanding our online presence and controlling costs. Among other efforts, we conducted a comprehensive evaluation of our key apparel brands and business relationships, resulting in strategic phase-outs and the elimination of certain non-core brands.
During late fiscal 2016 and the first half of fiscal 2017 we incurred significant expenses and expended substantial management time, attention and energy in seeking to complete the Merger. Those expenditures, although made in pursuit of a transaction we believed would be in the best interest of our stockholders, nevertheless had a negative impact on the execution of our operations and turnaround plan. After termination of the Merger we have taken actions focused on preserving and creating value for our stockholders. We retained a leading consulting firm to review our costs and business strategy in order to implement an organizational transformation. We are in the process of executing a CEO transition having announced on September 7, 2017 the resignation of Anthony M. Romano as our Former CEO. B. Allen Weinstein, then a member of our Board of Directors, served as our Interim CEO from September 7, 2017 until his retirement on January 2, 2018. Since that date, Melissa Payner-Gregor, an independent director since 2009, has served as our interim Chief Executive Officer. We also paid one-time retention bonuses with service conditions to certain key management personnel, while reducing our overall headcount to create a more efficient and effective operating structure. Through these actions we are identifying further opportunities to improve profitability, by growing both top line and gross margins while reducing expenses. We expect this transformation to yield approximately $10 to $11 million per year in annualized expense savings primarily starting in fiscal 2018.
During fiscal 2017 and fiscal 2016 we recognized $3.7 million and $1.8 million, respectively, of charges related to our turnaround plan.
Fiscal 2017 Financial Results
Presented below is a summary of our results for the years ended February 3, 2018 and January 28, 2017 with regard to each of the key measures noted above.
|
|
• |
Net sales for fiscal 2017 decreased 6.3% to $406.2 million from $433.7 million for fiscal 2016. |
|
|
• |
Net loss for fiscal 2017 was $21.6 million, or $1.57 per share (diluted), compared to net loss of $32.8 million, or $2.39 per share (diluted), for fiscal 2016, which included a $27.8 million non-cash income tax charge. |
34
|
|
• |
Adjusted net loss for fiscal 2017 was $10.2 million, or $0.74 per share (diluted), compared to the comparably adjusted net loss for fiscal 2016 of $1.9 million, or $0.14 per share (diluted). |
|
|
• |
Adjusted EBITDA was $8.9 million for fiscal 2017, compared to $18.4 million of Adjusted EBITDA for fiscal 2016. |
|
|
• |
Adjusted EBITDA before other charges was $13.0 million for fiscal 2017, compared to $23.3 million of Adjusted EBITDA before other charges for fiscal 2016. |
|
|
• |
Comparable sales for fiscal 2017 decreased 1.5% versus a comparable sales decrease of 5.3% for fiscal 2016. |
Leased Department and Licensed Relationships
In addition to the stores we operate, we have arrangements with department stores and baby specialty stores, including Macy’s, buybuy BABY and Boscov’s to operate maternity apparel departments in their stores. Generally, we are the exclusive maternity apparel provider in our leased department locations. We staff these leased departments at varying levels and maintain control of the pricing and promotional terms, as well as the timing and degree of the markdowns of our merchandise that is sold in the leased departments. We operate our leased departments during the same hours and days as the host store and are responsible for replenishment of the merchandise in the leased departments. These leased departments typically involve the lease partner collecting all of the revenue from the leased department. The revenue is remitted to us, less a fixed percentage of the net sales earned by the lease partner as stipulated in each agreement.
We previously had an exclusive product and license agreement with Kohl’s, to which we sold maternity apparel under the Oh Baby by Motherhood® brand. We phased out production of our Oh Baby line during fiscal 2016 after being informed that Kohl’s had elected to scale back and ultimately discontinue its exclusive license with us for this line. Our license agreement with Kohl’s ended in February 2017. We are not a party to any other similar licensed relationship at this time.
Fiscal Year Ended February 3, 2018 Compared to Fiscal Year Ended January 28, 2017
Results of Operations
The following table sets forth certain operating data from our consolidated statements of operations in thousands of dollars, as a percentage of net sales and as a percentage change for the periods indicated:
|
|
|
Twelve Months Ended |
|
|
|
|
|
|||||||||||||||||||
|
|
|
February 3, 2018 |
|
|
January 28, 2017 |
|
|
|
% Period to |
|
||||||||||||||||
|
|
|
|
Amount (in thousands) |
|
|
|
% of Net Sales (1) |
|
|
|
Amount (in thousands) |
|
|
|
% of Net Sales (1) |
|
|
|
Period Favorable (Unfavorable) |
|
||||||
|
Net sales |
|
$ |
406,207 |
|
|
|
|
100.0 |
% |
|
|
$ |
433,699 |
|
|
|
|
100.0 |
% |
|
|
|
|
(6.3 |
)% |
|
|
Cost of goods sold (2) |
|
|
192,355 |
|
|
|
|
47.4 |
|
|
|
|
206,271 |
|
|
|
|
47.6 |
|
|
|
|
|
6.7 |
|
|
|
Gross profit |
|
|
213,852 |
|
|
|
|
52.6 |
|
|
|
|
227,488 |
|
|
|
|
52.4 |
|
|
|
|
|
(6.0) |
|
|
|
Selling, general and administrative expenses (3) |
|
|
218,656 |
|
|
|
|
53.8 |
|
|
|
|
223,881 |
|
|
|
|
51.6 |
|
|
|
|
|
2.3 |
|
|
|
Store closing, asset impairment and asset disposal expenses (income) |
|
|
6,292 |
|
|
|
|
1.5 |
|
|
|
|
2,768 |
|
|
|
|
0.6 |
|
|
|
|
|
(127.3 |
) |
|
|
Other charges, net |
|
|
4,912 |
|
|
|
|
1.2 |
|
|
|
|
4,914 |
|
|
|
|
1.1 |
|
|
|
|
|
0.0 |
|
|
|
Operating loss |
|
|
(16,008 |
) |
|
|
|
(3.9 |
) |
|
|
|
(4,135 |
) |
|
|
|
(1.0 |
) |
|
|
|
|
(287.1 |
)% |
|
|
Interest expense, net |
|
|
4,045 |
|
|
|
|
1.0 |
|
|
|
|
3,575 |
|
|
|
|
0.8 |
|
|
|
|
|
(13.1 |
) |
|
|
Loss on extinguishment of debt |
|
|
1,542 |
|
|
|
|
0.4 |
|
|
|
|
— |
|
|
|
|
— |
|
|
|
|
|
— |
|
|
|
Loss before income taxes |
|
|
(21,595 |
) |
|
|
|
(5.3 |
) |
|
|
|
(7,710 |
) |
|
|
|
(1.8 |
) |
|
|
|
|
(180.1 |
) |
|
|
Income tax provision (benefit) |
|
|
2 |
|
|
|
|
0.0 |
|
|
|
|
25,050 |
|
|
|
|
5.8 |
|
|
|
|
|
(100.0 |
) |
|
|
Net loss |
|
$ |
(21,597 |
) |
|
|
|
(5.3 |
)% |
|
|
$ |
(32,760 |
) |
|
|
|
(7.6 |
)% |
|
|
|
|
(34.1 |
)% |
|
|
(1) |
Components may not add to total due to rounding. |
35
|
(3) |
Selling, general and administrative expenses include advertising and marketing expenses, corporate administrative expenses, corporate headquarters occupancy expenses, store expenses (including store payroll and store occupancy expenses), and store opening expenses, partially offset by the allocable amount of our Grow NJ award benefit. |
The following tables set forth certain information regarding the number of our retail locations and international franchised locations, for the periods indicated.
|
|
Twelve Months Ended |
|
|||||||||||||||||||||||||||||||||
|
|
February 3, 2018 |
|
|
January 28, 2017 |
|
||||||||||||||||||||||||||||||
|
Retail Locations (1) |
Stores |
|
|
Leased Departments |
|
|
Total Retail Locations |
|
|
Stores |
|
|
Leased Departments |
|
|
Total Retail Locations |
|
||||||||||||||||||
|
Beginning of period |
|
|
515 |
|
|
|
|
|
705 |
|
|
|
|
|
1,220 |
|
|
|
|
|
536 |
|
|
|
|
|
1,279 |
|
|
|
|
|
1,815 |
|
|
|
Opened |
|
|
7 |
|
|
|
|
|
7 |
|
|
|
|
|
14 |
|
|
|
|
|
11 |
|
|
|
|
|
10 |
|
|
|
|
|
21 |
|
|
|
Closed |
|
|
(35 |
) |
|
|
|
|
(75 |
) |
|
|
|
|
(110 |
) |
|
|
|
|
(32 |
) |
|
|
|
|
(584 |
) |
|
|
|
|
(616 |
) |
|
|
End of period |
|
|
487 |
|
|
|
|
|
637 |
|
|
|
|
|
1,124 |
|
|
|
|
|
515 |
|
|
|
|
|
705 |
|
|
|
|
|
1,220 |
|
|
|
(1) |
Excludes international franchised locations, and locations where Kohl’s sold our products under an exclusive product and license agreement. Our license agreement with Kohl’s ended in February 2017. |
|
|
Twelve Months Ended |
|
|||||||||||||||||||||||||||||||||
|
|
February 3, 2018 |
|
|
January 28, 2017 |
|
||||||||||||||||||||||||||||||
|
International Franchised Locations |
Stores |
|
|
Shop-in- Shop Locations |
|
|
Total International Franchised Locations |
|
|
Stores |
|
|
Shop-in- Shop Locations |
|
|
Total International Franchised Locations |
|
||||||||||||||||||
|
Beginning of period |
|
|
19 |
|
|
|
|
|
194 |
|
|
|
|
|
213 |
|
|
|
|
|
25 |
|
|
|
|
|
168 |
|
|
|
|
|
193 |
|
|
|
Opened |
|
|
0 |
|
|
|
|
|
8 |
|
|
|
|
|
8 |
|
|
|
|
|
2 |
|
|
|
|
|
64 |
|
|
|
|
|
66 |
|
|
|
Closed |
|
|
(4 |
) |
|
|
|
|
(29 |
) |
|
|
|
|
(33 |
) |
|
|
|
|
(8 |
) |
|
|
|
|
(38 |
) |
|
|
|
|
(46 |
) |
|
|
End of period |
|
|
15 |
|
|
|
|
|
173 |
|
|
|
|
|
188 |
|
|
|
|
|
19 |
|
|
|
|
|
194 |
|
|
|
|
|
213 |
|
|
Net Sales. Our net sales for fiscal 2017 decreased by 6.3%, or $27.5 million, to $406.2 million from $433.7 million for fiscal 2016. Comparable sales for fiscal 2017decreased 1.5% compared to a comparable sales decrease of 5.3% for fiscal 2016. The decrease in total sales for fiscal 2017 compared to fiscal 2016 resulted primarily from the wind down of the Kohl’s, Sears and Gordmans relationships, the net closure of locations, the decline in comparable store sales of 1.5%, which reflects the net result of a decrease in brick and mortar comparable sales of 9.2% and an increase in ecommerce sales of 40.7%. These decreases were partially offset by increases in fiscal 2017 related to sales during the 53rd week of the retail calendar and the recognition of $0.8 million of revenue related to a change in our method of accounting for gift card breakage.
As of February 3, 2018, we operated a total of 487 stores and 1,124 total retail locations: 385 Motherhood Maternity stores (including 96 Motherhood Maternity Outlet stores), 27 A Pea in the Pod stores, 75 Destination Maternity stores, and 637 leased maternity apparel departments. In comparison, as of January 28, 2017 we operated a total of 515 stores and 1,220 total retail locations: 408 Motherhood Maternity stores (including 97 Motherhood Maternity Outlet stores), 26 A Pea in the Pod stores, 81 Destination Maternity stores, and 705 leased maternity apparel departments. As of February 3, 2018, our store total included 75 multi-brand Destination Maternity nameplate stores, including 43 Destination Maternity combo stores and 32 Destination Maternity superstores. In comparison, as of January 28, 2017 we operated 81 multi-brand Destination Maternity nameplate stores, including 48 Destination Maternity combo stores and 33 Destination Maternity superstores. During fiscal 2017 we opened 7 stores, and closed 35 stores. In addition, during fiscal 2017 we opened 7 leased department locations and closed 75 leased department locations.
Gross Profit. Our gross profit for fiscal 2017 decreased by 6.0%, or $13.5 million, to $213.9 million from $227.4 million for fiscal 2016, and our gross margin for fiscal 2017 was 52.6% compared to 52.4% for fiscal 2016. The decrease in gross profit for fiscal 2017 compared to fiscal 2016 was primarily due to our lower sales volume as a result of the factors discussed above, partially offset by the increased gross margin. The year over year increase in gross margin primarily reflects reduced product costs and our exit from former leased department and licensed relationships, which historically generated lower than average gross margins
36
Selling, General and Administrative Expenses. Our selling, general and administrative expenses for fiscal 2017 decreased by 2.3%, or $5.2 million, to $218.7 million from $223.9 million for fiscal 2016. As a percentage of net sales, selling, general and administrative expenses increased to 53.8% for fiscal 2017 from 51.6% for fiscal 2016. This decrease in expense in fiscal 2017 compared to fiscal 2016 reflects cost reductions resulting from our continued closure of underperforming stores, the wind down of the Kohl’s, Sears and Gordmans relationships and other employee cost reductions, partially offset by increased marketing and advertising costs related to the increase in ecommerce sales, and expenses related to the additional 53rd week of operations in fiscal 2017. The increase in expense as a percent of sales reflects the unfavorable leverage from our decreased sales due to the relatively fixed nature of much of our expenses.
Store Closing, Asset Impairment and Asset Disposal Expenses (Income). For fiscal 2017 we had $6.3 million of expense from store closings, asset impairments and asset disposals compared to $2.8 million of expense for fiscal 2016.
Other Charges, Net. In fiscal 2017 we incurred other charges of $4.9 million related to a proposed business combination and other corporate activities, and to management and organizational changes. Other net charges related to the proposed business combination and other corporate activities were approximately $1.2 million, primarily for legal and advisory fees. Other charges related to management and organizational changes were $3.7 million, primarily for costs related to severance and other benefits related to our former Chief Executive Officer and other reductions in headcount, consulting fees, and retention bonuses for certain key management. In fiscal 2016 we incurred other charges of $4.9 million related to a proposed business combination, primarily for legal and advisory fees. Other charges related to management and organizational changes were $1.8 million, primarily for costs related to severance and other benefits, and to a lesser extent, to terminate certain non-core apparel brand relationships.
Operating Loss. We had an operating loss of $16.0 million for fiscal 2017 compared to an operating loss of $4.1 million for fiscal 2016. The $11.9 million increase in operating loss reflects our lower gross profit as a result of the decline in sales volume, as well as higher asset impairment charges, partially offset by reduced selling, general and administrative expenses.
Interest Expense, Net. Our net interest expense for fiscal 2017 increased to $4.0 million from $3.6 million in fiscal 2016. This increase was due to our higher effective borrowing rate and timing related to our first quarter of fiscal 2016 debt refinancing and interest expense for our new equipment financing arrangement. This increase was partially offset by lower average borrowings under our Credit Facility and reductions in the principal balance under our term loan and prior equipment note.
Loss on Extinguishment of Debt. During fiscal 2017 we recorded a loss on extinguishment of debt of $1.5 million as a result of the repayment of our outstanding term loan. Refer to Note 9, “Long-term Debt,” in our Notes to Consolidated Financial Statements for further details on our debt transactions.
Income Tax Provision (Benefit). The 2017 U.S. Tax Cuts and Jobs Act (the “TCJA”) was enacted on December 22, 2017. The TCJA includes a number of changes to the U.S. corporate income tax, including a reduction of the corporate income tax rate from 35% to 21% for tax years beginning after December 31, 2017, enhancing and extending through 2026 the option to claim accelerated depreciation on qualified property, eliminating the corporate alternative minimum tax (AMT) and changing how existing AMT credits can be utilized, a new limitation on deductible interest expense and limitations on the use of net operating loss carryforwards created in tax years beginning after December 31, 2017. For fiscal 2017 the Company used a blended effective tax rate of 33.7% which represents the prorata percentage from the TCJA’s January 1, 2018 effective date and our February 3, 2018 fiscal year-end. The Company recorded an $10.2 million reduction in our net deferred tax asset to reflect the remeasurement of the asset value from a tax rate of 35% to 21%. The Company had previously recorded a valuation allowance against its deferred tax assets therefore the revaluation did not have an impact on our 2017 tax provision.
For fiscal 2017 our income tax provision was $0.0 million compared to income tax provision of $25.1 million for fiscal 2016. In the fourth quarter of fiscal 2016 we recorded a non-cash charge of $27.8 million as a valuation allowance against substantially all of our deferred tax assets. In fiscal 2017 we continued to record a valuation allowance against our deferred tax assets. Our effective tax rate for fiscal 2017, excluding the effect of the valuation allowance and impact on the value of our deferred tax assets from the rate change enacted under the TCJA, was a benefit of 33.2% compared to a benefit of 35.1% for fiscal 2016. This benefit reduction was primarily the result of the reduction in the federal effective tax rate from 35% in fiscal 2016 to 33.7% in fiscal 2017.
Net Loss. Net loss for fiscal 2017 was $21.6 million, or $1.57 per share (diluted), compared to net loss of $32.8 million, or $2.39 per share (diluted), for fiscal 2016. Net loss for fiscal 2017 includes a $7.8 million, non-cash charge related to a change in the valuation allowance against net deferred tax assets, other charges of $3.2 million, net of tax, related to management and organizational changes, and the now terminated merger, a non-cash charge form the loss on extinguishment of debt, net of tax, of $1.0 million and revenue of $0.5 million net of tax, related to a cumulative adjustment for change in accounting principle. After these adjustments, our adjusted net loss for fiscal 2017 was $10.2 million, or $0.74 per share (diluted). Net loss for fiscal 2016 was primarily related to a non-cash valuation allowance charge of $27.8 million against our deferred tax assets, other charges of $2.0 million, net of tax, related to a proposed business combination and $1.1 million, net of tax, related to management and organizational changes. Before these charges, our adjusted net loss for fiscal 2016 was $1.9 million, or $0.14 per share (diluted),
37
Our average diluted shares outstanding of 13.8 million for fiscal 2017 were slightly higher than the 13.7 million average diluted shares outstanding for fiscal 2016. We had higher shares outstanding in fiscal 2017 compared to fiscal 2016 as a result of the vesting of restricted stock awards.
Following is a reconciliation of net loss and net loss per share (diluted) (“Diluted EPS”) to adjusted net loss and adjusted Diluted EPS for the twelve months ended February 3, 2018 and January 28, 2017 (in thousands, except per share amounts):
|
|
|
Twelve Months Ended |
|
|||||||||||||||||||||
|
|
|
February 3 2018 |
|
|
January 28, 2017 |
|
||||||||||||||||||
|
|
|
Net Loss |
|
|
Diluted Shares |
|
|
Diluted EPS |
|
|
Net Loss |
|
|
Diluted Shares |
|
|
Diluted EPS |
|
||||||
|
As reported |
|
$ |
(21,597 |
) |
|
|
13,788 |
|
|
$ |
(1.57 |
) |
|
$ |
(32,760 |
) |
|
|
13,702 |
|
|
$ |
(2.39 |
) |
|
Add: other charges for proposed business combination |
|
|
1,198 |
|
|
|
— |
|
|
|
|
|
|
|
3,154 |
|
|
|
— |
|
|
|
|
|
|
Add: other charges for management and organizational changes |
|
|
3,714 |
|
|
|
— |
|
|
|
|
|
|
|
1,760 |
|
|
|
— |
|
|
|
|
|
|
Less: income tax effect of other charges (1) |
|
|
(1,764 |
) |
|
|
|
|
|
|
|
|
|
|
(1,858 |
) |
|
|
|
|
|
|
|
|
|
Add: loss on extinguishment of debt |
|
|
1,542 |
|
|
|
— |
|
|
|
|
|
|
|
— |
|
|
|
— |
|
|
|
|
|
|
Less: income tax effect of loss on extinguishment of debt |
|
|
(554 |
) |
|
|
— |
|
|
|
|
|
|
|
— |
|
|
|
— |
|
|
|
|
|
|
Less: effect of change in accounting principle |
|
|
(764 |
) |
|
|
|
|
|
|
|
|
|
|
|
|
|
|
|
|
|
|
|
|
|
Add; income tax effect of change in accounting principle |
|
|
274 |
|
|
|
|
|
|
|
|
|
|
|
|
|
|
|
|
|
|
|
|
|
|
Add: deferred tax valuation allowance |
|
|
7,758 |
|
|
|
— |
|
|
|
|
|
|
|
27,758 |
|
|
|
— |
|
|
|
|
|
|
As adjusted |
|
$ |
(10,193 |
) |
|
|
13,788 |
|
|
$ |
(0.74 |
) |
|
$ |
(1,946 |
) |
|
|
13,702 |
|
|
$ |
(0.14 |
) |
|
(1) |
For fiscal 2017 and 2016 income tax effect of other charges includes $430 and $1,193, respectively, related to a proposed business combination and $1,334 and $665 respectively, related to management and organizational changes, which represent the differences in income tax provision calculated with and without the specified pretax expense. |
Following is a reconciliation of net loss to Adjusted EBITDA and Adjusted EBITDA before other charges for the twelve months ended February 3, 2018 and January 28, 2017 (in thousands):
|
|
|
Twelve Months Ended |
|
|||||
|
|
|
February 3, 2018 |
|
|
January 28, 2017 |
|
||
|
Net loss |
|
$ |
(21,597 |
) |
|
$ |
(32,760 |
) |
|
Add: income tax provision (benefit) |
|
|
2 |
|
|
|
25,050 |
|
|
Add: interest expense, net |
|
|
4,045 |
|
|
|
3,575 |
|
|
Add: loss on extinguishment of debt |
|
|
1,542 |
|
|
|
— |
|
|
Operating loss |
|
|
(16,008 |
) |
|
|
(4,135 |
) |
|
Add: depreciation and amortization expense |
|
|
17,592 |
|
|
|
18,032 |
|
|
Add: loss on impairment of long-lived assets |
|
|
5,775 |
|
|
|
2,388 |
|
|
Add: loss on disposal of assets |
|
|
349 |
|
|
|
272 |
|
|
Add: stock-based compensation expense |
|
|
1,154 |
|
|
|
1,801 |
|
|
Adjusted EBITDA |
|
|
8,862 |
|
|
|
18,358 |
|
|
Add: other charges for proposed business combination |
|
|
1,198 |
|
|
|
3,154 |
|
|
Add: other charges for management and organizational changes |
|
|
3,714 |
|
|
|
1,760 |
|
|
Less: effect of change in accounting principle |
|
|
(764 |
) |
|
|
— |
|
|
Adjusted EBITDA before other charges and effect of change in accounting principle |
|
$ |
13,010 |
|
|
$ |
23,272 |
|
38
Fiscal Year Ended January 28, 2017 Compared to Fiscal Year Ended January 30, 2016
Results of Operations
The following table sets forth certain operating data from our consolidated statements of operations in thousands of dollars, as a percentage of net sales and as a percentage change for the periods indicated:
|
|
|
Twelve Months Ended |
|
|
|
|
||||||||||||||||||||
|
|
|
January 28, 2017 |
|
|
January 30, 2016 |
|
|
% Period to |
|
|||||||||||||||||
|
|
|
Amount (in thousands) |
|
|
% of |
|
|
Amount (in thousands) |
|
|
% of |
|
|
Period Favorable |
|
|||||||||||
|
Net sales |
|
$ |
433,699 |
|
|
|
|
100.0 |
% |
|
|
$ |
498,753 |
|
|
|
|
100.0 |
% |
|
|
|
|
(13.0 |
)% |
|
|
Cost of goods sold (2) |
|
|
206,271 |
|
|
|
|
47.6 |
|
|
|
|
252,713 |
|
|
|
|
50.7 |
|
|
|
|
|
18.4 |
|
|
|
Gross profit |
|
|
227,428 |
|
|
|
|
52.4 |
|
|
|
|
246,040 |
|
|
|
|
49.3 |
|
|
|
|
|
(7.6 |
) |
|
|
Selling, general and administrative expenses (3) |
|
|
223,881 |
|
|
|
|
51.6 |
|
|
|
|
246,914 |
|
|
|
|
49.5 |
|
|
|
|
|
9.3 |
|
|
|
Store closing, asset impairment and asset disposal expenses (income) |
|
|
2,768 |
|
|
|
|
0.6 |
|
|
|
|
(2,084 |
) |
|
|
|
(0.4 |
) |
|
|
|
|
(232.8 |
) |
|
|
Other charges, net |
|
|
4,914 |
|
|
|
|
1.1 |
|
|
|
|
6,979 |
|
|
|
|
1.4 |
|
|
|
|
|
29.6 |
|
|
|
Operating loss |
|
|
(4,135 |
) |
|
|
|
(1.0 |
) |
|
|
|
(5,769 |
) |
|
|
|
(1.2 |
) |
|
|
|
|
28.3 |
|
|
|
Interest expense, net |
|
|
3,575 |
|
|
|
|
0.8 |
|
|
|
|
1,520 |
|
|
|
|
0.3 |
|
|
|
|
|
(135.2 |
) |
|
|
Loss before income taxes |
|
|
(7,710 |
) |
|
|
|
(1.8 |
) |
|
|
|
(7,289 |
) |
|
|
|
(1.5 |
) |
|
|
|
|
(5.8 |
) |
|
|
Income tax provision (benefit) |
|
|
25,050 |
|
|
|
|
5.8 |
|
|
|
|
(2,806 |
) |
|
|
|
0.6 |
|
|
|
|
|
(992.7 |
) |
|
|
Net loss |
|
$ |
(32,760 |
) |
|
|
|
(7.6 |
)% |
|
|
$ |
(4,483 |
) |
|
|
|
(0.9 |
)% |
|
|
|
|
(630.8 |
)% |
|
|
(1) |
Components may not add to total due to rounding. |
|
(2) |
Cost of goods sold includes merchandise costs (including customs duty expenses), expenses related to inventory shrinkage, product-related corporate expenses (including expenses related to our payroll, benefit costs and operating expenses of our design and sourcing departments), inventory reserves (including lower of cost or market reserves), inbound freight charges, purchasing and receiving costs, inspection costs, distribution center costs (including occupancy expenses and equipment depreciation), internal transfer costs, and the other costs of our distribution network, partially offset by the allocable amount of our Grow NJ award benefit. |
|
(3) |
Selling, general and administrative expenses include advertising and marketing expenses, corporate administrative expenses, corporate headquarters occupancy expenses, store expenses (including store payroll and store occupancy expenses), and store opening expenses, partially offset by the allocable amount of our Grow NJ award benefit. The following tables set forth certain information regarding the number of our retail locations and international franchised locations, for the periods indicated. |
|
|
Twelve Months Ended |
|
|||||||||||||||||||||||||||||||||
|
|
January 28, 2017 |
|
|
January 30, 2016 |
|
||||||||||||||||||||||||||||||
|
Retail Locations (1) |
Stores |
|
|
Leased |
|
|
Total |
|
|
Stores |
|
|
Leased |
|
|
Total |
|
||||||||||||||||||
|
Beginning of period |
|
|
536 |
|
|
|
|
|
1,279 |
|
|
|
|
|
1,815 |
|
|
|
|
|
564 |
|
|
|
|
|
1,311 |
|
|
|
|
|
1,875 |
|
|
|
Opened |
|
|
11 |
|
|
|
|
|
10 |
|
|
|
|
|
21 |
|
|
|
|
|
18 |
|
|
|
|
|
19 |
|
|
|
|
|
37 |
|
|
|
Closed |
|
|
(32 |
) |
|
|
|
|
(584 |
) |
|
|
|
|
(616 |
) |
|
|
|
|
(46 |
) |
|
|
|
|
(51 |
) |
|
|
|
|
(97 |
) |
|
|
End of period |
|
|
515 |
|
|
|
|
|
705 |
|
|
|
|
|
1,220 |
|
|
|
|
|
536 |
|
|
|
|
|
1,279 |
|
|
|
|
|
1,875 |
|
|
|
(1) |
Excludes international franchised locations, and locations where Kohl’s sold our products under an exclusive product and license agreement. Our license agreement with Kohl’s ended in February 2017. |
|
|
Twelve Months Ended |
|
|||||||||||||||||||||||||||||||||
|
|
January 28, 2017 |
|
|
January 30, 2016 |
|
||||||||||||||||||||||||||||||
|
International Franchised Locations (1) |
Stores |
|
|
Shop-in- |
|
|
Total |
|
|
Stores |
|
|
Shop-in- |
|
|
Total |
|
||||||||||||||||||
|
Beginning of period |
|
|
25 |
|
|
|
|
|
168 |
|
|
|
|
|
193 |
|
|
|
|
|
23 |
|
|
|
|
|
62 |
|
|
|
|
|
85 |
|
|
|
Opened |
|
|
2 |
|
|
|
|
|
64 |
|
|
|
|
|
66 |
|
|
|
|
|
4 |
|
|
|
|
|
110 |
|
|
|
|
|
114 |
|
|
|
Closed |
|
|
(8 |
) |
|
|
|
|
(38 |
) |
|
|
|
|
(46 |
) |
|
|
|
|
(2 |
) |
|
|
|
|
(4 |
) |
|
|
|
|
(6 |
) |
|
|
End of period |
|
|
19 |
|
|
|
|
|
194 |
|
|
|
|
|
213 |
|
|
|
|
|
25 |
|
|
|
|
|
168 |
|
|
|
|
|
193 |
|
|
|
(1) |
In June 2015 we commenced our expansion into Israel. As of January 28, 2017, our merchandise is offered in 27 shop-in-shops in Israel. In October 2015 we entered into a new franchise agreement in India and commenced our expansion into India. As of January 28, 2017, our merchandise is offered in 25 shop-in-shops in India. |
39
Net Sales. Our net sales for fiscal 2016 decreased by 13.0%, or $65.1 million, to $433.7 million from $498.8 million for fiscal 2015. Comparable sales for fiscal 2016 decreased 5.3% compared to a comparable sales decrease of 1.5% for fiscal 2015. The decrease in total reported sales for fiscal 2016 compared to fiscal 2015 resulted primarily from the decrease in comparable sales, decreased sales related to the Company’s continued efforts to close underperforming stores (see our discussion in Item 1. Business regarding closing underperforming stores), and decreased leased department and licensed sales, reflecting the effect of the wind down of the Kohl’s, Sears and Gordmans relationships. The primary drivers of the comparable sales decrease were lower transactions and lower unit sales due to decreased store traffic, partially offset by an increase in our average selling prices.
As of January 28, 2017, we operated a total of 515 stores and 1,220 total retail locations: 408 Motherhood Maternity stores (including 97 Motherhood Maternity Outlet stores), 26 A Pea in the Pod stores, 81 Destination Maternity stores, and 705 leased maternity apparel departments. In comparison, as of January 30, 2016 we operated a total of 536 stores and 1,815 total retail locations: 425 Motherhood Maternity stores (including 93 Motherhood Maternity Outlet stores), 23 A Pea in the Pod stores, 88 Destination Maternity stores, and 1,279 leased maternity apparel departments, of which 475 were in Sears stores under the Two Hearts Maternity brand and the balance were in other department stores and baby specialty stores. As of January 28, 2017, our store total included 81 multi-brand Destination Maternity nameplate stores, including 48 Destination Maternity combo stores and 33 Destination Maternity superstores. In comparison, as of January 30, 2016 we operated 88 multi-brand Destination Maternity nameplate stores, including 53 Destination Maternity combo stores and 35 Destination Maternity superstores. During fiscal 2016 we opened 11 stores, and closed 32 stores. In addition, during fiscal 2016 we opened 10 leased department locations and closed 584 leased department locations.
Gross Profit. Our gross profit for fiscal 2016 decreased by 7.6%, or $18.6 million, to $227.4 million from $246.0 million for fiscal 2015, and our gross margin for fiscal 2016 was 52.4% compared to 49.3% for fiscal 2015. The decrease in gross profit for fiscal 2016 compared to fiscal 2015 was primarily due to lower sales volume as a result of the factors discussed above. The year-over-year increase in gross margin is a result of less price promotion and markdown activity as a result of better managed inventory, and lower levels of excess current season and aged merchandise. During fiscal 2016 and 2015 higher occupancy and depreciation expenses from our relocations were substantially offset by lower employment costs and benefit from our Grow NJ award, which we began to recognize during the second half of fiscal 2015. Due to the timing of the initial benefit recognition in the second half of fiscal 2015, we estimate our full year fiscal 2015 gross margin was approximately 0.2% higher than the annualized benefit expected in the future.
Selling, General and Administrative Expenses. Our selling, general and administrative expenses for fiscal 2016 decreased by 9.3%, or $23.0 million, to $223.9 million from $246.9 million for fiscal 2015. As a percentage of net sales, selling, general and administrative expenses increased to 51.6% for fiscal 2016 from 49.5% for fiscal 2015. This decrease in expense in fiscal 2016 compared to fiscal 2015 reflects cost reductions resulting from our continued closure of underperforming stores and other headcount reductions, lower variable incentive compensation expense, and lower marketing and advertising expense, partially offset by a non-recurring reduction of $1.2 million from settlement of certain unclaimed property matters during the first quarter of fiscal 2015. The increase in expense percentage for the twelve month period reflects the unfavorable leverage from our decreased sales due to the relatively fixed nature of much of our expenses.
Store Closing, Asset Impairment and Asset Disposal Expenses (Income). For fiscal 2016 we had $2.8 million of expense from store closings, asset impairments and asset disposals compared to $2.1 million of income for fiscal 2015. During fiscal 2015 we received $4.1 million as incentive for early termination of the lease for our superstore located on Madison Avenue in New York City.
Other Charges, Net. In fiscal 2016 we incurred other charges of $4.9 million related to a proposed business combination and to management and organizational changes. Other charges related to the Merger were approximately $3.1 million, primarily for legal and advisory fees. Other charges related to management and organizational changes were $1.8 million, primarily for costs related to severance and other benefits, and to a lesser extent, to terminate certain non-core apparel brand relationships. In fiscal 2015 we incurred other charges of $7.0 million primarily related to management and organizational changes and the relocations of our headquarters and distribution facilities. Other charges related to management and organizational changes were $4.2 million, primarily severance and other benefits in connection with the replacement of certain key management personnel and some reductions in headcount, and to a lesser extent, consulting fees. Other charges related to the relocations were $2.7 million, primarily for pre-opening rent expense for the new distribution center, moving costs for the new distribution center, shut down costs of the prior facility and accelerated depreciation.
Operating Loss. We had an operating loss of $4.1 million for fiscal 2016 compared to an operating loss of $5.8 million for fiscal 2015, which included the $4.1 million incentive for an early termination of a store lease. Excluding the year-over-year effect of the early lease termination incentive in fiscal 2015 our operating income increased by approximately $5.7 million, which reflects our 9.3% reduction in selling, general and administrative expenses, increases in our average selling prices and gross margin from better inventory management, and lower other charges. These improvements more than offset our lower gross profit as a result of the decline in sales volume.
40
Interest Expense, Net. Our net interest expense for fiscal 2016 increased to $3.6 million from $1.5 million in fiscal 2015. This increase was due to interest expense on outstanding borrowings on our Term Loan during fiscal 2016, partially offset by lower average borrowings under our Credit Facility and a reduction in the principal balance due under our equipment note during fiscal 2016 compared to fiscal 2015.
Income Tax Provision (Benefit). For fiscal 2016 our income tax provision was $25.1 million. In the fourth quarter of fiscal 2016 we recorded a non-cash charge of $27.8 million as a valuation allowance against substantially all of our deferred tax assets. Excluding the effect of the valuation allowance charge in fiscal 2016 our effective tax benefit rate was 35.1%, which was slightly higher than the statutory federal tax rate of 35% primarily due to certain state minimum income taxes substantially offset by state income tax benefits from our pretax loss and reductions related to uncertain income tax positions. For fiscal 2015 our effective tax benefit rate was 38.5%. Our effective tax rate for fiscal 2015 was higher than the statutory federal tax rate of 35% primarily due to state income tax benefits, net of federal expense, including reductions related to uncertain income tax positions. See Note 15 of the Notes to Consolidated Financial Statements, included elsewhere in this report, for the reconciliation of the statutory federal income tax rate to our effective tax rate
Net Loss. Net loss for fiscal 2016 was $32.8 million, or $2.39 per share (diluted), compared to net loss of $4.5 million, or $0.33 per share (diluted), for fiscal 2015. Net loss for fiscal 2016 was primarily related to a non-cash valuation allowance charge of $27.8 million against our deferred tax assets, other charges of $2.0 million, net of tax, related to a proposed business combination and $1.1 million, net of tax, related to management and organizational changes. Net loss for fiscal 2015 includes other charges of $1.7 million, net of tax, related to the relocations of our headquarters and distribution facilities and approximately $2.6 million, net of tax, related to management and organizational changes, and other matters. Before these charges, our adjusted net loss for fiscal 2016 was $1.9 million, or $0.14 per share (diluted), compared to net loss of $0.2 million, or $0.01 per share (diluted), for fiscal 2015.
Our average diluted shares outstanding of 13.7 million for fiscal 2016 were slightly higher than the 13.6 million average diluted shares outstanding for fiscal 2015. We had higher shares outstanding in fiscal 2016 compared to fiscal 2015 as a result of stock option exercises and restricted stock awards.
Following is a reconciliation of net loss and net loss per share (diluted) (“Diluted EPS”) to adjusted net loss and adjusted Diluted EPS for the twelve months ended January 28, 2017 and January 30, 2016 (in thousands, except per share amounts):
|
|
|
Twelve Months Ended |
|
|||||||||||||||||||||
|
|
|
January 28, 2017 |
|
|
January 30, 2016 |
|
||||||||||||||||||
|
|
|
Net |
|
|
Diluted |
|
|
Diluted |
|
|
Net |
|
|
Diluted |
|
|
Diluted |
|
||||||
|
As reported |
|
$ |
(32,760 |
) |
|
|
13,702 |
|
|
$ |
(2.39 |
) |
|
$ |
(4,483 |
) |
|
|
13,596 |
|
|
$ |
(0.33 |
) |
|
Add: other charges for proposed business combination |
|
|
3,154 |
|
|
|
— |
|
|
|
|
|
|
|
61 |
|
|
|
— |
|
|
|
|
|
|
Add: other charges for management and organizational changes |
|
|
1,760 |
|
|
|
— |
|
|
|
|
|
|
|
4,196 |
|
|
|
— |
|
|
|
|
|
|
Add: other charges for relocations |
|
|
— |
|
|
|
— |
|
|
|
|
|
|
|
2,695 |
|
|
|
— |
|
|
|
|
|
|
Add: other charges for fiscal year change |
|
|
— |
|
|
|
— |
|
|
|
|
|
|
|
27 |
|
|
|
— |
|
|
|
|
|
|
Less: income tax effect of other charges (1) (2) |
|
|
(1,858 |
) |
|
|
— |
|
|
|
|
|
|
|
(2,664 |
) |
|
|
— |
|
|
|
|
|
|
Add: deferred tax valuation allowance related to cumulative losses |
|
|
27,758 |
|
|
|
— |
|
|
|
|
|
|
|
|
|
|
|
— |
|
|
|
|
|
|
As adjusted |
|
$ |
(1,946 |
) |
|
|
13,702 |
|
|
$ |
(0.14 |
) |
|
$ |
(168 |
) |
|
|
13,596 |
|
|
$ |
(0.01 |
) |
|
(2) |
For fiscal 2015 income tax effect of other charges includes $23 related to a proposed business combination, $1,063 related to management and organizational changes, $1,028 related to relocations and $10 related to the fiscal year change, which represent the differences in income tax provision calculated with and without the specified pretax expense charges. |
41
Following is a reconciliation of net loss to Adjusted EBITDA and Adjusted EBITDA before other charges for the twelve months ended January 28, 2017 and January 30, 2016 (in thousands):
|
|
|
Twelve Months Ended |
|
|
|||||
|
|
|
January 28, 2017 |
|
|
January 30, 2016 |
|
|
||
|
Net loss |
|
$ |
(32,760 |
) |
|
$ |
(4,483 |
) |
|
|
Add: income tax provision (benefit) |
|
|
25,050 |
|
|
|
(2,806 |
) |
|
|
Add: interest expense, net |
|
|
3,575 |
|
|
|
1,520 |
|
|
|
Operating loss |
|
|
(4,135 |
) |
|
|
(5,769 |
) |
|
|
Add: depreciation and amortization expense |
|
|
18,032 |
|
|
|
17,231 |
|
|
|
Add: loss on impairment of long-lived assets |
|
|
2,388 |
|
|
|
1,662 |
|
|
|
Add: loss on disposal of assets |
|
|
272 |
|
|
|
193 |
|
|
|
Add: stock-based compensation expense |
|
|
1,801 |
|
|
|
2,784 |
|
|
|
Adjusted EBITDA |
|
|
18,358 |
|
|
|
16,101 |
|
|
|
Add: other charges for proposed business combination |
|
|
3,154 |
|
|
|
61 |
|
|
|
Add: other charges for management and organizational changes |
|
|
1,760 |
|
|
|
4,196 |
|
|
|
Add: other charges for relocations (1) |
|
|
— |
|
|
|
2,462 |
|
|
|
Add: other charges for fiscal year change |
|
|
— |
|
|
|
27 |
|
|
|
Adjusted EBITDA before other charges |
|
$ |
23,272 |
|
|
$ |
22,847 |
|
|
|
(1) |
For the year ended January 30, 2016 other charges for relocations excludes accelerated depreciation expense of $233 (included in depreciation and amortization expense above). |
Liquidity and Capital Resources
Our cash needs have primarily been for 1) capital expenditures, including (i) leasehold improvements, fixtures and equipment for new stores, store relocations and remodels of our existing stores, (ii) investment in information systems and technology, 2) debt service, including principal repayments, and 3) working capital, including inventory to support our business. We have historically financed our capital requirements from cash flows from operations, borrowings under our credit facilities or available cash balances.
Cash and cash equivalents decreased by $1.2 million during fiscal 2017 compared to an increase of $0.7 million during fiscal 2016.
Cash provided by operations was $8.9 million for fiscal 2017, a decrease of $1.8 million from the $10.7 million in cash provided by operations for fiscal 2016. This decrease in cash provided by operations versus the comparable prior year period was primarily the result of the lower loss offset by the reduction in deferred income taxes in fiscal 2017 compared to fiscal 2016, and an increase in trade receivables of $1.0 million in fiscal 2017 compared a reduction of $4.5 million in fiscal 2016. These were partially offset by a $14.4 million increase in the net investment in inventory (inventory less accounts payable) and an increase of $3.4 million in the non-cash adjustment relating to the loss on impairment of long-lived assets. Our working capital changes, quarterly net income (loss) and cash flow adjustments may fluctuate significantly, and net cash provided by operating activities for any interim period is not necessarily indicative of the results that may be achieved for a full fiscal year.
On February 1, 2018 (the “Closing Date”) the Company entered into a Term Loan Credit Agreement (the “Term Loan Agreement) which provides for a term loan of up to $25.0M (the “Term Loan”). On the Closing Date we borrowed $22.5M against the Term Loan and used the proceeds, in addition to $3.6M borrowed under our Credit Facility to pay off the balance of our then existing term loan (the “Prior Term Loan”) and fees relating to the financing.
The Term Loan, which matures on January 31, 2023 (the “Maturity Date”), provides for an additional loan of $2.5M which can be borrowed at the Company’s discretion within a period of 45 days after delivery to the lender of our first quarter fiscal 2018 financial statement and the satisfaction of certain other requirements. There is a minimum excess availability requirement of the greater of 10% of the combined loan cap, as defined in the Term Loan Agreement, or $7.0M. The interest rate on the Term Loan is equal to a LIBOR rate plus 9.0%. We are required to make minimum payments of $312,500 each quarter commencing on July 31, 2018, with the remaining outstanding balance payable on the Maturity Date. The Term Loan can be prepaid at our option, subject to certain restrictions and subject to a prepayment premium as follows: 1) if prepayment occurs on or prior to the second anniversary of the Closing Date, the greater of a) interest on the prepayment that would otherwise have been paid with the 24 month period following the Closing Date minus actual interest payments made through the prepayment date and b) 2% of the prepayment, and 2) 2% of the prepayment amount if paid between the second and third anniversary of the Closing Date.
42
In conjunction with entering into the Term Loan Agreement, on February 1, 2018 we also amended and restated our credit facility (the “Credit Facility”). This amendment, among other things, reduced the amount of the Credit Facility from $70.0M to $50.0M, extended the Termination Date to January 31, 2023 and reduced or eliminated certain availability reserves.
Cash provided by operations was $10.7 million for fiscal 2016, a decrease of $5.4 million from the $16.1 million in cash provided by operations for fiscal 2015. This decrease in cash provided by operations versus the comparable prior year period was primarily the result of the higher net loss in fiscal 2016 compared to fiscal 2015, net working capital and other asset/liability changes that used $4.3 million of cash in fiscal 2016 compared to $0.1 million cash provided in fiscal 2015, net of the change in non-cash adjustments.
On March 25, 2016 we entered into a Term Loan Credit Agreement (the “Prior Term Loan Agreement”) for a $32.0 million term loan due March 25, 2021 (the “Prior Term Loan”), the proceeds of which were received on March 25, 2016 and were used to repay a portion of the outstanding indebtedness under our existing Credit Facility (see below). The interest rate on the Prior Term Loan was equal to a LIBOR rate (with a 1.00% LIBOR floor) plus 7.50%. We were required to make minimum repayments of the principal amount in quarterly installments of $0.8 million each, with the remaining outstanding balance payable on the maturity date. The Prior Term Loan had a prepayment option, subject to the payment of a prepayment premium, that we exercised on the Closing Date. The Company paid a prepayment premium of $249,582, or 2% of the then outstanding loan balance. There were various minimum excess availability requirements applicable to the Prior Term Loan including $5.0 million against availability under our Credit Facility that will be reduced dollar for dollar for prepayments of the Prior Term Loan, an amount equal to the greater of 10% of the Combined Loan Cap (as defined in the related Credit Facility agreement) or $10.0 million and a $10.0M EBITDA as defined in the Credit Agreement
As of February 3, 2018, we had $8.0 million in outstanding borrowings and $7.3 million in letters of credit outstanding under the Credit Facility with $26.8 million of availability, As of January 28, 2017 we had $4.6 million in outstanding borrowings and $5.8 million in letters of credit with $19.4 million of availability. For Fiscal 2017 our borrowings had a weighted interest rate of 3.65% per annum, our average level of borrowing was $9.5 million and our maximum borrowing at any time was $17.0 million. For fiscal 2016 Tranche A borrowings had a weighted interest rate of 2.84% per annum and Tranche A-1 borrowings had a weighted interest rate of 3.43%. During fiscal 2016 our average level of direct borrowings was $11.2 million and our maximum borrowings at any time were $42.7 million.
As of February 3, 2018, and January 28, 2017, there was $6.1 million and $9.3 million, respectively, outstanding under a five-year equipment financing arrangement with our Credit Facility bank. The equipment note bears annual interest at 3.38%, with payments of $0.3 million (including interest) due monthly through December 2019. The equipment note is collateralized by substantially all of the material handling equipment at our distribution facility in Florence, New Jersey.
On June 6, 2017 the Company received $3.4 million in proceeds from a three-year financing arrangement in the form of a sale and leaseback for certain furniture, fixtures and software. Monthly payments under the leaseback arrangement are $123,000 for the first 24 months and $48,000 for months 25 to 36. At the end of the leaseback term, the Company has the option to extend the financing for an additional year or repurchase the property for a price to be agreed upon. All proceeds from the transaction were used to prepay a portion of the Company’s Term Loan. As of February 3, 2018, there was $2.7 million of principal outstanding under the arrangement.
Based on our current operating plan, our management believes that our current cash and working capital positions, expected operating cash flows and available borrowing capacity will be sufficient to fund our cash requirements for working capital and capital expenditures for at least the next 12 months. We have based this belief on assumptions (which include a positive sustained turn in comparable sales as well as significant expense savings) that we believe are reasonable but may not be realized due to a variety of factors including lower than anticipated net sales or gross margins, higher than expected expenses, a failure to actualize these assumptions, continued or declining levels of economic or retail industry conditions, or other events, including those factors discussed in Part I, Item 1A “Risk Factors” of this Form 10-K. As a result, we could use our available capital resources sooner than we currently expect. Furthermore, our operating plan may change and we may need additional funds sooner than planned. If we are unable to obtain needed funds from the aforementioned sources, we will likely need to seek other sources of financing as well as defer, reduce or eliminate planned expenditures, which would impair our growth prospects and could otherwise negatively impact our business.
Facilities Relocations
In 2015 we completed the relocation of our corporate headquarters and distribution operations. We had cumulative capital expenditures associated with these relocations of $40 million, with nearly $4 million of this amount offset by construction allowance contributions from the landlord for our new headquarters building. To partially offset the costs of these relocations, the Board of the NJEDA approved us for an incentive package of up to $40 million in benefits under Grow NJ in the form of transferrable income tax credits over a ten-year period from the State of New Jersey. The annual benefit amount available to us is expected to significantly exceed our annual income tax liability to New Jersey. In order to maximize the realizable value of our incentive package, we entered
43
into an agreement with a third party to sell 75% or more of the annual income tax credits awarded to us. In May 2016 NJEDA delivered our initial tax credit certificate which was earned in fiscal 2015. In fiscal 2017, 2016 and 2015 the Company’s Grow NJ award (net of valuation allowance) was $2.8 million, $3.3 million and $3.6 million, respectively. Refer to Note 14, “Government Incentives,” in the Notes to Consolidated Financial Statements for further information on the Grow NJ program.
Contractual Obligations and Commercial Commitments
We have entered into agreements that create contractual obligations and commercial commitments. These obligations and commitments will have an impact on future liquidity and the availability of capital resources. The tables below set forth a summary of these obligations and commitments as of February 3, 2018 (in thousands):
Contractual Obligations:
|
|
|
|
|
|
Payments Due by Period |
|
||||||||||||||
|
Description |
|
Total |
|
|
Less |
|
|
One |
|
|
Three |
|
|
After |
|
|||||
|
Long-term debt |
|
$ |
31,221 |
|
|
$ |
5,247 |
|
|
$ |
8,161 |
|
|
$ |
17,813 |
|
|
$ |
— |
|
|
Interest related to long-term debt (2) |
|
|
11,378 |
|
|
|
2,869 |
|
|
|
6,612 |
|
|
|
1,897 |
|
|
|
— |
|
|
Operating leases (3) |
|
|
189,637 |
|
|
|
37,474 |
|
|
|
53,575 |
|
|
|
37,383 |
|
|
|
61,205 |
|
|
Purchase obligations (4) |
|
|
57,650 |
|
|
|
57,650 |
|
|
|
— |
|
|
|
— |
|
|
|
— |
|
|
Total contractual cash obligations |
|
$ |
289,886 |
|
|
$ |
103,240 |
|
|
$ |
68,348 |
|
|
$ |
57,093 |
|
|
$ |
61,205 |
|
|
(1) |
The amounts in this table exclude obligations under employment agreements. For a discussion of the compensation of our executive officers refer to Item 11 of this Form 10-K. |
|
(2) |
Variable rate interest costs on long-term debt were estimated using the interest rate in effect as of February 3, 2018. |
|
(3) |
Includes store, office and distribution facility leases, which generally provide for payment of direct operating costs in addition to rent. The amounts reflected include future minimum lease payments and exclude such direct operating costs. |
|
(4) |
Our purchase orders with contract manufacturers are cancelable by us at any time prior to our acceptance of the merchandise subject to negotiated payment of certain of vendors’ nonrecoverable costs. The amount in this table excludes purchase orders for supplies in the normal course of business. |
Commercial Commitments:
|
|
|
|
|
|
Amount of Commitment Per Period |
|
||||||||||||||
|
Description |
|
Total |
|
|
Less |
|
|
One |
|
|
Three |
|
|
After |
|
|||||
|
Credit facility (1) |
|
$ |
7,327 |
|
|
$ |
7,327 |
|
|
$ |
— |
|
|
$ |
— |
|
|
$ |
— |
|
|
Other standby letters of credit |
|
|
— |
|
|
|
— |
|
|
|
— |
|
|
|
— |
|
|
|
— |
|
|
Total commercial commitments |
|
$ |
7,327 |
|
|
$ |
7,327 |
|
|
$ |
— |
|
|
$ |
— |
|
|
$ |
— |
|
|
(1) |
Consists of outstanding letter of credit commitments under our Credit Facility as of February 3, 2018. |
Off-Balance Sheet Arrangements
Other than operating lease and letter of credit commitments set forth in the tables above, we are not party to any material off-balance sheet financing arrangements.
Critical Accounting Policies and Estimates
Our consolidated financial statements have been prepared in accordance with GAAP. These generally accepted accounting principles require management to make estimates and assumptions that affect the reported amounts of assets and liabilities and disclosure of contingent assets and liabilities at the date of our consolidated financial statements and the reported amounts of net sales and expenses during the reporting period.
44
Our significant accounting policies are described in Note 2 of “Notes to Consolidated Financial Statements” included elsewhere in this report. We believe that the following discussion addresses our critical accounting policies, which are those that are most important to the portrayal of our financial condition and results of operations and require management’s most difficult, subjective and complex judgments, often as a result of the need to make estimates about the effect of matters that are inherently uncertain. If actual results were to differ significantly from estimates made, future reported results could be materially affected. However, we are not currently aware of any reasonably likely events or circumstances that would result in materially different results.
Our senior management has reviewed these critical accounting policies and estimates and the related Management’s Discussion and Analysis of Financial Condition and Results of Operations with the Audit Committee of our Board of Directors.
Inventories. We value our inventories, which consist primarily of maternity apparel, at the lower of cost or net realizable value. Cost is determined on the first-in, first-out method (FIFO) and includes the cost of merchandise, freight, duty and broker fees, as well as applied product-related overhead. A periodic review of inventory quantities on hand is performed in order to determine if inventory is properly valued at the lower of cost or net realizable value. Factors related to current inventories such as future consumer demand and fashion trends, current aging, current analysis of merchandise based on receipt date, current and anticipated retail markdowns or wholesale discounts, and class or type of inventory are analyzed to determine estimated net realizable values. Criteria utilized by us to determine the net realizable value of our inventories and the related level of required inventory reserves include factors such as the amount of merchandise received within the past twelve months, merchandise received more than one year before with quantities on-hand in excess of twelve months of sales, and merchandise currently selling below cost. A provision is recorded to reduce the cost of inventories to its estimated net realizable value, if required. Inventories as of February 3, 2018 and January 28, 2017 totaled $71.3 million and $69.0 million, respectively, representing 43.8% and 39.2% of total assets, respectively. Given the significance of inventories to our consolidated financial statements, the determination of net realizable values is considered to be a critical accounting estimate. Any significant unanticipated changes in the factors noted above could have a significant impact on the value of our inventories and our reported operating results.
Long-Lived Assets. Our long-lived assets consist principally of store leasehold improvements, material handling equipment, information technology systems, and other furniture and fixtures (included in “property and equipment, net” in our consolidated balance sheets) and, to a much lesser extent, patent and lease acquisition costs (included in “other intangible assets, net” in our
consolidated balance sheets). These long-lived assets are recorded at cost and are amortized using the straight-line method over the shorter of the lease term or their useful life. Net long-lived assets as of February 3, 2018 and January 28, 2017 totaled $67.1 million and $84.1 million, respectively, representing 41.3% and 47.8% of total assets, respectively.
In assessing potential impairment of these assets, we periodically evaluate the historical and forecasted operating results and cash flows on a location-by-location basis. Newly opened retail locations may take time to generate positive operating and cash flow results. Factors such as 1) retail location type, that is, Company store or leased department, 2) retail nameplate, that is, Motherhood, Pea or Destination Maternity, 3) geographic location, for example, urban area versus suburb, 4) current marketplace awareness of our brands, 5) local customer demographic data, 6) anchor stores within the mall in which our retail location is premised and 7) current fashion trends are all considered in determining the time frame required for a retail location to achieve positive financial results, which is assumed to be within two years from the date a retail location is opened. If economic conditions are substantially different from our expectations, the carrying value of certain of our long-lived assets may become impaired. As a result of our impairment assessment, we recorded write-downs of long-lived assets of $5.8 million, $2.4 million and $1.7 million during fiscal 2017, fiscal 2016 and fiscal 2015 respectively.
Self-Insurance Reserves. We are primarily self-insured for most workers’ compensation claims, general liability and automotive liability losses, and for employee-related healthcare claims. We have purchased insurance coverage in order to establish certain limits to our exposure on a per claim basis and on an aggregate basis. Our accrued insurance expense, which was primarily for self-insurance reserves, as of February 3, 2018 and January 28, 2017 totaled $5.0 million and $5.4 million, respectively, representing 4.1% and 4.7% of total liabilities, respectively. The estimated reserves for our self-insured liabilities and our reported operating results could be significantly affected if future occurrences and claims differ from the factors noted below.
We determine the estimated reserve required for workers’ compensation claims, general liability and automotive liability losses in each accounting period. This requires that we determine estimates of the costs of claims incurred (including claims incurred but not yet reported) and accrue for such expenses in the period in which the claims are incurred (including claims incurred but not yet reported). Actual workers’ compensation claims, and general liability and automotive liability losses, are reported to us by third-party administrators. The third-party administrators also report initial estimates of related loss reserves. The open claims and initial loss reserves and estimates of claims incurred but not yet reported are subjected to examination by us utilizing a consistent methodology which involves various assumptions, judgment and other factors. Such factors include, but are not limited to, the probability of settlement, the amount at which settlement can be achieved, the probable duration of the claim, the cost development pattern of the claim and the applicable cost development factor. The liabilities associated with claims for workers’ compensation, general liability and automotive liability are measured through the use of actuarial methods to project an estimate of ultimate cost for claims incurred.
45
We record an accrual for the estimated amount of self-insured healthcare claims incurred but not yet reported using a method based on our historical claims experience. The most significant factors in addition to our historical claims experience that impact the determination of the required accrual are the historical timing of claims processing, medical cost trends and inflation, employer-employee cost sharing factors and changes in plan benefits. We continually monitor historical experience and cost trends, and accruals are adjusted when warranted by changes in facts and circumstances.
Government Incentives. To partially offset the costs of the relocations of our corporate headquarters and distribution operations from Philadelphia, Pennsylvania to southern New Jersey, the Board of the NJEDA approved us for an incentive package of up to $40 million in benefits under Grow NJ in the form of transferrable income tax credits over a ten-year period from the State of New Jersey. The Grow NJ award benefit is recognized ratably over the ten-year life of the award and provides the Company with transferrable income tax credits of up to $4.0 million annually, with a net pretax cash realizable value of up to $3.6 million annually. The annual benefit amount available to us is expected to significantly exceed our annual income tax liability to New Jersey. In order to maximize the realizable value of our incentive package, in December 2013 we entered into an agreement with a third party to sell 75% of the annual income tax credits with an option to sell an additional amount up to the remaining 25% of the annual income tax credits.
We recognize the estimated benefit from our Grow NJ award as a reduction to distribution center and corporate headquarters costs that result from the relocation of these facilities to New Jersey (primarily occupancy expenses and equipment depreciation). When recognized, such income tax credits are included in our consolidated balance sheets as deferred income tax assets, net of a valuation allowance, and net of federal and state income tax effect, to reflect the expected after-tax amount to be realized from subsequent sales of the income tax credits. We began to recognize the benefit of our Grow NJ award in fiscal 2015 and deferred income tax assets as of February 3, 2018 and January 28, 2017 related to the award totaled $2.8 million and $3.3 million, respectively, representing 1.7% and 1.8% of total assets.
In order to receive the benefits of the incentive package we need to meet certain levels of annual jobs and other requirements. We record an accrual for the estimated realizable amount of our Grow NJ award based on our monthly average pre- and post-relocation employment levels in New Jersey. We continually monitor our compliance with the requirements of our incentive package. If we do not meet these job levels or other requirements on an annual basis, we will not receive some or all of the benefits. The estimated deferred income tax asset and our reported operating results could be significantly affected if we are unable to receive the full amount of the award benefits from NJEDA or are unable to sell or otherwise utilize the income tax credits. The Company estimates that in fiscal 2018 it will receive approximately $3.0 million of transferrable tax credits with a net pretax realizable value of approximately $2.6 million.
Income Taxes. As part of the process of preparing our consolidated financial statements, we are required to estimate our income taxes in each of the jurisdictions in which we operate. This process requires us to estimate our actual current tax exposure (including interest and penalties) together with assessing temporary differences resulting from differing treatment of items, such as depreciation of property and equipment and valuation of inventories, for tax and accounting purposes. We establish reserves for certain tax positions that we believe are supportable, but are potentially subject to successful challenge by the applicable taxing authority. We determine our provision for income taxes based on federal, state and foreign tax laws and regulations currently in effect, some of which have been recently revised. Legislation changes in jurisdictions in which we operate, if enacted, could increase our transactions or activities subject to tax. Any such legislation that becomes law could result in an increase in our income tax expense and our income taxes paid, which could have a material and adverse effect on our net income or cash flow.
Federal net operating loss and tax credit carryforwards, certain state net operating loss carryforwards, and temporary differences between the book and tax treatment of income and expenses result in deferred tax assets and liabilities, which are included within our consolidated balance sheets. We must periodically assess the likelihood that our deferred tax assets will be recovered from future taxable income. To the extent we believe that recovery is not more likely than not, we must establish a valuation allowance to reduce deferred tax assets to the amount considered realizable. The evaluation of the realizability of deferred tax assets includes consideration of all available evidence, both positive and negative, regarding historical operating results including recent years with reported losses, the estimated timing of future reversals of existing taxable temporary differences, estimated future taxable income exclusive of reversing temporary differences and carryforwards, and potential tax planning strategies which may be employed to prevent an operating loss or tax credit carryforward from expiring unused. In situations where a three-year cumulative loss condition exists, accounting standards limit the ability to consider projections of future results as positive evidence to assess the realizability of deferred tax assets. In fiscal 2016 our financial results reflected a three-year cumulative loss. The three-year cumulative loss constitutes significant negative evidence, limiting our ability to consider other positive evidence, such as our projections for future growth. Consequently, in fiscal 2016 we recorded a non-cash charge of $27.8 million as a valuation allowance against substantially all of our deferred tax assets. In fiscal 2017 we continued to record a valuation allowance against substantially all of our deferred tax assts. This valuation allowance has no effect on our ability to utilize the deferred tax assets to offset future taxable income, if generated. As required by GAAP, we will continue to assess the likelihood that our deferred tax assets will be realizable in the future and the valuation allowance will be adjusted accordingly. The tax benefits relating to any reversal of the valuation allowance on the net deferred tax assets in a future period will be recognized as a reduction of future income tax expense in that period. Actual results could differ from our assessments if adequate taxable income is not generated in future periods. Net deferred tax assets (including our Grow NJ award benefit discussed above) as of February 3, 2018 and January 28, 2017 totaled $2.8 million and $3.3 million, respectively, representing 1.7% and 1.8% of total assets, respectively.
46
On December 22, 2017, the Tax Cuts and Jobs Act (the”TCJA”) was enacted. The TCJA includes a number of changes to existing U.S. tax laws that impact the Company, most notably a reduction in the U.S. Corporate tax rate from 35% to 21% for tax years beginning after December 31, 2017. We will continue to analyze additional information and guidance related to the TCJA as supplemental legislation, regulatory guidance or technical interpretations become available.
Contingencies. From time to time, we are named as a defendant in legal actions arising from our normal business activities. We account for contingencies such as these in accordance with applicable accounting standards, which require us to record an estimated loss contingency when information available prior to issuance of our financial statements indicates that it is probable that an asset has been impaired or a liability has been incurred at the date of the financial statements and the amount of the loss can be reasonably estimated. Accounting for contingencies arising from contractual or legal proceedings requires management, after consultation with outside legal counsel, to use its best judgment when estimating an accrual related to such contingencies. As additional information becomes known, our accrual for a loss contingency could fluctuate, thereby creating variability in our results of operations from period to period. Likewise, an actual loss arising from a loss contingency which significantly exceeds the amount accrued for in our financial statements could have a material adverse impact on our operating results for the period in which such actual loss becomes known.
Recent Accounting Pronouncements
Adopted
In March 2016 the Financial Accounting Standards Board (“FASB”) issued Accounting Standards Update (“ASU”) No. 2016-09, Compensation - Stock Compensation (Topic 718): Improvements to Employee Share-Based Payment Accounting. ASU No. 2016-09 affects all entities that issue share-based payment awards to their employees. ASU No. 2016-09 simplifies several aspects of the accounting for share-based payment transactions, including the income tax consequences, classification of awards as either equity or liabilities, and classification on the statement of cash flows, including recognizing all excess tax benefits and tax deficiencies as income tax expense or benefit in the income statement rather than in additional paid-in capital. The Company adopted ASU No. 2016-09 effective January 29, 2017 and the adoption did not have a material impact on the Company’s consolidated financial position, results of operations or cash flows.
In November 2015 the FASB issued ASU No. 2015-17, Income Taxes (Topic 740): Balance Sheet Classification of Deferred Taxes. To simplify the presentation of deferred income taxes, ASU No. 2015-17 requires that deferred tax liabilities and assets be classified as noncurrent in a classified statement of financial position. The Company adopted ASU No. 2015-17 effective January 29, 2017 and applied the required reclassifications on a retrospective basis. Accordingly, in the consolidated balance sheet as of January 28, 2017, $3,251,000 of deferred tax assets were reclassified from current assets to other assets. The adoption of ASU No. 2015-17 did not have any impact on the Company’s net consolidated financial position, results of operations or cash flows.
In July 2015 the FASB issued ASU No. 2015-11, Inventory (Topic 330): Simplifying the Measurement of Inventory. ASU No. 2015-11 changes the measurement principle for inventory from the lower of cost or market to the lower of cost and net realizable value. The Company adopted ASU No. 2015-11 effective January 29, 2017 and the adoption did not have a material impact on the Company’s consolidated financial position, results of operations or cash flows.
Not Yet Adopted
In May 2017 the FASB issued ASU No. 2017-09, Compensation - Stock Compensation (Topic 718): Scope of Modification Accounting. ASU No. 2017-09 provides guidance about which changes to the terms or conditions of a share-based payment award require an entity to apply modification accounting in Topic 718. ASU No. 2017-09 is effective for financial statements issued for annual reporting periods beginning after December 15, 2017 and interim periods within those years. Earlier application is permitted. The impact from adoption of the new requirements of ASU No. 2017-09 on the Company’s consolidated financial position or results of operations has not yet been determined.
In October 2016 the FASB issued ASU No. 2016-16, Income Taxes (Topic 740): Intra-Entity Transfers of Assets Other Than Inventory. ASU No. 2016-16 amends the accounting for income taxes and requires the recognition of the income tax consequences of an intercompany asset transfer, other than transfers of inventory, when the transfer occurs. For intercompany transfers of inventory, the income tax effects will continue to be deferred until the inventory has been sold to a third party. ASU No. 2016-16 is effective for financial statements issued for annual reporting periods beginning after December 15, 2017 and interim periods within those years, using a modified retrospective application method through a cumulative-effect adjustment directly to retained earnings as of the beginning of the period of adoption. Earlier application is permitted. The impact from adoption of the new requirements of ASU No. 2016-16 on our consolidated financial position or results of operations has not yet been determined.
47
In August 2016 the FASB issued ASU No. 2016-15, Statement of Cash Flows (Topic 230): Classification of Certain Cash Receipts and Cash Payments. ASU No. 2016-15 clarifies and provides guidance on eight specific cash flow classification issues and is intended to reduce existing diversity in practice in how certain cash receipts and cash payments are presented and classified in the statement of cash flows. ASU No. 2016-15 is effective for annual reporting periods beginning after December 15, 2017 and interim periods within those years. Earlier application is permitted, provided that all of the amendments are adopted in the same period. The adoption of the new requirements of ASU No. 2016-15 will not have any impact on our net consolidated financial position or results of operations.
In February 2016 the FASB issued ASU No. 2016-02, Leases (Topic 842). ASU No. 2016-02 affects any entity that enters into a lease (as that term is defined in the ASU) and its guidance supersedes Topic 840, Leases. As it substantively relates to the Company, ASU No. 2016-02 requires lessees to recognize a right-of-use asset and a lease liability, initially measured at the present value of the lease payments, in the statement of financial position. For finance leases, lessees are required to recognize interest on the lease liability separately from amortization of the right-of-use asset in the statement of comprehensive income and to classify repayments of the principal portion of the lease liability within financing activities and payments of interest on the lease liability and variable lease payments within operating activities in the statement of cash flows. For operating leases, lessees are required to recognize a single lease cost, calculated so that the cost of the lease is allocated over the lease term on a generally straight-line basis, and to classify all cash payments within operating activities in the statement of cash flows. In transition, lessees are required to recognize and measure leases at the beginning of the earliest period presented using a modified retrospective approach. ASU No. 2016-02 is effective for financial statements issued for annual reporting periods beginning after December 15, 2018 and interim periods within those years. Earlier application is permitted. While the Company is still evaluating this standard, given the significant number of leases the Company is party to, the Company expects this standard will have a material impact on the Company's financial statements.
In May 2014 the FASB issued ASU No. 2014-09, Revenue from Contracts with Customers (Topic 606). ASU No. 2014-09 requires an entity to recognize revenue for the amount of consideration to which it expects to be entitled for the transfer of promised goods or services to customers. Additionally, ASU No. 2014-09 requires improved disclosures to help users of financial statements better understand the nature, amount, timing, and uncertainty of revenue that is recognized. The standard will replace most existing revenue recognition guidance in GAAP when it becomes effective. ASU No. 2014-09 is effective for financial statements issued for annual reporting periods beginning after December 15, 2016 and interim periods within those years. In August 2015 the FASB issued ASU No. 2015-14, Revenue from Contracts with Customers (Topic 606): Deferral of the Effective Date which deferred the effective date of ASU No. 2014-09 by one year, making the guidance effective for fiscal years beginning after December 15, 2017. Early adoption will be permitted, but not earlier than the original effective date for annual and interim periods. We will adopt the new guidance beginning with the first quarter of fiscal 2018 as a cumulative effect adjustment as of the date of adoption. We are in the process of finalizing our analysis, we do not expect the adoption will have a material impact on our consolidated financial position or results of operations. In order to determine the impact of ASU No. 2014-09, our assessment included a detailed review of our revenue streams and a comparison of our historical accounting policies and practices to the new standard.
Change in Accounting Principle
The Company sells gift cards to its customers in its retail stores, through its websites and through select third parties. The portion of gift cards sold to customers which are never redeemed is commonly referred to as gift card breakage. Prior to fiscal 2017 the Company recognized revenue from gift card breakage after it determined that any legal obligation to report and remit the value associated with abandoned property had been satisfied. The Company has accumulated a significant amount of historical data from its past gift card transactions, allowing it to reasonably and objectively determine the pattern of gift card redemptions and a related estimated gift card breakage rate. In the first quarter of fiscal 2017 the Company elected to record revenue from gift card breakage over the period of, and in proportion to, the actual redemptions of gift cards based on the Company’s historical breakage. The Company believes this method is preferable as it better reflects the gift card earnings process resulting in the recognition of gift card breakage income over the period of gift card redemptions (i.e., over the performance period).
The Company determined that this accounting change represented a change in accounting estimate effected by a change in accounting principle. In accordance with the requirements of ASC Topic 250 related to such accounting changes, during the first quarter of fiscal 2017 the Company recognized $0.8 million of revenue as a cumulative adjustment for the accounting change.
Inflation
We do not believe that inflation has had a material effect on our net sales or profitability in the periods presented. However, there can be no assurance that our business will not be affected by inflation in the future.
48
Some of the information in this report, including the information incorporated by reference (as well as information included in oral statements or other written statements made or to be made by us), contains forward-looking statements within the meaning of Section 27A of the Securities Act of 1933, as amended, and Section 21E of the Securities Exchange Act of 1934, as amended (the “Exchange Act”). The forward-looking statements involve a number of risks and uncertainties. A number of factors could cause our actual results, performance, achievements or industry results to be materially different from any future results, performance or achievements expressed or implied by these forward-looking statements. These factors include, but are not limited to: the strength or weakness of the retail industry in general and of apparel purchases in particular, our ability to successfully manage our various business initiatives, the success of our international business and its expansion, our ability to successfully manage, retain and expand our leased department and international franchise relationships and marketing partnerships, future sales trends in our various sales channels, unusual weather patterns, changes in consumer spending patterns, raw material price increases, overall economic conditions and other factors affecting consumer confidence, demographics and other macroeconomic factors that may impact the level of spending for maternity apparel (such as fluctuations in pregnancy rates and birth rates), expense savings initiatives, our ability to anticipate and respond to fashion trends and consumer preferences, unanticipated fluctuations in our operating results, the impact of competition and fluctuations in the price, availability and quality of raw materials and contracted products, availability of suitable store locations, continued availability of capital and financing, our ability to hire, develop and retain senior management and sales associates, our ability to develop and source merchandise, our ability to receive production from foreign sources on a timely basis, our compliance with applicable financial and other covenants under our financing arrangements, potential debt prepayments, the trading liquidity of our common stock, changes in market interest rates, our compliance with certain tax incentive and abatement programs, war or acts of terrorism and other factors referenced in this report, including those set forth under the caption “Item 1A. Risk Factors.”
In addition, these forward-looking statements necessarily depend upon assumptions, estimates and dates that may be incorrect or imprecise and involve known and unknown risks, uncertainties and other factors. Accordingly, any forward-looking statements included in this report do not purport to be predictions of future events or circumstances and may not be realized. Forward-looking statements can be identified by, among other things, the use of forward-looking terms such as “believes,” “expects,” “may,” “will,” “should,” “seeks,” “pro forma,” “anticipates,” “intends,” “continues,” “could,” “estimates,” “plans,” “potential,” “predicts,” “goal,” “objective,” or the negative of any of these terms, or comparable terminology, or by discussions of our outlook, plans, goals, strategy or intentions. Forward-looking statements speak only as of the date made. Except as required by applicable law, including the securities laws of the United States and the rules and regulations of the SEC, we assume no obligation to update any of these forward-looking statements to reflect actual results, changes in assumptions or changes in other factors affecting these forward-looking statements.
The Company is exposed to market risk from changes in interest rates. We have not entered into any market sensitive instruments for trading purposes. The analysis below presents the sensitivity of the market value of our financial instruments to selected changes in market interest rates. The range of changes presented reflects our view of changes that are reasonably possible over a one-year period.
As of February 3, 2018, we had cash and cash equivalents of $1.6 million. Our cash equivalents consist of investments in money market funds that bear interest at variable rates. A change in market interest rates earned on our investments impacts the interest income and cash flows, but does not materially impact the fair market value of the financial instruments. Due to the low balance, average maturity and conservative nature of our investment portfolio, we believe a sudden change in interest rates would not have a material effect on the value of our investment portfolio. The impact on our future interest income resulting from changes in investment yields will depend largely on the gross amount of our investment portfolio at that time. However, based upon the conservative nature of our investment portfolio and current experience, we do not believe a decrease in investment yields would have a material negative effect on our interest income.
The components of our debt portfolio as of February 3, 2018 are $22.5 million due under our Term Loan, $6.0 million due under our equipment note, $2.7 million due under a sale and leaseback transaction and the $50.0 million Credit Facility. Each of the components of our debt portfolio are denominated in United States dollars. The fair value of the debt portfolio is referred to as the “debt value.” The equipment note bears interest at a fixed rate of 3.38%. Although a change in market interest rates would not affect the interest incurred or cash flow related to this fixed rate portion of the debt portfolio, the debt value would be affected.
The Term Loan carries a variable interest rate that is tied to market indices with a minimum annual rate of 9.0%. The sensitivity analysis as it relates to this portion of our debt portfolio assumes an instantaneous 100 basis point move in interest rates above and below the minimum threshold, with all other variables held constant. The debt value of the Term Loan is approximately $22.5 million. A 100 basis point increase in market interest rates above the minimum threshold would result in additional annual interest expense on the Term Loan of approximately $0.2 million. A 100 basis point decline in market interest rates below the minimum threshold would have no effect on our annual interest expense on the Term Loan.
49
Our Credit Facility has variable interest rates that are tied to market indices. As of February 3, 2018, we had $8.0 million of direct borrowings and $7.3 million of letters of credit outstanding under our Credit Facility. As of February 3, 2018, borrowings under the Credit Facility would have resulted in interest at a rate between approximately 3.1% and 5.0% per annum. Interest on any future borrowings under the Credit Facility would, to the extent of outstanding borrowings, be affected by changes in market interest rates. A change in market interest rates on the variable rate portion of our debt portfolio would impact the interest expense incurred and cash flows.
The sensitivity analysis as it relates to the fixed rate portion of our debt portfolio assumes an instantaneous 100 basis point move in interest rates from their levels as of February 3, 2018, with all other variables held constant. A 100 basis point increase in market interest rates would result in a decrease in the value of the debt by approximately $0.1 million as of February 3, 2018. A 100 basis point decline in market interest rates would cause the debt value to increase by approximately $0.1 million as of February 3, 2018.
Other than as described above, we do not believe that the market risk exposure on other financial instruments is material.
Our Consolidated Financial Statements appear on pages F-1 through F-31, as set forth in Item 15.
None.
Disclosure Controls and Procedures
Our disclosure controls and procedures are designed to ensure that information required to be disclosed by us in the reports that are filed or submitted under the Exchange Act is recorded, processed, summarized and reported within the time periods specified in the SEC’s rules and forms. These disclosure controls and procedures include controls and procedures designed to ensure that information required to be disclosed under the Exchange Act is accumulated and communicated to our management on a timely basis to allow decisions regarding required disclosure. We evaluated the effectiveness of the design and operation of our disclosure controls and procedures as of February 3, 2018. Based on this evaluation, the Company’s Interim Chief Executive Officer and Chief Financial Officer have concluded that as of February 3, 2018 these controls and procedures were effective.
Internal Control over Financial Reporting
(a) Management’s Annual Report on Internal Control over Financial Reporting
The Company’s management is responsible for establishing and maintaining adequate internal control over financial reporting to provide reasonable assurance regarding the reliability of the Company’s financial reporting and the preparation of financial statements for external purposes in accordance with generally accepted accounting principles. Internal control over financial reporting includes those policies and procedures that (i) pertain to the maintenance of records that in reasonable detail accurately and fairly reflect the transactions and dispositions of the assets of the Company, (ii) provide reasonable assurance that transactions are recorded as necessary to permit preparation of financial statements in accordance with generally accepted accounting principles, and that receipts and expenditures of the Company are being made only in accordance with authorizations of management and directors of the Company, and (iii) provide reasonable assurance regarding prevention or timely detection of unauthorized acquisition, use or disposition of the Company’s assets that could have a material effect on the financial statements.
Management assessed the Company’s internal control over financial reporting as of February 3, 2018, the end of the Company’s fiscal year. Management based its assessment on criteria established in Internal Control—Integrated Framework (2013) issued by the Committee of Sponsoring Organizations of the Treadway Commission. Management’s assessment included evaluation of such elements as the design and operating effectiveness of key financial reporting controls, process documentation, accounting policies, and the Company’s overall control environment.
Based on its assessment, management has concluded that the Company’s internal control over financial reporting was effective as of the end of the fiscal year to provide reasonable assurance regarding the reliability of financial reporting and the preparation of financial statements for external reporting purposes in accordance with generally accepted accounting principles. The results of management’s assessment were reviewed with the Audit Committee of the Company’s Board of Directors.
(b) Change in Internal Control over Financial Reporting
There have been no changes in internal control over financial reporting identified in connection with management’s evaluation that occurred during the fiscal quarter ended February 3, 2018 that have materially affected, or are reasonably likely to materially affect, our internal control over financial reporting.
50
Information concerning directors and corporate governance, appearing under the captions “Corporate Governance,” “Election of Directors” and “Section 16(a) Beneficial Ownership Reporting Compliance” in our Proxy Statement, is incorporated herein by reference in response to this Item 10. Information concerning executive officers, appearing under the caption “Item 1. Business—Executive Officers of the Company” in Part I of this Form 10-K, is incorporated herein by reference in response to this Item 10.
The Board of Directors has adopted a Code of Business Conduct and Ethics, which can be found on the Company’s corporate website at investor.destinationmaternity.com. We intend to satisfy the amendment and waiver disclosure requirements under applicable securities regulations by posting any amendments of, or waivers to, the Code of Business Conduct and Ethics on our website.
The information contained in the Proxy Statement from the sections titled “Compensation Discussion and Analysis,” “Reports of Committees of the Board of Directors” and “Executive Compensation” with respect to executive compensation, and in the section titled “Compensation of Directors” with respect to director compensation, is incorporated herein by reference in response to this Item 11.
|
Item 12. |
Security Ownership of Certain Beneficial Owners and Management and Related Stockholder Matters |
Securities Authorized for Issuance Under Equity Compensation Plans
The following table provides information as of February 3, 2018 regarding the number of shares of common stock that may be issued under our equity compensation plans.
|
Plan Category |
|
Number of securities to be issued upon exercise of outstanding options, warrants and rights |
|
|
Weighted-average exercise price of outstanding options, warrants and rights |
|
|
Number of securities remaining available for future issuance under equity compensation plans (excluding securities reflected in the first column) |
|
||||||||
|
Equity compensation plans approved by security holders |
|
|
471,014 |
(1) |
|
|
|
$ |
12.14 |
|
|
|
|
|
785,703 |
(2) |
|
|
Equity compensation plans not approved by security holders |
|
|
73,255 |
(3) |
|
|
|
$ |
5.62 |
|
|
|
|
|
— |
|
|
|
Total |
|
|
544,269 |
|
|
|
|
$ |
11.26 |
|
|
|
|
|
785,703 |
|
|
|
(1) |
Reflects shares subject to options outstanding under the 2005 Plan. |
|
(2) |
Reflects shares available under the 2005 Plan (all of which may be issued as shares of restricted stock, restricted stock units or deferred stock units). |
|
(3) |
Reflects shares subject to an outstanding option agreement awarded as a non-plan based inducement grant. |
The information contained in the section titled “Security Ownership of Certain Beneficial Owners and Management” in the Proxy Statement, with respect to security ownership of certain beneficial owners and management, is incorporated herein by reference in response to this Item 12.
The information contained in the sections titled “Corporate Governance” and “Election of Directors” in the Proxy Statement with respect to certain relationships and director independence, is incorporated herein by reference in response to this Item 13.
The information contained in the Proxy Statement in the section titled “Auditor Fees and Services” is incorporated herein by reference in response to this Item 14.
51
|
(a) (1) |
Financial Statements |
The financial statements listed in the accompanying Index to Consolidated Financial Statements and Financial Statement Schedule are filed as part of this Form 10-K, commencing on page F-1.
|
|
(2) |
Financial Statement Schedules Schedule II—Valuation and Qualifying Accounts. |
All other schedules are omitted because they are not applicable or not required, or because the required information is included in the consolidated financial statements or notes thereto.
|
|
(3) |
Exhibits |
See following Index of Exhibits.
52
|
Exhibit No. |
|
Description |
|
|
|
|
|
*3.1 |
|
|
|
|
|
|
|
3.2 |
|
|
|
|
|
|
|
†*10.1 |
|
|
|
|
|
|
|
†*10.2 |
|
|
|
|
|
|
|
†*10.3 |
|
|
|
|
|
|
|
†*10.4 |
|
|
|
|
|
|
|
†*10.5 |
|
Non-Employee Director Compensation Policy (Exhibit 10.2 to the January 24, 2014 Form 8-K) |
|
|
|
|
|
*10.6 |
|
|
|
|
|
|
|
†*10.7 |
|
|
|
|
|
|
|
†*10.8 |
|
|
|
|
|
|
|
*10.9 |
|
|
|
|
|
|
|
*10.10 |
|
|
|
|
|
|
|
*10.11 |
|
|
|
|
|
|
|
†*10.12 |
|
|
|
|
|
|
|
†*10.13 |
|
|
|
|
|
|
|
†*10.14 |
|
|
|
|
|
|
|
†*10.15 |
|
|
|
|
|
|
|
†*10.16 |
|
|
|
|
|
|
|
†*10.17 |
|
|
|
|
|
|
|
†*10.18 |
|
|
|
|
|
|
53
|
Exhibit No. |
|
Description |
|
|
||
|
|
|
|
|
*10.20 |
|
|
|
|
|
|
|
*10.21 |
|
|
|
|
|
|
|
*10.22 |
|
|
|
|
|
|
|
†*10.23 |
|
|
|
|
|
|
|
†*10.24 |
|
|
|
|
|
|
|
*10.25 |
|
|
|
|
|
|
|
*10.26 |
|
|
|
|
|
|
|
*10.27 |
|
|
|
|
|
|
|
*10.28 |
|
|
|
|
|
|
|
*10.29 |
|
|
|
|
|
|
|
*10.30 |
|
|
|
|
|
|
|
†*10.31 |
|
|
|
|
|
|
|
†*10.32 |
|
|
|
|
|
|
|
*10.33 |
|
|
|
|
|
|
|
*10.34 |
|
|
|
|
|
|
|
*10.35 |
|
|
|
|
|
|
|
*10.36 |
|
|
|
|
|
|
54
|
Exhibit No. |
|
Description |
|
|
||
|
|
|
|
|
†*10.38 |
|
|
|
|
|
|
|
†*10.39 |
|
|
|
|
|
|
|
*10.40 |
|
|
|
|
|
|
|
†*10.41 |
|
|
|
|
|
|
|
†*10.42 |
|
|
|
|
|
|
|
†*10.43 |
|
|
|
|
|
|
|
†*10.44 |
|
|
|
|
|
|
|
†*10.45 |
|
|
|
|
|
|
|
*10.46 |
|
|
|
|
|
|
|
10.47 |
|
|
|
|
|
|
|
*10.48 |
|
|
|
|
|
|
|
*10.49 |
|
|
|
|
|
|
|
*10.50 |
|
|
|
|
|
|
|
*18.1 |
|
|
|
|
|
|
|
21 |
|
|
|
|
|
|
|
23 |
|
|
|
|
|
|
|
31.1 |
|
|
|
|
|
|
|
31.2 |
|
|
|
|
|
|
|
32.1 |
|
|
|
|
|
|
55
|
Exhibit No. |
|
Description |
|
|
||
|
|
|
|
|
101.INS |
|
XBRL Instance Document |
|
|
|
|
|
101.SCH |
|
XBRL Taxonomy Extension Schema Document |
|
|
|
|
|
101.CAL |
|
XBRL Taxonomy Extension Calculation Linkbase Document |
|
|
|
|
|
101.DEF |
|
XBRL Taxonomy Extension Definition Linkbase Document |
|
|
|
|
|
101.LAB |
|
XBRL Taxonomy Extension Label Linkbase Document |
|
|
|
|
|
101.PRE |
|
XBRL Taxonomy Extension Presentation Linkbase Document |
|
* |
Incorporated by reference. |
|
† |
Management contract or compensatory plan or arrangement. |
Optional disclosure, not included in this Form 10-K.
56
Pursuant to the requirements of Section 13 or 15(d) of the Securities Exchange Act of 1934, the Registrant has duly caused this report to be signed on its behalf by the undersigned, thereunto duly authorized on April 19, 2018.
|
DESTINATION MATERNITY CORPORATION |
||
|
|
|
|
|
By: |
|
/S/ Melissa Payner-Gregor |
|
|
|
Melissa Payner-Gregor |
|
|
|
Interim Chief Executive Officer (Principal Executive Officer) |
|
|
|
|
|
By: |
|
/S/ David Stern |
|
|
|
David Stern |
|
|
|
Executive Vice President & Chief Financial Officer (Principal Financial Officer) |
|
|
|
|
|
By: |
|
/S/ Rodney Schriver |
|
|
|
Rodney Schriver |
|
|
|
Senior Vice President & Chief Accounting Officer (Principal Accounting Officer) |
Pursuant to the requirements of the Securities Exchange Act of 1934, this Report has been signed by the following persons on April 19, 2018, in the capacities indicated:
|
/S/ Melissa Payner-Gregor
Melissa Payner-Gregor |
|
Interim Chief Executive Officer and Director (Principal Executive Officer) |
|
|
|
|
|
/S/ David Stern
David Stern |
|
Executive Vice President & Chief Financial Officer (Principal Financial Officer) |
|
|
|
|
|
/S/ Rodney Schriver
Rodney Schriver |
|
Senior Vice President & Chief Accounting Officer (Principal Accounting Officer) |
|
|
|
|
|
/S/ Barry Erdos
Barry Erdos |
|
Director (Non-Executive Chairman of the Board) |
|
|
|
|
|
/S/ Michael J. Blitzer
Michael J. Blitzer |
|
Director |
|
|
|
|
|
/S/ Peter Longo
Peter Longo |
|
Director |
|
|
|
|
|
/S/ Pierre-Andre Mestre
Pierre-Andre Mestre |
|
Director |
|
|
|
|
|
|
|
|
57
DESTINATION MATERNITY CORPORATION AND SUBSIDIARIES
INDEX TO CONSOLIDATED FINANCIAL STATEMENTS
AND FINANCIAL STATEMENT SCHEDULE
|
|
F-2 |
|
|
F-3 |
|
|
F-4 |
|
|
F-5 |
|
|
F-6 |
|
|
F-7 |
|
. |
F-8 to F-29 |
|
Schedule Supporting the Consolidated Financial Statements: |
|
|
|
F-30 |
F-1
Report of Independent Registered Public Accounting Firm
To the Stockholders and the Board of Directors
Destination Maternity Corporation:
Opinion on the Consolidated Financial Statements
We have audited the accompanying consolidated balance sheets of Destination Maternity Corporation and subsidiaries (the “Company”) as of February 3, 2018 and January 28, 2017, and the related consolidated statements of operations, comprehensive loss, stockholders’ equity and cash flows for each of the years in the three-year period ended February 3, 2018 and the related notes and financial statement schedule Valuation and Qualifying Accounts (collectively, the “consolidated financial statements”). In our opinion, the consolidated financial statements present fairly, in all material respects, the financial position of the Company as of February 3, 2018 and January 28, 2017, and the results of its operations and its cash flows for each of the years in the three-year period ended February 3, 2018, in conformity with U.S. generally accepted accounting principles.
Basis for Opinion
These consolidated financial statements are the responsibility of the Company’s management. Our responsibility is to express an opinion on these consolidated financial statements based on our audits. We are a public accounting firm registered with the Public Company Accounting Oversight Board (United States) (“PCAOB”) and are required to be independent with respect to the Company in accordance with the U.S. federal securities laws and the applicable rules and regulations of the Securities and Exchange Commission and the PCAOB.
We conducted our audits in accordance with auditing standards of the PCAOB. Those standards require that we plan and perform the audit to obtain reasonable assurance about whether the consolidated financial statements are free of material misstatement, whether due to error or fraud. The Company is not required to have, nor were we engaged to perform, an audit of its internal control over financial reporting. As part of our audits, we are required to obtain an understanding of internal control over financial reporting but not for the purpose of expressing an opinion on the effectiveness of the Company’s internal control over financial reporting. Accordingly, we express no such opinion.
Our audits included performing procedures to assess the risks of material misstatement of the consolidated financial statements, whether due to error or fraud, and performing procedures that respond to those risks. Such procedures included examining, on a test basis, evidence regarding the amounts and disclosures in the consolidated financial statements. Our audits also included evaluating the accounting principles used and significant estimates made by management, as well as evaluating the overall presentation of the consolidated financial statements. We believe that our audits provide a reasonable basis for our opinion.
/s/ KPMG LLP
We have served as the Company’s auditor since 2002.
Philadelphia Pennsylvania
April 19, 2018
F-2
DESTINATION MATERNITY CORPORATION AND SUBSIDIARIES
(in thousands, except share and per share amounts)
|
|
|
February 3, 2018 |
|
|
January 28, 2017 |
|
||
|
ASSETS |
|
|
|
|
|
|
|
|
|
Current assets: |
|
|
|
|
|
|
|
|
|
Cash and cash equivalents |
|
$ |
1,635 |
|
|
$ |
2,859 |
|
|
Trade receivables, net |
|
|
6,692 |
|
|
|
5,683 |
|
|
Inventories |
|
|
71,256 |
|
|
|
69,040 |
|
|
Prepaid expenses and other current assets |
|
|
11,522 |
|
|
|
9,464 |
|
|
Total current assets |
|
|
91,105 |
|
|
|
87,046 |
|
|
Property and equipment, net |
|
|
66,146 |
|
|
|
83,029 |
|
|
Other assets: |
|
|
|
|
|
|
|
|
|
Deferred line of credit financing costs, net of accumulated amortization of $829 and $717 |
|
|
450 |
|
|
|
456 |
|
|
Other intangible assets, net of accumulated amortization of $907 and $810 |
|
|
953 |
|
|
|
1,092 |
|
|
Deferred income taxes |
|
|
2,829 |
|
|
|
3,251 |
|
|
Other non-current assets |
|
|
1,099 |
|
|
|
1,113 |
|
|
Total other assets |
|
|
5,331 |
|
|
|
5,912 |
|
|
Total assets |
|
$ |
162,582 |
|
|
$ |
175,987 |
|
|
|
|
|
|
|
|
|
|
|
|
LIABILITIES AND STOCKHOLDERS’ EQUITY |
|
|
|
|
|
|
|
|
|
Current liabilities: |
|
|
|
|
|
|
|
|
|
Line of credit borrowings |
|
$ |
8,000 |
|
|
$ |
4,600 |
|
|
Current portion of long-term debt |
|
|
4,780 |
|
|
|
6,948 |
|
|
Accounts payable |
|
|
30,949 |
|
|
|
17,656 |
|
|
Accrued expenses and other current liabilities |
|
|
31,661 |
|
|
|
31,359 |
|
|
Total current liabilities |
|
|
75,390 |
|
|
|
60,563 |
|
|
Long-term debt |
|
|
23,809 |
|
|
|
31,485 |
|
|
Deferred rent and other non-current liabilities |
|
|
22,715 |
|
|
|
22,789 |
|
|
Total liabilities |
|
|
121,914 |
|
|
|
114,837 |
|
|
|
|
|
|
|
|
|
|
|
|
Commitments and contingencies (Note 16) |
|
|
|
|
|
|
|
|
|
|
|
|
|
|
|
|
|
|
|
Stockholders’ equity: |
|
|
|
|
|
|
|
|
|
Preferred stock, 1,656,381 shares authorized |
|
|
|
|
|
|
|
|
|
Series B junior participating preferred stock, $.01 par value; 300,000 shares authorized, none outstanding |
|
|
— |
|
|
|
— |
|
|
Common stock, $.01 par value; 20,000,000 shares authorized, 14,684,117 and 14,010,417 shares issued and outstanding |
|
|
147 |
|
|
|
140 |
|
|
Additional paid-in capital |
|
|
106,865 |
|
|
|
105,775 |
|
|
Accumulated deficit |
|
|
(66,274 |
) |
|
|
(44,693 |
) |
|
Accumulated other comprehensive loss |
|
|
(70 |
) |
|
|
(72 |
) |
|
Total stockholders’ equity |
|
|
40,668 |
|
|
|
61,150 |
|
|
Total liabilities and stockholders’ equity |
|
$ |
162,582 |
|
|
$ |
175,987 |
|
The accompanying notes are an integral part of these Consolidated Financial Statements.
F-3
DESTINATION MATERNITY CORPORATION AND SUBSIDIARIES
CONSOLIDATED STATEMENTS OF OPERATIONS
(in thousands, except per share amounts)
|
|
Year Ended |
|
||||||||||
|
|
February 3, 2018 |
|
January 28, 2017 |
|
|
January 30, 2016 |
|
|
||||
|
Net sales |
$ |
406,207 |
|
|
$ |
433,699 |
|
|
$ |
498,753 |
|
|
|
Cost of goods sold |
|
192,355 |
|
|
|
206,271 |
|
|
|
252,713 |
|
|
|
Gross profit |
|
213,852 |
|
|
|
227,428 |
|
|
|
246,040 |
|
|
|
Selling, general and administrative expenses |
|
218,656 |
|
|
|
223,881 |
|
|
|
246,914 |
|
|
|
Store closing, asset impairment and asset disposal expenses (income) |
|
6,292 |
|
|
|
2,768 |
|
|
|
(2,084 |
) |
|
|
Other charges, net |
|
4,912 |
|
|
|
4,914 |
|
|
|
6,979 |
|
|
|
Operating loss |
|
(16,008 |
) |
|
|
(4,135 |
) |
|
|
(5,769 |
) |
|
|
Interest expense, net |
|
4,045 |
|
|
|
3,575 |
|
|
|
1,520 |
|
|
|
Loss on extinguishment of debt |
|
1,542 |
|
|
|
— |
|
|
|
— |
|
|
|
Loss before income taxes |
|
(21,595 |
) |
|
|
(7,710 |
) |
|
|
(7,289 |
) |
|
|
Income tax provision (benefit) |
|
2 |
|
|
|
25,050 |
|
|
|
(2,806 |
) |
|
|
Net loss |
$ |
(21,597 |
) |
|
$ |
(32,760 |
) |
|
$ |
(4,483 |
) |
|
|
|
|
|
|
|
|
|
|
|
|
|
|
|
|
Net loss per share—Basic |
$ |
(1.57 |
) |
|
$ |
(2.39 |
) |
|
$ |
(0.33 |
) |
|
|
Average shares outstanding—Basic |
|
13,788 |
|
|
|
13,702 |
|
|
|
13,596 |
|
|
|
Net loss per share—Diluted |
$ |
(1.57 |
) |
|
$ |
(2.39 |
) |
|
$ |
(0.33 |
) |
|
|
Average shares outstanding—Diluted |
|
13,788 |
|
|
|
13,702 |
|
|
|
13,596 |
|
|
The accompanying notes are an integral part of these Consolidated Financial Statements.
F-4
DESTINATION MATERNITY CORPORATION AND SUBSIDIARIES
CONSOLIDATED STATEMENTS OF COMPREHENSIVE LOSS
(in thousands)
|
|
Year Ended |
|
|||||||||
|
|
February 3, 2018 |
|
|
January 28, 2017 |
|
|
January 30, 2016 |
|
|||
|
Net loss |
$ |
(21,597 |
) |
|
$ |
(32,760 |
) |
|
$ |
(4,483 |
) |
|
Foreign currency translation adjustments |
|
2 |
|
|
|
1 |
|
|
|
(9 |
) |
|
Comprehensive loss |
$ |
(21,595 |
) |
|
$ |
(32,759 |
) |
|
$ |
(4,492 |
) |
The accompanying notes are an integral part of these Consolidated Financial Statements.
F-5
DESTINATION MATERNITY CORPORATION AND SUBSIDIARIES
CONSOLIDATED STATEMENTS OF STOCKHOLDERS’ EQUITY
(in thousands)
|
|
Common Stock |
|
|
Additional |
|
|
Retained |
|
|
Accumulated |
|
|
Total |
|
|||||||||
|
|
Number |
|
|
Amount |
|
|
|
|
|
|
|
|
|
||||||||||
|
Balance as of January 31, 2015 |
|
13,807 |
|
|
$ |
138 |
|
|
$ |
102,370 |
|
|
$ |
3,558 |
|
|
$ |
(64 |
) |
|
$ |
106,002 |
|
|
Net loss |
|
— |
|
|
|
— |
|
|
|
— |
|
|
|
(4,483 |
) |
|
|
— |
|
|
|
(4,483 |
) |
|
Foreign currency translation adjustments |
|
— |
|
|
|
— |
|
|
|
— |
|
|
|
— |
|
|
|
(9 |
) |
|
|
(9 |
) |
|
Cash dividends |
|
— |
|
|
|
— |
|
|
|
— |
|
|
|
(11,026 |
) |
|
|
— |
|
|
|
(11,026 |
) |
|
Stock-based compensation |
|
22 |
|
|
|
— |
|
|
|
2,784 |
|
|
|
— |
|
|
|
— |
|
|
|
2,784 |
|
|
Exercise of stock options, net |
|
11 |
|
|
|
— |
|
|
|
69 |
|
|
|
— |
|
|
|
— |
|
|
|
69 |
|
|
Tax benefit shortfall from stock option exercises and restricted stock vesting |
|
— |
|
|
|
— |
|
|
|
(312 |
) |
|
|
— |
|
|
|
— |
|
|
|
(312 |
) |
|
Repurchase and retirement of common stock |
|
(15 |
) |
|
|
— |
|
|
|
(127 |
) |
|
|
— |
|
|
|
— |
|
|
|
(127 |
) |
|
Balance as of January 30, 2016 |
|
13,825 |
|
|
|
138 |
|
|
|
104,784 |
|
|
|
(11,951 |
) |
|
|
(73 |
) |
|
|
92,898 |
|
|
Net loss |
|
— |
|
|
|
— |
|
|
|
— |
|
|
|
(32,760 |
) |
|
|
— |
|
|
|
(32,760 |
) |
|
Foreign currency translation adjustments |
|
— |
|
|
|
— |
|
|
|
— |
|
|
|
— |
|
|
|
1 |
|
|
|
1 |
|
|
Dividends forfeited |
|
— |
|
|
|
— |
|
|
|
— |
|
|
|
18 |
|
|
|
— |
|
|
|
18 |
|
|
Stock-based compensation |
|
191 |
|
|
|
2 |
|
|
|
1,799 |
|
|
|
— |
|
|
|
— |
|
|
|
1,801 |
|
|
Exercise of stock options, net |
|
2 |
|
|
|
— |
|
|
|
6 |
|
|
|
— |
|
|
|
— |
|
|
|
6 |
|
|
Tax benefit shortfall from stock option exercises and restricted stock vesting |
|
— |
|
|
|
— |
|
|
|
(760 |
) |
|
|
— |
|
|
|
— |
|
|
|
(760 |
) |
|
Repurchase and retirement of common stock |
|
(8 |
) |
|
|
— |
|
|
|
(54 |
) |
|
|
— |
|
|
|
— |
|
|
|
(54 |
) |
|
Balance as of January 28, 2017 |
|
14,010 |
|
|
|
140 |
|
|
|
105,775 |
|
|
|
(44,693 |
) |
|
|
(72 |
) |
|
|
61,150 |
|
|
Net loss |
|
— |
|
|
|
— |
|
|
|
— |
|
|
|
(21,597 |
) |
|
|
— |
|
|
|
(21,597 |
) |
|
Foreign currency translation adjustments |
|
— |
|
|
|
— |
|
|
|
— |
|
|
|
— |
|
|
|
2 |
|
|
|
2 |
|
|
Dividends forfeited |
|
— |
|
|
|
— |
|
|
|
— |
|
|
|
16 |
|
|
|
— |
|
|
|
16 |
|
|
Stock-based compensation |
|
693 |
|
|
|
7 |
|
|
|
1,147 |
|
|
|
— |
|
|
|
— |
|
|
|
1,154 |
|
|
Repurchase and retirement of common stock |
|
(19 |
) |
|
|
— |
|
|
|
(57 |
) |
|
|
— |
|
|
|
— |
|
|
|
(57 |
) |
|
Balance as of February 3, 2018 |
|
14,684 |
|
|
$ |
147 |
|
|
$ |
106,865 |
|
|
$ |
(66,274 |
) |
|
$ |
(70 |
) |
|
$ |
40,668 |
|
The accompanying notes are an integral part of these Consolidated Financial Statements.
F-6
DESTINATION MATERNITY CORPORATION AND SUBSIDIARIES
CONSOLIDATED STATEMENTS OF CASH FLOWS
(in thousands)
|
|
|
Year Ended |
|
|||||||||
|
|
|
February 3, 2018 |
|
|
January 28, 2017 |
|
|
January 30, 2016 |
|
|||
|
Operating Activities |
|
|
|
|
|
|
|
|
|
|
|
|
|
Net loss |
|
$ |
(21,597 |
) |
|
$ |
(32,760 |
) |
|
$ |
(4,483 |
) |
|
Adjustments to reconcile net loss to net cash provided by operating activities: |
|
|
|
|
|
|
|
|
|
|
|
|
|
Depreciation and amortization |
|
|
17,592 |
|
|
|
18,032 |
|
|
|
17,231 |
|
|
Stock-based compensation expense |
|
|
1,154 |
|
|
|
1,801 |
|
|
|
2,784 |
|
|
Loss on impairment of long-lived assets |
|
|
5,775 |
|
|
|
2,388 |
|
|
|
1,662 |
|
|
Loss on disposal of assets |
|
|
349 |
|
|
|
272 |
|
|
|
193 |
|
|
Loss on extinguishment of debt |
|
|
1,542 |
|
|
|
— |
|
|
|
— |
|
|
Grow NJ award benefit |
|
|
422 |
|
|
|
349 |
|
|
|
(3,600 |
) |
|
Deferred income tax provision |
|
|
— |
|
|
|
24,614 |
|
|
|
2,020 |
|
|
Amortization of deferred financing costs |
|
|
487 |
|
|
|
328 |
|
|
|
166 |
|
|
Changes in assets and liabilities: |
|
|
|
|
|
|
|
|
|
|
|
|
|
Decrease (increase) in: |
|
|
|
|
|
|
|
|
|
|
|
|
|
Trade receivables |
|
|
(1,009 |
) |
|
|
4,471 |
|
|
|
(951 |
) |
|
Inventories |
|
|
(2,216 |
) |
|
|
3,469 |
|
|
|
3,250 |
|
|
Prepaid expenses and other current assets |
|
|
(1,990 |
) |
|
|
328 |
|
|
|
3,194 |
|
|
Other non-current assets |
|
|
14 |
|
|
|
37 |
|
|
|
(178 |
) |
|
(Decrease) increase in: |
|
|
|
|
|
|
|
|
|
|
|
|
|
Accounts payable, accrued expenses and other current liabilities |
|
|
8,565 |
|
|
|
(11,593 |
) |
|
|
(3,675 |
) |
|
Deferred rent and other non-current liabilities |
|
|
(219 |
) |
|
|
(1,025 |
) |
|
|
(1,519 |
) |
|
Net cash provided by operating activities |
|
|
8,869 |
|
|
|
10,711 |
|
|
|
16,094 |
|
|
Investing Activities |
|
|
|
|
|
|
|
|
|
|
|
|
|
Capital expenditures |
|
|
(6,649 |
) |
|
|
(12,690 |
) |
|
|
(29,272 |
) |
|
Proceeds from sale of property, plant and equipment |
|
|
— |
|
|
|
2 |
|
|
|
35 |
|
|
Additions to intangible assets |
|
|
(18 |
) |
|
|
(97 |
) |
|
|
(163 |
) |
|
Net cash used in investing activities |
|
|
(6,667 |
) |
|
|
(12,785 |
) |
|
|
(29,400 |
) |
|
Financing Activities |
|
|
|
|
|
|
|
|
|
|
|
|
|
Increase (decrease) in cash overdrafts |
|
|
5,116 |
|
|
|
681 |
|
|
|
(277 |
) |
|
Increase (decrease) in line of credit borrowings |
|
|
3,400 |
|
|
|
(23,800 |
) |
|
|
28,400 |
|
|
Proceeds from long-term debt |
|
|
25,901 |
|
|
|
32,000 |
|
|
|
— |
|
|
Repayment of long-term debt |
|
|
(34,382 |
) |
|
|
(4,498 |
) |
|
|
(2,801 |
) |
|
Deferred financing costs paid |
|
|
(3,406 |
) |
|
|
(1,519 |
) |
|
|
(157 |
) |
|
Withholding taxes on stock-based compensation paid in connection with repurchase of common stock |
|
|
(57 |
) |
|
|
(54 |
) |
|
|
(127 |
) |
|
Cash dividends paid |
|
|
— |
|
|
|
— |
|
|
|
(11,026 |
) |
|
Proceeds from exercise of stock options |
|
|
— |
|
|
|
6 |
|
|
|
69 |
|
|
Net cash (used in) provided by financing activities |
|
|
(3,428) |
|
|
|
2,816 |
|
|
|
14,081 |
|
|
Effect of exchange rate changes on cash and cash equivalents |
|
|
2 |
|
|
|
1 |
|
|
|
(8 |
) |
|
Net (Decrease) Increase in Cash and Cash Equivalents |
|
|
(1,224 |
) |
|
|
743 |
|
|
|
767 |
|
|
Cash and Cash Equivalents, Beginning of Period |
|
|
2,859 |
|
|
|
2,116 |
|
|
|
1,349 |
|
|
Cash and Cash Equivalents, End of Period |
|
$ |
1,635 |
|
|
$ |
2,859 |
|
|
$ |
2,116 |
|
The accompanying notes are an integral part of these Consolidated Financial Statements.
F-7
DESTINATION MATERNITY CORPORATION AND SUBSIDIARIES
NOTES TO CONSOLIDATED FINANCIAL STATEMENTS
Destination Maternity Corporation and subsidiaries (the “Company”) is a specialty designer and retailer of maternity clothing. The Company operated 1,124 retail locations as of February 3, 2018, including 487 stores and 637 leased departments, throughout the United States, Puerto Rico and Canada, and markets its maternity apparel on the Internet through its DestinationMaternity.com and brand-specific websites. The Company also has store franchise and product supply relationships in the Middle East, South Korea, Mexico, Israel and India. The Company was incorporated in Delaware in 1982.
|
2. |
SUMMARY OF SIGNIFICANT ACCOUNTING POLICIES |
|
|
a. |
Principles of Consolidation and Basis of Financial Statement Presentation |
The accompanying consolidated financial statements include the accounts of the Company and its direct and indirect wholly-owned subsidiaries: Cave Springs, Inc., Mothers Work Canada, Inc. and Destination Maternity Apparel Private Limited. All significant intercompany transactions and accounts have been eliminated in consolidation.
|
|
b. |
Fiscal Year-End |
The Company operates on a 52 or 53 week fiscal year ending on the Saturday nearest January 31 of each year. References to the Company’s fiscal 2017 refer to the 53 week fiscal year, or periods within such fiscal year, which began January 29, 2017 and ended February 3, 2018. References to the Company’s fiscal 2016 refer to the 52 week fiscal year, or periods within such fiscal year, which began January 31, 2016 and ended January 28, 2017. References to the Company’s fiscal 2015 refer to the 52 week fiscal year, or periods within such fiscal year, which began February 1, 2015 and ended January 30, 2016.
|
|
c. |
Use of Estimates |
The preparation of financial statements in conformity with accounting principles generally accepted in the United States requires management to make certain estimates and assumptions that may affect the reported amounts of assets and liabilities and disclosure of contingent assets and liabilities at the date of the financial statements and the reported amounts of revenues and expenses during the reporting period. Actual results could differ from those estimates.
|
|
d. |
Cash and Cash Equivalents |
Cash and cash equivalents include cash on hand, cash in the bank and short-term investments with an original maturity of three months or less when purchased. Book cash overdrafts, which are outstanding checks in excess of funds on deposit, of $7,947,000 and $2,831,000 were included in accounts payable as of February 3, 2018 and January 28, 2017, respectively.
The Company maintains cash accounts that, at times, may exceed federally insured limits. The Company has not experienced any losses from maintaining cash accounts in excess of such limits. Management believes that it is not exposed to any significant credit risks on its cash accounts.
|
|
e. |
Inventories |
Inventories are valued at the lower of cost or net realizable value. Cost is determined by the “first-in, first-out” (FIFO) method. Inventories of goods manufactured by the Company include the cost of materials, freight, direct labor, and design, manufacturing and distribution overhead.
|
|
f. |
Property and Equipment |
Property and equipment are stated at cost. Depreciation and amortization are computed for financial reporting purposes on a straight-line basis, using service lives ranging principally from five to ten years for furniture and equipment. Leasehold improvements are amortized using the straight-line method over the shorter of the lease term or their useful life. The cost of assets sold or retired, and the related accumulated depreciation or amortization are removed from the accounts with any resulting gain or loss included in net income. Maintenance and repairs are expensed as incurred, except for the capitalization of major renewals and betterments that extend the life of the asset. Long-lived assets are reviewed for impairment whenever adverse events, or changes in circumstances or business climate, indicate that the carrying value may not be recoverable. Factors used in the evaluation include, but are not limited to, management’s plans for future operations, brand initiatives, recent operating results and projected cash flows. If the associated undiscounted cash flows are insufficient to support the recorded asset, an impairment loss is recognized to reduce the carrying value of
F-8
DESTINATION MATERNITY CORPORATION AND SUBSIDIARIES
NOTES TO CONSOLIDATED FINANCIAL STATEMENTS (Continued)
the asset. The amount of the impairment loss is determined by comparing the fair value of the asset with the carrying value. During fiscal 2017, 2016 and 2015 the Company recorded impairment write-downs of property and equipment totaling $5,743,000, $2,382,000 and $1,659,000, respectively, on a pretax basis.
|
|
g. |
Intangible Assets |
Intangible assets with definite useful lives consist primarily of patent and lease acquisition costs. The Company capitalizes legal costs incurred to defend its patents when a successful outcome is deemed probable and to the extent of an evident increase in the value of the patents. Intangible assets are amortized over the shorter of their useful life or, if applicable, the lease term. Management reviews the carrying amount of these intangible assets as impairment indicators arise, to assess the continued recoverability based on future undiscounted cash flows and operating results from the related asset, future asset utilization and changes in market conditions. During fiscal 2017, 2016 and 2015 the Company recorded write-downs of intangible assets totaling $32,000, $6,000 and $3,000, respectively, on a pretax basis. The Company has not identified any indefinite-lived intangible assets. Aggregate amortization expense of intangible assets in fiscal 2017, 2016 and 2015 was $126,000, $142,000 and $122,000, respectively.
Estimated amortization expense of the Company’s intangible assets as of February 3, 2018, during our next five future fiscal years ending on the Saturday nearest January 31 of each year is as follows (in thousands):
|
Fiscal Year |
|
|
|
|
2018 |
$ |
116 |
|
|
2019 |
|
109 |
|
|
2020 |
|
101 |
|
|
2021 |
|
90 |
|
|
2022 |
|
82 |
|
|
|
h. |
Deferred Financing Costs |
Deferred financing costs are amortized to interest expense over the term of the related debt agreements. Amortization expense of deferred financing costs in fiscal 2017, 2016 and 2015 was $487,000, $328,000 and $166,000, respectively. In connection with its current credit facility amended effective February 1, 2018, and its term loan entered into on February 1, 2018 the Company incurred approximately $3,406,000 in new costs that were paid in fiscal 2017 and are being deferred and amortized in future periods, and $1,542,000 of previously deferred financing costs were written off and recorded as loss on extinguishment of debt in the Company’s consolidated statements of operations (see Notes 8 and 9).
Estimated amortization expense of the Company’s deferred financing costs during future fiscal years ending on the Saturday nearest January 31 of each year is as follows (in thousands):
|
Fiscal Year |
|
|
|
|
2018 |
$ |
658 |
|
|
2019 |
|
634 |
|
|
2020 |
|
632 |
|
|
2021 |
|
582 |
|
|
2022 |
|
582 |
|
|
|
i. |
Deferred Rent |
Rent expense on operating leases, including rent holidays and scheduled rent increases, is recorded on a straight-line basis over the term of the lease commencing on the date the Company takes possession of the leased property, which for stores is generally four to six weeks prior to a store’s opening date. The net excess of rent expense over the actual cash paid has been recorded as a deferred rent liability in the accompanying consolidated balance sheets. Tenant improvement allowances received from landlords are also included in the accompanying consolidated balance sheets as deferred rent liabilities and are amortized as a reduction of rent expense over the term of the lease from the possession date.
F-9
DESTINATION MATERNITY CORPORATION AND SUBSIDIARIES
NOTES TO CONSOLIDATED FINANCIAL STATEMENTS (Continued)
Shares repurchased are retired and treated as authorized but unissued shares, with the cost in excess of par value of the reacquired shares charged to additional paid-in capital and the par value charged to common stock.
|
|
k. |
Fair Value of Financial Instruments |
The carrying values of cash and cash equivalents, trade receivables and accounts payable approximate fair value due to the short-term nature of those instruments. The majority of the Company’s long-term debt bore interest at variable rates, which adjusted based on market conditions, and the carrying value of the long-term debt approximated fair value. The fair value of the Company’s debt was determined using a discounted cash flow analysis based on interest rates available to the Company.
|
|
l. |
Revenue Recognition, Sales Returns and Allowances |
Revenue is recognized at the point of sale for retail store sales, including leased department sales, or when merchandise is delivered to customers for licensed brand product and Internet sales, and when merchandise is shipped to international franchisees. Leased department revenue is remitted to the Company, less a fixed percentage of the net sales earned by the lease partner (as stipulated in each agreement), which is considered a store expense and included in selling, general and administrative expenses (see Note 2p). A liability is established for the retail value of gift cards sold and merchandise credits issued. The liability is relieved and revenue is recognized over the period of, and in proportion to, the actual redemptions of gift cards based on the Company’s historical breakage. Allowances for returns are recorded as a reduction of revenue, based on the Company’s historical experience. Revenues are recorded net of applicable sales taxes.
|
|
m. |
Other Revenues |
Included in net sales are revenues earned by the Company through a variety of marketing partnership programs utilizing the Company’s opt-in customer database and various in-store marketing initiatives, focused on baby and parent-related products and services. Revenue from marketing partnership programs is recognized when goods or services are provided. Also included in net sales are fees and royalties related to international franchise agreements. International franchise fees are earned by the Company when all material services or conditions related to the international franchise agreement have been substantially performed or satisfied and royalties are earned based on net sales of the Company’s international franchisees and may include minimum guaranteed royalties.
|
|
n. |
Cost of Goods Sold |
Cost of goods sold in the accompanying consolidated statements of operations includes merchandise costs (including customs duty expenses), expenses related to inventory shrinkage, product-related corporate expenses (including expenses related to payroll, benefit costs and operating expenses of the Company’s design and sourcing departments), inventory reserves (including lower of cost and net realizable value), inbound freight charges, purchasing and receiving costs, inspection costs, distribution center costs (including occupancy expenses and equipment depreciation), internal transfer costs, and the other costs of the Company’s distribution network, partially offset by the allocable amount of the Company’s Grow NJ benefit (see Notes 2q and 14).
|
|
o. |
Shipping and Handling Fees and Costs |
The Company includes shipping and handling revenue earned from its Internet activities in net sales. Shipping and handling costs, which are included in cost of goods sold in the accompanying consolidated statements of operations, include shipping supplies, related labor costs and third-party shipping costs.
|
|
p. |
Selling, General and Administrative Expenses |
Selling, general and administrative expenses in the accompanying consolidated statements of operations include advertising and marketing expenses, corporate administrative expenses, corporate headquarters occupancy expenses, store expenses (including store payroll and store occupancy expenses), and store opening expenses, partially offset by the allocable amount of the Company’s Grow NJ benefit (see Notes 2q and 14).
F-10
DESTINATION MATERNITY CORPORATION AND SUBSIDIARIES
NOTES TO CONSOLIDATED FINANCIAL STATEMENTS (Continued)
The Company recognizes the estimated benefit from its Grow NJ award (see Note 14) as a reduction to distribution center and corporate headquarters costs that result from the relocation of these facilities to New Jersey (primarily occupancy expenses and equipment depreciation). The Grow NJ award benefit is recognized ratably over the ten-year life of the award and provides the Company with transferrable income tax credits. When recognized such income tax credits are included in the consolidated balance sheets as deferred income tax assets, net of a valuation allowance, and net of federal and state income tax effect, to reflect the expected amount to be realized from subsequent sales of the income tax credits.
|
|
r. |
Advertising Costs |
The Company expenses the costs of advertising when the advertising first occurs. Advertising expenses, including Internet advertising expenses, were $15,563,000, $12,869,000 and $15,877,000 in fiscal 2017, 2016 and 2015, respectively.
|
|
s. |
Stock-based Compensation |
The Company recognizes employee stock-based compensation as a cost in the accompanying consolidated statements of operations. Stock-based awards are measured at the grant date fair value and the compensation expense is recorded generally on a straight-line basis over the vesting period, net of estimated forfeitures. Excess tax benefits related to stock option exercises and restricted stock vesting are recognized as income tax expense or benefit in the consolidated statements of operations.
|
|
t. |
Store Closing, Asset Impairment and Asset Disposal Expenses (Income) |
Store closing expenses include lease termination fees, gains or losses on disposal of closed store assets and recognition of unamortized deferred rent. Asset impairment expenses represent losses recognized to reduce the carrying value of impaired long-lived assets. Asset disposal expenses represent gains or losses on disposal of assets other than in connection with store closings, including assets disposed from remodeling or relocation of stores.
|
|
u. |
Income Taxes |
The Company utilizes the asset and liability method of accounting for income taxes. Under this method, deferred tax assets and liabilities are recognized for the expected future tax consequences of temporary differences between the carrying amounts and the tax bases of assets and liabilities as well as from net operating loss and tax credit carryforwards. The effect on deferred tax assets and liabilities of a change in tax rates is recognized in operations in the period that includes the enactment date. On a quarterly basis the Company evaluates the realizability of its deferred tax assets. The evaluation includes the consideration of all available evidence, both positive and negative, regarding historical operating results including recent years with reported losses, the estimated timing of future reversals of existing taxable temporary differences, estimated future taxable income exclusive of reversing temporary differences and carryforwards, and potential tax planning strategies which may be employed to prevent an operating loss or tax credit carryforward from expiring unused. In situations where a three-year cumulative loss condition exists, accounting standards limit the ability to consider projections of future results as positive evidence to assess the realizability of deferred tax assets. A valuation allowance is established when it is estimated that it is more likely than not that the tax benefit of a deferred tax asset will not be realized.
Under the accounting standard for uncertain income tax positions, recognition of a tax benefit occurs when a tax position is estimated by management to be more likely than not to be sustained upon examination, based solely on its technical merits. Derecognition of a previously recognized tax position would occur if it is subsequently determined that the tax position no longer meets the more-likely-than-not threshold of being sustained. Recognized tax positions are measured at the largest amount that management believes has a greater than 50% likelihood of being finalized. The Company records interest and penalties related to unrecognized tax benefits in income tax provision.
|
|
v. |
Net Loss per Share and Cash Dividends |
Basic net income (loss) (or earnings) per share (“Basic EPS”) is computed by dividing net income (loss) by the weighted average number of common shares outstanding, excluding restricted stock awards for which the restrictions have not lapsed. Diluted net income (loss) (or earnings) per share (“Diluted EPS”) is computed by dividing net income (loss) by the weighted average number of common shares outstanding, after giving effect to the potential dilution, if applicable, from the assumed lapse of restrictions on restricted stock awards and exercise of stock options into shares of common stock as if those stock options were exercised. Common shares issuable in connection with the award of performance-based restricted stock units (“RSUs”) are excluded from the calculation of EPS until the RSUs’ performance conditions are achieved and the shares in respect of the RSUs become issuable (see Note 12).
F-11
DESTINATION MATERNITY CORPORATION AND SUBSIDIARIES
NOTES TO CONSOLIDATED FINANCIAL STATEMENTS (Continued)
The following table summarizes those effects for the Basic EPS and Diluted EPS calculations (in thousands, except per share amounts):
|
|
Year Ended |
|
|||||||||
|
|
February 3, 2018 |
|
|
January 28, 2017 |
|
|
January 30, 2016 |
|
|||
|
Net loss |
$ |
(21,597 |
) |
|
$ |
(32,760 |
) |
|
$ |
(4,483 |
) |
|
Net loss per share—Basic |
$ |
(1.57 |
) |
|
$ |
(2.39 |
) |
|
$ |
(0.33 |
) |
|
Net loss per share—Diluted |
$ |
(1.57 |
) |
|
|
(2.39 |
) |
|
$ |
(0.33 |
) |
|
Average number of shares outstanding—Basic |
|
13,788 |
|
|
|
13,702 |
|
|
|
13,596 |
|
|
Incremental shares from the assumed exercise of outstanding stock options |
|
— |
|
|
|
— |
|
|
|
— |
|
|
Incremental shares from the assumed lapse of restrictions on restricted stock awards |
|
— |
|
|
|
— |
|
|
|
— |
|
|
Average number of shares outstanding—Diluted |
|
13,788 |
|
|
|
13,702 |
|
|
|
13,596 |
|
Options and unvested restricted stock totaling approximately 1,398,000, 1,232,000 and 901,000 shares of the Company's common stock were outstanding as February 3, 2018, January 28, 2017 and January 30, 2016 respectively, but were not included in the computation of Diluted EPS for fiscal 2017, 2016 or 2015 due to the Company's net loss. Had the Company reported a profit for fiscal 2017, 2016 and 2015 the weighted average number of dilutive shares outstanding for computation of Diluted EPS would have been approximately 13,806,000, 13,720,000 and 13,624,000 shares, respectively.
During fiscal 2015 the Company paid cash dividends totaling $11,026,000 ($0.80 per share) In connection with a debt refinancing in March 2016 the Company suspended its quarterly dividend and accordingly no cash dividends were paid by the Company during fiscal 2017 or 2016 (see Note 9). During fiscal 2017 and 2016 $16,000 and $18,000, respectively, of previously declared and undistributed dividends, for which payment was subject to completion of service requirements under restricted stock awards, were forfeited back to the Company in connection with the cancellation of the awards.
|
|
w. |
Statements of Cash Flows |
In fiscal 2017, 2016 and 2015 the Company paid interest of $3,734,000, $3,063,000, $1,404,000, respectively, and made income tax payments, net of refunds, of $(4,141,000), $(324,000), $(5,347,000), respectively.
|
|
x. |
Business and Credit Risk |
Financial instruments, primarily cash and cash equivalents and trade receivables, potentially subject the Company to concentrations of credit risk. The Company limits its credit risk associated with cash and cash equivalents by placing such investments in highly liquid funds and instruments. Trade receivables associated with third-party credit cards are processed by financial institutions, which are monitored for financial stability. Trade receivables associated with licensed brand, leased department, international franchise and other relationships are evaluated for collectability based on a combination of factors, including aging of trade receivables, write-off experience and past payment trends. The Company is dependent on key suppliers to provide sufficient quantities of inventory at competitive prices. No single supplier represented 20% or more of net purchases in fiscal 2017, 2016 or 2015. A significant majority of the Company’s purchases during fiscal 2017, 2016 and 2015 were imported. Management believes that any event causing a disruption of imports from any specific country could be mitigated by moving production to readily available alternative sources.
|
|
y. |
Insurance |
The Company is self-insured for workers’ compensation, general liability and automotive liability claims, and employee-related healthcare claims, up to certain stop-loss limits. Such costs are accrued based on known claims and an estimate of incurred but not reported claims. Liabilities associated with these risks are estimated by considering historical claims experience and other actuarial assumptions.
F-12
DESTINATION MATERNITY CORPORATION AND SUBSIDIARIES
NOTES TO CONSOLIDATED FINANCIAL STATEMENTS (Continued)
Non-capital expenditures, such as payroll costs incurred prior to the opening of a new store, are charged to expense in the period in which they were incurred.
|
|
aa. |
Newly Adopted Accounting Pronouncements |
In March 2016 the Financial Accounting Standards Board (“FASB”) issued Accounting Standards Update (“ASU”) No. 2016-09, Compensation - Stock Compensation (Topic 718): Improvements to Employee Share-Based Payment Accounting. ASU No. 2016-09 affects all entities that issue share-based payment awards to their employees. ASU No. 2016-09 simplifies several aspects of the accounting for share-based payment transactions, including the income tax consequences, classification of awards as either equity or liabilities, and classification on the statement of cash flows, including recognizing all excess tax benefits and tax deficiencies as income tax expense or benefit in the income statement rather than in additional paid-in capital. The Company adopted ASU No. 2016-09 effective January 29, 2017 and the adoption did not have a material impact on the Company’s consolidated financial position, results of operations or cash flows.
In November 2015 the FASB issued ASU No. 2015-17, Income Taxes (Topic 740): Balance Sheet Classification of Deferred Taxes. To simplify the presentation of deferred income taxes, ASU No. 2015-17 requires that deferred tax liabilities and assets be classified as noncurrent in a classified statement of financial position. The Company adopted ASU No. 2015-17 effective January 29, 2017 and applied the required reclassifications on a retrospective basis. Accordingly, in the consolidated balance sheet as of January 28, 2017, $3,251,000 of deferred tax assets were reclassified from current assets to other assets. The adoption of ASU No. 2015-17 did not have any impact on the Company’s net consolidated financial position, results of operations or cash flows.
In July 2015 the FASB issued ASU No. 2015-11, Inventory (Topic 330): Simplifying the Measurement of Inventory. ASU No. 2015-11 changes the measurement principle for inventory from the lower of cost or market to the lower of cost and net realizable value. The Company adopted ASU No. 2015-11 effective January 29, 2017 and the adoption did not have a material impact on the Company’s consolidated financial position, results of operations or cash flows.
|
|
bb. |
Recent Accounting Pronouncements – Not Yet Adopted |
In May 2017 the FASB issued ASU No. 2017-09, Compensation - Stock Compensation (Topic 718): Scope of Modification Accounting. ASU No. 2017-09 provides guidance about which changes to the terms or conditions of a share-based payment award require an entity to apply modification accounting in Topic 718. ASU No. 2017-09 is effective for financial statements issued for annual reporting periods beginning after December 15, 2017 and interim periods within those years. Earlier application is permitted. The impact from adoption of the new requirements of ASU No. 2017-09 on the Company’s consolidated financial position or results of operations has not yet been determined.
In October 2016 the FASB issued ASU No. 2016-16, Income Taxes (Topic 740): Intra-Entity Transfers of Assets Other Than Inventory. ASU No. 2016-16 amends the accounting for income taxes and requires the recognition of the income tax consequences of an intercompany asset transfer, other than transfers of inventory, when the transfer occurs. For intercompany transfers of inventory, the income tax effects will continue to be deferred until the inventory has been sold to a third party. ASU No. 2016-16 is effective for financial statements issued for annual reporting periods beginning after December 15, 2017 and interim periods within those years, using a modified retrospective application method through a cumulative-effect adjustment directly to retained earnings as of the beginning of the period of adoption. Earlier application is permitted. The impact from adoption of the new requirements of ASU No. 2016-16 on the Company’s consolidated financial position or results of operations has not yet been determined.
In August 2016 the FASB issued ASU No. 2016-15, Statement of Cash Flows (Topic 230): Classification of Certain Cash Receipts and Cash Payments. ASU No. 2016-15 clarifies and provides guidance on eight specific cash flow classification issues and is intended to reduce existing diversity in practice in how certain cash receipts and cash payments are presented and classified in the statement of cash flows. ASU No. 2016-15 is effective for annual reporting periods beginning after December 15, 2017 and interim periods within those years. Earlier application is permitted, provided that all of the amendments are adopted in the same period. The adoption of the new requirements of ASU No. 2016-15 will not have any impact on the Company’s net consolidated financial position or results of operations.
F-13
DESTINATION MATERNITY CORPORATION AND SUBSIDIARIES
NOTES TO CONSOLIDATED FINANCIAL STATEMENTS (Continued)
In February 2016 the FASB issued ASU No. 2016-02, Leases (Topic 842). ASU No. 2016-02 affects any entity that enters into a lease (as that term is defined in the ASU) and its guidance supersedes Topic 840, Leases. As it substantively relates to the Company, ASU No. 2016-02 requires lessees to recognize a right-of-use asset and a lease liability, initially measured at the present value of the lease payments, in the statement of financial position. For finance leases, lessees are required to recognize interest on the lease liability separately from amortization of the right-of-use asset in the statement of comprehensive income and to classify repayments of the principal portion of the lease liability within financing activities and payments of interest on the lease liability and variable lease payments within operating activities in the statement of cash flows. For operating leases, lessees are required to recognize a single lease cost, calculated so that the cost of the lease is allocated over the lease term on a generally straight-line basis, and to classify all cash payments within operating activities in the statement of cash flows. In transition, lessees are required to recognize and measure leases at the beginning of the earliest period presented using a modified retrospective approach. ASU No. 2016-02 is effective for financial statements issued for annual reporting periods beginning after December 15, 2018 and interim periods within those years. Earlier application is permitted. While the Company is still evaluating this standard, given the significant number of leases the Company is party to, the Company expects this standard will have a material impact on the Company's consolidated financial statements.
In May 2014 the FASB issued ASU No. 2014-09, Revenue from Contracts with Customers (Topic 606). ASU No. 2014-09 requires an entity to recognize revenue for the amount of consideration to which it expects to be entitled for the transfer of promised goods or services to customers. Additionally, ASU No. 2014-09 requires improved disclosures to help users of financial statements better understand the nature, amount, timing, and uncertainty of revenue that is recognized. The standard will replace most existing revenue recognition guidance in GAAP when it becomes effective. ASU No. 2014-09 is effective for financial statements issued for annual reporting periods beginning after December 15, 2016 and interim periods within those years. In August 2015 the FASB issued ASU No. 2015-14, Revenue from Contracts with Customers (Topic 606): Deferral of the Effective Date which deferred the effective date of ASU No. 2014-09 by one year, making the guidance effective for fiscal years beginning after December 15, 2017. Early adoption will be permitted, but not earlier than the original effective date for annual and interim periods. We will adopt the new guidance beginning with the first quarter of fiscal 2018 as a cumulative effect adjustment as of the date of adoption. While we are in the process of finalizing our analysis, we do not expect that the adoption will have a material impact on our consolidated financial position or results of operations.
|
|
cc. |
Change in Accounting Principle |
The Company sells gift cards to its customers in its retail stores, through its websites and through select third parties. The portion of gift cards sold to customers which are never redeemed is commonly referred to as gift card breakage. Prior to fiscal 2017 the Company recognized revenue from gift card breakage after it determined that any legal obligation to report and remit the value associated with abandoned property had been satisfied. The Company has accumulated a significant amount of historical data from its past gift card transactions, allowing it to reasonably and objectively determine the pattern of gift card redemptions and a related estimated gift card breakage rate. In the first quarter of fiscal 2017 the Company elected to record revenue from gift card breakage over the period of, and in proportion to, the actual redemptions of gift cards based on the Company’s historical breakage. The Company believes this method is preferable as it better reflects the gift card earnings process resulting in the recognition of gift card breakage income over the period of gift card redemptions (i.e., over the performance period).
The Company determined that this accounting change represented a change in accounting estimate effected by a change in accounting principle. In accordance with the requirements of ASC Topic 250 related to such accounting changes, during the first quarter of fiscal 2017 the Company recognized $0.8 million of revenue as a cumulative adjustment for the accounting change.
|
3. |
TRADE RECEIVABLES |
Trade receivables are recorded based on revenue recognized for sales of the Company’s merchandise and for other revenue earned by the Company through its marketing partnership programs and international franchise agreements, and are non-interest bearing. The Company evaluates the collectability of trade receivables based on a combination of factors, including aging of trade receivables, write-off experience, analysis of historical trends and expectations of future performance. An allowance for doubtful accounts is recorded for the amount of trade receivables that are considered unlikely to be collected. When the Company’s collection efforts are unsuccessful, uncollectible trade receivables are charged against the allowance for doubtful accounts. As of February 3, 2018 and January 28, 2017 the Company’s trade receivables were net of allowance for doubtful accounts of $166,000 and $163,000, respectively.
F-14
DESTINATION MATERNITY CORPORATION AND SUBSIDIARIES
NOTES TO CONSOLIDATED FINANCIAL STATEMENTS (Continued)
Inventories as of February 3, 2018 and January 28, 2017 were comprised of the following (in thousands):
|
|
February 3, 2018 |
|
|
January 28, 2017 |
|
||
|
Finished goods |
$ |
70,687 |
|
|
$ |
68,346 |
|
|
Work-in-progress |
|
182 |
|
|
|
212 |
|
|
Raw materials |
|
387 |
|
|
|
482 |
|
|
|
$ |
71,256 |
|
|
$ |
69,040 |
|
|
5. |
PROPERTY AND EQUIPMENT, NET |
Property and equipment as of February 3, 2018 and January 28, 2017 was comprised of the following (in thousands):
|
|
February 3, 2018 |
|
|
January 28, 2017 |
|
||
|
Furniture and equipment |
$ |
75,140 |
|
|
$ |
73,904 |
|
|
Leasehold improvements |
|
89,030 |
|
|
|
103,198 |
|
|
Construction in progress |
|
— |
|
|
|
3,388 |
|
|
|
|
164,170 |
|
|
|
180,490 |
|
|
Less: accumulated depreciation and amortization |
|
(98,024 |
) |
|
|
(97,461 |
) |
|
|
$ |
66,146 |
|
|
$ |
83,029 |
|
Aggregate depreciation and amortization expense of property and equipment in fiscal 2017, 2016 and 2015 was $17,466,000, $17,890,000, $17,109,000, respectively. During fiscal 2017, 2016 and 2015 the Company recorded pretax charges of $5,743,000, $2,382,000, $1,659,000, respectively, related to the impairment of leasehold improvements and furniture and equipment at certain of its retail locations.
|
6. |
ACCRUED EXPENSES AND OTHER CURRENT LIABILITIES |
As of February 3, 2018 and January 28, 2017 accrued expenses and other current liabilities were comprised of the following (in thousands):
|
|
February 3, 2018 |
|
|
January 28, 2017 |
|
||
|
Employee compensation and benefits |
$ |
7,133 |
|
|
$ |
6,754 |
|
|
Insurance, primarily self-insurance reserves |
|
5,048 |
|
|
|
5,421 |
|
|
Gift certificates and store credits |
|
3,385 |
|
|
|
4,305 |
|
|
Deferred rent |
|
3,211 |
|
|
|
3,507 |
|
|
Sales and use taxes |
|
2,638 |
|
|
|
2,591 |
|
|
Product return reserve |
|
2,799 |
|
|
|
1,615 |
|
|
Accounting and legal |
|
714 |
|
|
|
1,276 |
|
|
Accrued property, plant and equipment additions |
|
218 |
|
|
|
316 |
|
|
Income taxes payable |
|
— |
|
|
|
12 |
|
|
Other |
|
6,515 |
|
|
|
5,562 |
|
|
|
$ |
31,661 |
|
|
$ |
31,359 |
|
F-15
DESTINATION MATERNITY CORPORATION AND SUBSIDIARIES
NOTES TO CONSOLIDATED FINANCIAL STATEMENTS (Continued)
As of February 3, 2018 and January 28, 2017 deferred rent and other non-current liabilities were comprised of the following (in thousands):
|
|
|
February 3, 2018 |
|
|
January 28, 2017 |
|
||
|
Deferred rent |
|
$ |
25,407 |
|
|
$ |
25,398 |
|
|
Less: current portion included in accrued expenses and other current liabilities |
|
|
(3,211 |
) |
|
|
(3,507 |
) |
|
Non-current deferred rent |
|
|
22,196 |
|
|
|
21,891 |
|
|
Accrued income taxes |
|
|
380 |
|
|
|
752 |
|
|
Other |
|
|
139 |
|
|
|
146 |
|
|
|
|
$ |
22,715 |
|
|
$ |
22,789 |
|
|
8. |
LINE OF CREDIT |
After completion of a debt refinancing on February 1, 2018 the Company has a $50,000,000 senior secured revolving credit facility (the “Credit Facility”), which was amended and restated in connection with the issuance of the Company’s $25,000,000 Term Loan (see Note 9). The previous $70,000,000 Credit Facility had been in place since March 25, 2016. In connection with the Term Loan financing the maturity date of the Credit Facility was extended to January 31, 2023 and certain availability reserves were reduced or eliminated. Proceeds from advances under the Credit Facility with certain restrictions may be used to provide financing for working capital, letters of credit, capital expenditures, and other general corporate purposes.
The Credit Facility contains various affirmative and negative covenants and representations and warranties including the requirement that the Company maintain Excess Availability (as defined in the related Credit Agreement) of more than the greater of 10% of the Combined Loan Caps (as defined in the related Credit Agreement) and $7,000,000. In the event that the outstanding balance of the Term Loan exceeds the Term Loan Borrowing Base (as defined in the related Term Loan Agreement) then a reserve will be imposed against availability under the Credit Facility. The Credit Facility is secured by a security interest in the Company’s trade receivables, inventory, letter of credit rights, cash, intangibles and certain other assets. The interest rate on outstanding borrowings is equal to, at the Company’s election, either 1) the lender’s base rate plus 0.50% or 2) a LIBOR rate plus 1.0%. The Company also pays an unused line fee under the Credit Facility of 0.25% per annum.
Any amounts outstanding under the Credit Facility may be accelerated and become due and payable immediately and all loan and letter of credit commitments thereunder may be terminated upon an event of default and expiration of any applicable cure period. Events of default include: 1) nonpayment of obligations due under the subject loan agreement and related loan documents, 2) cross-defaults to other indebtedness and documents, 3) failure to perform any covenant or agreement contained in the subject loan agreement, 4) material misrepresentations, 5) failure to pay, or certain other defaults under, other material indebtedness of the Company, 6) certain bankruptcy or insolvency events, 7) a change of control, 8) indictments of the Company or senior management in a material forfeiture action, 9) default under certain material contracts to the extent such termination or default has or could reasonably be expected to have a material adverse effect, and 9) customary ERISA defaults, among others.
In connection with the original execution and subsequent amendments of the Credit Facility, the Company incurred deferred financing costs of $1,280,000 including $107,000 paid in fiscal 2017. These deferred financing costs are being amortized over the term of the Credit Facility agreement and included in “interest expense, net” in the consolidated statements of operations.
As of February 3, 2018 the Company had $8,000,000 in outstanding borrowings under the Credit Facility, $7,327,000 in letters of credit and $26,848,000 of availability based on the Company’s Borrowing Base formula and availability reserve requirements. As of January 28, 2017 the Company had $4,600,000 in outstanding borrowings under the Credit Facility, $5,827,000 in letters of credit and $19,374,000 of availability. For fiscal 2017, 2016 and 2015 borrowings had a weighted interest rate of 3.65%, 2.84%, 3.05% per annum, respectively. During fiscal 2017, 2016 and 2015 the Company’s average level of direct borrowings was $9,454,000, $11,191,000 and $26,835,000, respectively, and the Company’s maximum borrowings during fiscal 2017, 2016 and 2015 were $17,100,000, $42,700,000, $40,900,000, respectively.
F-16
DESTINATION MATERNITY CORPORATION AND SUBSIDIARIES
NOTES TO CONSOLIDATED FINANCIAL STATEMENTS (Continued)
On February 1, 2018 (the “Closing Date”) the Company entered into a Term Loan Credit Agreement (the “Term Loan Agreement”) which provides for a term loan of up to $25,000,000 which matures on January 31, 2023 (the “Term Loan”). On the Closing Date the Company borrowed $22,500,000 net of fees against the Term Loan and used the proceeds, in addition to $3,600,000 borrowed under our Credit Facility (see Note 8) to pay off the $22,999,000 balance of our then existing term loan (the “Prior Term Loan”) and $3,226,000 of fees and interest associated with the transaction. The Term Loan provides for an additional loan of $2,500,000 which can be borrowed at the Company’s discretion within a period of 45 days after delivery to the lender of our first quarter fiscal 2018 financial statements and satisfaction of certain other requirements. There is a minimum excess availability requirement of the greater of 10% of the combined loan cap, as defined in the Term Loan Agreement, or $7,000,000.
The interest rate on the Term Loan is equal to a LIBOR rate plus 9.0%. The Company is required to make minimum repayments of the principal amount of the Term Loan in quarterly installments of $312,500 each quarter commencing on July 31, 2018, with the remaining outstanding balance payable on the maturity date. Additionally, the Term Loan can be prepaid at the Company's option subject to certain restrictions and subject to a prepayment premium as follows: 1) if the prepayment occurs on or prior to the second anniversary of the Closing Date, the greater of a) interest on the prepayment that would otherwise have been paid with the 24 month period following the Closing Date minus actual interest payments made through the prepayment date and b) 2% of the prepayment and 2) 2% of the prepayment amount if paid between the second and third anniversary of the Closing Date.
The Term Loan is secured by a security interest in substantially all of the assets of the Company, including accounts receivable, inventory, equipment, letter of credit rights, cash, intellectual property and other intangibles, and certain other assets. The security interest granted to the Term Lenders is, in certain respects, subordinate to the security interest granted to the Credit Facility Lender. The Term Loan Agreement prohibits the payment of dividends or share repurchases by the Company for three years and imposes certain restrictions on the Company's ability to, among other things, incur additional indebtedness and enter into other various types of transactions.
On March 25, 2016 the Company entered into a Term Loan Agreement Credit Agreement (the “Prior Term Loan Agreement”) for the $32,000,000 Prior Term Loan that had a maturity date of March 25, 2021. The proceeds were used to repay a portion of the indebtedness that was outstanding under our credit facility at that time. The interest rate on the Prior Term Loan was equal to a LIBOR rate (with a 1.0% LIBOR floor) plus 7.5%. We were required to make minimum repayments of the principal amount in quarterly installments of $800,000 with the remaining outstanding balance payable on the maturity date. As amended on December 19, 2016 and April 7, 2017, the Prior Term Loan Agreement contained various minimum excess availability requirements including $5,000,000 against availability under our Credit Facility that was reduced dollar for dollar for prepayments of the Prior Term Loan, and an amount equal to the greater of 10% of the Combined Loan Cap (as defined in the Credit Facility Agreement) or $10,000,000.
In connection with the execution of the Term Loan Agreement, the Prior Term Loan Agreement and subsequent amendments, the Company incurred deferred financing costs of $4,557,000. Of this amount, the unamortized balance of $1,542,000 in deferred financing costs incurred in connection with the Prior Term Loan were written off upon entering into the Term Loan and charged to loss on extinguishment of debt in our consolidated statements of operations. There were $2,460,000 of deferred financing costs incurred in connection with the Term Loan. These deferred financing costs are reflected as a direct deduction from the Term Loan liability in the consolidated balance sheets and are being amortized over the term of the Term Loan Agreement. The amortization is included in “interest expense, net” in the consolidated statements of operations.
As of February 3, 2018 and January 28, 2017 there was $22,500,000 and $30,400,000, respectively, of principal outstanding under the Term Loan and Prior Term Loan.
As of February 3, 2018 and January 31, 2017 there was $6,051,000 and $9,302,000, respectively, outstanding under a five-year equipment financing arrangement with the Company’s Credit Facility bank. The equipment note bears annual interest at 3.38%, with payments of $272,000 (including interest) due monthly through December 2019. The equipment note is collateralized by substantially all of the material handling equipment at the Company’s distribution facility in Florence, New Jersey (see Note 5). Any amounts outstanding under the equipment note may be accelerated and become due and payable immediately upon an event of default and expiration of any applicable cure period. The specified events of default are substantially the same as those in the Credit Facility agreement (see Note 8).
F-17
DESTINATION MATERNITY CORPORATION AND SUBSIDIARIES
NOTES TO CONSOLIDATED FINANCIAL STATEMENTS (Continued)
On June 6, 2017 the Company received $3,401,000 in proceeds from a three-year financing arrangement in the form of a sale and leaseback for certain furniture, fixtures and software. Monthly payments are $123,000 for the first 24 months and $48,000 for months 25 to 36. At the end of the leaseback term, the Company has the option to extend the financing arrangement for an additional year or to repurchase the financed property for a price to be agreed upon. All of the proceeds from the transaction were used to prepay a portion of the Company’s Prior Term Loam. As of February 3, 2018 there was $2,670,000 of principal outstanding under this financing arrangement.
Future maturities of long-term debt are as follows (in thousands):
|
Fiscal Year |
|
|
|
|
2018 |
$ |
5,247 |
|
|
2019 |
|
4,898 |
|
|
2020 |
|
2,013 |
|
|
2021 |
|
1,250 |
|
|
2022 |
|
17,813 |
|
|
|
$ |
31,221 |
|
|
10. |
FAIR VALUE MEASUREMENTS |
The accounting standard for fair value measurements defines fair value as the price that would be received to sell an asset or paid to transfer a liability in an orderly transaction between market participants at the measurement date. The standard establishes a framework for measuring fair value focused on exit price and creates a fair value hierarchy in order to increase the consistency and comparability of fair value measurements as follows:
|
|
• |
Level 1 – Quoted market prices in active markets for identical assets or liabilities |
|
|
• |
Level 2 – Observable market-based inputs or inputs that are corroborated by observable market data |
|
|
• |
Level 3 – Unobservable inputs that are not corroborated by market data |
At both February 3, 2018 and January 28, 2017 the Company had cash equivalents of $4,000. The Company’s cash equivalents consist of investments in money market funds for which the carrying value approximates fair value (based on Level 1 inputs) due to the short-term nature of those instruments. The carrying values of trade receivables and accounts payable approximate fair value due to the short-term nature of those instruments.
The Company’s Credit Facility has variable interest rates that are tied to market indices. As of February 3, 2018 and January 28, 2017 the Company had $8,000,000 and $4,600,000, respectively, of direct borrowings outstanding under the Credit Facility. The carrying value of the Company’s Credit Facility borrowings approximates fair value as the variable interest rates approximate current market rates, which the Company considers to be Level 2 inputs.
The Company’s Term Loan, which represents a significant majority of the Company’s long-term debt, bears interest at variable rates, which adjust based on market conditions with a minimum annual rate of 9.0%. The carrying value of the Company’s Term Loan approximates fair value as the variable interest rates approximate current market rates for similar instruments available to companies with comparable credit quality, which the Company considers to be Level 2 inputs. The fair value of the Company’s fixed-rate equipment note was determined using a discounted cash flow analysis based on interest rates currently available to the Company, which the Company considers to be Level 2 inputs. The difference between the carrying value and fair value of long-term debt held by the Company with a fixed rate of interest is not material.
The fair value accounting standards provide a company with the option to report selected financial assets and liabilities on an instrument-by-instrument basis at fair value and requires such company to display the fair value of those assets and liabilities for which the company has chosen to use fair value on the face of the balance sheet. The Company has not elected the fair value option for its financial assets and liabilities that had not been previously measured at fair value.
F-18
DESTINATION MATERNITY CORPORATION AND SUBSIDIARIES
NOTES TO CONSOLIDATED FINANCIAL STATEMENTS (Continued)
The Company’s Board of Directors previously approved a program to repurchase up to $10,000,000 of the Company’s outstanding common stock that expired as of July 31, 2016. Under the program, the Company was authorized to repurchase shares from time to time through solicited or unsolicited transactions in the open market or in negotiated or other transactions. No shares were repurchased under this program. The Term Loan Agreement, effective February 1, 2018, prohibits the payment of dividends or share repurchases by the Company for three years.
The Company has authorization to issue up to 1,656,381 shares of preferred stock, par value $0.01, with 300,000 shares authorized for Series B Junior Participating Preferred Stock. There was no preferred stock issued or outstanding as of February 3, 2018 and January 28, 2017.
|
12. |
EQUITY AWARD PLANS |
In January 2006 the stockholders of the Company approved the adoption of the Amended and Restated 2005 Equity Incentive Plan (the “2005 Plan”) and, subsequently, have approved amendments to increase the number of issuable shares. Under the 2005 Plan, employees, directors, consultants and other individuals who provide services to the Company may be granted awards in the form of stock options, stock appreciation rights, restricted stock, restricted stock units or deferred stock units. Up to 3,550,000 shares of the Company’s common stock may be issued in respect of awards under the 2005 Plan, as amended, with no more than 2,250,000 of those shares permitted to be issued in respect of restricted stock, restricted stock units, or deferred stock units granted under the 2005 Plan. Awards of stock options to purchase the Company’s common stock will have exercise prices as determined by the Compensation Committee of the Board of Directors (the “Compensation Committee”), but such exercise prices may not be lower than the fair market value of the stock on the date of grant.
No stock options have been granted by the Company with an exercise price less than the fair market value of the Company’s common stock on the date of grant for any of the periods presented. The majority of the stock options issued under the 2005 Plan vest ratably over four-year periods and stock options issued under the 2005 Plan generally expire ten years from the date of grant. Restricted stock awards issued under the 2005 Plan generally have restrictions that lapse ratably over periods ranging from one to four years, however, up to 177,500 restricted stock awards may be issued with a vesting period of less than one year. The non-executive chairman of the Company’s Board of Directors is granted 6,000 shares of restricted stock and each non-employee director, other than the non-executive chairman, of the Company’s Board of Directors is granted 4,000 shares of restricted stock on an annual basis that will vest one year from the date of grant. The Company issues new shares of common stock upon exercise of vested stock options. As of February 3, 2017 there were 785,703 shares of the Company’s common stock available for grant under the 2005 Plan in the form of stock options, restricted stock, restricted stock units or deferred stock units.
Stock option activity for all plans was as follows:
|
|
Outstanding |
|
Weighted |
|
Weighted |
|
Aggregate |
||||||||
|
|
(in thousands) |
|
|
|
|
(years) |
|
(in thousands) |
|||||||
|
Balance—January 28, 2017 |
|
955 |
|
|
$ |
11.68 |
|
|
|
|
|
|
|
|
|
|
Granted |
|
— |
|
|
|
|
|
|
|
|
|
|
|
|
|
|
Exercised |
|
— |
|
|
|
|
|
|
|
|
|
|
|
|
|
|
Forfeited |
|
411 |
|
|
|
12.25 |
|
|
|
|
|
|
|
|
|
|
Expired |
|
— |
|
|
|
|
|
|
|
|
|
|
|
|
|
|
Balance—February 3, 2018 |
|
544 |
|
|
$ |
11.26 |
|
|
|
7.3 |
|
|
$ |
|
— |
|
Exercisable— February 3, 2018 |
|
273 |
|
|
$ |
13.94 |
|
|
|
6.6 |
|
|
$ |
|
— |
During fiscal 2017 there were no stock options exercised. During fiscal 2016 and 2015 the total intrinsic value of stock options exercised was $5,000 and $63,000, respectively. The total cash received from these stock option exercises was $6,000, and $69,000, respectively, and the actual tax benefit realized for the tax deductions from these option exercises was $2,000 and $24,000, respectively.
F-19
DESTINATION MATERNITY CORPORATION AND SUBSIDIARIES
NOTES TO CONSOLIDATED FINANCIAL STATEMENTS (Continued)
There were no stock options granted in fiscal 2017. The weighted-average fair value of stock options granted during fiscal 2016 and 2015 was estimated to be $2.96 and $2.58 per option share, respectively. The weighted-average fair value of each option granted is calculated on the date of grant using the Black-Scholes option pricing model.
Weighted-average assumptions for option grants were as follows:
|
|
Year Ended |
|
|||||||||||||
|
|
February 3, 2018 |
|
|
January 28, 2017 |
|
|
January 30, 2016 |
|
|||||||
|
Expected dividend yield |
|
|
|
N/A |
|
|
|
|
none |
|
|
|
|
5.7% |
|
|
Expected price volatility |
|
|
|
N/A |
|
|
|
|
45.0% |
|
|
|
|
36.1% |
|
|
Risk-free interest rate |
|
|
|
N/A |
|
|
|
|
1.3% |
|
|
|
|
1.4% |
|
|
Expected life |
|
|
|
N/A |
|
|
|
|
5.3 years |
|
|
|
|
5.0 years |
|
There were no option grants during the fiscal year ended February 3, 2018. Expected dividend yield was determined using a weighted average of the Company’s annualized dividend rate compared to the market price of the Company’s common stock as of the grant date. Expected volatility was determined using a weighted average of the historic volatility of the Company’s common stock as of the option grant date measured over a period equal to the expected life of the grant. Risk-free interest rates were based on the United States Treasury yield curve in effect at the date of the grant. Expected lives were determined using a weighted average of the historic lives of previously issued grants of the Company’s stock options.
The following table summarizes information about stock options outstanding as of February 3, 2018:
|
|
Stock Options Outstanding |
|
Stock Options Exercisable |
||||||||||||||||
|
Range of Exercise Prices |
Number |
|
Weighted |
|
Weighted |
|
Number |
|
Weighted |
||||||||||
|
|
(in thousands) |
|
(years) |
|
|
|
|
(in thousands) |
|
|
|
||||||||
|
$ 3.52 to $ 7.00 |
|
74 |
|
|
|
8.5 |
|
|
$ |
5.61 |
|
|
|
19 |
|
|
$ |
5.60 |
|
|
7.01 to 8.00 |
|
211 |
|
|
|
8.2 |
|
|
|
7.49 |
|
|
|
53 |
|
|
|
7.49 |
|
|
8.01 to 14.00 |
|
24 |
|
|
|
4.4 |
|
|
|
11.63 |
|
|
|
19 |
|
|
|
11.72 |
|
|
14.01 to 15.00 |
|
177 |
|
|
|
6.7 |
|
|
|
14.39 |
|
|
|
128 |
|
|
|
14.37 |
|
|
15.01 to 19.00 |
|
10 |
|
|
|
7.0 |
|
|
|
15.31 |
|
|
|
8 |
|
|
|
15.31 |
|
|
19.01 to 23.00 |
|
33 |
|
|
|
4.5 |
|
|
|
20.55 |
|
|
|
31 |
|
|
|
20.62 |
|
|
23.01 to 31.38 |
|
15 |
|
|
|
5.8 |
|
|
|
30.93 |
|
|
|
15 |
|
|
|
30.93 |
|
|
$ 3.52 to $31.38 |
|
544 |
|
|
|
7.3 |
|
|
$ |
11.26 |
|
|
|
273 |
|
|
$ |
13.94 |
|
Restricted stock activity for the 2005 Plan was as follows:
|
|
Outstanding Restricted |
|
Weighted |
||||
|
|
(in thousands) |
|
|
|
|||
|
Nonvested—January 28, 2017 |
|
276 |
|
|
$ |
9.55 |
|
|
Granted |
|
747 |
|
|
|
2.35 |
|
|
Vested |
|
(113) |
|
|
|
8.26 |
|
|
Forfeited |
|
(57) |
|
|
|
8.88 |
|
|
Nonvested—February 3, 2018 |
|
853 |
|
|
$ |
3.16 |
|
The Compensation Committee established performance goals for the award of performance-based RSUs for the Company’s executive officers, under the 2005 Plan, in each of August 2016 and April 2016 (collectively the “Fiscal 2016 Awards”) and April 2015 (the “Fiscal 2015 Awards”). The RSUs earned, if any, under the awards will be based on the Company’s cumulative operating income, as defined in the applicable award agreement (“RSU Operating Income”) for a specified three-year period (“Performance Period”). The grant of any RSUs under these awards will generally be further contingent on the continued employment of the executive officers with the Company through the dates on which the shares in respect of these RSUs, if any, are issued following the end of the applicable Performance Periods, as well as the achievement of certain minimum levels of RSU Operating Income in the final fiscal year of each applicable Performance Period. Any dividends declared on the shares of the Company’s common stock underlying the RSUs will be credited as additional RSUs based on the fair market value of the Company’s common stock on the dividend record date. The additional RSUs, if any, will be earned on the same terms as the original RSUs.
F-20
DESTINATION MATERNITY CORPORATION AND SUBSIDIARIES
NOTES TO CONSOLIDATED FINANCIAL STATEMENTS (Continued)
The following table sets forth the aggregate minimum, target and maximum RSUs, excluding RSUs from dividends declared, that may be earned by the executive officers for each fiscal year award cycle. The minimum RSUs will be earned if the Company’s RSU Operating Income during the Performance Period equals the specified threshold RSU Operating Income. Additional RSUs are earned ratably for RSU Operating Income that exceeds the specified threshold, up to the maximum amount for RSU Operating Income that equals or exceeds the specified maximum RSU Operating Income.
|
Awards |
|
Performance Period |
|
|
Minimum RSUs |
|
|
Target RSUs |
|
|
Maximum RSUs |
|
|||
|
Fiscal 2016 Awards |
|
January 31, 2016 to February 3, 2018 |
|
|
|
13,698 |
|
|
|
54,789 |
|
|
|
82,185 |
|
|
Fiscal 2015 Awards |
|
February 2, 2015 to January 28, 2017 |
|
|
|
15,218 |
|
|
|
30,436 |
|
|
|
45,655 |
|
Fiscal 2015 Awards include the prorated number of RSUs that may be earned by the Company’s former President and exclude RSUs forfeited by the Company’s former Executive Vice President & Chief Financial Officer. In fiscal 2017 and 2016 the Company determined that the Fiscal 2016 Awards and Fiscal 2015 Awards were unlikely to be earned, even at the minimum level. No RSUs were earned under the awards for the three-year Performance Periods ending September 30, 2016, 2015 and 2014 because the Company’s RSU Operating Income during the Performance Period was less than the threshold RSU Operating Income required to earn the minimum level of award.
During fiscal 2017 and 2016 the Company’s Board of Directors received a cumulative total of 22,000 and 13,867 shares of restricted stock, respectively, as compensation for their services. The awards will vest at the earlier of 1) one year from the grant date, 2) one day prior to the next annual meeting of stockholders, 3) the end of the grantee’s Board service other than via resignation, or 4) a change in control of the Company (as defined in the 2005 Plan). During fiscal 2016, 10,974 deferred stock units were awarded to members of the Company’s Board of Directors in lieu of cash retainers totaling $75,000.
Stock-based compensation expense in fiscal 2017, 2016 and 2015 was $1,154,000, $1,801,000, and $2,784,000 respectively. As of February 3, 2018, $2,739,000 of total unrecognized compensation cost related to all non-vested equity awards is expected to be recognized over a weighted-average period of 1.5 years.
During fiscal 2017, 2016 and 2015 certain stock option exercises and vesting restricted stock awards were net-share settled by the Company such that the Company withheld shares of the Company’s common stock, which had a fair market value equivalent to the minimum statutory obligation for the applicable income and employment taxes for the awards, and the Company remitted the cash value to the appropriate taxing authorities. The total shares withheld in connection with tax obligations, which were 19,149, 7,408 and 15,024 respectively, during fiscal 2017, 2016 and 2015, are reflected as repurchase of common stock in the accompanying financial statements, and were based on the value of the Company’s common stock on the exercise or vesting date. The remaining shares, net of those withheld, were delivered to the award holders. Total payments for tax obligations to the tax authorities were $57,000, $54,000 and $127,000 for fiscal 2017, 2016 and 2015, respectively.
|
13. |
OTHER CHARGES, NET |
In an effort to enhance the Company’s competitive position, in late fiscal 2014 the Company commenced a program to actively focus on improving its business processes, key management personnel and planning resources. These efforts have been increasingly challenged by a number of external factors and industry trends, including the overall weakness in the women's specialty apparel retail space as well as declining mall-based traffic. In order to address these challenges, the Company has acted to best position itself for profitable, long-term growth, with a focus on improving inventory management, driving sales productivity, optimizing real estate, expanding its online presence and controlling costs. Among other efforts, the Company conducted a comprehensive evaluation of its key apparel brands and business relationships, resulting in strategic phase-outs and the elimination of certain non-core brands. The Company retained a leading consulting firm to review its costs and business strategy in order to implement an organizational transformation. The Company is in the process of executing a CEO transition having announced on September 17, 2017 the appointment of B. Allen Weinstein, a member of our Board since 2010, as Interim Chief Executive Officer (“Interim CEO”) and the resignation of Anthony M. Romano as our Chief Executive Officer & President (“Former CEO”). On January 2, 2018 Melissa Payner-Gregor, an independent director since 2009, replaced Mr. Weinstein as Interim CEO. The Company also paid one-time retention bonuses with service conditions to certain key management personnel which are being recorded over the service period, while reducing its overall headcount to create a more efficient and effective operating structure. During fiscal 2017, 2016 and 2015 the Company incurred $3,714,000, $1,760,000 and $4,196,000, respectively, of net charges related to these management and organizational changes.
F-21
DESTINATION MATERNITY CORPORATION AND SUBSIDIARIES
NOTES TO CONSOLIDATED FINANCIAL STATEMENTS (Continued)
During the fourth quarter of fiscal 2015 the Company announced that it had received an unsolicited, non-binding preliminary merger proposal from the Company’s largest shareholder, Orchestra, a France-based retailer of children’s wear. On December 19, 2016 the Company entered into a merger agreement. During the second quarter of fiscal 2017 the parties determined that it was in the best interests of their respective stockholders to terminate the proposed merger. On July 27, 2017 the Company, Orchestra, and certain other affiliates of Orchestra entered into a termination agreement. In connection with the termination agreement, Orchestra and the Company agreed to reimburse each other for certain costs incurred in connection with their effort to implement the merger agreement, with a net amount of $1,000,000 paid to the Company on July 31, 2017. During fiscal 2017, 2016 and 2015 the Company incurred $1,198,000, $3,154,000 and $61,000, respectively, of net charges related to the merger.
The termination agreement also terminated certain ancillary agreements between the Company and a wholly-owned subsidiary of Orchestra, under which the Company provided real estate and construction project consulting services, and offered for purchase infant and childrenswear merchandise for sale in certain of the Company’s stores. In fiscal 2017 the Company recognized $44,000 of revenue under such agreements.
In September 2013 the Company announced plans to relocate its corporate headquarters and distribution operations from Philadelphia, Pennsylvania to southern New Jersey. The Company completed the relocation of its corporate headquarters to Moorestown, New Jersey in January 2015 and completed the relocation of its distribution operations to Florence, New Jersey in August 2015. During fiscal 2015, the Company recorded $2,695,000, of charges related the sale and closure of its prior facilities, and the preparation for occupancy of and relocation to its new facilities.
During fiscal 2015 the Company incurred $27,000 of charges related to its change to a retail calendar-based fiscal year.
A summary of the charges incurred in connection with the proposed business combinations, management and organizational changes, facilities relocations and fiscal year change for fiscal 2017, 2016, and 2015 follows (in thousands):
|
|
|
Year Ended |
|
||||||||||
|
|
|
February 3, 2018 |
|
|
January 28, 2017 |
|
|
|
January 30, 2016 |
|
|||
|
Proposed Business Combination and Other Corporate Activities |
|
|
|
|
|
|
|
|
|
|
|
|
|
|
Legal and other professional fees |
|
$ |
2,198 |
|
|
$ |
3,154 |
|
|
|
$ |
61 |
|
|
Net reimbursement for certain costs incurred |
|
|
(1,000 |
) |
|
|
— |
|
|
|
|
— |
|
|
Total proposed business combination and other corporate activities |
|
|
1,198 |
|
|
|
3,154 |
|
|
|
|
61 |
|
|
|
|
|
|
|
|
|
|
|
|
|
|
|
|
|
Management and Organizational Changes |
|
|
|
|
|
|
|
|
|
|
|
|
|
|
Severance and related benefits |
|
773 |
|
|
|
1,210 |
|
|
|
|
1,787 |
|
|
|
Non-core brand contract terminations |
|
— |
|
|
545 |
|
|
|
— |
|
|||
|
Consulting fees |
|
1,233 |
|
|
|
5 |
|
|
|
1,388 |
|
||
|
Executive officer separation benefits |
|
1,445 |
|
|
— |
|
|
|
922 |
|
|||
|
Pro-rata retention bonuses |
|
263 |
|
|
— |
|
|
|
— |
|
|||
|
Other |
|
— |
|
|
— |
|
|
|
99 |
|
|||
|
Total management and organizational changes |
|
3,714 |
|
|
|
1,760 |
|
|
|
|
4,196 |
|
|
|
|
|
|
|
|
|
|
|
|
|
|
|
|
|
|
Facilities Relocations |
|
|
|
|
|
|
|
|
|
|
|
|
|
|
Pre-opening rent expense on new corporate headquarters and distribution facility |
|
|
— |
|
|
|
— |
|
|
|
|
1,699 |
|
|
Moving and other costs |
|
— |
|
|
— |
|
|
|
763 |
|
|||
|
Accelerated depreciation and amortization expense |
|
— |
|
|
— |
|
|
|
233 |
|
|||
|
Total facilities relocations |
|
— |
|
|
|
— |
|
|
|
|
2,695 |
|
|
|
|
|
|
|
|
|
|
|
|
|
|
|
|
|
|
Fiscal Year Change |
|
|
|
|
|
|
|
|
|
|
|
|
|
|
Systems modifications |
|
— |
|
|
— |
|
|
|
27 |
|
|||
|
Total fiscal year change |
|
— |
|
|
— |
|
|
|
|
27 |
|
||
|
Total other charges, net |
|
$ |
4,912 |
|
|
$ |
4,914 |
|
|
|
$ |
6,979 |
|
F-22
DESTINATION MATERNITY CORPORATION AND SUBSIDIARIES
NOTES TO CONSOLIDATED FINANCIAL STATEMENTS (Continued)
In 2015 the Company completed the relocation of its corporate headquarters and distribution operations from Philadelphia, Pennsylvania to southern New Jersey (the “Project”). To partially offset the costs of these relocations, the Board of the New Jersey Economic Development Authority (“NJEDA”) approved the Company for an incentive package of up to $40,000,000 in benefits under the Grow New Jersey Assistance Program (“Grow NJ”) in the form of transferrable income tax credits over a ten-year period from the State of New Jersey. The Company’s Grow NJ award required a minimum capital investment of $20,000,000 with the total potential award being equal to the total eligible capital investment in the Project and subject to an overall award limit of $40,000,000. The award provides annually over a ten-year period up to $7,000 per eligible new full-time job, as defined under Grow NJ, with a requirement that at least 100 eligible jobs were created and subject to an annual award limit of $4,000,000.
The Grow NJ award will be earned on an annual basis over the ten-year period, subject to the $4,000,000 annual award limit, and requires an annual compliance report that includes certification of average annual employment figures after the end of each fiscal year. After the end of the ten-year Grow NJ award earnings period there is a five-year compliance period during which the Company must maintain the average of its annual eligible jobs certified during the preceding ten years or a pro-rata amount up to one-tenth of the previously awarded income tax credits would be subject to recapture and repayment to the State of New Jersey annually during the five-year compliance period. The Company believes the likelihood of any recapture and repayment is remote.
The annual benefit from the Grow NJ award available to the Company is expected to significantly exceed the Company’s annual income tax liability to the State of New Jersey. In order to maximize the realizable value of the incentive package, in December 2013 the Company entered into an agreement with a third party to sell 75% or more of the annual income tax credits awarded to the Company. The Company recognizes its Grow NJ award on an annual basis for each fiscal year based on the realizable value of the award earned and expected to be received, primarily from the sale of the income tax credits, net of any associated costs. The Grow NJ award earned is reflected in the Company’s consolidated financial statements as a reduction to the costs incurred by the Company in connection with the relocations. The expected realizable amount of the Grow NJ award is included in the consolidated balance sheet in deferred income taxes.
In fiscal 2017, 2016 and 2015, the Company’s Grow NJ award (net of valuation allowance) of $2,829,000, $3,251,000 and $3,600,000, respectively, was recognized ratably during the fiscal year, or in the case of fiscal 2015 during the third and fourth quarters, and included in the Company’s consolidated statements of operations as a reductions of cost of goods sold and selling, general and administrative expenses. The reductions to cost of goods sold were $2,077,000, $2,287,000, and $1,846,000 and the reductions to selling, general and administrative expenses were $785,000, $902,000 and $1,006,000 in fiscal 2017, 2016 and 2015 respectively. Additionally, $776,000, $810,000 and $748,000 is included in the consolidated balance sheets as of February 3, 2018, January 28, 2017 and January 30, 2016, respectively, as a reduction to overhead in inventory. In fiscal 2017 and 2016 the Company received cash proceeds of $3,251,000 and $3,600,000, from the sale of the 2016 and 2015 awards. As of February 3, 2018 the fiscal 2017 award was recorded as a deferred tax asset on the Company’s consolidated balance sheet and is expected to be converted to a receivable and collected in fiscal 2018 upon the sale of the income tax credits.
|
15. |
INCOME TAXES |
The 2017 U.S. Tax Cuts and Jobs Act (the “TCJA”) was signed into law on December 22, 2017. The TCJA included a number of changes to the U.S. corporate income tax including a reduction of the corporate income tax rate form 35% to 21% for tax years beginning after December 31, 2017, enhancing and extending through 2026 the option to claim accelerated depreciation on qualified property, eliminating the corporate alternative minimum tax (AMT) and changing how existing AMT credits can be utilized, a new limitation on deductible interest expense and limitations on the use of net operating loss carryforwards created in tax years beginning after December 31, 2017. For fiscal 2017 the Company used a blended effective tax rate of 33.7% which represents the prorated percentage from the TCJA’s January 1, 2018 effective date and our February 3, 2018 fiscal year-end. The Company recorded a $10.2 million reduction in our net deferred tax asset to reflect the remeasurement of the asset value from a tax rate of 35% to 21%. The Company had previously recorded a valuation allowance against its deferred tax assets, therefore the revaluation did not affect our fiscal 2017 tax expense.
The Company is reporting the impact of the TCJA provisionally based on reasonable estimates using currently available information and interpretations. We will continue to refine our reporting within the measurement period provided by Staff Accounting Bulletin No. 118.
F-23
DESTINATION MATERNITY CORPORATION AND SUBSIDIARIES
NOTES TO CONSOLIDATED FINANCIAL STATEMENTS (Continued)
Income tax provision (benefit) was comprised of the following (in thousands):
|
|
Year Ended |
|
|||||||||
|
|
February 3, 2018 |
|
|
January 28,2017 |
|
|
January 30,2016 |
|
|||
|
Current provision (benefit) |
$ |
2 |
|
|
$ |
436 |
|
|
$ |
(4,826 |
) |
|
Deferred provision (benefit) |
|
— |
|
|
|
24,614 |
|
|
|
2,020 |
|
|
Income tax provision (benefit) |
$ |
2 |
|
|
$ |
25,050 |
|
|
$ |
(2,806 |
) |
|
|
|
|
|
|
|
|
|
|
|
|
|
|
Federal provision (benefit) |
$ |
(20 |
) |
|
$ |
19,202 |
|
|
$ |
(1,962 |
) |
|
State provision (benefit) |
|
(70 |
) |
|
|
5,679 |
|
|
|
(575 |
) |
|
Foreign provision (benefit) |
|
92 |
|
|
|
169 |
|
|
|
(269 |
) |
|
Income tax provision (benefit) |
$ |
2 |
|
|
$ |
25,050 |
|
|
$ |
(2,806 |
) |
A reconciliation of the statutory federal tax rate to the Company’s effective income tax rates follows:
|
|
Year Ended |
|
||||||||||||||||
|
|
February 3, 2018 |
|
|
January 28, 2017 |
|
|
January 30, 2016 |
|
||||||||||
|
Statutory federal tax rate |
|
|
(33.7 |
)% |
|
|
|
|
(35.0 |
)% |
|
|
|
|
(35.0 |
)% |
|
|
|
State tax rate, net of federal effect |
|
|
0.5 |
|
|
|
|
|
5.4 |
|
|
|
|
|
(2.3 |
) |
|
|
|
(Benefit) provision for uncertain income tax positions, net of federal effect |
|
|
(1.3 |
) |
|
|
|
|
(1.8 |
) |
|
|
|
|
(2.8 |
) |
|
|
|
Change in federal tax rate |
|
|
52.2 |
|
|
|
|
|
— |
|
|
|
|
|
— |
|
|
|
|
Other |
|
|
(2.6 |
) |
|
|
|
|
(3.7 |
) |
|
|
|
|
1.6 |
|
|
|
|
Valuation allowance |
|
|
(15.1 |
) |
|
|
|
|
360.0 |
|
|
|
|
|
— |
|
|
|
|
Effective income tax rate |
|
|
0.0 |
% |
|
|
|
|
324.9 |
% |
|
|
|
|
(38.5 |
)% |
|
|
The decrease in the effective tax rate in fiscal 2017 compared to fiscal 2016 was primarily the result of a valuation allowance recorded by the Company in fiscal 2016. Accounting Standards Codification Topic 740, Income Taxes, requires that a valuation allowance be recorded to reduce deferred tax assets when it is more likely than not that the tax benefit of the deferred tax assets will not be realized. In situations where a three-year cumulative loss condition exists, accounting standards limit the ability to consider projections of future results as positive evidence to assess the realizability of deferred tax assets. In fiscal 2016 the Company’s financial results reflected a three-year cumulative loss. Consequently, in fiscal 2016 the Company recorded a non-cash charge of $27.8 million as a valuation allowance against substantially all of its deferred tax assets. In fiscal 2017 the Company’s financial results continue to reflect a cumulative three-year loss and as such we continue to record a valuation allowance against substantially all of our deferred tax assets. The establishment of this valuation allowance has no effect on the Company’s ability to utilize the deferred tax assets to offset future taxable income, if generated. The Company will continue to assess the likelihood that the deferred tax assets will be realizable in the future and the valuation allowance will be adjusted accordingly. The tax benefits relating to any reversal of the valuation allowance on the net deferred tax assets in a future period will be recognized as a reduction of future income tax expense in that period.
F-24
DESTINATION MATERNITY CORPORATION AND SUBSIDIARIES
NOTES TO CONSOLIDATED FINANCIAL STATEMENTS (Continued)
The deferred tax effects of temporary differences giving rise to the Company’s net deferred tax assets were as follows (in thousands):
|
|
February 3, 2018 |
|
|
January 28, 2017 |
|
||
|
Deferred tax assets: |
|
|
|
|
|
|
|
|
Net operating loss carryforwards |
$ |
13,840 |
|
|
$ |
13,201 |
|
|
Deferred rent |
|
5,568 |
|
|
|
9,454 |
|
|
Employee benefit accruals |
|
1,873 |
|
|
|
3,041 |
|
|
Grow NJ award benefit, net |
|
2,158 |
|
|
|
2,268 |
|
|
Depreciation and amortization |
|
1,507 |
|
|
|
— |
|
|
Inventory reserves |
|
1,211 |
|
|
|
2,131 |
|
|
Federal tax credit carryforwards |
|
1,494 |
|
|
|
1,247 |
|
|
Stock-based compensation |
|
565 |
|
|
|
855 |
|
|
Other accruals |
|
1,037 |
|
|
|
1,905 |
|
|
Other |
|
1,367 |
|
|
|
1,960 |
|
|
|
|
30,620 |
|
|
|
36,062 |
|
|
Valuation allowance |
|
(27,425 |
) |
|
|
(30,402 |
) |
|
|
|
3,195 |
|
|
|
5,660 |
|
|
Deferred tax liabilities: |
|
|
|
|
|
|
|
|
Depreciation and amortization |
|
— |
|
|
|
(1,860 |
) |
|
Prepaid expenses |
|
(366 |
) |
|
|
(549 |
) |
|
|
|
(366 |
) |
|
|
(2,409 |
) |
|
|
|
|
|
|
|
|
|
|
Net deferred tax assets |
$ |
2,829 |
|
|
$ |
3,251 |
|
The Company assessed that it was unlikely that sufficient future state specific taxable income will be generated to fully use the available state net operating loss carryforwards, and accordingly, a valuation allowance has been recorded to recognize only the portion of the deferred tax asset that is considered more likely than not to be realized. The Company does not record state tax benefits associated with temporary differences for certain other states in which it has net operating losses, given the continued historical uncertainty related to realizing such state tax benefits. Had the state tax benefits been reflected for these states, the deferred tax assets (excluding state net operating loss carryforwards) as of February 3, 2018 would be approximately $1.4 million higher.
The accounting standard for uncertain income tax positions clarifies the accounting for income taxes by prescribing the minimum recognition threshold a tax position is required to meet before being recognized in the financial statements and also contains guidance on the measurement of uncertain tax positions.
A reconciliation of gross unrecognized tax benefits for uncertain tax positions follows (in thousands):
|
|
Year Ended |
|
|||||||||
|
|
February 3, 2018 |
|
|
January 28, 2017 |
|
|
January 30, 2016 |
|
|||
|
Balance at beginning of period |
$ |
752 |
|
|
$ |
961 |
|
|
$ |
1,537 |
|
|
Additions for current period tax positions |
|
— |
|
|
|
— |
|
|
|
— |
|
|
Additions for prior period tax positions |
|
— |
|
|
|
13 |
|
|
|
48 |
|
|
Reductions of prior period tax positions |
|
(372 |
) |
|
|
(222 |
) |
|
|
(470 |
) |
|
Payments |
|
— |
|
|
|
— |
|
|
|
(154 |
) |
|
Balance at end of period |
$ |
380 |
|
|
$ |
752 |
|
|
$ |
961 |
|
As of February 3, 2018 gross unrecognized tax benefits included accrued interest and penalties of $192,000. During fiscal 2017, 2016 and 2015 interest and penalties of $(131,000), $(28,000) and $(83,000), respectively, related to unrecognized tax benefits, were included in income tax provision (benefit). If recognized, the portion of the liability for unrecognized tax benefits that would impact the Company’s effective tax rate was $326,000, net of federal tax benefit.
As of February 3, 2018, January 28, 2017 and January 30, 2016 the Company had income taxes receivable of $700,000, $4,875,000 and $5,859,000, respectively, which are included in prepaid expenses and other current assets in the accompanying consolidated balance sheets.
F-25
DESTINATION MATERNITY CORPORATION AND SUBSIDIARIES
NOTES TO CONSOLIDATED FINANCIAL STATEMENTS (Continued)
During the twelve months subsequent to February 3, 2018 it is reasonably possible that the gross unrecognized tax benefits could potentially decrease by approximately $238,000 (of which approximately $214,000 would affect the effective tax rate, net of federal expense) for uncertain tax positions, primarily from the effect of expiring statutes of limitations, partially offset by the continued effect of interest on unrecognized tax benefits.
The Company’s United States Federal income tax returns for the years ended September 30, 2014 and thereafter remain subject to examination by the United States Internal Revenue Service. The Company also files tax returns in Canada, India, Kuwait and numerous United States state jurisdictions, which have varying statutes of limitations. Generally, Canadian tax returns for tax years ended September 30, 2009 and thereafter, Indian tax returns for tax years ended March 31, 2011 and thereafter, and United States state tax returns for tax years ended September 30, 2013 and thereafter, depending upon the jurisdiction, remain subject to examination. However, the statutes of limitations on certain of the Company’s United States state tax returns remain open for tax years prior to fiscal 2013.
|
16. |
COMMITMENTS AND CONTINGENCIES |
The Company leases its retail facilities and certain equipment under various non-cancelable operating leases. Certain of these leases have renewal options. Total rent expense (including related occupancy costs, such as insurance and maintenance, paid to landlords) under operating leases amounted to $53,657,000, $56,830,000 and $58,120,000 in fiscal 2017, 2016 and 2015, respectively. Such amounts exclude contingent rentals based upon a percentage of sales totaling $942,000, $977,000, $1,359,000 in fiscal 2017, 2016 and 2015, respectively.
The Company completed the relocation of its corporate headquarters to Moorestown, New Jersey in January 2015 and completed the relocation of its distribution operations to Florence, New Jersey in August 2015. Rent payments for both the corporate headquarters and distribution center commenced in March 2015 and future minimum payments for these two leases are included in the table below.
Store, office and distribution facility leases generally provide for payment of direct operating costs in addition to rent.
Future annual minimum lease payments, for facilities leases excluding such direct operating costs, as well as leases for equipment rental, as of February 3, 2018, are as follows (in thousands):
|
Fiscal Year |
|
|
|
|
2018 |
$ |
37,474 |
|
|
2019 |
|
30,113 |
|
|
2020 |
|
23,462 |
|
|
2021 |
|
20,091 |
|
|
2022 |
|
17,292 |
|
|
2023 and thereafter |
|
61,205 |
|
|
|
$ |
189,637 |
|
From time to time, the Company is named as a defendant in legal actions arising from normal business activities. Litigation is inherently unpredictable and although the amount of any liability that could arise with respect to currently pending actions cannot be accurately predicted, the Company does not believe that the resolution of any pending action will have a material adverse effect on its financial position, results of operations or liquidity.
F-26
DESTINATION MATERNITY CORPORATION AND SUBSIDIARIES
NOTES TO CONSOLIDATED FINANCIAL STATEMENTS (Continued)
On January 3, 2018 the Company entered into a letter agreement with Melissa Payner-Gregor when she was appointed interim Chief Executive Officer. Ms. Payner-Gregor’s letter agreement provides for an annual base salary of $620,000. Base salary earned by Ms. Payner-Gregor was $31,000 in fiscal 2017. Ms. Payner-Gregor is also entitled to receive a $50,000 bonus on June 30, 2018, if Ms. Payner-Gregor remains employed by the Company on that date; provided that if her employment is terminated by the Company prior to such date, Ms. Payner-Gregor would receive the bonus on the date of such termination. She is also entitled to the reimbursement of certain reasonable and necessary business expenses incurred during her period of interim service, including reimbursement of reasonable transportation and temporary living expenses incurred by Ms. Payner-Gregor as a result of her commuting and/or temporary relocation during her period of interim service. Furthermore, per a separate letter agreement between the Company and Ms. Payner-Gregor entered into in March of 2018, Ms. Payner-Gregor is entitled to health benefit continuation coverage after her interim service ends, as further described in such letter agreement. As interim Chief Executive Officer, Ms. Payner-Gregor is not eligible to participate in the Company’s Management Incentive Program or in any severance arrangement, or receive any other incentive or executive perquisite not described in her letter agreement. The agreement continues in effect until terminated by either the Company or the executive in accordance with the termination provisions of the agreement.
On September 7, 2017 the Company entered into a letter agreement with Allen Weinstein when he was appointed. Interim Chief Executive Officer. Mr. Weinstein’s letter agreement provided for an annual base salary of $620,000. Base salary earned by Mr. Weinstein in fiscal 2017 was $183,615. Mr. Weinstein was also entitled to receive a $50,000 bonus on March 17, 2018 if Mr. Weinstein remained employed by the Company on that date; provided that if his employment was terminated by the Company prior to such date, Mr. Weinstein would receive the bonus on the date of such termination. He was also entitled to the reimbursement of certain reasonable and necessary business expenses during his period of interim service, including reimbursement of reasonable transportation and temporary living expenses incurred by Mr. Weinstein as a result of his commuting and/or temporary relocation during her period of interim service. As interim Chief Executive Officer, Mr. Weinstein was not eligible to participate in the Company’s Management Incentive Program or in any severance arrangement, or receive any other incentive or executive perquisite not described in his letter agreement. Effective on January 2, 2018, Mr. Weinstein decided to retire from the Board for personal reasons. In light of the retirement, the Board determined to terminate Mr. Weinstein’s service as the Company’s interim Chief Executive Officer also effective on January 2, 2018. In connection with Mr. Weinstein’s departure, and in accordance with his letter agreement with the Company, the Company entered into a Retirement and Release Agreement with Mr. Weinstein, pursuant to which Mr. Weinstein granted a general release in favor of the Company as a condition of receiving the payments specified in the original letter agreement, as well as for receiving base salary continuation payments through February 3, 2018 and reimbursement of the legal fees he incurred in connection with negotiation of the Retirement and Release Agreement.
During fiscal 2017, 2016 and 2015 the Company had an employment agreement with Anthony M. Romano, the Company’s former CEO & President. Base salary earned for Mr. Romano was $520,365, $825,000 and $825,000 for fiscal 2017, 2016 and 2015, respectively. Effective September 7, 2017 Mr. Romano resigned as CEO & President. In connection with Mr. Romano’s resignation as CEO & President, the Company entered into a separation agreement with Mr. Romano (the “Romano Separation Agreement”), pursuant to which Mr. Romano granted a general release in favor of the Company as a condition of receiving the payments and other benefits specified in his employment agreement. Pursuant to the Romano Separation Agreement, Mr. Romano received base salary continuation for 12 months, a $496,000 aggregate payment payable over 12 months and health benefit continuation for 12 months. In addition, with respect to each outstanding grant of time-based restricted stock and stock options held by Mr. Romano at the time of his separation, the vesting on the tranche that was next scheduled to vest pursuant to each such grant was accelerated. Further a pro-rata portion of any outstanding performance-based restricted stock units then held by Mr. Romano will remain outstanding and will vest to the extent earned based on the actual performance of the Company through the end of the applicable performance period (subject to acceleration upon a change in control).
During fiscal 2014 the Company had an employment agreement with Edward M. Krell, the Company’s former CEO. Base salary earned for Mr. Krell was $681,000 for fiscal 2014. Effective August 10, 2014 Mr. Krell resigned as CEO. In connection with Mr. Krell’s resignation as CEO, the Company entered into a separation agreement with Mr. Krell (the “Krell Separation Agreement”). The Krell Separation Agreement provided a) that Mr. Krell would receive a lump sum payment of $3,338,000, which was paid in February 2015, b) accelerated vesting of stock option and restricted stock awards and c) continuation of certain insurance and fringe benefits for up to three years. The Krell Separation Agreement also provides for the restrictive covenants set forth in Mr. Krell’s employment agreement to continue in effect until three years after Mr. Krell’s separation from the Company.
F-27
DESTINATION MATERNITY CORPORATION AND SUBSIDIARIES
NOTES TO CONSOLIDATED FINANCIAL STATEMENTS (Continued)
During fiscal 2015 the Company had an employment agreement with Christopher F. Daniel, the Company’s former President. Base salary earned for Mr. Daniel was $453,000. Effective December 7, 2015 Mr. Daniel left the Company as a result of the elimination of the separate President function. In connection with Mr. Daniel’s departure, the Company entered into a separation agreement with Mr. Daniel (the “Daniel Separation Agreement”). The Daniel Separation Agreement provided a) that Mr. Daniel would receive one year of base salary, one-half of which was paid as a lump sum in June 2016 and the balance of which was paid monthly thereafter, totaling $535,000, b) payment to Mr. Daniel of a pro-rata annual bonus for fiscal 2015, c) lump sum payments to Mr. Daniel totaling $104,000 in January 2016, primarily for consulting services from his date of separation through January 31, 2016 and d) continuation of certain insurance and fringe benefits for up to 14 months. The Daniel Separation Agreement also modifies the restrictive covenants set forth in Mr. Daniel’s employment agreement and provides that such covenants will continue in effect until two years after Mr. Daniel’s separation.
Effective July 20, 2016 the Company entered into an employment agreement with David Stern, in connection with hiring of Mr. Stern as the Company’s Executive Vice President & Chief Financial Officer. Mr. Stern’s employment agreement provided that Mr. Stern’s annual base salary would be $405,000. Base salary earned for Mr. Stern was $405,000 and $195,000 for fiscal 2017 and 2016, respectively. The agreement also provides for salary continuation and severance payments should employment of the executive be terminated under specified conditions, as defined therein. Additionally, Mr. Stern is eligible for an annual cash bonus based on performance. The agreement continues in effect until terminated by either the Company or the executive in accordance with the termination provisions of the agreement.
During fiscal 2016 and 2015 the Company had an employment agreement with Judd P. Tirnauer, the Company’s former Executive Vice President & Chief Financial Officer. Base salary earned for Mr. Tirnauer was $128,000 and $405,000 for fiscal 2016 and 2015, respectively. Effective April 22, 2016 Mr. Tirnauer resigned as Executive Vice President & Chief Financial Officer to take a senior leadership role with a private specialty retailer.
The Company has an employment agreement with Ronald J. Masciantonio, the Company’s Executive Vice President & Chief Administrative Officer. On December 4, 2013 the Compensation Committee approved an increase to Mr. Masciantonio’s annual base salary from $360,000 to $390,000. On September 6, 2017 the Compensation Committee approved an increase to Mr. Masciantonio’s annual base salary from $390,000 to $425,000. Base salary earned for Mr. Masciantonio was $403,058, $390,000 and $390,000 for fiscal 2017, 2016 and 2015, respectively. The agreement also provides for salary continuation and severance payments should employment of the executive be terminated under specified conditions, as defined therein. Additionally, Mr. Masciantonio is eligible for an annual cash bonus based on performance. The agreement continues in effect until terminated by either the Company or the executive in accordance with the termination provisions of the agreement.
|
18. |
EMPLOYEE BENEFIT PLANS |
The Company has a 401(k) savings plan for all eligible employees who elect to participate. Participating employees can contribute up to 20% of their eligible compensation. Through December 31, 2015 employees who met certain criteria were eligible for a matching contribution from the Company based on a sliding scale. Company matches were made in the first quarter of the succeeding calendar year and vest over a period of approximately six years from each employee’s commencement of employment with the Company. Company matching contributions totaling $0, $123,000 and $144,000 were made in fiscal 2017, 2016 and 2015, respectively, which were net of $20,000 of cumulative plan forfeitures in fiscal 2016. In addition, the Company may make discretionary contributions to the plan, which vest over a period of approximately six years from each employee’s commencement of employment with the Company. The Company has not made any discretionary contributions.
|
19. |
QUARTERLY FINANCIAL INFORMATION (UNAUDITED) |
Quarterly financial results for the fiscal years ended February 3, 2018 and January 28, 2017 were as follows (in thousands, except per share amounts):
|
|
Quarter Ended |
|
|||||||||||||
|
Fiscal 2017 |
2/3/18 |
|
|
10/28/17 |
|
|
7/29/17 |
|
|
4/29/17 |
|
||||
|
Net sales |
$ |
105,147 |
|
|
$ |
96,354 |
|
|
$ |
98,280 |
|
|
$ |
106,426 |
|
|
Gross profit |
|
52,959 |
|
|
|
50,901 |
|
|
|
52,053 |
|
|
|
57,939 |
|
|
Net loss |
|
(10,158 |
) |
|
|
(7,523 |
) |
|
|
(2,774 |
) |
|
|
(1,142) |
|
|
Net loss per share—Basic |
|
(0.73 |
) |
|
|
(0.55 |
) |
|
|
(0.20 |
) |
|
|
(0.08) |
|
|
Net loss per share—Diluted |
|
(0.73 |
) |
|
|
(0.55 |
) |
|
|
(0.20 |
) |
|
|
(0.08) |
|
F-28
DESTINATION MATERNITY CORPORATION AND SUBSIDIARIES
NOTES TO CONSOLIDATED FINANCIAL STATEMENTS (Continued)
|
|
|
|
|||||||||||||
|
|
Quarter Ended |
|
|||||||||||||
|
Fiscal 2016 |
1/28/17 |
|
|
10/29/16 |
|
|
7/30/16 |
|
|
4/30/16 |
|
||||
|
Net sales |
$ |
100,158 |
|
|
$ |
102,582 |
|
|
$ |
106,529 |
|
|
$ |
124,430 |
|
|
Gross profit |
|
51,038 |
|
|
|
54,288 |
|
|
|
54,830 |
|
|
|
67,272 |
|
|
Net income (loss) |
|
(32,786 |
) |
|
|
(1,506 |
) |
|
|
(2,509 |
) |
|
|
4,041 |
|
|
Net income (loss) per share—Basic |
|
(2.39 |
) |
|
|
(0.11 |
) |
|
|
(0.18 |
) |
|
|
0.30 |
|
|
Net income (loss) per share—Diluted |
|
(2.39 |
) |
|
|
(0.11 |
) |
|
|
(0.18 |
) |
|
|
0.30 |
|
The Company’s business, like that of other retailers, is seasonal. The Company’s quarterly net sales have historically been highest in the peak Spring selling season, which under the Company’s 4-5-4 retail fiscal calendar ending on the Saturday nearest January 31 of each year, generally occurs during the Company’s first and second fiscal quarters. Given the historically higher sales level in that timeframe and the relatively fixed nature of most of the Company’s operating expenses, the Company has typically generated a very significant percentage of its full year operating income and net income during the calendar months of March through May.
|
20. |
SEGMENT AND ENTERPRISE WIDE DISCLOSURES |
Operating Segment. For purposes of the disclosure requirements for segments of a business enterprise, the Company has determined that its business is comprised of one operating segment: the design, manufacture and sale of maternity apparel and related accessories. While the Company offers a wide range of products for sale, the substantial portion of its products are initially distributed through the same distribution facilities, many of the Company’s products are manufactured at common contract manufacturer production facilities, the Company’s products are marketed through a common marketing department, and these products are sold to a similar customer base, consisting of expectant mothers.
Geographic Information. Geographic revenue information is allocated based on the country in which the products or services are sold, and in the case of international franchise revenues, on the location of the customer. Information concerning the Company’s operations by geographic area is as follows (in thousands):
|
|
Year Ended |
|
|||||||||
|
|
February 3, 2018 |
|
|
January 28, 2017 |
|
|
January 30, 2016 |
|
|||
|
Net Sales to Unaffiliated Customers |
|
|
|
|
|
|
|
|
|
|
|
|
United States |
$ |
383,183 |
|
|
$ |
405,921 |
|
|
$ |
468,282 |
|
|
Foreign |
|
23,024 |
|
|
|
27,778 |
|
|
|
30,471 |
|
|
|
February 3, 2018 |
|
|
January 28, 2017 |
|
||
|
Long-Lived Assets, Net |
|
|
|
|
|
|
|
|
United States |
$ |
65,456 |
|
|
$ |
81,811 |
|
|
Foreign |
|
1,643 |
|
|
|
2,310 |
|
Major Customers. For the periods presented, the Company did not have any one customer who represented more than 10% of its net sales.
|
21. |
INTEREST EXPENSE, NET |
Interest expense, net is comprised of the following (in thousands):
|
|
Year Ended |
|
|||||||||
|
|
February 3, 2018 |
|
|
January 28, 2017 |
|
|
January 30, 2016 |
|
|||
|
Interest expense |
$ |
4,048 |
|
|
$ |
3,578 |
|
|
$ |
1,529 |
|
|
Interest income |
|
(3 |
) |
|
|
(3 |
) |
|
|
(9 |
) |
|
Interest expense, net |
$ |
4,045 |
|
|
$ |
3,575 |
|
|
$ |
1,520 |
|
F-29
DESTINATION MATERNITY CORPORATION AND SUBSIDIARIES
SCHEDULE II—VALUATION AND QUALIFYING ACCOUNTS
(in thousands)
|
|
Balance at |
|
|
Additions |
|
|
Deductions and |
|
|
Balance at |
|
||||
|
Year Ended February 3, 2018 |
|
|
|
|
|
|
|
|
|
|
|
|
|
|
|
|
Product return reserve |
$ |
1,615 |
|
|
$ |
1,184 |
|
|
$ |
— |
|
|
$ |
2,799 |
|
|
|
|
|
|
|
|
|
|
|
|
|
|
|
|
|
|
|
Year Ended January 28, 2017 |
|
|
|
|
|
|
|
|
|
|
|
|
|
|
|
|
Product return reserve |
$ |
1,736 |
|
|
$ |
— |
|
|
$ |
(121 |
) |
|
$ |
1,615 |
|
|
|
|
|
|
|
|
|
|
|
|
|
|
|
|
|
|
|
Year Ended January 30, 2016 |
|
|
|
|
|
|
|
|
|
|
|
|
|
|
|
|
Product return reserve |
$ |
2,084 |
|
|
$ |
— |
|
|
$ |
(348 |
) |
|
$ |
1,736 |
|
|
(1) |
As of February 3, 2018, January 28, 2017, and January 30, 2016 the Company’s product return reserve reflects the estimated gross sales value of estimated product returns, which had an estimated cost value of $1,154, $775, and $887, respectively. |
F-30