Attached files
| file | filename |
|---|---|
| EX-32.2 - Plastic2Oil, Inc. | ex32-2.htm |
| EX-32.1 - Plastic2Oil, Inc. | ex32-1.htm |
| EX-31.2 - Plastic2Oil, Inc. | ex31-2.htm |
| EX-31.2 - Plastic2Oil, Inc. | ex31-1.htm |
| EX-10.41 - Plastic2Oil, Inc. | ex10-41.htm |
UNITED STATES
SECURITIES AND EXCHANGE COMMISSION
Washington, DC 20549
FORM 10-K
[X] ANNUAL REPORT PURSUANT TO SECTION 13 OR 15(d) OF THE SECURITIES EXCHANGE ACT OF 1934
For the fiscal year ended December 31, 2017
or
[ ] TRANSITION REPORT UNDER SECTION 13 OR 15(d) OF THE SECURITIES EXCHANGE ACT OF 1934
For the transition period from _____________ to _____________
Commission file number: 000-52444
PLASTIC2OIL, INC.
(Exact name of registrant as specified in its charter)
| Nevada | 90-0822950 | |
| (State
or other jurisdiction of incorporation or organization) |
(IRS
Employer Identification No.) |
20
Iroquois Street
Niagara Falls, NY 14303
(Address of Principal Executive Offices) (Zip Code)
Registrant’s telephone number: (716) 278-0015
Securities registered pursuant to Section 12(b) of the Act: None.
Securities registered pursuant to Section 12(g) of the Act: Common Stock, par value $0.001 per share.
Indicate by check mark if the registrant is a well-known seasoned issuer, as defined in Rule 405 of the Securities Act. Yes [ ] No [X]
Indicate by check mark if the registrant is not required to file reports pursuant to Section 13 or Section 15(d) of the Exchange Act. Yes [ ] No [X]
Indicate by check mark whether the registrant (1) has filed all reports required to be filed by Section 13 or 15(d) of the Securities Exchange Act of 1934 during the preceding 12 months (or for such shorter period that the registrant was required to file such report(s)), and (2) has been subject to such filing requirements for the past 90 days. Yes [X] No [ ]
Indicate by check mark whether the registrant has submitted electronically and posted on its corporate Web site, if any, every Interactive Data File required to be submitted and posted pursuant to Rule 405 of Regulation S-T (§ 232.405 of this chapter) during the preceding 12 months (or for such shorter period that the registrant was required to submit and post such files). Yes [X] No [ ]
Indicate by check mark if disclosure of delinquent filers pursuant to Item 405 of Regulation S-K is not contained herein, and will not be contained, to the best of Registrant’s knowledge, in definitive proxy or information statements incorporated by reference in Part III of this Form 10-K or any amendment to this Form 10-K. [ ]
Indicate by check mark whether the registrant is a large accelerated filer, an accelerated filer, a non-accelerated filer or a smaller reporting company. See definitions of “large accelerated filer,” “accelerated filer,” and “smaller reporting company” in Rule 12b-2 of the Exchange Act.
| Large accelerated filer [ ] | Accelerated filer [ ] | |
| Non-accelerated filer [ ] | Smaller reporting company [X] |
Indicate by check mark whether the registrant is a shell company (as defined in Rule 12b-2 of the Exchange Act). Yes [ ] No [X]
The aggregate market value of the voting and non-voting common equity held by non-affiliates of the Registrant was approximately $2.5million as of June 30, 2017 based upon the closing price of $0.02 per share on June 30, 2017.
As of April 2, 2018, there were 124,756,158 shares of the Registrant’s common stock, $0.001 par value, outstanding.
Documents Incorporated by Reference
None
PLASTIC2OIL, INC.
Table of Contents
| 2 |
CAUTIONARY STATEMENT REGARDING FORWARD-LOOKING STATEMENTS
This annual report on Form 10-K (“Report”) contains “forward looking statements” within the meaning of applicable securities laws. Such statements include, but are not limited to, statements with respect to management’s beliefs, plans, strategies, objectives, goals and expectations, including expectations about the future financial or operating performance of our Company and its projects, capital expenditures, capital needs, government regulation of the industry, environmental risks, limitations of insurance coverage, and the timing and possible outcome of regulatory matters, including the granting of patents and permits. Words such as “expect”, “anticipate”, “intend”, “attempt”, “may”, “will”, “plan”, “believe”, “seek”, “estimate”, and variations of such words and similar expressions are intended to identify such forward looking statements. These statements are not guarantees of future performance and involve assumptions, risks and uncertainties that are difficult to predict.
These statements are based on and were developed using a number of factors and assumptions including, but not limited to: stability in the U.S. and other foreign economies; stability in the availability and pricing of raw materials, energy and supplies; stability in the competitive environment; the continued ability of our Company to access cost effective capital when needed; and no unexpected or unforeseen events occurring that would materially alter the Company’s current plans. All of these assumptions have been derived from information currently available to the Company including information obtained by our Company from third party sources. Although management believes that these assumptions are reasonable, these assumptions may prove to be incorrect in whole or in part. As a result of these and other factors, actual results may differ materially from those expressed, implied or forecasted in such forward looking information, which reflect our Company’s expectations only as of the date hereof.
Factors that could cause actual results or outcomes to differ materially from the results expressed, implied or forecasted by the forward-looking statements include risks associated with general business, economic, competitive, political and social uncertainties; risks associated with changes in project parameters as plans continue to be refined; risks associated with failure of plant, equipment or processes to operate as anticipated; risks associated with accidents or labor disputes; risks associated in delays in obtaining governmental approvals or financing, or in the completion of development or construction activities; risks associated with financial leverage and the availability of capital; risks associated with the price of commodities and the inability of our Company to control commodity prices; risks associated with the regulatory environment within which our Company operates; risks associated with litigation including the availability of insurance; and risks posed by competition. These and other factors could cause actual results or outcomes to differ materially from the results expressed, implied or forecasted by the forward looking statements.
Some of the forward-looking statements may be considered to be financial outlooks for purposes of applicable securities legislation including, but not limited to, statements concerning capital expenditures. These financial outlooks are presented to allow the Company to benchmark the results of our Company’s Plastic2Oil business. These financial outlooks may not be appropriate for other purposes and readers should not assume they would be achieved.
Our Company does not intend to, and the Company disclaims any obligation to, update any forward-looking statements (including any financial outlooks), whether written or oral, or whether as a result of new information, future events or otherwise, except as required by law.
Unless otherwise noted, references in this Report to “P2O”, the “Company,” “we,” “our” or “us” means Plastic2Oil, Inc., a Nevada corporation
| 3 |
GLOSSARY OF TECHNICAL TERMS
In this filing, the technical terms, phrases, and abbreviations set forth below have the following meanings:
“ASTM” means American Society for Testing and Materials, the entity responsible for the development and delivery of international voluntary consensus standards.
“distillate” means a product derived from petroleum-based hydrocarbons.
“Fuel Oil” means various ranges of Number 1 to 6 fuels distilled from crude oil, or in P2O’s case, distilled from plastic;
“Fuel Oil No. 2” means a distillate heating oil similar to diesel fuel with the same cetane number, or measurement of combustibility quality, as diesel fuel. This is generally obtained in the crude oil distillation process from the lighter cuts of crude oil. In our process, it is the second fuel made in the conversion from plastic to oil;
“Fuel Oil No. 6” means a high viscosity residual oil that requires preheating to 104 – 127 degree Celsius. It is generally the material remaining after the more valuable cuts of crude oil have been boiled off. In our process, it is the first fuel made in the conversion from plastic to oil;
“hydrocarbon” means an organic compound consisting entirely of hydrogen and carbon;
“MACT” means Maximum Achievable Control Technology, which are various degrees of emissions reductions that the EPA determines to be achievable;
“Naphtha” means a flammable liquid mixture of hydrocarbons covering the lightest and most volatile fraction of the liquid hydrocarbons in petroleum with a boiling range of 60 to 200 degrees Celsius. In our process, it is the last liquid fuel made in the conversion from plastic to oil;
“NESHAP” means the National Emissions Standards for Hazardous Pollutants which are emissions standards set by the EPA for an air pollutant that may cause an increase in fatalities or in serious irreversible and incapacitating illnesses.
“Stack Test” means a procedure for sampling a gas stream from a single sampling location at a facility, used to determine a pollutant emission rate, concentration or parameter while the facility equipment is operating at conditions that result in the measurement of the highest emission values approved by regulatory authorities.
“tipping fees” means the charge levied on a given quantity of waste received at a landfill, recycling center or waste transfer facility.
| 4 |
Overview
We are a technology development and licensing company. We have developed technology that converts waste plastic into ultra-clean, ultra-low sulphur fuel products through our proprietary plastic-to-oil, or P20, process. We have constructed several fully operational P2O processors to demonstrate our technology and process to potential customers. Previously, our business model was the sale of fuel produced from our own P2O processors and subsequently we sought to manufacture P2O processors for sale to commercial customers. These prior experiences allowed the Company to hone and solidify its technology, however, the attendant capital requirements management were significant. For this and other reasons, management shifted its business strategy to technology development and licensing model. We no longer produce and market fuel for sale and no longer manufacture processors ourselves, instead we rely on third party manufactures. Under our current business model, we seek to license our technology to companies that generate significant waste plastics and desire to have a P2O processor on site to convert the plastics to useable fuel for their operations. We charge our customer for the P2O processor and related equipment, a royalty fee based on the amount of fuel generated, a license fee for the use of our proprietary catalyst, and a set up and service fee.
We provide environmentally-friendly solutions through our processors and technologies. Our primary offering is our Plastic2Oil®, or P2O®, solution, which is our proprietary process that converts waste plastic into fuel through a series of chemical reactions (our “P2O business”). We are able to collect mainly mixed plastics from commercial and industrial enterprises that generate large amounts of waste plastic for use in our process. Generally, this waste plastic would otherwise be sent to landfills and its disposal potentially can be quite costly for companies. We are able to use this waste plastic as feedstock to produce Fuel Oil No. 2, Naphtha, and Fuel Oil No. 6 for various uses by our customers. The fuels that our P2O processors produce can be sold through two main distribution channels, fuel wholesalers and directly to commercial and industrial end-users.
At April 2, 2018, we had three fully-permitted, P2O processors at our Niagara Falls, NY facility and have the capability to produce and store the fuels at, and ship from, such facility. However, it is our strategy to license our P2O technology and know-how to license partners for their use in producing fuel for their own operations directly from the waste plastics that such licensees generate from their own operations.
Of our three P2O processors, one is dedicated to research and development and two dedicated to fuel production during pilot runs for customer demonstration. We have components for two additional processors, Nos. 4 and 5, which are in process of assembly for future sale. For the reasons described in Item 7, Management’s Discussion and Analysis of Financial Condition and Results of Operations, our three P2O processors have been idle since late December 2013 and assembly of processors #4 and #5 was suspended. In light of the change in our business model, management has determined that it only requires an operational processor to demonstrate the Company’s technology. Thus, our processors are likely to remain idle or incomplete, as applicable.
For financial reporting purposes, we operate in two business segments, (i) our P2O business, which manufactures and sells processors, and sells fuel produced by our processors and (ii) data storage and recovery (the “Data Business”). As part of our P2O business segment, we began to offer for sale built-to-order P2O processors for use at a customer’s site. Previously, we operated a chemical processing and cleaning business, known as Pak-It and a retail and wholesale distribution business known as Javaco, Inc. As of December 31, 2012, we had exited both of these businesses and their results in all periods presented are classified as discontinued operations. As of March 2, 2018, we exited the Data Business. We anticipate that our P2O business will account for a majority of our revenues in 2018 and periods thereafter. In the year ended December 31, 2017, we had no sales. In the year ended December 31, 2016, we had total sales of approximately $21,950, of which $0 were derived from our P2O business and $21,950 were derived from our Data Business.
We conduct our P2O business at our facilities located in Niagara Falls, New York. Our corporate address is 20 Iroquois Street, Niagara Falls, NY 14303.
| 5 |
Organizational History
We were incorporated on April 20, 2006 under the laws of the State of Nevada under the name 310 Holdings Inc. (“310”). On April 24, 2009, the Company’s founder, former CEO and Chief of Technology, John Bordynuik, purchased 63% of the issued and outstanding shares of 310 and became our chairman and chief executive officer. On June 25, 2009, we purchased certain assets from John Bordynuik, Inc., a corporation founded by Mr. Bordynuik. The assets acquired included tape drives, computer hardware, servers and a mobile data recovery container to read and transfer data from magnetic tapes. From inception until August 2009, we were a shell company within the meaning of the rules of the Securities and Exchange Commission. On August 24, 2009, we acquired all of the outstanding shares of Javaco, Inc., a wholly owned subsidiary of Domark International, Inc. On September 30, 2009, we acquired 100% of the issued and outstanding equity interests of Pak-It, LLC. We formed JBI (Canada) Inc. on February 9, 2010 for purposes of distributing Pak-It products in Canada. We formed Plastic2Oil of NY, #1, LLC on May 4, 2010, for the development and commercialization of our Plastic2Oil business in Niagara Falls, NY.
On October 5, 2009, we changed our corporate name to JBI, Inc.
On August 24, 2009, the Company acquired Javaco, Inc. (“Javaco”), a distributor of electronic components, including home theater and audio video products. On July 9, 2012, we announced the closure of our Javaco operations and sold substantially all of its assets to an unrelated third party. In July 2012, the Company closed Javaco and sold substantially all its inventory and fixed assets. There were no operations in Javaco during 2016 and the remaining liabilities have been classified as discontinued operations for all periods presented (See Note 16).
In September 2009, the Company acquired Pak-It, LLC (“Pak-It”). Pak-It operated a bulk chemical processing, mixing, and packaging facility. It also developed and patented a delivery system that packages condensed cleaners in small water-soluble packages. . On February 10, 2012, we sold substantially all the assets of Pak-It. There were no operations in Pak-It during 2016, and the remaining liabilities were classified as discontinued operations for all periods presented (See Note 16).
In December 2010, the Company entered into a twenty year lease for a recycling facility in Thorold, Ontario. During the period ended December 31, 2013, the Company determined that it would no longer operate the facility and shut down all operations. The assets and operations related to the recycling facility have been reclassified as discontinued operations for all periods presented (See Note 16 to the Consolidated Financial Statements included herein). The property was vacated on November 10, 2015 and the lease was terminated on January 15, 2016 effective October 31, 2015.
On July 31, 2014, we changed our corporate name to Plastic2Oil, Inc. On January 6, 2015, we changed the names of our two Canadian subsidiaries from JBI (Canada) Inc. to Plastic2Oil (Canada), Inc., and from JBI RE ONE, Inc. to Plastic2Oil RE ONE, Inc.
On March 2, 2018, we sold the Data Business. There were no operations in the Data Business during 2017.
Our common stock is quoted on the OTCQB Market under the symbol “PTOI”.
| 6 |
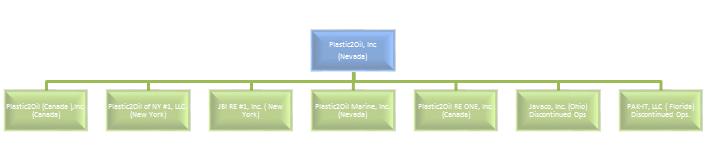
Organizational Chart
The following chart outlines our corporate structure, as of April 2, 2018, and identifies the jurisdiction of organization of each of our material subsidiaries. Each material subsidiary is wholly-owned by the company.
| 7 |
| Plastic2Oil, Inc. | - | Operates our Data Recovery and Migration business and Parent company with corporate office in Niagara Falls, NY. |
| Plastic2Oil of NY #1, LLC | - | Operates our P2O business in Niagara Falls, NY. |
| Plastic2Oil (Canada) Inc. | - | Conducts our P2O business in Canada, including management of our idle Ontario, Canada fuel blending site. |
| JBI RE#1, Inc. | Real Estate holding subsidiary operating out of the Niagara Fall, NY | |
| Plastic2Oil RE ONE, Inc. | Real Estate subsidiary operating out of Ontario, Canada |
P2O Overview
We are a technology development and licensing company. We have developed technology that converts waste plastic into ultra-clean, ultra-low sulphur fuel products through our proprietary plastic-to-oil, or P20, process. We have constructed several fully operational P2O processors to demonstrate our technology and process to potential customers. Previously, our business model was the sale of fuel produced from our own P2O processors and subsequently we sought to manufacture P2O processors for sale to commercial customers. These prior experiences allowed the Company to hone and solidify its technology, however, the attendant capital requirements management were significant. For this and other reasons, management shifted its business strategy to technology development and licensing model. We no longer produce and market fuel for sale and no longer manufacture processors ourselves, instead we rely on third party manufactures. Under our current business model, we seek to license our technology to companies that generate significant waste plastics and desire to have a P2O processor on site to convert the plastics to useable fuel for their operations. We charge the company for the P2O equipment, a royalty fee based on the amount of fuel generated, a license fee for the use of our proprietary catalyst, and a set up and service fee.
We provide environmentally-friendly solutions through our processors and technologies. Our primary offering is our Plastic2Oil®, or P2O®, solution, which is our proprietary process that converts waste plastic into fuel through a series of chemical reactions (our “P2O business”). We are able to collect mainly mixed plastics from commercial and industrial enterprises that generate large amounts of waste plastic for use in our process. Generally, this waste plastic would otherwise be sent to landfills and its disposal potentially can be quite costly for companies. We are able to use this waste plastic as feedstock to produce Fuel Oil No. 2, Naphtha, and Fuel Oil No. 6 for various uses by our customers. Fuels our P2O processors produce can be sold through two main distribution channels, fuel wholesalers and directly to commercial and industrial end-users.
During the years ended December 31, 2017 and 2016, neither manufacturing nor sales activity took place. We plan to grow mainly from sale of P2O equipment, a royalty fee based on the amount of fuel generated, a license fee for the use of our proprietary catalyst, and a set up and service fee. We continue seeking opportunities to execute on our business strategy with the goal of becoming a leading North American company whose technology transforms waste plastic into ultra-clean, ultra-low sulphur fuel. We have years of operating data and have solved numerous challenges that vexed the plastics-to-oil industry. Since inception we have produced approximately 670,000 gallons of fuel. Our P2O processors have evolved into a modular solution with the completion of our third P2O processor in 2013. We use third party contract manufacturers to supply us with many of the key modular components of our processors, including the kilns, distillation towers and other key components that require specialized machining and fabrication.
Our proprietary P2O process converts waste plastic into fuel through a series of chemical reactions. We developed this process in 2009 and began very limited commercial production in 2010 following our receipt of a consent order from the New York State Department of Environmental Conservation (“NYSDEC”) allowing us to commercially operate our first large-scale P2O processor at our Niagara Falls, New York facility. Currently, we have three fully-permitted P2O processors, which are capable of producing Naphtha, Fuel Oil No. 2 and Fuel Oil No. 6, all of which are fuels produced to the specifications published by ASTM. One fully-permitted P2O processor is dedicated to research and development activities. We have components for two additional processors at an outside vendor, which were impaired in the 4th quarter of 2016. Our P2O process is capable of producing two by-products, an off-gas similar to natural gas and a petcoke carbon residue. In instances when we produce and sell fuel products, we primarily use our off-gas product in our operations to fuel the burners in our P2O processors. Historically, we have sold our fuel products through two main distribution channels comprised of fuel wholesalers and directly to commercial and industrial end-users.
| 8 |
We shut down our fuel production late in the fourth quarter of 2013 due to severe cold weather that caused damage to condensers and other components of our processors and we have not resumed fuel production due to the repair costs as well as our shift in strategy toward manufacturing processors for sale, as opposed to producing and selling fuel products. Management estimates that the repair of the processors will require the expenditure of between $275,000 and $300,000. An additional $500,000 of startup working capital will be required to resume operations mainly for hiring operational personnel and incremental overhead expenses. At April 2, 2018, we lacked the working capital or access to bank credit to make these repairs. We are reviewing our financing options, including the sale of shares of our common stock or other securities, in order to allow us to obtain sufficient funds to make the required repairs and resume pilot operation of our processors to support processor sales. These processors were idle for all of 2017 and 2016. Management currently anticipates that the processors will remain idle other than pilot, or demo runs to support processor sales. During the idle period, we have significantly reduced our headcount by furloughing our operations personnel but retained a small team to perform general repairs and maintenance on the processors. Once the processors are fully operational, we expect a small increase in our headcount in order to resume fuel production for pilot or demo purposes.
Our P2O process accepts mainly unsorted, unwashed waste plastics. We believe our P2O process offers a cost-effective solution for businesses that currently have to pay to dispose of these types of waste. Although many sources of plastic waste are available, we have focused our feedstock sources on primarily post-commercial and industrial waste plastic. Generally, we believe that this waste stream is more costly for companies to dispose of, making it more readily available in large quantities and cheaper for us to acquire than other potential types of feedstock.
Currently, we understand that there are several plastic-to-oil processes operational globally. These other processes employ a wide range of technologies and yield varying purities of fuel output. We believe that our process has many advantages over many other commercially available processes in that our P2O solution requires a comparatively less initial capital investment and yields high-quality, ultra-low sulphur fuel, with no need for further refinement. Additionally, our process uses comparatively little energy and physical space, which, in our view, makes it well suited for high-volume production and expansion to multiple sites.
P2O Process and Operations
Our patent-pending P2O conversion process involves the cracking of the plastic hydrocarbon chains at ambient pressure and comparatively low temperature using a catalyst. There are various processes in existence for converting plastic and other hydrocarbon materials into products for use in the production of fuels, chemicals and recycled items. These processes include: pyrolysis (conversion using dry materials at high pressure and temperature in the absence of oxygen), catalytic conversion (conversion using a catalyst for stimulating a chemical reaction), depolymerization (conversion using superheated water and high pressure and temperature) and gasification (conversion at high temperature using oxygen or steam).
We have developed our P2O processors with the ability to be continuously running, energy-efficient and environmentally-friendly while converting waste plastics into end-user ready, and ultra-clean, ultra-low sulfur fuels. The processors are periodically shut-down for maintenance and residue removal during operations. The fuels produced can be used directly by our customers without further refining or processing. Over a three year development period from 2009-2012, we scaled our processing operations from a one gallon processor to three processors, each permitted to feed up to 4,000 pounds of feedstock per hour. In prior years, some of the milestones that we have reached include:
| ● | Manufacturing and operating multiple processors at our Niagara Falls, NY site; | |
| ● | From inception, the processors were designed with safety and green emissions as top priorities; | |
| ● | Standardization and modularization of the components of our processors; | |
| ● | Ability to continuously feed waste plastic 24 hours a day; | |
| ● | Approximately 86% of waste plastic by weight is converted to liquid fuel conversion; | |
| ● | Approximately 8% of waste plastic by weight is converted to gas and is used to fuel the process; | |
| ● | Operating at atmospheric pressure, not susceptible to pinhole leaks and other problems with pressure and vacuum-based systems; |
| 9 |
| ● | No requirement for incinerators, thermal oxidizers or scrubbers and no stack monitoring is necessary; | |
| ● | Three stack tests (two on the initial processor and one on the second processor) conducted by Conestoga-Rovers & Associates (“CRA”), prove emissions are extremely low; | |
| ● | Process validation by SAIC Energy, Environment & Infrastructure, LLC and IsleChem, LLC; and | |
| ● | Permitted to operate three processors commercially in New York by the NYSDEC. |
Processor Input
Waste Plastics: We are able to feed mainly mixed unwashed waste plastics into the Plastic2Oil processors. Waste plastic is widely available and we are focused on maximizing the types and densities of the plastic we procure for optimal processor performance.
Heat Transfer Fluid: We are also able to include hydrocarbon based transfer fluid as feed into the P2O processors.
Processor Output
We are currently permitted to feed two tons, or 4,000 pounds, of waste plastic per hour into each processor by a continuous conveyor belt where it is heated by a burner that mainly burns off-gases produced from the P2O process. Plastic hydrocarbons are cracked into various shorter hydrocarbon chains and exit in a gaseous state. Any residue, metals and or non-usable substances remain in the reactor and are periodically removed. Through our proprietary process, Fuel Oil No. 6, Fuel Oil No. 2, and Naphtha are condensed from the reactor through the remainder of the process. The fuel output is then transferred to storage tanks automatically by the system. Our process is mainly operated by an automated computer system that controls the conveyor feed rate, system temperatures, off-gas systems and the pumping out of newly created fuel to storage tanks. The plastic to liquid fuel conversion is approximately 86% by weight. Therefore, twenty tons of plastic can be processed into approximately 4,100 gallons of fuel. At April 2, 2018, we had three processors at our Niagara Falls, NY facility. One processor was dedicated to research and development and all three processors remained idle due to maintenance and repair issues.
Fuel Produced: The fuel produced in our processors is ultra-low sulfur fuel and is ready for end-users without the need for further refinement.
Off-gas: Approximately 8-10% of waste plastics fed into the processors are converted to a mixture of hydrogen, methane, ethane, butane and propane gas, which we call “off-gas”. Once our processors are in a state to begin the P2O process, they use their own off-gas to fuel the burners in the process.
Residue: There is approximately 2-4% residue from our process, which is petroleum coke or carbon black (which we call “petcoke”) that needs to be removed on a periodic basis.
Feedstock
Our P2O process primarily uses post-commercial and industrial waste plastic that might otherwise be sent to a landfill by the commercial and industrial producers of such waste plastic. We believe that this can be costly for these producers due to the large volumes of plastic waste that they generate. As such, our business model is premised on the processor’s ability to accept numerous types of waste plastics from such sources at a relatively low cost. We believe that our processor ability to accept mainly mixed, unwashed waste plastics is a significant advantage of our P2O process compared to similar operations in our industry.
Fuel Products
Our P2O process makes both light and heavy fuel products which are Naphtha, Fuel Oil No. 2 and Fuel Oil No. 6, as defined by ASTM. Our process also generates two main by-products, a reusable off-gas similar to natural gas and a carbon residue known as petcoke.
| 10 |
Naphtha is a very light fuel product that is used as a cutting component for both high and regular grade gasoline. Fuel Oil No. 2 is a mid-range fuel commonly known as diesel and has numerous transportation, manufacturing and industrial uses. Fuel Oil No. 6 is a heavy fuel generally used in industrial boilers and ships. Our process produces high quality, ultra-low sulphur fuels, without the need for further refinement which enables fuel sales directly from the processors to the end-user.
The reusable off-gas that is produced by the P2O process is used to fuel the burner that heats the entire processor.
P2O Facilities
We currently have one main facility (located in Niagara Falls, NY) that we use in our P2O business, as well as a second facility, our fuel blending site (located in Thorold, Canada), for use in the future. These are briefly described below. Additional information on our properties can be found in Item 2 of this report.
Niagara Falls, NY facility: Our Niagara Falls, NY facility currently has two buildings, a 10,000 square foot building that currently houses one commercial-scale P2O processor and one P2O processor devoted to research and development activities, and a 7,200 square foot building housing the third commercial-scale P2O processor. Our Niagara Falls operations are situated on eight acres that can accommodate expansion of our operations. This facility also serves as the center of our research and development operations and our administrative offices.
Blending Site: We own a 250,000 gallon fuel-blending facility in Thorold, Ontario, Canada, which, when in use, would allow us to blend and self-certify certain fuels that are produced from our process to meet government specifications.
Sales and Distribution
Our P2O business is a commercial manufacturing and production business. We plan to grow mainly from sale of processors first, and fuel seller secondly.
Historically, we have sold our fuel products through two main channels: fuel brokers and direct to end-users. During the years ended December 31, 2017 and 2016, we had no fuel sales.
Suppliers
The principal goods that we require for our P2O business are the waste plastic that we use as feedstock for production of our fuels. We collect waste plastics from commercial and industrial businesses that generate large amounts of this waste stream. As of April 2, 2018, we had approximately 327,000 pounds of waste plastic and approximately 10,000 gallons of heat transfer fluid available in inventory as feedstock for operations once operations are resumed.
We also rely on third party manufacturers for the manufacture of many components of our processors, including kilns and distillation towers.
During the years ended December 31, 2017 and 2016, two and four suppliers, respectively, accounted for 34.3% and 28.3% of accounts payable, respectively.
Licenses, Permits and Testing
We maintain the following permits and licenses in connection with the operation of our P2O business.
| 11 |
| License/Permit | Issuing Authority | Registration Number | Issue date | |||
| Air Permit | NYSDEC | 9-2911-00348/00002 | 06/30/2017(Annual) | |||
| Solid Waste Permit | NYSDEC | 9-2911-00348/00003 | 06/30/2017(Annual) | |||
| Bulk Fuel Blending License | Ontario Technical Standards & Safety Authority | 000184322 | 10/12/2017(Annual) | |||
| Waste Disposal Site | Ontario Ministry of the Environment | A121029 | Perpetual (subject to annual reviews) |
In 2010, our P2O process and processors were tested by IsleChem, LLC, an independent chemical firm providing contract research and development, manufacturing and scale-up services, using two small prototypes of our P2O processor. The IsleChem test results indicated that our process is both repeatable and scalable. Following this testing, we assembled a large-scale P2O processor capable of processing at least 20 metric tons of plastic per day. In September 2010, we had a Stack Test performed by Conestoga-Rovers & Associates (“CRA”), an independent engineering and consulting firm, which concluded that, with a feed rate of 2,000 pounds of plastic per hour, our processor’s emissions were below the maximum emissions levels allowed by the NYSDEC simple air permit, which is needed to commercially operate the P2O processor at that location. We used the CRA test results to apply for the required operating permits and in June 2011 we received an Air State Facility Permit (“Air Permit”) and Solid Waste Management Permit (“Solid Waste Permit”) for up to three processors at the Niagara Falls, NY facility. In December 2011, we had a second stack test performed by CRA for an increased rate of 4,000 pounds per hour. In January 2012, we received a final emissions report from CRA confirming that emissions were considerably decreased with an increased feed rate. In December 2012, we had a stack test performed on the second processor.
The emissions tests conducted by CRA on our processors are summarized in the following table:
| Emissions | Units1 | Original Stack Test (2010) – Processor #1 | Final
Stack Test (Dec. 2011) – Processor #1 | Stack
Test (Dec. 2012) – Processor #2 | ||||||||||
| CO – Carbon Monoxide | ppm | 3.16 | 3.1 | 3.7 | ||||||||||
| SO 2 - Sulphur Dioxide | ppm | 0.23 | 0.02 | 0.39 | ||||||||||
| NOx – Oxides of Nitrogen | ppm | 86.4 | 15.1 | 21.3 | ||||||||||
| TNMHC – Total Non-Methane Hydrocarbons | ppm | 0.25 | 3.92 | 0.62 | ||||||||||
| PM – Particulate Matter | Lbs./hr. | 0.016 | 0.002 | 0.012 | ||||||||||
| Hexane | Lbs./hr. | Not tested | 0.00001 | 0.0013 | ||||||||||
1 “ppm” means parts per million
Industry Background
Alternative fuels are generally considered to be any substances that can be used as fuel, other than conventional fossil fuels such as naturally occurring oil, gas and coal. There have been many approaches taken to producing alternative fuels, including conversion of corn oil, vegetable oil and non-food-based materials. These approaches have demonstrated varying degrees of commercial potential. Some of the challenges that alternative fuel producers have faced include high feedstock supply costs, lower perceived value of fuel product, higher capital costs and dependence on government regulations for economic viabilities. We believe our company is distinguishable from other producers of alternative or renewable fuels because our P2O solution represents a process and product that is commercially viable and designed to provide immediate benefit for industries, communities and government organizations with waste plastic recycling challenges. Our business model is premised on the need for a more efficient and cost-effective alternative to disposing of waste plastic in jurisdictions where the cost of transporting and landfilling large amounts of plastic is quite costly.
| 12 |
Competition
Our P2O business has elements of both a recycling business and a fuel refiner/ production business, which makes it difficult to identify and make direct comparisons to competitors. Both the recycling and energy sectors are characterized by rapid technological change. Our future success will depend on our ability to achieve and maintain a competitive position with respect to technological advances in both of these sectors. We believe that our business currently faces competition in the plastics-to-energy market, including competition from PK Clean, Green Envirotec Holdings LLC, Vadaxx and RES polyflow, each of which has developed alternative methods for obtaining and generating fuel from plastics. Because P2O solution end products include a variety of fuels, we also face competition from the broader petroleum industry.
Business Model
We believe that our business model provides a unique proposition for both the “supply side” and the “end-user” side of the waste-to-fuel value chain. Our P2O technology is positioned to link these two sides by offering economic incentives in both directions. We believe P2O offers value to suppliers of waste plastic by saving transport and landfill tipping fees, and value to fuel end-users by providing ultra-low sulphur green fuel. Given these incentives, we believe that our business will be sought after by those industries that can benefit from the added value that we provide, thus allowing the potential for our company’s growth through sale and license of our technology and equipment.
Business Strategy
Under our current business model, we seek to license our technology to companies that generate significant waste plastics and desire to have a P2O processor on site to convert the plastics to useable fuel for their operations. Our target customers for our processors are private companies and municipalities in the recycling industry who can operate on a commercial scale.We charge the company for the P2O equipment, a royalty fee based on the amount of fuel generated, a license fee for the use of our proprietary catalyst, and a set up and service fee. In light of the change in our business model, management has determined that it only requires an operational processor to demonstrate the Company’s technology. Thus, our processors are likely to remain idle or incomplete, as applicable The key elements of our strategy to achieve this goal are as follows:
Marketing Strategy
We target post-commercial and industrial waste plastic partners. We believe this allows us to identify sources of large plastic waste streams, such as industrial sites and material recovery facilities and recycling centers. We also seek to partner with businesses and municipalities that collect waste plastics. Our vision is to help redirect these waste plastic streams, preventing them from entering landfills.
Manufacturing and Procurement Strategy
Our P2O business model allows us to simultaneously pursue sales to multiple commercial opportunities (partners) across the waste plastic and fuel markets. Our P2O processors have evolved to be modular solutions with the completion of processor #3 in 2013. We use third party contract manufacturers for the manufacture of many of the key modular components of our processors, including the kilns, distillation towers as well as other key components that require specialized machining and fabrication. We will license our P2O technology, including construction operation and maintenance of processors for operation at our partners’ sites. Our strategy is to have our partners construct clusters of P2O processors at sources of large plastic waste streams, such as industrial sites, material recovery facilities and recycling centers.
| 13 |
Competitive Strengths
We believe that our competitive strengths are as follows:
Our processors convert unwashed waste plastics into “in specification fuels” ready for use by the end-user customer. Our process does not generate any waste water. The fuel is Halide-free and there is no further need for refinement. The process does not produce any hazardous waste.
In addition to producing fuel, our P2O solution simultaneously addresses the problem of disposing of waste plastic. We offer an alternative to disposing of waste plastic in a landfill. Our processors can accept mainly mixed, unwashed plastic feedstock. In the United States and Canada, a substantial amount of plastic is currently considered waste and is disposed of in landfills, resulting in tipping fees levied by the landfill or other waste disposal facility fees. We believe that the current low landfill diversion rates for waste plastic in the United States and Canada, together with the costs of transporting and disposing of plastic in bulk, present a significant opportunity to provide an alternative to conventional recycling and waste disposal.
The P2O process provides a highly efficient means of converting plastic into fuel. Our proprietary P2O process and catalyst provide a highly efficient means of converting plastic into fuel. Our business model depends on us being able to provide both a cost-competitive means of disposing of waste plastic and an efficient and non-energy intensive means of producing fuel. Our process requires comparatively minimal electricity to operate, and the energy balance of the process is positive, meaning that more energy can be produced than is consumed by the process.
Low capital costs and small footprint. We have designed the processors with a modular design with standardized components, making construction of our processors relatively simple and cost effective. We have designed our processors to take up approximately 3,000 square feet of space, giving the processors a relatively small footprint. We believe that this design facilitates the construction and operation of multiple processors on a single site. We estimate that the costs of constructing our processors on industrial partner sites will be substantially less than the cost of constructing waste-to-fuel facilities offered by our competitors.
Lower emissions
In the United States, businesses and other producers of emissions are subject to various regulatory requirements, including the National Emission Standards for Hazardous Air Pollutants, or “NESHAP.” These emission standards may be established according to Maximum Achievable Control Technology requirements set by the EPA, often referred to as “MACT standards”. MACT standards apply to a number of sources of emissions, including operators of boilers, process heaters and certain solid waste incinerators. Because our P2O fuel products have ultra-low sulphur content, we believe that our P2O fuel can assist industrial partners with meeting MACT requirements through reduced hazardous emissions.
Our processors produce fuels that have very low sulphur content, which allows the end-user to potentially lower the emissions generated by its operations while using our fuels. These lower emissions potentially could save the end-user from expensive environmental compliance costs, stemming from such initiatives as the NESHAP regulations and more specifically the MACT standards for each pollution source.
Validation of repeatability and scalability of P2O processors.
Our P2O business has been validated for repeatability and scalability by extensive testing by our customers and multiple independent tests by outside consultants and third party laboratories.
| 14 |
Other Businesses
Data Recovery & Migration
In June 2009, we purchased certain assets from John Bordynuik, Inc., a corporation founded by John Bordynuik, our former Chief Executive Officer and former Chief of Technology and who now serves as a consultant to the company. The assets acquired from John Bordynuik, Inc. included tape drives, computer hardware, servers and a mobile data recovery lab to read and transfer data from magnetic tapes and these assets are used in our Data Recovery & Migration business.
Magnetic tapes were previously a primary media for data storage. Because of its cost effectiveness, magnetic tape was widely used by government, scientific, educational and commercial organizations for decades. Over time, these tapes can become vulnerable to deterioration when exposed to natural elements, which can render the tapes difficult to read or unreadable using the original tape-reading equipment. Our Data Business involves reading old magnetic tapes, interpreting and restoring the data where necessary and transferring the recovered data to storage formats used in current systems. The recovered data is verified for accuracy and returned to customers in the media storage format of their choice. Our process gives customers the ability to conveniently catalogue and safely archive difficult-to-retrieve data on readily accessible, contemporary storage media. Users of these services generally include businesses or organizations that have historically stored information on magnetic tape, such as government agencies, oil and gas companies and academic institutions.
The process for data recovery was developed and is very highly dependent on the services of Mr. Bordynuik. The Data Business’s reliance on Mr. Bordynuik was a key driver to achieving revenue in 2016. On March 2, 2018 the Data Business including the U.S. patent related to our Data Business was sold to 2335524Ontario Inc., a company owned by Mr. Bordynuik. (See note 17)
Intellectual Property
To ensure the protection of our proprietary technology, we have applied for patent protection for both the P2O process and P2O processor. As of April 2, 2018, we have pending two United States and one Canadian applications. A lack of patent protection could have a material adverse effect on our ability to gain a competitive advantage for our process and processors, since it is possible that our competitors may be able to duplicate the P2O process for their own purposes. We also rely on our trade secrets to provide protection from portions of our process and proprietary catalyst.
We also hold a U.S. patent relating to our Data Business for the recovery of tape information. This was sold to 2335524Ontario Inc. on March 2, 2018.
We also hold three United States trade marks and are as follows:
(1) The standard character mark P2O®
(2)
Miscellaneous design
(3) The standard character mark Plastic2Oil®
| 15 |
Research and Development
Given our strategic focus on developing our P2O business, we anticipate that our research and development activities related to our P2O processors and the construction, operation and systems management of those processors will decrease. Specifically, we will seek to increase the operational capabilities and performance of our P2O processors as opportunities arise. Research and development expenditures was $0 in 2017 and 2016.
Employees
As of April 2, 2018, we employed three and one half persons on a full-time equivalent basis, of which one were executive management, one and one half were in finance and administration, one were in operations. None of our employees are subject to a collective bargaining agreement and we believe that our labor relations are good.
Environmental and Other Regulatory Matters
As we seek to further develop and commercialize our P2O business, we will be subject to extensive and frequently developing federal, state, provincial and local laws and regulations, including, but not limited to those relating to emissions requirements, fuel production, fuel transportation, fuel storage, waste management, waste storage, composition of fuels and permitting. Compliance with current and future regulations could increase our operational costs. Management believes that the company is currently in substantial compliance with applicable environmental regulations and permitting.
Our operations require various governmental permits and approvals. We believe that we have obtained, or are in the process of obtaining, all necessary permits and approvals for the operations of our P2O business; however, any of these permits or approvals may be subject to denial, revocation or modification under various circumstances. Failure to obtain or comply with the conditions of permits and approvals or to have the necessary approvals in place may adversely affect our operations and may subject us to penalties.
Company Information
We are a reporting company and file annual, quarterly and current reports, proxy statements and other information with the SEC. You may read and copy these reports, proxy statements and other information at the SEC’s Public Reference Room at 100 F Street N.E., Washington, D.C. 20549. Please call the SEC at 1-800-SEC-0330 or e-mail the SEC at publicinfo@sec.gov for more information on the operation of the public reference room. Our SEC filings are also available at the SEC’s website at http://www.sec.gov. Our Internet address is http://www.plastic2oil.com. There we make available, free of charge, our Annual Reports on Form 10-K, Quarterly Reports on Form 10-Q, Current Reports on Form 8-K, and any amendments to those reports, as soon as reasonably practicable after we electronically file such material with, or furnish such material to, the SEC.
Not Applicable
| 16 |
ITEM 1B. UNRESOLVED STAFF COMMENTS
Not Applicable
The following is a summary of our properties. We believe that these facilities are sufficient to support our research and development, operational, processing and administrative needs under our current operating plan.
1. Corporate Office and Niagara Falls, NY facility
Our Niagara Falls, NY facility currently has two operating buildings, a 10,000 square foot building that currently houses two commercial-scale P2O processors and a 7,200 square foot building that houses one commercial-scale processor of our P2O business and other fabrication equipment and parts relevant to the process. This facility serves as the center of our research and development operations and our corporate and administrative offices and is situated on eight acres of land which we own. We believe that this site is adequate to accommodate further expansion of our operations in the foreseeable future.
2. Fuel Blending Facility
We own approximately six acres of land in Thorold, Ontario, Canada where we have the capability to operate our fuel blending tanks facility with a 250,000 gallon capacity. When active, the idle fuel-blending facility gives us the capability to store, blend,analyze and self-certify the fuels produced from the P2O process. The facility was not in use during 2017 and 2016. We own the property and have no mortgage debt outstanding in relation to this facility.
3. Thorold, Ontario, Canada Office Building
We owned approximately 21,000 square feet in Thorold, Ontario, consisting of 5,000 square feet of office space and 16,000 square feet of warehousing and storage space, which serves as storage for our company as well as offsite IT operations. This property has a mortgage securing approximately $206,910 of debt. On March 31, 2017, the Company sold this land and building located at 1783 Allanport Road, Thorold, Ontario for a gain of approximately $254,000. The proceeds were used towards repayment of the outstanding mortgage, real estate taxes and closing costs. This asset was classified as property plant and equipment, net- held for sale in the consolidated balance sheet at December 31, 2016.
| 17 |
As of December 31, 2017, the Company was involved in litigation and claims which arise from time to time in the normal course of business. In the opinion of management, based upon the information and facts known to them, any liability that may arise from such contingencies would not have a material adverse effect on the consolidated financial statements of the Company.
ITEM 4. MINE SAFETY DISCLOSURES
Not Applicable.
ITEM 5. MARKET FOR THE REGISTRANT’S COMMON EQUITY, RELATED STOCKHOLDER MATTERS AND ISSUER PURCHASES OF EQUITY SECURITIES
Market Information
Our common stock is quoted for trading on the OTCQB under symbol “PTOI”. The following table sets forth, for each of the quarterly periods indicated, the high and low bid prices of our common stock. The prices reflect inter-dealer quotations, do not include retail mark-ups, markdowns or commissions and do not necessarily reflect actual transactions.
| 18 |
| Quarter | High | Low | ||||||
| 2016 | ||||||||
| First Quarter | $ | 0.05 | $ | 0.03 | ||||
| Second Quarter | 0.05 | 0.01 | ||||||
| Third Quarter | 0.03 | 0.01 | ||||||
| Fourth Quarter | 0.04 | 0.01 | ||||||
| 2015 | ||||||||
| First Quarter | $ | 0.06 | $ | 0.02 | ||||
| Second Quarter | 0.05 | 0.03 | ||||||
| Third Quarter | 0.07 | 0.02 | ||||||
| Fourth Quarter | 0.06 | 0.03 | ||||||
Holders
The last sales price of our common stock as reported by the OTC Market on March 29, 2018 was $0.03 per share.
On April 2, 2018, there were 450 holders of record of our common stock, $0.001 par value per share.
As of April 2, 2018, we had issued and outstanding 124,756,158 shares of common stock, $0.001 par value per share.
Dividend Policy
We have never declared or paid any cash dividends on our common stock. For the foreseeable future, we intend to retain any earnings to finance the development and expansion of our business, and we do not anticipate paying any cash dividends on our common stock. Any future determination to pay dividends will be at the discretion of the Board of Directors and will be dependent upon then existing conditions, including our financial condition and results of operations, capital requirements, contractual restrictions, business prospects and other factors that the Board of Directors considers relevant.
Recent Sales of Unregistered Securities
Our sales of unregistered securities have been previously reported in our reports on Forms 8-K and 10-Q filed with the SEC.
| 19 |
Securities Authorized for Issuance under Equity Compensation Plans
The following table sets forth certain information as of December 31, 2017 with respect to equity compensation plans under which the Company’s common stock may be issued.
| Plan Name | Number of securities to be issued upon exercise of outstanding options, warrants and rights | Weighted average exercise price of outstanding options, warrants and rights | Number of securities remaining available for future issuance under equity compensation plans | |||||||||
| Equity Compensation Plans | ||||||||||||
| JBI, Inc. 2012 Long-Term Incentive Plan Approved by Stockholders | 4,380,000 | $ | 1.12 | 4,808,424 | ||||||||
| Equity Compensation Plans not Approved by Stockholders | 2,250,000 | 0.17 | 2,250,000 | |||||||||
Purchases of Equity Securities by the Issuer and Affiliated Purchasers
None.
ITEM 6. SELECTED FINANCIAL DATA
Not Applicable.
ITEM 7. MANAGEMENT’S DISCUSSION AND ANALYSIS OF FINANCIAL CONDITION AND RESULTS OF OPERATIONS
The following management’s discussion and analysis (the “ MD&A “) of the results of operations of the Company should be read in conjunction with the consolidated financial statements of the Company, together with the accompanying notes, as well as other financial information included elsewhere in this Report. This discussion contains forward-looking statements that involve certain risks and uncertainties, and that reflect estimates and assumptions. See the section titled, “Cautionary Statement Regarding Forward-Looking Statements” for more information on forward-looking statements. Our actual results may differ materially from those indicated in forward-looking statements.
Business Overview
For the twelve months ended December 31, 2017 and 2016, the Company has no P2O revenue. The Company’s P2O processors were idle for all of 2016 and 2017. The Company’s data storage and recovery business was idle during the twelve months ended December 31, 2017 and had revenue of $21,950 for the twelve months ended December 31, 2016.
On April 17, 2017, the Company recorded $779,287 to Other Income from the settlement of the Glenny and Maskell lawsuit. Net cash received was $524,010, net of legal expenses.
For financial reporting purposes, we operate in two business segments, (i) our P2O® solution business, which manufactures and sells the fuel produced through our two P2O processors and (ii) data storage and recovery (the “Data Business”). On March 2, 2018, we exited the Data Business; it was sold to 2335524 Ontario Inc. As of this filing date of the report, all three of our fully-permitted P2O processors were idle and not producing fuel products. In light of the change in our business model, management has determined that it only requires an operational processor to demonstrate the Company’s technology. Thus, our processors are likely to remain idle or incomplete, as applicable.
| 20 |
Our P2O business is a technology development and licensing company. We have developed technology that converts waste plastic into ultra-clean, ultra-low sulphur fuel products through our proprietary plastic-to-oil, or P20, process. Under our current business model, we seek to license our technology to companies that generate significant waste plastics and desire to have a P2O processor on site to convert the plastics to useable fuel for their operations. We charge the company for the P2O equipment, a royalty fee based on the amount of fuel generated, a license fee for the use of our proprietary catalyst, and a set up and service fee. We anticipate that this segment will account for substantially all of our revenues in 2018 and beyond. Historically, however, our revenues have been derived primarily from our other segments and products, including those noted above as discontinued operations.
The following table highlights since inception the proceeds from financings, research and development expenditures, investment in property, plant and equipment and fuel produced:
| FY 2009-2013 | FY 2014 | FY 2015 | FY 2016 | FY 2017 | Total | |||||||||||||||||||
| Cash raised | $ | 31,088,110 | $ | 1,705,095 | $ | 25,000 | $ | 600,000 | $ | 0 | $ | 33,418,205 | ||||||||||||
| R&D cost | $ | 2,452,560 | $ | 20,999 | $ | 1,653 | $ | 0 | $ | 0 | $ | 2,475,212 | ||||||||||||
| Investment in property, plant & Equipment | $ | 4,792,433 | $ | 13,775 | $ | 0 | $ | 0 | $ | 0 | $ | 4,806,208 | ||||||||||||
| Fuel produced in gallons | 655,037 | 12,959 | 0 | 0 | 0 | 667,996 | ||||||||||||||||||
Plastic2Oil Business
Under our current business model, we seek to license our technology to companies that generate significant waste plastics and desire to have a P2O processor on site to convert the plastics to useable fuel for their operations. Our target customers for our processors are private companies and municipalities in the recycling industry who can operate on a commercial scale.We charge the company for the P2O equipment, a royalty fee based on the amount of fuel generated, a license fee for the use of our proprietary catalyst, and a set up and service fee. In light of the change in our business model, management has determined that it only requires an operational processor to demonstrate the Company’s technology. Thus, our processors are likely to remain idle or incomplete, as applicable
We believe that our business model provides a unique proposition for both the “supply side” and the “end-user” side of the waste-to-fuel value chain. Our P2O technology is positioned to link these two sides by offering economic incentives in both directions. We believe P2O offers value to suppliers of waste plastic by saving transport and landfill tipping fees, and value to fuel end-users by providing ultra-low sulphur green fuel. Given these incentives, we believe that our business will be sought after by those industries that can benefit from the added value that we provide, thus allowing the potential for our company’s growth through sale of P2O equipment, a royalty fee based on the amount of fuel generated, a license fee for the use of our proprietary catalyst, and a set up and service fee.
Our future success will depend on our ability to achieve and maintain a competitive position with respect to technological advances. We believe that our business currently faces competition in the plastics-to-energy market, including competition from PK Clean, Green Envirotec Holdings LLC, Vadxx and RES polyflow, each of which has developed alternative methods for obtaining and generating fuel from plastics.
| 21 |
Effective as of October 12, 2017 the Company’s Board of Directors increased the number of directors comprising the Board from two to four members and appointed Jason C. Aspin and Lee C. Brain to fill the vacancies created thereby.
In 2017, we substantially reduced the Company’s monthly cash burn rate as a result of actions taken in 2015 and 2016, which resulted in a $281,582 reduction of operating expenses for the twelve months ended December 31, 2017. We continue to monitor our operating expenses closely and exploring every avenue, including the March 31, 2017 sale of vacant land and building we own in Thorold, Canada and also seeking to rent the idle blending facility to a qualified independent operator.
Our 2017 and 2016 financing activities came from cash raised through short-term loans from our CEO, related party strategic investors and non-related party strategic investors. Some of these investors have experience in systems integration and we believe that their engineering and operations experience will be instrumental towards delivery, set-up and sale of the P2O processors through commercials partnerships.
U.S. Patent Application No.: 15/362,102 Titled, SYSTEM AND PROCESS FOR CONVERTING PLASTICS TO PETROLEUM PRODUCTs, was published on March 16, 2017 under Publication No. US 20170073584 and is available on the USPTO website at http://patft.uspto.gov/.
Our P2O sales and marketing program are expected to include direct sales as well as new partnerships. To that end, we made the decision in early 2016 not to further extend our agreement with EcoNavigation LLC as their firm has been unable to conclude processor sales on acceptable terms.
On December 21, 2017, we executed a Master Agreement (the “Master Agreement”) with Veridisyn Technologies, LLC, a company engaged in processing waste plastics (the “Customer”), pursuant to which the Customer agreed to purchase all of its requirements for the catalyst and processors for its plastic-to-oil (P2O) operations from the Company and to license from the Company certain related P2O technology. The Master Agreement was executed pursuant to the Company’s previously disclosed Memorandum of Understanding with a then un-disclosed party.
| 22 |
Under the Master Agreement, the Customer agreed to submit purchase orders for six processors during the first three years of the Master Agreement, two of which shall be ordered within the first one hundred twenty days of executing the Master Agreement. The purchase price of the P2O processors will be $2 million for each of the initial two processors and $3 million for each subsequent processor. In connection with the sale of processors, the Company agreed to provide certain monitoring and technical support services. In addition, as consideration for the non-exclusive license of certain P2O technology, The Customer agreed to pay the Company a royalty fee of 5% of gross sales of fuel products by the Customer or its customers. The Company granted the Customer a right of first refusal to purchase P2O processors for facilities to be developed in certain southern U.S. States. This could lead to purchase of two processors in 2018, although there can be no assurance as negotiations remain ongoing.
Through years of testing and refinement in conjunction with our outside engineering firm, we are considering bringing our flagship processor #3 back online in late 2018. It will be important to be able to demonstrate the commercial viability of this processor by regular (pilot) operations at our Niagara Falls plant to potential customers. Of primary influence to our decision to expand our sales efforts and to bring the flagship processor #3 back on line is our view based on analysis and consultation that oil prices have reached a bottom and could rise and stay above $50 a barrel by the end of the 2018.
While the price of crude is a factor in certain economic analysis pertaining to our processor sales, it is not the only factor. There are significant costs associated with landfill disposal. Financial decisions regarding P2O’s technology are based on the results of models that are tailored specifically to each potential client. These include, but are not limited to, the anticipated life of a processor or cluster, specific configurations of customers’ sites and facilities on hand, and the ability to integrate P2O’s technology into existing operations.
Internal Changes
While our primary focus continues to be on the sale of our disruptive technology, a number of internal operational changes are being considered:
1. Management expects the Niagara Falls plant to provide a source of revenue during its pilot and demo operations. We plan to raise additional outside capital for the restart of flagship processor #3 and we are also considering modifications to our processor #2 in order to improve economies of scale and deliver cash flow.
2. Plastics2Oil owns a fully permitted fuel blending facility in Thorold, Canada. Regional demand justifies bringing the facility back on line with intentions to lease or sell the idle blending facility to a qualified independent operator.
3. P2O will continue to draw support from our loyal shareholder base that includes individuals with impressive business credentials, experience and acumen. In 2016 P2O raised secured debt financing from investors with systems integration and operations experience who can partner with P2O in the delivery, set-up and sale of P2O Processors. Valuable strategic suggestions have been offered and are being evaluated. P2O is also considering making important additions to support the 2018 sales and marketing initiatives. This will require a project management team and P2O may also require an ancillary advisory board.
| 23 |
Data Recovery & Migration Business
On March 2, 2018, the Data Business was sold to 2335524Ontario Inc.
Listing on the OTCQB
On April 2, 2018, we had 124,756,158 shares of common stock issued and outstanding. Our common stock is currently trading on the OTCQB marketplace in the United States of America under the stock ticker symbol “PTOI.” On March 30, 2018, the last trading day prior to the date of this filing, the closing price of the common stock on the OTCQB was $0.0X.
Sources of Revenues and Expenses
Revenues
In 2017, we did not derive revenue from our either P2O business or Data Business.
| 24 |
Cost of Sales
We did not incur cost of sales in 2017 or 2016. Costs of Sales for P2O when operating consist of the following:
| ● | feedstock procurement costs; |
| ● | overhead incurred at our Niagara Falls Facility related to the operation of the processors; and |
| ● | freight costs incurred in shipping of plastics and fuels. |
Costs of sales for our Data Business mainly consist of direct labor costs incurred in reading and interpreting the tape data as well as costs for transferring the tape data to storage media.
Operating Expenses
Operating expenses consist primarily of the following:
| ● | personnel-related costs including employee payroll, payroll taxes, stock based compensation and insurance; |
| ● | plant and processor related costs including repairs and maintenance, processing and welding consumables, safety equipment and related costs; |
| ● | professional fees including legal fees, accounting fees including audit and tax professional costs, certain public company required fees, consulting fees and other professional and administrative costs; |
| ● | insurance costs consisting of pollution, workers compensation, general liability, and directors and officers insurance policies; |
| ● | compliance related costs including environmental consulting fees, stack test and other related testing costs and permitting costs; |
| ● | depreciation expense related to our property plant and equipment; and |
| ● | Impairment expense related to our deposits and property, plant and equipment. |
Other Income (Expense)
In 2017, other income of $87,771 consisted mainly of $935,902 of interest expenses on short-term loans and secured debt,$13,1580 impairment loss of property plant and equipment, $255,676 gain on disposable of the 1783 Allanport Road land and building and $779,287 income from the Glenny and Maskell settlement.
In 2016, other expense of $3,870,189 consisted mainly of our $3,088,314 impairment of deposits, property, plant and equipment, and interest expenses on short term loans and secured debt of $780,675.
Results of Operations – Year ended December 31, 2017 compared to Year ended December 31, 2016
Revenue
As we only recently shifted our business strategy to selling fuel processors, we did not derive any revenue from processor sales in 2017 or 2016. However, we earned revenue from our Data Business through reading and interpreting magnetic tape media. The following table shows a breakdown of our revenues from these sources.
| Revenue | Period Ended December 31, | |||||||||||
| 2017 | 2016 | % Change | ||||||||||
| P2O Revenue | ||||||||||||
| Fuels | $ | - | $ | - | - | % | ||||||
| Total P2O Revenue | - | - | - | % | ||||||||
| Data Business | - | 21,950 | -100.0 | % | ||||||||
| TOTAL REVENUE | $ | - | $ | 21,9508 | -100.0 | % | ||||||
| 25 |
There was no fuel production in the year ended December 31, 2017 and 2016. Consequently, there was neither fuel shipment nor fuel revenue. The lack of fuel revenue for these years was mainly due to management’s decision to shut down its production in the fourth quarter of 2013 due to the severe cold weather that caused damage to condensers and other components of our processors and the lack of operating cash. The damage requires substantial working capital for general repairs and replacement of damaged condensers. These processors were idle for all of 2017 and 2016, and are currently idle.
Cost of Goods Sold & Total Gross Profit
As indicated earlier, we had no fuel produced in 2017 and 2016. The following tables are a breakdown of the costs of goods sold and Total Gross Profit:
| Cost of Good Sold | Periods Ended December 31, | |||||||||||
| 2017 | 2016 | % Change | ||||||||||
| P2O Cost of Goods Sold | ||||||||||||
| Fuels | $ | - | $ | - | - | % | ||||||
| Total P2O Cost of Goods Sold | - | - | - | % | ||||||||
| Data Business Cost of Goods Sold | - | 8,438 | -100.0 | % | ||||||||
| TOTAL COST OF GOODS SOLD | $ | - | $ | 8,438 | -100.0 | % | ||||||
| Gross Profit (Loss) | Periods Ended December 31, | |||||||||||
| 2017 | 2016 | % Change | ||||||||||
| P2O Gross Loss | ||||||||||||
| Fuels | $ | - | $ | - | - | % | ||||||
| Total P2O Gross Loss | - | - | - | % | ||||||||
| Data Business Gross Profit | - | 13,512 | -100.0 | % | ||||||||
| TOTAL GROSS PROFIT | $ | - | $ | 13,512 | -100.0 | % | ||||||
The cost of goods sold related to the Data Business was primarily the direct labor incurred in the reading and interpreting of the magnetic tape data.
Operating Expenses
We incurred operating expenses of $1,561,776 during the year ended December 31, 2017, compared to $1,843,358 for the year ended December 31, 2016. This $281,582 decrease was driven by a $215,958 increase in professional fees (from legal fees incurred in the recovery of $779,287 from the Glenny & Maskell class action suit ), a $30,330 reduction in wages from less full-time equivalent (FTE) employees, $84,923 reduction of additional operational expenses from cost management and $382,287 from reduction in depreciation and accretion expenses. For the years ended December 31, 2017 and 2016 compensation expense includes $163,170 and $120,667 for shares of common stock issued for services. A breakdown of the components of operating expenses for the fiscal years ended December 31, 2017 and 2016, are as follows:
| Operating Expenses | ||||||||
| For the Twelve Months Ended December 31, | ||||||||
| 2017 | 2016 | |||||||
| Selling, General and Administrative expenses | ||||||||
| Professional Fees | $ | 342,458 | $ | 126,500 | ||||
| Compensation | 634,500 | 664,830 | ||||||
| Other | 193,175 | 278,098 | ||||||
| Depreciation & Accretion | 391,643 | 773,930 | ||||||
| Total Operating Expenses | $ | 1,561,776 | $ | 1,843,358 | ||||
| 26 |
Non-Operating Expenses
Interest Expenses
For the year ended December 31, 2017, we incurred net interest expense of $935,902 as compared to $780,675 for the year ended December 31, 2016.
Income Tax Expenses
For the years ended December 31, 2017, and 2016, we had no federal taxable income due to net losses and recorded a deferred tax asset and a valuation allowance to the extent that those assets are attributable to net operating losses. We recognized the valuation allowance because we are unsure as to the ability to use these assets in the near future due to continued operating losses.
For the years ended December 31, 2017 and 2016, we incurred $0 current income tax or future income tax expenses from continuing operations.
Net Loss
We incurred a net loss of $1,474,005 for the year ended December 31, 2017 as compared to a net loss of $5,700,035 for the year ended December 31, 2016. The primary reason for the decrease in net loss were from a $215,958 increase in professional fees (from legal fees incurred in the recovery of $779,287 from the Glenny & Maskell class action suit ), a $30,330 reduction in wages from less full-time equivalent (FTE) employees, $84,923 reduction of additional operational expenses from cost management ,$382,287 from reduction in depreciation and accretion expenses and $$3,075,157 decrease in impairment loss. In 2017, other income of $87,771 consisted mainly of $935,902 of interest expenses on short-term loans and secured debt, a $13,158 impairment loss of property plant and equipment. A $255,676 gain from sale of land and building and a $779,287 income from the settlement of the class action suit. In 2016, other expense of $3,870,189 consisted mainly of our $3,088,314 impairment of deposits, property, plant and equipment, and interest expenses on short term loans and secured debt $780,675.
| 27 |
Liquidity and Capital Resources
We do not have sufficient cash to operate our business which has forced us to suspend our operations until such time as we receive a capital infusion or cash advances on the sale of our processors. We intend to source additional capital through the sale of our equity and debt securities and other financing methods. We plan to use the cash proceeds from any financing to complete the repairs on Processors #3 to resume production of fuels for pilot runs and customer demonstrations. At December 31, 2017, we had a cash balance of $172,286. Our principal sources of liquidity in 2017 was from the sale of the property located at 1783 Allanport Road, Thorold, Ontario, Canada and proceeds from the settlement of the Glenny and Maskell (Canadian Insurance Broker) lawsuit. Our principal sources of liquidity in 2016 were the proceeds from the related party short-term loans from our chief executive officer, and proceeds from the sale of related –party and non-related party secured long –term debt.
As discussed earlier in this MD&A, our processors are currently idle and, thus, we are not producing fuel or generating fuel sales. Furthermore, we have shifted our business strategy to processor sales, rather than fuel sales. Our current cash levels are not sufficient to enable us to make the required repairs to our processors or to execute our business strategy as described in this Report. As a result, we intend to seek significant additional capital through the sale of our equity and debt securities and other financing methods to enable us to make the repairs, to meet ongoing operating costs and reduce existing current liabilities. We also intend to seek to cash advances or deposits under any new processor sale agreements and/or related technology licenses. Management currently anticipates that the processors will remain idle until at least late 2018 and then pilot, or demo, runs for sale of processors. Due to the many factors and uncertainties involved in capital markets transactions, there can be no assurance that we will raise sufficient capital to allow us to resume operations in 2018, or at all. In the interim, we anticipate that our level of operations will continue to be nominal, although we plan to continue to market our P2O processors with the intention of making additional P2O processor sales and technology licenses.
Our limited capital resources and recurring losses from operations raise substantial doubt about our ability to continue as a going concern and may adversely affect our ability to raise additional capital. The financial statements do not include any adjustments that might be necessary if we are unable to continue as a going concern.
The following table provides a comparative summary of our cash flows for the fiscal years ended December 31, 2017 and 2016.
| Cash Flow from Operating Activities | ||||||||
| For
the Twelve Months Ended December 31, | ||||||||
| 2017 | 2016 | |||||||
| Net Loss | (1,474,005 | ) | (5,700,035 | ) | ||||
| Net cash used in operating activities | (184,424 | ) | (830,480 | ) | ||||
| Cash flow from investing activities | ||||||||
| Net cash used in investing activities | (101 | ) | (101 | ) | ||||
| Cash flows from Financing activities: | ||||||||
| Net cash provided by financing activities | 85,913 | 1,082,991 | ||||||
| Cash and cash equivalents at beginning of period | 270,898 | 18,488 | ||||||
| Cash and cash equivalents at end of period | 172,286 | $ | 270,898 | |||||
Cash Flow from Operations
Cash used in operations was $184,424 and $830,480 for the years ended December 31, 2017 and 2016, respectively. In 2017 and 2016 cash was mainly used to continue funding the minimum operating costs. In 2017, the Glenny and Maskell settlement provided cash in the amount of $524,010, net of legal expenses.
Cash Flow from Investing Activities
Cash used in investing was $101 for the years ended December 31, 2017 and 2016 and was attributable to restricted cash.
| 28 |
Cash Flow from Financing Activities
Cash flow from financing activities was $85,913, and $1,082,991, for the years ended December 31, 2017 and 2016, respectively. For 2017 and 2016, these amounts were mainly driven by the proceeds sale of property in Ontario, Canada, Glenny Maskell settlement and amounts received from short-term notes from related parties
Off-Balance Sheet Arrangements
We had no off-balance sheet arrangements in the years ended December 31, 2017 and 2016, other than operating leases, as discussed in Note 8.
Transactions with Related Parties
From June 2014 to December 31, 2017, Mr. Richard Heddle, the Company’s President and Chief Executive Officer, made several personal loans to the company to provide working capital. As of December 31, 2017 and December 31, 2016, the aggregate outstanding balance, including accrued interest at 4% per annum, was 1,969,121 and $1,695,926, respectively. (See Note 6).
From January 2016 to December 31, 2017, Mr. Heddle made several personal loans to the company to provide working capital. At December 31, 2017 and December 31, 2016, the aggregate outstanding balance, including accrued interest at 12% per annum, was $588,651 and $567,402, respectively. (See Note 6).
At December 31, 2017 the Company’s accounts payable and accrued expenses included a $132,217 (adjusted for currency fluctuation) outstanding balance due to Heddle Marine Services, a business controlled by Mr. Heddle. The amounts payable arose from payments made in 2014 by Heddle Marine on behalf of the company to a logistics company to transport fuel from the Niagara Falls site to the blending tanks at our facility in Thorold, Ontario, as well as for labor and material provided by Heddle Marine towards upkeep of our Canadian facilities including 2015 cleanup costs incurred in order to terminate the lease with Avondale properties on the discontinued RRON Operation. In addition, in 2016, $12,500 was paid for feedstock analysis to a business in which Mr. Heddle holds a material financial interest.
On August 24, 2016, the Company issued to Hilander Limited, a business controlled by Mr. Jason Aspin, presently one of the Company’s directors, a $100,000 Secured Promissory Note bearing interest of 12% per annum compounded annually, together with a five-year warrant to purchase up to one hundred thousand shares of the Company’s common stock at an exercise price of $0.12 per share, and payable upon maturity in 2021 and secured by a security interest in substantially all of the assets of the Company and its subsidiaries. On October 12, 2017, Mr. Aspin was appointed a Board member of the Company. As of December 31, 2017 and December 31, 2016, the aggregate outstanding balance, including accrued interest at 12% per annum, was 115,276 and $102,368, respectively. (See Note 6).
On October 18, 2016. the Company issued to Atlantic Advances Power Technologies, a business controlled by Mr. Aspin, a $400,000 Secured Promissory Note bearing interest of 12% per annum compounded annually, together with a five-year warrant to purchase up to four hundred thousand shares of the Company’s common stock at an exercise price of $0.12 per share, and payable upon maturity in 2021 and secured by a security interest in substantially all of the assets of the Company and its subsidiaries. Mr. Aspin was appointed a Board member of Plastic2Oil, Inc. As of December 31, 2017 and December 31, 2016, the aggregate outstanding balance, including accrued interest at 12% per annum, was $443,757 and $389,847, respectively. (See Note 6).
Plastic2Oil Marine, Inc., one of the Company’s subsidiaries, which is currently not operating, entered into a consulting service contract in 2010 with a company owned by Mr. Heddle, who later (in 2014) became the Company’s Chief Executive Officer. The contract provides the related company with a share of the operating income earned from Plastic2Oil technology installed on marine vessels which are owned by the related company. The contract provides a minimum future payment equal to fifty percent of the operating income generated from the operations of two of the most profitable marine vessel processors and 10% from all other marine vessel processors. At December 31, 2017, there were no installed marine vessel processors pursuant to the contract.
Critical Accounting Policies
Basis of Consolidation
The consolidated financial statements include our accounts and the accounts of our wholly-owned subsidiaries, Plastic2Oil (Canada) Inc., JBI CDE Inc., Plastic2OilI Re One Inc., and JBI Re #1 Inc., Plastic2Oil of NY #1, and Plastic2Oil Marine Inc. The results of Javaco and Pak-It are consolidated and classified as discontinued operations for all periods presented. (Note 16) All of our intercompany transactions and balances have been eliminated on consolidation. Amounts in the consolidated financial statements are expressed in U.S. dollars.
Estimates
The preparation of financial statements in conformity with U.S. GAAP requires management to make estimates and assumptions that affect the reported amounts of assets and liabilities, the disclosure of contingent assets and liabilities at the date of the financial statements, and the reported amounts of revenues and expenses during the reporting period. Actual results could differ from these estimates. Significant estimates include amounts for impairment of long-lives assets, share based compensation, asset retirement obligations, inventory obsolescence, accrued liabilities and accounts receivable exposures.
| 29 |
Cash and Cash Equivalents
The Company considers all highly liquid investments with maturities of three months or less at the time of purchase to be cash equivalents.
Restricted Cash
At December 31, 2017 and December 31, 2016 the Company had $100,524 and $100,423, respectively, of restricted cash, which is used to secure a line of credit that secures a performance bond on behalf of the Company. The performance bond is required by the State of New York for fuel distributors in perpetuity.
Accounts Receivable
Accounts receivable represent unsecured obligations due from customers under terms requesting payments upon receipt of invoices up to ninety days, depending on the customer. Accounts receivable are non-interest bearing and are stated at the amounts billed to the customer net of an allowance for uncollectible accounts. Customer balances with invoices over 90 days old are considered delinquent. Payments of accounts receivable are applied to the specific invoices identified on the customer remittance, or if unspecified, are applied to the earliest unpaid invoice.
The allowance for uncollectible accounts reflects management’s best estimate of amounts that may not be collected based on an analysis of the age of receivables and the credit standing of individual customers. The allowance for uncollectible accounts for December 31, 2017 and December 31, 2016 was $0 and $23,785, respectively.
Inventories
Inventories, which consist primarily of plastics, costs to process the plastic and processed fuel are stated at the lower of cost or market. We use an average costing method in determining cost. Inventories are periodically reviewed for use and obsolescence, and adjusted as necessary. As of December 31, 2017 and 2016, reserves for obsolescence were $412,128.
Property Plant and Equipment
Property, Plant and Equipment are recorded at cost. Depreciation is provided using the straight-line method over the estimated useful lives of the various classes of assets as follows:
| Leasehold improvements | lesser of useful life or term of the lease |
| Machinery and office equipment | 3-15 years |
| Furniture and fixtures | 7 years |
| Office and industrial buildings | 25-30 years |
Gains and losses on depreciable assets retired or sold are recognized in the statement of operations in the year of disposal. Repairs and maintenance expenditures are expensed as incurred and expenditures that increase the value or useful life of the asset are capitalized.
Construction in Process
The Company capitalizes customized equipment built to be used in the future day to day operations at cost. Once complete and available for use, the cost for accounting purposes is transferred to property, plant and equipment, where normal depreciation rates are applied.
Impairment of Long-Lived Assets
The Company reviews for impairment of long-lived assets on an asset by asset basis. Impairment is recognized on properties held for use when the expected undiscounted cash flows for a property are less than its carrying amount at which time the property is written-down to fair value. Properties held for sale are recorded at the lower of the carrying amount or the expected sales price less costs to sell. The sale or disposal of a “component of an entity” is treated as discontinued operations. The operating properties sold by the Company typically meet the definition of a component of an entity and as such the revenues and expenses associated with sold properties are reclassified to discontinued operations for all periods presented.
| 30 |
As of December 31, 2017 and 2016, we recorded impairment losses of $13,158 and $3,088,314, respectively. The charge in 2017 relates specifically to the sale of the property at 1783 Allanport Road, Thorold, Ontario, Canada. The charge in 2016 relates specifically to Deposits for Processor #4 and #5, Processor #3 and construction in process parts and spare parts used in Processor #3 and #2 respectively.
Asset Retirement Obligations
The fair value of the estimated asset retirement obligation is recognized in the consolidated balance sheets when identified and a reasonable estimate of fair value can be made. The asset retirement cost, equal to the estimated fair value of the asset retirement obligation, is capitalized as part of the cost of the related long-lived asset. The balance of the asset retirement obligation is determined through an assessment made by the Company’s engineers, of the total costs expected to be incurred by the Company when closing a facility. The total estimated cost is then discounted using the current market rates to determine the present value of the asset as of the date of this valuation. As of the date of the creation of the asset retirement obligation in the amount of $57,530, the Company determined the present value of the obligation using a discount rate equal to 2.96%. The present value of the asset retirement obligation is then capitalized on the consolidated balance sheets and is depreciated over the asset’s estimated useful life and is included in depreciation and accretion expense in the unaudited condensed consolidated statements of operations. Increases in the asset retirement obligation resulting from the passage of time are recorded as accretion of asset retirement obligations in the unaudited condensed consolidated statements of operations. Actual expenditures incurred are charged against the accumulated obligation. The December 31, 2017 and 2016 assessment, amounted to a net increase of $0 and $23,000, respectively. As of December 31, 2017 and December 31, 2016, both the carrying value of the asset retirement obligations were $64,000.These costs include disposal of plastic and other non-hazardous waste, site closing labor and testing and sampling of the site upon closure. This liability is included in other long-term liabilities.
Environmental Contingencies
The Company records environmental liabilities at their undiscounted amounts on our consolidated balance sheets as other current or long-term liabilities when environmental assessments indicate that remediation efforts are probable and the costs can be reasonably estimated. These costs may be discounted to reflect the time value of money if the timing of the cash payments is fixed or reliably determinable and extends beyond a current period. Estimates of our liabilities are based on currently available facts, existing technology and presently enacted laws and regulations, taking into consideration the likely effects of other societal and economic factors, and include estimates of associated legal costs. These amounts also consider prior experience in remediating contaminated sites, other companies’ clean-up experience and data released by the Environmental Protection Agency (EPA) or other organizations. Our estimates are subject to revision in future periods based on actual costs or new circumstances. We capitalize costs that benefit future periods and we recognize a current period charge in operation and maintenance expense when clean-up efforts do not benefit future periods.
We evaluate any amounts paid directly or reimbursed by government sponsored programs and potential recoveries or reimbursements of remediation costs from third parties including insurance coverage separately from our liability. Recovery is evaluated based on the creditworthiness or solvency of the third party, among other factors. When recovery is assured, we record and report an asset separately from the associated liability on our balance sheet. No amounts for recovery have been accrued to date.
Deposits
Deposits represent utility services deposit and payments made to vendors for fabrication of key pieces of property, plant and equipment that have been made in accordance with the Company’s agreements to purchase such equipment. Payments are made to these vendors as progress is made on the fabrication of the equipment, with final payments made when the equipment is delivered. Until we have possession of the equipment, all payments made to these vendors are classified as deposits on assets. As at December 31, 2017 and December 31, 2016, the carrying value of the deposits were $10,000 and $27,662 respectively.
| 31 |
Leases
The Company has entered into various leases for buildings and equipment. At the inception of a lease, the Company evaluates whether it is operating or capital in nature. Operating leases are recorded as expense in the appropriate periods of the lease. Capital leases are classified as property, plant and equipment and the related depreciation is recorded on the assets. Also, the debt related to the capital lease is included in the Company’s short- and long-term debt obligations, in accordance with the lease agreement.
Lease inducements are recognized for periods of reduced rent or for larger than usual rent escalations over the term of the lease. The benefit of a rent free period and the cost of future rent escalations are recognized on a straight-line basis over the term of the lease.
Revenue Recognition
The Company recognizes revenue when it is realized or realizable and collection is reasonably assured. The Company considers revenue realized or realizable and earned when all of the following criteria are met: (i) persuasive evidence of an arrangement exists, (ii) the product has been shipped or the services have been rendered to the customer, (iii) the sales price is fixed or determinable, and (iv) collectability is reasonably assured.
P2O equipment and catalyst sales are recognized when the customer take possession of the items since title to the goods and the risk of loss transfers from P2O to Customer upon delivery. Royalty fee from production are recognized when the customer produces fuel from its P2O processors and related equipments. License fees from the use of our catalyst and a set up fee and service fee are recognized when the customer is in production mode.
Shipping and Handling Costs
The Company’s shipping and handling costs of $0 and $0 for the years ended December 31, 2017 and 2016, respectively, are included in cost of goods sold for the periods presented. Shipping and handling costs related to the purchase of inventory items are capitalized to inventory and expensed to cost of sales when the related inventory is sold for the periods presented.
Advertising costs
The Company expenses advertising costs as incurred. Advertising costs were $0 and $0 for the years ended December 31, 2017 and 2016, respectively. These expenses are included in selling, general and administrative expenses in the consolidated statements of operations.
Research and Development
Research and development costs are charged as operating expense of the Company as incurred. For the years ended December 31, 2017, and 2016, the Company did not expense any research and development costs.
Foreign Currency Translation
The consolidated financial statements have been translated into U.S. dollars in accordance with Financial Accounting Standards Board (“FASB”) Accounting Standards Codification (“ASC”) Topic 830. All monetary items have been translated using the exchange rates in effect at the balance sheet date. All non-monetary items have been translated using the historical exchange rates at the time of transactions. Income statement amounts have been translated using the average exchange rate for the year. Foreign exchange gain of $57,301 and loss of $100 for monetary items are included as general and administrative expenses in the condensed consolidated statements of operations for the twelve months ended December 31, 2017 and 2016, respectively. The 2017 foreign exchange gain results from the payoff of the 1783 Allanport property mortgage. Resulting differences are reflected in accumulated other comprehensive income in the accompanying consolidated balance sheets.
Income Taxes
The Company utilizes the asset and liability method to measure and record deferred income tax assets and liabilities. Deferred tax assets and liabilities reflect the future income tax effects of temporary differences between the financial statement carrying amounts of existing assets and liabilities and their respective tax basis and are measured using enacted tax rates that apply to taxable income in the years in which those temporary differences are expected to be recovered or settled. Deferred tax assets are reduced by a valuation allowance when, in the opinion of management, it is more likely than not that some portion or all of the deferred tax assets will not be realized.
| 32 |
The Company adopted the accounting standards associated with uncertain tax positions as of January 1, 2007. The adoption of this standard did not have a material impact on the Company’s consolidated statements of operations or financial position. Upon adoption, the Company had no unrecognized tax benefits. Furthermore, the Company had no unrecognized tax benefits at December 31, 2017 and 2016. The Company files tax returns in the U.S. federal and state jurisdictions as well as a foreign country. The years ending December 31, 2013 through December 31, 2017 are open tax years for IRS review.
Loss Per Share
The financial statements include basic and diluted per share information. Basic net loss per share is computed by dividing net loss by the weighted average number of shares of common stock outstanding during the period. Diluted net loss per share is computed by dividing net loss by the weighted average number of shares of common stock and potentially outstanding shares of common stock during each period. Common stock equivalents are excluded from the computation of diluted loss per share when their effect is anti-dilutive. For the year ended December 31, 2017, potential dilutive common stock equivalents consisted of 4,850,000 shares underlying common stock warrants and 6,580,000 shares underlying stock options, which were not included in the calculation of the diluted loss per share because they would be antidilutive. For the year ended December 31, 2016, potential dilutive common stock equivalents consisted of 14,950,000 shares underlying common stock warrants and 6,650,000 shares underlying stock options, which were not included in the calculation of the diluted loss per share because they would be antidilutive.
Segment Reporting
We operate in two reportable segments. ASC 280-10, “Disclosures about Segments of an Enterprise and Related Information”, establishes standards for the way that public business enterprises report information about operating segments in their annual consolidated financial statements. Operating segments are components of an enterprise about which separate financial information is available that is evaluated regularly by the chief operating decision maker in deciding how to allocate resources and in assessing performance. Our operating segments include plastic-to-oil conversion (Plastic2Oil), which includes processor sales as well as fuel sales and Data Recovery and Migration, our magnetic tape reading segment. Our Chief Operating Decision Maker is the Company’s Chief Executive Officer.
Concentrations and Credit Risk
The Company maintains cash balances, at times, with financial institutions in excess of amounts insured by the Canada Deposit Insurance Corporation and the U.S. Federal Deposit Insurance Corporation. Management monitors the soundness of these institutions and has not experienced any collection losses with these financial institutions.
Financial instruments which potentially expose the Company to concentrations of credit risk consist principally of operating demand deposit accounts and accounts receivable. The Company’s policy is to place our operating demand deposit accounts with high credit quality financial institutions that are insured by the FDIC, however, account balances may at times exceed insured limits. The Company extends limited credit to its customers based upon their creditworthiness and establishes an allowance for doubtful accounts based upon the credit risk of specific customers, historical trends and other pertinent information.
There were no revenue and accounts receivable for the year ended December 31, 2017. During the years ended December 31, 2016, 100% of total net revenues were generated from a single customer and segment, Data Business. As of December 31, 2016, one customer and segment, Data Business, accounted for 100.0% of accounts receivable.
During the years ended December 31, 2017 and 2016 two and four suppliers, respectively, accounted for 34.3% and 28.4% of accounts payable, respectively.
| 33 |
Fair Value of Financial Instruments
Fair value is defined under FASB ASC Topic 820 as the exchange price that would be received for an asset or paid to transfer a liability (an exit price) in the principal or the most advantageous market for an asset or liability in an orderly transaction between participants on the measurement date. Valuation techniques used to measure fair value must maximize the use of observable inputs and minimize the use of unobservable inputs. The standard describes a fair value hierarchy based on the levels of inputs, of which the first two are considered observable and the last unobservable, that may be used to measure fair value. The levels are as follows:
| ● | Level 1 - Quoted prices in active markets for identical assets or liabilities- |
| ● | Level 2 - Inputs other than Level 1 that are observable, either directly or indirectly, such as quoted prices for similar assets or liabilities; quoted prices in markets that are not active; or other inputs that are observable or corroborated by observable market data or substantially the full term of the assets or liabilities |
| ● | Level 3 - Unobservable inputs that are supported by little or no market activity and that are significant to the value of the assets or liabilities |
The carrying amounts of cash and cash equivalents, accounts receivable, accounts payable, accrued expenses, notes payable, leases, promissory notes, mortgage payable and short-term loans approximate fair value because of the short-term nature of these items. Per ASC Topic 820 framework these are considered Level 2 inputs where estimates are unobservable by market participants outside of the Company and must be estimated using assumptions developed by the Company.
Going Concern
The accompanying financial statements have been prepared on a going concern basis, which contemplates the realization of assets and the satisfaction of liabilities and commitments in the normal course of business. We have experienced negative cash flows from operations since inception, have a history of net losses from continuing operations of $51,474,005 and $5,700,035 for the years ended December 31, 2017 and 2016, respectively, and have an accumulated deficit of $79,418,137 at December 31, 2017. These factors raise substantial doubt about our ability to continue to operate in the normal course of business. We have funded our activities to date almost exclusively from equity financings and issuance of secured long-term debt.
Financial Instruments and Other Instruments
We do not have any outstanding financial instruments and/or other instruments.
Disclosure of Outstanding Securities
As of April 2, 2018, we had 124,756,158 shares of common stock issued and outstanding.
In conjunction with the Company’s 2012 Long Term Incentive Plan, options to purchase 1,040,000 shares of common stock with the exercise price of $1.50, 240,000 shares of common stock with the exercise price of $0.38, 3,100,000 shares of common stock with the exercise price of $0.05 have been issued and outstanding at December 31, 2017.2,380,000 shares are vested at December 31, 2017.
In conjunction with the Company’s 2016 Incentive Plan (Rahoul S Banerjea) , options to purchase 2,250,000 shares of common stock with the exercise price of $0.17. 2,250,000 of the shares are vested at December 31, 2016.
In conjunction with the Company’s August 10, 2016 private placement, the Company sold a $100,000 principal amount of 12% Promissory Note, together with a five-year warrant to purchase up to one hundred thousand shares of the company’s common stock at an exercisable price of $0.12 per share. The gross proceeds to the Company were $100,000.
In conjunction with the Company’s August 25, 2016 private placement, the Company sold a $100,000 principal amount of 12% Promissory Note, together with a five-year warrant to purchase up to one hundred thousand shares of the company’s common stock at an exercisable price of $0.12 per share. The gross proceeds to the Company were $100,000.
In conjunction with the Company’s October 18, 2016 private placement, the Company sold a $400,000 principal amount of 12% Promissory Note, together with a five-year warrant to purchase up to four hundred thousand shares of the company’s common stock at an exercisable price of $0.12 per share. The gross proceeds to the Company were $400,000.
| 34 |
ITEM 7A. QUANTITATIVE AND QUALITATIVE DISCLOSURES ABOUT MARKET RISK
Disclosures About Market Risk
We may be exposed to changes in financial market conditions in the normal course of business. Market risk generally represents the risk that losses may occur as a result of movements in interest rates and equity prices. We currently do not use financial instruments in the normal course of business that are subject to changes in financial market conditions.
Currency Fluctuations and Foreign Currency Risk
We mainly operate in the United States and Canada. Due to the relative stability of the Canadian Dollar in comparison to the U.S. Dollar, we have not experienced foreign currency risk, however, should this stability change, we could be exposed to such risk.
Interest Rate Risk
We do not feel that we are subject to significant interest rate risk. We deposit surplus funds with banks earning daily interest at fixed rates and we do not invest in any instruments for trading purposes. Additionally, all of our outstanding debt instruments (our mortgage and capital leases) carry fixed rates of interests. We are exposed to opportunity risk should interest rates decrease. The amount of interest bearing short-term debt outstanding as of December 31, 2017 and 2016 was $2,557,772 and $2,263,328 respectively.
Credit Risk
Financial instruments which potentially expose us to concentrations of credit risk consist principally of operating demand deposit accounts and accounts receivable. Our policy is to place our operating demand deposit accounts with high credit quality financial institutions that are insured by the FDIC, however, account balances may at times exceed insured limits. We extend limited credit to our customers based upon their creditworthiness and establish an allowance for doubtful accounts based upon the credit risk of specific customers, historical trends and other pertinent information.
We maintain cash balances, at times, with financial institutions in excess of amounts insured by the Canada Deposit Insurance Corporation and the U.S. Federal Deposit Insurance Corporation. Management monitors the soundness of these institutions and has not experienced any collection losses with these financial institutions.
There were no revenue and accounts receivable for the year ended December 31, 2017. During the years ended December 31, 2016, 100% of total net revenues were generated from a single customer and segment, Data Business. As of December 31, 2016, one customer and segment, Data Business, accounted for 100.0% of accounts receivable.
During the years ended December 31, 2017 and 2016 two and four suppliers, respectively, accounted for 34.3% and 28.4% of accounts payable, respectively.
Inflation Risk
Inflationary factors such as increases in the cost of our product and overhead costs may adversely affect our operating results. Although we do not believe that inflation has had a material impact on our financial position or results of operations to date, a high rate of inflation in the future may have an adverse effect on our ability to maintain current levels of gross margin and selling, general and administrative expenses as a percentage of net revenues if the selling prices of our products do not increase with these increased costs.
| 35 |
ITEM 8. FINANCIAL STATEMENTS AND SUPPLEMENTARY DATA
Index
| 36 |

REPORT OF INDEPENDENT REGISTERED PUBLIC ACCOUNTING FIRM
To the Board of Directors and
Stockholders of Plastic2Oil, Inc.
Opinion on the Consolidated Financial Statements
We have audited the accompanying consolidated balance sheets of Plastic2Oil, Inc. (the Company) as of December 31, 2017 and 2016, and the related consolidated statements of operations, stockholders’ deficit, and cash flows for each of the years in the two-year period ended December 31, 2017, and the related notes to the consolidated financial statements (collectively referred to as the financial statements). In our opinion, the consolidated financial statements present fairly, in all material respects, the consolidated financial position of the Company as of December 31, 2017 and 2016, and the results of its operations and its cash flows for each of the years in the two- year period ended December 31, 2017, in conformity with accounting principles generally accepted in the United States of America.
Basis for Opinion
These consolidated financial statements are the responsibility of the Company’s management. Our responsibility is to express an opinion on the Company’s financial statements based on our audits. We are a public accounting firm registered with the Public Company Accounting Oversight Board (United States) (PCAOB) and are required to be independent with respect to the Company in accordance with the U.S. federal securities laws and the applicable rules and regulations of the Securities and Exchange Commission and the PCAOB.
We conducted our audits in accordance with the standards of the PCAOB. Those standards require that we plan and perform the audit to obtain reasonable assurance about whether the financial statements are free of material misstatement, whether due to error or fraud. The Company is not required to have, nor were we engaged to perform, an audit of its internal control over financial reporting. As part of our audits, we are required to obtain an understanding of internal control over financial reporting, but not for the purpose of expressing an opinion on the effectiveness of the Company’s internal control over financial reporting. Accordingly, we express no such opinion.
Our audits included performing procedures to assess the risks of material misstatement of the financial statements, whether due to error or fraud, and performing procedures that respond to those risks. Such procedures included examining, on a test basis, evidence regarding the amounts and disclosures in the financial statements. Our audits also included evaluating the accounting principles used and significant estimates made by management, as well as evaluating the overall presentation of the financial statements. We believe that our audits provide a reasonable basis for our opinion.
The accompanying consolidated financial statements have been prepared assuming that the Company will continue as a going concern. As discussed in Note 7 to the consolidated financial statements, the Company has incurred operating losses, has incurred negative cash flows from operations and has a working capital deficit. These and other factors raise substantial doubt about the Company’s ability to continue as a going concern. Management’s plan regarding these matters is also described in Note 7 to the financial statements. The consolidated financial statements do not include any adjustments that might result from the outcome of this uncertainty.

D. Brooks and Associates CPA’s, P.A.
We have served as the Company’s auditor since 2014.
Palm Beach Gardens, Florida
April 2, 2018
D. Brooks and Associates CPA’s, P.A. 4440 PGA Boulevard Suite 104, Palm Beach Gardens, FL 33410 – (561) 429-6225
| F-1 |
PART I - FINANCIAL INFORMATION
Item 1. Financial Statements
PLASTIC2OIL, INC. AND SUBSIDIARIES
CONSOLIDATED BALANCE SHEETS
| As
of December 31, 2017 | As
of December 31, 2016 | |||||||
| ASSETS | ||||||||
| CURRENT ASSETS: | ||||||||
| Cash and cash equivalents | $ | 172,286 | $ | 270,898 | ||||
| Restricted cash (Note 2 ) | 100,524 | 100,423 | ||||||
| Accounts receivable, net of allowance of $0 and $22,994, respectively. | - | 21,950 | ||||||
| Prepaid expenses and other current assets | 12,386 | 14,907 | ||||||
| TOTAL CURRENT ASSETS | 285,196 | 408,178 | ||||||
| PROPERTY, PLANT AND EQUIPMENT, NET: | ||||||||
| Property, plant and equipment, net (Note 4) | 1,525,918 | 1,552,613 | ||||||
| Property, plant and equipment, net - held for sale | - | 287,124 | ||||||
| TOTAL PROPERTY, PLANT AND EQUIPMENT | 1,525,918 | 1,839,737 | ||||||
| Deposits (Note 2) | 10,000 | 27,662 | ||||||
| TOTAL ASSETS | $ | 1,821,114 | $ | 2,275,577 | ||||
| LIABILITIES AND STOCKHOLDERS’ DEFICIT | ||||||||
| CURRENT LIABILITIES: | ||||||||
| Accounts payable | $ | 1,878,821 | $ | 2,036,469 | ||||
| Accrued expenses | 2,607,561 | 2,310,679 | ||||||
| Demand promissory note – related party, current portion (Note 6) | 7,304,262 | 2,263,328 | ||||||
| Mortgages payable and capital leases (Note 8) | 21,362 | 227,455 | ||||||
| TOTAL CURRENT LIABILITIES | 11,812,006 | 6,837,931 | ||||||
| LONG-TERM LIABILITIES: | ||||||||
| Asset retirement obligations (Note 2) | 65,920 | 64,000 | ||||||
| Secured promissory notes – related party (Note 6) | 1,972,219 | 5,782,846 | ||||||
| Secured promissory notes (Note 7) | 115,802 | 102,838 | ||||||
| TOTAL LONG-TERM LIABILITIES | 2,153,941 | 5,949,684 | ||||||
| TOTAL LIABILITIES | 13,965,947 | 12,787,615 | ||||||
| Commitments and contingencies ( Note 9) | ||||||||
| STOCKHOLDERS’ DEFICIT: | ||||||||
| Common stock, par $0.001; 250,000,000 authorized, 124,756,158 shares issued and outstanding | 124,756 | 124,756 | ||||||
| Additional paid in capital | 67,176,993 | 67,113,822 | ||||||
| Accumulated other comprehensive income (loss) | (28,445 | ) | 193,516 | |||||
| Accumulated deficit | (79,418,137 | ) | (77,944,132 | ) | ||||
| TOTAL STOCKHOLDERS’ DEFICIT | (12,144,833 | ) | (10,512,038 | ) | ||||
| TOTAL LIABILITIES AND STOCKHOLDERS’ DEFICIT | $ | 1,821,114 | $ | 2,275,577 | ||||
The accompanying notes are an integral part of the consolidated financial statements.
| F-2 |
PLASTIC2OIL, INC. AND SUBSIDIARIES
CONSOLIDATED STATEMENTS OF OPERATIONS
| For
the Twelve Months Ended December 31, | ||||||||
| 2017 | 2016 | |||||||
| SALES | ||||||||
| P2O | $ | - | $ | - | ||||
| Other | - | 21,950 | ||||||
| TOTAL SALES | - | 21,950 | ||||||
| COST OF SALES | ||||||||
| P2O | - | - | ||||||
| Other | - | 8,438 | ||||||
| TOTAL COST OF SALES | - | 8,438 | ||||||
| GROSS PROFIT | - | 13,512 | ||||||
| OPERATING EXPENSES | ||||||||
| Selling general and administrative expenses | ||||||||
| Professional Fees | 342,458 | 126,500 | ||||||
| Compensation | 634,500 | 664,830 | ||||||
| Other | 193,175 | 278,098 | ||||||
| Depreciation of property, plant and equipment and accretion of long-term liability | 391,643 | 773,930 | ||||||
| TOTAL OPERATING EXPENSES | 1,561,776 | 1,843,358 | ||||||
| LOSS FROM OPERATIONS | (1,561,776 | ) | (1,829,846 | ) | ||||
| OTHER (INCOME) EXPENSES | ||||||||
| Impairment loss - property, plant and equipment | 13,158 | 3,088,315 | ||||||
| Gain on disposal of property, plant and equipment | (255,676 | ) | - | |||||
| Interest expense, net | 935,902 | 780,675 | ||||||
| Other (income) expense, net | (781,155 | ) | 1,199 | |||||
| TOTAL OTHER (INCOME) EXPENSES | (87,771 | ) | 3,870,189 | |||||
| LOSS BEFORE INCOME TAXES | (1,474,005 | ) | (5,700,035 | ) | ||||
| Provision for Income taxes | - | - | ||||||
| NET LOSS | (1,474,005 | ) | (5,700,035 | ) | ||||
Basic and diluted loss per share | $ | (0.01 | ) | $ | (0.05 | ) | ||
| Basic and diluted weighted average number of shares outstanding (Note2) | 124,756,158 | 124,756,158 | ||||||
The accompanying notes are an integral part of the consolidated financial statements.
| F-3 |
PLASTIC2OIL, INC. AND SUBSIDIARIES
CONSOLIDATED STATEMENTS OF COMPREHENSIVE LOSS
| For
the Twelve Months Ended December 31, | ||||||||
| 2017 | 2016 | |||||||
| NET LOSS | $ | (1,474,005 | ) | $ | (5,700,035 | ) | ||
OTHER COMPREHENSIVE INCOME (LOSS), NET OF INCOME TAX | ||||||||
| Foreign currency items | (221,961 | ) | 38,438 | |||||
| COMPREHENSIVE LOSS | $ | (1,695,966 | ) | $ | (5,661,597 | ) | ||
The accompanying notes are an integral part of the consolidated financial statements.
| F-4 |
Plastic2Oil, Inc. and Subsidiaries
CONSOLIDATED STATEMENTS OF CHANGES IN STOCKHOLDERS’ DEFICIT
Years Ended December 31, 2017, and 2016
| Common Stock $0.001 Par Value | Common Stock to be issued | Additional Paid | Accumulated | Other Comprehensive | Total Stockholder | |||||||||||||||||||||||||||
| Shares | Amount | Shares | Amount | in Capital | Deficit | Income | Equity | |||||||||||||||||||||||||
| BALANCES - DECEMBER 31, 2015 | 124,756,158 | $ | 124,756 | 0 | $ | (0 | ) | $ | 66,981,154 | $ | (72,244,097 | ) | $ | 231,954 | $ | (4,918,233 | ) | |||||||||||||||
| To book Stock compensation expense related to granting of stock options at $0.17 | - | - | - | - | 90,000 | - | - | 90,000 | ||||||||||||||||||||||||
| To book Stock compensation expense related to granting of stock options at $0.05 | - | - | - | - | 30,667 | - | - | 30,667 | ||||||||||||||||||||||||
| Warrants issued with 12% secured Notes | - | - | - | - | 71,030 | - | - | 71,030 | ||||||||||||||||||||||||
| Warrants subscribed in 2016 net of discounts | - | - | - | - | (59,029 | ) | - | - | (59,029 | ) | ||||||||||||||||||||||
| Foreign currency adjustment | - | - | - | - | - | - | (38,438 | ) | (38,438 | ) | ||||||||||||||||||||||
| Net loss | - | - | - | - | - | (5,700,035 | ) | - | (5,700,035 | ) | ||||||||||||||||||||||
| BALANCES - DECEMBER 31, 2016 | 124,756,158 | $ | 124,756 | 0 | $ | (0 | ) | $ | 67,113,822 | $ | (77,944,132 | ) | $ | 193,516 | $ | (10,524,038 | ) | |||||||||||||||
The accompanying notes are an integral part of the consolidated financial statements.
(Continued next page)
| F-5 |
Plastic2Oil, Inc. and Subsidiaries
CONSOLIDATED STATEMENTS OF CHANGES IN STOCKHOLDERS’ DEFICIT
Years Ended December 31, 2017, and 2016
| Common Stock $0.001 Par Value | Common Stock to be issued | Additional Paid | Accumulated | Other Comprehensive | Total Stockholder | |||||||||||||||||||||||||||
| Shares | Amount | Shares | Amount | in Capital | Deficit | Income | Deficit | |||||||||||||||||||||||||
| BALANCES - DECEMBER 31, 2016 | 124,756,158 | 124,756 | 0 | $ | (0 | ) | $ | 67,113,822 | $ | (77,944,132 | ) | $ | 193,516 | $ | (10,512,038 | ) | ||||||||||||||||
| To book Stock compensation expense related to granting of stock options at $0.05 | - | - | - | - | 63,170 | - | - | 63,170 | ||||||||||||||||||||||||
| Foreign currency adjustment | - | - | - | - | - | - | (221,961 | ) | (221,961 | ) | ||||||||||||||||||||||
| Net loss | - | - | - | - | - | (1,474,005 | ) | - | (1,474,005 | ) | ||||||||||||||||||||||
| BALANCES - DECEMBER 31, 2017 | 124,756,158 | 124,756 | 0 | $ | (0 | ) | $ | 67,176,992 | $ | (79,418,137 | ) | $ | (28,445 | ) | $ | (12,144,834 | ) | |||||||||||||||
The accompanying notes are an integral part of the consolidated financial statements.
| F-6 |
PLASTIC2OIL, INC. AND SUBSIDIARIES
CONSOLIDATED STATEMENTS OF CASH FLOWS
For the Twelve Months Ended December 31,
| 2017 | 2016 | |||||||
| CASH FLOWS FROM OPERATING ACTIVITIES: | ||||||||
| NET LOSS | $ | (1,474,005 | ) | $ | (5,700,035 | ) | ||
| Reconciliation of net loss to net cash used in operations: | ||||||||
| Depreciation of property plant and equipment | 193,187 | 579,217 | ||||||
| Accretion of long-term liability | 198,935 | 194,270 | ||||||
| Impairment loss - property, plant and equipment | 13,158 | 3,088,315 | ||||||
| Accrued interest expense | 928,874 | 742,409 | ||||||
| Stock options issued for services | 63,170 | 120,667 | ||||||
| Gain on sale of property plant and equipment | (255,676 | ) | - | |||||
| Other | - | 732 | ||||||
| Working capital changes: | ||||||||
| Accounts receivable | 21,950 | (18,605 | ) | |||||
| Prepaid expenses and other current assets | 20,184 | 5,103 | ||||||
| Accounts payable | (169,861 | ) | (90,752 | ) | ||||
| Accrued expenses | 275,660 | 248,199 | ||||||
| NET CASH USED IN OPERATING ACTIVITIES | (184,424 | ) | (830,480 | ) | ||||
| CASH FLOW FROM INVESTMENT ACTIVITIES: | ||||||||
| Increase in restricted cash | (101 | ) | (101 | ) | ||||
| NET CASH USED IN INVESTING ACTIVITIES | (101 | ) | (101 | ) | ||||
| CASH FLOWS FROM FINANCING ACTIVITIES: | ||||||||
| Proceeds from sale of property, plant and equipment | 365,070 | - | ||||||
| Proceeds from short-term loans – related party | - | 525,566 | ||||||
| Proceeds from long-term loans | 100,000 | |||||||
| Proceeds from long-term loans – related party | 500,000 | |||||||
| Repayment of mortgages and capital leases | (279,157 | ) | (42,575 | ) | ||||
| NET CASH PROVIDED BY FINANCING ACTIVITIES | 85,913 | 1,082,991 | ||||||
| NET INCREASE (DECREASE) IN CASH AND CASH EQUIVALENTS | (98,612 | ) | 252,410 | |||||
| CASH AND CASH EQUIVALENTS AT BEGINNING OF YEAR | 270,898 | 18,488 | ||||||
| CASH AND CASH EQUIVALENTS AT END OF YEAR | $ | 172,286 | $ | 270,898 | ||||
| SUPPLEMENTAL DISCLOSURE OF CASH FLOW INFORMATION: | ||||||||
| Cash paid for income taxes | $ | - | $ | - | ||||
| Cash paid for interest | $ | 7,796 | $ | 15,590 | ||||
The accompanying notes are an integral part of the consolidated financial statements.
| F-7 |
PLASTI2OIL, INC. AND SUBSIDIARIES
NOTES TO CONSOLIDATED FINANCIAL STATEMENTS
NOTE 1 – ORGANIZATION AND GOING CONCERN
Plastic2Oil, Inc. (the “Company” or “P2O”) was originally incorporated as 310 Holdings, Inc. (“310”) in the State of Nevada on April 20, 2006. 310 had no significant activity from inception through 2009. In April 2009, John Bordynuik purchased 63% of the issued and outstanding shares of 310. During 2009, the Company changed its name to JBI, Inc. and began operations of its main business operation, transforming waste plastics to oil and other fuel products. During 2014, the Company changed its name to Plastic2Oil, Inc. (“P2O”). P2O is a combination of proprietary technologies and processes developed by P2O which convert waste plastics into fuel. P2O currently, as of the date of this filing, has two processors at its Niagara Falls, NY facility (the “Niagara Falls Facility”). Both processors are currently idle since December 2013. Our P2O business has begun the transition from research and development to a commercial manufacturing and production business. We plan to grow mainly from sale of processors.
We do not have sufficient cash to operate our business which has forced us to suspend our operations until such time as we receive a capital infusion or cash advances on the sale of our processors.
On August 24, 2009, the Company acquired Javaco, Inc. (“Javaco”), a distributor of electronic components, including home theater and audio video products. In July 2012, the Company closed Javaco and sold substantially all of the inventory and fixed assets of Javaco. The operations of Javaco have been classified as discontinued operations for the years presented (Note 16).
On September 30, 2009, the Company acquired Pak-It, LLC (“Pak-It”), and the operator of a bulk chemical processing, mixing, and packaging facility. It also has developed and patented a delivery system that packages condensed cleaners in small water-soluble packages. In February 2012, the Company sold substantially all of the assets of Pak-It and as a result, the operations of Pak-It have been classified as discontinued operations for the years presented (Note 16).
Going Concern
These consolidated financial statements have been prepared in accordance with accounting principles generally accepted in the United States of America (“US GAAP”), which contemplates continuation of the Company as a going concern which assumes the realization of assets and satisfaction of liabilities and commitments in the normal course of business. The Company has experienced negative cash flows from operations since inception, has net losses from continuing operations of $1,474,005, and $5,700,035 for the years ended December 31, 2017 and 2016, respectively, and has a working capital deficit of $11,526,809 and an accumulated deficit of $79,418,137, at December 31, 2017. These factors raise substantial doubt about the Company’s ability to continue as a going concern and to operate in the normal course of business. The Company has funded its activities to date almost exclusively from equity financings, loans form related party and issuance of secured long-term debt.
The Company will continue to require substantial funds to continue the expansion of its P2O business to achieve significant commercial productions, and to significantly increase sales and marketing efforts. Management’s plans in order to meet its operating cash flow requirements include financing activities such as private placements of its common stock, issuances of debt and convertible debt instruments.
While the Company believes that it will be successful in obtaining the necessary financing to fund its operations, meet regulatory requirements and achieve commercial production goals, there are no assurances that such additional funding will be achieved and that it will succeed in its future operations. The consolidated financial statements do not include any adjustments relating to the recoverability and classification of recorded asset amounts or amounts of liabilities that might be necessary should we be unable to continue in existence.
| F-8 |
NOTE 2 – SUMMARY OF ACCOUNTING POLICIES
Basis of Consolidation
The consolidated financial statements include the accounts of the Company and its wholly-owned subsidiaries, Plastic2Oil of NY#1 Inc., Plastic2Oil (Canada) Inc., JBI CDE Inc., Plastic2Oil Re One Inc., JBI Re #1 Inc., Plastic2Oil Marine Inc., Javaco, and Pak-it. All intercompany transactions and balances have been eliminated in consolidation. Amounts in the consolidated financial statements are expressed in US dollars. Recycling Center, Pak-It and Javaco have also been consolidated; however, as mentioned their operations are classified as discontinued operations (Note 16).
Estimates
The preparation of financial statements in conformity with U.S. GAAP requires management to make estimates and assumptions that affect the reported amounts of assets and liabilities, the disclosure of contingent assets and liabilities at the date of the financial statements, and the reported amounts of revenues and expenses during the reporting period. Actual results could differ from these estimates. Significant estimates include amounts for impairment of long-lived assets, share based compensation, asset retirement obligations, inventory obsolescence, accrued liabilities, accounts receivable exposures and valuation of options and warrants.
Cash and Cash Equivalents
The Company considers all highly liquid investments with maturities of three months or less at the time of purchase to be cash equivalents. As of December 31, 2017 and December 31, 2016, the Company has cash of $172,286 and $270,898, respectively.
Restricted Cash
As of December 31, 2017 and 2016, the Company had $100,524 and $100,423, respectively, of restricted cash, which is used to secure a line of credit that secures a performance bond on behalf of the Company. The performance bond is required by the State of New York for fuel distributors in perpetuity.
Cash Held in Attorney Trust
The amount held in trust represents retainer payments the Company have made to law firms which were being held on our behalf for the payment of future services.
Accounts Receivable
Accounts receivable represent unsecured obligations due from customers under terms requesting payments upon receipt of invoice up to ninety days, depending on the customer. Accounts receivable are non-interest bearing and are stated at the amounts billed to the customer net of an allowance for uncollectible accounts. Customer balances with invoices over 90 days old are considered delinquent. Payments of accounts receivable are applied to the specific invoices identified on the customer remittance, or if unspecified, are applied to the earliest unpaid invoice.
The allowance for uncollectible accounts reflects management’s best estimate of amounts that may not be collected based on an analysis of the age of receivables and the credit standing of individual customers. The allowance for uncollectible accounts as of December 31, 2017 and 2016 were $0 and $22,994, respectively.
| F-9 |
Inventories
Inventories, which consist primarily of plastics, costs to process the plastic and processed fuel are stated at the lower of cost or market. We use an average costing method in determining cost. Inventories are periodically reviewed for use and obsolescence, and adjusted as necessary. The inventories were fully reserved as of December 31, 2015.
Property, Plant and Equipment
Property, plant and equipment are recorded at cost. Depreciation is provided using the straight-line method over the estimated useful lives of the various classes of assets, and capital leased assets are given useful lives coinciding with the asset classification they are classified as. These lives are as follows:
| Leasehold improvements | lesser of useful life or term of the lease |
| Machinery and office equipment | 3-15 years |
| Furniture and fixtures | 7 years |
| Office and industrial buildings | 25 -30 years |
Gains and losses on depreciable assets retired or sold are recognized in the statements of operations in the year of disposal. Repairs and maintenance expenditures are expensed as incurred and expenditures that increase the value or useful life of the asset are capitalized.
Construction in Process
The Company capitalizes customized equipment built to be used in the future day to day operations at cost. Once complete and available for use, the cost for accounting purposes is transferred to property, plant and equipment, where normal depreciation rates are applied.
Impairment of Long-Lived Assets
The Company reviews for impairment of long-lived assets on an asset by asset basis. Impairment is recognized on properties held for use when the expected undiscounted cash flows for a property are less than its carrying amount at which time the property is written-down to fair value. Properties held for sale are recorded at the lower of the carrying amount or the expected sales price less costs to sell. The sale or disposal of a “component of an entity” is treated as discontinued operations. The operating properties sold by the Company typically meet the definition of a component of an entity and as such the revenues and expenses associated with sold properties are reclassified to discontinued operations for all periods presented (Note 16).
During the year ended December 31, 2017 and 2016, the Company recorded impairment losses on deposits and property, plant and equipment of $13,158 and $3,088,315, respectively, in accordance to ASC 360-10-50-2 where an impairment loss will be recognized only if the carrying amount of the long-lived assets are not recoverable and exceeds its fair value. The Company estimates the fair value of equipment for impairment purposes using a discounted cash flow method.
Asset Retirement Obligations
The fair value of the estimated asset retirement obligation is recognized in the consolidated balance sheets when identified and a reasonable estimate of fair value can be made. The asset retirement cost, equal to the estimated fair value of the asset retirement obligation, is capitalized as part of the cost of the related long-lived asset. The balance of the asset retirement obligation is determined through an assessment made by the Company’s engineers, of the total costs expected to be incurred by the Company when closing a facility. The total estimated cost is then discounted using the current market rates to determine the present value of the asset as of the date of this valuation. As of the date of the creation of the asset retirement obligation in the amount of $57,530, the Company determined the present value of the obligation using a discount rate equal to 2.96%. The present value of the asset retirement obligation is then capitalized on the consolidated balance sheets and is depreciated over the asset’s estimated useful life and is included in depreciation and accretion expense in the consolidated statements of operations. Increases in the asset retirement obligation resulting from the passage of time are recorded as accretion of asset retirement obligations in the consolidated statements of operations. Actual expenditures incurred are charged against the accumulated obligation. As of December 31, 2017 and December 31, 2016, the carrying value of the asset retirement obligations was $65,920 and $64,000, respectively. These costs include disposal of plastic and other non-hazardous waste, site closing labor and testing and sampling of the site upon closure.
| F-10 |
Environmental Contingencies
The Company records environmental liabilities at their undiscounted amounts on our balance sheets as other current or long-term liabilities when environmental assessments indicate that remediation efforts are probable and the costs can be reasonably estimated. These costs may be discounted to reflect the time value of money if the timing of the cash payments is fixed or reliably determinable and extends beyond a current period. Estimates of our liabilities are based on currently available facts, existing technology and presently enacted laws and regulations, taking into consideration the likely effects of other societal and economic factors, and include estimates of associated legal costs. These amounts also consider prior experience in remediating contaminated sites, other companies’ clean-up experience and data released by the Environmental Protection Agency (EPA) or other organizations. Our estimates are subject to revision in future periods based on actual costs or new circumstances. We capitalize costs that benefit future periods and we recognize a current period charge in operation and maintenance expense when clean-up efforts do not benefit future periods.
We evaluate any amounts paid directly or reimbursed by government sponsored programs and potential recoveries or reimbursements of remediation costs from third parties including insurance coverage separately from our liability. Recovery is evaluated based on the creditworthiness or solvency of the third party, among other factors. When recovery is assured, we record and report an asset separately from the associated liability on our balance sheets. No amounts for recovery have been accrued to date.
Deposits
Deposits represent utility services deposit and payments made to vendors for fabrication of key pieces of property, plant and equipment that have been made in accordance with the Company’s agreements to purchase such equipment. Payments are made to these vendors as progress is made on the fabrication of the equipment, with final payments made when the equipment is delivered. Until we have possession of the equipment, all payments made to these vendors are classified as deposits on assets.
Leases
The Company has entered into various leases for buildings and equipment. At the inception of a lease, the Company evaluates whether it is operating or capital in nature. Operating leases are recorded as expense in the appropriate periods of the lease. Capital leases are classified as property, plant and equipment and the related depreciation is recorded on the assets. Also, the debt related to the capital lease is included in the Company’s short- and long-term debt obligations, in accordance with the lease agreement (Note 8).
Lease inducements are recognized for periods of reduced rent or for larger than usual rent escalations over the term of the lease. The benefit of a rent free period and the cost of future rent escalations are recognized on a straight-line basis over the term of the lease.
Revenue Recognition
The Company recognizes revenue when it is realized or realizable and collection is reasonably assured. The Company considers revenue realized or realizable and earned when all of the following criteria are met: (i) persuasive evidence of an arrangement exists, (ii) the product has been shipped or the services have been rendered to the customer, (iii) the sales price is fixed or determinable, and (iv) collectability is reasonably assured.
| F-11 |
P2O processor sales are recognized when the customer take possession of the processors since title to the goods and the risk of loss transfers from P2O to Customer upon delivery. P2O fuel sales are recognized when the customers take possession of the fuel since at that stage the customer has completed all prior testing necessary for their acceptance of the fuel. At the time of possession they have arranged for transportation to pick it up and the sales price has either been set in their purchase contract or negotiated prior to the time of pick up through the issuance of a purchase order. The Company negotiates the pricing of the fuel based on the quality of the product and the type of fuel being sold (i.e. Naphtha, Fuel Oil No. 6 or Fuel Oil No. 2).
Data storage and recovery sales are recognized when the product has been shipped or the services have been rendered to the customer.
Foreign Currency Translation
The consolidated financial statements have been translated into U.S. dollars in accordance with Financial Accounting Standards Board (“FASB”) Accounting Standards Codification (“ASC”) Topic 830. All monetary items have been translated using the exchange rates in effect at the balance sheet date. All non-monetary items have been translated using the historical exchange rates at the time of transactions. Income statement amounts have been translated using the average exchange rate for the year. Resulting differences are immaterial to the financial statements as a whole. Foreign exchange gain of $57,301 and loss of $100 are included as general and administrative expenses in the consolidated statements of operations for the years ended December 31, 2017 and 2016, respectively.
Income Taxes
The Company utilizes the asset and liability method to measure and record deferred income tax assets and liabilities. Deferred tax assets and liabilities reflect the future income tax effects of temporary differences between the financial statement carrying amounts of existing assets and liabilities and their respective tax basis and are measured using enacted tax rates that apply to taxable income in the years in which those temporary differences are expected to be recovered or settled. Deferred tax assets are reduced by a valuation allowance when, in the opinion of management, it is more likely than not that some portion or all of the deferred tax assets will not be realized.
The Company adopted the accounting standards associated with uncertain tax positions as of January 1, 2007. The adoption of this standard did not have a material impact on the Company’s consolidated statements of operations or financial position. Upon adoption, the Company had no unrecognized tax benefits. Furthermore, the Company had no unrecognized tax benefits at December 31, 2017 and 2016. The Company files tax returns in the U.S federal and state jurisdictions as well as a foreign country. The years ended December 31, 2013 through December 31, 2017 are open tax years for IRS review.
| F-12 |
Loss Per Share
The financial statements include basic and diluted per share information. Basic net loss per share is computed by dividing net loss by the weighted average number of shares of common stock outstanding during the period. Diluted net loss per share is computed by dividing net loss by the weighted average number of shares of common stock and potentially outstanding shares of common stock during each period. Common stock equivalents are excluded from the computation of diluted loss per share when their effect is anti-dilutive. For the year ended December 31, 2017, potential dilutive common stock equivalents consisted 4,850,000 shares underlying common stock warrants and 6,580,000 shares underlying stock options, which were not included in the calculation of the diluted loss per share because their effect is anti-dilutive. For the year ended December 31, 2016, potential dilutive common stock equivalents consisted 14,950,000 shares underlying common stock warrants and 6,650,000 shares underlying stock options, which were not included in the calculation of the diluted loss per share because of their effect is anti-dilutive.
Segment Reporting
The Company operates in two reportable segments. ASC 280-10, “Disclosures about Segments of an Enterprise and Related Information”, establishes standards for the way that public business enterprises report information about operating segments in their annual consolidated financial statements. Operating segments are components of an enterprise about which separate financial information is available that is evaluated regularly by the chief operating decision maker in deciding how to allocate resources and in assessing performance. Our operating segments include plastic to oil conversion (Plastic2Oil), which includes processor sales as well as fuel sales and Data Recovery and Migration, our magnetic tape reading segment. Our Chief Operating Decision Maker is the Company’s Chief Executive Officer.
Concentrations and Credit Risk
Financial instruments which potentially expose the Company to concentrations of credit risk consist principally of operating demand deposit accounts and accounts receivable. The Company’s policy is to place our operating demand deposit accounts with high credit quality financial institutions that are insured by the FDIC, however, account balances may at times exceed insured limits. The Company extends limited credit to its customers based upon their creditworthiness and establishes an allowance for doubtful accounts based upon the credit risk of specific customers, historical trends and other pertinent information. The Company also routinely makes an assessment of the collectability of the short-term note receivable and determines its exposure for non-performance based on the specific holder and other pertinent information.
There were no revenue and accounts receivable for the year ended December 31, 2017. During the years ended December 31, 2016, 100% of total net revenues were generated from a single customer and segment, Data Business. As of December 31, 2016, one customer and segment, Data Business, accounted for 100.0% of accounts receivable.
During the years ended December 31, 2017 and 2016 two and four suppliers, respectively, accounted for 34.3% and 28.4% of accounts payable, respectively.
Fair Value of Financial Instruments
The carrying amounts of cash and cash equivalents, accounts receivable, accounts payable, accrued expenses, leases, promissory notes, long-term debt and mortgage payable approximate fair value because of the short-term nature of these items.
Changes in Accounting Policies Including Initial Adoption
There are no recently adopted accounting pronouncements that impact the Company’s consolidated financial statements.
| F-13 |
Recently Issued Accounting Pronouncements
In May 2014, the FASB issued ASU 2014-09, Revenue from Contracts with Customers (Topic 606). Under this ASU and subsequently issued amendments, revenues are recognized at the time when goods or services are transferred to a customer in an amount that reflects the consideration it expects to receive in exchange for those goods or services. Companies may use either a full retrospective or a modified retrospective approach to adopt this ASU. We will adopt this standard using the modified retrospective method effective January 1, 2018.
We will generate the majority of our revenues from P2O processor and related equipment sale, royalty fee from fuel production and licensing fee for the use of our catalyst and a set up and service fees. The impact of the ASU adoption for each type of billing arrangement is as follows:
P2O processor and equipment sale – The Company will use the right-to-invoice practical expedient to account for shipment of the P2O equipment and its billing arrangements when the Company has a right to consideration from a customer in an amount that corresponds directly with the value. This is consistent with the Company’s current revenue recognition policy.
Royalty fee from production volume - The Company will recognize revenues as individual production using a measure of progress that is based on the customer production reports.
Licensing fee for the use of our catalyst - The Company will use the right-to-invoice practical expedient to account for shipment of the Catalyst and its billing arrangements when the Company has a right to consideration from a customer in an amount that corresponds directly with the value. This is consistent with the Company’s current revenue recognition policy.
Set up and service fees - The Company will use the right-to-invoice practical expedient to account for shipment of the P2O equipment and its billing arrangements when the Company has a right to consideration from a customer in an amount that corresponds directly with the value. This is consistent with the Company’s current revenue recognition policy.
The Company is in its final stages of quantifying the financial impacts of the new guidance based on the contracts that exist at the date of adoption, as well as evaluating presentation of our revenues and required enhancements to disclosures. We expect that the new standard will have an immaterial impact on our consolidated financial statements, other than increased disclosures, upon adoption. Changes to revenue recognition as a result of applying the new standard will largely arise from certain contingent or success fee arrangements as described above.
In November 2015, the FASB issued ASU 2015-17, Balance Sheet Classification of Deferred Taxes. This update requires an entity to classify deferred tax liabilities and assets as noncurrent within a classified statement of financial position. ASU 2015-17 is effective for annual and interim reporting periods beginning after December 15, 2016. This update may be applied either prospectively to all deferred tax liabilities and assets or retrospectively to all periods presented. Early application is permitted as of the beginning of the interim or annual reporting period. The Company does not expect the new standard to have a significant impact on its consolidated financial position, results of operations or cash flows.
In July 2015, FASB issued ASU 2015-11, Simplifying the Measurement of Inventory (“ASU 2015-11”). ASU 2015-11 requires that an entity measure inventory at the lower of cost and net realizable value. This ASU does not apply to inventory measured using last-in, first-out. ASU 2015-11 is effective for annual reporting periods beginning after December 15, 2016, including interim periods within that reporting period. The Company does not expect the new standard to have a significant impact on its consolidated financial position, results of operations or cash flows.
In August 2015, the FASB issued ASU 2015-14, Revenue from Contracts with Customers (Topic 606): Deferral of Effective Date, which defers the effective date of ASU 2014-09 by one year. ASU 2014-09 is now effective for annual reporting periods beginning after December 15, 2017, including interim periods within that reporting period. Earlier application is permitted only as of annual reporting periods beginning after December 15, 2016, including interim reporting periods within that reporting period. The adoption of this guidance did not impact our consolidated financial statements.
In October 2016, Financial Accounting Standards Board (“FASB”) issued Accounting Standards Update (“ASU”) 2016-16, Income Taxes (Topic 740): Intra-Entity Transfers of Assets Other Than Inventory, which removes the prohibition against immediate recognition of current and deferred income tax effects on intra-entity transfers of assets other than inventory. This standard is effective January 1, 2019, although early adoption is permitted as early as January 1, 2017. The Company has not yet determined the impact that the adoption of this guidance will have on our consolidated financial statements.
In August 2016, the FASB issued ASU 2016-15, Statement of Cash Flows (Topic 230): Classification of Certain Cash Receipts and Cash Payments, which clarifies how cash receipts and cash payments are classified in the statement of cash flows. This standard is effective January 1, 2018, although early adoption is permitted. The Company does not expect the adoption of this guidance to have a material impact on our consolidated financial statements.
| F-14 |
In August 2016, the FASB issued ASU 2016-15, Statement of Cash Flows (Topic 230): Classification of Certain Cash Receipts and Cash Payments, which clarifies how cash receipts and cash payments are classified in the statement of cash flows. This standard is effective January 1, 2018, although early adoption is permitted. The Company does not expect the adoption of this guidance to have a material impact on our consolidated financial statements.
In March 2016, the FASB issued ASU 2016-09, Compensation - Stock Compensation (Topic 718): Improvements to Employee Share-Based Payment Accounting. This standard makes several modifications to Topic 718, including the accounting for forfeitures, employer tax withholding on share-based compensation, income tax consequences, and clarifies the statement of cash flows presentation for certain components of share-based awards, all of which are intended to simplify various aspects of the accounting for share-based compensation. The ASU will require that the difference between the actual tax benefit realized upon option exercise or restricted share or restricted stock unit release and the tax benefit recorded based on the fair value of the stock award at the time of grant (the “excess tax benefits”) to be reflected as a reduction of the current period provision for income taxes with any shortfall recorded as an increase in the tax provision rather than as a component of changes to additional paid-in capital. The ASU will also require the excess tax benefit or detriment realized to be reflected as operating cash flows rather than financing cash flows. The standard is effective beginning January 1, 2017.
In February 2016, the FASB issued ASU 2016-02, Leases (Topic 842), that replaces existing lease guidance. Under this ASU, leases will be required to record right-of-use assets and corresponding lease liabilities on the balance sheet. This guidance is effective beginning January 1, 2019. The new standard is required to be applied with a modified retrospective approach to each prior reporting period presented. The Company has not yet determined the impact that the adoption of this guidance will have on our consolidated financial statements.
Management does not believe that any other recently issued, but not yet effective accounting pronouncements, if adopted, would have a material effect on the accompanying consolidated financial statements.
| F-15 |
NOTE 3 – INVENTORIES
Inventories consist of the following at December 31,:
| 2017 | 2016 | |||||||
| Raw materials | $ | 410,089 | $ | 410,089 | ||||
| Finished goods | 2,039 | 2,039 | ||||||
| Obsolescence reserve | (412,128 | ) | (412,128 | ) | ||||
| Total inventories | $ | - | $ | - | ||||
NOTE 4 - PROPERTY, PLANT AND EQUIPMENT, NET
Property, Plant and Equipment consist of the following at:
| As of December 31, 2017 | Cost | Accumulated Depreciation | Net Book Value | |||||||||
| Leasehold improvements | $ | 218,054 | $ | (40,635 | ) | $ | 177,419 | |||||
| Machinery and office equipment | 1,626,379 | (1,385,432 | ) | 240,947 | ||||||||
| Furniture and fixtures | 16,368 | (16,368 | ) | - | ||||||||
| Land | 243,859 | - | 243,859 | |||||||||
| Asset retirement obligation | 58,363 | (9,799 | ) | 48,564 | ||||||||
| Office and industrial buildings | 1,084,899 | (271,672 | ) | 813,227 | ||||||||
| Equipment under capital lease | 53,257 | (51,355 | ) | 1,902 | ||||||||
| Total | $ | 3,301,179 | $ | (1,775,261 | ) | $ | 1,525,918 | |||||
| As of December 31, 2016 | Cost | Accumulated Depreciation | Net Book Value | |||||||||
| Leasehold improvements | $ | 218,054 | $ | (32,029 | ) | $ | 186,025 | |||||
| Machinery and office equipment | 1,738,414 | (1,539,203 | ) | 199,211 | ||||||||
| Furniture and fixtures | 16,368 | (16,368 | ) | - | ||||||||
| Land | 273,118 | - | 273,118 | |||||||||
| Asset retirement obligation | 58,363 | (7,101 | ) | 51,262 | ||||||||
| Office and industrial buildings | 1,433,523 | (312,912 | ) | 1,120,611 | ||||||||
| Equipment under capital lease | 53,257 | (43,747 | ) | 9,510 | ||||||||
| Total | $ | 3,791,097 | $ | (1,951,360 | ) | $ | 1,839,737 | |||||
At December 31, 2017 and 2016, the Company recognized $190,009, and $578,108, respectively, of depreciation expense. At December 31, 2017 and 2016, machinery and equipment with a cost of $53,257 and $53,257 and accumulated amortization of $51,355 and $43,746, respectively, were under capital lease. During the periods ended December 31, 2017 and 2016, the Company recognized $7,608, and $7,608, respectively, of depreciation expense related to these assets under capital lease.
At December 31, 2017 and 2016, we recorded impairment loss on deposits and property, plant and equipment of $13,158 and $3,088,315, respectively in accordance to ASC 360-10-50-2 where an impairment loss will be recognized only if the carrying amount of the long-lived assets are not recoverable and exceeds its fair value. The charge in 2017 relates specifically to the sale of the 1783 Allanport property. The charges in 2016 relates to impairment of the reactors for Processor #2 and #3 which will be used for customer demonstration, spare parts for Processor #2 and #3,deposits and construction in progress materials for Processor #4 and #5.
At December 31, 2016, $257,865 of land, office and industrial building were classified as property,plant and equipment, net – held for sale. On March 31, 2017, the Company sold the land, office and industrial building.
| F-16 |
NOTE 5 - INCOME TAXES
The following table summarizes the activities for the year ended December 31,:
| 2017 | 2016 | |||||||
| Statutory tax rate: | ||||||||
| U.S. | 34 | % | 34 | % | ||||
| Foreign | 26.5 | % | 26.5 | % | ||||
| Loss from operations before recovery of income taxes: | ||||||||
| U.S. | $ | (1,603,917 | ) | $ | (5,498,587 | ) | ||
| Foreign | 129,912 | (201,448 | ) | |||||
| (1,474,005 | ) | $ | (5,700,035 | ) | ||||
| Expected income tax recovery | (510,905 | ) | $ | (1,834,259 | ) | |||
| Permanent differences | 1,889 | 1,771 | ||||||
| Other adjustments | (7,122,672 | ) | (853,583 | ) | ||||
| Change in Tax Rate | 7,019,512 | - | ||||||
| Increase in valuation allowance | 612,176 | 978,905 | ||||||
| Income tax recovery from continuing operations | $ | - | $ | - | ||||
The Company’s income tax recovery is allocated as follows:
The Company’s deferred tax assets and liabilities as at December 31, are as follows:
| 2017 | 2016 | |||||||
| Deferred Tax Assets | ||||||||
| Non-capital losses | $ | 13,700,176 | $ | 19,787,656 | ||||
| Reserve – Contingency | 81,415 | 151,613 | ||||||
| Property, plant and equipment | 258,553 | 394,348 | ||||||
| Accounts receivable | 146,965 | 237,944 | ||||||
| Accrued expenses | 317 | 514 | ||||||
| Fees and Payroll in Stocks and Options | 236,756 | 361,399 | ||||||
| Impairment Reserve | 490,680 | 788,789 | ||||||
| Other | 1,255 | 2,032 | ||||||
| 14,916,118 | 21,724,295 | |||||||
| Deferred Tax Liabilities | ||||||||
| Property, plant and equipment | (462,779 | ) | (768,111 | ) | ||||
| Less: Valuation allowance | (14,453,3391 | ) | (20,956,184 | ) | ||||
| $ | - | $ | - | |||||
The Company has $46,166,933 of US and $5,928,358 of foreign, non-capital income tax losses and they expire in the year 2037.
| F-17 |
The Company calculates its income tax expense by estimating the annual effective tax rate and applying that rate to the year-to-date ordinary income (loss) at the end of the period. The Company records a tax valuation allowance when it is more likely than not that it will not be able to recover the value of its deferred tax assets. For the years ended December 31, 2017 and 2016, the Company calculated its estimated annualized effective tax rate at 0% and 0%, respectively, for both the United States and Canada. The Company had no income tax expense on its $1,474,005 and $5,439,315 losses for the years ended December 31, 2017 and 2016, respectively.
The Company recognizes the financial statement benefit of a tax position only after determining that the relevant tax authority would more likely than not sustain the position following an audit. For tax positions meeting the more-likely-than-not threshold, the amount recognized in the financial statements is the largest benefit that has a greater than 50% likelihood of being realized upon ultimate settlement with the relevant tax authority. The Company recognizes interest accrued on uncertain tax positions as well as interest received from favorable tax settlements within interest expense. The Company recognizes penalties accrued on unrecognized tax benefits within selling, general and administrative expenses. As of December 31, 2017 and 2016, the Company had no uncertain tax positions.
On December 22, 2017, the Tax Cuts and Jobs Act (the “Act”) was signed into law. The Act decreases the U.S. corporate federal income tax rate from a maximum of 35% to a flat 21% effective January 1, 2018. The impact of the re-measurement on the Corporation’s net deferred tax asset, as of December 31, 2017, was an approximately $7,000,000 decrease in deferred tax assets, with a corresponding decrease in the Company’s valuation allowance, and no impact on income tax expense. The Act also includes a number of other provisions including, among others, the elimination of net operating loss carrybacks and limitations on the use of future losses, the repeal of the Alternative Minimum Tax regime and the repeal of the domestic production activities deduction. These provisions are not expected to have a material effect on the Corporation.
Given the significant complexity of the Act and anticipated additional implementation guidance from the Internal Revenue Service, further implications of the Act may be identified in future periods.
The Company does not anticipate any significant changes to the total amounts of unrecognized tax benefits in the next twelve months. The years ended December 31, 2013 through December 31, 2017 are open tax years.
| F-18 |
NOTE 6 – SECURED PROMISSORY NOTES - RELATED PARTY
Related Party notes payable consists of the following at periods ended:
| As
of December 31, 2017 |
As
of December 31, 2016 |
|||||||
| Secured Demand Promissory Note (provided by a related party) bearing interest of 4% per annum. | $ | 1,969,121 | $ | 1,695,926 | ||||
| Secured Demand Promissory Note (provided by a related party) bearing interest of 12% per annum. | 588,651 | 567,402 | ||||||
| Secured Promissory Notes (provided by a related party -$1,000,000 in November 19, 2014) bearing interest of 12% per annum compounded annually, together with a five-year warrant to purchase up to one million shares of the Company’s common stock at an exercise price of $0.12 per share, and payable upon maturity in 2019 and secured by a security interest in substantially all of the assets of the Company and its subsidiaries. | 1,413,186 | 1,248,894 | ||||||
| Secured Promissory Notes (provided by a related party - $1,000,000 in August 29, 2013 and $2,000,000 in September 31, 2014) bearing interest of 12% per annum compounded annually, together with a five-year warrant to purchase up to three million shares of the Company’s common stock at an exercise price of $0.54 per share and payable upon maturity in 2018 and secured by a security interest in substantially all of the assets of the Company and its subsidiaries. | 4,746,490 | 4,041,737 | ||||||
| Secured Promissory Note -$100,000 in August 24, 2016 bearing interest of 12% per annum compounded annually, together with a five-year warrant to purchase up to one million shares of the Company’s common stock at an exercise price of $0.12 per share, and payable upon maturity in 2021 and secured by a security interest in substantially all of the assets of the Company and its subsidiaries. | 115,276 | 102,368 | ||||||
| Secured Promissory Note -$400,000 in October 18, 2016 bearing interest of 12% per annum compounded annually, together with a five-year warrant to purchase up to one million shares of the Company’s common stock at an exercise price of $0.12 per share, and payable upon maturity in 2021 and secured by a security interest in substantially all of the assets of the Company and its subsidiaries. | 443,757 | 389,847 | ||||||
| Total | 9,276,481 | 8,046,174 | ||||||
| Short Term Demand Notes Payable | $ | 2,557,772 | $ | 2,263,328 | ||||
| Short Term Secured promissory notes – related party | $ | 4,746,490 | $ | - | ||||
| Long Term Secured promissory notes – related party | $ | 1,972,219 | $ | 5,782,847 | ||||
| ShortTerma and Long Term promissory notes – related party | $ | 6,718,709 | $ | 5,782,847 | ||||
| Continuity of Secured Promissory Notes – Related Party | As
of December 31, 2017 |
As
of December 31, 2016 |
||||||
| Face value of November 19, 2014 secured note payable | $ | 1,000,000 | $ | 1,000,000 | ||||
| Face value of August 29, 2013 secured note payable | 1,000,000 | 1,000,000 | ||||||
| Face value of September 30, 2013 secured note payable | 2,000,000 | 2,000,000 | ||||||
| Face value of August 25, 2016 secured note payable | 100,000 | 100,000 | ||||||
| Face value of October 18, 2016 secured note payable | 400,000 | 400,000 | ||||||
| Total face value of promissory notes payable | 4,500,000 | 4,500,000 | ||||||
| Discount on November 19, 2014 secured notes payable (1,000,000 warrants) | (58,082 | ) | (58,082 | ) | ||||
| Discount on August 29, 2013 secured note payable (1,000,000 warrants) | (310,200 | ) | (310,200 | ) | ||||
| Discount on September 30, 2013 secured note payable (2,000,000 warrants) | (600,400 | ) | (600,400 | ) | ||||
| Discount on August 24, 2016 secured notes payable (100,000 warrants) | (2,000 | ) | (2,000 | ) | ||||
| Discount on October 18, 2016 secured notes payable (500,000 warrants) | (20,000 | ) | (20,000 | ) | ||||
| Accretion of discount on secured notes payable ($4,000,000 secured note payable) | 818,480 | 624,744 | ||||||
| Accretion of discount on secured notes payable ($500,000 secured note payable) | 5,200 | 800 | ||||||
| Interest on secured notes payable($4,000,000 secured note payable) | 2,309,878 | 1,634,570 | ||||||
| Interest on secured notes payable($500,000 secured note payable) | 75,833 | 13,814 | ||||||
| Carrying value of Short Term and Long Term Secured Promissory Notes | $ | 6,718,709 | $ | 5,782,847 | ||||
| The following annual payments of principal and interest are required over the next five years in respect to these short term and long term related party secured notes payables: | 9,276,481 | |||||||
| Years Ending December 31, | Annual Payments | |||||||
| 2018 | 7,304,262 | |||||||
| 2019 | 1,413,186 | |||||||
| 2020 | - | |||||||
| 2021 | 559,033 | |||||||
| Total | $ | 9,276,481 | ||||||
| F-19 |
NOTE 7 – SECURED PROMISSORY NOTES
Secured notes payable consists of the following at periods ended:
| As
of December 31, 2017 | As
of December 31, 2016 | |||||||
| Secured Promissory Note -$100,000 in August 10, 2016 bearing interest of 12% per annum compounded annually, together with a five-year warrant to purchase up to one million shares of the Company’s common stock at an exercise price of $0.12 per share, and payable upon maturity in 2021 and secured by a security interest in substantially all of the assets of the Company and its subsidiaries. | 115,802 | 102,838 | ||||||
| Total | 115,802 | 102,838 | ||||||
| Less: current portion | - | - | ||||||
| Secured promissory notes | $ | 115,802 | $ | 102,838 | ||||
| Continuity of Secured Promissory Notes | As
of December 31, 2017 | As
of December 31, 2016 | ||||||
| Face value of August 10, 2016 secured note payable | $ | 100,000 | $ | 100,000 | ||||
| Total face value of promissory notes payable | 100,000 | 100,000 | ||||||
| Discount on August 10, 2016 secured notes payable (100,000 warrants) | (2,000 | ) | (2,000 | ) | ||||
| Accretion of discount on secured notes payable ($100,000 secured note payable) | 533 | 133 | ||||||
| Interest on secured notes payable($500,000 secured note payable) | 17,269 | 4,705 | ||||||
| Carrying value of Secured Promissory Notes | $ | 115,802 | $ | 102,838 | ||||
| The following annual payments of principal and interest are required over the next five years in respect to these secured notes payable: | ||||||||
| Years Ending December 31, | Annual Payments | |||||||
| 2017 | $ | - | ||||||
| 2018 | - | |||||||
| 2019 | - | |||||||
| 2020 | - | |||||||
| 2021 | 115,802 | |||||||
| Total | $ | 115,802 | ||||||
| F-20 |
NOTE 8 - MORTGAGES PAYABLE AND CAPITAL LEASES
The Mortgages Payable and Capital Leases consists of the following at periods ending:
| As
of December 31, 2017 | As
of December 31, 2016 | |||||||
| Mortgage in the amount of $280,000 Canadian dollars, bears simple interest at 7% per annum, secured by the land and building, and matured on June 15, 2015. Principal and interest were due, in their entirety, at maturity. In consideration for 10,000 shares, the maturity was extended from June 15, 2015 to December 15, 2015 and subsequently to June 15, 2016 by the Mortgage holder. The mortgage was repaid on March 31, 2017. | $ | - | (1) | $ | 206,910 | (1) | ||
| Equipment capital lease bears interest at 3.9% per annum, secured by the equipment and matured on May 10, 2016, Principal and interest were due, in their entirety, at maturity. The maturity was extended to May 10, 2016 by the Lessor. The capital lease is in default. | 21,362 | (2) | 20,546 | (2) | ||||
| Total | 21,362 | 227,455 | ||||||
| Less: current portion | 21,362 | 227,455 | ||||||
| Mortgages payable and capital leases | $ | - | $ | - | ||||
(1) Based on $280,000 Canadian dollars converted to U.S. Dollars using the conversion rate on December 31, 2016.
(2) Includes accrued interest
| F-21 |
NOTE 9 – COMMITMENTS AND CONTINGENCIES
Commitments
Plastic2Oil Marine, Inc., one of the Company’s subsidiaries, which is currently not operating, entered into a consulting service contract in 2010 with a company owned by the Company’s chief executive officer. The contract provides the related company with a share of the operating income earned from Plastic2Oil technology installed on marine vessels which are owned by the related company. The contract provides a minimum future payment equal to fifty percent of the operating income generated from the operations of two of the most profitable marine vessel processors and 10% from all other marine vessel processors. At December 31, 2017, there were no currently installed marine vessel processors pursuant to the contract.
At December 31, 2016, we recorded impairment loss $1,448,464 on the deposits in accordance to ASC 360-10-50-2 where an impairment loss will be recognized only if the carrying amount of the long-lived assets are not recoverable and exceeds its fair value. The Company will be required to pay approximately $235,000 upon the delivery of these assets which is expected occur with the delivery of processor #4 and processor #5. As of December 31, 2017, the Company has committed to purchase certain pieces of key machinery from vendors related to the future expansion of its operations.
Contingencies
As of December 31, 2017, the Company is involved in litigation and claims which arise from time to time in the normal course of business. In the opinion of management, based upon the information and facts known to them, any liability that may arise from such contingencies would not have a material adverse effect on the consolidated financial statements of the Company.
| F-22 |
NOTE 10 – STOCKHOLDERS’ DEFICIT
| F-23 |
Warrants
The following table summarizes the activities for the years ended December 31, 2017 and 2016:
| Weighted | Weighted | |||||||||||
| Warrants | Average | Average | ||||||||||
| Number | Exercise Price | Remaining Term | ||||||||||
| OUTSTANDING, December 31, 2015 | 14,350,000 | $ | 0.19 | 1.8 | ||||||||
| Issued | 600,000 | 0.12 | 4.9 | |||||||||
| OUTSTANDING, December 31, 2016 | 14,950,000 | $ | 0.18 | 0.9 | ||||||||
| Expired | 10,100,000 | 0.09 | ||||||||||
| OUTSTANDING, December 31, 2017 | 4,850,000 | $ | 0.38 | 1.3 | ||||||||
Pursuant to a secured debt issuances on August 10, 2016, August 24, 2016 and October 25, 2016, the Company issued 600,000 warrants, to purchase shares of common stock for $0.12 per share to the holder of the secured debt. The warrants have a five year term from the date of issuance, as such the corresponding expiry dates are August 10, 2021, August 25, 2021 and October 25, 2021 respectively. The Company allocated $24,000 of the proceeds to the warrants based on their relative fair value. Such amount was recorded as a discount against the debt and in being amortized in to interest expense through the maturity date of the debt. The relative fair value of the warrants was determined on the date of the grant using the Black-Scholes pricing model with the following assumptions:
| 2016 | ||||
| Expected life (in years) | 7.00 | |||
| Risk-free interest rate | 0.05 | % | ||
| Expected volatility | 152.09%-306.83 | |||
| Expected dividend yield | 0 | % | ||
There were no warrants issued during the twelve months ended December 31, 2017. 10,600,000 warrants issued during the 2014 subscriptions expired in 2017.
NOTE 11 – STOCK-BASED COMPENSATION PLANS AND AWARDS
The Company’s 2012 Long Term Incentive Plan (the “2012 Plan”) provides for the issuance of stock options, restricted stock units and other stock-based awards to members of management and key employees. The 2012 Plan is administered by the compensation committee of the Board of Directors of the Company, or in the absence of a committee, the full Board of Directors of the Company. The Plan was enacted in July 2012, and prior to this time, no plan and consequently, no stock options or shares of restricted stock were granted under an equity compensation plan.
Valuation of Awards
The per-share fair value of each stock option granted during the year ended December 31, 2017 and 2016 was determined on the date of grant using the Black-Scholes option pricing model using the following assumptions:
| 2017 | 2016 | |||||||
| Expected life (in years) | 7.0 | 7.00 | ||||||
| Risk-free interest rate | 2.5 | % | 0.05 | % | ||||
| Expected volatility | 311.98 | 306.83 | ||||||
| Expected dividend yield | 0 | % | 0 | % | ||||
Stock Options-2012 Plan
There were 50,000 options granted during the year ended December 31, 2017. There were 3,000,000 options granted during the year ended December 31, 2016. For years ended December 31, 2017 and 2016, the Company recorded stock-based compensation expense (included in selling, general and administrative expense) of $63,170 and $419,331, respectively, related to stock options. As of December 31, 2017, 2,380,000 options are vested (1,040,000 at $1.50 per share, 240,000 at $0.38 per share, and 1,100,000 at $.005 per share).
| F-24 |
A summary of stock option activity for the years ended December 31, 2017 and 2016 is as follows:
| Outstanding | Weighted-Average | Aggregate | ||||||||||
| Stock Options | Exercise Price | Intrinsic Value (1) | ||||||||||
| Balance as of December 31, 2015 | 1,628,000 | $ | 1.30 | $ | - | |||||||
| Issued | 3,000,000 | 0.05 | - | |||||||||
| Expired | (238,000 | ) | 0.38 | - | ||||||||
| Balance as of December 31, 2016 | 4,390,000 | $ | 1.12 | $ | - | |||||||
| Expired | (60,000 | ) | 0.38 | - | ||||||||
| Issued | 50,0000 | $ | 0.05 | $ | - | |||||||
| Balance as of December 31, 2017 | 4,380,000 | 0.42 | ||||||||||
| Exercisable as of December 31, 2017 | 2,330,000 | $ | 0.72 | $ | - | |||||||
| Equity awards available for grant, net of restricted stock (811,576) at December 31, 2017 | 4,808,424 | |||||||||||
| (1) | Amounts represent the difference between the exercise price and the fair value of common stock at period end for all in the money options outstanding based on the fair value per share of common stock. |
Restricted Stock
The fair value of the restricted stock is expensed ratably over the vesting period. During the years ended December 31, 2017 and 2016, the Company recorded stock-based compensation expense related to restricted stock of approximately $63,170 and $120,667, respectively.
2016 Incentive Plan (Rahoul S Banerjea)
On October 25, 2016, the Board awarded Rahoul S Banerjea, the chief financial officer 2,250,000 options to purchase shares of common stock at $0.17 per share. This grant was independent of the Company’s 2012 long term incentive plan. The purpose of this award was to further incentivize Mr. Banerjea and promote the interests of the Company, its subsidiaries and its stockholders by enabling the Company and its subsidiaries to attract, retain and motivate executive employees of the Company and/or its subsidiaries, and to align the interests of those individuals and the Company’s stockholders. At December 31, 2016, all 2,250,000 were vested and an expense of $90,000 was recognized.
| F-25 |
Stock Options-2016 Plan
A summary of stock option activity for the years ended December 31, 2017 and 2016 is as follows:
| Outstanding | Weighted-Average | Aggregate | ||||||||||
| Stock Options | Exercise Price | Intrinsic Value (1) | ||||||||||
| Balance as of December 31, 2015 | - | $ | - | $ | - | |||||||
| Issued | 2,250,000 | 0.17 | - | |||||||||
| Balance as of December 31, 2016 | 2,250,000 | $ | 0.17 | $ | - | |||||||
| Balance as of December 31, 2017 | 2,250,000 | $ | 0.17 | $ | - | |||||||
| Exercisable as of December 31, 2017 | 2,250,000 | $ | 0.17 | $ | - | |||||||
NOTE 12 – RETIREMENT PLAN
The Company adopted a defined contribution benefit plan (the “Defined Contribution Plan”) for our U.S. employees which complies with section 401(k) of the Internal Revenue Code. The Company does not currently match any of the employee contributions. Employees are not required to make contributions into the fund. For the years ended December 31, 2017 and 2016, $31,051 and $30,460 respectively were contributed by employees. Total administrative expense under this plan was $3055, and $2,097 for the years ended December 31, 2017, and 2016 respectively.
NOTE 13 – RELATED PARTY TRANSACTIONS AND BALANCES
From June 2014 to December 31, 2017, Mr. Heddle, the Company’s Chief Executive Officer, or his affiliated companies made several personal loans to the company to provide working capital. As of December 31, 2017, the current aggregate outstanding balance, including accrued interest at 4% per annum, due and owing to Mr. Heddle was $1,969,121. (See Note 6).
On February 11, 2016, the Company issued a promissory note in favor of Richard Heddle, the Company’s President, Chief Executive Officer and Chairman of the Company’s board of directors, to memorialize various advances which were made by Mr. Heddle to the Company from February 11, 2016 until March 31, 2016. As of December 31, 2017, the current aggregate outstanding balance including accrued interest at 12% per annum was $588,651. (See Note 6).The promissory note bears interest at the rate of 12% per annum. All principal and interest on the promissory note is due and payable in full by the Company on demand. The repayment of promissory note will be secured by assets of the Company. The proceeds of these advances are being used for working capital purposes.
At December 31, 2017 and 2016, the company’s accounts payable and accrued expenses included $132,217 and $132,218, respectively, outstanding balance due to Heddle Marine Services, a business controlled by Mr. Richard Heddle, the company’s Chief Executive Officer and member of the Company’s board of directors. The amounts payable arose from payments made in 2014 by Heddle Marine on behalf of the company to a logistics company to transport fuel from the Niagara Falls site to the blending tanks at our facility in Thorold, Ontario, as well as for labor and material provided by Heddle Marine towards upkeep of our Canadian facilities including 2015 cleanup costs incurred in order to terminate the lease with Avondale properties on the discontinued (RRON) Operation. In addition, in 2016, $12,500 was paid for feedstock analysis to a business where Mr.Richard Heddle holds a material financial interest.
On August 24, 2016, the Company issued to Hilander Limited, a business controlled by Mr. Jason Aspin, presently one of the Company’s directors, a $100,000 Secured Promissory Note bearing interest of 12% per annum compounded annually, together with a five-year warrant to purchase up to one hundred thousand shares of the Company’s common stock at an exercise price of $0.12 per share, and payable upon maturity in 2021 and secured by a security interest in substantially all of the assets of the Company and its subsidiaries. On October 12, 2017, Mr. Aspin was appointed a Board member of the Company. As of December 31, 2017 and December 31, 2016, the aggregate outstanding balance, including accrued interest at 12% per annum, was 115,276 and $102,368, respectively. (See Note 6).
On October 18, 2016. the Company issued to Atlantic Advances Power Technologies, a business controlled by Mr. Aspin, a $400,000 Secured Promissory Note bearing interest of 12% per annum compounded annually, together with a five-year warrant to purchase up to four hundred thousand shares of the Company’s common stock at an exercise price of $0.12 per share, and payable upon maturity in 2021 and secured by a security interest in substantially all of the assets of the Company and its subsidiaries. Mr. Aspin was appointed a Board member of Plastic2Oil, Inc. As of December 31, 2017 and December 31, 2016, the aggregate outstanding balance, including accrued interest at 12% per annum, was $443,757 and $389,847, respectively. (See Note 6).
| F-26 |
Plastic2Oil Marine, Inc., one of the Company’s subsidiaries, which is currently not operating, entered into a consulting service contract in 2010 with a company owned by Mr. Heddle, who later (in 2014) became the Company’s Chief Executive Officer. The contract provides the related company with a share of the operating income earned from Plastic2Oil technology installed on marine vessels which are owned by the related company. The contract provides a minimum future payment equal to fifty percent of the operating income generated from the operations of two of the most profitable marine vessel processors and 10% from all other marine vessel processors. At December 31, 2017, there were no currently installed marine vessel processors pursuant to the contract.
NOTE 14 – SEGMENT REPORTING
During 2017 and 2016, the Company had two principal operating segments, Plastic2Oil and the Data Business. These operating segments were determined based on the nature of the products and services offered. Operating segments are defined as components of an enterprise about which separate financial information is available that is evaluated regularly by the chief operating decision-maker in deciding how to allocate resources and in assessing performance. The Company’s Chief Executive Officer has been identified as the chief operating decision maker, and directs the allocation of resources to operating segments based on the profitability and cash flows of each respective segment.
The Company evaluates performance based on several factors, of which the primary financial measure is net income. The accounting policies of the business segments are the same as those described in “Note 2: Summary of Accounting Policies.” The following tables show the operations of the Company’s reportable segments:
| F-27 |
Year Ended December 31, 2017
| Data Recovery & Migration | P2O | Other | Total | |||||||||||||
| Sales | $ | - | $ | - | $ | - | $ | - | ||||||||
| Cost of Sales | $ | - | $ | - | $ | - | $ | - | ||||||||
| Total Operating Expenses | $ | - | $ | 410,583 | $ | 1,151,193 | $ | 1,561,776 | ||||||||
| Profit (Loss) from Operations | $ | $ | (410,583 | ) | $ | (1,151,193 | ) | $ | (1,561,776 | ) | ||||||
| Other Income (Expenses) | $ | - | $ | 540 | $ | 87,231 | $ | 87,771 | ||||||||
| Net Income(Loss) from Continuing Operations | $ | $ | (410,043 | ) | $ | (1,063,962 | )(1) | $ | (1,474,005 | ) | ||||||
| Total Assets | $ | - | $ | 1,130,516 | $ | 690,598 | $ | 1,821,114 | ||||||||
| Accounts Receivable | $ | $ | - | $ | - | $ | ||||||||||
| Inventories | $ | - | $ | - | $ | - | $ | - | ||||||||
Year Ended December 31, 2016
| Data Recovery & Migration | P2O | Other | Total | |||||||||||||
| Sales | $ | 21,950 | $ | - | $ | - | $ | 21,950 | ||||||||
| Cost of Sales | $ | 8,438 | $ | - | $ | - | $ | 8,438 | ||||||||
| Total Operating Expenses | $ | - | $ | 923,945 | $ | 919,413 | $ | 1,843,358 | ||||||||
| Profit (Loss) from Operations | $ | 13,512 | $ | (923,945 | ) | $ | (919,413 | ) | $ | (1,829,846 | ) | |||||
| Other Income (Expenses) | $ | - | $ | (3,089,934 | ) | $ | (780,255 | ) | $ | (3,870,189 | ) | |||||
| Net Income(Loss) from Continuing Operations | $ | 13,512 | $ | (34,933,292 | ) | $ | (1,699,668 | )(1) | $ | (5,700,035 | ) | |||||
| Total Assets | $ | - | $ | 2,275,577 | $ | - | $ | 2,275,577 | ||||||||
| Accounts Receivable | $ | 21,950 | $ | - | $ | - | $ | 21,950 | ||||||||
| Inventories | $ | - | $ | - | $ | - | $ | - | ||||||||
(1) Included Inter-company Receivable and Payables elimination
All receivables from the Data Recovery & Migration Business were generated in the United States for the year ended December 31, 20. For the year ended December 31, 2017 and 2016, there were no P2O sales.
As of March 31, 2012, due to the conclusion that the Company could not substantiate when a significant amount of revenues would be earned from the Data Business, all property, plant and equipment assets related to the Data Business were determined to be impaired and was recorded to write the assets down to $0. On March 2, 2017, the Data Business was sold to 2335524Ontario Inc. All other amounts included in the measure of segment profit or loss related to the Data business are not material. Other than as noted above, the amounts shown for Operating Expenses and Other Income (Expense) items on the consolidated statements of operations related to the P2O segment.
P2O assets include the Company headquarters and various machinery and equipment used at the aforementioned sites and at the Niagara Falls Facility. As of December 31, 2017, total long-lived assets of $1,330,780 and $195,138, were located in the United States and Canada, respectively As of December 31, 2016, total long-lived assets of $1,832,078 and $344,671 were located in the United States and Canada, respectively. The mortgage payable of $206,910 and the equipment capital lease which matured on June 15, 2016, both disclosed in Note 8, relate to assets held in Canada.
| F-28 |
NOTE 15 – RISK MANAGEMENT
Concentration of Credit Risk
The Company maintains cash balances, at times, with financial institutions in excess of amounts insured by the Canada Deposit Insurance Corporation and the U.S. Federal Deposit Insurance Corporation. Management monitors the soundness of these institutions and has not experienced any collection losses with these financial institutions.
There were no revenue and accounts receivable for the year ended December 31, 2017. During the years ended December 31, 2016, 100% of total net revenues were generated from a single customer and segment, Data Business. As of December 31, 2016, one customer and segment, Data Business, accounted for 100.0% of accounts receivable.
During the years ended December 31, 2017 and 2016 two and four suppliers, respectively, accounted for 34.3% and 28.4% of accounts payable,
Contingencies
As of December 31, 2017, the Company is involved in litigation and claims which arise from time to time in the normal course of business. In the opinion of management, based upon the information and facts known to them, any liability that may arise from such contingencies would not have a material adverse effect on the consolidated financial statements of the Company.
NOTE 16 – DISCONTINUED OPERATIONS AND ASSETS HELD FOR SALE
Regional Recycling of Niagara
During the third quarter of 2013, the Company determined that, due to the significant losses incurred by Regional Recycling of Niagara, and the continuous need to fund their operations through the Company’s Plastic2Oil operations, that it would shut down the operations of the facility. The decision to do this was based on the following factors:
| ● | The inventory processed over the prior months at Regional Recycling of Niagara was comingled with contaminated materials that made the significant majority of their inventory worthless without significant additional processing and labor; |
| ● | The fixed assets utilized at the facility were old and beginning to become in need of significant repairs, which would have been a significant cost to maintain; |
| ● | The pre-processing cost of plastic at Regional Recycling of Niagara was significant and was a hindrance to the Company becoming profitable on a cost per gallon of fuel basis; and |
| ● | The Company leases the Recycling Facility in Thorold, Ontario, Canada with terms remaining of up to 14 years. |
The property was vacated on November 10, 2015 and the lease was terminated on January 15, 2016 effective October 31, 2015 with no penalty for early termination. This resulted in adjusting the short-term and long-term obligations set up in 2013 to zero, which resulted in a $195,044 income. The results of operations from Regional Recycling of Niagara for the years ended December 31, 2017 and 2016 have been classified as discontinued operations.
NOTE 17 – SUBSEQUENT EVENTS
On February 16, 2018, the Company received a secured short term demand loan from Mr. Jason C. Aspin in the amount of CAD$100,000. Mr. Aspin is a director of the company. The funds are to be used towards ongoing operating expenses.
On March 2, 2018 the Data Business was sold to 2335524Ontario Inc. for $10,500. This was a cashless transaction as the sale proceeds will be used to offset Plastic2Oil outstanding payables to 2335524Ontario Inc.2335524 Ontario Inc. is a business owned by Mr. John Bordynuik, former employee, significant stockholder and founder of Plastic2Oil Inc.
On March 23, 2018, the Restricted cash (Note2) was released by the State of NY. The $100,524 will be used towards ongoing operating expenses.
| F-29 |
ITEM 9. CHANGES IN AND DISAGREEMENTS WITH ACCOUNTANTS ON ACCOUNTING AND FINANCIAL DISCLOSURE
Not applicable.
ITEM 9A. CONTROLS AND PROCEDURES
Evaluation of disclosure controls and procedures
Under the supervision and with the participation of our management, including our principal executive officer and principal financial officer, we conducted an evaluation of our disclosure controls and procedures, as such term is defined under Rule 13a-15(e) and Rule 15d-15(e) promulgated under the Securities Exchange Act of 1934, as amended (the “Exchange Act”), as of December 31, 2016. Based on this evaluation, our principal executive officer and principal financial officer concluded that as of December 31, 2017 our disclosure controls and procedures were ineffective to ensure that information required to be disclosed by us in the reports we file or submit under the Exchange Act is recorded, processed, summarized, and reported within the time periods specified in the SEC’s rules and forms, and that such information is accumulated and communicated to the Company’s management, including the Company’s CEO and CFO, as appropriate, to allow timely decisions regarding required disclosure.
The company does not maintain separately designated audit, compensation, nominating and corporate governance committees.
| 37 |
MANAGEMENT’S REPORT ON INTERNAL CONTROL OVER FINANCIAL REPORTING
Management of the Company is responsible for establishing and maintaining effective internal control over our financial reporting as defined in Rule 13a-15(f) under the Exchange Act. The Company’s internal control over financial reporting is intended to be designed to provide reasonable assurance to the Company’s management and Board of Directors regarding the preparation and fair presentation of published financial statements in accordance with United States generally accepted accounting principles (U.S. GAAP), including those policies and procedures that: (i) pertain to the maintenance of records that, in reasonable detail, accurately and fairly reflect the transactions and dispositions of the assets of the Company, (ii) provide reasonable assurance that transactions are recorded as necessary to permit preparation of financial statements in accordance with U.S. GAAP and that receipts and expenditures are being made only in accordance with authorizations of management and directors of the Company, and (iii) provide reasonable assurance regarding prevention or timely detection of unauthorized acquisition, use, or disposition of the Company’s assets that could have a material effect on our financial statements. Management conducted an evaluation of the effectiveness of our internal control over financial reporting based on the framework in Internal Control- Integrated Framework issued by the Committee of Sponsoring Organizations of the Treadway Commission. Management’s assessment included an evaluation of the design of our internal control over financial reporting and testing of the operational effectiveness of our internal control over financial reporting as of December 31, 2017. Based on this assessment, management, including our principal executive officer and our principal financial officer, concluded that the Company’s internal controls over financial reporting were ineffective as of December 31, 2017.
Because of its inherent limitations, internal control over financial reporting may not prevent or detect misstatements. Therefore, even those systems determined to be effective can provide only reasonable assurance with respect to financial statement preparation and presentation. Management’s report was not subject to attestation by our registered public accounting firm.
Management’s Discussion of Material Weakness
A material weakness is a significant deficiency in internal controls that results in more than a remote likelihood that a material misstatement of the financial statements may occur as a result of the deficiency and is important enough to merit attention by those responsible for oversight of a company’s financial reporting. The Company’s material weaknesses are a result of a lack of policies and procedures, with the associated internal controls, to appropriately address entity level matters. Management concluded that the lack of adherence to the Board of Directors’ policies and more specifically, the Audit Committee Charter, which requires a three member committee with one member qualified as a “financial expert”, caused a failure at the entity level for proper governance over the Company’s financial reporting environment. Additionally, the company does not have a control in place to identify and communicate related party transactions to those charged with financial reporting.
Management acknowledges its responsibility for internal controls over financial reporting and seeks to continually improve these controls. In order to achieve compliance with Section 404 of the Sarbanes Oxley Act (“Section 404”), we are performing the system and process documentation and evaluation needed to comply with Section 404, which is both costly and challenging. We believe our process for documenting, evaluating and monitoring our internal control over financial reporting is consistent with the objectives of Section 404.
Changes in Internal Controls over Financial
There have been no changes in our internal controls during the year ended December 31, 2017.
None.
| 38 |
ITEM 10. DIRECTORS, EXECUTIVE OFFICERS AND CORPORATE GOVERNANCE
The following table sets forth, as of April 2, 2018, the names and ages of all of our directors and executive officers and all positions and offices held by such individuals. Each director will hold such office until the next annual meeting of shareholders and until his or her successor has been elected and qualified.
| Name | Age | Position | ||
| Rick W. Heddle | 52 | President, CEO and Director | ||
| Philip J. Bradley | 65 | Director | ||
Jason C. Aspin |
51 | Director | ||
Lee C. Brain |
50 | Director | ||
| Rahoul S. Banerjea | 67 | Chief Financial Officer |
Certain Biographical Information
The following summarizes the occupation and business experience of our officers and directors:
Richard W. Heddle, has served as a director and as the President and Chief Executive Officer of our company since August 14, 2013. Mr. Heddle is an entrepreneur with over 25 years of executive business experience. Since 1987, Mr. Heddle has been the owner and President of Heddle Marine Services, Inc., the largest marine repair firm that operates floating dry docks on the Canadian side of the Great Lakes. Mr. Heddle grew the company from a small start-up with two employees to a company that employs over 60 people. Mr. Heddle has significant expertise in logistics, supply chain analytics and managing production and brings over 25 years of comprehensive experience in fabrication, engineering and machinery. This experience and these qualifications led the Board to conclude that Mr. Heddle should serve as a director of our company.
Philip J. Bradley, has served as a director of our company since August 14, 2013. Mr. Bradley has over 35 years of executive accounting and business experience. For the past ten years, Mr. Bradley has been working in private practice as a Chartered Professional Accountant. Previously, Mr. Bradley worked as an Audit Manager and former partner of Grant Thornton Canada, where he worked for 29 years. Mr. Bradley also served two three-year terms in the firm’s national office, where he was responsible for recruitment, human resource administration, as well as providing support services to the firm’s professional practice offices. Mr. Bradley is a member of the Canadian Institute of Chartered Accountants and the Institute of Chartered Accountants of both Ontario and Nova Scotia. He received a Bachelor of Business Administration from the University of Prince Edward Island in 1975 and was admitted to the Institute of Chartered Accountants of Nova Scotia in 1976. This experience and these qualifications led the Board to conclude that Mr. Bradley should serve as a director of our company.
Jason C. Aspin, has served as a director of our company since October 12, 2017. He is the Chief Executive Officer and Chief Technology Officer of Aspin Kemp & Associates (AKA), a Canadian technology company providing innovation and solutions to marine and land based power, energy and power to process applications. Mr. Aspin cofounded AKA in 1996 and has served on AKA’s board of directors for 21 years. He is a graduate of the Canadian Coast Guard College Marine Engineering program. The Board has concluded that Mr. Aspin is qualified to serve as a director of the Company because of his 22 years of executive business experience in the industrial electrical, automation and mechanical industry.
Lee C. Brain, has served as a director of our company since October 12, 2017. He is the owner and operator of Hess Millwork, a custom commercial cabinetry manufacturing business that services architectural and commercial construction firms. He founded Hess Millwork in 1996 and currently manages and oversees sales, estimating and production management staff with a focus on logistics, safety and quality. The Board has concluded that Mr. Brain is qualified to serve as a director of the Company due to his 27 years of executive experience, as well as his significant experience in business strategy and decision-making
Rahoul S. Banerjea, has served as Chief Financial Officer of the Company since March 2014. Prior to joining the Company, from 2013 to March 2014, Mr. Banerjea was the principal of Matun Group LLC, a global professional services firm providing interim CFO and project management services, located in Sudbury, Massachusetts. From 2007 to 2013, Mr. Banerjea was a Partner, New England Practice, at Tatum, a national professional services firm providing leadership roles, located in Boston, Massachusetts. Prior to this period, Mr. Banerjea held senior financial management roles with technology start-ups and global technology companies. Mr. Banerjea is also a member of the Board of the American School of Madrid Foundation and a former member of the Board of the Boston Chapter Financial Executives International. Mr. Banerjea received his B.S.B.A. from Drexel University and is a Certified Public Accountant. Mr. Banerjea brings more than 30 years of experience in finance and accounting to the Company’s executive management team.
| 39 |
Family Relationships
There are no family relationships between any of the Company’s directors or officers.
Involvement in Certain Legal Proceedings
Except as set forth above, to the best of our knowledge, during the past ten years, no director or officer of the Company has been involved in any of the following: (1) any bankruptcy petition filed by or against such person individually, or any business of which such person was a general partner or executive officer either at the time of the bankruptcy or within two years prior to that time; (2) any conviction in a criminal proceeding or being subject to a pending criminal proceeding (excluding traffic violations and other minor offenses); (3) being subject to any order, judgment, or decree, not subsequently reversed, suspended or vacated, of any court of competent jurisdiction, permanently or temporarily enjoining, barring, suspending or otherwise limiting his or her involvement in any type of business, securities or banking activities; and (4) being found by a court of competent jurisdiction (in a civil action), the SEC or the Commodity Futures Trading Commission to have violated a federal or state securities or commodities law, and the judgment has not been reversed, suspended, or vacated.
Adverse Proceedings
There exists no material proceeding to which any director or officer is a party adverse to the Company or has a material interest adverse to the Company.
Section 16(a) Beneficial Ownership Reporting Compliance
Section 16 of the Exchange Act requires that reports of beneficial ownership of common shares and changes in such ownership be filed with the SEC by Section 16 “reporting persons,” including directors, certain officers, holders of more than 10% of the outstanding common shares and certain trusts of which reporting persons are trustees. The Company is required to disclose in this Annual Report each reporting person whom we know to have failed to file any required reports under Section 16 on a timely basis during the fiscal year ended December 31, 2017. To our knowledge, based solely on a review of copies of Forms 3, 4 and 5 filed with the SEC and written representations that no other reports were required, during the fiscal year ended December 31, 2017, our officers, directors and 10% stockholders complied with all Section 16(a) filing requirements applicable to them.
Committees of the Board of Directors
Due to the fact that the Company currently has just two directors, one of whom is member of executive management and not independent, the Company does not maintain separately designated audit, compensation and nominating and corporate governance committees of the Board. Upon the appointment of additional directors, the Company intends to reconstitute such committees of the Board.
Independence of the Board of Directors
The Board is currently composed of four (4) members, three of whom qualify as an independent director in accordance with the published listing requirements of the NASDAQ Capital Market. The NASDAQ independence definition includes a series of objective tests, such as that the director is not, and has not been for at least three years, one of our employees and that neither the director nor any of his or her family members has engaged in various types of business dealings with us. Mr. Richard Heddle, one of the current directors, also serves as an executive officer of the Company, and thus is not independent.
| 40 |
Code of Ethics
We have adopted a code of ethics that applies to all of our executive officers, directors and employees. Code of ethics codifies the business and ethical principles that govern all aspects of our business. This document will be made available in print, free of charge, to any shareholder requesting a copy in writing from the Company. A copy of our code of ethics was filed with the Form 10-K for the year ended December 31, 2006, filed on March 2, 2007.
ITEM 11. EXECUTIVE COMPENSATION
Summary Compensation Table
The following summary compensation table sets forth all compensation awarded to, earned by, or paid to our “named executive officers” during the years ended December 31, 2017 and 2016:
Summary Compensation Table
| Name and Principal Position | Year Ended December 31, | Salary ($) | Bonus ($) | Stock Awards ($) (1) | Stock Awards ($) (2) | Non-Equity Incentive Plan Compensation ($) | Nonqualified
Deferred Compensation Earnings ($) | All Other Compensation ($) | Total ($) | |||||||||||||||||||||||||||
| Richard W.Heddle President & Chief Executive Officer, Director | 2017 | - | (1) | - | - | - | - | - | - | - | ||||||||||||||||||||||||||
| 2016 | - | - | - | - | - | - | - | - | ||||||||||||||||||||||||||||
| Rahoul S.Banerjea Chief Financial Officer | 2017 | 72,454 | (2) | - | - | - | - | - | - | 72,454 | ||||||||||||||||||||||||||
| 2016 | 49,237 | (2) | - | - | - | - | - | - | 49,237 | |||||||||||||||||||||||||||
Notes:
| (1) | Cash compensation paid is noted in the above table. Mr. Heddle’s employment commenced on August 14, 2013. Mr. Heddle’s elected to receive all of his annual salary compensation in shares of common stock which has not been paid. $240,000 has been accrued in each of 2017 and 2016 for such obligation. The dollar amounts do not necessarily reflect the dollar amounts of compensation actually realized or that may be realized by our named executive officers. | |
| (2) | Cash compensation paid is noted in the above table. Mr. Banerjea’s employment commenced on March 17, 2014. Mr. Banerjea significantly reduced his hours starting March 2016 to redirect cash towards operating expenses. Mr. Banerjea’s elected to receive $50,000 of his annual salary compensation in shares of common stock which has not been paid. $50,000 a has been accrued in each of 2017 and 2016 for such obligation. The dollar amounts do not necessarily reflect the dollar amounts of compensation actually realized or that may be realized by our named executive officers. |
Outstanding Equity Awards at Fiscal Year-End
The following table provides information on all restricted stock and stock option awards held by our named executive officers as of December 31, 2017.
OUTSTANDING EQUITY AWARDS AT FISCAL YEAR-END
| Option Awards | Stock Awards | |||||||||||||||||||||||||||||||
| Number of Securities Underlying Unexercised Options (#) Exercisable | Number of Securities Underlying Unexercised Options (#)Unexercisable | Equity Incentive Plan Awards: Number of Securities Underlying Unexercised Unearned Options (#) | Option Expiration Date | Number of Shares or Units of Stock That Have Not Vested (#) | Market Value of Shares or Units of Stock That have Not Vested ($) | Number of Unearned Shares, Units or Other Rights That Have Not Vested (#) | Equity Market or Payout Value of Unearned Shares, Units or Other Rights That Have Not Vested ($) | |||||||||||||||||||||||||
| Richard W. Heddle | - | - | - | - | - | - | - | |||||||||||||||||||||||||
| Rahoul S. Banerjea | 2,250,000 | 3,000,000 | 3,000,000 | 3/24/2023 | - | - | - | - | ||||||||||||||||||||||||
Option Exercises and Stock Vested During the Fiscal Year
During the fiscal year ended December 31, 2017, there were 5,250,000 awards to, no exercises of stock options by, 3,250,000 vesting of shares of restricted stock held by, our named executive officers.
| 41 |
OUTSTANDING EQUITY AWARDS AT FISCAL YEAR-END
DIRECTOR COMPENSATION
| Name | Year | Fees Earned or Paid in Cash ($) | Stock Awards ($) | Option Awards ($) | Non-Equity Incentive Plan Compensation (S) | Change
in Pension Value and Nonqualified Deferred Compensation Earnings ($) | All Other Compensation ($) | Total ($) | ||||||||||||||||||||||||
| Richard W. Heddle | 2017 | - | - | - | - | - | - | - | ||||||||||||||||||||||||
| 2016 | - | - | - | - | - | - | - | |||||||||||||||||||||||||
| Philip J. Bradley (1) | 2017 | - | - | - | - | - | - | - | ||||||||||||||||||||||||
| 2016 | - | - | - | - | - | - | - | |||||||||||||||||||||||||
| Jason C. Aspin | 2017 | - | - | 1,250 | (3) | - | - | - | - | |||||||||||||||||||||||
| 2016 | - | - | - | - | - | - | ||||||||||||||||||||||||||
| Lee C. Brain | 2017 | - | - | 1,250 | (3) | - | - | - | - | |||||||||||||||||||||||
| 2016 | - | - | - | - | - | - | ||||||||||||||||||||||||||
| (1) | Mr. Bradley has not receive either common stock or cash as compensation for 2017 and 2016. The dollar amounts do not necessarily reflect the dollar amounts of compensation actually realized or that may be realized by our named executive officers. | |
| (3) | Mr. Aspin and Mr. Brain received 25,000 option awards at $0.50 vesting over two years, upon joining the Board on October 18, 2017. |
Narrative Disclosure to Summary Compensation Table and Grants of Plan-Based Awards Table
Employment Agreements, Severance and Change In Control Plans
We currently have not entered into employment agreements with Richard W. Heddle, our President and Chief Executive Officer, or Mr. Rahoul S. Banerjea, our Chief Financial Officer.
2012 Long-Term Incentive Plan
On May 23, 2012, the Board adopted the JBI, Inc. 2012 Long-Term Incentive Plan (the “Plan”). The plan was subsequently approved by the Company’s stockholders at the Company’s 2012 annual meeting of stockholders.
The purpose of the Plan is to further and promote the interests of the Company, its subsidiaries and its stockholders by enabling the Company and its subsidiaries to attract, retain and motivate employees, directors and consultants or those who will become employees, directors and of the Company and/or its subsidiaries, and to align the interests of those individuals and the Company’s stockholders. To do this, the Plan offers performance-based incentive awards and equity-based opportunities providing employees, directors and consultants with a proprietary interest in maximizing the growth, profitability and overall success of the Company and/or its subsidiaries.
| 42 |
The maximum number of shares of our common stock as to which awards may be granted under the Plan may not exceed 10,000,000 shares. In the case of any individual participant, the maximum amount payable in respect of awards subject to performance criteria in any calendar year may not exceed four million shares of common stock. The limits on the numbers of shares described in this paragraph and the number of shares subject to any award under the Plan are subject to proportional adjustment as determined by the Board, to reflect certain stock changes, such as stock dividends and stock splits (see “Recapitalization Adjustments” below).
If any awards under the Plan expire or terminate unexercised, the shares of common stock allocable to the unexercised or terminated portion of such award shall again be available for award under the Plan.
Administration and Eligibility
The administration, interpretation and operation of the Plan will be vested in the Compensation Committee of the Board if and when one is designated, otherwise the Board itself shall administer the Plan (the Board or the Compensation Committee, if applicable, acting in such capacity, the “Committee”). The Committee may designate persons other than members of the Committee to carry out the day-to-day administration of the Plan. In addition, the Committee may, in its sole discretion, delegate day-to-day ministerial administration to persons other than members of the Committee, except that the Committee shall not delegate its authority with regard to selection for participation in the Plan and/or the granting of any awards to participants.
Employees, directors and consultants, or those who will become employees, directors and consultants of the Company and/or its subsidiaries are eligible to receive awards under the Plan. Awards under the Plan are granted by the Committee.
Awards Under The Plan
Awards under the Plan may consist of stock options, stock appreciation rights (“SARs”), restricted shares or performance unit awards, each of which is described below. All awards are evidenced by an award agreement between the Company and the individual participant and approved by the Committee. In the discretion of the Committee, an eligible employee, director or consultant may receive awards from one or more of the categories described below, and more than one award may be granted to an eligible employee, director or consultant.
Stock Options and Stock Appreciation Rights.
A stock option is an award that entitles a participant to purchase shares of common stock at a price fixed at the time the option is granted. Stock options granted under the Plan may be in the form of incentive stock options (which qualify for special tax treatment) or non-qualified stock options, and may be granted alone or in addition to other awards under the Plan. Non-qualified stock options may be granted alone or in tandem with SARs.
An SAR entitles a participant to receive, upon exercise, an amount equal to (a) the excess of (i) the fair market value on the exercise date of a share of common stock, over (ii) the fair market value of a share of common stock on the date the SAR was granted, multiplied by (b) the number of shares of common stock for which the SAR has been exercised.
The exercise price and other terms and conditions of stock options and the terms and conditions of SARs will be determined by the Committee at the time of grant, provided, however, that the exercise price per share may not be less than 100 percent of the fair market value of a share of common stock on the date of the grant. In addition, the term of any incentive stock options granted under the Plan may not exceed ten years. An option or SAR grant under the Plan does not provide an optionee any rights as a stockholder and such rights will accrue only as to shares actually purchased through the exercise of an option or the settlement of an SAR. If stock options and SARs are granted together in tandem, the exercise of such stock option or the related SAR will result in the cancellation of the related stock option or SAR to the extent of the number of shares in respect of which such option or SAR has been exercised. Stock options and SARs granted under the Plan shall become exercisable at such time as designated by the Committee at the time of grant.
| 43 |
In addition, the Committee, in its sole discretion, may provide in any stock option or SAR award agreement that the recipient of the stock option or SAR will be entitled to dividend equivalents with respect to such award. In such instance, in respect of any such award which is outstanding on a dividend record date for common stock, the participant would be entitled to an amount equal to the amount of cash or stock dividends that would have paid on the shares of common stock covered by such stock option or SAR award had such shares of common stock been outstanding on the dividend record date.
Restricted Share Awards.
Restricted share awards are grants of common stock made to a participant subject to conditions established by the Committee in the relevant award agreement on the date of grant. The restricted shares only become unrestricted in accordance with the conditions and vesting schedule, if any, provided in the relevant award agreement. A participant may not sell or otherwise dispose of restricted shares until the conditions imposed by the Committee with respect to such shares have been satisfied. Restricted share awards under the Plan may be granted alone or in addition to any other awards under the Plan. Restricted shares which vest will be reissued as unrestricted shares of common stock. Each participant who receives a grant of restricted shares will have the right to receive all dividends and vote or execute proxies for such shares. Any stock dividends granted with respect to such restricted shares will be treated as additional restricted shares.
Performance Units.
Performance units (with each unit representing a monetary amount designated in advance by the Committee) are awards which may be granted to participants alone or in addition to any other awards under the Plan. Participants receiving performance unit grants will only earn such units if the Company and/or the participant achieve certain performance goals during a designated performance period. The Committee will establish such performance goals and may use measures such as total stockholder return, return on equity, net earnings growth, sales or revenue growth, comparison to peer companies, individual or aggregate participant performance or such other measures the Committee deems appropriate. The participant may forfeit such units in the event the performance goals are not met. If all or a portion of a performance unit is earned, payment of the designated value thereof will be made in cash, in unrestricted common stock or in restricted shares or in any combination thereof, as provided in the relevant award agreement.
Recapitalization Adjustments.
In the event that the Board determines that any dividend or other distribution (whether in the form of cash, common stock, other securities, or other property), recapitalization, stock split, reverse stock split, reorganization, merger, consolidation, split-up, spin-off, combination, repurchase, or exchange of common stock or other securities of the Company, or other corporate transaction or event affects the common stock such that an adjustment is determined by the Board, in its sole discretion, to be necessary or appropriate in order to prevent dilution or enlargement of benefits or potential benefits intended to be made available under the Plan, the Board may, in any manner that it in good faith deems equitable, adjust any or all of (i) the number of shares of common stock or other securities of the Company (or number and kind of other securities or property) with respect to which awards may be granted, (ii) the number of shares of common stock or other securities of the Company (or number and kind of other securities or property) subject to outstanding awards, and (iii) the exercise price with respect to any stock option, or make provision for an immediate cash payment to the holder of an outstanding award in consideration for the cancellation of such award.
Mergers.
If the Company enters into or is involved in any merger, reorganization, recapitalization, sale of all or substantially all of the Company’s assets, liquidation, or business combination with any person or entity (a “Merger Event”), the Board may, prior to such Merger Event and effective upon such Merger Event, take any action that it deems appropriate, including, replacing such stock options with substitute stock options and/or SARs in respect of the shares, other securities or other property of the surviving corporation or any affiliate of the surviving corporation on such terms and conditions, as to the number of shares, pricing and otherwise, which shall substantially preserve the value, rights and benefits of any affected stock options or SARs granted hereunder as of the date of the consummation of the Merger Event. If any Merger Event occurs, the Company has the right, but not the obligation, to cancel each participant’s stock options and/or SARs and to pay to each affected participant in connection with the cancellation of such stock options and/or SARs, an amount equal to the excess of the fair market value, as determined by the Board, of the common stock underlying any unexercised stock options or SARs (whether then exercisable or not) over the aggregate exercise price of such unexercised stock options and/or SARs. Upon receipt by any affected participant of any such substitute stock options, SARs (or payment) as a result of any such Merger Event, such participant’s affected stock options and/or SARs for which such substitute options and/or SARs (or payment) were received shall be thereupon cancelled without the need for obtaining the consent of any such affected participant.
| 44 |
Amendment, Suspension or Termination of the Plan
Unless earlier terminated by the Board, the Plan will terminate on May 23, 2022. The Board may amend, suspend or terminate the Plan (or any portion thereof) at any time. However, no amendment may (a) materially adversely affect the rights of any participant under any outstanding award, without the consent of such participant, or (b) make any change that would disqualify the Plan from the benefits provided under Sections 422 and 162(m) of the Internal Revenue Code of 1986 (the “Code”), or (c) increase the number of shares available for awards under the Plan without stockholder approval; provided , however , that the Board and/or Committee may amend the Plan, without the consent of any participants, in any way it deems appropriate to satisfy Code Section 409A and any regulations or other authority promulgated thereunder, including any amendment to the Plan to cause certain awards not to be subject to Code Section 409A.
2016 Incentive Plan (Rahoul S Banerjea)
On October 25, 2016, the Board awarded Rahoul S Banerjea, the chief financial officer 2,250,000 options to purchase shares of common stock at $0.17 per share. This grant was independent of the Company’s 2012 long term incentive plan. The purpose of this award was to further incentivize Mr. Banerjea and promote the interests of the Company, its subsidiaries and its stockholders by enabling the Company and its subsidiaries to attract, retain and motivate executive employees of the Company and/or its subsidiaries, and to align the interests of those individuals and the Company’s stockholders. At December 31, 2017 and 2016, all 2,250,000 were vested and an expense of $90,000 was recognized.
| 45 |
ITEM 12. SECURITY OWNERSHIP OF CERTAIN BENEFICIAL OWNERS AND MANAGEMENT AND RELATED STOCKHOLDER MATTERS
Our authorized capital stock consists of 250,000,000 shares of Common Stock. As of April 2, 2018, we had outstanding 124,756,158 common stock outstanding.
The following table sets forth certain information regarding the beneficial ownership of our Common Stock as of April 2, 2018 by:
| ● | each person known by us to be a beneficial owner of more than 5% of our outstanding Common Stock; | |
| ● | each of our directors; | |
| ● | each of our named executive officers; and | |
| ● | all directors and executive officers as a group. |
| 46 |
In the table below, as of April 2, 2018, the percentage of ownership of our Common Stock is based on 124,756,158 shares of outstanding Common Stock, 4,850,000 outstanding warrants and 6,630,000 outstanding stock option. Unless otherwise noted below, the address of the persons listed on the table is c/o Plastic2Oil, Inc., 20 Iroquois Street, Niagara Falls, New York 14303.
| Common Stock Beneficially Owned | ||||||||
| Name of Beneficial Owner | Number | Percentage | ||||||
| Executive Officers and Directors | ||||||||
| Richard W. Heddle, Chief Executive Officer and Director | 7,000,000 | (1) | 5.1 | % | ||||
| Rahoul S. Banerjea, Chief Financial Officer | 4,250,000 | (2) | 3.1 | % | ||||
| Philip J. Bradley, Director | - | 0.0 | % | |||||
Jason C. Aspin, Director | 805,000 | (3) | 0.6 | % | ||||
Lee C. Brain, Director | 1,152,567 | (4) | 0.8 | % | ||||
| All named executive officers and directors as a group | 13,207,567 | 9.7 | % | |||||
| 5% or More Stockholders | - | 0.00 | % | |||||
| (1) | Includes warrants to purchase 4,000,000 shares of Common Stock. | |
| (2) | Represents option awards to purchase 4,250,000 shares of Common Stock. | |
| (3) | Includes warrants to purchase 500,000 shares of Common Stock and option awards to purchase 25,000 shares of common stock. | |
| (4) | Includes option awards to purchase 25,000 shares of Common Stock. |
| Common Stock Beneficially Owned |
The amounts and percentages of Common Stock beneficially owned are reported on the basis of regulations of the SEC governing the determination of beneficial ownership of securities. Under the rules of the SEC, a person is deemed to be a “beneficial owner” of a security if that person has or shares “voting power,” which includes the power to vote or to direct the voting of such security, or “investment power,” which includes the power to dispose of or to direct the disposition of such security. A person is also deemed to be a beneficial owner of any securities of which that person has a right to acquire beneficial ownership within 60 days after, April 2, 2018. Under these rules, more than one person may be deemed a beneficial owner of the same securities and a person may be deemed a beneficial owner of securities as to which he has no economic interest. Except as indicated by footnote, to our knowledge, the persons named in the table below have sole voting and investment power with respect to all shares of Common Stock shown as beneficially owned by them.
Changes in Control
We are not aware of any arrangements that may result in a change in control of the Company.
| 47 |
Securities Authorized for Issuance under Equity Compensation Plans
The following table sets forth certain information as of December 31, 2017 with respect to equity compensation plans under which the Company’s common stock may be issued.
| Plan Name | Number of securities to be issued upon exercise of outstanding options, warrants and rights | Weighted average exercise price of outstanding options, warrants and rights | Number of securities remaining available for future issuance under equity compensation plans | |||||||||
| Equity Compensation Plans | ||||||||||||
| JBI, Inc. 2012 Long-Term Incentive Plan Approved by Stockholders | 4,380,000 | $ | 1.12 | 4,808,424 | ||||||||
| 2016 Incentive Plan ( Rahoul S Banerjea) | 2,250,000 | $ | 0.17 | 2,250,000 | ||||||||
ITEM 13. CERTAIN RELATIONSHIPS AND RELATED TRANSACTIONS, AND DIRECTOR INDEPENDENCE
Review, Approval or Ratification of Transactions with Related Persons
The Board is responsible for the review, approval or ratification of all “transactions with related persons” as that term refers to transactions required to be disclosed by Item 404 of Regulation S-K promulgated by the SEC. In reviewing a proposed transaction, the Board must (i) satisfy itself that it has been fully informed as to the related party’s relationship and interest and as to the material facts of the proposed transaction and (ii) consider all of the relevant facts and circumstances available to the Board. After its review, the Board will only approve or ratify transactions that are fair to the Company and not inconsistent with the best interests of the Company and its stockholders.
| 48 |
ITEM 14. PRINCIPAL ACCOUNTANT FEES AND SERVICES
As outlined in the table below, we incurred the following fees for the fiscal years ended December 31, 2017 and 2016, respectively, for professional services rendered by D. Brooks and Associates CPA’s, P.A., for the audit of the Company’s annual financial statements and for audit-related services, tax services and all other services, as applicable.
| Service Provided | Fiscal 2017 | Fiscal 2016 | ||||||
| Audit Fees | ||||||||
| Annual Audit – D. Brooks and Associates CPA’s, P.A | $ | 44,490 | (1) | $ | 43,869 | (1) | ||
| Tax Fees | - | - | ||||||
| All Other Fees | - | - | ||||||
| Total Fees | $ | 44,490 | $ | 43,869 | ||||
| (1) | Includes the interim Quarterly Reviews reported on Form 10-Q and annual Audit reported on Form 10-K. |
The Company has policies and procedures that require the pre-approval of the Board of all fees paid to, and all services performed by, the Company’s independent registered public accounting firm. At the beginning of each year, the Board approves the proposed services, including the nature, type and scope of services contemplated and the related fees, to be rendered by these firms during the year. In addition, pre-approval of the Board is also required for those engagements that may arise during the course of the year that are outside the scope of the initial services and fees initially pre-approved by the Board.
ITEM 15. EXHIBITS AND FINANCIAL STATEMENT SCHEDULES
The exhibits required by this item are listed on the Exhibit Index attached hereto.
| 49 |
Signatures
Pursuant to the requirements of Section 13 or 15(d) of the Securities Exchange Act of 1934, the registrant has duly caused this report has been signed on its behalf by the undersigned, thereunto duly authorized.
| PLASTIC2OIL, INC. | ||
| Date: April 2, 2018 | By: | /s/ Richard Heddle |
| Name: | Richard Heddle | |
| Title: | President and Chief Executive Officer (Principal Executive Officer) | |
Pursuant to the requirements of the Securities Exchange Act of 1934, this report has been signed below by the following persons on behalf of the registrant and in the capacities and on the dates indicated.
| Signature | Title | Date | ||
| /s/ Richard Heddle | President, Chief Executive Officer | 2-Apr-18 | ||
| Richard Heddle | (Principal Executive Officer) and Chairman of the Board of Directors | |||
| /s/ Rahoul S. Banerjea | Chief Financial Officer | 2-Apr-18 | ||
| Rahoul S. Banerjea | (Principal Financial Officer and Principal Accounting Officer) | |||
| /s/ Philip J Bradley | Director | 2-Apr-18 | ||
| Philip J. Bradley | ||||
| /s/ Jason C. Aspin | Director | 2-Apr-18 | ||
| Jason C. Aspin | ||||
| /s/ Lee C. Brain | Director | 2-Apr-18 | ||
| Lee C. Brain |
| 50 |
EXHIBIT INDEX
| 51 |
| 52 |
| 53 |
| 54 |
| 32.2 | Certification of our Chief Financial Officer pursuant to 18 U.S.C. Section 1350, as adopted pursuant to Section 906 of the Sarbanes-Oxley Act of 2002. (2) | |
| 101.INS | XBRL Instance Document. (2) | |
| 101.SCH | XBRL Taxonomy Extension Schema Document. (2) | |
| 101.CAL | XBRL Taxonomy Extension Calculation Linkbase Document. (2) | |
| 101.DEF | XBRL Taxonomy Extension Definition Linkbase Document. (2) | |
| 101.LAB | XBRL Taxonomy Extension Label Linkbase Document. (2) | |
| 101.PRE | XBRL Taxonomy Extension Presentation Linkbase Document. (2) |
| * | Certain Confidential Information contained in this Exhibit was omitted by means of redacting a portion of the text and replacing it with an asterisk. This Exhibit has been filed separately with the Secretary of the Securities and Exchange Commission without the redaction pursuant to a Confidential Treatment Request under Rule 24b-2 of the Securities Exchange Act of 1934, as amended. |
| (1) | Filed herewith. |
| (2) | Furnished herewith. |
| 55 |