Attached files
| file | filename |
|---|---|
| EX-99.4 - EXHIBIT 99.4 - HGR Liquidating Trust | hinesglobal-ex994x2017cons.htm |
| EX-99.3 - EXHIBIT 99.3 - HGR Liquidating Trust | hinesglobal-ex993x2017cons.htm |
| EX-99.2 - EXHIBIT 99.2 - HGR Liquidating Trust | hinesglobal-ex992x2017cons.htm |
| EX-99.1 - EXHIBIT 99.1 - HGR Liquidating Trust | hinesglobal-ex991x2017cons.htm |
| EX-32.1 - EXHIBIT 32.1 - HGR Liquidating Trust | hinesglobal-ex321x20171231.htm |
| EX-31.2 - EXHIBIT 31.2 - HGR Liquidating Trust | hinesglobal-ex312x20171231.htm |
| EX-31.1 - EXHIBIT 31.1 - HGR Liquidating Trust | hinesglobal-ex311x20171231.htm |
| EX-23.1 - EXHIBIT 23.1 - HGR Liquidating Trust | hinesglobal-ex231x2017delo.htm |
| EX-21.1 - EXHIBIT 21.1 - HGR Liquidating Trust | hinesglobal-ex211x2017list.htm |
| EX-10.1 - EXHIBIT 10.1 - HGR Liquidating Trust | hinesglobal-ex101formofres.htm |
UNITED STATES SECURITIES AND EXCHANGE COMMISSION
Washington, D.C. 20549
Form 10-K
(Mark One) | |
þ | ANNUAL REPORT PURSUANT TO SECTION 13 OR 15(d) OF THE SECURITIES EXCHANGE ACT OF 1934 |
For the fiscal year ended December 31, 2017
OR
o | TRANSITION REPORT PURSUANT TO SECTION 13 OR 15(d) OF THE SECURITIES EXCHANGE ACT OF 1934 |
Commission file number: 000-53964
HINES GLOBAL REIT, INC.
(Exact Name of Registrant as Specified in its Charter)
Maryland | 26-3999995 |
(State or Other Jurisdiction of Incorporation or Organization) | (I.R.S. Employer Identification No.) |
2800 Post Oak Boulevard Suite 5000 | 77056-6118 |
Houston, Texas | (Zip code) |
(Address of principal executive offices) | |
Registrant’s telephone number, including area code: (888) 220-6121
Securities registered pursuant to Section 12(b) of the Act: None.
Securities registered pursuant to Section 12(g) of the Act: Common Stock, par value $.001
Indicate by check mark if the registrant is a well-known seasoned issuer, as defined in Rule 405 of the Securities Act. Yes ¨ No þ
Indicate by check mark if the registrant is not required to file reports pursuant to Section 13 or Section 15(d) of the Exchange Act. Yes ¨ No þ
Indicate by check mark whether the registrant: (1) has filed all reports required to be filed by Section 13 or 15(d) of the Securities Exchange Act of 1934 during the preceding 12 months (or for such shorter period that the registrant was required to file such reports), and (2) has been subject to such filing requirements for the past 90 days. Yes þ No ¨
Indicate by check mark whether the registrant has submitted electronically and posted on its corporate Web site, if any, every Interactive Data File required to be submitted and posted pursuant to Rule 405 of Regulation S-T (§232.405 of this chapter) during the preceding 12 months (or for such shorter period that the registrant was required to submit and post such files). Yes þ No o
Indicate by check mark if disclosure of delinquent filers pursuant to Item 405 of Regulation S-K (§229.405 of this chapter) is not contained herein, and will not be contained, to the best of the registrant’s knowledge, in definitive proxy or information statements incorporated by reference in Part III of this Form 10-K or any amendment to this Form 10-K. þ
Indicate by check mark whether the registrant is a large accelerated filer, an accelerated filer, a non-accelerated filer, a smaller reporting company, or an emerging growth company. See the definitions of “large accelerated filer,” “accelerated filer,” “smaller reporting company” and “emerging growth company” in Rule 12b-2 of the Exchange Act. (Check one):
Large accelerated filer ☐ | Accelerated filer ☐ | Non-accelerated filer þ | (Do not check if a smaller reporting company) |
Smaller reporting company ☐ | Emerging growth company ☐ | If an emerging growth company, indicate by check mark if the registrant has elected not to use the extended transition period for complying with any new or revised financial accounting standards provided pursuant to Section 13 (a) of the Exchange Act. ☐ | |
Indicate by check mark whether the registrant is a shell company (as defined in Rule 12b-2 of the Exchange Act). Yes ¨ No þ
Aggregate market value of the common stock held by non-affiliates of the registrant: No established market exists for the registrant’s common stock.
The registrant had 273.1 million shares of common stock outstanding as of March 19, 2018.
TABLE OF CONTENTS PART I | ||
Item 1. | ||
Item 1A. | ||
Item 1B. | ||
Item 2. | ||
Item 3. | ||
Item 4. | ||
PART II | ||
Item 5. | ||
Item 6. | ||
Item 7. | ||
Item 7A. | ||
Item 8. | ||
Item 9. | ||
Item 9A. | ||
Item 9B. | ||
PART III | ||
Item 10. | ||
Item 11. | ||
Item 12. | ||
Item 13. | ||
Item 14. | ||
PART IV | ||
Item 15. | ||
Item 16. | ||
EX- 10.1 | Form of Restricted Share Award Agreement | |
EX- 21.1 | List of Subsidiaries | |
EX- 23.1 | Consent | |
EX- 31.1 | Certification | |
EX- 31.2 | Certification | |
EX- 32.1 | Certification of CEO & CFO pursuant to Section 906 | |
EX- 99.1 | Consent of Independent Valuer | |
EX- 99.2 | Consent of Independent Valuer | |
EX- 99.3 | Consent of Independent Valuer | |
EX- 99.4 | Consent of Independent Valuer | |
EX- 101 | Instance Document | |
EX- 101 | Schema Document | |
EX- 101 | Calculation Linkbase Document | |
EX- 101 | Labels Linkbase Document | |
EX- 101 | Presentation Linkbase Document | |
EX- 101 | Definition Linkbase Document | |
PART I
Special Note Regarding Forward-Looking Statements
This Annual Report on Form 10-K includes certain statements that may be deemed forward-looking statements within the meaning of Section 27A of the Securities Act of 1933, as amended (the “Securities Act”), and Section 21E of the Securities Exchange Act of 1934, as amended (the “Exchange Act”). Such forward-looking statements relate to, without limitation, economic conditions that may impact our operations, our future leverage and financial position, our future capital expenditures, future distributions, other developments and trends in the commercial real estate industry and our business strategy. Forward-looking statements are generally identifiable by the use of the words “may,” “will,” “should,” “expect,” “could,” “intend,” “plan,” “anticipate,” “estimate,” “believe,” “continue,” “predict,” “potential” or the negative of these words or other comparable terminology. These statements are not guarantees of future performance, and involve certain risks, uncertainties and assumptions that are difficult to predict.
The forward-looking statements in this Form 10-K are based on our current expectations, plans, estimates, assumptions and beliefs that involve numerous risks and uncertainties. Assumptions relating to the foregoing involve judgments with respect to, among other things, future economic, competitive and market conditions and future business decisions, all of which are difficult or impossible to predict accurately and many of which are beyond our control. Any of the assumptions underlying forward-looking statements could prove to be inaccurate. To the extent that our assumptions differ from actual results, our ability to meet such forward-looking statements, including our ability to generate positive cash flow from operations, provide distributions to our stockholders and maintain the value of the real estate properties in which we hold an interest, may be significantly hindered.
Our stockholders are cautioned not to place undue reliance on any forward-looking statement in this Form 10-K. All forward-looking statements are made as of the date of this Form 10-K, and the risk that actual results will differ materially from the expectations expressed in this Form 10-K may increase with the passage of time. In light of the significant uncertainties inherent in the forward-looking statements in this Form 10-K, the inclusion of such forward-looking statements should not be regarded as a representation by us or any other person that the objectives and plans set forth in this Form 10-K will be achieved. Please see “Item 1A. Risk Factors” for a discussion of some of the risks and uncertainties that could cause actual results to differ materially from those presented in certain forward-looking statements.
Item 1. Business
General Description of Business and Operations
Hines Global REIT, Inc. (“Hines Global”) was incorporated under the Maryland General Corporation Laws on December 10, 2008, primarily for the purpose of investing in a diversified portfolio of quality commercial real estate properties and other real estate investments located throughout the United States and internationally. Hines Global raised the equity capital for its real estate investments through two public offerings from August 2009 through April 2014. Hines Global continues to offer up to $500.0 million of shares of its common stock under its distribution reinvestment plan, pursuant to an offering which commenced on April 24, 2014 (the “DRP Offering”). Collectively, through its public offerings, including the DRP Offering, Hines Global raised approximately $3.1 billion as of December 31, 2017. Hines Global engaged Hines Securities, Inc. (the “Dealer Manager”), an affiliate of Hines, to serve as the dealer manager for its two public offerings.
Hines Global conducts most of its activities through, and most of its real estate investments are held directly or indirectly by, Hines Global REIT Properties, LP (the “Operating Partnership”), which was formed on January 7, 2009. Hines Global contributes the proceeds it receives from the issuance of common shares to the Operating Partnership and the Operating Partnership in turn issues general partner interests to Hines Global. The general partner interests entitle Hines Global to receive its share of the Operating Partnership’s earnings or losses and distributions of cash flow.
We refer to Hines Global, the Operating Partnership and its wholly-owned subsidiaries as the “Company,” and the use of “we,” “our,” “us” or similar pronouns in this annual report refers to Hines Global or the Company as required by the context in which such pronoun is used.
1
We completed our investment phase during 2015 and have achieved one of our primary investment objectives of investing in a real estate portfolio that is diversified by asset type, geographic area, lease expirations and tenant industries. As of December 31, 2017, we owned interests in 34 real estate investments which contain, in the aggregate, 14.1 million square feet of leasable space, and we believe each investment is suitable for its intended purpose. These investments consisted of:
• | Domestic office investments (9 investments) |
• | Domestic other investments (5 investments) |
• | International office investments (9 investments) |
• | International other investments (11 investments) |
As part of our ongoing portfolio management, we continually evaluate the merits of selling certain assets based on their current and projected market valuations, property-specific leasing and other operational dynamics, and other portfolio and market considerations. As a result, we strategically elected to sell two properties during 2016 (@1377 and Komo Plaza) and six properties during 2017 (the Brindleyplace Project, Aviva Coral Gables, Southpark, Mercedes Benz Bank, Hock Plaza, and Fifty South Sixth).
We have commenced the process of evaluating various strategic alternatives to execute a liquidity event (i.e., a sale of our assets, our sale or merger, a listing of our shares on a national securities exchange, a tender offer for our shares, or another similar transaction). That process is ongoing and we are continuing to evaluate strategic alternatives. There is no set timetable for the execution of such an event, and there is no assurance that any such event will occur.
We have no employees. Our business is managed by Hines Global REIT Advisors LP (the “Advisor”), an affiliate of our sponsor, Hines Interests Limited Partnership (“Hines”), under the terms and conditions of an advisory agreement between us, the Operating Partnership and the Advisor (the “Advisory Agreement”). As compensation for these services, we pay or have paid the Advisor asset management, acquisition, debt financing and disposition fees and we reimburse certain of the Advisor’s expenses incurred on our behalf in accordance with the advisory agreement. Hines or affiliates of Hines manage the leasing and operations of most of the properties in which we invest and, accordingly, we pay property management and leasing fees in connection with these services. Hines is owned and controlled by or for the benefit of Gerald D. Hines and his son Jeffrey C. Hines, the Chairman of our board of directors. Hines and its 4,000 employees have over 60 years of experience in the areas of investment selection, underwriting, due diligence, portfolio management, asset management, property management, leasing, disposition, finance, accounting and investor relations.
Our office is located at 2800 Post Oak Boulevard, Suite 5000, Houston, Texas 77056-6118. Our telephone number is 1-888-220-6121. Our web site is www.HinesSecurities.com. The information on our website is not incorporated by reference into this report.
Primary Investment Objectives
Our primary investment objectives are to:
• | preserve invested capital; |
• | invest in a diversified portfolio of quality commercial real estate properties and other real estate investments; |
• | pay regular cash distributions; |
• | achieve attractive total returns upon the ultimate sale of our investments or occurrence of another liquidity event; and |
• | remain qualified as a real estate investment trust (“REIT”) for federal income tax purposes. |
Acquisition and Investment Policies
We had invested all of the proceeds raised through our public offerings by the end of 2015. We have invested in a diversified portfolio of quality commercial real estate properties and other real estate investments throughout the United States and internationally. Our principal targeted assets have been investments in properties, and other real estate investments that relate to properties, that have quality construction and desirable locations which can attract quality tenants. These types of investments are generally located in central business districts or suburban markets of major metropolitan cities worldwide. We have invested in a geographically diverse portfolio in order to reduce the risk of reliance on a particular market, a particular property and/or a particular tenant. We do not presently intend to make any additional property acquisitions. See “Item 2. Properties” for additional information regarding our real estate portfolio.
2
Financing Strategy and Policies
We have and may continue to use debt financing from time to time for acquisitions, property improvements, lease inducements, tenant improvements, redemptions and other working capital needs. As of December 31, 2017, our portfolio was 38% leveraged based on the values of our real estate investments.
Our existing indebtedness and any additional indebtedness we incur will likely be subject to continuing covenants, and we will likely be required to make continuing representations and warranties about the Company in connection with such debt. Moreover, some or all of our debt may be secured by some or all of our assets. If we default on the payment of interest or principal on any such debt, breach any representation or warranty in connection with any borrowing or violate any covenant in any loan document, our lender may accelerate the maturity of such debt, requiring us to immediately repay all outstanding principal.
Distribution Objectives
In order to qualify as a REIT for federal income tax purposes, we generally must distribute at least 90% of our taxable income (excluding capital gains) to our stockholders. We intend, although we are not legally obligated, to continue to make regular monthly distributions to holders of our common shares in excess of the level required to maintain our REIT status unless our results of operations, our general financial condition, general economic conditions or other factors inhibit us from doing so. Distributions are authorized at the discretion of our board of directors, which considers the requirements for our qualification as a REIT pursuant to the Internal Revenue Code of 1986, as amended (the “Code”).
We have declared distributions of approximately $0.65 per share, per year for the years ended December 31, 2017, 2016 and 2015. We have also declared distributions for the months of January, February, and March 2018 in an amount equal to $0.0541667 per share, per month, which is equal to an annualized distribution rate of $0.65 per share. Of this amount, $0.02 of the per share, per month distribution has been or will be designated by the Company as a return of a portion of the stockholders’ invested capital and, as such, will reduce the stockholders’ remaining investment in the Company.
Additionally, we declared a special distribution to stockholders of $1.05 per share that was paid to all stockholders of record as of December 30, 2017 in January 2018. This special distribution represented a return of a portion of our stockholders’ invested capital from sales of investment property and, as such, reduced their remaining investment in the Company. The special distribution represented a portion of the net proceeds received from the strategic sale of six assets during 2017.
Our cash flows from operations have been and may continue to be insufficient to fund distributions to stockholders. We have funded the remaining distributions from proceeds from the sales of our real estate investments in the current and prior periods, as well as from cash flows from financing activities.
Tax Status
We have elected to be treated as a REIT under the Code. Our management believes that we operate in such a manner as to qualify for treatment as a REIT and we intend to operate in the foreseeable future in such a manner so that we will remain qualified as a REIT for federal income tax purposes. Accordingly, no provision has been made for U.S. federal income taxes for the years ended December 31, 2017, 2016 and 2015 in the accompanying consolidated financial statements. Income tax expense recorded by the Company during each of these years was primarily comprised of foreign income taxes related to the operation of its international properties.
Competition
Numerous real estate companies, real estate investment trusts and U.S. institutional and foreign investors compete with us in acquiring properties or making other real estate investments and obtaining creditworthy tenants to occupy such properties, including, but not limited to, Hines Global Income Trust, Inc. (“Hines Global Income Trust”), and other real estate investment vehicles sponsored by Hines. Many of these entities have significant financial and other resources, allowing them to compete effectively with us. Principal factors of competition in our primary business of acquiring properties or making other real estate investments include access to capital, the quality of properties, leasing terms (including rent and other charges and allowances for inducements and tenant improvements), the quality and breadth of tenant services provided, and reputation as an owner and operator of commercial real estate investments in the relevant market. Additionally, our ability to compete depends upon, among other factors, trends of the global, national and local economies, investment alternatives, financial condition and operating results of current and prospective tenants, availability and cost of capital, taxes, governmental regulations, legislation and demographic trends.
3
We believe Hines’ extensive real estate experience and depth and breadth of its organization of 4,000 employees located in over 100 cities across the United States and 23 foreign countries allows it to better identify investment opportunities for us. However, competition may increase our cost of acquisitions.
Customers
We are dependent upon the ability of current tenants to pay their contractual rent amounts as the rents become due. During the years ended December 31, 2017, 2016 and 2015, respectively, we did not earn more than 10% of total rental revenues from any individual tenant.
Available Information
Stockholders may obtain copies of our filings with the Securities and Exchange Commission (“SEC”), free of charge from the website maintained by the SEC at www.sec.gov or from our website at www.HinesSecurities.com. Further, a copy of this Annual Report on Form 10-K is located at the SEC’s Public Reference Room at 100 F Street NE, Washington, D.C. 20549. Information on the operation of the Public Reference Room can be obtained by calling the SEC at 1-800-SEC-0330. Our filings will be available on our website as soon as reasonably practicable after we electronically file such materials with the SEC. However, the information from our website is not incorporated by reference into this report.
Item 1A. Risk Factors
You should carefully read and consider the risks described below together with all other information in this report. If certain of the following risks actually occur, our results of operations and ability to pay distributions would likely suffer materially, or could be eliminated entirely. As a result, the value of our common shares may decline, and our stockholders could lose all or part of the money they paid to buy our common shares.
Risks Related to Our Business in General
A liquidity event is not guaranteed. If we do not successfully implement a liquidity event, investors may have to hold an investment for an indefinite period.
We have commenced the process of evaluating various strategic alternatives to provide stockholders with liquidity of their investment. A determination to pursue a liquidity event does not create an obligation to conclude the process within a set time. For example, if we adopt a plan of liquidation or enter into a contract to sell or merge the Company, the timing of such transactions may depend on real estate and financial markets, general or local economic conditions and federal income tax effects on our stockholders. We cannot guarantee that we will be able to liquidate all of our assets, sell or merge the Company or otherwise complete a liquidity event on favorable terms, if at all. If we were to adopt a plan of liquidation, we would likely remain in existence until all our investments are liquidated. Similarly, if we determined to list our common stock on a national securities exchange, the timing would depend in part on the general economic conditions and volatility of the financial markets. If there are delays in pursuing a liquidity event due to market conditions or otherwise, our common stock may continue to be illiquid and investors may, for an indefinite period of time, be unable to convert their shares to cash easily, if at all, and it could adversely affect their overall return. There is no set timetable for the execution of a liquidity event and there is no assurance that any such event will occur.
A prolonged national or world-wide economic downturn or volatile capital market conditions could adversely affect our results of operations and our ability to pay distributions to our stockholders.
If disruptions in the capital and credit markets were to occur, they could adversely affect our ability to obtain loans, credit facilities, debt financing and other financing, or, when available, to obtain such financing on reasonable terms, which could negatively impact our ability to implement our investment strategy.
If these disruptions in the capital and credit markets should occur as a result of, among other factors, uncertainty, changing regulation, changes in trade agreements reduced alternatives or additional failures of significant financial institutions, our access to liquidity could be significantly impacted. Prolonged disruptions could result in us taking measures to conserve cash until the markets stabilize or until alternative credit arrangements or other funding for our business needs could be arranged. Such measures could include deferring investments, reducing or eliminating the number of shares redeemed under our share redemption program and reducing or eliminating distributions we make to our stockholders.
4
We believe the risks associated with our business are more severe during periods of economic downturn if these periods are accompanied by declining values in real estate. For example, a prolonged economic downturn could negatively impact our property investments as a result of increased customer delinquencies and/or defaults under our leases, generally lower demand for rentable space, potential oversupply of rentable space leading to increased concessions, and/or customer improvement expenditures, or reduced rental rates to maintain occupancies.
Our operations could be negatively affected to a greater extent if an economic downturn occurs, is prolonged or becomes more severe, which could significantly harm our revenues, results of operations, financial condition, liquidity, business prospects and our ability to make distributions to our stockholders and may result in a decrease in the value of our stockholders’ investment.
Yields on and safety of deposits may be lower due to extensive declines in the financial markets.
We may hold funds in investments, including money market funds, bank money market accounts and CDs or other accounts at third-party depository institutions. Unusual declines in the financial markets similar to those experienced during the Great Recession, could result in a loss of some or all of these funds. In particular, money market funds may experience intense redemption pressure in such years and have difficulty satisfying redemption requests. As a result, we may not be able to access the cash in our money market investments. In addition, current yields from these investments are minimal.
The failure of any bank in which we deposit our funds could reduce the amount of cash we have available to pay distributions and make additional investments.
The Federal Deposit Insurance Corporation only insures amounts up to $250,000 per depositor. It is likely that we will have cash and cash equivalents and restricted cash deposited in certain financial institutions in excess of federally insured levels. If any of the banking institutions in which we deposit funds ultimately fails, we may lose any amount of our deposits over federally insured levels. The loss of our deposits could reduce the amount of cash we have available to distribute or invest and could result in a decline in the value of our stockholders’ investments.
We may need to incur borrowings that would otherwise not be incurred to meet REIT minimum distribution requirements.
In order to maintain our qualification as a REIT, we are required to distribute to our stockholders at least 90% of our annual ordinary taxable income. In addition, we will be subject to a 4% nondeductible excise tax on the amount, if any, by which certain distributions paid (or deemed paid) by us with respect to any calendar year are less than the sum of (i) 85% of our ordinary income for that year, (ii) 95% of our capital gain net income for that year and (iii) 100% of our undistributed taxable income from prior years.
We expect our income, if any, to consist principally of our share of the Operating Partnership’s income, and the cash available for the payment of distributions by us to our stockholders will consist of our share of cash distributions made by the Operating Partnership and our other subsidiaries. As the general partner of the Operating Partnership, we will determine the amount of any distributions made by the Operating Partnership. However, we must consider a number of factors in making such distributions, including:
• | the amount of the cash available for distribution; |
• | the impact of such distribution on other partners of the Operating Partnership; |
• | the Operating Partnership’s financial condition; |
• | the Operating Partnership’s capital expenditure requirements and reserves therefor; and |
• | the annual distribution requirements contained in the Code necessary to qualify and maintain our qualification as a REIT. |
Differences in timing between the actual receipt of income and actual payment of deductible expenses and the inclusion of such income and deduction of such expenses when determining our taxable income, as well as the effect of nondeductible capital expenditures, the creation of reserves, the use of cash to purchase shares under our share redemption program or required debt amortization payments, could result in our having taxable income that exceeds cash available for distribution.
In view of the foregoing, we may be unable to meet the REIT minimum distribution requirements and/or avoid the 4% excise tax described above. In certain cases, we may decide to borrow funds in order to meet the REIT minimum distribution requirement and/or avoid the 4% excise tax even if our management believes that the then prevailing market conditions generally are not favorable for such borrowings or that such borrowings would not be advisable in the absence of such tax considerations.
5
Lenders may require us to enter into restrictive covenants that relate to or otherwise limit our operations, which could limit our ability to make distributions to our stockholders, to replace the Advisor or to otherwise achieve our investment objectives.
When providing financing, a lender may impose restrictions on us that affect our distribution and operating policies and our ability to incur additional debt. Loan agreements we enter into may contain covenants that limit our ability to further mortgage property, discontinue insurance coverage, or make distributions under certain circumstances. In addition, provisions of our loan agreements may deter us from replacing the Advisor because of the consequences under such agreements and may limit our ability to replace the property manager or terminate certain operating or lease agreements related to the property. These or other limitations may adversely affect our flexibility and our ability to achieve our investment objectives.
We have acquired, and may continue to acquire, various financial instruments for purposes of “hedging” or reducing our risks, which may be costly and ineffective and may reduce our cash available for distribution to our stockholders.
We may enter into currency rate swaps and caps or similar hedging or derivative transactions or arrangements, in order to manage or mitigate our risk of exposure to the effects of currency changes as a result of our international investments. Similarly, we have, and may continue to enter into interest rate swaps and caps, or similar hedging or derivative transactions or arrangements, in order to manage or mitigate our risk of exposure to the effects of interest rate changes due to variable interest rate debt that we may have.
We are different in some respects from other investment vehicles sponsored by Hines, and therefore the past performance of such investment vehicles may not be indicative of our future results.
We are one of three publicly-offered real estate investment vehicles that have been sponsored by Hines. We collectively refer to real estate joint ventures, funds and programs as investment vehicles. All but two of the other real estate investment vehicles of Hines and its affiliates were conducted through privately-held entities not subject to either the up-front commissions, fees and expenses associated with our public offerings or all the laws and regulations that govern us, including reporting requirements under the federal securities laws and tax and other regulations applicable to REITs.
The past performance of other real estate investment vehicles sponsored by Hines or its affiliates may not be indicative of our future results, and we may not be able to successfully operate our business and implement our investment strategy, which may be different in a number of respects from the operations previously conducted by Hines. In addition, a significant portion of Hines’ other programs and investments involve development projects. Although we have invested in development projects, they do not constitute a significant portion of our portfolio. As a result of all of these factors, our stockholders should not rely on the past performance of other investment vehicles sponsored by Hines and its affiliates to predict, or as an indication of, our future performance.
Our success will be dependent on the performance of Hines as well as key employees of Hines. Certain other investment vehicles sponsored by Hines have experienced adverse developments in recent years and there is a risk that we may experience similar adverse developments.
Our ability to achieve our investment objectives and to pay distributions is dependent upon the performance of Hines and its affiliates as well as key employees of Hines in the identification and acquisition of investments, the selection of tenants, the determination of any financing arrangements, the management of our assets and operation of our day-to-day activities. Our board of directors and the Advisor have broad discretion when identifying, evaluating, making and managing our investments. Our stockholders will have no opportunity to evaluate the terms of transactions or other economic or financial data concerning our investments. We will rely on the management ability of Hines and the oversight of our board of directors as well as the management of any entities or ventures in which we invest.
We may not be able to retain our key employees. To the extent we are unable to retain and/or find qualified successors for key employees that depart from the Company, our results of operations may be adversely impacted. Our officers and the management of the Advisor also serve in similar capacities for numerous other entities. If Hines or any of its key employees are distracted by these other activities or suffer from adverse financial or operational problems in connection with operations unrelated to us, the ability of Hines and its affiliates to allocate time and/or resources to our operations may be adversely affected. If Hines is unable to allocate sufficient resources to oversee and perform our operations for any reason, our results of operations would be adversely impacted. We will not provide key-man life insurance policies for any of Hines’ key employees. Please see “— Risks Related to Potential Conflicts of Interest — Employees of the Advisor and Hines will face conflicts relating to time management and allocation of resources and investment opportunities.”
6
Certain other investment vehicles sponsored by Hines have experienced adverse developments in recent years. Although it was re-opened with respect to ordinary redemption requests in April 2013, in December 2009, Hines Real Estate Investment Trust, Inc. (“Hines REIT”) suspended its share redemption program, except with respect to redemptions in connection with the death or disability of a stockholder. During the five years prior to its adoption of a plan of liquidation and dissolution in 2016, specifically in May 2011, November 2012, April 2013, November 2013, December 2014 and September 2015, Hines REIT’s board of directors determined an estimated per share NAV of $7.78, $7.61, $6.75, $6.40, $6.50, and $6.65, respectively, each of which was lower than the most recent primary offering price of $10.08 per share. The reduction in the estimated NAV between November 2012 and April 2013 was due to Hines REIT’s payment to its stockholders of special distributions in excess of $0.80 per share (all of which represented a return of capital). In addition, Hines REIT decreased its distribution rate in July 2010 and further decreased the rate in April 2013. The reduction in the NAV between September 2015 and December 2016 was due primarily to Hines REIT’s payment to its stockholders of their initial liquidating distribution of $6.20 per share.
In addition to Hines REIT, Hines Global Income Trust and HMS Income Fund, Inc. (“HMS”), Hines has sponsored more than 20 privately-offered programs in the past ten years. Several of Hines’ privately-offered programs have experienced adverse economic developments due to the global financial crisis and deteriorating economic conditions in several European and South American countries, Mexico and several U.S. markets between 2007 and 2009. The adverse market conditions experienced by these programs may result in them altering their investment strategy, generating returns lower than originally expected, or ultimately may cause them to incur losses. There is a risk that we may experience similar adverse developments, as an investment vehicle sponsored by Hines.
Terrorist attacks and other acts of violence, civilian unrest or war may affect the markets in which we operate our operations and our profitability.
Terrorist attacks and other acts of violence, civilian unrest or war may negatively affect our operations and our stockholders’ investments in our shares. Certain of our real estate investments are located in areas that may be susceptible to attack. In addition, any kind of terrorist activity or violent criminal acts, including terrorist acts against public institutions or buildings or modes of public transportation (including airlines, trains or buses) could have a negative effect on our business. These events may directly impact the value of our assets through damage, destruction, loss or increased security costs. We may not be able to obtain insurance against the risk of terrorism because it may not be available or may not be available on terms that are economically feasible. Further, even if we do obtain terrorism insurance, we may not be able to obtain sufficient coverage to fund any losses we may incur. Risks associated with potential acts of terrorism in the areas in which we acquire properties or other real estate investments could sharply increase the premiums we pay for coverage against property and casualty claims. Additionally, mortgage lenders in some cases have begun to insist that specific coverage against terrorism be purchased by commercial owners as a condition for providing loans.
The consequences of any armed conflict are unpredictable, and we may not be able to foresee events that could have an adverse effect on our business or our stockholders’ investments in our shares. More generally, any terrorist attack, other act of violence or war, including armed conflicts, could result in increased volatility in or damage to, the United States and worldwide financial markets and economy. They also could result in a continuation of the current economic uncertainty in the United States or abroad. Our revenues will be dependent upon the payment of rent and the return of our other investments which may be particularly vulnerable to uncertainty in the local economy. Increased economic volatility could adversely affect our tenants’ ability to pay rent or the return on our other investments or our ability to borrow money or issue capital stock at acceptable prices and have a material adverse effect on our business, results of operations, cash flows and financial condition and our ability to make distributions to our stockholders and the value of their investment.
We may be subject to litigation which could have a material adverse effect on our business and financial condition.
We may be subject to litigation, including claims relating to our operations, offerings, unrecognized pre-acquisition contingencies and otherwise in the ordinary course of business. Some of these claims may result in potentially significant judgments against us, some of which are not, or cannot be, insured against. We generally intend to vigorously defend ourselves; however, we cannot be certain of the ultimate outcomes of claims that may arise in the future. Resolution of these types of matters against us may result in our payment of significant fines or settlements, which, if not insured against, or if these fines and settlements exceed insured levels, would adversely impact our earnings and cash flows. Certain litigation or the resolution of certain litigation may affect the availability or cost of some of our insurance coverage which could adversely impact our results of operations and cash flows, expose us to increased risks that would be uninsured and/or adversely impact our ability to attract officers and directors.
Our business could suffer in the event the Advisor, our transfer agent or any other party that provides us with services essential to our operations experiences system failures or cyberincidents or a deficiency in cybersecurity.
7
The Advisor, our transfer agent and other parties that provide us with services essential to our operations are vulnerable to damages from any number of sources, including computer viruses, unauthorized access, energy blackouts, natural disasters, terrorism, war and telecommunication failures. Any system failure or accident that causes interruptions in our operations could result in a material disruption to our business. A cyber incident is considered to be any adverse event that threatens the confidentiality, integrity or availability of information resources. More specifically, a cyber incident is an intentional attack or an unintentional event that may include, but is not limited to, gaining unauthorized access to systems to disrupt operations, corrupt data, steal assets or misappropriate confidential information, such as confidential stockholder records. As reliance on technology in our industry has increased, so have the risks posed to our systems, both internal and those we have outsourced. In addition, the risk of a cyber incident, including by computer hackers, foreign governments and cyber terrorists, has generally increased as the number, intensity and sophistication of attempted attacks and instructions from around the world have increased. The remediation costs and lost revenues experienced by a victim of a cyber incident may be significant and significant resources may be required to repair system damage, protect against the threat of future security breaches or to alleviate problems, including reputational harm, loss of revenues and litigation, caused by any breaches. There also may be liability for any stolen assets or misappropriated confidential information. Any material adverse effect experienced by the Advisor, our transfer agent and other parties that provide us with services essential to our operations could, in turn, have an adverse impact on us.
Risks Related to Investments in Real Estate
Geographic concentration of our portfolio may make us particularly susceptible to adverse economic developments in the real estate markets of those areas.
In the event that we have a concentration of properties in, or real estate investments that invest in properties located in, a particular geographic area, our operating results and ability to make distributions are likely to be impacted by economic changes affecting the real estate markets in that area. Therefore, stockholders’ investment in our common stock will be subject to greater risk to the extent that we lack a geographically diversified portfolio. For example, based on our pro rata share of the estimated market value of the real estate investments in which we owned interests as of December 31, 2017, approximately 12% of our portfolio consists of properties located in London, England and 9% of our portfolio consists of our property in Seattle, Washington. Consequently, our financial condition and ability to make distributions could be materially and adversely affected by any significant adverse developments in those markets. Please see “Item 2. Properties — Market Concentration.”
Industry concentration of our tenants may make us particularly susceptible to adverse economic developments in these industries.
In the event we have a concentration of tenants in a particular industry, our operating results and ability to make distributions may be adversely affected by adverse developments in these industries and we will be subject to a greater risk to the extent that our tenants are not diversified by industry. For example, based on our pro rata share of space leased to tenants as of December 31, 2017, 38% of our space is leased to tenants in the transportation and warehousing industry, 22% is leased to tenants in the retail industry and 7% is leased to tenants in the finance and insurance industry. Please see “Item 2. Properties — Industry Concentration.”
We depend on tenants for our revenue, and therefore our revenue is dependent on the success and economic viability of our tenants. Our reliance on single or significant tenants in certain buildings may decrease our ability to lease vacated space.
Rental income from real property constitutes a significant portion of our income. Delays in collecting accounts receivable from tenants could adversely affect our cash flows and financial condition. In addition, the inability of a single major tenant or a number of smaller tenants to meet their rental obligations would adversely affect our income. Therefore, our financial success is indirectly dependent on the success of the businesses operated by the tenants in our properties or in the properties securing loans we may own. Tenants may have the right to terminate their leases upon the occurrence of certain customary events of default and, in other circumstances, may not renew their leases or, because of market conditions, may be able to renew their leases on terms that are less favorable to us than the terms of the current leases. The weakening of the financial condition or the bankruptcy or insolvency of a significant tenant or a number of smaller tenants and vacancies caused by defaults of tenants or the expiration of leases, may adversely affect our operations and our ability to pay distributions.
Generally, under U.S. bankruptcy law, a debtor tenant has 120 days to exercise the option of assuming or rejecting the obligations under any unexpired lease for nonresidential real property, which period may be extended once by the bankruptcy court. If the tenant assumes its lease, the tenant must cure all defaults under the lease and may be required to provide adequate assurance of its future performance under the lease. If the tenant rejects the lease, we will have a claim against the tenant’s bankruptcy estate. Although rent owing for the period between filing for bankruptcy and rejection of the lease may be afforded
8
administrative expense priority and paid in full, pre-bankruptcy arrears and amounts owing under the remaining term of the lease will be afforded general unsecured claim status (absent collateral securing the claim). Moreover, amounts owing under the remaining term of the lease will be capped. Other than equity and subordinated claims, general unsecured claims are the last claims paid in a bankruptcy and therefore funds may not be available to pay such claims in full. In addition, while the specifics of the bankruptcy laws of international jurisdictions may differ from the U.S. bankruptcy laws described herein, the bankruptcy or insolvency of a significant tenant or a number of smaller tenants at any of the international properties we may acquire, may similarly adversely impact our operations and our ability to pay distributions.
Some of our properties may be leased to a single or significant tenant and, accordingly, may be suited to the particular or unique needs of such tenant. We may have difficulty replacing such a tenant if the floor plan of the vacant space limits the types of businesses that can use the space without major renovation. In addition, the resale value of the property could be diminished because the market value of a particular property will depend principally upon the value of the leases of such property.
A change in U.S. accounting standards regarding operating leases may make the leasing of our properties less attractive to our potential tenants, which could reduce overall demand for our leasing services.
Under current authoritative accounting guidance for leases, a lease is classified by a tenant as a capital lease if the significant risks and rewards of ownership are considered to reside with the tenant. Under capital lease accounting, both the leased asset and liability are reflected on the tenant’s balance sheet. If the terms of the lease do not meet the criteria for a capital lease, the lease is considered an operating lease and no leased asset or contractual lease obligation is recorded on the tenant’s balance sheet. Accordingly, under the current accounting standards for leases, the entry into an operating lease with respect to real property can appear to enhance a tenant’s reported financial condition or results of operations in comparison to the tenant’s direct ownership of the property.
In order to address concerns raised by the SEC regarding the transparency of contractual lease obligations under the existing accounting standards for operating leases, the FASB issued ASU 2016-02 on February 25, 2016, which substantially changes the current lease accounting standards, primarily by significantly changing the concept of operating lease accounting. As a result, a lease asset and obligation will be recorded on the tenant’s balance sheet for all lease arrangements. In addition, ASU 2016-02 will impact the method in which contractual lease payments will be recorded. In order to mitigate the effect of the new lease accounting standards, tenants may seek to negotiate certain terms within new lease arrangements or modify terms in existing lease arrangements, such as shorter lease terms, which would generally have less impact on their balance sheets. Also, tenants may reassess their lease-versus-buy strategies. This could result in a greater renewal risk or shorter lease terms, which may negatively impact our operations and our ability to pay distributions to our stockholders. The new leasing standard is effective on January 1, 2019, with early adoption permitted.
We may suffer adverse consequences if our revenues decline, since our operating costs do not necessarily decline in proportion to our revenue.
We earn a significant portion of our income from renting our properties. Our operating costs, however, do not necessarily fluctuate in proportion to changes in our rental revenue. As a result, our costs will not necessarily decline even if our revenues do. Similarly, our operating costs could increase while our revenues stay flat or decline. In either such event, we may be forced to borrow funds to cover our costs, we may incur losses or we may not have cash available to service our debt and to pay distributions to our stockholders.
9
Due to the risks involved in the ownership of real estate investments and real estate acquisitions, a return on an investment in Hines Global is not guaranteed, and our stockholders may lose some or all of their investment.
By owning our shares, stockholders will be subjected to significant risks associated with owning and operating real estate investments. The performance of their investment in Hines Global will be subject to such risks, including:
• | changes in the general economic climate; |
• | changes in local conditions such as an oversupply of space or reduction in demand for real estate; |
• | changes in interest rates and the availability of financing; |
• | changes in property level operating expenses due to inflation or otherwise; |
• | changes in laws and governmental regulations, including those governing real estate usage, zoning and taxes; and |
• | changes due to factors that are generally outside of our control, such as terrorist attacks and international instability, natural disasters and acts of God, over-building, adverse national, state or local changes in applicable tax, environmental or zoning laws and a taking of any of the properties which we own or in which we otherwise have interests by eminent domain. |
In addition, we expect to acquire additional properties in the future, which may subject us to additional risks associated with real estate property acquisitions, including the risks that:
• | the investments will fail to perform in accordance with our expectations because of conditions or liabilities we did not know about at the time of acquisition; and |
• | our projections or estimates with respect to the performance of the investments, the costs of operating or improving the properties or the effect of the economy or capital markets on the investments will prove inaccurate. |
Any of these factors could have a material adverse effect on our business, results of operations, cash flows and financial condition and our ability to make distributions to our stockholders and the value of their investment.
We may be adversely affected by trends in the office real estate industry.
Some businesses are rapidly evolving to make employee telecommuting, flexible work schedules, open workplaces and teleconferencing increasingly common. These practices enable businesses to reduce their space requirements. A continuation of the movement towards these practices could over time erode the overall demand for office space and, in turn, place downward pressure on occupancy, rental rates and property valuations, each of which could have an adverse effect on our financial position, results of operations, cash flows and ability to make distributions to our stockholders.
An economic slowdown or rise in interest rates or other unfavorable changes in economic conditions in the markets in which we operate could adversely impact our business, results of operations, cash flows and financial condition and our ability to make distributions to our stockholders and the value of their investment.
The development of negative economic conditions in the markets in which we operate may significantly affect occupancy, rental rates and our ability to collect rent from our tenants, as well as our property values, which could have a material adverse impact on our cash flows, operating results and carrying value of investment property. For example, an economic recession or rise in interest rates could make it more difficult for us to lease real properties, may require us to lease the real properties we acquire at lower rental rates and may lead to an increase in tenant defaults. In addition, these conditions may also lead to a decline in the value of our properties and make it more difficult for us to dispose of these properties at an attractive price. Other risks that may affect conditions in the markets in which we operate include:
• | local conditions, such as an oversupply of the types of properties we invest in or a reduction in demand for such properties in the area; and |
• | increased operating costs, if these costs cannot be passed through to tenants. |
International, national, regional and local economic climates have been adversely affected by the slow job growth of recent years. To the extent any of the adverse conditions described above occurs in the specific markets in which we operate, market rents, occupancy rates and our ability to collect rents from our tenants will likely be affected and the value of our properties may decline. We could also face challenges related to adequately managing and maintaining our properties, should we experience increased operating cost and as a result, we may experience a loss of rental revenues. Any of these factors may adversely affect our business, results of operations, cash flows and financial condition, our ability to make distributions to our stockholders and the value of their investment.
10
Our use of borrowings to fund improvements on properties or other cash needs could result in foreclosures and unexpected debt service expenses upon refinancing, both of which could have an adverse impact on our operations and cash flow.
We are relying and intend to continue to rely in part on borrowings under our credit facilities and other external sources of financing to fund the costs of any capital expenditures and other items. Accordingly, we are subject to the risks that our cash flow will not be sufficient to cover required debt service payments and that we will be unable to meet other covenants or requirements in the credit agreements.
If we cannot meet our required debt obligations, the property or properties securing such indebtedness could be foreclosed upon by, or otherwise transferred to, our lender, with a consequent loss of income and asset value to us. For tax purposes, a foreclosure of any of our properties would be treated as a sale of the property for a purchase price equal to the outstanding balance of the debt secured by the mortgage. If the outstanding balance of the debt secured by the mortgage exceeds our tax basis in the property, we would recognize taxable income on foreclosure, but we may not receive any cash proceeds. Additionally, we may be required to refinance our debt subject to “lump sum” or “balloon” payment maturities on terms less favorable than the original loan or at a time we would otherwise prefer to not refinance such debt. A refinancing on such terms or at such times could increase our debt service payments, which would decrease the amount of cash we would have available for operations, new investments and distribution payments and may cause us to determine to sell one or more properties at a time when we would not otherwise do so.
Uninsured losses relating to real property may adversely impact the value of our portfolio.
We attempt to ensure that all of our properties are adequately insured to cover casualty losses. However, there are types of losses, generally catastrophic in nature, which are uninsurable, are not economically insurable or are only insurable subject to limitations. Examples of such catastrophic events include acts of war or terrorism, earthquakes, floods, hurricanes and pollution or environmental matters. We may not have adequate coverage in the event we or our buildings suffer casualty losses. If we do not have adequate insurance coverage, the value of our assets will be reduced as the result of, and to the extent of, any such uninsured losses. Additionally, we may not have access to capital resources to repair or reconstruct any uninsured damage to a property.
We may be unable to obtain desirable types of insurance coverage at a reasonable cost, if at all, and we may be unable to comply with insurance requirements contained in mortgage or other agreements due to high insurance costs.
We may not be able either to obtain certain desirable types of insurance coverage, such as terrorism, earthquake, flood, hurricane and pollution or environmental matter insurance, or to obtain such coverage at a reasonable cost in the future, and this risk may limit our ability to finance or refinance debt secured by our properties. Additionally, we could default under debt or other agreements if the cost and/or availability of certain types of insurance make it impractical or impossible to comply with covenants relating to the insurance we are required to maintain under such agreements. In such instances, we may be required to self-insure against certain losses or seek other forms of financial assurance.
The real estate industry is subject to extensive regulation, which may result in higher expenses or other negative consequences that could adversely affect us.
Our activities are subject to federal, state and municipal laws, and to regulations, authorizations and license requirements with respect to, among other things, zoning, environmental protection and historical heritage, all of which may affect our business. We may be required to obtain licenses and permits with different governmental authorities in order to acquire and manage our assets.
In addition, the Dodd-Frank Wall Street Reform and Consumer Protection Act (the “Dodd-Frank Act”), which generally took effect in 2011, contains a sweeping overhaul of the regulation of U.S. financial institutions and financial markets. Key provisions of the Dodd-Frank Act require extensive rulemaking by the SEC and the U.S. Commodity Futures Trading Commission, some of which remains ongoing. Thus, the full impact of the Dodd-Frank Act on our business cannot be fully assessed until all final implementing rules and regulations are promulgated.
Various rules currently in effect under the Dodd-Frank Act may have a significant impact on our business, including, without limitation, provisions of the legislation that increase regulation of and disclosure requirements related to investment advisors, swap transactions and hedging policies, corporate governance and executive compensation, investor protection and enforcement provisions, and asset-backed securities. In February 2017, the U.S. President ordered the Secretary of the U.S. Treasury to review certain existing rules and regulations, such as those promulgated under the Dodd-Frank Act; however, the
11
implications of that review are not yet known and none of the rules and regulations promulgated under the Dodd-Frank Act have been modified or rescinded as of the date of this report.
For example, but not by way of limitation, the Dodd-Frank Act and the rules and regulations promulgated thereunder provides for significantly increased regulation of the derivatives markets and transactions that affect our interest rate hedging activities, including: (i) regulatory reporting, (ii) subject to limited exemptions, mandated clearing through central counterparties and execution on regulated exchanges or execution facilities, and (iii) margin and collateral requirements. While the full impact of the Dodd-Frank Act on our interest rate hedging activities cannot be fully assessed until all final implementing rules and regulations are promulgated, the foregoing requirements may affect our ability to enter into hedging or other risk management transactions, may increase our costs in entering into such transactions, and/or may result in us entering into such transactions on less favorable terms than prior to the Dodd-Frank Act. For example, subject to an exception for “end-users” of swaps upon which we may seek to rely, we may be required to clear certain interest rate hedging transactions by submitting them to a derivatives clearing organization. To the extent we are required to clear any such transactions, we will be required to, among other things, post margin in connection with such transactions. The occurrence of any of the foregoing events may have an adverse effect on our business and our stockholders’ return.
In addition, public authorities may enact new and more stringent standards, or interpret existing laws and regulations in a more restrictive manner, which may force companies in the real estate industry, including us, to spend funds to comply with these new rules. Any such action on the part of public authorities may adversely affect our results from operations.
In the event of noncompliance with such laws, regulations, licenses and authorizations, we may face the payment of fines, project shutdowns, cancellation of licenses, and revocation of authorizations, in addition to other civil and criminal penalties.
We operate in a competitive business, and many of our competitors have significant resources and operating flexibility, allowing them to compete effectively with us.
Numerous real estate companies that operate in the markets in which we may operate will compete with us in acquiring real estate investments and obtaining creditworthy tenants to occupy such properties or the properties owned by such investments. One such company with whom we may compete for tenants is Hines Global Income Trust. Such competition could adversely affect our business. There are numerous real estate companies, real estate investment trusts and U.S. institutional and foreign investors that will compete with us in seeking investments and tenants for properties. Many of these entities have significant financial and other resources, including operating experience, allowing them to compete effectively with us. In addition, our ability to charge premium rental rates to tenants may be negatively impacted. This increased competition may increase our costs of acquisitions or investments or lower our occupancy rates and the rent we may charge tenants. In addition, the arrival of new competitors in the immediate areas where we have assets could require unplanned investments in our assets, which may adversely affect us. We may also have difficulty in renewing leases or in leasing to new tenants, which may lead to a reduction in our cash flow and operating income, since the proximity of new competitors could divert existing or new tenants to such competitors, resulting in vacancies.
We may have difficulty selling real estate investments, and our ability to distribute all or a portion of the net proceeds from such sales to our stockholders may be limited.
Real estate investments are relatively illiquid. We will have a limited ability to vary our portfolio in response to changes in economic or other conditions. We will also have a limited ability to sell assets in order to fund working capital and similar capital needs such as share redemptions. We expect to generally hold a real estate investment for the long term. When we sell any of our real estate investments, we may not realize a gain on such sale or the amount of our taxable gain could exceed the cash proceeds we receive from such sale. We may not distribute any proceeds from the sale of real estate investments to our stockholders. Rather, we may use such proceeds to:
• | purchase additional real estate investments; |
• | repay debt; |
• | buy out interests of any co-venturers or other partners in any joint venture in which we are a party; |
• | purchase shares under our share redemption program; |
• | create working capital reserves; or |
• | make repairs, maintenance, tenant improvements or other capital improvements or expenditures to our other properties. |
The real estate market is affected by many factors, such as general economic conditions, availability of financing, interest rates and other factors, including supply and demand, that are beyond our control. We cannot predict whether we will be able to sell any property for the price or on the terms set by us, or whether any price or other terms offered by a prospective purchaser
12
would be acceptable to us. We cannot predict the length of time needed to find a willing purchaser and to close the sale of a property. Real estate generally cannot be sold quickly. Therefore, we may not be able to dispose of properties promptly, or on favorable terms, in response to economic or other market conditions, and this may adversely impact our ability to make distributions to stockholders. In addition, we may be required to expend funds to correct defects or to make improvements before a property can be sold. We cannot assure stockholders that we will have funds available to correct such defects or to make such improvements.
Our ability to sell our properties may also be limited by our desire to avoid a 100% penalty tax that is imposed on gain recognized by a REIT from the sale of property characterized as dealer property. In order to avoid such characterization and to take advantage of certain safe harbors under the Code, we may determine to hold our properties for a minimum period of at least two years, in addition to satisfying certain other requirements.
The sale of properties may cause us to incur penalty taxes, fail to maintain our REIT status, or own and sell properties through Taxable REIT Subsidiaries (“TRSs”), each of which would diminish the return to our stockholders.
The sale of one or more of our properties may be considered a prohibited transaction under the Code. Any “inventory-like” sales could be considered such a prohibited transaction. If we are deemed to have engaged in a “prohibited transaction” (i.e., we sell a property held by us primarily for sale in the ordinary course of our trade or business), all net gain that we derive from such sale would be subject to a 100% penalty tax. The Code sets forth a safe harbor for REITs that wish to sell property without risking the imposition of the 100% penalty tax. The principal requirements of the safe harbor are that: (i) the REIT must hold the applicable property for not less than two years for the production of rental income prior to its sale; (ii) the aggregate expenditures made by the REIT, or any partner of the REIT, during the two-year period preceding the date of sale which are includible in the basis of the property do not exceed 30% of the net selling price of the property; and (iii) property sales by the REIT do not exceed at least one of the following thresholds: (a) seven sales in the current year; (b) sales in the current year that do not exceed 10% of the REIT’s assets as of the beginning of the year (as measured by either fair market value or tax basis); or (c) sales in the current year that do not exceed 20% of the REIT’s assets as of the beginning of the year, and sales over a three-year period do not exceed, on average, 10% per annum of the REIT’s assets, in each case as measured by either fair market value or tax basis. Given our investment and operating strategy, the sale of one or more of our properties may not satisfy the above prohibited transaction safe harbor.
If we desire to sell a property pursuant to a transaction that does not satisfy the safe harbor, we may be able to avoid the prohibited transaction tax if we hold and sell the property through a TRS. In that case, any gain would be taxable to the TRS at regular corporate income tax rates. We may decide to forego the use of a TRS in a transaction that does not meet the safe harbor based our own internal analysis, the opinion of counsel or the opinion of other tax advisors that the disposition will not be subject to the prohibited transaction tax. In cases where a property disposition is not effected through a TRS, the Internal Revenue Service could assert that the disposition constitutes a prohibited transaction. If such an assertion were successful, all of the net gain from the sale of the property will be payable as a tax which will have a negative impact on cash flow and the ability to make cash distributions.
As a REIT, the value of our ownership interests held in our TRSs may not exceed 20% of the value of all of our assets at the end of any calendar quarter. If the IRS were to determine that the value of our interests in all of our TRSs exceeded 20% of the value of our total assets at the end of any calendar quarter, then we could fail to qualify as a REIT. If we determine it to be in our best interest to own a substantial number of our properties through one or more TRSs, then it is possible that the IRS may conclude that the value of our interests in our TRSs exceeds 20% of the value of our total assets at the end of any calendar quarter and therefore cause us to fail to qualify as a REIT. Additionally, as a REIT, generally no more than 25% of our gross income with respect to any year may be from sources other than real estate. Distributions paid to us from a TRS are considered to be non-real estate income. Therefore, we may fail to qualify as a REIT if distributions from all of the Company’s TRSs, when aggregated with all other non-real estate income with respect to any one year, are more than 25% of the Company’s gross income with respect to such year.
Potential liability as the result of, and the cost of compliance with, environmental matters could adversely affect our operations.
Under various federal, state and local environmental laws, ordinances and regulations, a current or previous owner or operator of real property may be liable for the cost of removal or remediation of hazardous or toxic substances on such property. Such laws often impose liability whether or not the owner or operator knew of, or was responsible for, the presence of such hazardous or toxic substances.
13
We have invested in properties historically used for industrial, manufacturing and commercial purposes. These properties are more likely to contain, or may have contained, underground storage tanks for the storage of petroleum products and other hazardous or toxic substances. All of these operations create a potential for the release of petroleum products or other hazardous or toxic substances. Leasing properties to tenants that engage in industrial, manufacturing, and commercial activities will cause us to be subject to increased risk of liabilities under environmental laws and regulations. The presence of hazardous or toxic substances, or the failure to properly remediate these substances, may adversely affect our ability to sell, rent or pledge such property as collateral for future borrowings.
Environmental laws also may impose restrictions on the manner in which properties may be used or businesses may be operated, and these restrictions may require expenditures. Such laws may be amended so as to require compliance with stringent standards which could require us to make unexpected, substantial expenditures. Environmental laws provide for sanctions in the event of noncompliance and may be enforced by governmental agencies or, in certain circumstances, by private parties. We may be potentially liable for such costs in connection with the acquisition and ownership of our properties in the United States. In addition, we may invest in properties located in countries that have adopted laws or observe environmental management standards that are less stringent than those generally followed in the United States, which may pose a greater risk that releases of hazardous or toxic substances have occurred to the environment. The cost of defending against claims of liability, compliance with environmental regulatory requirements or remediating any contaminated property could be substantial and require a material portion of our cash flow.
We face possible risks associated with the physical effects of climate change.
We cannot predict with certainty whether climate change is occurring and, if so, at what rate. However, the physical effects of climate change could have a material adverse effect on our properties, operations and business. To the extent climate change causes changes in weather patterns, our markets could experience increases in storm intensity, such as those experienced in Super Storm Sandy in October 2012 and Hurricane Harvey in 2017, and rising sea-levels. Over time, these conditions could result in declining demand for office space in our buildings or the inability of us to operate the buildings at all. Climate change may also have indirect effects on our business by increasing the cost of (or making unavailable) property insurance on terms we find acceptable, increasing the cost of energy and increasing the cost of snow removal at our properties. There can be no assurance that climate change will not have a material adverse effect on our properties, operations or business.
Our properties are subject to property taxes that may increase in the future, which could adversely affect our cash flow.
Our properties are subject to real and personal property taxes that may increase as property tax rates change and as the properties are assessed or reassessed by taxing authorities. We anticipate that most of our leases will generally provide that the property taxes or increases therein, are charged to the lessees as an expense related to the properties that they occupy. As the owner of the properties, however, we are ultimately responsible for payment of the taxes to the government. If property taxes increase, our tenants may be unable to make the required tax payments, ultimately requiring us to pay the taxes. In addition, we will generally be responsible for property taxes related to any vacant space. If we purchase residential properties, the leases for such properties typically will not allow us to pass through real estate taxes and other taxes to residents of such properties. Consequently, any tax increases may adversely affect our results of operations at such properties.
Our costs associated with complying with the Americans with Disabilities Act of 1990, or the ADA, may affect cash available for distributions.
Any domestic properties we acquire will generally be subject to the ADA. Under the ADA, all places of public accommodation are required to comply with federal requirements related to access and use by disabled persons. The ADA has separate compliance requirements for “public accommodations” and “commercial facilities” that generally require that buildings and services be made accessible and available to people with disabilities. The ADA’s requirements could require removal of access barriers and could result in the imposition of injunctive relief, monetary penalties or, in some cases, an award of damages. We may not acquire properties that comply with the ADA or we may not be able to allocate the burden on the seller or other third-party, such as a tenant, to ensure compliance with the ADA in all cases. Foreign jurisdictions may have similar requirements and any funds we use for ADA or similar compliance may affect cash available for distributions and the amount of distributions to you.
Our properties may contain or develop harmful mold, which could lead to liability for adverse health effects and costs of remediating the problem.
If any of our properties has or develops mold we may be required to undertake a costly program to remediate, contain or remove the mold. Mold growth may occur when moisture accumulates in buildings or on building materials. Some molds may
14
produce airborne toxins or irritants. Concern about indoor exposure to mold has been increasing because exposure to mold may cause a variety of adverse health effects and symptoms, including allergic or other reactions. We may become liable to our tenants, their employees and others if property damage or health concerns arise, all of which could have a material adverse effect on our business, results of operations, cash flows and financial condition and our ability to make distributions to our stockholders and the value of their investment.
If we set aside insufficient working capital reserves, we may be required to defer necessary or desirable property improvements.
If we do not establish sufficient reserves for working capital to supply necessary funds for capital improvements or similar expenses, we may be required to defer necessary or desirable improvements to our properties. If we defer such improvements, the applicable properties may decline in value, it may be more difficult for us to attract or retain tenants to such properties or the amount of rent we can charge at such properties may decrease.
Changes in supply of or demand for similar properties in a particular area may increase the price of real estate assets we may seek to purchase or adversely affect the value of the properties we own.
The real estate industry is subject to market forces and we are unable to predict certain market changes including changes in supply of or demand for similar properties in a particular area. For example, if demand for the types of real estate assets in which we seek to invest were to sharply increase or supply of those assets were to sharply decrease, the prices of those assets could rise significantly. Any potential purchase of an overpriced asset could decrease our rate of return on these investments and result in lower operating results and overall returns to you. Likewise, a sharp increase in supply could adversely affect lease rates and occupancy, which could result in lower operating results and overall returns to you.
Retail properties depend on anchor tenants to attract shoppers and could be adversely affected by the loss of a key anchor tenant.
We have acquired properties that include retail space. Retail properties, like other properties, are subject to the risk that tenants may be unable to make their lease payments or may decline to extend a lease upon its expiration. A lease termination by a tenant that occupies a large area of a retail center (commonly referred to as an anchor tenant) could impact leases of other tenants. Other tenants may be entitled to modify the terms of their existing leases in the event of a lease termination by an anchor tenant, or the closure of the business of an anchor tenant that leaves its space vacant even if the anchor tenant continues to pay rent. Any such modifications or conditions could be unfavorable to us as the property owner and could decrease rents or expense recoveries. Additionally, major tenant closures may result in decreased customer traffic, which could lead to decreased sales at other stores. In the event of default by a tenant or anchor store, we may experience delays and costs in enforcing our rights as landlord to recover amounts due to us under the terms of our agreements with those parties.
Leases with retail properties’ tenants may restrict us from re-leasing space.
Most leases with retail tenants contain provisions giving the particular tenant the exclusive right to sell particular types of merchandise or provide specific types of services within the particular retail center. These provisions may limit the number and types of prospective tenants interested in leasing space in a particular retail property.
We purchased assets at a time when the commercial real estate market was experiencing substantial influxes of capital investment and competition for properties, and the real estate we purchased may not appreciate or may decrease in value.
Real estate investment transaction volume has increased since 2010, and estimated going-in capitalization rates, or cap rates (ratio of the net projected operating income of a property in its initial fiscal year divided by the net purchase price), have fallen relative to their post-recession peaks in late 2009. There continues to be a significant amount of investment capital pursuing high-quality, well-located assets that generate stable cash flows, causing aggressive competition and pricing for assets which match our investment strategy. This may continue to drive prices higher, resulting in lower cap rates and returns. We have purchased real estate in this environment and we are subject to the risks that the value of our assets may not appreciate or may decrease significantly below the amount we paid for such assets if the real estate market ceases to attract the same level of capital investment in the future as it attracted when we purchased such assets, or if the number of companies seeking to acquire such assets decreases. If any of these circumstances occur or the values of our investments are otherwise negatively affected, the value of our stockholders’ investment may be lower.
We depend on the availability of public utilities and services, especially for water and electric power. Any reduction, interruption or cancellation of these services may adversely affect us.
15
Public utilities, especially those that provide water and electric power, are fundamental for the operation of our assets. The delayed delivery or any material reduction or prolonged interruption of these services could result in tenants terminating their leases or result in an increase in our costs, as we may be forced to use backup generators, which also could be insufficient to fully operate our properties. Accordingly, any interruption or limitation in the provision of these essential services may adversely affect us.
Risks Related to International Investments
We are subject to additional risks from our international investments.
Many of the properties in our portfolio are located outside the United States. These investments may be affected by factors particular to the laws and business practices of the jurisdictions in which the properties are located. These laws and business practices may expose us to risks that are different from and in addition to those commonly found in the United States. Foreign investments pose the following risks:
• | the burden of complying with a wide variety of foreign laws; |
• | changing governmental rules and policies, including changes in land use and zoning laws, more stringent environmental laws or changes in such environmental laws; |
• | existing or new laws relating to the foreign ownership of real property or loans and laws restricting the ability of foreign persons or companies to remove profits earned from activities within the country to the person’s or company’s country of origin; |
• | the potential for expropriation; |
• | possible currency transfer restrictions; |
• | imposition of adverse or confiscatory taxes; |
• | changes in real estate and other tax rates and changes in other operating expenses in particular countries; |
• | possible challenges to the anticipated tax treatment of the structures that allow us to acquire and hold investments; |
• | adverse market conditions caused by terrorism, civil unrest and changes in national or local governmental or economic conditions; |
• | the willingness of domestic or foreign lenders to make loans in certain countries and changes in the availability, cost and terms of loan funds resulting from varying national economic policies; |
• | general political and economic instability in certain regions; |
• | the potential difficulty of enforcing obligations in other countries; and |
• | Hines’ limited experience and expertise in foreign countries relative to its experience and expertise in the United States. |
Investments in properties or other real estate investments outside the United States subject us to foreign currency risks, which may adversely affect distributions and our REIT status.
Revenues generated from any properties or other real estate investments or ventures we enter into relating to transactions involving assets located in markets outside the United States likely will be denominated in the local currency. Therefore, any investments we make outside the United States may subject us to foreign currency risk due to potential fluctuations in exchange rates between foreign currencies and the U.S. dollar. As a result, changes in exchange rates of any such foreign currency to the U.S. dollar may affect our revenues, operating margins and distributions and may also affect the book value of our assets and the amount of stockholders’ equity.
Changes in foreign currency exchange rates used to value a REIT’s foreign assets may be considered changes in the value of the REIT’s assets. These changes may adversely affect our status as a REIT. Further, bank accounts in foreign currency which are not considered cash or cash equivalents may adversely affect our status as a REIT.
16
The United Kingdom’s determination to exit the European Union could adversely affect market rental rates and commercial real estate values in the United Kingdom and Europe.
On June 23, 2016, the United Kingdom held a non-binding referendum in which a majority of voters voted in favor of the United Kingdom’s exit from the European Union. On March 29, 2017, the United Kingdom gave formal notice of its exit from the European Union and commenced the two-year period of negotiations to determine the terms of the United Kingdom’s relationship with the European Union after the exit, including, among other things, the terms of trade between the United Kingdom and the European Union. The effects of the exit will depend on any agreements the United Kingdom makes to retain access to European Union markets either during a transitional period or more permanently. The announcement of the Brexit vote caused significant volatility in global stock markets and currency exchange rate fluctuations that resulted in the strengthening of the U.S. dollar against foreign currencies in which we conduct business. In addition, the uncertainty caused by the Brexit vote and the notice of departure may:
• | adversely affect European and worldwide economic and market conditions; |
• | adversely affect commercial property market rental rates in the United Kingdom and continental Europe; |
• | adversely affect commercial property market values in the United Kingdom and continental Europe; |
• | adversely affect the availability of financing for commercial properties in the United Kingdom and continental Europe, which could reduce the price for which we are able to sell properties we have acquired in such geographic locations; and |
• | create further instability in global financial and foreign exchange markets, including volatility in the value of the sterling and euro. |
Each of these effects may occur before the United Kingdom departs from the European Union because the capital and credit markets are subject to volatility and disruption caused by the uncertainty introduced by the Brexit vote. As of December 31, 2017, 12% of our real estate investment portfolio was located in London, England. A decline in economic conditions could negatively impact commercial real estate fundamentals and result in lower occupancy, lower rental rates and declining values in our portfolio, which could, among other things, adversely affect our business and financial condition.
Inflation in foreign countries, along with government measures to curb inflation, may have an adverse effect on our investments.
Certain countries have in the past experienced extremely high rates of inflation. Inflation, along with governmental measures to curb inflation, coupled with public speculation about possible future governmental measures to be adopted, has had significant negative effects on these international economies in the past and this could occur again in the future. The introduction of governmental policies to curb inflation can have an adverse effect on our business. High inflation in the countries in which we purchase real estate or make other investments could increase our expenses and we may not be able to pass these increased costs on to our tenants.
Lack of compliance with the United States Foreign Corrupt Practices Act (“FCPA”) could subject us to penalties and other adverse consequences.
We are subject to the FCPA, which generally prohibits United States companies from engaging in bribery or other prohibited payments to foreign officials for the purpose of obtaining or retaining business. Foreign companies, including potential competitors, are not subject to these prohibitions. Fraudulent practices, including corruption, extortion, bribery, pay-offs, theft and others, occur from time-to-time in countries in which we may do business. If people acting on our behalf or at our request are found to have engaged in such practices, severe penalties and other consequences could be imposed on us that may have a material adverse effect on our business, results of operations, cash flows and financial condition and our ability to make distributions to our stockholders and the value of their investment.
Risks Related to Organizational Structure
Any interest in Hines Global will be diluted by the Special OP Units and any other OP Units in the Operating Partnership, and any interest in Hines Global may be diluted if we issue additional shares.
Hines Global owned a 99.99% general partner interest in the Operating Partnership as of December 31, 2017. Affiliates of Hines owned the remaining 0.01% interest in the Operating Partnership. Hines Global REIT Associates Limited Partnership owns the special units of the Operating Partnership (the “Special OP Units”), which were issued as consideration for an obligation by Hines and its affiliates to perform services in connection with our real estate operations. Payments with respect to these interests will reduce the amount of distributions that would otherwise be payable to our stockholders in the future.
17
Stockholders do not have preemptive rights to acquire any shares issued by us in the future. Therefore, investors may experience dilution of their equity investment if we:
• | sell additional shares in the future, including those issued pursuant to our distribution reinvestment plan; |
• | sell securities that are convertible into shares, such as units of the Operating Partnership (“OP Units”); |
• | at the option of the Advisor, issue OP Units to pay for certain fees; |
• | issue OP Units or common shares to the Advisor or affiliates in exchange for advances or deferrals of fees; |
• | issue shares in a private offering; or |
• | issue shares to sellers of properties acquired by us in connection with an exchange of partnership units from the Operating Partnership. |
The repurchase of interests in the Operating Partnership held by Hines and its affiliates (including the Special OP Units and other OP Units) as required in our Advisory Agreement may discourage a takeover attempt.
Under certain circumstances, including a merger, consolidation or sale of substantially all of our assets or any similar transaction, a transaction pursuant to which a majority of our board of directors then in office are replaced or removed, or the termination or non-renewal of our Advisory Agreement under various circumstances, the Operating Partnership is, at the election of Hines or its affiliates, required to purchase the Special OP Units and any OP Units that Hines or its affiliates own for cash (or, in certain cases, a promissory note) or our shares, at the election of the holder. These rights may deter these types of transactions which may limit the opportunity for stockholders to receive a premium for their common shares that might otherwise exist if an investor attempted to acquire us.
Hines’ ability to cause the Operating Partnership to purchase the Special OP Units and any other OP Units that it or its affiliates hold in connection with the termination of our Advisory Agreement may deter us from terminating our Advisory Agreement.
Under certain circumstances, if we are not advised by an entity affiliated with Hines, Hines or its affiliates may cause the Operating Partnership to purchase some or all of the Special OP Units or any other OP Units then held by such entities. Under these circumstances if the amount necessary to purchase Hines’ and its affiliates’ interests in the Operating Partnership is substantial, these rights could discourage or deter us from terminating our Advisory Agreement under circumstances in which we would otherwise do so.
We may issue preferred shares or separate classes or series of common shares, which issuance could adversely affect the holders of our common shares.
We may issue, without stockholder approval, preferred shares or a class or series of common shares with rights that could adversely affect the holders of our common shares. Upon the affirmative vote of a majority of our directors (including, in the case of preferred shares, a majority of our independent directors), our articles authorize our board of directors (without any further action by our stockholders) to issue preferred shares or common shares in one or more classes or series, and to fix the voting rights (subject to certain limitations), liquidation preferences, distribution rates, conversion rights, redemption rights and terms, including sinking fund provisions, and certain other rights and preferences with respect to such classes or series of shares. If we ever create and issue preferred shares with a distribution preference over common shares, payment of any distribution preferences of outstanding preferred shares would reduce the amount of funds available for the payment of distributions on the common shares. Further, holders of preferred shares are normally entitled to receive a preference payment in the event we liquidate, dissolve or wind up before any payment is made to the common stockholders, likely reducing the amount common stockholders would otherwise receive upon such an occurrence. We could also designate and issue shares in a class or series of common shares with similar rights. In addition, under certain circumstances, the issuance of preferred shares or a separate class or series of common shares may render more difficult or tend to discourage:
• | a merger, tender offer or proxy contest; |
• | the assumption of control by a holder of a large block of our securities; and/or |
• | the removal of incumbent management. |
Our board of directors determines our major policies and operations which increases the uncertainties faced by our stockholders.
Our board of directors determines our major policies, including our policies regarding acquisitions, dispositions, financing, growth, debt capitalization, REIT qualification, redemptions and distributions. Our board of directors may amend or revise these and other policies without a vote of the stockholders. Under the Maryland General Corporation Law and our articles, our
18
stockholders have a right to vote only on limited matters. Our board of directors’ broad discretion in setting policies and the inability of our stockholders to exert control over those policies increases the uncertainty and risks they face, especially if our board of directors and our stockholders disagree as to what course of action is in the best interests of our stockholders.
The ownership limit in our articles may discourage a takeover attempt.
Our articles provide that no holder of shares, other than any person to whom our board of directors grants an exemption, may directly or indirectly own more than 9.9% of the number or value, whichever is more restrictive, of the aggregate of our outstanding shares or more than 9.9% of the number or value, whichever is more restrictive, of the outstanding shares of any class or series of our outstanding securities. This ownership limit may deter tender offers for our common shares, which offers may be attractive to our stockholders, and thus may limit the opportunity for stockholders to receive a premium for their common shares that might otherwise exist if an investor attempted to assemble a block of common shares in excess of 9.9% of the number or value, whichever is more restrictive, of the aggregate of our outstanding shares, or 9.9% in number or value, whichever is more restrictive, of the outstanding common shares or otherwise to effect a change of control in us.
We will not be afforded the protection of the Maryland General Corporation Law relating to business combinations.
Provisions of the Maryland General Corporation Law prohibit business combinations, unless prior approval of the board of directors is obtained before the person seeking the combination became an interested stockholder, with:
• | any person who beneficially owns 10% or more of the voting power of our outstanding voting shares (an “interested stockholder”); |
• | any of our affiliates or associates who, at any time within the two-year period prior to the date in question, was the beneficial owner of 10% or more of the voting power of our then outstanding shares (also an “interested stockholder”); or |
• | an affiliate of an interested stockholder. |
These prohibitions are intended to prevent a change of control by interested stockholders who do not have the support of our board of directors. Because our articles contain limitations on ownership of more than 9.9% of our common shares, our board of directors has adopted a resolution presently opting out of the business combinations statute. Therefore, we will not be afforded the protections of this statute and, accordingly, there is no guarantee that the ownership limitations in our articles will provide the same measure of protection as the business combinations statute and prevent an undesired change of control by an interested stockholder.
We are not registered as an investment company under the Investment Company Act of 1940, as amended (the “Investment Company Act”), and therefore we will not be subject to the requirements imposed on an investment company by the Investment Company Act which may limit or otherwise affect our investment choices.
Hines Global, our Operating Partnership, and our subsidiaries will conduct our businesses so that none of such entities are required to register as “investment companies” under the Investment Company Act. Although we could modify our business methods at any time, at the present time we expect that the focus of our activities will involve investments in real estate, buildings, and other assets that can be referred to as “sticks and bricks” and in other real estate investments and will otherwise be considered to be in the real estate business.
Companies subject to the Investment Company Act are required to comply with a variety of substantive requirements such as requirements relating to:
• | limitations on the capital structure of the entity; |
• | restrictions on certain investments; |
• | prohibitions on transactions with affiliated entities; and |
• | public reporting disclosures, record keeping, voting procedures, proxy disclosure and similar corporate governance rules and regulations. |
These and other requirements are intended to provide benefits and/or protections to security holders of investment companies. Because we and our subsidiaries do not expect to be subject to these requirements, our stockholders will not be entitled to these benefits or protections. It is our policy to operate in a manner that will not require us to register as an investment company, and we do not expect or intend to register as an “investment company” under the Investment Company Act.
19
Whether a company is an investment company can involve analysis of complex laws, regulations and SEC staff interpretations. Hines Global and the Operating Partnership intend to continue to conduct operations so as not to become subject to regulation as an investment company under the Investment Company Act. So long as Hines Global conducts its businesses directly and through its Operating Partnership and its wholly-owned or majority-owned subsidiaries that are not investment companies and none of Hines Global, the Operating Partnership and the wholly-owned or majority-owned subsidiaries hold themselves out as being engaged primarily in the business of investing in securities, Hines Global will not have to register. The securities issued by any subsidiary that is excepted from the definition of investment company under Section 3(c)(1) or Section 3(c)(7) of the Investment Company Act, together with any other “investment securities” (as used in the Investment Company Act) its parent may own, may not meet the standards of the 40% test. In other words, even if some interests in other entities were deemed to be investment securities, so long as such investment securities do not comprise more than 40% of an entity’s assets, the entity will not be required to register as an investment company. If an entity held investment securities and the value of these securities exceeded 40% of the value of its total assets, and no other exemption from registration was available, then that entity might be required to register as an investment company.
We do not expect that we, the Operating Partnership, or other subsidiaries will be an investment company because we will seek to assure that holdings of investment securities in any such entity will not exceed 40% of the total assets of that entity as calculated under the Investment Company Act. In order to operate in compliance with that standard, each entity may be required to conduct its business in a manner that takes account of these provisions. We, our Operating Partnership, or a subsidiary could be unable to sell assets we would otherwise want to sell or we may need to sell assets we would otherwise wish to retain, if we deem it necessary to remain in compliance with the 40% test. In addition, we may also have to forgo opportunities to acquire certain investments or interests in companies or entities that we would otherwise want to acquire, or acquire assets we might otherwise not select for purchase, if we deem it necessary to remain in compliance with the 40% test. For example, these restrictions will limit the ability of our subsidiaries to invest directly in mortgage-backed securities that represent less than the entire ownership in a pool of mortgage loans, debt and equity tranches of securitizations and certain asset backed securities and real estate companies or in assets not related to real estate.
If Hines Global, the Operating Partnership or any subsidiary owns assets that qualify as “investment securities” as such term is defined under the Investment Company Act and the value of such assets exceeds 40% of the value of its total assets, the entity could be deemed to be an investment company. In that case the entity would have to qualify for an exemption from registration as an investment company in order to operate without registering as an investment company. Certain of the subsidiaries that we may form in the future could seek to rely upon the exemption from registration as an investment company under the Investment Company Act pursuant to Section 3(c)(5)(C) of that Act, which is available for, among other things, entities “primarily engaged in the business of purchasing or otherwise acquiring mortgages and other liens on and interests in real estate.” This exemption generally requires that at least 55% of an entity’s portfolio must be comprised of qualifying assets and at least another 25% of such entity’s portfolio must be comprised of real estate-related assets (as such terms are used under the Investment Company Act) and no more than 20% of such entity’s portfolio may be comprised of miscellaneous assets. Qualifying assets for this purpose include certain mortgage loans and other assets, such as whole pool agency residential mortgage backed securities (“RMBS”) that the SEC staff, in various no-action letters, has determined are the functional equivalent of mortgage loans for the purposes of the Investment Company Act. We intend to treat as real estate-related assets non-agency RMBS, commercial mortgage backed securities, debt and equity securities of companies primarily engaged in real estate businesses, agency partial pool certificates and securities issued by pass-through entities of which substantially all of the assets consist of qualifying assets and/or real estate-related assets.
20
We may in the future organize one or more subsidiaries that seek to rely on the Investment Company Act exemption provided to certain structured financing vehicles by Rule 3a-7. To the extent that we organize subsidiaries that rely on Rule 3a-7 under the Investment Company Act for an exemption from the Investment Company Act, these subsidiaries will need to comply with the restrictions contained in this Rule. In general, Rule 3a-7 exempts from the Investment Company Act issuers that limit their activities as follows:
• | the issuer issues securities the payment of which depends primarily on the cash flow from “eligible assets”; |
• | the securities sold are fixed income securities rated investment grade by at least one rating agency (fixed income securities which are unrated or rated below investment grade may be sold to institutional accredited investors and any securities may be sold to “qualified institutional buyers” and to persons involved in the organization or operation of the issuer); |
• | the issuer acquires and disposes of eligible assets (1) only in accordance with the agreements pursuant to which the securities are issued, (2) so that the acquisition or disposition does not result in a downgrading of the issuer’s fixed income securities and (3) the eligible assets are not acquired or disposed of for the primary purpose of recognizing gains or decreasing losses resulting from market value changes; and |
• | unless the issuer is issuing only commercial paper, the issuer appoints an independent trustee, takes reasonable steps to transfer to the trustee an ownership or perfected security interest in the eligible assets, and meets rating agency requirements for commingling of cash flows. |
In addition, in certain circumstances, compliance with Rule 3a-7 may also require, among other things, that the indenture governing the subsidiary include additional limitations on the types of assets the subsidiary may sell or acquire out of the proceeds of assets that mature, are refinanced or otherwise sold, on the period of time during which such transactions may occur, and on the level of transactions that may occur. In light of the requirements of Rule 3a-7, our ability to manage assets held in a special purpose subsidiary that complies with Rule 3a-7 will be limited and we may not be able to purchase or sell assets owned by that subsidiary when we would otherwise desire to do so, which could lead to losses.
In addition to the exceptions and exemptions discussed above, we, the Operating Partnership and/or our subsidiaries may rely upon other exceptions and exemptions, including the exemptions provided by Section 3(c)(6) of the Investment Company Act (which exempts, among other things, parent entities whose primary business is conducted through majority-owned subsidiaries relying upon the exemption provided by Section 3(c)(5)(C) discussed above) from the definition of an investment company and the registration requirements under the Investment Company Act.
There can be no assurance that the laws and regulations governing the Investment Company Act status of REITs, including actions by the Division of Investment Management of the SEC providing more specific or different guidance regarding these exemptions, will not change in a manner that adversely affects our operations. To the extent that the SEC staff provides more specific guidance regarding any of the matters bearing upon the exceptions discussed above or other exemptions from the definition of an investment company under the Investment Company Act upon which we may rely, we may be required to adjust our strategy accordingly.
If Hines Global or the Operating Partnership is required to register as an investment company under the Investment Company Act, the additional expenses and operational limitations associated with such registration may reduce our stockholders’ investment return or impair our ability to conduct our business as planned.
If we were required to register as an investment company, but failed to do so, we would be prohibited from engaging in our business, criminal and civil actions could be brought against us, some of our contracts might be unenforceable, unless a court were to direct enforcement, and a court could appoint a receiver to take control of us and liquidate our business.
If we internalize our management functions, we could incur adverse effects on our business and financial condition, including significant costs associated with becoming and being self-managed and the percentage of our outstanding common stock owned by our stockholders could be reduced.
If we seek to list our shares on an exchange as a way of providing our stockholders with a liquidity event, we may consider internalizing the functions performed for us by the Advisor. An internalization could take many forms, for example, we may hire our own group of executives and other employees or we may acquire the Advisor or its respective assets including its existing workforce. Any internalization could result in significant payments, including in the form of our stock, to the owners of the Advisor as compensation, which could reduce the percentage ownership of our then existing stockholders and concentrate ownership in Hines. In addition, there is no assurance that internalizing our management functions will be beneficial to us and our stockholders. For example, we may not realize the perceived benefits because of: (i) the costs of being self-managed; (ii) our inability to effectively integrate a new staff of managers and employees; or (iii) our inability to properly replicate the
21
services provided previously by the Advisor or its affiliates. Additionally, internalization transactions have also, in some cases, been the subject of litigation and even if these claims are without merit, we could be forced to spend significant amounts of money defending claims which would reduce the amount of funds available for us to invest in real estate investments or to pay distributions. In connection with any such internalization transaction, a special committee consisting of our independent directors will be appointed to evaluate the transaction and to determine whether a fairness opinion should be obtained.
Risks Related to Potential Conflicts of Interest
We may compete with other investment vehicles affiliated with Hines for tenants.
Hines and its affiliates are not prohibited from engaging, directly or indirectly, in any other business or from possessing interests in any other business venture or ventures, including businesses and ventures involved in the acquisition, development, ownership, management, leasing or sale of real estate projects. Hines or its affiliates own and/or manage properties in most, if not all, geographical areas in which we expect to acquire interests in real estate assets. Therefore, our properties compete for tenants with other properties owned and/or managed by Hines and its affiliates. Hines may face conflicts of interest when evaluating tenant opportunities for our properties and other properties owned and/or managed by Hines and its affiliates and these conflicts of interest may have a negative impact on our ability to attract and retain tenants.
Employees of the Advisor and Hines will face conflicts of interest relating to time management and allocation of resources.
We do not have employees. Pursuant to a contract with Hines, we rely on employees of Hines and its affiliates to manage and operate our business and they are contractually bound to devote the time and attention reasonably necessary to conduct our business in an appropriate manner. Our officers and the officers and employees of the Advisor, Hines and its affiliates hold similar positions in numerous entities and they may from time to time allocate more of their time to service the needs of such entities than they allocate to servicing our needs. Hines is not restricted from acquiring, developing, operating, managing, leasing or selling real estate through entities other than us and Hines will continue to be actively involved in real estate operations and activities other than our operations and activities. Hines currently controls and/or operates other entities that own properties in many of the markets in which we will seek to invest. Hines spends a material amount of time managing these properties and other assets unrelated to our business. We lack the ability to manage it without the time and attention of Hines’ employees.
Hines and its affiliates are general partners and sponsors of other investment vehicles having investment objectives and legal and financial obligations similar to ours. Because Hines and its affiliates have interests in other investment vehicles and also engage in other business activities, they may have conflicts of interest in allocating their time and resources among our business and these other activities. Our officers and directors, as well as those of the Advisor, own equity interests in entities affiliated with Hines from which we may buy properties. These individuals may make substantial profits in connection with such transactions, which could result in conflicts of interest. As a result of these interests, they could pursue transactions that may not be in our best interest.
Hines may face conflicts of interest if we sell properties to Hines.
We may in the future sell properties to Hines and affiliates of Hines. Hines, its affiliates and its employees (including our officers and directors) may make substantial profits in connection with such transactions. We must follow certain procedures when selling assets to Hines and its affiliates. Hines may owe fiduciary and/or other duties to the purchaser in these transactions and conflicts of interest between us and the purchaser could exist in such transactions. Because we are relying on Hines, these conflicts could result in transactions based on terms that are less favorable to us than we would receive from a third party.
Hines and its affiliates may face conflicts of interest caused by compensation arrangements with us, which could result in actions that are not in our stockholders’ best interest.
Hines, the Advisor and their affiliates receive substantial fees from us in return for their services and these fees could influence the Advisor’s advice to us. Among other matters, the compensation arrangements could affect their judgment with respect to:
• | Property dispositions in circumstances where Hines or an affiliate of Hines manages the property and earns significant fees for managing the property; and |
• | Various liquidity events and whether to pursue a liquidity event at all. |
22
Asset management fees paid to the Advisor and property management and leasing fees paid to Hines and its affiliates would be paid irrespective of the quality of the underlying real estate or property management services during the term of the related agreement. The Advisor is also entitled to a fee equal to a percentage of the total consideration paid in connection with a disposition. This fee may incentivize the Advisor to recommend the disposition of a property or properties through a sale, merger, or other transaction that may not be in our best interests at the time. In addition, the premature disposition of an asset may add concentration risk to the portfolio or may be at a price lower than if we held the property. Moreover, the Advisor has considerable discretion with respect to the terms and timing of disposition and leasing transactions. In evaluating investments and other management strategies, the opportunity to earn these fees may lead the Advisor to place undue emphasis on criteria relating to its and its affiliates’ compensation at the expense of other criteria, such as preservation of capital, in order to achieve higher short-term compensation. Considerations relating to compensation from us to the Advisor and its affiliates could result in decisions that are not in the best interests of our stockholders, which could hurt our ability to pay our stockholders distributions or result in a decline in the value of our stockholders’ investment.
Hines may face conflicts of interest in connection with the management of our day-to-day operations and in the enforcement of agreements between Hines and its affiliates.
Hines and the Advisor manage our day-to-day operations and properties pursuant to an advisory agreement. This agreement was not negotiated at arm’s-length and certain fees payable by us under such agreement are paid regardless of our performance.
Hines and its affiliates may encounter conflicts of interest with respect to position as to matters relating to this agreement. Areas of potential conflict include the computation of fees and reimbursements under such agreements, the enforcement, renewal and/or termination of the agreements and the priority of payments to third parties as opposed to amounts paid to affiliates of Hines. These fees may be higher than fees charged by third parties in an arm’s-length transaction as a result of these conflicts.
Certain of our officers and directors face conflicts of interest relating to the positions they hold with other entities.
All of our officers and non-independent directors are also officers and directors of the Advisor and/or other entities controlled by Hines, such as the advisor to Hines REIT, the advisor to Hines Global Income Trust and the advisor to HMS Income Fund, Inc. Some of these entities may compete with us for investment and leasing opportunities. These personnel owe fiduciary duties to these other entities and their security holders and these duties may from time to time conflict with the fiduciary duties such individuals owe to us and our stockholders. For example, conflicts of interest adversely affecting our investment decisions could arise in decisions or activities related to:
• | the allocation of new investments among us and other entities operated by Hines; |
• | the allocation of time and resources among us and other entities operated by Hines; |
• | the timing and terms of the investment in or sale of an asset; |
• | investments with Hines and affiliates of Hines; |
• | the compensation paid to the Advisor; and |
• | our relationship with Hines in the management of our properties. |
These conflicts of interest may also be impacted by the fact that such individuals may have compensation structures tied to the performance of such other entities controlled by Hines and these compensation structures may potentially provide for greater remuneration in the event an investment opportunity is presented to a Hines affiliate rather than us.
Our officers and directors have limited liability.
Generally, we are obligated under our articles to indemnify our officers and directors against certain liabilities incurred in connection with their services. We have entered into indemnification agreements with each of our officers and directors. Pursuant to these indemnification agreements, we have generally agreed to indemnify our officers and directors for any such liabilities that they incur. These indemnification agreements, as well as the indemnification provisions in our articles, could limit our ability and the ability of our stockholders to effectively take action against our officers and directors arising from their service to us. In addition, there could be a potential reduction in distributions resulting from our payment of premiums associated with insurance or payments of a defense, settlement or claim.
23
Our Umbrella Partnership Real Estate Investment Trust (“UPREIT”) structure may result in potential conflicts of interest.
Persons holding OP Units have the right to vote on certain amendments to the Agreement of Limited Partnership of the Operating Partnership, as well as on certain other matters. Persons holding such voting rights may exercise them in a manner that conflicts with the interests of our stockholders. As general partner of the Operating Partnership, we will be obligated to act in a manner that is in the best interest of all partners of the Operating Partnership. Circumstances may arise in the future when the interests of limited partners in the Operating Partnership may conflict with the interests of our stockholders.
Risks Related to Taxes
If we fail to qualify as a REIT, our operations and our ability to pay distributions to our stockholders would be adversely impacted.
We believe that we qualify as a REIT under the Code. A REIT generally is not taxed at the corporate level on income that it currently distributes to its stockholders. Qualification as a REIT involves the application of highly technical and complex rules for which there are only limited judicial or administrative interpretations. The determination of various factual matters and circumstances not entirely within our control may affect our ability to continue to qualify as a REIT. In addition, new legislation, regulations, administrative interpretations or court decisions could significantly change the tax laws with respect to qualification as a REIT or the federal income tax consequences of such qualification.
If we were to fail to qualify as a REIT in any taxable year:
• | we would not be allowed to deduct our distributions to our stockholders when computing our taxable income; |
• | we would be subject to federal income tax (including any applicable alternative minimum tax) on our taxable income at regular corporate rates; |
• | we would be disqualified from being taxed as a REIT for the four taxable years following the year during which qualification was lost, unless entitled to relief under certain statutory provisions; |
• | our cash available for distribution would be reduced and we would have less cash to distribute to our stockholders; and |
• | we might be required to borrow additional funds or sell some of our assets in order to pay corporate tax obligations that we may incur as a result of our disqualification. |
We may be required to defer repatriation of cash from foreign jurisdictions in order to qualify as a REIT.
Investments in foreign real property may give rise to foreign currency gains and losses. Certain foreign currency gains may be excluded from income for purposes of determining our satisfaction of one or both of the REIT gross revenue tests; however, under certain circumstances (for example, if we regularly trade in foreign securities) such gains will be treated as non-qualifying income. To reduce the risk of foreign currency gains adversely affecting our REIT qualification, we may be required to defer the repatriation of cash from foreign jurisdictions or to employ other structures that could affect the timing, character or amount of income we receive from our foreign investments. No assurance can be given that we will be able to manage our foreign currency gains in a manner that enables us to qualify as a REIT or to avoid U.S. federal income or other taxes on our income as a result of foreign currency gains.
If the Operating Partnership is classified as a “publicly traded partnership” under the Code, our operations and our ability to pay distributions to our stockholders could be adversely affected.
We believe that the Operating Partnership will be treated as a partnership, and not as an association or a publicly traded partnership for federal income tax purposes. In this regard, the Code generally classifies “publicly traded partnerships” (as defined in Section 7704 of the Code) as associations taxable as corporations (rather than as partnerships), unless substantially all of their taxable income consists of specified types of passive income. In order to minimize the risk that the Code would classify the Operating Partnership as a “publicly traded partnership” for tax purposes, we placed certain restrictions on the transfer and/or repurchase of partnership units in the Operating Partnership. However, if the Internal Revenue Service, or IRS, successfully determined that the Operating Partnership should be taxed as a corporation, the Operating Partnership would be required to pay U.S. federal income tax at corporate rates on its net income, its partners would be treated as stockholders of the Operating Partnership and distributions to partners would constitute non-deductible distributions in computing the Operating Partnership’s taxable income. In addition, we could fail to qualify as a REIT, and the imposition of a corporate tax on the Operating Partnership would reduce the amount of cash available for distribution to our stockholders.
24
Distributions to tax-exempt investors may be classified as unrelated business taxable income.
Neither ordinary nor capital gain distributions with respect to our common shares, or gain from the sale of common shares, should generally constitute unrelated business taxable income to a tax-exempt investor. However, there are certain exceptions to this rule. In particular:
• | part of the income and gain recognized by certain qualified employee pension trusts with respect to our common shares may be treated as unrelated business taxable income if our stock is predominately held by qualified employee pension trusts, we are required to rely on a special look through rule for purposes of meeting the REIT stock ownership tests, and we are not operated in such a manner as to otherwise avoid treatment of such income or gain as unrelated business taxable income; |
• | part of the income and gain recognized by a tax exempt investor with respect to our common shares would constitute unrelated business taxable income if such investor incurs debt in order to acquire the common shares; and |
• | part or all of the income or gain recognized with respect to our common shares by social clubs, voluntary employee benefit associations and supplemental unemployment benefit trusts and qualified group legal services plans which are exempt from federal income taxation under Sections 501(c)(7), (9) or (17), of the Code may be treated as unrelated business taxable income. |
Stockholders who participate in our distribution reinvestment plan may realize taxable income without receiving cash distributions.
If our stockholders participate in the distribution reinvestment plan, they will be required to take into account, in computing their taxable income, ordinary and capital gain distributions allocable to shares that they own, even though they receive no cash because such distributions are reinvested.
Foreign investors may be subject to the Foreign Investment in Real Property Tax Act (“FIRPTA”) on sale of common shares if we are unable to qualify as a “domestically controlled” REIT.
A foreign person disposing of a U.S. real property interest, including shares of a U.S. corporation whose assets consist principally of U.S. real property interests, is generally subject to tax under FIRPTA on the gain recognized on the disposition. FIRPTA does not apply, however, to the disposition of stock in a REIT if the REIT is “domestically controlled.” A REIT is “domestically controlled” if less than 50% of the REIT’s capital stock, by value, has been owned, directly and indirectly, by persons who are not U.S. persons during a continuous five-year period ending on the date of disposition or, if shorter, during the entire period of the REIT’s existence.
We cannot assure our stockholders that we will qualify as a “domestically controlled” REIT. If we were to fail to so qualify, gains realized by foreign investors other than “qualified foreign pension plans” on a sale of our common shares would be subject to tax under FIRPTA (unless our common shares were traded on an established securities market and the foreign investor did not at any time during a specified testing period directly or indirectly own more than 10% of the value of our outstanding common shares). Our common shares are not currently traded on an established securities market.
In certain circumstances, we may be subject to federal, state, local or foreign income or other taxes, which would reduce our cash available to pay distributions to our stockholders.
Even if we qualify and maintain our status as a REIT, we may be subject to certain federal, state, local or foreign income or other taxes. For example, if we have net income from a “prohibited transaction,” such income will be subject to a 100% tax. We may not be able to make sufficient distributions to avoid paying federal income tax and/or the 4% excise tax that applies to certain income retained by a REIT. We may also decide to retain income that we earn from the sale or other disposition of our properties and pay income tax directly on such income. In that event, our stockholders would be treated as if they earned that income and paid the tax on it directly. However, stockholders that are tax-exempt, such as charities or qualified pension plans, would have no benefit from their deemed payment of such tax liability. We may also be subject to state and local taxes on our income or property, either directly or at the level of the Operating Partnership or of other entities through which we indirectly own our assets. Any taxes that we pay will reduce our cash available for distribution to our stockholders.
25
We have entered, and may continue to enter into, certain hedging transactions which may have a potential impact on our REIT status.
We have entered into hedging transactions with respect to certain of our activities and may continue to enter into similar transactions in the future. Our hedging activities may include entering into interest rate and/or foreign currency swaps, caps and floors, options to purchase these items, and futures and forward contracts.
The gross income tests applicable to REITs generally exclude any income or gain from a hedging or similar transaction entered into by the REIT primarily to manage the risk of interest rate, price changes or currency fluctuations with respect to borrowings made or to be made to acquire or carry real estate assets or to manage the risk of currency fluctuations with respect to an item of income or gain that would be qualifying income under the 75% or 95% gross income test (or any property which generates such income or gain), provided that we properly identify such hedges and other transactions in the manner required by the Code and regulations. To the extent that we do not properly identify such transactions as hedges or we hedge with other types of financial instruments, or hedge asset values or other types of indebtedness, the income from those transactions is likely to be treated as non-qualifying income for purposes of the gross income tests and may affect our ability to qualify as a REIT. In addition, to the extent that our position in a hedging transaction has positive value, the instrument may be treated as a non-qualifying asset for purposes of the gross asset tests to which REITs are subject.
Entities through which we hold foreign real estate investments may be subject to foreign taxes, notwithstanding our status as a REIT.
Even if we maintain our status as a REIT, entities through which we hold investments in assets located outside the United States may be subject to income taxation by jurisdictions in which such assets are located. Our cash available for distribution to our stockholders will be reduced by any such foreign income taxes.
Dividends payable by REITs do not qualify for the reduced tax rates available for some dividends.
The maximum tax rate applicable to income from “qualified dividends” payable to U.S. stockholders that are individuals, trusts or estates is currently 20%. Dividends payable by REITs, however, generally are not eligible for the reduced rates. The more favorable rates applicable to regular corporate qualified dividends could cause investors who are individuals, trusts or estates to perceive investments in our common shares to be relatively less attractive than investments in the stocks of non-REIT corporations that pay dividends, which could adversely affect the value of our common shares.
Recharacterization of sale-leaseback transactions may cause us to lose our REIT status.
We may hold real property which is leased back to the person from whom we acquired it. We will use commercially reasonable efforts to structure any such sale-leaseback transaction such that the lease will be characterized as a “true lease,” thereby allowing us to be treated as the owner of the property for federal income tax purposes, but cannot assure our stockholders that the IRS will not challenge such characterization. In the event that any such sale-leaseback transaction is challenged and recharacterized as a financing transaction or loan for U.S. federal income tax purposes, deductions for depreciation relating to such property would be disallowed. We might fail to satisfy the REIT qualification “asset tests” or the “income tests” and, consequently, lose our REIT status effective with the year of recharacterization if a sale-leaseback transaction were so recharacterized. Alternatively, the amount of our REIT taxable income could be recalculated which might also cause us to fail to meet the distribution requirement for a taxable year.
Complying with the REIT requirements may cause us to forego otherwise attractive opportunities.
To qualify as a REIT for U.S. federal income tax purposes, we must continually satisfy tests concerning, among other things, the sources of our income, the nature and diversification of our assets, the amounts we distribute to our stockholders and the ownership of shares of our common stock. We may be required to forego otherwise attractive investments or make distributions to stockholders at disadvantageous times or when we do not have funds readily available for distribution. Thus, compliance with the REIT requirements may hinder our ability to operate solely on the basis of maximizing profits.
Complying with the REIT requirements may force us to liquidate otherwise attractive investments.
We must ensure that at the end of each calendar quarter, at least 75% of the value of our assets consists of cash, cash items, government securities and qualified REIT real estate assets in order to ensure our qualification as a REIT. The remainder of our investments (other than governmental securities and qualified real estate assets) generally cannot include more than 10% of the outstanding voting securities of any one issuer or more than 10% of the total value of the outstanding securities of any one
26
issuer. In addition, in general, no more than 5% of the value of our assets (other than government securities and qualified real estate assets) can consist of the securities of any one issuer, and no more than 20% (the limit was 25% prior to January 1, 2018) of the value of our total assets can be represented by securities of one or more taxable REIT subsidiaries. If we fail to comply with these requirements at the end of any calendar quarter, we must correct such failure within 30 days after the end of the calendar quarter in order to avoid losing our REIT status and suffering adverse tax consequences. As a result, we may be required to liquidate otherwise attractive investments.
Legislative or regulatory action could adversely affect us and/or our investors.
In recent years, numerous legislative, judicial and administrative changes have been made to the U.S. federal income tax laws applicable to the qualification and taxation of REITs and to investments in REITs and similar entities. Additional changes to tax laws may continue to occur in the future and may be given retroactive or prospective effect, and we cannot assure our stockholders that any such changes will not adversely affect how we are taxed or the taxation of our stockholders. Any such changes could have an adverse effect on us and on an investment in shares of our common stock. We urge our stockholders to consult with their own tax advisors with respect to the status of legislative, regulatory or administrative developments and proposals and their potential effect on an investment in shares of our common stock.
The Tax Cuts and Jobs Act, which made significant changes to the U.S. federal income tax rules for taxation of individuals and corporations, including REITs and their stockholders, was signed into law on December 22, 2017 and the precise application of all facets of the legislation is unclear. In addition, as a result of these changes, we may be limited in our ability to deduct interest expense, or be required to spread depreciation deductions over longer periods of time and we may be limited in our ability to utilize losses incurred in earlier years to offset income generated in subsequent years.
The Tax Cuts and Jobs Act made significant changes to the U.S. federal income tax rules for taxation of individuals and corporations, including REITs and their stockholders. In the case of individuals, the tax brackets were adjusted, the top federal income rate was reduced to 37%, special rules reduce taxation of certain income earned through pass-through entities and reduce the top effective rate applicable to ordinary dividends from REITs to 29.6% (through a 20% deduction for ordinary REIT dividends received that are not “capital gain dividends” or “qualified dividend income,” subject to complex limitations) and various deductions were eliminated or limited, including limiting the deduction for state and local taxes to $10,000 per year. Most of the changes applicable to individuals are temporary and apply only to taxable years beginning after December 31, 2017 and before January 1, 2026. The top corporate income tax rate was reduced to 21%. There are only minor changes to the tax rules applicable to REITs (other than the 20% deduction applicable to individuals for ordinary REIT dividends received). The Tax Cuts and Jobs Act makes numerous other large and small changes to the tax rules that do not affect REITs directly but may affect our stockholders and may indirectly affect us. For example, the Tax Cuts and Jobs Act amended the rules for accrual of income so that income is taken into account no later than when it is taken into account on applicable financial statements, even if financial statements take such income into account before it would accrue under the original issue discount rules, market discount rules or other rules in the Code. Such rule may cause us to recognize income before receiving any corresponding receipt of cash, which may make it more likely that we could be required to borrow funds or take other action to satisfy the REIT distribution requirements for the taxable year in which such income is recognized, although the precise application of this rule is unclear at this time.
In addition, per the Tax Cuts and Jobs Act, the amount of business interest expense that we may deduct may be limited to the sum of 30% of our adjusted taxable income for the tax year and our business interest income for the tax year. Business interest expense generally is interest paid or accrued with respect to indebtedness allocable to a trade or business. It does not include investment interest. Adjusted taxable income generally means taxable income from trade or business activities before any deductions for interest, net operating losses, or the new deduction for pass-through business income provided for in the Tax Cuts and Jobs Act. In taxable years beginning before January 1, 2022, adjusted taxable income is also computed before deducting depreciation and amortization expense. Interest expense that is disallowed may be carried forward indefinitely. Businesses with average annual gross receipts of $25 million or less (determined by taking into account businesses operated by certain affiliated entities) are exempt from this limitation. A real property trade or business may elect to not be subject to this limit. A real property trade or business is any real property development, redevelopment, construction, reconstruction, acquisition, conversion, rental, operation, management, leasing, or brokerage trade or business. An electing real property trade or business must use longer alternative depreciation system periods prospectively for all real estate, including real estate acquired prior to the election. We have not yet determined whether the new limitation will affect us or any of our subsidiaries, or whether we and our subsidiaries are eligible to make and will make this election. Once made, this election is irrevocable. Further, under the Tax Cuts and Jobs Act, for taxable years beginning after December 31, 2017, a company’s ability to deduct net operating losses is generally limited to 80% of taxable income (prior to the application of the dividends paid deduction), which may limit our ability or the ability of our subsidiaries to derive tax benefits in a later year from losses incurred and carried forward from a prior year. Additionally, the Tax Cuts and Jobs Act reduced individual taxpayers’ ability to deduct state
27
and local taxes, including property taxes further limited their ability to deduct mortgage interest expense, such that interest is only deductible with respect to up to a total of $750,000 of mortgages and the legislation does not permit deduction of interest on home equity loans (after grandfathering all existing mortgages). These changes may potentially (and negatively) affect the markets in which we may invest.
Stockholders are urged to consult with their tax advisors with respect to the Tax Cuts and Jobs Act and any other regulatory or administrative developments and proposals, including their potential impact on stockholders’ investment in our common shares.
Risks Related to ERISA
If our assets are deemed to be plan assets under the Employee Retirement Income Security Act of 1974, as amended, (“ERISA”), the Advisor and the fiduciaries of investing ERISA plans may be exposed to liabilities under Title I of ERISA and the Internal Revenue Code.
In some circumstances where an ERISA plan holds an interest in an entity, an undivided interest in the assets of the entity attributable to that interest are deemed to be ERISA plan assets unless an exception applies. This is known as the “look-through rule.” Under those circumstances, the obligations and other responsibilities of plan sponsors, plan fiduciaries and plan administrators, and of parties in interest and disqualified persons, under Title I of ERISA and Section 4975 of the Code, as applicable, may be applicable, and there may be liability under these and other provisions of ERISA and the Code. We believe that our assets should not be treated as plan assets because the shares should qualify as “publicly-offered securities” that are exempt from the look-through rule under applicable regulations of the U.S. Department of the Treasury. We note, however, that because certain limitations are imposed upon the transferability of shares so that we may qualify as a REIT, and perhaps for other reasons, it is possible that this exemption may not apply. If that is the case, and if the Advisor or we are exposed to liability under ERISA or the Code, our performance and results of operations could be adversely affected. In addition, if that were the case, an investment in our common shares might constitute an ineffective delegation of fiduciary responsibility to the Advisor, and expose the fiduciary of the benefit plan to co-fiduciary liability under ERISA for any breach by the Advisor of the fiduciary duties mandated under ERISA. Prior to making an investment in us, potential investors should consult with their legal and other advisors concerning the impact of ERISA and the Code on such investors’ investment and our performance.
There are special considerations that apply to pension or profit sharing trusts or individual retirement accounts (“IRAs”) investing in our common stock.
If stockholders have invested the assets of an IRA, pension, profit sharing, 401(k), Keogh or other qualified retirement plan, or plan to further invest through our distribution reinvestment plan, they should satisfy themselves that:
• | their investment is consistent with their fiduciary obligations under ERISA and the Code; |
• | their investment is made in accordance with the documents and instruments governing their plan or IRA, including their plan’s investment policy; |
• | their investment satisfies the prudence and diversification requirements of Sections 404(a)(1)(B) and 404(a)(1)(C) of ERISA; |
• | their investment will not impair the liquidity of the plan or IRA; |
• | their investment will not produce “unrelated business taxable income” for the plan or IRA; |
• | they will be able to value the assets of the plan annually in accordance with ERISA requirements; and |
• | their investment will not constitute a prohibited transaction under Section 406 of ERISA or Section 4975 of the Code. |
28
Investment Risks
There is no public market for our common shares; therefore, it will be difficult for our stockholders to sell their shares and, if they are able to sell their shares, they will likely sell them at a substantial discount. The most recently determined per share net asset value of our common shares is an amount that is less than the price some stockholders paid for their shares in our prior public offerings and may be further adjusted in the future.
There is no public market for our common shares, and we do not expect one to develop. Additionally, our charter contains restrictions on the ownership and transfer of our shares, and these restrictions may limit the ability of our stockholders to sell their shares. If they are able to sell their shares, they may only be able to sell them at a substantial discount from the price they paid. This may be the result, in part, of the fact that the amount of funds available for investment are reduced by funds used to pay certain up-front fees and expenses, including organization and offering costs, such as issuer costs, selling commissions, and the dealer manager fee and acquisition fees and expenses in connection with our public offerings. Unless our aggregate investments increase in value to compensate for these up-front fees and expenses, which may not occur, it is unlikely that our stockholders will be able to sell their shares, without incurring a substantial loss. Stockholders may also experience substantial losses if we dispose of our assets or in connection with a liquidation event. We cannot assure stockholders that their shares will ever appreciate in value to equal the price they paid for their shares. Thus, stockholders should consider our common shares as an illiquid and long-term investment, and they must be prepared to hold their shares for an indefinite length of time. On February 26, 2018, our board of directors established a per share NAV of our common stock of $9.04, when adjusted for the special distribution of $1.05 per share (which represented a return of capital) declared on December 30, 2017, is lower than the $10.28 and $10.40 per share primary offering prices in our second public offering. For a discussion of how the per share NAV was determined, see “Item 5. Market for Registrant’s Common Equity, Related Stockholder Matters and Issuer Purchases of Equity Securities—Market Information.”
The offering price of our shares under our distribution reinvestment plan may not accurately represent the current value of our assets at any particular time and the actual value of your investment may be substantially less than what you pay.
The offering price for shares of our common stock under our distribution reinvestment plan is equal to the per share NAV most recently determined by our board of directors, as described in “Item 5. Market for Registrant’s Common Equity, Related Stockholder Matters and Issuer Purchases of Equity Securities — Market Information.” The per share NAV was calculated as of a moment in time, and the value of our shares will fluctuate over time as a result of, among other things, developments related to individual assets and changes in the real estate and capital markets. Therefore, the actual value of your investment may be substantially less than what you pay for shares of our common stock under our distribution reinvestment plan. The offering price is not indicative of either the price at which our shares would trade if they were listed on an exchange or actively traded by brokers or of the proceeds that you would receive if we were liquidated or dissolved.
Because we are conducting an ongoing offering pursuant to our distribution reinvestment plan, we are providing information about our net tangible book value per share. As of December 31, 2017, our net tangible book value per share was $5.01, which is less than the offering price for shares of our common stock pursuant to our distribution plan. Net tangible book value is a rough approximation of value calculated simply as total book value of assets minus total liabilities (all of which are adjusted for noncontrolling interests). It assumes that the value of real estate assets diminishes predictably over time as shown through the depreciation and amortization of real estate investments. Real estate values have historically risen or fallen with market conditions. Net tangible book value is used generally as a conservative measure of net worth that we do not believe reflects our estimated value per share. It is not intended to reflect the value of our assets upon an orderly liquidation of the Company in accordance with our investment objectives. However, net tangible book value does reflect certain dilution in value of our common stock from the issue price as a result of (i) accumulated depreciation and amortization of real estate investments, (ii) the funding of distributions from sources other than our cash flow from operations, (iii) the substantial fees paid in connection with our two prior public offerings, such as selling commissions and marketing fees, all or a portion of which were re-allowed by our dealer manager to participating broker dealers and (iv) the fees and expenses paid to the Advisor and its affiliates in connection with the selection, acquisition, management and sale of our investments.
29
Our distributions have been paid using cash flows from financing activities, including proceeds from our public offerings and proceeds from debt financings and some or all of the distributions we pay in the future may be paid from debt financings or sources such as cash advances by the Advisor, cash resulting from a waiver or deferral of fees and/or proceeds from the sale of assets. We have not placed a cap on the amount of our distributions that may be paid from any of these sources. The use of sources other than our cash flow from operations to fund distributions could adversely impact our ability to pay distributions in future periods, decrease the amount of cash we have available for operations and new investments and/or potentially impact the value or result in dilution of our stockholders’ investment.
Our cash flows from operations have been and may continue to be insufficient to fund distributions to stockholders. Our organizational documents permit us to make distributions from any source when we do not have sufficient cash flow from operations to fund such distributions. We may choose to use advances, deferrals or waivers of fees, if available, from the Advisor or affiliates, borrowings, and/or proceeds from the sale of assets or other sources to fund distributions to our stockholders. We have not placed a cap on the amount of our distributions that may be paid from any of these sources. The Advisor agreed to waive the asset management fee otherwise payable to it pursuant to our Advisory Agreement for the years ended December 31, 2014 and 2015, to the extent that our MFFO for those years, as disclosed in our Annual Report on Form 10-K for those years, amounted to less than 100% of the aggregate distributions declared to our stockholders for such year. However, because MFFO exceeded distributions declared to our stockholders during those years, the Advisor did not waive any asset management fees for such periods.
Although the Advisor agreed to these waivers in prior years, the Advisor and affiliates are under no obligation to advance funds to us or to defer or waive fees in order to support our distributions. Our distributions have been funded from sources other than cash flows from operations. For example, for 2017, after application of our cash flows from operations, which accounted for 19% of the operating distributions, the remaining distributions were funded using proceeds from the sales of our real estate investments in the current and prior periods, and cash flows from financing activities. We have not placed a cap on the amount of our distributions that may be paid from sources other than cash flows from operations, including proceeds from the sales of our real estate investments, proceeds from our debt financings, proceeds from our public offerings, cash advances by the Advisor and cash resulting from a waiver or deferral of fees. When we pay distributions in excess of earnings and we use cash flows from financing activities, including offering proceeds and borrowings, to fund distributions, then we will have less funds available for operations and for acquiring properties and other investments, which could adversely impact our ability to pay distributions in future periods, our stockholders overall return may be reduced and it may result in the dilution of our stockholders’ investment. In addition, the Advisor or its affiliates could choose to receive shares of our common stock or interests in the Operating Partnership in lieu of cash or deferred fees or the repayment of advances to which they are entitled, and the issuance of such securities may dilute our stockholders’ interest in us. Furthermore, to the extent distributions exceed cash flows from operations, a stockholder’s basis in our stock will be reduced and, to the extent distributions exceed a stockholder’s basis, the stockholder may recognize capital gain.
We have reduced our distribution rate in the past and cannot guarantee that distributions will continue to be paid at the current rate or at all.
Commencing with distributions from January 2012 through December 2017, as a result of market conditions and our goal of increasing our distribution coverage, our board of directors authorized distributions in an amount equal to approximately $0.65 per share, per year. This amount, which we have continued to declare on a monthly basis from January 2018 through March 2018, was a decrease from the distribution amount of approximately $0.70 per share, per year, which had been declared by our board of directors since October of 2009.
Payments to the holder of the Special OP Units or holders of any other OP Units will reduce cash available for distribution to our stockholders.
An affiliate of Hines has received OP Units in return for its $190,000 contribution to the Operating Partnership. The Advisor or its affiliates may also choose to receive OP Units in lieu of certain fees. The holders of all OP Units will be entitled to receive cash from operations pro rata with the distributions being paid to us and such distributions to the holder of the OP Units will reduce the cash available for distribution to our stockholders. In addition, Hines Global REIT Associates Limited Partnership, the holder of the Special OP Units, will be entitled to cash distributions, under certain circumstances, including from sales of our real estate investments, refinancings and other sources, which may reduce cash available for distribution to our stockholders and may negatively affect the value of our shares of common stock. Furthermore, under certain circumstances the Special OP Units and any other OP Units held by Hines or its affiliates are required to be repurchased, in cash at the holder’s election and there may not be sufficient cash to make such a repurchase payment; therefore, we may need to use cash from operations, borrowings, or other sources to make the payment, which will reduce cash available for distribution to our stockholders.
30
Our stockholders’ ability to have their shares redeemed is limited under our share redemption program, and if they are able to have their shares redeemed, it may be at a price that is less than the price they paid for the shares and the then-current market value of the shares.
Our share redemption program contains significant restrictions and limitations. For example, only stockholders who purchase their shares directly from us or who received their shares through a non-cash transaction, not in the secondary market, are eligible to participate, and stockholders must generally hold their shares for a minimum of one year before they can participate in our share redemption program. In addition, our share redemption program generally provides that only funds received from the prior month’s distribution reinvestment plan may be used in the subsequent month to redeem shares. Further, our share redemption program limits the number of shares that may be redeemed in any consecutive twelve month period to no more than 5% of the number of shares outstanding at the beginning of that period, which we refer to as the “5% limitation.” Our board of directors may terminate, suspend or amend the share redemption program upon 30 days’ written notice without stockholder approval. The redemption price our stockholders may receive upon any such redemption may not be indicative of the price our stockholders would receive if our shares were actively traded or if we were liquidated, and our stockholders should not assume that they will be able to sell all or any portion of their shares back to us pursuant to our share redemption program or to third parties at a price that reflects the then current market value of the shares or at all.
For the months of January and February 2018, we received requests to redeem shares in excess of the 5% limitation. Based on the application of the 5% limitation, we redeemed, on a pro rata basis, approximately 68% and 29%, respectively, of the shares each stockholder requested to be redeemed for the months of January and February 2018, respectively.
The actual value of shares that we redeem under our share redemption program may be substantially less than what we pay.
Under our share redemption program, after shares have been held by a stockholder for at least one year, shares generally may be redeemed at a price equal to the per share NAV of our common stock most recently announced by us in a public filing with the SEC as of the applicable date of the redemption. The per share NAV may not accurately represent the current value of our assets per share of our common stock at any particular time and may be higher or lower than the actual value of our assets per share at such time. Accordingly, stockholders should not assume that they will be able to sell all or any portion of their shares back to us pursuant to our share redemption program at a price that reflects the then-current market value of the shares. In addition, as we consider strategic alternatives for a potential liquidity event, our stockholders should be aware of the possibility that the amount they may receive if their shares of our common stock are redeemed may be higher or lower than the amount they may receive if we execute a liquidity event. However, there is no set timetable for the execution of such an event and there is no assurance that any such event will occur. If, at the time of redemption, the actual value of the shares is less than the redemption price, then it would cause the redemption to be dilutive to our remaining stockholders. Alternatively, if the actual value of the shares that we redeem is equal to or more than the most recently announced per share NAV, then a redeeming stockholder will not benefit from any increase in the value of the underlying assets.
There is no separate counsel for us and our affiliates, which could result in conflicts of interest.
Greenberg Traurig, LLP acts as legal counsel to us and also represents the Advisor and some of its affiliates. There is a possibility in the future that the interests of the various parties may become adverse and, under the code of professional responsibility of the legal profession, Greenberg Traurig, LLP may be precluded from representing any one or all of such parties. If any situation arises in which our interests appear to be in conflict with those of the Advisor or its affiliates, additional counsel may be retained by one or more of the parties to assure that their interests are adequately protected, which may result in us incurring additional fees and expenses. Moreover, should a conflict of interest not be readily apparent, Greenberg Traurig, LLP may inadvertently act in derogation of the interest of the parties which could affect our ability to meet our investment objectives.
The fees we pay and the agreements entered into with Hines and its affiliates were not determined on an arm’s-length basis and therefore may not be on the same terms we could achieve from a third party.
The compensation paid to the Advisor, Hines and other affiliates for services they provide us was not determined on an arm’s-length basis. All service agreements, contracts or arrangements between or among Hines and its affiliates, including the Advisor and us, were not negotiated at arm’s-length. Such agreements include our Advisory Agreement, and property management and leasing agreements. A third party unaffiliated with Hines may be willing and able to provide certain services to us at a lower price.
31
We pay substantial compensation to Hines, the Advisor and their affiliates, which may be increased by our independent directors.
Subject to limitations in our articles, the fees, compensation, income, expense reimbursements, interests and other payments payable to Hines, the Advisor and their affiliates may increase if such increase is approved by a majority of our independent directors.
We do not, and do not expect to, have research analysts reviewing our performance.
We do not, and do not expect to, have research analysts reviewing our performance or our securities on an ongoing basis. Therefore, our stockholders will not have an independent review of our performance and the value of our common stock relative to publicly traded companies.
Item 1B. Unresolved Staff Comments
Not applicable.
Item 2. Properties
We make real estate investments directly and through entities wholly-owned by the Operating Partnership, or indirectly through other entities. As of December 31, 2017, we owned interests in 34 real estate investments which contain, in the aggregate, 14.1 million square feet of leasable space that was 92% leased.
32
The following table provides additional information regarding each of the properties we owned an interest in as of December 31, 2017:
Property (1) | Location | Investment Type | Date Acquired/ Net Purchase Price (in millions) (2) | Estimated Going-in Capitalization Rate (3) | Leasable Square Feet | Percent Leased | |||||||||
Domestic Office Investments | |||||||||||||||
250 Royall | Canton, Massachusetts | Office | 9/2011; $57.0 | 9.1% | 185,171 | 100 | % | ||||||||
Campus at Marlborough | Marlborough, Massachusetts | Office | 10/2011; $103.0 | 8.0% | 532,246 | 78 | % | ||||||||
9320 Excelsior | Hopkins, Minnesota | Office | 12/2011; $69.5 | 6.2% | 254,915 | 100 | % | ||||||||
550 Terry Francois | San Francisco, California | Office | 8/2012; $180.0 | 8.2% | 289,408 | 100 | % | ||||||||
Riverside Center | Boston, Massachusetts | Office | 3/2013; $197.1 | 5.7% | 509,702 | 88 | % | ||||||||
The Campus at Playa Vista | Los Angeles, California | Office | 5/2013; $216.6 | 5.7% | 324,955 | 99 | % | ||||||||
2300 Main | Irvine, California | Office | 8/2013; $39.5 | 6.4% | 132,064 | 100 | % | ||||||||
55 M Street | Washington, D.C. | Office | 12/2013; $140.9 | 4.8% | 267,915 | 95 | % | ||||||||
The Summit | Bellevue, Washington | Office | 3/2015; $316.5 | 5.6% | 524,130 | 98 | % | ||||||||
Total for Domestic Office Investments | 3,020,506 | 93 | % | ||||||||||||
Domestic Other Investments | |||||||||||||||
Minneapolis Retail Center | Minneapolis, Minnesota | Retail | 8/2012 & 12/2012; $130.6 | 6.5% | 401,397 | 98 | % | ||||||||
The Markets at Town Center | Jacksonville, Florida | Retail | 7/2013; $135.0 | 5.9% | 317,477 | 98 | % | ||||||||
The Avenue at Murfreesboro | Nashville, Tennessee | Retail | 8/2013; $163.0 | 6.4% | 766,934 | 89 | % | ||||||||
The Rim | San Antonio, Texas | Retail | 2/2014, 4/2015, 12/2015, & 12/2016: $285.9 | 5.9% | 1,055,375 | 93 | % | ||||||||
WaterWall Place | Houston, Texas | Residential/Living | 7/2014; $64.5 | 7.8% (4) | 316,299 | 91 | % | ||||||||
Total for Domestic Other Investments | 2,857,482 | 93 | % | ||||||||||||
International Office Investments | |||||||||||||||
Gogolevsky 11 | Moscow, Russia | Office | 8/2011; $96.1 | 8.9% | 94,240 | 94 | % | ||||||||
100 Brookes St. | Brisbane, Australia | Office | 7/2012; $67.6 | 10.5% | 105,636 | 100 | % | ||||||||
465 Victoria | Sydney, Australia | Office | 2/2013; $90.8 | 8.0% | 169,472 | 76 | % | ||||||||
One Westferry Circus (5) | London, England | Office | 2/2013; $124.6 | 7.4% | 221,019 | 100 | % | ||||||||
New City | Warsaw, Poland | Office | 3/2013; $163.5 | 7.1% | 484,182 | 83 | % | ||||||||
825 Ann | Brisbane, Australia | Office | 4/2013; $128.2 | 8.0% | 206,505 | 97 | % | ||||||||
Perspective Defense | Paris, France | Office | 6/2013; $165.8 | 8.5% | 289,663 | 47 | % | ||||||||
25 Cabot Square | London, England | Office | 3/2014; $371.7 | 6.7% | 455,712 | 59 | % | ||||||||
818 Bourke | Melbourne, Australia | Office | 10/2014; $135.6 | 7.1% | 259,007 | 95 | % | ||||||||
Total for International Office Properties | 2,285,436 | 79 | % | ||||||||||||
International Other Investments | |||||||||||||||
FM Logistic | Moscow, Russia | Industrial | 4/2011 $70.8 | 11.2% | 748,578 | 100 | % | ||||||||
Poland Logistics Portfolio | Poland (5) | Industrial | 3/2012 & 10/2012; $157.2 | 8.1% | 2,365,225 | 92 | % | ||||||||
Fiege Mega Centre | Erfurt, Germany | Industrial | 10/2013; $53.6 | 7.7% | 952,540 | 100 | % | ||||||||
Simon Hegele Logistics | Forchheim, Germany | Industrial | 6/2014 & 1/2015; $78.9 | 7.5% | 615,555 | 100 | % | ||||||||
Harder Logistics Portfolio | Germany (6) | Industrial | 4/2015 & 12/2015; $126.5 | 7.3% | 1,287,065 | 100 | % | ||||||||
Total for International Other Investments | 5,968,963 | 97 | % | ||||||||||||
Total for All Investments | 14,132,387 | 92 | % | (7) | |||||||||||
(1) | On December 31, 2017, the Company effectively owned a 99.99% interest in the properties listed, with the exception of WaterWall Place, through the ownership interest in the Operating Partnership as its sole general partner. Affiliates of Hines owned the remaining 0.01% interest in the Operating Partnership. We own a 93% interest in WaterWall Place through our investment in the WaterWall Place JV. |
(2) | For acquisitions denominated in a foreign currency, amounts have been translated at a rate based on the rate in effect on the acquisition date. |
33
(3) | The estimated going-in capitalization rate is determined as of the date of acquisition by dividing the projected property revenues in excess of expenses for the first fiscal year following the date of acquisition by the net purchase price (excluding closing costs and taxes). Property revenues in excess of expenses includes all projected operating revenues (rental income, tenant reimbursements, parking and any other property-related income) less all projected operating expenses (property operating and maintenance expenses, property taxes, insurance and property management fees). |
The projected property revenues in excess of expenses includes assumptions which may not be indicative of the actual future performance of the property, and the actual economic performance of each property for our period of ownership may differ materially from the amounts used in calculating the estimated going-in capitalization rate. These include assumptions, with respect to each property, that in-place tenants will continue to perform under their lease agreements during the 12 months following our acquisition of the property. In addition, with respect to the Poland Logistics Portfolio, the Minneapolis Retail Center, 465 Victoria, One Westferry Circus, Riverside Center, 825 Ann, the Campus at Playa Vista, the Markets at Town Center, the Avenue at Murfreesboro, 55 M Street, 818 Bourke, and The Summit, the projected property revenues in excess of expenses include assumptions concerning estimates of timing and rental rates related to re-leasing vacant space.
(4) | Construction has been completed for this residential/living development property. The estimated going-in capitalization rate is based on the projected revenues in excess of expenses once the property’s operations have stabilized divided by the construction cost of the property. The projected property revenues in excess of expenses includes assumptions which may not be indicative of the actual future performance of the property, and the actual economic performance of the property for our period of ownership may differ materially from the amounts used in calculating the estimated going-in capitalization rate. These include assumptions concerning estimates of timing and rental rates related to leasing vacant space and assumptions that in-place tenants |
will continue to perform under their lease agreements during the 12 months following stabilization of the property.
(5) | The Poland Logistics Portfolio is comprised of five industrial parks located in Warsaw, Wroclaw and Upper Silesia, Poland. |
(6) | The Harder Logistics Portfolio is comprised of three logistic buildings located in Nuremberg, Karlsdorf, and Duisburg, Germany. |
(7) | This amount represents the percentage leased assuming we own a 100% interest in each of these properties. The percentage leased based on our effective ownership interest in each property is 92%. |
34
Investment Type
Our portfolio is comprised of investments in a variety of real estate asset classes, including office, retail, industrial and residential/living properties. The following chart depicts the percentage of our portfolio’s investment types based on our pro rata share of the estimated value of each of our investments as of December 31, 2017. The estimated values of our real estate property investments were based on their appraised values as of December 31, 2017.
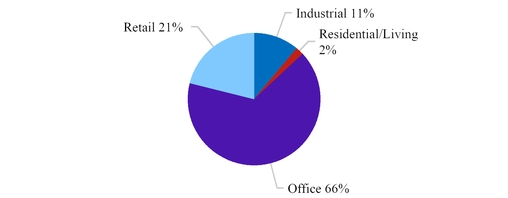
Lease Expirations
The following table lists our pro rata share of the scheduled lease expirations and related expiring base rents for each of the years ending December 31, 2018 through December 31, 2027 and thereafter for all of the properties in which we owned an interest as of December 31, 2017. The table also shows the approximate leasable square feet represented by the applicable lease expirations (1):
Leasable Area | ||||||||||||||||
Year | Number of Leases | Approximate Square Feet | Percent of Total Leasable Area | Annual Base Rental Income of Expiring Leases | Percent of Total Annual Base Rental Income | |||||||||||
Vacant | — | 1,075,138 | 7.8 | % | $ | — | — | % | ||||||||
2018 | 55 | 873,251 | 6.3 | % | $ | 23,109,002 | 8.5 | % | ||||||||
2019 | 40 | 1,391,269 | 10.2 | % | $ | 32,293,337 | 11.8 | % | ||||||||
2020 | 60 | 1,191,522 | 8.6 | % | $ | 33,305,289 | 12.3 | % | ||||||||
2021 | 37 | 990,668 | 7.2 | % | $ | 32,358,535 | 11.9 | % | ||||||||
2022 | 69 | 2,672,552 | 19.3 | % | $ | 48,830,215 | 18.0 | % | ||||||||
2023 | 41 | 1,159,131 | 8.4 | % | $ | 29,606,622 | 10.9 | % | ||||||||
2024 | 24 | 1,518,548 | 11.0 | % | $ | 14,244,072 | 5.2 | % | ||||||||
2025 | 35 | 495,825 | 3.6 | % | $ | 12,025,167 | 4.4 | % | ||||||||
2026 | 17 | 169,706 | 1.2 | % | $ | 5,390,982 | 2.0 | % | ||||||||
2027 | 24 | 1,355,772 | 9.8 | % | $ | 14,103,673 | 5.2 | % | ||||||||
Thereafter | 24 | 920,917 | 6.6 | % | $ | 26,679,984 | 9.8 | % | ||||||||
(1) | The table excludes amounts related to our residential/living project. |
35
Market Concentration
The map below depicts the location of our real estate investments. Approximately 59% of our portfolio is located throughout the United States and approximately 41% is located internationally (based on our pro rata share of the estimated value of each of the investments). The estimated values of our real estate property investments were based on their appraised values as of December 31, 2017.
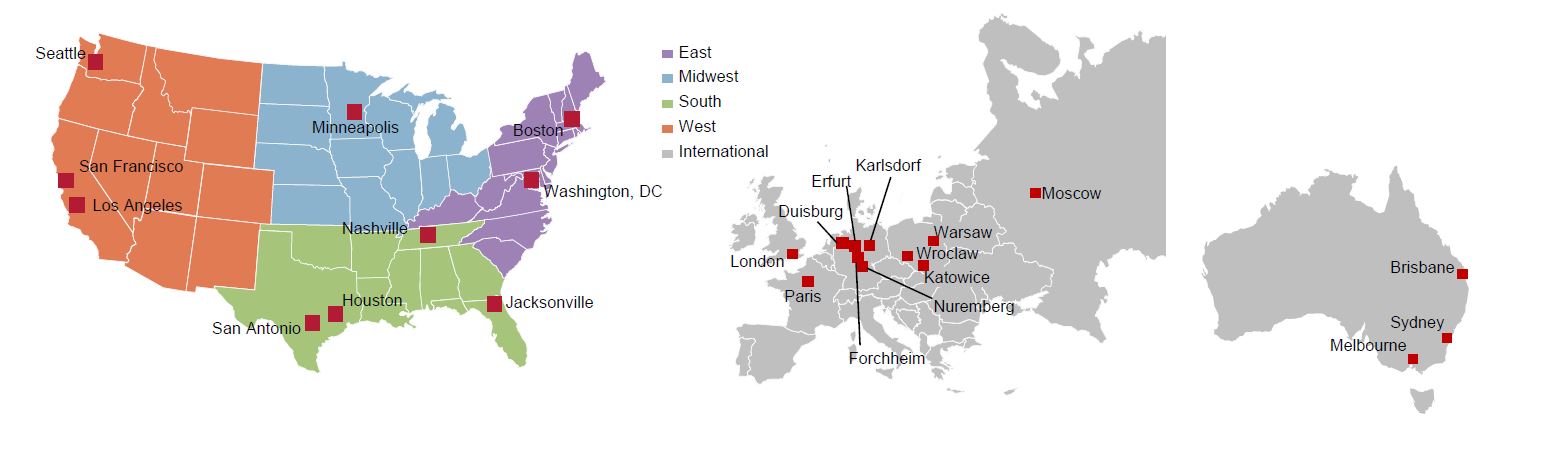
The following table provides a summary of the market concentration of our portfolio based on our pro rata share of the estimated value of each of the investments in which we owned interests as of December 31, 2017.
Market | Market Concentration (1) | ||
London, United Kingdom | 12% | ||
Seattle, Washington | 9% | ||
Boston, Massachusetts | 8% | ||
Los Angeles, California | 8% | ||
San Antonio, Texas | 7% | ||
Minneapolis, Minnesota | 7% | ||
San Francisco, California | 7% | ||
Nashville, Tennessee | 5% | ||
Warsaw, Poland | 5% | ||
Brisbane, Australia | 4% | ||
Paris, France | 4% | ||
(1) | Excluded from the table is approximately 24% of our portfolio, which is made up of markets which are individually less than 4% of our portfolio and includes: Houston, Texas; Sydney, Australia; Jacksonville, Florida; Washington, DC; Katowice, Poland; Erfurt, Germany; Duisburg, Germany; Karlsdorf, Germany; Wroclaw, Poland; Melbourne, Australia; Nuremberg, Germany; and Moscow, Russia. |
36
Industry Concentration
The following table provides a summary of the industry concentration of the tenants of the properties in which we owned interests based on our pro rata share of their leased square footage as of December 31, 2017:
Industry | Industry Concentration (1) (2) | |
Transportation and Warehousing | 38% | |
Retail | 22% | |
Finance and Insurance | 7% | |
Manufacturing | 5% | |
Information | 3% | |
Health Care | 4% | |
Utilities | 4% | |
Other Professional Services | 3% | |
(1) | Industry concentration does not include residential/living properties. |
(2) | Excluded from the table is approximately 14% of our portfolio, which is made up of industries which are individually less than 3% of our portfolio and includes: administrative and support services, agriculture, arts, educational services, entertainment and recreation, construction, hospitality, government, other services, real estate, wholesale trade, oil and gas, accounting, and legal services. |
Item 3. Legal Proceedings
From time to time in the ordinary course of business, the Company or its subsidiaries may become subject to legal proceedings, claims or disputes. As of March 30, 2018, neither the Company nor any of its subsidiaries was a party to any material pending legal proceedings.
Item 4. Mine Safety Disclosures
Not applicable.
37
PART II
Item 5. Market for Registrant’s Common Equity, Related Stockholder Matters and Issuer Purchases of Equity Securities
Market Information
As of December 31, 2017, we had 274.3 million common shares outstanding, held by a total of approximately 60,000 stockholders. The number of stockholders is based on the records of our registrar and transfer agent. There is no established public trading market for our common stock. Therefore, there is a risk that a stockholder may not be able to sell our stock at a time or price acceptable to the stockholder.
To assist the Financial Industry Regulatory Authority (“FINRA”) members and their associated persons that participate in our public offerings in their effort to comply with National Association of Securities Dealers (“NASD”) Rule 2340, we disclose in each annual report distributed to investors a per share estimated value of the shares, the method by which it was developed and the date of the data used to develop the estimated value. In addition, we plan to prepare annual statements of estimated share values to assist fiduciaries of retirement plans subject to the annual reporting requirements of ERISA in the preparation of their reports relating to an investment in our shares and such statements should not be used for any other purpose. On February 26, 2018, our board of directors determined a new per share net asset value, or NAV, of $9.04 as of December 31, 2017. This new per share NAV is slightly higher than the previously determined estimated per share NAV of $8.98 as of December 30, 2017. The estimated per share NAV of $8.98 as of December 30, 2017 represented a decrease from the per share NAV of $10.03 determined as of December 31, 2016, and the decrease was due solely to a special distribution of $1.05 per share declared to stockholders of record as of December 30, 2017. The new per share NAV was determined utilizing the guidelines established by the Investment Program Association Practice Guideline 2013-01 – “Valuation of Publicly Registered, Non-Listed REITs” issued on April 29, 2013 except that it includes the estimate of closing costs that we would expect to incur related to a potential future liquidity event, as described further below. Our deemed per share NAV is provided to assist plan fiduciaries in fulfilling their annual valuation and reporting responsibilities, and should not be used for any other purpose. We cannot assure you that this deemed estimated value, or the method used to establish such value, complies with the ERISA or IRS requirements. It is currently anticipated that a new per share NAV will next be determined in 2019.
Methodology
We engaged Cushman & Wakefield, Inc. (“Cushman”) a division of which is an independent third party real estate advisory and consulting firm, to provide, or cause its subsidiaries to provide, appraised values of our domestic real estate property investments as of December 31, 2017. These appraisals were performed in accordance with Uniform Standards of Professional Appraisal Practice. Cushman has extensive experience in conducting appraisals and valuations on real properties and each of our appraisals was prepared by personnel who are members of the Appraisal Institute and have the Member of Appraisal Institute (“MAI”) designation.
Additionally, we engaged Knight Frank, LLP (“Knight Frank”) an independent third party real estate advisory and consulting services firm, to provide appraised values of our international real estate investments as of December 31, 2017. These appraisals were performed in accordance with the professional standards as published by the Royal Institution of Chartered Surveyors, with the exception of our Australian real estate property investments, in which case the appraisals were performed in accordance with the Australian Property Institute and the International Valuation Standards.
We also engaged Jones Lang LaSalle Incorporated (“JLL”), an independent third party real estate advisory and consulting services firm, to perform valuations of our debt obligations as of December 31, 2017.
In establishing the per share NAV of $9.04, in addition to using the values of our real estate property investments and values of the our debt obligations, our board of directors also included in its determination the values of other assets and liabilities such as cash, tenant receivables, accounts payable and accrued expenses, distributions payable and other assets and liabilities, all of which were valued at cost and an estimate of closing costs that we would expect to incur in relation to a future potential liquidity event. No liquidity discounts or discounts relating to the fact that we are externally managed were applied to the per share NAV and no attempt was made to value Hines Global as an enterprise. Additionally, the per share NAV was reduced by the value of noncontrolling interests owned by Hines in WaterWall Place, a real estate investment that is not wholly-owned by the Company.
Additionally, we engaged Altus Group U.S. Inc., (“Altus”) to review the appraisals provided by Cushman and Knight Frank and to assess the reasonableness of our new per share NAV. The appraisal reviews were conducted under the supervisions of a member of the MAI. In assessing the reasonableness of our new per share NAV, Altus utilized the appraised
38
values provided by Cushman and Knight Frank, the valuations of our debt obligations provided by JLL and information provided by management regarding balances of cash, tenant and loan receivables, accounts payable and accrued expenses, distributions payable and other assets and liabilities and an estimate of closing costs that we would expect to incur in relation to a future potential liquidity event. Altus concluded that the new per share NAV determined by our board of directors was reasonable.
The independent firms that we engaged to assist us in connection with our determination of a new NAV per share, as described above, have provided, and are expected to continue to provide, real estate appraisal, valuation and financial advisory services to us and to Hines and its affiliates and have received, and are expected to continue to receive, fees in connection with such services. Certain of these firms and their respective affiliates may from time to time in the future perform other real estate appraisal, valuation and financial advisory services for us and for Hines and its affiliates, or in transactions related to the properties that are the subject of the valuations being performed for us, or otherwise, so long as such other services do not adversely affect the independence of the applicable firm as certified in the applicable report.
The aggregate value of our real estate property investments as of December 31, 2017 was $4.4 billion, including amounts attributable to noncontrolling interests, which represents a 6.0% net increase when compared to the previously determined value of our assets as of December 31, 2016 (including adjustments for properties disposed during 2017). This 6.0% net increase resulted from 1.9% appreciation in the aggregate values of our real estate property investments and 4.1% resulting from the weakening of the U.S. dollar against the Euro, British pound sterling, and Australian dollar.
The aggregate value of our real estate property investments also represented a 13.0% increase compared to their aggregate net purchase price. The table below sets forth the calculation of our per share NAV as of December 31, 2017 and our previous per share NAV as of December 31, 2016 and 2015:
December 31, 2017 | December 31, 2016 | December 31, 2015 | ||||||||||||||||||||||
Gross Amount (in millions) | Per Share | Gross Amount (in millions) | Per Share | Gross Amount (in millions) | Per Share | |||||||||||||||||||
Real estate property investments | $ | 4,445 | $ | 16.20 | $ | 5,095 | $ | 18.37 | $ | 5,468 | $ | 19.92 | ||||||||||||
Other assets | 441 | 1.61 | 213 | 0.77 | 251 | 0.91 | ||||||||||||||||||
Debt obligations and other liabilities | (1,962 | ) | (7.15 | ) | (2,330 | ) | (8.40 | ) | (2,678 | ) | (9.75 | ) | ||||||||||||
Special Distribution(1) | (288 | ) | (1.05 | ) | ||||||||||||||||||||
Noncontrolling interests | (11 | ) | (0.04 | ) | (89 | ) | (0.32 | ) | (124 | ) | (0.45 | ) | ||||||||||||
Net Asset Value before closing costs | $ | 2,625 | $ | 9.57 | $ | 2,889 | $ | 10.42 | $ | 2,917 | $ | 10.63 | ||||||||||||
Estimated closing costs | (146 | ) | (0.53 | ) | (107 | ) | (0.39 | ) | (107 | ) | (0.39 | ) | ||||||||||||
NAV | $ | 2,479 | $ | 9.04 | $ | 2,782 | $ | 10.03 | $ | 2,810 | $ | 10.24 | ||||||||||||
Shares outstanding | 274 | 277 | 274 | |||||||||||||||||||||
(1) | In December 2017, the Company declared a distribution of $1.05 per share (the “Special Distribution”) to all stockholders of record as of December 30, 2017, which was paid in January 2018. This distribution was designated by the Company as a special distribution, which represented a return of a portion of the stockholders’ invested capital from sales of investment property and, as such, reduced their remaining investment in the Company. The Special Distribution reduced the previous per share NAV determined as of December 31, 2016 from $10.03 to $8.98. |
The table below provides additional information regarding the change in the Company's per share NAV related to the Special Distribution declared in December 2017:
39
Per Share | ||||
NAV per share as of December 31, 2016 | $ | 10.03 | ||
Less: Special Distribution | $ | (1.05 | ) | |
Adjusted beginning estimated NAV per share | $ | 8.98 | ||
Net increase to NAV per share during 2017 | $ | 0.06 | ||
Ending NAV per share as of December 31, 2017 | $ | 9.04 | ||
Our board of directors determined the per share NAV by (i) utilizing the values of our real estate property investments of approximately $4.4 billion and adding our other assets comprised of our cash, tenant and other receivables and other assets of $441 million, (ii) subtracting the values of our debt obligations and other liabilities comprised of our accounts payable and accrued expenses, due to affiliates, distributions payable (including the Special Distribution) and other liabilities (including amounts related to noncontrolling interests) of $2.3 billion, (iii) subtracting an estimate of closing costs that we would expect to incur in relation to a potential future liquidity event of $146 million, and (iv) dividing the total by our common shares outstanding as of December 31, 2017 of 274 million, resulting in a per share NAV of $9.04.
Other than with respect to the values of our real estate property investments and values of our debt obligations, the values of the assets and liabilities described above were determined based on their cost as of December 31, 2017 and included certain pro forma adjustments primarily related to estimated closing costs that we would expect to incur in relation to a potential future liquidity event. As we consider strategic alternatives for a potential liquidity event, management and our board of directors thought it appropriate to include an estimate of the closing costs, including fees, that we would expect to incur related to a potential liquidity event. However, there can be no assurances of the time frame in which we would execute any potential liquidity event or that the closing costs related to a potential liquidity event would be incurred in the amount estimated by our company. No other adjustments were made related to the period from January 1, 2018 through February 26, 2018 because we did not believe they would have a material effect on our per share NAV. Additionally, the calculation of the per share NAV excluded certain items on our unaudited consolidated balance sheet that were determined to have no future value or economic impact on the valuation. Examples include receivables related to straight-line rental revenue and costs incurred to put debt in place. Other items were excluded because they were already considered elsewhere in the valuation. Examples include intangible lease assets and liabilities related to our real estate property investments and costs incurred for capital expenditures that were included in the appraised values of our real estate property investments and the fair values of interest rate swaps and caps, as they were included in the valuation of our debt.
The appraised values provided by Cushman and Knight Frank described above were determined primarily by using methodologies that are commonly used in the commercial real estate industry. For our domestic real estate property investments, these methodologies included discounted cash flow analyses and reviews of current, historical and projected capitalization rates for properties comparable to those owned by us and assume a 10-12 year holding period. Additionally, the residential/living development project appraisals included assumptions regarding projected stabilization. For our international real estate investments, these methodologies included cash flow analyses and going-in capitalization rates for properties comparable to those owned by us. The tables below summarize the key assumptions that were used in the valuations of our real estate property investments.
Range | Weighted Average | |||
Domestic Real Estate Property Investments | ||||
Office/Industrial/Mixed-use/Retail | ||||
Exit capitalization rate | 5.00% - 7.50% | 5.88% | ||
Discount rate/internal rate of return | 6.00% - 9.00% | 6.76% | ||
Residential/Living | ||||
Exit capitalization rate | 5.25% | 5.25% | ||
Discount rate/internal rate of return | 6.75% | 6.75% | ||
International Real Estate Property Investments | ||||
Office/Industrial/Mixed-use | ||||
Going-in capitalization rate | 2.09% - 22.92% | 5.26% | ||
As with any valuation methodology, the methodology used to determine the per share NAV was based upon a number of assumptions, estimates and judgments that may not be accurate or complete. Further, different parties using different property-specific and general real estate and capital market assumptions, estimates, judgments and standards could derive a per share
40
NAV that could be significantly different from the per share NAV determined by our board of directors. While our board of directors believes that the assumptions used in determining the appraised values of our real estate property investments are reasonable, a change in these assumptions would impact the calculation of such values. For example, assuming all other factors remained unchanged, an increase in the average discount rate of 25 basis points would yield a decrease in the appraised values of our domestic real estate property investments of 1.9%, while a decrease in the average discount rate of 25 basis points would yield an increase in the appraised values of our domestic real estate property investments of 2.1%. Likewise, an increase in the average exit capitalization rate of 25 basis points would yield a decrease in the appraised values of our domestic real estate property investments of 2.5%, while a decrease in the average exit capitalization rate of 25 basis points would yield an increase in the appraised values of our domestic real estate property investments of 2.9%. Additionally, an increase in the average going-in capitalization rate of 25 basis points would yield a decrease in the appraised values of our international real estate property investments of 5.7%, while a decrease in the average going-in capitalization rate of 25 basis points would yield an increase in the appraised values of our international real estate property investments of 4.7%.
The per share NAV determined by our board of directors does not represent the fair value of our assets less liabilities in accordance with U.S. generally accepted accounting principles, and such per share NAV is not a representation, warranty or guarantee that (i) a stockholder would be able to realize an amount equal to the per share NAV if such stockholder attempts to sell the his or her shares; (ii) a stockholder would ultimately realize distributions per share equal to the per share NAV upon our liquidation or sale; (iii) shares of our common stock would trade at the per share NAV on a national securities exchange; or (iv) a third party would offer the per share NAV in an arm’s-length transaction to purchase all or substantially all of our shares of common stock. In addition, we can make no claim as to whether the estimated value will or will not satisfy the applicable annual valuation requirements under ERISA and the Code with respect to employee benefit plans subject to ERISA and other retirement plans or accounts subject to Section 4975 of the Code that are investing in our shares.
Further, the per share NAV was calculated as of a moment in time, and, although the value of shares of our common stock will fluctuate over time as a result of, among other things, developments related to individual assets, purchases and sales of additional assets and the payment of fees and closing costs in connection therewith, changes in the real estate and capital markets, the distribution of sales proceeds to our stockholders (if any) and changes in corporate policies such as our distribution level relative to earnings, we do not undertake to update the per share NAV on a regular basis. As a result, stockholders should not rely on the per share NAV as an accurate measure of the then-current value of shares of our common stock in making a decision to buy or sell shares of our common stock, including whether to reinvest distributions by participating in our distribution reinvestment plan and whether to request redemption under our share redemption program.
Distributions
We have declared distributions of approximately $0.65 per share, per year for the years ended December 31, 2017, 2016 and 2015. We have also declared distributions for the months of January, February, and March 2018 in an amount equal to $0.0541667 per share, per month, which is equal to an annualized rate of $0.65 per share. Of this amount, $0.02 of the per share, per month distribution will be designated by the Company as a return of a portion of the stockholders’ invested capital and, as such, will reduce the stockholders’ remaining investment in the Company.
Additionally, we declared a special distribution to stockholders of $1.05 per share that was paid to all stockholders of record as of December 30, 2017 in January 2018. This special distribution represented a return of a portion of the stockholders’ invested capital from sales of investment property and, as such, reduced their remaining investment in the Company. The special distribution represented a portion of the net proceeds received from the strategic sale of six assets during 2017.
Our cash flows from operations have been and may continue to be insufficient to fund distributions to stockholders. We have funded 19% our operating distributions in 2017, 85% of our operating distributions in 2016, and 63% of our operating distributions in 2015 with cash flows from operations. We have funded the remaining distributions from proceeds from the sales of our real estate investments in the current and prior periods, and cash flows from financing activities.
41
The table below outlines our total distributions declared to stockholders and holders of noncontrolling interests for each of the quarters during the years ended December 31, 2017 and December 31, 2016, including the breakout between the distributions declared in cash and those reinvested pursuant to our distribution reinvestment plan (in thousands):
Stockholders | Noncontrolling Interests | |||||||||||||||||
Distributions for the three months ended | Cash Distributions | Distributions Reinvested | Total Declared | Total Declared | ||||||||||||||
2017 | ||||||||||||||||||
December 31, 2017 | $ | 310,078 | $ | 22,890 | $ | 332,968 | $ | 1,064 | ||||||||||
September 30, 2017 | 22,224 | 23,031 | 45,255 | 1,786 | ||||||||||||||
June 30, 2017 | 21,935 | 22,953 | 44,888 | 21,053 | (1 | ) | ||||||||||||
March 31, 2017 | 21,614 | 22,883 | 44,497 | 2,804 | ||||||||||||||
Total | $ | 375,851 | $ | 91,757 | $ | 467,608 | $ | 26,707 | ||||||||||
2016 | ||||||||||||||||||
December 31, 2016 | $ | 21,843 | $ | 23,539 | $ | 45,382 | $ | 752 | ||||||||||
September 30, 2016 | 21,617 | 23,611 | 45,228 | 2,671 | ||||||||||||||
June 30, 2016 | 21,232 | 23,402 | 44,634 | 1,281 | ||||||||||||||
March 31, 2016 | 21,128 | 23,451 | 44,579 | 987 | ||||||||||||||
Total | $ | 85,820 | $ | 94,003 | $ | 179,823 | $ | 5,691 | ||||||||||
(1) | For the three months ended June 30, 2017, distributions declared to the noncontrolling interests included a distribution totaling $21.0 million to the Company’s JV partner in the Aviva Coral Gables JV, as a result of the sale of Aviva Coral Gables. |
In general, distributions to stockholders are characterized for federal income tax purposes as ordinary income, capital gains, non-taxable return of capital or a combination of the three. Distributions that exceed our current and accumulated earnings and profits (calculated for tax purposes) constitute a return of capital for tax purposes rather than a distribution and reduce the stockholders’ basis in our common shares. To the extent that a distribution exceeds both current and accumulated earnings and profits and the stockholders’ basis in the common shares, it will generally be treated as a capital gain. We annually notify stockholders of the taxability of distributions paid during the preceding year.
For the years ended December 31, 2017 and 2016, respectively, approximately 76.2% and 62.1% of the distributions paid were taxable to the investor as capital gains and approximately 23.8% and 4.7% were treated as a return of capital for federal income tax purposes. The remaining amounts in each period were treated as ordinary income distributions. The primary driver of the increase in return of capital was the increase in the gain on sale of investments related to the six asset sales in 2017. The amount of distributions paid and taxable portion in each period are not indicative or predictive of amounts anticipated in future periods.
Recent Sales of Unregistered Securities
On September 5, 2017, 2,991.027 restricted common shares were granted to each of our independent directors, Messrs. Peter Shaper, Thomas L. Mitchell, John S. Moody and Jack L. Farley. Such restricted shares were granted pursuant to Restricted Share Award Agreements between us and each of our independent directors, as part of the independent directors’ annual compensation for service on our board of directors and without registration under the Securities Act of 1933, as amended (the “Securities Act”), in reliance upon the exemption from registration contained in Section 4(a)(2) of the Securities Act.
42
Share Redemption Program
We offer a share redemption program that may allow stockholders who have purchased their shares from us or received their shares through a non-cash transaction, not in the secondary market, and who have held their shares for a minimum of one year, to have their shares redeemed subject to certain limitations and restrictions. We allow redemptions of our shares on a monthly basis. No fees will be paid to Hines in connection with any redemption. Our board of directors may terminate, suspend or amend the share redemption program upon 30 days’ written notice without stockholder approval, which notice shall take the form of a current report on Form 8-K filed at least 30 days prior to the effective date of any such termination, suspension or amendment.
On December 1, 2017, the board of directors approved and adopted amendments to the Company’s share redemption program in order to modify the pricing under the share redemption program, such that the redemption price applicable to all redemption requests, including redemption requests made in connection with the death or disability of a stockholder, will be equal to the net asset value per share of the Company’s common stock most recently announced by the Company in a public filing with the SEC (the “Amended Share Redemption Program”). The Amended Share Redemption Program replaced the current share redemption program, effective as of December 31, 2017.
In the event a stockholder is having all his shares redeemed, we may waive the one-year holding requirement for shares purchased under our distribution reinvestment plan. In addition, we may waive the one-year holding requirement in the event of a stockholder’s bankruptcy. In the event of the death or disability of the holder, upon request, we will waive the one-year holding requirement. For purposes of the one-year holding period, limited partners of the Operating Partnership who exchange their OP Units for shares of our common stock (and any persons to whom they transfer such stock) shall be deemed to have owned those shares of our common stock as of the date the related OP Units were issued.
Unless our board of directors determines otherwise, the funds available for redemptions in each month will be limited to the funds received from the distribution reinvestment plan in the prior month. Our board of directors has complete discretion to determine whether all of such funds from the prior month’s distribution reinvestment plan can be applied to redemptions in the following month, whether such funds are needed for other purposes or whether additional funds from other sources may be used for redemptions. Our board of directors determined to waive this limitation on the share redemption program in order to fully honor all redemption requests received for the year ended December 31, 2017, which totaled $121.4 million, which was in excess of the $92.0 million received from the distribution reinvestment plan from December 2016 through November 2017.
To the extent our board of directors determines that we have sufficient available cash for redemptions as described above, we initially intend to redeem shares on a monthly basis; however, our board of directors may determine from time to time to adjust the timing of redemptions or suspend or terminate our share redemption program upon 30 days’ notice. Subject to the limitations and restrictions on the program and to funds being available, the number of shares repurchased during any consecutive twelve month period will be limited to no more than 5% of the number of outstanding shares of common stock at the beginning of that twelve month period. In the event the number of shares for which repurchase requests have been submitted exceeds the limits on the number of shares we can redeem or the funds available for such redemption in a particular month and our board of directors determines that we will repurchase shares in that month, then shares will be repurchased on a pro rata basis and the portion of any unfulfilled repurchase request will be held and considered for redemption until the next month unless withdrawn. In addition, if we do not have sufficient available funds at the time redemption is requested, a stockholder can withdraw his or her request for redemption or request in writing that we honor it at such time in a successive month, if any, when we have sufficient funds to do so. Such pending requests will generally be considered on a pro rata basis with any new redemption requests we receive in the applicable period. In January and February 2018, the number of shares requested for redemption exceeded the limits and were paid pro rata, as described in the note to the table below.
All requests for redemption must be made in writing and received by us at least five business days prior to the end of the month. If a stockholder would like to request redemption of his or her shares, the stockholder should contact us to receive required redemption forms and instructions concerning required signatures. Certain broker dealers require that their clients make redemption requests through their broker dealer, so stockholders should contact their broker dealers first if they want to request redemption of their shares. Stockholders also may withdraw their requests to have their shares redeemed. Withdrawal requests must also be made in writing and received by us at least five business days prior to the end of the month. We cannot guarantee that we will have sufficient funds from our distribution reinvestment plan, or at all, to accommodate all requests made in any month.
Commitments by us to repurchase shares will be communicated either telephonically or in writing to each stockholder who submitted a request on or promptly (no more than five business days) after the fifth business day following the end of each month. We will redeem the shares subject to these commitments, and pay the redemption price associated therewith, within
43
three business days following the delivery of such commitments. Stockholders will not relinquish their shares until we redeem them.
The shares we redeem under our share redemption program will be canceled and will have the status of authorized but unissued shares. We will not resell such shares to the public unless such sales are first registered with the SEC under the Securities Act and under appropriate state securities laws or are exempt under such laws. We will terminate our share redemption program in the event that our shares ever become listed on a national securities exchange or in the event a secondary market for our common shares develops.
Issuer Redemptions of Equity Securities
The following table lists shares we redeemed (in thousands) under our share redemption plan during the quarter ended December 31, 2017, including the average price paid per share.
Period | Total Number of Shares Redeemed | Average Price Paid Per Share | Total Number of Shares Purchased as Part of Publicly Announced Plans of Programs | Maximum Number of Shares that May Yet be Redeemed Under the Plans or Programs (1) | |||||||||
October 1, 2017 to October 31, 2017 | 1,597,134 | $ | 9.91 | 1,597,134 | — | ||||||||
November 1, 2017 to November 30, 2017 | 1,085,099 | $ | 9.96 | 1,085,099 | — | ||||||||
December 1, 2017 to December 31, 2017 | 1,214,834 | $ | 9.97 | 1,214,834 | — | ||||||||
Total | 3,897,067 | 3,897,067 | |||||||||||
(1) | See description of our share redemption program above for a description of the limitations on the number of shares that may be redeemed. |
44
Item 6. Selected Financial Data
The following selected consolidated financial data are qualified by reference to and should be read in conjunction with our Consolidated Financial Statements and Notes thereto and “Item 7. Management’s Discussion and Analysis of Financial Condition and Results of Operations” below (in thousands, except per share amounts).
Certain revisions have been made to the prior period balances to adjust the allocation of net income (loss) to noncontrolling interests and net income (loss) to common stockholders. Please refer to the Consolidated Financial Statements and Note 2 — Summary of Significant Accounting Policies for additional details.
2017 | 2016 | 2015 | 2014 | 2013 | ||||||||||||||||
Operating Data: | ||||||||||||||||||||
Revenues | $ | 403,649 | $ | 477,908 | $ | 476,873 | $ | 456,264 | $ | 322,862 | ||||||||||
Depreciation and amortization | $ | 138,503 | $ | 174,110 | $ | 186,965 | $ | 193,870 | $ | 140,187 | ||||||||||
Asset management and acquisition fees | $ | 37,949 | $ | 37,001 | $ | 44,522 | $ | 53,069 | $ | 60,490 | ||||||||||
General and administrative | $ | 9,250 | $ | 11,149 | $ | 8,597 | $ | 6,782 | $ | 5,344 | ||||||||||
Gain (loss) on sale of real estate investments | $ | 364,325 | $ | 127,294 | $ | 14,684 | $ | 64,003 | $ | — | ||||||||||
Income (loss) before benefit (provision) for income taxes | $ | 379,813 | $ | 164,553 | $ | (436 | ) | $ | 16,648 | $ | (85,062 | ) | ||||||||
Benefit (provision) for income taxes | $ | 8,705 | $ | (7,326 | ) | $ | (4,518 | ) | $ | (5,806 | ) | $ | (701 | ) | ||||||
Provision for income taxes related to sale of real estate | $ | (12,911 | ) | $ | — | $ | — | $ | — | $ | — | |||||||||
Net income (loss) | $ | 375,607 | $ | 157,227 | $ | (4,954 | ) | $ | 10,842 | $ | (85,763 | ) | ||||||||
Net (income) loss attributable to noncontrolling interests(1) | $ | (54,657 | ) | $ | (2,563 | ) | $ | (2,281 | ) | $ | (1,420 | ) | $ | (386 | ) | |||||
Net income (loss) attributable to common stockholders(1) | $ | 320,950 | $ | 154,664 | $ | (7,235 | ) | $ | 9,422 | $ | (86,149 | ) | ||||||||
Basic and diluted income (loss) per common share(1): | $ | 1.16 | $ | 0.56 | $ | (0.03 | ) | $ | 0.04 | $ | (0.47 | ) | ||||||||
Distributions declared per common share | $ | 1.70 | (2) | $ | 0.65 | $ | 0.65 | $ | 0.65 | $ | 0.65 | |||||||||
Weighted average common shares outstanding - basic and diluted | 276,374 | 275,914 | 272,773 | 263,323 | 184,412 | |||||||||||||||
Balance Sheet Data: | ||||||||||||||||||||
Total investment property | $ | 2,689,276 | $ | 3,049,643 | $ | 3,267,877 | $ | 2,964,699 | $ | 2,799,850 | ||||||||||
Cash and cash equivalents | $ | 401,326 | $ | 127,393 | $ | 136,627 | $ | 143,609 | $ | 124,859 | ||||||||||
Total assets | $ | 3,726,197 | $ | 3,988,432 | $ | 4,372,946 | $ | 4,115,173 | $ | 3,790,062 | ||||||||||
Long-term obligations (3) | $ | 1,834,953 | $ | 2,207,299 | $ | 2,545,656 | $ | 2,121,223 | $ | 1,969,634 | ||||||||||
(1) | The amounts previously reported have been adjusted to reflect the appropriate allocation of net income related to the Brindleyplace JV. See Note 2 — Summary of Significant Accounting Policies for additional information related to the nature of the incorrect allocation and the effect on the years ended 2016 and 2015. For the years ended 2014 and 2013, this adjustment changed net income (loss) attributable to common stockholders by $4.3 million and $2.8 million, changed net (income) loss attributable to noncontrolling interest by the same amounts, and changed basic and diluted income (loss) per common share by $0.02 and $0.01, respectively. |
(2) | Includes special distribution of $1.05 per share paid in January 2018. See Item 1. Business — Distribution Objectives for additional details. |
(3) | These amounts include notes payable, notes payable to affiliates and long-term derivative instruments. |
45
Item 7. Management’s Discussion and Analysis of Financial Condition and Results of Operations
You should read the following discussion and analysis together with our consolidated financial statements and notes thereto included in this Annual Report on Form 10-K. The following information contains forward-looking statements, which are subject to risks and uncertainties. Should one or more of these risks or uncertainties materialize, actual results may differ materially from those expressed or implied by the forward-looking statements. Please see “Special Note Regarding Forward-Looking Statements” above for a description of these risks and uncertainties.
Executive Summary
Hines Global REIT, Inc. (“Hines Global”) was incorporated under the Maryland General Corporation Laws on December 10, 2008, primarily for the purpose of investing in a diversified portfolio of quality commercial real estate properties and other real estate investments located throughout the United States and internationally. Hines Global raised the equity capital for its real estate investments through two public offerings from August 2009 through April 2014. Hines Global continues to offer up to $500.0 million of shares of its common stock under its distribution reinvestment plan, pursuant to an offering which commenced on April 24, 2014 (the “DRP Offering”). Collectively, through its public offerings, including the DRP Offering, the Company raised approximately $3.1 billion. Hines Global engaged Hines Securities, Inc. (the “Dealer Manager”), an affiliate of Hines, to serve as the dealer manager for its public offerings.
We have substantially completed our investment phase and have accomplished one of our primary investment objectives of investing in a real estate portfolio that is diversified by asset type, geographic area, lease expirations and tenant industries. As of December 31, 2017, we owned interests in 34 real estate investments which contain, in the aggregate, 14.1 million square feet of leasable space. Our portfolio includes the following investments:
• | Domestic office investments (9 investments) |
• | Domestic other investments (5 investments) |
• | International office investments (9 investments) |
• | International other investments (11 investments) |
As part of our ongoing portfolio management, we continually evaluate the merits of selling certain assets based on their current and projected market valuations, property-specific leasing and other operational dynamics, and other portfolio and market considerations. As a result, we strategically elected to sell two properties during 2016 (@1377 and Komo Plaza) and six properties during the year ended December 31, 2017 (the Brindleyplace Project, Aviva Coral Gables, Southpark, Mercedes Benz Bank, Hock Plaza, and Fifty South Sixth).
We commenced the process of evaluating various strategic alternatives to execute a liquidity event (i.e., a sale of our assets, our sale or merger, a listing of our shares on a national securities exchange, a tender offer for our shares, or another similar transaction). That process is ongoing, and we are continuing to evaluate strategic alternatives. There is no set timetable for the execution of such an event, and there is no assurance that any such event will occur.
Critical Accounting Policies
Our discussion and analysis of financial condition and results of operations is based on our consolidated financial statements, which have been prepared in accordance with GAAP. The preparation of the consolidated financial statements requires us to make estimates and judgments that affect the reported amounts of assets, liabilities and contingencies as of the date of the financial statements and the reported amounts of revenues and expenses during the reporting periods. We evaluate our assumptions and estimates on an ongoing basis. We base our estimates on historical experience and on various other assumptions that we believe to be reasonable under the circumstances. Additionally, application of our accounting policies involves exercising judgments regarding assumptions as to future uncertainties. Actual results may differ from these estimates under different assumptions or conditions. The following is a discussion of our critical accounting policies. For a discussion of all of our significant accounting policies, see Note 2 — Summary of Significant Accounting Policies, to the accompanying consolidated financial statements.
Accounting for Joint Ventures and Noncontrolling Interests
Our consolidated financial statements included in this annual report include the accounts of Hines Global, the Operating Partnership and its wholly-owned subsidiaries and joint ventures as well as the related amounts of noncontrolling interests. All intercompany balances and transactions have been eliminated in consolidation.
46
We evaluate the need to consolidate investments based on standards set forth by GAAP. Our joint ventures are evaluated based upon GAAP to determine whether or not the investment qualifies as a VIE. If the investment qualifies as a VIE, an analysis is then performed to determine if we are the primary beneficiary of the VIE by reviewing a combination of qualitative and quantitative measures including analyzing the expected investment portfolio using various assumptions to estimate the net income from the underlying assets. The projected cash flows are then analyzed to determine whether or not we are the primary beneficiary by analyzing if we have both the power to direct the entity’s significant economic activities and the obligation to absorb potentially significant losses or receive potentially significant benefits. In addition to this analysis, we also consider the rights and decision making abilities of each holder of variable interests. We will consolidate joint ventures that are determined to be variable interest entities for which we are the primary beneficiary. We will also consolidate joint ventures that are not determined to be variable interest entities, but for which we exercise significant control over major operating decisions, such as approval of budgets, selection of property managers, asset management, investment activity and changes in financing.
Any investments in partially owned real estate joint ventures and partnerships are reviewed for impairment periodically if events or circumstances change indicating that the carrying amount of its investments may exceed its fair value. In such an instance, we will record an impairment charge if we determine that a decline in the value of an investment below its fair value is other than temporary. Our analysis will be dependent on a number of factors, including the performance of each investment, current market conditions, and our intent and ability to hold the investment to full recovery. Based on our analysis of the facts and circumstances at each reporting period, no impairment was recorded related to investments in partially owned real estate joint ventures for the years ended December 31, 2017, 2016 and 2015. However, if market conditions deteriorate in the future and result in lower valuations or reduced cash flows of the Company’s investments, impairment charges may be recorded in future periods.
Investment Property and Lease Intangibles
When we have acquired properties, we allocated the purchase price of the acquisition based upon our assessment of the fair value of various components, including land, building and improvements, and intangible lease assets and liabilities. Fair value determinations were based on estimated cash flow projections that utilized discount and/or capitalization rates, as well as certain available market information. The fair value of land, building and improvements considered the value of the property as if it were vacant. The fair value of intangible lease assets was based on our evaluation of the specific characteristics of each lease. Factors considered included estimates of carrying costs during hypothetical expected lease-up periods, current market conditions and market rates, the customer’s credit quality and costs to execute similar leases. The fair value of out-of-market leases was calculated as the present value (using a discount rate that reflects the risks associated with the leases) of the difference between the contractual amounts to be paid pursuant to each in-place lease and our estimate of fair market lease rates for each corresponding in-place lease. In estimating carrying costs, we included estimates of lost rentals at market rates during the expected lease-up periods, depending on local market conditions. In estimating costs to execute similar leases, we considered customer improvements, leasing commissions, legal costs and other related expenses. Initial valuations were subject to change until such information was finalized, which occured no later than 12 months after the acquisition date.
Real estate assets are reviewed for impairment each reporting period if events or changes in circumstances indicate that the carrying amount of the individual property may not be recoverable. In such an event, a comparison will be made of the current and projected operating cash flows and expected proceeds from the eventual disposition of each property on an undiscounted basis to the carrying amount of such property. If the carrying amount exceeds the undiscounted cash flows, it would be written down to the estimated fair value to reflect impairment in the value of the asset. The determination of whether investment property is impaired requires a significant amount of judgment by management and is based on the best information available to management at the time of the evaluation. For the year ended December 31, 2017, we determined that one of our investment properties was impaired, as a result of deteriorating market conditions. As a result, an impairment loss of $7.1 million was recorded to write down its carrying value to its fair value for the year ended December 31, 2017. No impairment charges were recorded during the years ended December 31, 2016, and 2015.
Deferred Leasing Costs
We consider a number of different factors to evaluate whether we or the lessee is the owner of the tenant improvements for accounting purposes. These factors include: (i) whether the lease stipulates how and on what a tenant improvement allowance may be spent; (ii) whether the tenant or landlord retains legal title to the improvements; (iii) the uniqueness of the improvements; (iv) the expected economic life of the tenant improvements relative to the term of the lease; and (v) who constructs or directs the construction of the improvements. The determination of who owns the tenant improvements for accounting purposes is subject to significant judgment. In making that determination, we consider all of the above factors. No one factor, however, necessarily establishes any determination.
47
Revenue Recognition and Valuation of Receivables
We are required to recognize minimum rent revenues on a straight-line basis over the terms of tenant leases, including rent holidays and bargain renewal options, if any. Revenues associated with tenant reimbursements are recognized in the period in which the expenses are incurred based upon the tenant’s lease provision. Leases are not uniform in dealing with such cost reimbursements and there are many variations to the computation. We make quarterly accrual adjustments, positive or negative, to tenant reimbursement revenue to adjust the recorded amounts to our best estimate of the final amounts to be billed and collected with respect to the cost reimbursements. Revenues relating to lease termination fees are recognized on a straight-line basis amortized from the time that a tenant’s right to occupy the leased space is modified through the end of the revised lease term and are included in other revenue in the accompanying consolidated statements of operations. To the extent our leases provide for rental increases at specified intervals, we will record a receivable for rent not yet due under the lease terms. Accordingly, our management must determine, in its judgment, to what extent the unbilled rent receivable applicable to each specific tenant is collectible. We review unbilled rent receivables on a quarterly basis and take into consideration the tenant’s payment history, the financial condition of the tenant, business conditions in the industry in which the tenant operates and economic conditions in the area in which the property is located. In the event that the collectibility of unbilled rent with respect to any given tenant is in doubt, we would be required to record an increase in our allowance for doubtful accounts or record a direct write-off of the specific rent receivable, which would have an adverse effect on our net income for the year in which the reserve is increased or the direct write-off is recorded and would decrease our total assets and stockholders’ equity.
Recent Accounting Pronouncements
See Note 2 — Summary of Significant Accounting Policies to the accompanying consolidated financial statements for a discussion regarding recent accounting pronouncements and the potential impact, if any, on our financial statements.
Financial Condition, Liquidity and Capital Resources
Historically our most significant demands for funds were related to the purchase of real estate properties and other real estate-related investments. Specifically, we funded $5.1 billion of real estate investments using $3.1 billion of proceeds from our public offerings, including the DRP offerings, and debt proceeds. We invested all of the proceeds raised through our public offerings by the end of 2015. As a result, any real estate investments we made since that time were funded using proceeds from the dispositions of other real estate investments, debt proceeds, or our distribution reinvestment plan. Other significant demands for funds include the payment of operating expenses, distributions (excluding special distributions) and debt service. Generally, we expect to meet these operating cash needs using cash flows from operating activities. In December 2017, we declared a special distribution to stockholders of $1.05 per share that was paid to all stockholders of record as of December 30, 2017 in January 2018 using proceeds from the sales of our real estate investments. We received proceeds of $947.9 million from the sale of six properties during the year ended December 31, 2017
We have not generated sufficient cash flow from operations to fully fund distributions paid. Therefore some or all of our distributions may continue to be paid from other sources, such as proceeds from our debt financings, proceeds from our distribution reinvestment plan, proceeds from the sales of assets, cash advances by the Advisor, and cash resulting from a waiver or deferral of fees. We have not placed a cap on the amount of our distributions that may be paid from any of these other sources.
We believe that the proper use of leverage can enhance returns on real estate investments. As of December 31, 2017, our portfolio was 38% leveraged, based on the values of our real estate investments. At that time, we had $1.8 billion of principal outstanding under our various loan agreements with a weighted average interest rate of 2.8%, including the effects of related interest rate caps. Approximately $435.5 million of our loans are maturing during 2018. We may refinance these loans, or we may repay them using proceeds from the sale of our real estate investments, using our revolving credit facility with JPMorgan Chase Bank, N.A. (the “Revolving Credit Facility”), or other available cash if we are unable to refinance them at satisfactory terms.
The discussions below provide additional details regarding our operating, investing, and financing cash flows.
Cash Flows from Operating Activities
Our real estate properties generate cash flow in the form of rental revenues, which are used to pay direct leasing costs, property-level operating expenses and interest payments. Property-level operating expenses consist primarily of salaries and
48
wages of property management personnel, utilities, cleaning, insurance, security and building maintenance costs, property management and leasing fees, and property taxes. Additionally, we pay general and administrative expenses, acquisition fees and expenses and asset management fees, which also reduce our operating cash flows.
Net cash provided by operating activities for the year ended December 31, 2017 was $89.7 million compared to $156.8 million for the year ended December 31, 2016. The decrease in operating cash flows is primarily due to the sale of eight properties in 2016 and 2017, in addition to higher deferred lease costs paid during the year ended December 31, 2017.
Net cash provided by operating activities for the year ended December 31, 2016 was $156.8 million compared to $114.9 million as of December 31, 2015. Net cash provided by operating activities was reduced by the payment of acquisition fees and acquisition-related expenses totaling $1.1 million during the year ended December 31, 2016 and $22.0 million during the year ended December 31, 2015. Under GAAP for periods prior to January 1, 2018, acquisition fees and acquisition-related expenses were expensed and therefore reduced cash flows from operating activities. However, we funded these expenses with proceeds from our public offerings or other equity capital. Excluding the effect of these fees and expenses, operating cash flows increased by $20.9 million. The increase in operating cash flows is primarily due to cash flows from properties acquired in 2015 being included for the full year in 2016, in addition to lower deferred lease costs paid during the year ended December 31, 2016.
Cash Flows from Investing Activities
Net cash used in investing activities primarily relates to proceeds received from the sales of our real estate investments, capital expenditures at our properties, and activities related to our loans receivable. Additionally, prior to 2016, cash flows from investing activities included payments made for the acquisition of our real estate investments. Net cash from investing activities for the year ended December 31, 2017 increased $661.0 million compared to the same period in 2016 primarily as a result of property sales in 2017:
2017
• | We received proceeds of $947.9 million from the sale of six properties during the year ended December 31, 2017. |
• | We paid $43.1 million in capital expenditures at our operating properties, which includes re-development costs incurred at Minneapolis Retail Center and 25 Cabot Square. |
• | We made real estate loans of $2.3 million and received proceeds from the collection of real estate loans receivable of $7.2 million. |
• | We received proceeds of $10.3 million from the sale of real estate loans receivable. |
2016
• | We had cash outflows of $30.1 million related to our acquisition of the final phase of The Rim. |
• | We received proceeds of $266.3 million from the sale of Komo Plaza. |
• | We paid $19.9 million in capital expenditures at our operating properties. |
• | We made real estate loans of $6.2 million and received proceeds from the collection of real estate loans receivable of $47.0 million. |
• | We received distributions in excess of equity in earnings from our unconsolidated entity of $2.0 million, resulting from the sale of @1377. |
2015
• | We had cash outflows of $511.6 million related to our acquisition of four real estate investments as well as additional phases of The Rim and Simon Hegele Logistics properties. |
• | We received proceeds of $30.4 million from the sale of one of our properties. |
• | We paid $6.7 million in capital expenditures at our operating properties and paid $4.9 million in construction costs at our residential/living development projects in Houston, Texas and Miami, Florida. |
• | We made real estate loans of $13.2 million and received proceeds from the collection of real estate loans receivable of $33.6 million. |
49
Cash Flows from Financing Activities
Redemptions
As described previously, we ceased offering primary shares pursuant to our second public offering in April 2014. During the years ended December 31, 2017, 2016 and 2015, respectively, we redeemed $121.4 million, $63.8 million and $57.3 million in shares of our common stock through our share redemption program. During the year ended December 31, 2017, we also redeemed $52.6 million of Convertible Preferred Equity Certificates (“CPEC”) held by the non controlling interest owner in the Brindleyplace JV.
Distributions
With the authorization of our board of directors, We have declared distributions of approximately $0.65 per share, per year for the years ended December 31, 2017, 2016 and 2015, as well as a special distribution to stockholders of $288.0 million ($1.05 per share) to all stockholders of record as of December 30, 2017 that was paid in two cash payments in January 2018. This special distribution represents a return of a portion of our stockholders’ invested capital from sales of investment property and, as such, reduced their remaining investment in the Company. The special distribution represents a portion of the net proceeds received from the strategic sale of six assets during 2017. Excluding the special distribution, distributions paid to stockholders (including those reinvested in stock) during the years ended December 31, 2017, 2016 and 2015 were $179.8 million, $179.7 million and $177.1 million, respectively. Also, in 2017, we declared distributions to the non controlling interest holder in the Aviva Coral Gables JV of $21.0 million, due to the sale of the property.
With the authorization of our board of directors, we also have declared distributions for the months of January, February, and March 2018 in an amount equal to $0.0541667 per share, per month, which is equal to an annualized distribution rate of $0.65 per share. Of this amount, $0.02 of the per share, per month distribution will be designated by the Company as a return of a portion of the stockholders’ invested capital and, as such, will reduce the stockholders’ remaining investment in the Company. Distributions are paid monthly on the first business day following the completion of each month to which they relate. All distributions were or will be paid in cash or reinvested in shares of our common stock for those participating in our distribution reinvestment plan.
The table below contains additional information regarding distributions to our stockholders as well as the sources of distribution payments (all amounts are in thousands):
Stockholders | ||||||||||||||||||||
Distributions for the Year Ended | Cash Distributions | Distributions Reinvested | Total Declared | Distributions funded from Cash Flows From Operating Activities | ||||||||||||||||
December 31, 2017 | $ | 375,851 | (1) | $ | 91,757 | $ | 467,608 | $ | 89,729 | 19 | % | |||||||||
December 31, 2016 | $ | 85,820 | $ | 94,003 | $ | 179,823 | $ | 156,775 | 85 | % | ||||||||||
December 31, 2015 | $ | 83,481 | $ | 93,812 | $ | 177,293 | $ | 114,905 | 63 | % | ||||||||||
(1) | Includes $288.0 million related to the special distribution declared in December 2017, as described above. |
Our cash flows from operations have been and may continue to be insufficient to fund distributions to stockholders. We have funded the remaining distributions from proceeds from the sales of our real estate investments in the current and prior periods, and/or cash flows from financing activities. Also, during the year ended December 31, 2015, we paid $22.0 million in acquisition fees and expenses. Under GAAP for periods prior to January 1, 2018, acquisition fees and acquisition-related expenses were expensed and therefore reduced cash flows from operating activities. However, we funded these expenses with proceeds from our public offerings or other equity capital.
50
Debt Financings
We utilize permanent mortgage financing to leverage returns on our real estate investments and use borrowings under our Revolving Credit Facility to provide funding for near-term investment or working capital needs. As mentioned previously, our portfolio was 38% leveraged as of December 31, 2017 (based on the values of our real estate investments) with a weighted average interest value of 2.8%.
Below is additional information regarding our loan activities for the years ended December 31, 2017, 2016 and 2015. See Note 6 — Debt Financing for additional information regarding our outstanding debt:
2017
• | We borrowed approximately $159.0 million under our Revolving Credit Facility and made payments of $179.0 million. |
• | Upon the sales of the Brindleyplace Project, Aviva Coral Gables, Mercedes Benz Bank, and Fifty South Sixth, we made payments totaling $357.0 million to fully pay down the mortgage loans that had been secured by the applicable property. |
• | We made a payment of $5.4 million related to the 100 Brookes loan in May 2017. |
• | We made a payment of $72.0 million to fully pay down the secured mortgage loan related to 55 M Street in September 2017. |
• | We made payments of $8.1 million on our remaining outstanding mortgage loans. |
2016
• | We borrowed approximately $159.0 million under our Revolving Credit Facility and made payments of $367.0 million, which included a $253.0 million payment made using proceeds from the sale of Komo Plaza in December 2016. |
• | The Flagship JV made payments of $14.4 million on its revolving credit facility related to the repayment of certain of its loans receivable during the period. |
• | We made payments of $7.8 million related to our loan secured by New City, including a one-time payment of $5.8 million in July 2016. |
• | We made a payment of $18.0 million to pay off our loan secured by Southpark in December 2016. |
• | We also made payments totaling $5.3 million on our remaining outstanding mortgage loans. |
2015
• | We entered into $262.9 million of mortgage financing, related to the acquisition of four operating properties as well as an additional phase of the Simon Hegele Logistics Portfolio, with an aggregate net purchase price of $472.7 million. Additionally, our residential/living development projects borrowed $5.1 million to fund construction costs. |
• | The Flagship JV borrowed $0.7 million under its revolving credit facility related to the funding of its loans receivable during the period and made payments of $11.0 million on its revolving credit facility. |
• | We also borrowed approximately $1.2 billion under our Revolving Credit Facility and made payments of $891.7 million. |
• | We received proceeds of $65.0 million on loan modifications related to our loans secured by The Campus at Playa Vista and Fifty South Sixth. |
• | We made payments of $110.8 million to retire the outstanding principal balances of the secured mortgage loans of Hock Plaza and Gogolevsky 11. |
• | We made payments of $17.0 million related to our related party loan secured by Aviva Coral Gables. This loan had reached its maturity date and we did not seek additional financing. |
• | We also made payments totaling $7.1 million on our remaining outstanding mortgage loans. |
• | We made payments of $8.9 million for financing costs related to our loans and $2.5 million related to two $250 million interest rate cap corridor agreements as economic hedges against the variability of future interest rates on our Revolving Credit Facility. |
51
Results of Operations
Year ended December 31, 2017 compared to the year ended December 31, 2016
Same-store Analysis
The following table presents the property-level revenues in excess of expenses for the year ended December 31, 2017, as compared to the same period in 2016, by reportable segment. Same-store properties for the year ended December 31, 2017 include 34 properties owned as of January 1, 2016 that were 92% leased as of December 31, 2017 compared to 93% leased as of December 31, 2016. In total, property revenues in excess of expenses of the same-store properties decreased 10% for the year ended December 31, 2017 as compared to the year ended December 31, 2016. Below is additional information regarding our same-store results and significant variances from the prior year. All amounts are in thousands, except for percentages:
Years Ended December 31, | Change | ||||||||||||||
2017 | 2016 | $ | % | ||||||||||||
Property revenues in excess of expenses (1) | |||||||||||||||
Same-store properties | |||||||||||||||
Domestic office investments | $ | 89,676 | $ | 91,617 | $ | (1,941 | ) | (2 | )% | ||||||
Domestic other investments | 55,232 | 54,050 | 1,182 | 2 | % | ||||||||||
International office investments | 55,886 | 81,116 | (25,230 | ) | (31 | )% | |||||||||
International other investments | 29,778 | 29,121 | 657 | 2 | % | ||||||||||
Total same-store properties | $ | 230,572 | $ | 255,904 | $ | (25,332 | ) | (10 | )% | ||||||
Disposed properties (2) | 27,238 | 69,755 | (42,517 | ) | (61 | )% | |||||||||
Total property revenues in excess of expenses | $ | 257,810 | $ | 325,659 | $ | (67,849 | ) | (21 | )% | ||||||
Other | |||||||||||||||
Depreciation and amortization | $ | 138,503 | $ | 174,110 | $ | (35,607 | ) | (20 | )% | ||||||
Impairment losses | $ | 7,124 | $ | — | $ | 7,124 | — | % | |||||||
Gain (loss) on derivative instruments | $ | (634 | ) | $ | (689 | ) | $ | 55 | (8 | )% | |||||
Gain on sale of real estate investments | $ | 364,325 | $ | 127,294 | $ | 237,031 | 186 | % | |||||||
Interest expense | $ | 59,461 | $ | 64,473 | $ | (5,012 | ) | (8 | )% | ||||||
Income tax provision (benefit) | $ | (8,705 | ) | $ | 7,326 | $ | (16,031 | ) | (219 | )% | |||||
Provision for income taxes related to sale of real estate | $ | 12,911 | $ | — | $ | 12,911 | — | % | |||||||
(1) | Property revenues in excess of expenses include total revenues less property operating expenses, real property taxes and property management fees. |
(2) | Includes the property revenues in excess of expenses for the properties that were sold in 2016 and 2017. |
International office investments:
◦ | Revenues in excess of expenses of 25 Cabot Square decreased $17.3 million, primarily due to vacancies at the building and increases in property operating expenses caused by a large refurbishment and expansion project. 25 Cabot Square was 59% leased at December 31, 2017, compared to 100% leased at December 31, 2016. |
◦ | Revenues in excess of expenses of Perspective Défense decreased $9.5 million, primarily due to a decrease in the average occupancy during the year ended December 31, 2017 as compared to the year ended December 31, 2016, as well as a $2.2 million termination payment received during the year ended December 31, 2016. A tenant representing 53% of the net rentable area of Perspective Défense vacated as of September 2016. |
52
◦ | Revenues in excess of expenses at 465 Victoria increased $1.5 million, primarily due to a $2.2 million lease termination payment received during the year ended December 31, 2017. |
Other Changes
The decrease in depreciation and amortization in the table above is primarily due to the sales of several of our properties during 2016 and 2017 and lower amortization of our intangible lease assets.
For the year ended December 31, 2017, we determined that one of our investment properties was impaired, as a result of deteriorating market conditions. As a result, an impairment loss of $7.1 million was recorded to write down its carrying value to its fair value for the year ended December 31, 2017. No impairment charges were recorded for the year ended December 31, 2016.
The increase in the gain on sale of real estate investments in the table above is due to the gain recognized upon the sales of six properties during 2017. One property was sold during the year ended December 31, 2016. The gains on the sales of the Brindleyplace Project and Mercedes Benz Bank are recognized net of foreign exchange losses that had been recognized as other comprehensive income within stockholders’ equity, and reclassified into earnings upon the sales of the properties.
The decrease in the interest expense in the table above is primarily due to our lower debt principal balance offset by an increase in interest rates for the year ended December 31, 2017, compared to the year ended December 31, 2016.
The increase in our income tax benefit is primarily due to the restructuring of certain of our Polish subsidiaries resulting from recent changes in tax laws in Poland.
The increase in the provision for income taxes related to sale of real estate is due to capital gains taxes incurred upon the sale of Mercedes Benz Bank in July 2017.
Other Expenses
The tables below provide additional information related to our acquisition-related expenses, asset management and acquisition fees and general and administrative expenses for the years ended December 31, 2017 and 2016. All amounts in thousands, except percentages:
Years Ended December 31, | Change | ||||||||||||||
2017 | 2016 | $ | % | ||||||||||||
Acquisition fees | $ | — | $ | 191 | $ | (191 | ) | (100 | )% | ||||||
Asset management fees | $ | 37,949 | $ | 36,810 | $ | 1,139 | 3 | % | |||||||
Asset management and acquisition fees | $ | 37,949 | $ | 37,001 | $ | 948 | 3 | % | |||||||
Acquisition-related expenses | $ | 127 | $ | 372 | $ | (245 | ) | (66 | )% | ||||||
General and administrative expenses | $ | 9,250 | $ | 11,149 | $ | (1,899 | ) | (17 | )% | ||||||
Foreign currency gains (losses) | $ | 10,046 | $ | (8,240 | ) | $ | 18,286 | (222 | )% | ||||||
The changes identified in the table above are primarily due to the following:
• | Acquisition fees and acquisition-related expenses decreased because we did not complete any acquisitions in 2017. |
• | We pay monthly asset management fees to the Advisor based on an annual fee of 1.5% of the net equity capital invested in real estate, which may be affected by the timing of the property sales, amounts of equity invested in properties that are sold, capital expenditures and changes in the leverage of our properties. |
• | General and administrative expenses includes legal and accounting fees, printing and mailing costs, insurance costs, costs and expenses associated with our board of directors and other administrative expenses. The decrease is due to a reduction of certain costs associated with evaluating various strategic alternatives to execute a liquidity event. |
53
• | See below for a description of the changes related to foreign currency gains (losses). |
Foreign Currency Gains (Losses)
Our international real estate investments use functional currencies other than the U.S. dollar. The financial statements for these subsidiaries are translated into U.S. dollars for reporting purposes. Assets and liabilities are translated at the exchange rate in effect as of the balance sheet date while income statement accounts are translated using the average exchange rate for the period and significant nonrecurring transactions using the rate on the transaction date. Gains or losses resulting from translation are included in accumulated other comprehensive income (loss) within stockholders’ equity. By contrast, gains and losses related to transactions denominated in currencies other than an entity’s functional currency are recorded in foreign currency gains (losses) on the consolidated statement of operations. An exception is made where an intercompany loan or advance is deemed to be of a long-term investment nature, in which instance foreign currency transaction gains or losses are included in accumulated other comprehensive income (loss) within stockholders’ equity.
During the years ended December 31, 2017 and 2016, these gains/losses were primarily related to the effect of remeasuring our borrowings denominated in currencies other than our functional currencies and the changes to the related exchange rates between the date of the borrowing and the end of each period.
Year ended December 31, 2016 compared to the year ended December 31, 2015
Same-store Analysis
The following table presents the property-level revenues in excess of expenses for the year ended December 31, 2016, as compared to the same period in 2015, by reportable segment. Same-store properties for the year ended December 31, 2016 include 36 properties owned as of January 1, 2015 that were 93% leased as of December 31, 2016 compared to 96% leased as of December 31, 2015. In total, property revenues in excess of expenses of the same-store properties decreased 4% for the year ended December 31, 2016 as compared to the year ended December 31, 2015. Below is additional information regarding our same-store results and significant variances from the prior year. All amounts are in thousands, except for percentages:
Year Ended December 31, | Change | ||||||||||||||
2016 | 2015 | $ | % | ||||||||||||
Property revenues in excess of expenses (1) | |||||||||||||||
Same-store properties | |||||||||||||||
Domestic office investments | $ | 91,616 | $ | 88,349 | $ | 3,267 | 4 | % | |||||||
Domestic other investments | 59,946 | 59,933 | 13 | — | % | ||||||||||
International office investments | 85,951 | 97,524 | (11,573 | ) | (12 | )% | |||||||||
International other investments | 38,273 | 42,263 | (3,990 | ) | (9 | )% | |||||||||
Total same-store properties | $ | 275,786 | $ | 288,069 | $ | (12,283 | ) | (4 | )% | ||||||
Recent acquisitions | 35,464 | 21,546 | 13,918 | 65 | % | ||||||||||
Disposed properties (2) | 14,409 | 17,588 | (3,179 | ) | (18 | )% | |||||||||
Total property revenues in excess of expenses | $ | 325,659 | $ | 327,203 | $ | (1,544 | ) | — | % | ||||||
Other | |||||||||||||||
Depreciation and amortization | $ | 174,110 | $ | 186,965 | $ | (12,855 | ) | (7 | )% | ||||||
Gain (loss) on derivative instruments | $ | (689 | ) | $ | 562 | $ | (1,251 | ) | (223 | )% | |||||
Gain on sale of real estate investments | $ | 127,294 | $ | 14,684 | $ | 112,610 | 767 | % | |||||||
Interest expense | $ | 64,473 | $ | 71,288 | $ | (6,815 | ) | (10 | )% | ||||||
Income tax provision (benefit) | $ | 7,326 | $ | 4,518 | $ | 2,808 | 62 | % | |||||||
(1) | Property revenues in excess of expenses include total revenues less property operating expenses, real property taxes and property management fees. |
54
(2) | Includes the property revenues in excess of expenses for the properties that were sold in 2014, 2015, and 2016. |
• | Domestic office investments: |
◦ | Revenues in excess of expenses of 50 South Sixth increased $1.7 million primarily due to the payment of termination fees by a tenant at the building. |
◦ | Revenues in excess of expenses of 550 Terry Francois increased $1.5 million due to its single tenant renewing its lease at the end of 2015 at higher rental rates. |
• | Domestic other investments: |
◦ | Revenues in excess of expenses of The Rim increased $2.4 million resulting from additional phases acquired in December 2015 and December 2016. |
◦ | Revenues in excess of expenses of Flagship decreased $1.6 million due to the repayment of four loans during the year ended December 31, 2016. |
• | International office investments: |
◦ | Declines in foreign currency exchange rates against the U.S. dollar continue to cause declines in the operating results of our international properties. For example, the British Pound declined 11% against the U.S. dollar during the year ended December 31, 2016 compared with the same period in 2015. See “Item 7A. Quantitative and Qualitative Disclosures About Market Risk” for additional information regarding our exposure to foreign currency exchange rates. |
◦ | Revenues in excess of expenses of 818 Bourke decreased $4.1 million primarily due to vacancies at the building for the first six months of 2016, as well as a lease termination payment of $2.3 million received in 2015. 818 Bourke was 79% leased for the majority of the six months ended June 30, 2016. As of December 31, 2016, 818 Bourke was 96% leased. |
◦ | Revenues in excess of expenses of New City decreased $2.8 million primarily due to vacancies at the building for the year ended December 31, 2016. New City was 84% leased at December 31, 2016, compared to 93% leased at December 31, 2015. |
◦ | Revenues in excess of expenses of Perspective Défense increased due to the receipt of a $2.2 million termination payment from a tenant at the building. |
• | International other investments: |
◦ | Declining foreign currency exchange rates against the U.S. dollar continue to cause declines in the operating results of our international properties, as described previously. |
Other Changes
The decrease in the depreciation and amortization and interest expense in the table above is due to the declining foreign currency exchange rates described above.
The increase in the gain on sale of real estate investments in the table above is due to the higher gain on sale of Komo Plaza in 2016, as compared to the gain on sale of 17600 Gillette in 2015.
The increase in the income tax provision is due to acquisition costs related to the Harder Logistics portfolio being capitalized as a deferred tax asset in 2015. This caused a large income tax benefit in 2015 that is being amortized into income tax expense in 2016.
Other Expenses
The tables below provide details relating to our acquisition-related expenses, asset management and acquisition fees and general and administrative expenses for the years ended December 31, 2016 and 2015. All amounts in thousands, except percentages:
55
Years Ended December 31, | Change | ||||||||||||||
2016 | 2015 | $ | % | ||||||||||||
Acquisition fees | $ | 191 | $ | 8,797 | $ | (8,606 | ) | (98 | )% | ||||||
Asset management fees | $ | 36,810 | $ | 35,725 | $ | 1,085 | 3 | % | |||||||
Asset management and acquisition fees | $ | 37,001 | $ | 44,522 | $ | (7,521 | ) | (17 | )% | ||||||
Acquisition-related expenses | $ | 372 | $ | 10,472 | $ | (10,100 | ) | (96 | )% | ||||||
General and administrative expenses | $ | 11,149 | $ | 8,597 | $ | 2,552 | 30 | % | |||||||
The changes identified in the table above are primarily due to the following:
• | The decrease in acquisition fees identified above is a result of a decrease in our acquisition activity during 2015. For the year ended December 31, 2016, we acquired no new real estate investments, but we did acquire an additional phase of The Rim for a net purchase price of $38.1 million, compared to our acquisition of four real estate investments, as well as additional phases of The Rim and Simon Hegele Logistics, with an aggregate net purchase price of $544.2 million for the year ended December 31, 2015. |
• | We pay monthly asset management fees to the Advisor based on an annual fee of 1.5% of the net equity capital invested in real estate. Asset management fees were higher for the year ended December 31, 2016 compared to the same period in 2015, primarily due to an increase in assets under management. |
• | Acquisition-related expenses represent costs incurred on properties we have acquired and those which we may acquire in future periods. These costs vary significantly from one acquisition to another. |
• | General and administrative expenses includes legal and accounting fees, printing and mailing costs, insurance costs, costs and expenses associated with our board of directors and other administrative expenses. The increase in our general and administrative costs is primarily due to an increase in legal expenses, consulting expenses, and other miscellaneous expenses of $2.9 million incurred related to our consideration of strategic alternatives for a potential liquidity event. |
Foreign Currency Gains (Losses)
Our international real estate investments use functional currencies other than the U.S. dollar. The financial statements for these subsidiaries are translated into U.S. dollars for reporting purposes. Assets and liabilities are translated at the exchange rate in effect as of the balance sheet date while income statement accounts are translated using the average exchange rate for the period and significant nonrecurring transactions using the rate on the transaction date. Gains or losses resulting from translation are included in accumulated other comprehensive income (loss) within stockholders’ equity. By contrast, gains and losses related to transactions denominated in currencies other than an entity’s functional currency are recorded in foreign currency gains (losses) on the consolidated statement of operations. An exception is made where an intercompany loan or advance is deemed to be of a long-term investment nature, in which instance foreign currency transaction gains or losses are included in accumulated other comprehensive income (loss) within stockholders’ equity.
During the year ended December 31, 2016, the losses recognized in the consolidated statement of operations primarily related to third party loans denominated in a currency other than their functional currency. During the year ended December 31, 2015, the losses recognized in the consolidated statement of operations primarily related to repayment of our intercompany loans with our consolidated subsidiaries in Australia.
56
Funds from Operations and Modified Funds from Operations
Funds from Operations (“FFO”) is a non-GAAP financial performance measure defined by the National Association of Real Estate Investment Trusts (“NAREIT”) and is widely recognized by investors and analysts as one measure of operating performance of a real estate company. FFO excludes items such as real estate depreciation and amortization. Depreciation and amortization, as applied in accordance with GAAP, implicitly assumes that the value of real estate assets diminishes predictably over time and also assumes that such assets are adequately maintained and renovated as required in order to maintain their value. Since real estate values have historically risen or fallen with market conditions such as occupancy rates, rental rates, inflation, interest rates, the business cycle, unemployment and consumer spending, it is management’s view, and we believe the view of many industry investors and analysts, that the presentation of operating results for real estate companies using historical cost accounting alone is insufficient. In addition, FFO excludes gains and losses from the sale of real estate and impairment charges related to depreciable real estate assets and in-substance real estate equity investments, which we believe provides management and investors with a helpful additional measure of the historical performance of our real estate portfolio, as it allows for comparisons, year to year, that reflect the impact on operations from trends in items such as occupancy rates, rental rates, operating costs, general and administrative expenses and interest costs. A property will be evaluated for impairment if events or circumstances indicate that the carrying amount may not be recoverable (i.e. the carrying amount exceeds the total estimated undiscounted future cash flows from the property). Undiscounted future cash flows are based on anticipated operating performance, including estimated future net rental and lease revenues, net proceeds on the sale of the property, and certain other ancillary cash flows. While impairment charges are excluded from the calculation of FFO as described above, stockholders are cautioned that due to the limited term of our operations, it could be difficult to recover any impairment charges.
In addition to FFO, management uses modified funds from operations (“MFFO”), as defined by the Investment Program Association, (the “IPA”), as a non-GAAP supplemental financial performance measure to evaluate our operating performance. The IPA has recommended the use of MFFO as a supplemental measure for publicly registered, non-listed REITs to enhance the assessment of the operating performance of a non-listed REIT. MFFO is not equivalent to our net income or loss as determined under GAAP, and MFFO may not be useful as a measure of the long-term operating performance of our investments or as a comparative measure to other publicly registered, non-listed REITs if we do not continue to operate with a limited life and targeted exit strategy, as currently intended and described herein. MFFO includes funds generated by the operations of our real estate investments and funds used in our corporate-level operations. MFFO is based on FFO, but includes certain additional adjustments which we believe are appropriate. Such items include reversing the effects of straight-line rent revenue recognition, fair value adjustments to derivative instruments that do not qualify for hedge accounting treatment and certain other items as described below. Some of these adjustments are necessary to address changes in the accounting and reporting rules under GAAP such as the accounting for acquisition-related expenses from a capitalization/depreciation model to an expensed-as-incurred model that were put into effect in 2009 and other changes to GAAP rules for real estate subsequent to the establishment of NAREIT’s definition of FFO. These changes in the accounting and reporting rules under GAAP affected all industries, and as a result of these changes, acquisition fees and expenses typically have been accounted for as operating expenses under GAAP for periods through December 31, 2017. Management believes these fees and expenses do not affect our overall long-term operating performance. These changes also have prompted a significant increase in the magnitude of non-cash and non-operating items included in FFO, as defined. Such items include amortization of out-of-market lease intangible assets and liabilities and certain tenant incentives.
Other adjustments included in MFFO are necessary to address issues that are common to publicly registered, non-listed REITs. Publicly registered, non-listed REITs typically have a significant amount of acquisition activity and are substantially more dynamic during their initial years of investment and operations. While other start-up entities may also experience significant acquisition activity during their initial years, we believe that non-listed REITs like us are unique in that they have a limited life with targeted exit strategies within a relatively limited time frame after the acquisition activity ceases.
The purchase of properties, and the corresponding expenses associated with that process, including acquisition fees and expenses, is a key operational feature of our business plan to generate operational income and cash flows in order to make distributions to our stockholders. MFFO excludes acquisition fees payable to the Advisor and acquisition expenses. Under GAAP for periods prior to January 1, 2018, acquisition fees and expenses characterized as operating expenses in determining operating net income. These expenses were paid in cash by us, and therefore such funds will not be available to distribute to our stockholders. All paid and accrued acquisition fees and expenses with respect to the acquisition of a property negatively impact our operating performance during the period in which the property was acquired and will have negative effects on returns to our stockholders, the potential for future distributions, and future cash flows, unless earnings from operations or net sales proceeds from the disposition of other properties are generated to cover the purchase price of the property, the related acquisition fees and expenses and other costs related to such property. Therefore, MFFO may not be an accurate indicator of our operating performance, especially with respect to periods in which properties were being acquired. For periods prior to January 1, 2018,
57
since MFFO excludes acquisition fees and expenses, MFFO would only be comparable to the operations of non-listed REITs that have completed their acquisition activity and have other similar operating characteristics.
Management uses MFFO to evaluate the financial performance of our investment portfolio, including the impact of potential future investments. In addition, management uses MFFO to evaluate and establish our distribution policy and the sustainability thereof. Further, we believe MFFO is one of several measures that may be useful to investors in evaluating the potential performance of our portfolio following the conclusion of the acquisition phase, as it excludes acquisition fees and expenses that were expensed rather than capitalized for periods prior to January 1, 2018, as described herein.
MFFO has limitations as a performance measure in offerings where the price of a share of common stock is a stated value and there is no net asset value determination during the offering stage and for a period thereafter. MFFO is useful in assisting management and investors in assessing the sustainability (that is, the capacity to continue to be maintained) of operating performance in future operating periods, and in particular, after the offering and acquisition stages are complete and net asset value is disclosed. MFFO is not a useful measure in evaluating net asset value because impairments are taken into account in determining net asset value but not in determining MFFO.
FFO and MFFO should not be construed to be more relevant or accurate than the current GAAP methodology in calculating net income or in its applicability in evaluating our operating performance. In addition, FFO and MFFO should not be considered as alternatives to net income (loss) or income (loss) from continuing operations as an indication of our performance or as alternatives to cash flows from operating activities as an indication of our liquidity, but rather should be reviewed in conjunction with these and other GAAP measurements. Further, FFO and MFFO are not intended to be used as liquidity measures indicative of cash flow available to fund our cash needs, including our ability to make distributions to our stockholders. Please see the limitations listed below associated with the use of MFFO:
• | As we have recently completed the acquisition phase of our life cycle, acquisition costs and other adjustments that are increases to MFFO are, and may continue to be, a significant use of cash and dilutive to the value of an investment in our shares. |
• | MFFO excludes acquisition fees payable to the Advisor and acquisition expenses. Although these amounts reduce net income, under GAAP for periods prior to January 1, 2018, we generally have funded such costs with proceeds from our public offerings and acquisition-related indebtedness (and, solely with respect to acquisition-related costs incurred in connection with our acquisition of the Brindleyplace Project in July 2010, equity capital contributions from our joint venture partner) and do not consider these fees and expenses in the evaluation of our operating performance and determining MFFO. |
• | We use interest rate swap contracts and interest rate caps as economic hedges against the variability of interest rates on variable rate loans. Although we expect to hold these instruments to maturity, if we were to settle these instruments currently, it would have an impact on our operating performance. Additionally, these derivative instruments are measured at fair value on a quarterly basis in accordance with GAAP. MFFO excludes gains (losses) related to changes in these estimated values of our derivative instruments because such adjustments may not be reflective of ongoing operations and may reflect unrealized impacts on our operating performance. |
• | We use foreign currency forward contracts as economic hedges against the variability of foreign exchange rates on certain international investments. These derivative instruments are typically short-term and are frequently settled at amounts that result in additional amounts paid or received. However, such gains (losses) are excluded from MFFO since they are not considered to be operational in nature. Additionally, these derivative instruments are measured at fair value on a quarterly basis in accordance with GAAP. MFFO excludes gains (losses) related to changes in these estimated values of our derivative instruments because such adjustments may not be reflective of ongoing operations or may reflect unrealized impacts on our operating performance. |
• | We utilize the definition of FFO as set forth by NAREIT and the definition of MFFO as set forth by the IPA. Our FFO and MFFO as presented may not be comparable to amounts calculated by other REITs, if they use different approaches. |
• | Our business is subject to volatility in the real estate markets and general economic conditions, and adverse changes in those conditions could have a material adverse impact on our business, results of operations and MFFO. Accordingly, the predictive nature of MFFO is uncertain and past performance may not be indicative of future results. |
Neither the SEC, NAREIT nor any regulatory body has passed judgment on the acceptability of the adjustments that we use to calculate FFO or MFFO. In the future, the SEC, NAREIT or a regulatory body may decide to standardize the allowable
58
adjustments across the non-listed REIT industry and we would have to adjust our calculation and characterization of FFO or MFFO.
The following section presents our calculation of FFO and MFFO and provides additional information related to our operations (in thousands, except per share amounts) for the years ended December 31, 2017, 2016 and 2015. As we have recently completed the investment phase of our operations, FFO and MFFO are not useful in comparing operations for the three periods presented below.
Period from Inception (December 10, 2008) through December 31, 2017 | ||||||||||||||||
Years Ended December 31, | ||||||||||||||||
2017 | 2016 | 2015 | ||||||||||||||
Net income (loss) | $ | 328,832 | $ | 375,607 | $ | 157,227 | $ | (4,954 | ) | |||||||
Depreciation and amortization (1) | 987,585 | 138,503 | 174,110 | 186,965 | ||||||||||||
Loss (gain) on sale of investment property (2) | (570,335 | ) | (364,325 | ) | (127,296 | ) | (14,684 | ) | ||||||||
Impairment Losses(3) | 7,124 | 7,124 | — | — | ||||||||||||
Provision for income taxes related to sale of real estate | 12,911 | 12,911 | — | — | ||||||||||||
Gain on sale from unconsolidated subsidiary | (7,196 | ) | — | (7,196 | ) | — | ||||||||||
Adjustments for noncontrolling interests (4) | (31,626 | ) | (2,480 | ) | (6,191 | ) | (7,020 | ) | ||||||||
Funds from operations | 727,295 | 167,340 | 190,654 | 160,307 | ||||||||||||
Loss (gain) on derivative instruments (5) | (4,145 | ) | 634 | 689 | (562 | ) | ||||||||||
Loss (gain) on foreign currency (6) | 34,413 | (8,280 | ) | 5,134 | 20,212 | |||||||||||
Other components of revenues and expenses (7) | (31,403 | ) | 20,259 | (11,156 | ) | (16,725 | ) | |||||||||
Acquisition fees and expenses (8) | 223,148 | 127 | 562 | 19,259 | ||||||||||||
Adjustments for noncontrolling interests (4) | 5,217 | (759 | ) | 2,706 | 3,247 | |||||||||||
Modified Funds From Operations attributable to common stockholders | $ | 954,525 | $ | 179,321 | $ | 188,589 | $ | 185,738 | ||||||||
Basic and diluted income (loss) per common share (9) | $ | 1.72 | $ | 1.16 | $ | 0.56 | $ | (0.03 | ) | |||||||
Funds From Operations attributable to common stockholders per common share | $ | 4.42 | $ | 0.61 | $ | 0.69 | $ | 0.59 | ||||||||
Modified Funds From Operations attributable to common stockholders per common share | $ | 5.81 | $ | 0.65 | $ | 0.68 | $ | 0.68 | ||||||||
Weighted average shares outstanding | 164,368 | 276,374 | 275,914 | 272,773 | ||||||||||||
Notes to the table:
(1) | Represents the depreciation and amortization of various real estate assets. Historical cost accounting for real estate assets in accordance with GAAP implicitly assumes that the value of real estate assets diminishes predictably over time. Since real estate values have historically risen or fallen with market conditions, we believe that such depreciation and amortization may be of limited relevance in evaluating current operating performance and, as such, these items are excluded from our determination of FFO. |
(2) | Represents the gain on disposition of certain real estate investments. Although this gain is included in the calculation of net income (loss), we have excluded it from FFO because we believe doing so appropriately presents the operating performance of our real estate investments on a comparative basis. |
(3) | Represents impairment charges recorded for 2017 in accordance with GAAP. Although such impairment charges on operating real estate investments and our investments in unconsolidated entities are included in the calculation of net income (loss), we have excluded them from FFO because we believe doing so more appropriately presents the operating performance of our real estate investments and our investments in unconsolidated entities on a comparative basis. See “Critical Accounting Policies — Investment Property and Lease Intangibles” for additional information regarding our impairment charges. |
59
(4) | Includes income attributable to noncontrolling interests and all adjustments to eliminate the noncontrolling interests’ share of the adjustments to convert our net loss to FFO and MFFO. |
(5) | Represents components of net income (loss) related to the estimated changes in the values of our interest rate contract derivatives and foreign currency forwards. We have excluded these changes in value from our evaluation of our operating performance and MFFO because such adjustments may not be reflective of our ongoing performance and may reflect unrealized impacts on our operating performance. |
(6) | Represents components of net income (loss) primarily resulting from the remeasurement of loans denominated in currencies other than our functional currencies. We have excluded these changes in value from our evaluation of our operating performance and MFFO because such adjustments may not be reflective of our ongoing performance and may reflect unrealized impacts on our operating performance. |
(7) | Includes the following components of revenues and expenses that we do not consider in evaluating our operating performance and determining MFFO for the period from inception through December 31, 2017 and for the years ended December 31, 2017, 2016 and 2015 (in thousands): |
Period from Inception (December 10, 2008) through December 31, 2017 | ||||||||||||||||
Years Ended December 31, | ||||||||||||||||
2017 | 2016 | 2015 | ||||||||||||||
Straight-line rent adjustment (a) | $ | (102,149 | ) | $ | 3,366 | $ | (26,202 | ) | $ | (27,500 | ) | |||||
Amortization of lease incentives (b) | 45,178 | 18,693 | 12,274 | 7,581 | ||||||||||||
Amortization of out-of-market leases (b) | 22,561 | (2,130 | ) | 2,849 | 2,833 | |||||||||||
Other | 3,007 | 330 | (77 | ) | 361 | |||||||||||
$ | (31,403 | ) | $ | 20,259 | $ | (11,156 | ) | $ | (16,725 | ) | ||||||
(a) | Represents the adjustments to rental revenue as required by GAAP to recognize minimum lease payments on a straight-line basis over the respective lease terms. We have excluded these adjustments from our evaluation of our operating performance and in determining MFFO because we believe that the rent that is billable during the current period is a more relevant measure of our operating performance for such period. |
(b) | Represents the amortization of lease incentives and out-of-market leases. |
(8) | Represents acquisition expenses and acquisition fees paid to the Advisor that are expensed in our consolidated statements of operations. We fund such costs with proceeds from our offering, and therefore do not consider these expenses in evaluating our operating performance and determining MFFO. |
(9) | The amounts previously reported have been adjusted to reflect the appropriate allocation of net income related to the Brindleyplace JV. For the years ended 2016 and 2015, this adjustment changed basic and diluted income (loss) per common share by $0.01 and $0.01, respectively. See Note 2 — Summary of Significant Accounting Policies for additional information related to the nature of the incorrect allocation of net income. |
From inception through December 31, 2017, we declared operating distributions to our stockholders totaling $962.7 million (which does not include the $288.0 million return of capital special distribution declared in December 2017), compared to total aggregate FFO of $727.3 million and cash flows from operating activities of $590.4 million. For the year ended December 31, 2017, we declared operating distributions to our stockholders totaling $467.6 million, compared to total aggregate FFO of $167.3 million. For the years ended December 31, 2016 and 2015, we declared distributions to our stockholders totaling $179.8 million and $177.3 million, respectively, compared to total aggregate FFO of $190.7 million and $160.3 million, respectively. During our offering and investment stages, we incurred acquisition fees and expenses in connection with our real estate investments, which were recorded as reductions to net income and FFO. From inception through December 31, 2017, we incurred acquisition fees and expenses totaling $223.2 million.
As noted previously, our cash flows from operations have been and may continue to be insufficient to fully fund distributions paid. Therefore, some or all of our distributions may continue to be paid from other sources, such as cash advances by the Advisor, cash resulting from a waiver or deferral of fees, proceeds from the sale of real estate investments, borrowings
60
and/or proceeds from our public offerings. We have not placed a cap on the amount of our distributions that may be paid from any of these sources.
Related-Party Transactions and Agreements
We have entered into agreements with the Advisor, Dealer Manager and Hines or its affiliates, whereby we pay certain fees and reimbursements to these entities during the various phases of our organization and operation. During the organization and offering stage, these included payments to our Dealer Manager for selling commissions and the dealer manager fee and payments to the Advisor for reimbursement of issuer costs. During the acquisition and operational stages, these include payments for certain services related to acquisitions, financing and management of our investments and operations provided to us by the Advisor and Hines and its affiliates pursuant to various agreements we have entered into or anticipate entering into with these entities. We have also entered into several affiliated transactions with affiliates of Hines to make investments and provide financing. In addition to the description of the Aviva Coral Gables JV and the @1377 partnership agreement below, see Note 9 — Related Party Transactions to the Consolidated Financial Statements contained elsewhere in this Annual Report on Form 10-K for additional information concerning our Related-Party Transactions and Agreements.
In July 2012, a wholly-owned subsidiary of the Operating Partnership entered into a limited partnership agreement with an affiliate of Hines for the formation of Hines Ponce & Bird Holdings LP, a Delaware limited liability company, for the purpose of developing a residential/living project in Miami, Florida. Hines served as the initial general partner and as the development partner and a subsidiary of the Operating Partnership was the initial limited partner in the partnership, which we refer to as the Aviva Coral Gables JV. Hines owned a 17% interest in the joint venture and the Company owned the remaining 83% interest through its subsidiary. As compensation for providing development management services, Hines was paid a fee equal to 4% of the development project costs. In addition, subject to certain return thresholds being achieved, the Aviva Coral Gables JV agreement provided that Hines may receive certain incentive distributions in the event the residential/living project is liquidated. The project was completed in April 2015. Hines received total distributions of $21.0 million from the Aviva Coral Gables JV in June 2017, which included a return of capital, preferred return distributions, and incentive distributions based on the return thresholds set forth in the Aviva Coral Gables JV agreement having been achieved. These distributions represented 37.3% of the total distributions made by the Aviva Coral Gables JV from the sale of the property.
The @1377 partnership agreement provided that, subject to certain return thresholds being achieved, Hines would receive certain incentive distributions. Hines received total distributions of $15.7 million from the @1377 partnership in June 2016, which included a return of capital, preferred return distributions, and incentive distributions based on the return thresholds set forth in the @1377 partnership agreement having been achieved. These distributions represented 58% of the total distributions from the @1377 partnership.
Off-Balance Sheet Arrangements
As of December 31, 2017 and 2016, we had no off-balance sheet arrangements that have or are reasonably likely to have a current or future effect on our financial condition, changes in financial condition, revenues or expenses, results of operations, liquidity, capital expenditures or capital resources.
Contractual Obligations
The following table lists our known contractual obligations as of December 31, 2017. Specifically included are our obligations under long-term debt agreements and our operating lease agreement (in thousands):
Payments due by Period | ||||||||||||||||||||
Contractual Obligations | Less Than 1 Year | 1-3 Years | 4-5 Years | More Than 5 Years | Total | |||||||||||||||
Notes payable (1) | $ | 483,723 | $ | 1,184,509 | $ | 252,008 | $ | — | $ | 1,920,240 | ||||||||||
Total contractual obligations | $ | 483,723 | $ | 1,184,509 | $ | 252,008 | $ | — | $ | 1,920,240 | ||||||||||
(1) | Notes payable includes principal and interest payments under our mortgage and construction loans. For the purpose of this table, we assumed that rates of our unhedged variable-interest loans were equal to the rates in effect as of December 31, 2017 and remain constant for the remainder of the loan term. Further, for the purpose of this table, for mortgages |
61
denominated in a foreign currency, we assumed the exchange rate in effect as of December 31, 2017 remains constant for the remainder of the loan term.
Item 7A. Quantitative and Qualitative Disclosures About Market Risk
Market risk includes risks that arise from changes in interest rates, foreign currency exchange rates, commodity prices, equity prices and other market changes that affect market-sensitive instruments. In pursuing our business plan, we believe that interest rate risk, currency risk and real estate valuation risk are the primary market risks to which we are exposed.
Interest Rate Risk
We are exposed to the effects of interest rate changes primarily as a result of debt used to maintain liquidity and fund expansion of our real estate investment portfolio and operations. One of our interest rate risk management objectives is to limit the impact of interest rate changes on cash flows. To achieve this objective, we may borrow at fixed rates or fix and cap the variable rates of interest on variable interest rate borrowings through the use of interest rate swaps and caps. We have and may continue to enter into derivative financial instruments such as interest rate swaps and caps in order to mitigate our interest rate risk on a related financial instrument. We will not enter into derivative or interest rate transactions for speculative purposes. We are exposed to credit risk of the counterparty to these interest rate swap agreements in the event of non-performance under the terms of the derivative contracts. In the event of non-performance by the counterparty, if we were not able to replace these swaps, we would be subject to the variability of interest rates on the total amount of debt outstanding under the mortgage.
At December 31, 2017, we had fixed rate debt of $339.1 million and variable rate debt of $1.5 billion. If interest rates were to increase by 1% and all other variables were held constant, we would incur $15.0 million in additional annual interest expense associated with our variable-rate debt. Additionally, we have notional amounts of approximately $401.9 million in interest rate caps to cap our variable rate debt. As of December 31, 2017, the variable interest rates did not exceed their capped interest rates.
Foreign Currency Risks
We currently have real estate investments located in countries outside of the U.S. that are subject to the effects of exchange rate movements between the foreign currency of each real estate investment and the U.S. dollar, which may affect future costs and cash flows as well as amounts translated into U.S. dollars for inclusion in our consolidated financial statements. Generally, we have entered into mortgage loans denominated in foreign currencies for these investments, which provide natural hedges with regard to changes in exchange rates between the foreign currencies and U.S. dollar and reduces our exposure to exchange rate differences. Additionally, we are typically a net receiver of these foreign currencies, and, as a result, our foreign operations benefit from a weaker U.S. dollar and are adversely affected by a stronger U.S. dollar. See “Item 7. Management’s Discussion and Analysis of Financial Condition and Results of Operations - Results of Operations” for additional information concerning the negative impact that declines in the foreign currency exchange rates had on the operating results of our international properties for the year ended December 31, 2016. The table below identifies the effect that a 10% immediate, unfavorable change in the exchange rates would have on our equity in these international real estate investments and their net income for the most recently completed period, by foreign currency (in thousands)(1)(2):
Reduction in Book Value as of December 31, 2017 | Reduction in Net Income (Loss) for the Year Ended December 31, 2017 | |||
AUD | $9,911 | $784 | ||
EUR | $12,998 | $8,592 | ||
GBP | $21,526 | $4,671 | ||
RUB | $6,537 | $491 | ||
(1) | Our real estate assets in Moscow, Russia were purchased in U.S. dollars and we expect that when we dispose of these assets, the sale transactions will also be denominated in U.S. dollars. Accordingly, we do not expect to have economic exposure to the rouble upon disposition. However, changes in the exchange rate between the rouble and the U.S. dollar could result in realized losses recorded in our consolidated statement of operations at the time of sale. |
62
(2) | Our real estate assets in Warsaw, Wroclaw and Upper Silesia, Poland were purchased in Euros and we expect that when we dispose of these assets, the sale transactions will also be denominated in Euros. Accordingly, we do not expect to have Polish zloty exposure upon disposition. |
63
Item 8. Financial Statements and Supplementary Data
REPORT OF INDEPENDENT REGISTERED PUBLIC ACCOUNTING FIRM
To the Stockholders and Board of Directors of Hines Global REIT, Inc.
Opinion on the Financial Statements
We have audited the accompanying consolidated balance sheets of Hines Global REIT, Inc. and subsidiaries (the “Company”) as of December 31, 2017 and 2016, and the related consolidated statements of operations and comprehensive income (loss), equity, and cash flows for each of the three years in the period ended December 31, 2017 and the related notes and the schedules listed in the Index at Item 15 (collectively referred to as the “financial statements”). In our opinion, the financial statements present fairly, in all material respects, the financial position of the Company as of December 31, 2017 and 2016, and the results of its operations and its cash flows for each of the three years in the period ended December 31, 2017, in conformity with accounting principles generally accepted in the United States of America.
Basis for Opinion
These financial statements are the responsibility of the Company’s management. Our responsibility is to express an opinion on the Company’s financial statements based on our audits. We are a public accounting firm registered with the Public Company Accounting Oversight Board (United States) (PCAOB) and are required to be independent with respect to the Company in accordance with the U.S. federal securities laws and the applicable rules and regulations of the Securities and Exchange Commission and the PCAOB.
We conducted our audits in accordance with the standards of the PCAOB. Those standards require that we plan and perform the audit to obtain reasonable assurance about whether the financial statements are free of material misstatement, whether due to error or fraud. The Company is not required to have, nor were we engaged to perform, an audit of its internal control over financial reporting. As part of our audits, we are required to obtain an understanding of internal control over financial reporting but not for the purpose of expressing an opinion on the effectiveness of the Company’s internal control over financial reporting. Accordingly, we express no such opinion.
Our audits included performing procedures to assess the risks of material misstatement of the financial statements, whether due to error or fraud, and performing procedures that respond to those risks. Such procedures included examining, on a test basis, evidence regarding the amounts and disclosures in the financial statements. Our audits also included evaluating the accounting principles used and significant estimates made by management, as well as evaluating the overall presentation of the financial statements. We believe that our audits provide a reasonable basis for our opinion.
/s/ Deloitte & Touche LLP
Houston, Texas
March 30, 2018
We have served as the Company’s auditor since 2008.
64
HINES GLOBAL REIT, INC.
CONSOLIDATED BALANCE SHEETS
As of December 31, 2017 and 2016
2017 | 2016 | |||||||
(In thousands, except per share amounts) | ||||||||
ASSETS | ||||||||
Investment property, net | $ | 2,689,276 | $ | 3,049,643 | ||||
Cash and cash equivalents | 401,326 | 127,393 | ||||||
Restricted cash | 16,884 | 29,331 | ||||||
Derivative instruments | 1 | 40 | ||||||
Tenant and other receivables, net | 73,341 | 109,879 | ||||||
Intangible lease assets, net | 406,257 | 506,075 | ||||||
Deferred leasing costs, net | 107,789 | 127,995 | ||||||
Deferred financing costs, net | 1,225 | 2,425 | ||||||
Real estate loans receivable, net | — | 15,291 | ||||||
Other assets | 30,098 | 20,360 | ||||||
Total assets | $ | 3,726,197 | $ | 3,988,432 | ||||
LIABILITIES AND EQUITY | ||||||||
Liabilities: | ||||||||
Accounts payable and accrued expenses | $ | 105,151 | $ | 110,219 | ||||
Due to affiliates | 10,252 | 17,914 | ||||||
Intangible lease liabilities, net | 69,566 | 82,354 | ||||||
Other liabilities | 27,586 | 41,233 | ||||||
Distributions payable | 303,131 | 21,178 | ||||||
Notes payable, net | 1,834,953 | 2,207,299 | ||||||
Total liabilities | 2,350,639 | 2,480,197 | ||||||
Commitments and contingencies (Note 14) | — | — | ||||||
Equity: | ||||||||
Stockholders’ equity: | ||||||||
Preferred shares, $.001 par value; 500,000 preferred shares authorized, none issued or outstanding as of December 31, 2017 and 2016 | — | — | ||||||
Common shares, $.001 par value; 1,500,000 common shares authorized as of December 31, 2017 and 2016; 274,255 and 277,331 common shares issued and outstanding as of December 31, 2017 and 2016, respectively | 274 | 277 | ||||||
Additional paid-in capital | 2,471,004 | 2,507,186 | ||||||
Accumulated distributions in excess of earnings | (968,158 | ) | (821,500 | ) | ||||
Accumulated other comprehensive income (loss) | (128,869 | ) | (199,929 | ) | ||||
Total stockholders’ equity | 1,374,251 | 1,486,034 | ||||||
Noncontrolling interests | 1,307 | 22,201 | ||||||
Total equity | 1,375,558 | 1,508,235 | ||||||
Total liabilities and equity | $ | 3,726,197 | $ | 3,988,432 | ||||
See notes to the consolidated financial statements.
65
HINES GLOBAL REIT, INC.
CONSOLIDATED STATEMENTS OF OPERATIONS AND COMPREHENSIVE INCOME (LOSS)
For the Years Ended December 31, 2017, 2016 and 2015
2017 | 2016 | 2015 | ||||||||||
(In thousands, except per share amounts) | ||||||||||||
Revenues: | ||||||||||||
Rental revenue | $ | 379,188 | $ | 440,733 | $ | 441,709 | ||||||
Other revenue | 24,461 | 37,175 | 35,164 | |||||||||
Total revenues | 403,649 | 477,908 | 476,873 | |||||||||
Expenses: | ||||||||||||
Property operating expenses | 89,043 | 93,276 | 91,902 | |||||||||
Real property taxes | 48,566 | 49,394 | 47,431 | |||||||||
Property management fees | 8,230 | 9,579 | 10,337 | |||||||||
Depreciation and amortization | 138,503 | 174,110 | 186,965 | |||||||||
Acquisition related expenses | 127 | 372 | 10,472 | |||||||||
Asset management and acquisition fees | 37,949 | 37,001 | 44,522 | |||||||||
General and administrative expenses | 9,250 | 11,149 | 8,597 | |||||||||
Impairment losses | 7,124 | — | — | |||||||||
Total expenses | 338,792 | 374,881 | 400,226 | |||||||||
Income (loss) before other income (expenses) and benefit (provision) for income taxes | 64,857 | 103,027 | 76,647 | |||||||||
Other income (expenses): | ||||||||||||
Gain (loss) on derivative instruments | (634 | ) | (689 | ) | 562 | |||||||
Equity in earnings (losses) of unconsolidated entity | — | 7,504 | — | |||||||||
Gain (loss) on sale of real estate investments | 364,325 | 127,294 | 14,684 | |||||||||
Foreign currency gains (losses) | 10,046 | (8,240 | ) | (21,468 | ) | |||||||
Interest expense | (59,461 | ) | (64,473 | ) | (71,288 | ) | ||||||
Other income (expenses) | 680 | 130 | 427 | |||||||||
Income (loss) before benefit (provision) for income taxes | 379,813 | 164,553 | (436 | ) | ||||||||
Benefit (provision) for income taxes | 8,705 | (7,326 | ) | (4,518 | ) | |||||||
Provision for income taxes related to sale of real estate | (12,911 | ) | — | — | ||||||||
Net income (loss) | 375,607 | 157,227 | (4,954 | ) | ||||||||
Net (income) loss attributable to noncontrolling interests | (54,657 | ) | (2,563 | ) | (2,281 | ) | ||||||
Net income (loss) attributable to common stockholders | $ | 320,950 | $ | 154,664 | $ | (7,235 | ) | |||||
Basic and diluted income (loss) per common share: | $ | 1.16 | $ | 0.56 | $ | (0.03 | ) | |||||
Weighted average number of common shares outstanding | 276,374 | 275,914 | 272,773 | |||||||||
Net comprehensive income (loss): | ||||||||||||
Net income (loss) | $ | 375,607 | $ | 157,227 | $ | (4,954 | ) | |||||
Other comprehensive income (loss): | ||||||||||||
Foreign currency translation adjustment | 74,735 | (40,647 | ) | (40,516 | ) | |||||||
Net comprehensive income (loss): | 450,342 | 116,580 | (45,470 | ) | ||||||||
Net comprehensive (income) loss attributable to noncontrolling interests | (58,332 | ) | 1,251 | (1,092 | ) | |||||||
Net comprehensive income (loss) attributable to common stockholders | $ | 392,010 | $ | 117,831 | $ | (46,562 | ) | |||||
See notes to the consolidated financial statements.
66
HINES GLOBAL REIT, INC.
CONSOLIDATED STATEMENTS OF EQUITY
For the Years Ended December 31, 2017, 2016 and 2015
(In thousands)
Hines Global REIT, Inc. | ||||||||||||||||||||||||||
Common Shares | Amount | Additional Paid-in Capital | Accumulated Distributions in Excess of Earnings | Accumulated Other Comprehensive Income (Loss) | Total Stockholders’ Equity | Noncontrolling Interests | ||||||||||||||||||||
Balance as of January 1, 2015 | 270,657 | $ | 271 | $ | 2,440,089 | $ | (611,813 | ) | $ | (123,769 | ) | $ | 1,704,778 | $ | 31,319 | |||||||||||
Issuance of common shares | 9,836 | 10 | 93,775 | — | — | 93,785 | — | |||||||||||||||||||
Contribution from noncontrolling interest | — | — | — | — | — | — | 953 | |||||||||||||||||||
Distributions declared | — | — | — | (177,293 | ) | — | (177,293 | ) | (825 | ) | ||||||||||||||||
Distributions on Convertible Preferred Equity Certificates (“CPEC”) | — | — | — | — | — | — | (3,396 | ) | ||||||||||||||||||
Redemption of common shares | (6,011 | ) | (7 | ) | (57,059 | ) | — | — | (57,066 | ) | — | |||||||||||||||
Issuer costs | — | — | (61 | ) | — | — | (61 | ) | — | |||||||||||||||||
Net income (loss) | — | — | — | (7,235 | ) | — | (7,235 | ) | 2,281 | |||||||||||||||||
Foreign currency translation adjustment | — | — | — | — | (55,541 | ) | (55,541 | ) | (1,189 | ) | ||||||||||||||||
Foreign currency translation adjustment reclassified into earnings | — | — | — | — | 16,214 | 16,214 | — | |||||||||||||||||||
Balance as of December 31, 2015 | 274,482 | 274 | 2,476,744 | (796,341 | ) | (163,096 | ) | 1,517,581 | 29,143 | |||||||||||||||||
Issuance of common shares | 9,331 | 9 | 94,061 | — | — | 94,070 | — | |||||||||||||||||||
Distributions declared | — | — | — | (179,823 | ) | — | (179,823 | ) | (2,077 | ) | ||||||||||||||||
Distributions on CPEC | — | — | — | — | — | — | (3,614 | ) | ||||||||||||||||||
Redemption of common shares | (6,482 | ) | (6 | ) | (63,578 | ) | — | — | (63,584 | ) | — | |||||||||||||||
Issuer costs | — | — | (41 | ) | — | — | (41 | ) | — | |||||||||||||||||
Net income (loss) | — | — | — | 154,664 | — | 154,664 | 2,563 | |||||||||||||||||||
Foreign currency translation adjustment | — | — | — | — | (36,833 | ) | (36,833 | ) | (3,814 | ) | ||||||||||||||||
Balance as of December 31, 2016 | 277,331 | $ | 277 | $ | 2,507,186 | $ | (821,500 | ) | $ | (199,929 | ) | $ | 1,486,034 | $ | 22,201 | |||||||||||
Issuance of common shares | 9,150 | 9 | 91,974 | — | — | 91,983 | — | |||||||||||||||||||
Contributions from noncontrolling interest | — | — | — | — | — | 33 | ||||||||||||||||||||
Distributions declared | — | — | — | (467,608 | ) | — | (467,608 | ) | (26,707 | ) | ||||||||||||||||
Redemption of CPEC | — | — | — | — | — | — | (52,552 | ) | ||||||||||||||||||
Redemption of common shares | (12,226 | ) | (12 | ) | (128,095 | ) | — | — | (128,107 | ) | — | |||||||||||||||
Issuer costs | — | — | (61 | ) | — | — | (61 | ) | — | |||||||||||||||||
Net income (loss) | — | — | — | 320,950 | — | 320,950 | 54,657 | |||||||||||||||||||
Foreign currency translation adjustment | — | — | — | — | 62,248 | 62,248 | 61 | |||||||||||||||||||
Foreign currency translation adjustment reclassified into earnings | — | — | — | — | 8,812 | 8,812 | 3,614 | |||||||||||||||||||
Balance as of December 31, 2017 | 274,255 | $ | 274 | $ | 2,471,004 | $ | (968,158 | ) | $ | (128,869 | ) | $ | 1,374,251 | $ | 1,307 | |||||||||||
See notes to the consolidated financial statements.
67
HINES GLOBAL REIT, INC.
CONSOLIDATED STATEMENTS OF CASH FLOWS
For the Years Ended December 31, 2017, 2016 and 2015
2017 | 2016 | 2015 | ||||||||||
CASH FLOWS FROM OPERATING ACTIVITIES: | (In thousands) | |||||||||||
Net income (loss) | $ | 375,607 | $ | 157,227 | $ | (4,954 | ) | |||||
Adjustments to reconcile net income (loss) to net cash from operating activities: | ||||||||||||
Depreciation and amortization | 159,463 | 193,954 | 203,380 | |||||||||
Allowance for deferred tax assets | (11,172 | ) | — | — | ||||||||
Equity in (earnings) losses of unconsolidated entity | — | (7,504 | ) | — | ||||||||
Distributions from unconsolidated entities | — | 7,504 | — | |||||||||
Foreign currency (gains) losses | (10,046 | ) | 8,240 | 21,468 | ||||||||
(Gain) loss on sale of real estate investments | (364,325 | ) | (127,294 | ) | (14,684 | ) | ||||||
Impairment losses | 7,124 | — | — | |||||||||
(Gain) loss on derivative instruments | 634 | 689 | (562 | ) | ||||||||
Changes in assets and liabilities: | ||||||||||||
Change in other assets | 2,767 | (6,651 | ) | (5,235 | ) | |||||||
Change in tenant and other receivables | 2,062 | (27,065 | ) | (34,637 | ) | |||||||
Change in deferred leasing costs | (49,113 | ) | (43,191 | ) | (60,104 | ) | ||||||
Change in accounts payable and accrued expenses | (3,458 | ) | 7,471 | 9,133 | ||||||||
Change in other liabilities | (9,626 | ) | (5,145 | ) | 1,324 | |||||||
Change in due to affiliates | (10,188 | ) | (1,460 | ) | (224 | ) | ||||||
Net cash from operating activities | 89,729 | 156,775 | 114,905 | |||||||||
CASH FLOWS FROM INVESTING ACTIVITIES: | ||||||||||||
Proceeds from sale of real estate investments | 947,882 | 266,312 | 30,368 | |||||||||
Investments in acquired properties and lease intangibles | — | (30,142 | ) | (511,553 | ) | |||||||
Capital expenditures at operating properties and developments | (43,123 | ) | (19,926 | ) | (11,627 | ) | ||||||
Distributions from unconsolidated entities in excess of equity in earnings | — | 2,006 | 867 | |||||||||
Investments in real estate loans receivable | (2,296 | ) | (6,182 | ) | (13,208 | ) | ||||||
Proceeds from collection of real estate loans receivable | 7,178 | 46,951 | 33,569 | |||||||||
Sale of real estate loans receivable | 10,342 | — | — | |||||||||
Net cash from (used in) investing activities | 919,983 | 259,019 | (471,584 | ) | ||||||||
CASH FLOWS FROM FINANCING ACTIVITIES: | ||||||||||||
Contribution from noncontrolling interest | — | — | 953 | |||||||||
Redemption of common shares | (121,399 | ) | (63,842 | ) | (57,325 | ) | ||||||
Payment of issuer costs | (40 | ) | (42 | ) | (55 | ) | ||||||
Distributions paid to stockholders and noncontrolling interests | (120,457 | ) | (89,163 | ) | (85,275 | ) | ||||||
Redemptions of CPEC | (52,552 | ) | — | — | ||||||||
Proceeds from notes payable | 159,000 | 159,000 | 1,756,721 | |||||||||
Payments on related party notes payable | — | — | (17,017 | ) | ||||||||
Payments on notes payable | (621,508 | ) | (412,620 | ) | (1,230,638 | ) | ||||||
Change in security deposit liability | (538 | ) | 78 | 915 | ||||||||
Deferred financing costs paid | (425 | ) | (503 | ) | (8,933 | ) | ||||||
Payments related to interest rate contracts | (8 | ) | (50 | ) | (2,457 | ) | ||||||
Net cash from (used in) financing activities | (757,927 | ) | (407,142 | ) | 356,889 | |||||||
Effect of exchange rate changes on cash | 9,701 | (8,319 | ) | (7,383 | ) | |||||||
Net change in cash, cash equivalents, and restricted cash | 261,486 | 333 | (7,173 | ) | ||||||||
Cash, cash equivalents and restricted cash, beginning of year | 156,724 | 156,391 | 163,564 | |||||||||
Cash, cash equivalents and restricted cash, end of year | $ | 418,210 | $ | 156,724 | $ | 156,391 | ||||||
See notes to the consolidated financial statements.
68
HINES GLOBAL REIT, INC.
NOTES TO THE CONSOLIDATED FINANCIAL STATEMENTS
1. ORGANIZATION
Hines Global REIT, Inc. (the “Company”), was formed as a Maryland corporation on December 10, 2008 under the General Corporation Law of the state of Maryland for the purpose of engaging in the business of investing in and owning commercial real estate properties and other real estate investments. The Company conducts substantially all of its operations through Hines Global REIT Properties, LP (the “Operating Partnership”) and subsidiaries of the Operating Partnership. Beginning with its taxable year ended December 31, 2009, the Company operated and intends to continue to operate in a manner to qualify as a real estate investment trust (“REIT”) for federal income tax purposes. The day-to-day business of the Company is managed by Hines Global REIT Advisors LP (the “Advisor”), an affiliate of Hines Interests Limited Partnership (“Hines”), pursuant to the Advisory Agreement between the Company, the Advisor and the Operating Partnership.
On August 5, 2009, the Company commenced its initial public offering of common stock for sale to the public (the “Initial Offering”) which expired on February 1, 2013. The Company commenced a follow-on offering effective February 4, 2013, through which it offered up to $3.5 billion in shares of common stock (the “Second Offering”), and ceased offering primary shares pursuant to the second public offering on April 11, 2014. The Company continues to offer up to $500.0 million of shares of its common stock under its distribution reinvestment plan, pursuant to an offering which commenced on April 24, 2014 (the “DRP Offering”). Collectively, through its public offerings, the Company received gross offering proceeds of $3.1 billion from the sale of 306.7 million shares from inception through December 31, 2017, all of which has been invested in the Company’s real estate portfolio.
By the end of 2015, the Company completed its investment of the proceeds raised through its public offerings and owned interests in 43 real estate investments. Since that time, through December 31, 2017, the Company has sold its interests in 9 real estate investments. As of December 31, 2017, the Company owned interests in 34 real estate investments, consisting of the following types of investments:
• | Domestic office investments (9 investments) |
• | Domestic other investments (5 investments) |
• | International office investments (9 investments) |
• | International other investments (11 investments) |
Joint Ventures, Equity Method Investments and Noncontrolling Interests
On January 7, 2009, the Company and Hines Global REIT Associates Limited Partnership (“HALP”), an affiliate of the Advisor, formed Hines Global REIT Properties, LP (the “Operating Partnership”). The Company conducts most of its operations through the Operating Partnership. On January 14, 2009, the Company and HALP made initial capital contributions to the Operating Partnership of $10,000 and $190,000, respectively and accordingly, HALP owned a 95.0% noncontrolling interest in the Operating Partnership. As of December 31, 2017 and 2016, HALP owned a 0.01% and 0.01% interest in the Operating Partnership, respectively.
The Brindleyplace JV
In June 2010, the Operating Partnership and Moorfield Real Estate Fund II GP Ltd., (“Moorfield”) formed Hines Moorfield UK Venture I S.A.R.L., (the “Brindleyplace JV”) and, in July 2010, the Brindleyplace JV acquired several properties located in Birmingham, England (the “Brindleyplace Project”). In 2015, LSREF 3 Laser Holdings (Jersey) Limited (“Laser”) purchased Moorfield’s interest in the Brindleyplace JV and renamed it Hines Laser UK Venture I S.A.R.L. The Company owned a 60% interest in the Brindleyplace JV and Laser held the remaining 40% interest. In February 2017, the Brindleyplace JV sold the Brindleyplace Project. See Note 3 — Investment Property for information regarding the sale.
The Company has concluded its investment in the Brindleyplace JV does not qualify as a variable interest entity (“VIE”) under the Financial Accounting Standards Board (the “FASB”) Accounting Standards Codification (“ASC” or the “Codification”) 810 “Consolidation.” Based on the Company’s majority voting interest as well as certain additional voting rights and other factors, the Company has consolidated the Brindleyplace JV and its wholly-owned subsidiaries in its financial statements. See Note 10 — Noncontrolling Interests for additional information regarding our noncontrolling interests in the Brindleyplace JV.
69
Consolidated VIEs
The Flagship JV
In June 2011, a wholly-owned subsidiary of the Operating Partnership entered into a Limited Partnership Agreement (as amended) with Flagship Capital, GP for the formation of Flagship Capital Partners Fund, LP (the “Flagship JV”) for the purpose of originating real estate loans. The Company owns a 97% interest in the Flagship JV and Flagship Capital, GP owns the remaining 3% interest. Flagship Capital, GP serves as the general partner and will manage the day-to-day activities of the Flagship JV. Both partners have equal voting rights and distributions from the Flagship JV will initially be paid to the fund partners based on their pro rata ownership. Since the voting rights of each of the partners are disproportionate to their ownership interests, the Company has concluded that the Flagship JV qualifies as a VIE under ASC 810. Further, the Company has determined that it is the primary beneficiary due to its ability to exercise significant control and influence over the Flagship JV as well as certain other factors. As a result, the Company consolidated the Flagship JV and its wholly-owned subsidiaries in its financial statements. See Note 10 — Noncontrolling Interests for additional information regarding our noncontrolling interests in the Flagship JV. As of December 31, 2017, there were no remaining real estate loans owned by the Flagship JV and the partners consented to the voluntary winding up and termination of the Flagship JV.
The WaterWall Place JV
In December 2011, a wholly-owned subsidiary of the Operating Partnership entered into a Limited Partnership Agreement with an affiliate of Hines for the formation of Hines One WaterWall Holdings LP (the “WaterWall Place JV”), a Delaware limited liability company, for the purpose of developing a residential/living project in Houston, Texas. Hines serves as the initial general partner and as the development partner and the subsidiary of the Operating Partnership is the initial limited partner. The Company has a 93% interest in this joint venture. An affiliate of Hines owns the remaining 7% interest in this joint venture. The Company has concluded its investment in the WaterWall Place JV qualifies as a VIE under ASC 810. Further, the Company has determined that it is the primary beneficiary since it has greater exposure to the variability of One WaterWall JV’s economic performance as well as certain other factors. As a result, the Company has consolidated the WaterWall Place JV and its wholly-owned subsidiaries in its financial statements. See Note 10 — Noncontrolling Interests for additional information regarding our noncontrolling interests in the WaterWall Place JV.
The Aviva Coral Gables JV
In July 2012, a wholly-owned subsidiary of the Operating Partnership entered into a Limited Partnership Agreement with an affiliate of Hines for the formation of Hines Ponce & Bird Holdings LP, a Delaware limited liability company, for the purpose of developing a residential/living project in Miami, Florida. Hines serves as the initial general partner and as the development partner and the subsidiary of the Operating Partnership is the initial limited partner. The Company had an 83% interest in this joint venture. An affiliate of Hines owned the remaining 17% interest in this joint venture. The Company concluded its investment in the Aviva Coral Gables JV qualified as a VIE under ASC 810. Further, the Company determined that it is the primary beneficiary since it has greater exposure to the variability of Aviva Coral Gables's economic performance as well as certain other factors. As a result, the Company consolidated the Aviva Coral Gables JV and its wholly-owned subsidiaries in its financial statements. In June 2017, the Aviva Coral Gables JV sold Aviva Coral Gables. See Note 10 — Noncontrolling Interests for additional information regarding our noncontrolling interests in the Aviva Coral Gables JV and see Note 3 — Investment Property for information regarding the sale of the property.
A summary of our consolidated VIEs is as follows (in thousands):
December 31, 2017 | December 31, 2016 | |||||||
Maximum risk of loss (1) | $ | 9,535 | $ | 30,446 | ||||
Assets held by VIEs | $ | 59,112 | $ | 136,705 | ||||
Assets held as collateral for debt | $ | 59,112 | $ | 136,705 | ||||
Liabilities held by VIEs | $ | 48,222 | $ | 91,792 | ||||
(1) | Represents the Company's contributions, net of distributions, made to the consolidated VIEs. |
Restrictions on the use of these assets are significant because they serve as collateral for the VIE’s debt, and the Company is generally required to obtain its partners’ approval in accordance with the respective joint venture agreements for any major transactions. Transactions with these joint ventures on the Company’s consolidated financial statements primarily relate to (i)
70
distributions related to the receipt of proceeds from the collection of loans receivable at the Flagship JV or (ii) distributions received from the WaterWall Place JV and the Aviva Coral Gables JV, respectively. The Company and its partners are subject to the terms of the joint venture agreements which include provisions for when additional contributions may be required. During the year ended December 31, 2017, the Company received distributions of $52.5 million, which included a $35.3 million distribution from the sale of Aviva Coral Gables in June 2017 and $14.5 million of distributions related to the collection of the remaining loans receivable at the Flagship JV in 2017, net of contributions made of $0.5 million in accordance with the Company’s respective joint venture agreements. During the year ended December 31, 2016, the Company received distributions of $21.9 million, net of contributions made of $0.2 million in accordance with the Company’s respective joint venture agreements. This activity is eliminated in consolidation of the VIEs, but increases, or decreases in the case of distributions received, the Company’s maximum risk of loss.
Unconsolidated VIEs
The @1377 Equity Method Investment
The Company formed a joint venture with an affiliate of Hines in 2011 related to the construction of @1377, a residential/living development project in Atlanta, Georgia. The Company provided a preferred equity investment in the partnership of $3.6 million during 2012, representing a 51.7% ownership in the project and a $3.2 million mezzanine loan commitment plus accrued interest made by the Company. In addition, the partnership obtained a $23.3 million secured loan made by Cadence Bank, N.A., which was solely guaranteed by the Company’s joint venture partner (the “JV Partner”). The Company concluded that @1377 qualifies as a VIE. The JV Partner was the manager of the project, which allowed the JV Partner to direct the activities of the VIE that most significantly impacted the VIE’s financial performance. Based upon the loan guarantees and the JV Partner’s ability to direct the activities that significantly impacted the economic performance of the VIE, the Company determined that it is not the primary beneficiary of this VIE and determined to account for its preferred equity investment in the project as an equity method investment. Other than the initial capital contributions provided by the Company, the Company did not provide any additional subordinated financial support.
The construction of @1377 was completed in March 2014 and in June 2016, the joint venture sold @1377 for $51.0 million, excluding transaction costs and closing prorations. As a result of the sale of the property, the Company’s equity in earnings of the partnership included a gain of $7.5 million and the Company received distributions of $8.7 million as well as $4.0 million related to the repayment of its mezzanine loan.
2. SUMMARY OF SIGNIFICANT ACCOUNTING POLICIES
Use of Estimates
The Company’s consolidated financial statements have been prepared in accordance with accounting principles generally accepted in the United States of America (“GAAP”). The preparation of the consolidated financial statements requires the Company to make estimates and judgments that affect the reported amounts of assets, liabilities and contingencies as of the date of the financial statements and the reported amounts of revenues and expenses during the reporting periods. The Company evaluates its assumptions and estimates on an ongoing basis. The Company bases its estimates on historical experience and on various other assumptions that the Company believes to be reasonable under the circumstances. Additionally, application of the Company’s accounting policies involves exercising judgments regarding assumptions as to future uncertainties. Actual results may differ from these estimates under different assumptions or conditions.
Basis of Presentation
The consolidated financial statements of the Company include the accounts of Hines Global REIT, Inc., the Operating Partnership and its wholly-owned subsidiaries and the joint ventures as well as amounts related to noncontrolling interests. All intercompany balances and transactions have been eliminated in consolidation.
The Company evaluates the need to consolidate joint ventures in accordance with GAAP. In accordance with GAAP, the Company will consolidate joint ventures that are determined to be variable interest entities for which it is the primary beneficiary. Further, partially owned real estate joint ventures over which the Company has a controlling financial interest are consolidated in its financial statements. In determining if the Company has a controlling financial interest, it considers factors such as ownership interest, authority to make decisions, kick-out rights and substantive participating rights. Management continually analyzes and assesses reconsideration events, including changes in these factors, to determine if the consolidation treatment remains appropriate. Partially owned real estate joint ventures where the Company does not have a controlling financial interest, but has the ability to exercise significant influence, are accounted for using the equity method.
71
The Company’s investments in partially owned real estate joint ventures are reviewed for impairment periodically if events or circumstances change indicating that the carrying amount of its investments may not be recoverable. In such an instance, the Company will record an impairment charge if it determines that a decline in the value of an investment below its fair value is other than temporary. The Company’s analysis will be dependent on a number of factors, including the performance of each investment, current market conditions, and its intent and ability to hold the investment to full recovery. As of December 31, 2017 and 2016, the Company no longer had any investments in unconsolidated partially owned real estate joint ventures. Based on the Company’s analysis of the facts and circumstances at each reporting period, no impairment was recorded related to its investments in partially owned real estate joint ventures for the years ended December 31, 2017, 2016 or 2015.
International Operations
The British pound (“GBP”) is the functional currency for the Company’s subsidiaries operating in the United Kingdom, the Russian rouble (“RUB”) is the functional currency for the Company’s subsidiaries operating in Russia, the Polish zloty (“PLN”) is the functional currency for the Company’s subsidiaries operating in Poland, the Australian dollar (“AUD”) is the functional currency for the Company’s subsidiaries operating in Australia and the Euro (“EUR”) is the functional currency for the Company’s subsidiaries operating in Germany and France.
These subsidiaries have translated their financial statements into U.S. dollars for reporting purposes. Assets and liabilities are translated at the exchange rate in effect as of the balance sheet date while income statement accounts are translated using the average exchange rate for the period and significant nonrecurring transactions using the rate on the transaction date. Gains or losses resulting from translation are included in accumulated other comprehensive income (loss) within stockholders’ equity. Foreign currency transaction gains and losses are recorded in foreign currency gains (losses) on the consolidated statement of operations and result from the effect of changes in exchange rates on transactions denominated in currencies other than a subsidiary’s functional currency, including transactions between consolidated subsidiaries. An exception is made where an intercompany loan or advance is deemed to be of a long-term investment nature, in which instance foreign currency transaction gains or losses are included as currency translation adjustments and are reported in the consolidated statement of equity as accumulated other comprehensive gains or losses. The Company disposed of its investment in the Brindleyplace Project in February 2017 as well as its investment in Mercedes Benz Bank in July 2017. Upon the disposal of these properties, the Company realized a loss of $8.8 million related to the currency translation adjustment, which was included in the gain (loss) on sale of real estate in its consolidated statement of operations. During the year ended December 31, 2015, intercompany loans with the consolidated subsidiaries in Australia were repaid and as a result, the Company recognized a loss of $15.1 million, which was included in foreign currency gain (loss).
Investment Property and Lease Intangibles
Real estate assets acquired by the Company are stated at fair value at the date of acquisition less accumulated depreciation. Depreciation is computed using the straight-line method. The estimated useful lives for computing depreciation are generally 10 years for furniture and fixtures, 15-20 years for electrical and mechanical installations and 40 years for buildings. Major replacements that extend the useful life of the assets are capitalized and maintenance and repair costs are expensed as incurred.
Acquisitions of properties are accounted for utilizing the acquisition method and, accordingly, are recorded at the estimated fair values of the assets acquired and liabilities assumed. The results of operations of acquired properties are included in the Company’s results of operations from their respective dates of acquisition. Estimates of fair values are based upon estimates of future cash flows and other valuation techniques that the Company believes are similar to those used by market participants and are used to record the purchase of identifiable assets acquired, such as land, buildings and improvements, equipment and identifiable intangible assets related to in-place leases and liabilities assumed, such as amounts related to acquired out-of-market leases, asset retirement obligations, mortgage notes payable. Values of buildings and improvements are determined on an as if vacant basis. Initial valuations are subject to change until such information is finalized, no later than 12 months from the acquisition date. For prior acquisitions, acquisition-related costs such as transaction costs and acquisition fees paid to the Advisor were expensed as incurred. Beginning in 2018, when Accounting Standards Update (“ASU”) 2017-01 becomes effective, any acquisition-related costs and acquisition fees to any future acquisitions will be capitalized. See Recent Accounting Pronouncements below for more information on ASU 2017-01.
The estimated fair value of acquired in-place leases are the costs the Company would have incurred to lease the properties to the occupancy level of the properties at the date of acquisition. Such estimates include the fair value of leasing commissions, legal costs and other direct costs that would be incurred to lease the properties to such occupancy levels. Additionally, the Company evaluates the time period over which such occupancy levels would be achieved. Such evaluation will include an estimate of the net market-based rental revenues and net operating costs (primarily consisting of real estate taxes, insurance and
72
utilities) that would be incurred during the lease-up period. Acquired in-place leases as of the date of acquisition are amortized over the remaining lease terms. Should a tenant terminate its lease, the unamortized portion of the in-place lease value is charged to amortization expense.
Acquired out-of-market lease values (including ground leases) are recorded based on the present value (using a discount rate that reflects the risks associated with the lease acquired) of the difference between the contractual amounts paid pursuant to the in-place leases and management’s estimate of fair market value lease rates for the corresponding in-place leases. The capitalized out-of-market lease values are amortized as adjustments to rental revenue (or ground lease expense, as applicable) over the remaining terms of the respective leases, which include periods covered by bargain renewal options. Should a tenant terminate its lease, the unamortized portion of the out-of-market lease value is charged to rental revenue.
Management estimates the fair value of assumed mortgage notes payable based upon indications of then-current market pricing for similar types of debt with similar maturities. Assumed mortgage notes payable are initially recorded at their estimated fair value as of the assumption date, and the difference between such estimated fair value and the outstanding principal balance of the note will be amortized over the life of the mortgage note payable.
Real estate assets are reviewed for impairment each reporting period if events or changes in circumstances indicate that the carrying amount of the individual property may not be recoverable. In such an event, a comparison will be made of the current and projected operating cash flows and expected proceeds from the eventual disposition of each property on an undiscounted basis to the carrying amount of such property. If the carrying amount exceeds the undiscounted cash flows, it would be written down to the estimated fair value to reflect impairment in the value of the asset. The determination of whether investment property is impaired requires a significant amount of judgment by management and is based on the best information available to management at the time of the evaluation. For the year ended December 31, 2017, we determined that one of our investment properties was impaired as a result of deteriorating market conditions. As a result, an impairment loss of $7.1 million was recorded to write down its carrying value to its fair value for the year ended December 31, 2017. No impairment charges were recorded during the years ended December 31, 2016, and 2015.
Cash and Cash Equivalents
The Company considers all short-term, highly liquid investments that are readily convertible to cash with an original maturity of three months or less at the time of purchase to be cash equivalents.
Restricted Cash
The Company has restricted cash primarily related to certain escrow accounts required by several of the Company’s mortgage agreements.
Concentration of Credit Risk
As of December 31, 2017, the Company had cash and cash equivalents and restricted cash deposited in certain financial institutions in excess of federally insured levels. Management regularly monitors the financial stability of these financial institutions in an effort to manage the Company’s exposure to any significant credit risk in cash and cash equivalents or restricted cash.
In addition, as of December 31, 2017, the Company had $74.9 million of cash and cash equivalents deposited in certain financial institutions located in the United Kingdom, Russia, Poland, Australia, Germany, and France. Management regularly monitors the financial stability of these financial institutions in an effort to manage its exposure to any significant credit risk in cash and cash equivalents.
Tenant and Other Receivables
Receivable balances consist primarily of base rents, tenant reimbursements and receivables attributable to straight-line rent. An allowance for the uncollectible portion of tenant and other receivables is determined based upon an analysis of the tenant’s payment history, the financial condition of the tenant, business conditions in the industry in which the tenant operates and economic conditions in the area in which the property is located. Tenant and other receivables are shown at cost in the consolidated balance sheets, net of allowance for doubtful accounts of $3.8 million and $2.5 million at December 31, 2017 and 2016, respectively.
73
Deferred Leasing Costs
Direct leasing costs, primarily consisting of third-party leasing commissions, tenant inducements and legal costs are capitalized and amortized over the life of the related lease. Tenant inducement amortization is recorded as an offset to rental revenue and the amortization of other direct leasing costs is recorded in amortization expense.
Tenant inducement amortization was $18.7 million, $12.3 million and $7.6 million for the years ended December 31, 2017, 2016 and 2015, respectively, and was recorded as an offset to rental revenue. In addition, the Company recorded $4.6 million, $4.0 million and $2.5 million as amortization expense related to other direct leasing costs for the years ended December 31, 2017, 2016 and 2015, respectively.
Deferred Financing Costs
Deferred financing costs consist of direct costs incurred in obtaining debt financing (see Note 6 - Debt Financing). These fees are presented as a reduction to the related debt liability for permanent mortgages and presented as an asset for revolving credit arrangements. In total, deferred financing costs (net of amortization) were $6.5 million and $10.8 million as of December 31, 2017 and 2016. These costs are amortized into interest expense on a straight-line basis, which approximates the effective interest method, over the terms of the obligations. For the years ended December 31, 2017, 2016 and 2015, $4.7 million, $5.0 million and $6.0 million, were amortized into interest expense in the accompanying consolidated statement of operations, respectively.
Real Estate Loans Receivable
Real estate loans receivable are shown at cost, net of any applicable allowance for uncollectibility and net of deferred loan origination fees. The Company defers certain loan origination fees and amortizes them as an adjustment of yield over the term of the related real estate loan receivable. The related amortization of the deferred loan origination fees are recorded in other revenue in the accompanying consolidated statement of operations and comprehensive income (loss). An allowance for the uncollectible portion of the real estate loans receivable is determined based upon an analysis of the economic conditions in the area in which the property is located and credit quality indicators which include: borrower’s payment history, the financial condition of the borrower, and business conditions in the industry in which the borrower operates.
Additionally, a real estate loan receivable is considered to be impaired, when based upon current events, it is probable that we will be unable to collect all amounts due according to the existing contractual terms. If a real estate loan receivable is considered to be impaired, the amount of loss is calculated by comparing the recorded investment to the value determined by discounting the expected future cash flows at its effective interest rate or to the value of the underlying collateral if the real estate loan receivable is collateral dependent. Evaluating real estate loans receivable for potential impairment can require management to exercise significant judgment. No impairment was recorded for the years ended December 31, 2017, 2016 and 2015, respectively. Further, as of December 31, 2016, no allowances for uncollectibility have been recorded. As of December 31, 2017, the Company had no outstanding loan receivable balances.
Other Assets
Other assets included the following (in thousands):
December 31, 2017 | December 31, 2016 | |||||||
Prepaid expenses | 3,021 | 2,647 | ||||||
Deferred tax assets(1) | 26,670 | 11,259 | ||||||
Other(2) | 407 | 6,454 | ||||||
Other assets | $ | 30,098 | $ | 20,360 | ||||
(1) | The change in deferred tax assets is primarily due to a $13.1 million increase caused by the restructuring of certain of the Company’s Polish subsidiaries as a result of the recent tax law changes in Poland. |
(2) | Primarily consists of $6.3 million held by our escrow agent at Perspective Defense as of December 31, 2016. This amount was returned to the Company in January 2017. |
74
Revenue Recognition
Rental payments are generally paid by the tenants prior to the beginning of each month. As of December 31, 2017 and December 31, 2016, respectively, the Company recorded liabilities of $16.7 million and $27.3 million related to prepaid rental payments which were included in other liabilities in the accompanying consolidated balance sheets. The Company recognizes rental revenue on a straight-line basis over the life of the lease including rent holidays, if any. Straight-line rent receivable was $53.9 million and $89.4 million as of December 31, 2017 and December 31, 2016, respectively. Straight-line rent receivable consists of the difference between the tenants’ rents calculated on a straight-line basis from the date of acquisition or lease commencement over the remaining terms of the related leases and the tenants’ actual rents due under the lease agreements and is included in tenant and other receivables in the accompanying consolidated balance sheets. Revenues associated with operating expense recoveries are recognized in the period in which the expenses are incurred based upon the tenant lease provisions. Revenues relating to lease termination fees are recognized on a straight-line basis amortized from the time that a tenant’s right to occupy the leased space is modified through the end of the revised lease term.
Other revenues consist primarily of parking revenue, tenant reimbursements and interest on loans receivable. Parking revenue represents amounts generated from contractual and transient parking and is recognized in accordance with contractual terms or as services are rendered. Other revenues relating to tenant reimbursements are recognized in the period that the expense is incurred.
Income Taxes
The Company has elected to be treated as a REIT under the Internal Revenue Code of 1986, as amended (the “Code”). The Company’s management believes that it operates in such a manner as to qualify for treatment as a REIT and intends to operate in the foreseeable future in such a manner so that it will remain qualified as a REIT for federal income tax purposes. Accordingly, no provision has been made for U.S. federal income taxes for the years ended December 31, 2017, 2016 and 2015 in the accompanying consolidated financial statements. In 2017, 2016 and 2015, income tax expense recorded by the Company was primarily comprised of foreign income taxes related to the operation its international properties. The Company does not believe it has any uncertain tax positions or unrecognized tax benefits requiring disclosure.
On December 22, 2017, the U.S. government enacted the Tax Cuts and Jobs Act. The Tax Cuts and Jobs Act makes broad and complex changes to the Internal Revenue Code including, but not limited to, (1) reducing the top U.S. federal corporate income tax rate from 35% to 21%, (2) establishing a 20% deduction for ordinary REIT dividends (other than any portion that is a capital gain dividend or qualified dividend income, subject to complex limitations), (3) limiting the deductibility of business interest expenses, (4) allowing full expensing of certain qualifying property, (5) eliminating the corporate Alternative Minimum Tax (“AMT”) and changing how existing AMT credits can be realized, (6) limiting current net operating loss deductions and providing an indefinite carryforward and (7) limiting the deductibility of certain executive compensation. The Company’s evaluation of deferred taxes and the associated valuation allowance includes an estimate of the impact of the Tax Cuts and Jobs Act and was based on the best information available to the Company at the time.
Redemption of Common Stock
The Company complies with Financial Accounting Standards Board (“FASB”) ASC 480 “Distinguishing Liabilities from Equity” which requires, among other things, that financial instruments that represent a mandatory obligation of the Company to repurchase shares be classified as liabilities and reported at settlement value. When approved, the Company will reclassify such obligations from equity to an accrued liability based upon their respective settlement values. The Company has recorded liabilities of $11.7 million and $5.0 million in accounts payable and accrued expenses in the accompanying consolidated balance sheets as of December 31, 2017 and December 31, 2016, respectively, related to shares tendered for redemption and approved by the board of directors, but which were not redeemed until the subsequent month. Such amounts have been included in redemption of common shares in the accompanying consolidated statements of equity.
Per Share Data
Net income (loss) per common share is calculated by dividing the net income (loss) attributable to common stockholders for each period by the weighted average number of common shares outstanding during such period. Net income (loss) per common share on a basic and diluted basis is the same because the Company has no potentially dilutive common shares outstanding.
75
Immaterial Restatement
During the performance of the Company’s year end procedures on the consolidated financial statements included in this Annual Report on Form 10-K for the year ended December 31, 2017, management identified certain immaterial incorrect allocations of net income between the Company’s stockholders and noncontrolling interests pertaining to preferred equity securities of the Brindleyplace JV for the years ended December 31, 2016 and 2015. As a result, the prior period Consolidated Financial Statements and the Notes to the Consolidated Financial Statements included in this Annual Report on Form 10-K have been restated from the amounts previously reported to reflect the appropriate allocation of net income related to the Brindleyplace JV. The tables below show the effect of the immaterial restatement (in thousands).
December 31, 2016 | |||||||||
As Reported | Adjustment | As Corrected | |||||||
Consolidated Balance Sheets | |||||||||
Accumulated distributions in excess of earnings | $ | (843,900 | ) | $ | 22,400 | $ | (821,500 | ) | |
Total stockholders’ equity | $ | 1,463,634 | $ | 22,400 | $ | 1,486,034 | |||
Noncontrolling interests | $ | 44,601 | $ | (22,400 | ) | $ | 22,201 | ||
2016 | 2015 | ||||||||||||||||||
As Reported | Adjustment | As Corrected | As Reported | Adjustment | As Corrected | ||||||||||||||
Consolidated Statements of Operations and Comprehensive Income (Loss) | |||||||||||||||||||
Net (income) loss attributable to noncontrolling interests | $ | (6,177 | ) | $ | 3,614 | $ | (2,563 | ) | $ | (5,677 | ) | $ | 3,396 | $ | (2,281 | ) | |||
Net income (loss) attributable to common stockholders | $ | 151,050 | $ | 3,614 | $ | 154,664 | $ | (10,631 | ) | $ | 3,396 | $ | (7,235 | ) | |||||
Basic and diluted income (loss) per common share | $ | 0.55 | $ | 0.01 | $ | 0.56 | $ | (0.04 | ) | $ | 0.01 | $ | (0.03 | ) | |||||
Net comprehensive (income) loss attributable to noncontrolling interests | $ | (2,363 | ) | $ | 3,614 | $ | 1,251 | $ | (4,488 | ) | $ | 3,396 | $ | (1,092 | ) | ||||
Net comprehensive income (loss) attributable to common stockholders | $ | 114,217 | $ | 3,614 | $ | 117,831 | $ | (49,958 | ) | $ | 3,396 | $ | (46,562 | ) | |||||
Consolidated Statements of Equity | |||||||||||||||||||||||||||
Accumulated Distributions in excess of earnings (As Reported) | Adjustment | Accumulated Distributions in excess of earnings (As Corrected) | Total Stockholders’ Equity (As Reported) | Adjustment | Total Stockholders’ Equity (As Corrected) | Non- controlling Interests (As Reported) | Adjustment | Non- controlling Interests (As Corrected) | |||||||||||||||||||
Balance as of January 1, 2015 | $ | (627,203 | ) | $ | 15,390 | $ | (611,813 | ) | $ | 1,689,388 | $ | 15,390 | $ | 1,704,778 | $ | 46,709 | $ | (15,390 | ) | $ | 31,319 | ||||||
Net income (loss) | $ | (10,631 | ) | $ | 3,396 | $ | (7,235 | ) | $ | (10,631 | ) | $ | 3,396 | $ | (7,235 | ) | $ | 5,677 | $ | (3,396 | ) | $ | 2,281 | ||||
Balance as of December 31, 2015 | $ | (815,127 | ) | $ | 18,786 | $ | (796,341 | ) | $ | 1,498,795 | $ | 18,786 | $ | 1,517,581 | $ | 47,929 | $ | (18,786 | ) | $ | 29,143 | ||||||
Net income (loss) | $ | 151,050 | $ | 3,614 | $ | 154,664 | $ | 151,050 | $ | 3,614 | $ | 154,664 | $ | 6,177 | $ | (3,614 | ) | $ | 2,563 | ||||||||
Balance as of December 31, 2016 | $ | (843,900 | ) | $ | 22,400 | $ | (821,500 | ) | $ | 1,463,634 | $ | 22,400 | $ | 1,486,034 | $ | 44,601 | $ | (22,400 | ) | $ | 22,201 | ||||||
76
Recent Accounting Pronouncements
In May 2014, the FASB, issued ASU 2014-09 to provide guidance on recognizing revenue from contracts with customers (“ASC 606”). This ASU’s core objective is for an entity to recognize revenue based on the consideration it expects to receive in exchange for goods or services. The amendments also replace prior guidance regarding the recognition of revenue from sales of real estate, except for revenue from sales that are part of a sale-leaseback transaction. Subsequent to ASU 2014-09, the FASB has issued multiple ASUs clarifying multiple aspects of the new revenue recognition standard, which include the deferral of the effective date by one year, and additional guidance for partial sales of non-financial assets. These amendments are effective for fiscal years, and interim periods within those years, beginning after December 15, 2017, with retrospective or modified retrospective adoption.
Expanded quantitative and qualitative disclosures regarding revenue recognition will be required for contracts that are subject to this pronouncement. Rental income from leasing arrangements is specifically excluded from ASU 2014-09, and will be evaluated by the Company in its adoption of the lease accounting standard, ASU 2016-02 (described below). The Company has adopted ASC 606 using the modified retrospective approach effective January 1, 2018. The Company has identified its revenue streams and finalized its evaluation of the impact on our consolidated financial statements and internal accounting processes and determined that accounting for contracts for the sale of real estate will be the primary customer contracts under the scope of ASC 606. The Sale & Purchase Agreement for the sale of the Brindleyplace Project in February 2017 contained certain rent adjustments that the Company has determined do not constitute a separate performance obligation from the performance obligation of title transfer of the Brindleyplace Project. As such, the Company has performed an analysis of the estimated consideration related to the rent adjustments and expects to recognize the cumulative effect by increasing beginning retained earnings by approximately $2.3 million upon adoption in January 2018. In addition, the Company has evaluated controls around the implementation of this ASU and have concluded there will be no significant impact on our control structure.
In February 2016, the FASB issued ASU 2016-02 which will require companies that lease assets to recognize on the balance sheet the right-of-use assets and related lease liabilities. The accounting by companies that own the assets leased by the lessee (the lessor) will remain largely unchanged from current GAAP. The new standard requires a modified retrospective transition approach for all leases existing at, or entered into after, the date of initial application, with an option to use certain transition relief. The guidance is effective for public entities for fiscal years beginning after December 15, 2018 and interim periods within those fiscal years. Early adoption is permitted.
In January 2018, the FASB issued an exposure draft (“2018 Exposure Draft”) which, if adopted as written, would allow lessors a practical expedient by class of underlying assets to account for lease and non-lease components as a single lease component if certain criteria are met. The 2018 Exposure Draft also indicates that companies may be permitted to recognize a cumulative-effect adjustment to the opening balance of retained earnings in the period of adoption in lieu of the modified retrospective approach and provides other optional practical expedients.
The Company is in the process of evaluating the impact that the adoption of ASU 2016-02 will have on the Company’s consolidated financial statements relating to its lessor leases and other lessee leases, if any. Within our lessor leases, we are entitled to receive tenant reimbursements for operating expenses such as real estate taxes, insurance and common area maintenance. Currently upon adoption of this ASU, CAM reimbursement revenue will be accounted for in accordance with Topic 606. The Company has currently identified certain areas the Company believes may be impacted by the adoption of ASU 2016-02, which include:
• | The bifurcation of lease arrangements in which contractual amounts due are on a gross basis and the amount under contract is not allocated between rental and expense reimbursements, such as real estate taxes and insurance. This process would be based on the underlying fair values of these items. |
• | The Company has ground lease agreements in which the Company is the lessee for land underneath New City and the properties in the Poland Logistics Portfolio that the Company currently accounts for as operating leases. Upon adoption of ASU 2016-02, the Company will record any rights and obligations under these leases as an asset and liability at fair value in the Company’s consolidated balance sheets. |
• | Determination of costs to be capitalized associated with leases. ASU 2016-02 will limit the capitalization associated with certain costs to costs that are a direct result of obtaining a lease. |
In June 2016, the FASB issued ASU 2016-13 that requires the impairment of financial instruments to be based on expected credit losses. The new standard requires a modified retrospective transition approach using a cumulative effect adjustment to
77
retained earnings in the first reporting period for with the guidance is effective. These amendments are effective for fiscal years and interim periods within those years, beginning after December 15, 2019 and early adoption is permitted for years and interim periods within those years beginning after December 15, 2018. The Company is currently assessing the impact the adoption of this guidance will have on its financial statements.
In January 2017, the FASB issued ASU 2017-01 to clarify the definition of a business with the objective of adding guidance to assist entities with evaluating whether transactions should be accounted for as acquisitions (or disposals) of assets or businesses. The amendments in the ASU are effective for public entities for annual and interim periods in fiscal years beginning after December 15, 2017 and early adoption is permitted with prospective application. The Company adopted ASU 2017-01 as of January 1, 2018.
In February 2017, the FASB issued ASU No. 2017-05 to clarify that a financial asset is within the scope of Subtopic 610-20 if it meets the definition, as amended, of an in substance nonfinancial asset. If substantially all of the fair value of assets that are promised to a counterparty in a contract is concentrated in nonfinancial assets, then all of the financial assets promised to the counterparty are in substance nonfinancial assets within the scope of Subtopic 610-20, including a parent transferring control of a nonfinancial asset through a transfer of ownership interests of a consolidated subsidiary. The provisions of ASU No. 2017-05 are effective for the Company as of January 1, 2018. To date, the Company has not had any sales of in-substance nonfinancial assets.
3. INVESTMENT PROPERTY
Investment property consisted of the following amounts as of December 31, 2017 and December 31, 2016 (in thousands):
December 31, 2017 | December 31, 2016 | |||||||
Buildings and improvements | $ | 2,255,267 | $ | 2,612,274 | ||||
Less: accumulated depreciation | (237,767 | ) | (246,940 | ) | ||||
Buildings and improvements, net | 2,017,500 | 2,365,334 | ||||||
Land | 671,776 | 684,309 | ||||||
Investment property, net | $ | 2,689,276 | $ | 3,049,643 | ||||
Recent Dispositions of Real Estate Investments
The following table provides information regarding each of the properties sold during the years ended December 31, 2017, 2016, and 2015, including the acquisition/completed construction price, contract sales price, and the total gain on sale, net of disposition fees (in millions):
Property | Date Acquired/Completed | Acquisition Price/ Construction Cost | Date Sold | Sales Price | Gain on Sale | ||||||
Fifty South Sixth | 11/2010 | $185.0 | 12/2017 | $258.5 | $90.4 | ||||||
Hock Plaza | 9/2010 | $97.9 | 12/2017 | $141.9 | $58.7 | ||||||
Mercedes Benz Bank (1) | 2/2013 | $70.3 | 7/2017 | $133.2 | $75.4 | ||||||
Southpark | 10/2010 | $31.2 | 6/2017 | $41.1 | $16.3 | ||||||
Aviva Coral Gables | 4/2015 | $62.0 | 6/2017 | $100.0 | $39.2 | ||||||
The Brindleyplace Project (2) | 7/2010 | $282.5 | 2/2017 | $325.1 | $84.3 | ||||||
Komo Plaza | 12/2011 | $160.0 | 12/2016 | $276.0 | $127.3 | ||||||
17600 Gillette | 6/2010 | $20.4 | 12/2015 | $30.9 | $15.8 | ||||||
(1) | The acquisition price for Mercedes Benz Bank of approximately €51.9 million was converted to USD based on an exchange rate of $1.35 per EUR as of the transaction date. The sales price of approximately €117.0 million was converted to USD based on an exchange rate of $1.14 per EUR as of the transaction date. Additionally, the Company incurred a €11.3 million (approximately $12.9 million based on an exchange rate of $1.14 per EUR as of the transaction date) income tax |
78
provision related to the sale of this property, which was recorded in “Provision for income taxes related to the sale of real estate” in the consolidated statements of operations and comprehensive income (loss).
(2) | The acquisition price of the Brindleyplace Project of approximately £186.2 million was converted to USD based on an exchange rate of $1.52 per GBP as of the transaction date. The sales price of approximately £260.0 million was converted to USD based on an exchange rate of $1.25 per GBP as of the transaction date. |
As of December 31, 2017, the cost basis and accumulated amortization related to lease intangibles was as follows (in thousands):
Lease Intangibles | ||||||||||||
Out-of-Market Lease Assets | Out-of-Market Lease Liabilities | |||||||||||
In-Place Leases | ||||||||||||
Cost | $ | 662,854 | $ | 69,510 | $ | (108,043 | ) | |||||
Less: accumulated amortization | (283,774 | ) | (42,333 | ) | 38,477 | |||||||
Net | $ | 379,080 | $ | 27,177 | $ | (69,566 | ) | |||||
As of December 31, 2016, the cost basis and accumulated amortization related to lease intangibles was as follows (in thousands):
Lease Intangibles | ||||||||||||
Out-of-Market Lease Assets | Out-of-Market Lease Liabilities | |||||||||||
In-Place Leases | ||||||||||||
Cost | $ | 793,018 | $ | 96,912 | $ | (116,717 | ) | |||||
Less: accumulated amortization | (334,249 | ) | (49,606 | ) | 34,363 | |||||||
Net | $ | 458,769 | $ | 47,306 | $ | (82,354 | ) | |||||
Amortization expense of in-place leases was $70.8 million, $100.3 million and $115.7 million for the years ended December 31, 2017, 2016 and 2015, respectively. Amortization of out-of-market leases resulted in an increase to rental revenue of approximately $2.1 million for the year ended December 31, 2017 and a decrease to rental revenue of approximately $2.8 million and $2.8 million for the years ended December 31, 2016 and 2015, respectively.
Anticipated amortization of in-place leases and out-of-market leases, net, for each of the years ending December 31, 2018 through December 31, 2022 are as follows (in thousands):
In-Place Leases | Out-of-Market Leases, Net | |||||||
2018 | $ | 51,630 | $ | (2,079 | ) | |||
2019 | 42,137 | (3,327 | ) | |||||
2020 | 34,221 | (3,444 | ) | |||||
2021 | 23,349 | (1,062 | ) | |||||
2022 | 18,389 | (1,790 | ) | |||||
79
Leases
The Company has entered into non-cancelable lease agreements with tenants for space. As of December 31, 2017, the approximate fixed future minimum rentals for each of the years ending December 31, 2018 through 2022 and thereafter were as follows (in thousands):
Fixed Future Minimum Rentals | ||||
2018 | $ | 259,633 | ||
2019 | 245,429 | |||
2020 | 218,108 | |||
2021 | 175,865 | |||
2022 | 154,084 | |||
Thereafter | 648,848 | |||
Total | $ | 1,701,967 | ||
During the years ended December 31, 2017, 2016, and 2015, the Company did not earn more than 10% of its total rental revenue from any individual tenant, respectively.
4. RECENT ACQUISITIONS OF REAL ESTATE
For the year ended December 31, 2017, the Company did not have any acquisitions of new properties. For the year ended December 31, 2016, the Company did not have any acquisitions of new properties, but did acquire an additional phase of The Rim for $38.1 million. For the year ended December 31, 2015, the Company acquired the assets and assumed certain liabilities of four real estate operating properties located in the United States and internationally, for an aggregate net purchase price of $544.2 million, and also acquired additional phases of Simon Hegele Logistics and The Rim.
The amounts recognized for major assets acquired as of the acquisition date were determined by allocating the purchase price of each property acquired in 2016 and 2015 as follows (in thousands):
Property Name | Acquisition Date | Building and Improvements (1) | Land (1) | In-place Lease Intangibles (1) | Out-of- Market Lease Intangibles, Net (1) | Total (1) | ||||||||||||||||
The Rim (2) | 02/13/2014, 04/30/2015, 12/30/2015, and 12/20/2016 | $ | 153,082 | $ | 102,170 | $ | 59,450 | $ | (28,810 | ) | $ | 285,892 | ||||||||||
Simon Hegele Logistics (3) | 06/03/2014 & 01/07/2015 | $ | 56,428 | $ | 13,245 | $ | 9,154 | $ | 41 | $ | 78,868 | |||||||||||
The Summit | 03/04/2015 | $ | 217,974 | $ | 68,090 | $ | 45,360 | $ | (14,920 | ) | $ | 316,504 | ||||||||||
Harder Logistics Portfolio (4) | 04/01/2015 & 12/03/2015 | $ | 89,368 | $ | 16,362 | $ | 15,413 | $ | 5,392 | $ | 126,535 | |||||||||||
(1) | For acquisitions denominated in a foreign currency, amounts have been translated at a rate based on the exchange rate in effect on the acquisition date. |
(2) | In February 2014, the Company acquired The Rim retail center in San Antonio, Texas. In April 2015, December 2015, and December 2016, the Company acquired additional phases of the center. |
(3) | In June 2014, the Company acquired the Simon Hegele Logistics facility in Forchheim, Germany. In January 2015, the Company acquired the second phase of the facility. |
(4) | In April 2015, the Company acquired two logistics buildings in the Harder Logistics Portfolio located in Nuremberg and Karlsdorf, Germany. In December 2015, the Company acquired the second phase of the portfolio, which consisted of one logistics building located in Duisburg, Germany. |
80
The weighted average amortization period for the intangible assets and liabilities acquired in connection with the 2016 and 2015 acquisitions, as of the date of the acquisition, was as follows (in years):
In-Place Leases | Above-Market Lease Assets | Below-Market Lease Liabilities | ||||
2016 Acquisitions: | ||||||
The Rim (4th Phase) | 20.0 | 12.8 | 5.9 | |||
2015 Acquisitions: | ||||||
Simon Hegele Logistics (2nd Phase) | 11.3 | — | — | |||
The Summit | 5.1 | 3.0 | 5.6 | |||
Harder Logistics Portfolio (1st Phase) | 10.0 | 5.7 | — | |||
The Rim (2nd Phase) | 11.3 | 9.8 | 6.0 | |||
The Rim (3rd Phase) | 7.8 | 8.5 | 6.5 | |||
Harder Logistics Portfolio (2nd Phase) | 13.9 | 15.0 | — | |||
The table below includes the amounts of revenue and net income (loss) of the acquisitions completed during the year ended December 31, 2016, which are included in the Company’s consolidated results of operations for the year ended December 31, 2016 (in thousands):
For the Year Ended | ||||
2016 Acquisitions | December 31, 2016 | |||
The Rim (1) | Revenue | $ | 27,653 | |
Net income (loss) | $ | 4,898 | ||
(1) | Includes the total revenue and net income of The Rim retail center, including the phases of the center acquired in February 2014, April 2015 and December 2015. The fourth phase of the center was acquired in December 2016 and includes 96,742 square feet of net rentable area, which represents 9.4% of the total net rentable area of The Rim retail center. |
The following unaudited consolidated information is presented to give effect to current year acquisitions through December 31, 2016 as if the acquisitions occurred on January 1, 2015. This information excludes activity that is non-recurring and not representative of our future activity, primarily acquisition fees and expenses of $0.6 million and $19.3 million for the years ended December 31, 2016 and 2015, respectively. The information below is not necessarily indicative of what the actual results of operations would have been had we completed these transactions on January 1, 2016, nor does it purport to represent our future operations (amounts in thousands, except per share amounts):
For the Years Ended | ||||||||
December 31, | ||||||||
Pro Forma 2016 | Pro Forma 2015 | |||||||
Revenues | $ | 478,783 | $ | 477,778 | ||||
Net income (loss) | $ | 156,395 | $ | 11,853 | ||||
Basic and diluted income (loss) per common share | $ | 0.54 | $ | 0.02 | ||||
81
The table below includes the amounts of revenue and net income (loss) of the acquisitions completed during the year ended December 31, 2015, which are included in the Company’s consolidated results of operations for the year ended December 31, 2015 (in thousands):
For the Year Ended | ||||
2015 Acquisitions | December 31, 2015 | |||
Simon Hegele Logistics (1) | Revenue | $ | 5,336 | |
Net income (loss) | $ | 48 | ||
The Summit | Revenue | $ | 21,756 | |
Net income (loss) | $ | 439 | ||
Harder Logistics Portfolio (2) | Revenue | $ | 3,766 | |
Net income (loss) | $ | (8,762 | ) | |
The Rim (3) | Revenue | $ | 23,458 | |
Net income (loss) | $ | 2,853 | ||
(1) | Includes the total revenue and net income of the Simon Hegele Logistics facility, including the first phase of the facility acquired in June 2014. The second phase of the facility was acquired in January 2015 and includes 236,661 square feet of net rentable area, which represents 38.9% of the total net rentable area of the Simon Hegele Logistics facility. |
(2) | Includes the total revenue and net income of The Harder Logistics Portfolio, including the first phase of the portfolio acquired in April 2015. The second phase of the portfolio was acquired in December 2015 and includes 677,374 square feet of net rentable area, which represents 52.7% of the total net rentable area of the Harder Logistics Portfolio. |
(3) | Includes the total revenue and net income of The Rim retail center, including the first phase of the center acquired in February 2014. The second phase of the center was acquired in April 2015 and includes 259,316 square feet of net rentable area, which represents 27.8% of the total net rentable area of The Rim retail center. The third phase of the center was acquired in December 2015 and includes 28,901 square feet of net rentable area, which represents 3.1% of the total net rentable area of The Rim retail center. |
The following unaudited consolidated information is presented to give effect to 2015 acquisitions through December 31, 2015 as if the acquisitions occurred on January 1, 2014. This information excludes activity that is non-recurring and not representative of our future activity, primarily acquisition fees and expenses of $19.3 million and $47.5 million for the years ended December 31, 2015 and 2014, respectively. The information below is not necessarily indicative of what the actual results of operations would have been had we completed these transactions on January 1, 2014, nor does it purport to represent our future operations (amounts in thousands, except per share amounts):
For the Years Ended | ||||||||
December 31, | ||||||||
Pro Forma 2015 | Pro Forma 2014 | |||||||
Revenues | $ | 486,274 | $ | 491,187 | ||||
Net income (loss) | $ | 13,854 | $ | 58,514 | ||||
Basic and diluted income (loss) per common share | $ | 0.03 | $ | 0.20 | ||||
82
5. REAL ESTATE LOANS RECEIVABLE
Real estate loans receivable included the following at December 31, 2017 and 2016 (in thousands):
Property | Original Funding Date | Maturity Date | Interest Rate | Total Loan Commitment | Balance as of December 31, 2017 | Balance as of December 31, 2016 | ||||||||||||
Flagship Capital JV | ||||||||||||||||||
Randall’s | 7/28/2014 | 7/28/2018 | N/A | (1) | 10,939 | — | 8,953 | |||||||||||
Finesilver | 7/31/2014 | 10/31/2017 | N/A | (2) | 7,233 | — | 6,271 | |||||||||||
N/A | $ | 18,172 | $ | — | $ | 15,224 | ||||||||||||
(Origination)/Exit fees | — | 67 | ||||||||||||||||
Total Real Estate Loans Receivable | $ | — | $ | 15,291 | ||||||||||||||
(1) | In December 2017, the outstanding receivable balance of the loan was paid in full. |
(2) | In August 2017, the outstanding receivable balance of the loan was paid in full. |
83
6. DEBT FINANCING
As of December 31, 2017 and 2016, the Company had $1.8 billion and $2.2 billion of principal outstanding, respectively, with a weighted average years to maturity of 1.7 years and 2.4 years, respectively, and a weighted average interest rate of 2.8% and 2.4%, respectively. The following table describes the Company’s debt outstanding at December 31, 2017 and 2016 (in thousands, except percentages):
Description | Origination or Assumption Date | Maturity Date | Interest Rate Description | Interest Rate as of December 31, 2017 | Principal Outstanding at December 31, 2017 | Principal Outstanding at December 31, 2016 | |||||||||||
Secured Mortgage Debt | |||||||||||||||||
Brindleyplace Project | 7/1/2010 | 7/7/2017 | (1) | Variable | N/A | $ | — | $ | 149,343 | ||||||||
Fifty South Sixth | 11/4/2010 | 11/3/2018 | (1) | Variable | N/A | — | 125,000 | ||||||||||
Flagship Capital JV | 7/2/2014 | 7/2/2019 | Variable, subject to floor of 4.25% | N/A | — | 512 | |||||||||||
100 Brookes | 7/13/2012 | 1/31/2018 | (2) | Variable | 3.85 | % | 28,098 | 31,109 | |||||||||
Poland Logistics Portfolio | 8/2/2012 | 6/28/2019 | Variable, subject to interest rate cap | 2.00 | % | 71,183 | 64,294 | ||||||||||
Minneapolis Retail Center | 8/2/2012 | 8/10/2019 | Fixed | 3.50 | % | 65,500 | 65,500 | ||||||||||
825 Ann | 11/16/2012 | 11/20/2018 | Variable, subject to interest rate cap | 2.41 | % | 63,247 | 58,320 | ||||||||||
Mercedes Benz Bank | 2/7/2013 | 12/31/2019 | (1) | Variable, subject to interest rate cap | N/A | — | 35,041 | ||||||||||
465 Victoria | 2/28/2013 | 12/3/2018 | Variable, subject to interest rate cap | 3.02 | % | 41,528 | 38,293 | ||||||||||
New City | 3/28/2013 | 3/18/2018 | (3) | Variable, subject to interest rate cap | 2.30 | % | 80,831 | 73,612 | |||||||||
One Westferry Circus | 5/9/2013 | 5/5/2020 | Fixed | 3.30 | % | 64,757 | 59,213 | ||||||||||
The Campus at Playa Vista | 5/14/2013 | 12/1/2018 | Variable | 2.77 | % | 150,000 | 150,000 | ||||||||||
Perspective Defense | 6/21/2013 | 7/25/2019 | Variable, subject to interest rate cap | 2.17 | % | 83,853 | 73,612 | ||||||||||
Fiege Mega Centre | 10/18/2013 | 10/31/2018 | Variable, subject to interest rate cap | 1.37 | % | 26,898 | 23,924 | ||||||||||
55 M Street | 12/9/2013 | 12/9/2017 | (4) | Variable | N/A | — | 72,000 | ||||||||||
25 Cabot Square | 3/26/2014 | 3/26/2020 | Fixed | 3.50 | % | 166,951 | 152,658 | ||||||||||
Simon Hegele Logistics | 4/28/2014 | 6/15/2019 | Fixed | 1.90 | % | 41,904 | 37,167 | ||||||||||
818 Bourke | 10/31/2014 | 10/31/2019 | Variable, subject to interest rate cap | 2.46 | % | 65,562 | 62,254 | ||||||||||
The Summit | 3/4/2015 | 4/1/2022 | Variable | 2.92 | % | 170,000 | 170,000 | ||||||||||
Harder Logistics Portfolio | 4/1/2015 | 2/28/2021 | Variable, subject to interest rate cap | 0.95 | % | 81,068 | 72,275 | ||||||||||
Other Notes Payable | |||||||||||||||||
JPMorgan Chase Revolving Credit Facility | 4/13/2012 | 6/29/2019 | Variable | 3.07 | % | 99,000 | 119,000 | ||||||||||
JPMorgan Chase Revolving Credit Facility - Term Loan | 5/22/2013 | 6/29/2019 | Variable | 3.02 | % | 495,000 | 495,000 | ||||||||||
WaterWall Place Construction Loan | 6/29/2012 | 5/8/2018 | Variable | 2.95 | % | 44,897 | 44,897 | ||||||||||
Aviva Coral Gables JV Construction Loan | 5/10/2013 | 7/10/2017 | (1) | Variable | N/A | — | 42,693 | ||||||||||
Total Principal Outstanding | $ | 1,840,277 | $ | 2,215,717 | |||||||||||||
Unamortized Deferred Financing Fees | (5,324 | ) | (8,418 | ) | |||||||||||||
Notes Payable | $ | 1,834,953 | $ | 2,207,299 | |||||||||||||
(1) | The Company paid off the secured mortgage loan in full with proceeds from the sale of the property. |
(2) | In January 2018, the Company paid off the secured mortgage loan related to 100 Brookes in full. |
(3) | In March 2018, the loan was amended and the maturity date was extended to April 18, 2018. |
(4) | In September 2017, the Company paid off the secured mortgage loan related to 55 M Street in full. |
As of December 31, 2017, the variable rate debt has variable interest rates ranging from LIBOR, EURIBOR or the BBSY screen rate plus 0.65% to 2.50% per annum. Additionally, as of December 31, 2017, $401.9 million of our variable rate debt
84
was capped at strike rates ranging from 1.5% to 3.25%. See Note 7 — Derivative Instruments for more information regarding our interest rate contracts.
JP Morgan Chase Revolving Credit Facility
In April 2012, the Operating Partnership entered into a credit agreement (the “Credit Agreement”) with JPMorgan Chase Bank, N.A., as administrative agent for itself and various lenders named in the Credit Agreement. The Company refers to the Revolving Loan Commitment and Term Loan Commitment collectively as the “Revolving Credit Facility.” The borrowings under the Revolving Loan Commitment may be denominated in U.S. dollars, British pound sterling, Euros, Australian dollars or Canadian dollars with aggregate foreign currency commitments constituting up to $212.5 million of the maximum amount available under the Revolving Loan Commitment.
In June 2015, the Company entered into an amendment to its Revolving Credit Facility, which resulted in the following changes:
• | an increase in total commitments to $920.0 million, consisting of a $495.0 million increase to the term loan commitment (“Term Loan Commitment”) and a $425.0 million increase to the revolving loan commitment (“Revolving Loan Commitment”); |
• | the future ability to increase the maximum amount available to $1.25 billion, subject to the Company’s satisfaction of certain conditions; and |
• | extended the maturity date to June 29, 2019, subject to an additional one-year extension at the Company’s option and subject to the satisfaction of certain conditions. |
For the period from January 2017 through December 2017, the Company made draws of approximately $159.0 million and payments of $179.0 million under the Revolving Credit Facility through December 31, 2017. Additionally, from January 1, 2018 through March 30, 2018, the Company made draws of approximately $109.0 million under the Revolving Credit Facility resulting in an outstanding principal balance of $703.0 million as of March 30, 2018.
Financial Covenants
The Company's mortgage agreements and other loan documents for the debt described in the table above contain customary events of default, with corresponding grace periods, including payment defaults, cross-defaults to other agreements and bankruptcy-related defaults, and customary covenants, including limitations on liens and indebtedness and maintenance of certain financial ratios. In addition, the Company has executed customary recourse carve-out guarantees of certain obligations under its mortgage agreements and the other loan documents. The Company is not aware of any instances of noncompliance with financial covenants on any of its loans as of December 31, 2017.
Principal Payments on Debt
The Company is required to make the following principal payments on its outstanding notes payable for each of the years ending December 31, 2018 through December 31, 2022 and for the period thereafter. Amounts are in thousands:
Payments due by Year | ||||||||||||||||||||||||
2018 | 2019 | 2020 | 2021 | 2022 | Thereafter | |||||||||||||||||||
Principal payments | $ | 440,716 | (1) | $ | 919,311 | $ | 232,971 | $ | 77,279 | $ | 170,000 | $ | — | |||||||||||
(1) | In January 2018, the Company paid off the secured mortgage loan related to 100 Brookes in full. |
7. DERIVATIVE INSTRUMENTS
The Company has entered into several interest rate swap contracts and interest rate cap agreements as economic hedges against the variability of future interest rates on its variable interest rate borrowings. The Company’s interest rate swaps effectively fixed the interest rates on each of the loans to which they relate and the interest rate cap contracts have effectively limited the interest rate on the loans to which they relate. The Company has not designated any of these derivatives as hedges for accounting purposes. See Note 11 — Fair Value Measurements for additional information regarding the fair value of our interest rate contracts.
85
The Company has also entered into foreign currency forward contracts as economic hedges against the variability of foreign exchange rates on future international property sales. These forward contracts economically fix the currency exchange rate on the investment to which they relate. The Company did not designate any of these contracts as fair value or cash flow hedges for accounting purposes. See Note 11 — Fair Value Measurements for additional information regarding the fair value of our foreign currency forwards. In June 2017, the Company entered into an €80.0 million foreign currency forward contract with an effective date of June 27, 2017 and a trade date of July 10, 2017, in connection with the sale of the Mercedes Benz Bank from which the Company received proceeds in Euros. See Note 3 — Investment Property for additional information regarding the sale of the Mercedes Benz Bank.
The Company had only interest rate cap contracts active as of December 31, 2017. The table below provides additional information regarding these interest rate cap contracts (in thousands, except percentages).
Interest Rate Cap Contracts | |||||||||||||
Property | Effective Date | Expiration Date | Notional Amount (1) | Interest Rate Received | Pay Rate /Strike Rate | ||||||||
Poland Logistics Portfolio | June 30, 2017 | June 28, 2019 | $ | 63,894 | EURIBOR | 2.00 | % | ||||||
465 Victoria | February 29, 2016 | November 30, 2018 | $ | 20,764 | BBSW | 2.50 | % | ||||||
825 Ann | April 29, 2016 | November 20, 2018 | $ | 31,624 | BBSW | 3.25 | % | ||||||
New City | April 11, 2013 May 6, 2013 | March 16, 2018 | $ | 61,001 | EURIBOR | 2.50 | % | ||||||
Perspective Defense | July 25, 2013 | July 25, 2019 | $ | 83,853 | EURIBOR | 2.00 | % | ||||||
Fiege Mega Centre | October 18, 2013 | October 18, 2018 | $ | 26,897 | EURIBOR | 2.00 | % | ||||||
818 Bourke | October 27, 2017 | October 27, 2018 | $ | 32,781 | BBSW | 2.50 | % | ||||||
Harder Logistics Portfolio | March 31, 2015 | March 31, 2018 | $ | 36,173 | EURIBOR | 1.50 | % | ||||||
Harder Logistics Portfolio | December 2, 2015 | December 31, 2018 | $ | 44,926 | EURIBOR | 1.50 | % | ||||||
(1) | For notional amounts denominated in a foreign currency, amounts have been translated at a rate based on the exchange rate in effect on December 31, 2017. |
The table below presents the effects of the changes in fair value of our derivative instruments in the Company’s consolidated statements of operations and comprehensive income (loss) for the year ended December 31, 2017, 2016 and 2015 (in thousands):
Gain (Loss) on Derivative Instruments | ||||||||||||
Year Ended | ||||||||||||
December 31, 2017 | December 31, 2016 | December 31, 2015 | ||||||||||
Derivatives not designated as hedging instruments: | ||||||||||||
Interest rate swaps | $ | — | $ | — | $ | 2,661 | ||||||
Interest rate caps | (50 | ) | (689 | ) | (2,099 | ) | ||||||
Foreign currency forward contracts | (584 | ) | — | — | ||||||||
Total gain (loss) on derivatives | $ | (634 | ) | $ | (689 | ) | $ | 562 | ||||
8. DISTRIBUTIONS
The Company has declared distributions for the months of January 2015 through December 2017 at an amount equal to $0.0017808 per share, per day.
Additionally, on December 29, 2017, the Company declared a distribution to stockholders of $1.05 per share that was paid to all stockholders of record as of December 30, 2017 in two cash payments in January 2018. This distribution has been designated by the Company as a special distribution, which represents a return of a portion of the stockholders’ invested capital from sales of investment property and, as such, will reduce their remaining investment in the Company. The special distribution
86
represents a portion of the net proceeds received from the strategic sale of six assets during 2017. The special distribution is not subject to reinvestment pursuant to the Company’s dividend reinvestment plan.
The table below outlines the Company’s total distributions declared to stockholders and noncontrolling interests for the years ended December 31, 2017, 2016 and 2015, including the breakout between the distributions declared in cash and those reinvested pursuant to the Company’s distribution reinvestment plan (in thousands). The Company declared distributions to the Company’s stockholders as of daily record dates and aggregated and paid such distributions monthly.
Stockholders | Noncontrolling Interests | ||||||||||||||||
Distributions for the Years Ended | Cash Distributions | Distributions Reinvested | Total Declared | Total Declared | |||||||||||||
December 31, 2017 | $ | 375,851 | (1) | $ | 91,757 | $ | 467,608 | $ | 26,707 | (2) | |||||||
December 31, 2016 | $ | 85,820 | $ | 94,003 | $ | 179,823 | $ | 5,691 | |||||||||
December 31, 2015 | $ | 83,481 | $ | 93,812 | $ | 177,293 | $ | 4,221 | |||||||||
(1) | Includes $288.0 million related to the December 2017 special distribution described above. |
(2) | For the year ended December 31, 2017, distributions declared to the noncontrolling interests included a distribution totaling $21.0 million paid to the Company’s JV partner in the Aviva Coral Gables JV as a result of the sale of Aviva Coral Gables in June 2017. |
9. RELATED PARTY TRANSACTIONS
The table below outlines fees and expense reimbursements incurred that are payable by the Company to Hines and its affiliates for the years ended December 31, 2017, 2016 and 2015 and amounts unpaid as of December 31, 2017 and 2016 (in thousands):
Incurred During the Years Ended December 31, | Unpaid as of December 31, | |||||||||||||||||||
Type and Recipient | 2017 | 2016 | 2015 | 2017 | 2016 | |||||||||||||||
Issuer Costs- the Advisor | $ | 61 | $ | 41 | $ | 61 | 26 | 8 | ||||||||||||
Acquisition Fee (1)- the Advisor | $ | — | $ | 191 | $ | 8,797 | — | 191 | ||||||||||||
Asset Management Fee- the Advisor | $ | 37,949 | $ | 36,810 | $ | 35,725 | 2,430 | 8,922 | ||||||||||||
Disposition Fee- the Advisor | $ | 8,203 | $ | 3,024 | $ | 309 | 2,585 | 2,760 | ||||||||||||
Other (2) | $ | 7,331 | $ | 6,834 | $ | 6,768 | 1,952 | 1,644 | ||||||||||||
Property Management Fee- Hines | $ | 7,192 | $ | 7,564 | $ | 7,518 | 146 | (46 | ) | |||||||||||
Development/ Construction Management Fee- Hines | $ | 1,405 | $ | 757 | $ | 132 | 207 | 246 | ||||||||||||
Leasing Fee- Hines | $ | 2,658 | $ | 4,584 | $ | 4,446 | 2,129 | 3,455 | ||||||||||||
Expense Reimbursement- Hines (with respect to management and operations of the Company’s properties) | $ | 11,148 | $ | 11,835 | $ | 11,098 | 777 | 734 | ||||||||||||
Due to Affiliates | $ | 10,252 | $ | 17,914 | ||||||||||||||||
(1) | As described below, effective as of April 1, 2015, the Company, the Operating Partnership and the Advisor amended the Advisory Agreement in order to reduce the acquisition fee rate paid to the Advisor from 2.25% to 0.50%. |
(2) | Includes amounts the Advisor paid on behalf of the Company such as general and administrative expenses and acquisition-related expenses. These amounts are generally reimbursed to the Advisor during the month following the period in which they are incurred. |
87
@1377 Development
In June 2012, the Company entered into a $3.2 million mezzanine loan commitment plus accrued interest to provide construction financing to the @1377 development, which was developed by an affiliate of Hines. In June 2016, the borrower repaid the outstanding principal balance of the loan upon the sale of the property. See Note 1 — Organization for additional information concerning the @1377 development and the mezzanine loan.
The WaterWall Place JV
In December 2011, a wholly-owned subsidiary of the Operating Partnership entered into a Limited Partnership Agreement with an affiliate of Hines for the formation of the WaterWall Place JV, for the purpose of developing a residential/living project in Houston, Texas. Hines serves as the initial general partner and as the development partner and the subsidiary of the Operating Partnership is the initial limited partner. The Company has a 93% interest in this joint venture. An affiliate of Hines owns the remaining 7% interest in this joint venture.
The Aviva Coral Gables JV
In July 2012, a wholly-owned subsidiary of the Operating Partnership entered into a Limited Partnership Agreement with an affiliate of Hines for the formation of Hines Ponce & Bird Holdings LP, a Delaware limited liability company, for the purpose of developing a residential/living project in Miami, Florida. Hines served as the initial general partner and as the development partner and the subsidiary of the Operating Partnership was the initial limited partner. Hines owned a 17% interest in the joint venture and the Company owned the remaining 83% interest through its subsidiary. As compensation for providing development management services, Hines was paid a fee equal to 4% of the development project costs. In addition, subject to certain return thresholds being achieved, the Aviva Coral Gables JV agreement provided that Hines may receive certain incentive distributions in the event the residential/living project was liquidated. The project was completed in April 2015. In June 2017, the Aviva Coral Gables JV sold Aviva Coral Gables. See Note 3 — Investment Property for information regarding the sale.
Advisory Agreement
Pursuant to the Advisory Agreement, the Company is required to pay the following fees and expense reimbursements:
Acquisition Fee – Prior to April 2012, the Advisor received an acquisition fee equal to 2.0% of (i) the purchase price of each real estate investment the Company acquired or originated, including any debt attributable to such investments or the principal amounts of any loans originated directly by the Company and (ii) with respect to indirect investments through another entity, such entity’s pro rata share of the gross asset value of all real estate investments held by such entity. In March 2012, the Advisory Agreement was amended to increase the acquisition fee to 2.25% of these amounts. Effective as of April 1, 2015, the Advisory Agreement was further amended in order to reduce the acquisition fee paid to the Advisor from 2.25% to 0.50% of these amounts.
Asset Management Fee – The Advisor receives an asset management fee equal to 0.125% per month of the net equity capital invested by the Company in real estate investments as of the end of each month.
During the years ended December 31, 2017, 2016 and 2015, the Company incurred asset management fees of $37.9 million, $36.8 million and $35.7 million, respectively.
Disposition Fee – The Advisor or its affiliates also will be paid a disposition fee of 1.0% of the sales price of any real estate investments sold or 1.0% of the Company’s pro rata share of the sales price with respect to the Company’s indirect investments. The Company’s disposition fees related to the sales of wholly-owned properties are included in the Gain (loss) on sale of real estate investments in the Consolidated Statement of Operations and Comprehensive Income (loss). The disposition fee on the sale of @1377 in 2016 is included in Other Income (loss) on the Consolidated Statement of Operations and Comprehensive Income (loss), as the sale was made through the Company’s equity method investment.
Special OP Units – Hines Global REIT Associates Limited Partnership, an affiliate of Hines, owns the special units of the Operating Partnership (“Special OP Units”), which entitle them to receive distributions in an amount equal to 15% of distributions, including from sales of real estate investments, refinancings and other sources, but only after the Company’s stockholders have received, or are deemed to have received, in the aggregate, cumulative distributions equal to their invested capital plus an 8.0% cumulative, non-compounded annual pre-tax return on such invested capital.
88
At the sole discretion of the Advisor, the acquisition fees, asset management fees, debt financing fees and disposition fees are payable, in whole or in part, in cash or units of the Operating Partnership (“OP Units”). For the purposes of the payment of these fees, each OP Unit will be valued at the per-share offering price of the Company’s common stock in its most recent public offering less selling commissions and dealer manager fees. Upon the Advisor’s request, each OP unit can be repurchased for cash or can be converted into one share of the Company’s common stock. The decision to redeem each OP unit for cash or shares is at the Company’s option except in certain circumstances such as the Company’s decision to list its shares on a national securities exchange, a liquidation event or upon termination or nonrenewal of the Advisory Agreement for any reason other than by the Advisor. The Company will recognize the expense related to these OP Units as the related service is performed, as each OP Unit will be fully vested upon issuance.
The Company reimburses the Advisor for all expenses paid or incurred by the Advisor in connection with the services provided to the Company, subject to the limitation that the Company will not reimburse the Advisor for any amount by which its operating expenses (including the asset management fee) at the end of the four preceding fiscal quarters exceeds the greater of: (A) 2% of its average invested assets, or (B) 25% of its net income determined without reduction for any additions to reserves for depreciation, bad debts or other similar non-cash reserves and excluding any gain from the sale of the Company’s assets for that period. Notwithstanding the above, the Company may reimburse the Advisor for expenses in excess of this limitation if a majority of the independent directors determines that such excess expenses are justified.
The Company reimburses the Advisor for all issuer costs incurred by the Advisor on the Company’s behalf related to the Company’s distribution reinvestment plan offering and the Company’s prior public filings.
Property Management and Leasing Agreements
The Company pays Hines fees for the management and leasing of some of its properties. Property management fees are equal to a market-based percentage of the gross revenues of the properties managed by Hines or the amount of property management fees recoverable from tenants of the properties managed by Hines under their leases. In addition, if Hines provides leasing services with respect to a property, the Company will pay Hines leasing fees which are usual and customary for that type of property in that geographic area. The Company generally will be required to reimburse Hines for certain operating costs incurred in providing property management and leasing services pursuant to the property management and leasing agreements. Included in this reimbursement of operating costs will be the cost of personnel and overhead expenses related to such personnel located at the property as well as off-site personnel located in Hines’ headquarters and regional offices, to the extent the same relate to or support the performance of Hines’ duties under the agreement.
Hines may perform construction management services for the Company for both re-development activities and tenant construction. These fees are considered incremental to the construction effort and will be capitalized to the associated real estate project as incurred. Costs related to tenant construction will be depreciated over the estimated useful life. Costs related to redevelopment activities will be depreciated over the estimated useful life of the associated project. Leasing activities will generally be performed by Hines on the Company’s behalf. Leasing fees will be capitalized and amortized over the life of the related lease. Generally, as compensation for providing development management services, Hines will be paid a fee equal to 3% of the development project costs and as compensation for providing construction management services, an affiliate of Hines also will be paid a contractor’s fee of 5% of the total construction costs of the project.
10. NONCONTROLLING INTERESTS
The Brindleyplace JV issued Convertible Preferred Equity Certificates (“CPEC”) to Moorfield as a result of their contribution to the Brindleyplace JV. Each CPEC was convertible into one capital share of the Brindleyplace JV at any time. The Brindleyplace JV had the option to have the CPECs redeemed at any time prior to the earlier of the liquidation of the Brindleyplace Project or their expiration on July 7, 2059. If redeemed, they were required to be redeemed at a price of £1 per CPEC, plus any accrued and unpaid distributions thereon. In February 2017, all of the outstanding CPECs were redeemed upon the sale of the Brindleyplace Project.
In accordance with the partnership agreement that governs the Flagship Capital JV, distributions are declared and paid when the joint venture has available cash (all cash held by the joint venture less what is reasonably needed to reserve or satisfy cash needs) with respect to an investment made by the joint venture. The Flagship Capital JV declared distributions to the noncontrolling interest partner for the years ended December 31, 2017, 2016 and 2015 of $1.2 million, $1.2 million, and $0.2 million, respectively. See Note 1 — Organization for additional information regarding the Flagship Capital JV.
During the year ended December 31, 2015, the noncontrolling interest partner contributed $1.0 million to the Aviva Coral Gables JV, for the funding of the repayment of the construction loan to Hines. The Aviva Coral Gables JV declared
89
distributions to the noncontrolling interest partner for the years ended December 31, 2017, 2016, and 2015 of $21.2 million, $0.6 million, and $0.2 million, respectively. The distributions in the year ended December 31, 2017 include distributions declared as a result of the sale of Aviva Coral Gables in June 2017. See Note 1 — Organization for additional information regarding the Aviva Coral Gables JV.
The WaterWall Place JV declared distributions to the noncontrolling interest partner for the years ended December 31, 2017, 2016, and 2015 of $0.2 million, $0.3 million, and $0.3 million, respectively. See Note 1 — Organization for additional information regarding the WaterWall Place JV.
11. FAIR VALUE MEASUREMENTS
Fair values determined by Level 1 inputs utilize quoted prices (unadjusted) in active markets for identical assets or liabilities the Company has the ability to access. Fair values determined by Level 2 inputs utilize inputs other than quoted prices included in Level 1 that are observable for the asset or liability, either directly or indirectly. Level 2 inputs include quoted prices for similar assets and liabilities in active markets and inputs other than quoted prices observable for the asset or liability, such as interest rates and yield curves observable at commonly quoted intervals. Level 3 inputs are unobservable inputs for the asset or liability, and include situations where there is little, if any, market activity for the asset or liability. In instances in which the inputs used to measure fair value may fall into different levels of the fair value hierarchy, the level in the fair value hierarchy within which the fair value measurement in its entirety has been determined is based on the lowest level input significant to the fair value measurement in its entirety. The Company’s assessment of the significance of a particular input to the fair value measurement in its entirety requires judgment, and considers factors specific to the asset or liability.
Financial Instruments Measured on a Recurring Basis
As described in Note 7 – Derivative Instruments, the Company entered into several interest rate contracts as economic hedges against the variability of future interest rates on its variable interest rate borrowings. The valuation of these derivative instruments is determined based on assumptions that management believes market participants would use in pricing, using widely accepted valuation techniques including discounted cash flow analysis on the expected cash flows of each derivative. This analysis reflects the contractual terms of the derivatives, including the period to maturity, and uses observable market-based inputs, including interest rate curves and implied volatilities. The fair values of interest rate contracts have been determined using the market standard methodology of netting the discounted future fixed cash receipts (or payments) and the discounted expected variable cash payments (or receipts). The variable cash payments (or receipts) are based on an expectation of future interest rates (forward curves) derived from observable market interest rate curves.
Although the Company has determined the majority of the inputs used to value its interest rate contracts fall within Level 2 of the fair value hierarchy, the credit valuation adjustments associated with its derivatives utilize Level 3 inputs, such as estimates of current credit spreads to evaluate the likelihood of default by the Company and its counterparties, Commonwealth Bank of Australia, Crédit Agricole, SMBC Capital Markets, ING Capital Markets, and the Australia and New Zealand Banking Group Limited. In adjusting the fair values of its derivative contracts for the effect of nonperformance risk, the Company has considered the impact of netting and any applicable credit enhancements, such as collateral postings, thresholds and guarantees. However, as of December 31, 2017 and 2016, the Company has assessed the significance of the impact of the credit valuation adjustments on the overall valuation of its derivative positions and has determined that the credit valuation adjustments are not significant to the overall valuations of its derivatives. As a result, the Company has determined its derivative valuations are classified in Level 2 of the fair value hierarchy.
Additionally, as described in Note 7 — Derivative Instruments, the Company has entered into foreign currency forward contracts as economic hedges against the variability of foreign exchange rates. The valuation of these forward contracts is determined based on assumptions that management believes market participants would use in pricing, using widely accepted valuation techniques, including discounted cash flow analysis on the expected cash flows of each derivative. This analysis reflects the contractual terms of the derivatives, including the period to maturity, and uses observable market-based inputs, including currency exchange rate curves and implied volatilities. The Company has determined its foreign currency forward contracts valuations are classified in Level 2 of the fair value hierarchy, as they are based on observable inputs but are not traded in active markets.
90
Financial Instruments Fair Value Disclosures
As of December 31, 2017, the Company estimated that the fair value of its notes payable, which had a book value (excluding any unamortized discount or premium and deferred financing costs) of $1.8 billion, was $1.8 billion. As of December 31, 2016, the Company estimated that the fair value of its notes payable, which had a book value (excluding any unamortized discount or premium) of $2.2 billion, was $2.2 billion. Management has utilized available market information, such as interest rate and spread assumptions of notes payable with similar terms and remaining maturities, to estimate the amounts required to be disclosed. Although the Company has determined the majority of the inputs used to value its notes payable fall within Level 2 of the fair value hierarchy, the credit quality adjustments associated with its fair value of notes payable utilize Level 3 inputs. However, as of December 31, 2017 and 2016, the Company has assessed the significance of the impact of the credit quality adjustments on the overall valuations of its fair market value of notes payable and has determined that they are not significant. As a result, the Company has determined these financial instruments utilize Level 2 inputs. Since such amounts are estimates that are based on limited available market information for similar transactions, there can be no assurance that the disclosed values could be realized.
As of December 31, 2016, the Company estimated that the book values of its real estate loans receivable approximated their fair values. Management has utilized available market information, such as interest rate and spread assumptions of loans receivable with similar terms and remaining maturities, to estimate the amounts required to be disclosed. Although the Company has determined the majority of the inputs used to value its real estate notes receivable fall within Level 2 of the fair value hierarchy, the credit quality adjustments associated with its fair value of real estate notes receivable utilize Level 3 inputs. However, as of December 31, 2016, the Company has assessed the significance of the impact of the credit quality adjustments on the overall valuations of its fair market value of real estate notes receivable and has determined that they are not significant. As a result, the Company has determined these financial instruments utilize Level 2 inputs. Since such amounts are estimates that are based on limited available market information for similar transactions, there can be no assurance that the disclosed values could be realized. As of December 31, 2017, the Company had no outstanding real estate loans receivable.
Other financial instruments not measured at fair value on a recurring basis include cash and cash equivalents, restricted cash, tenant and other receivables, accounts payable and accrued expenses, other liabilities, due to affiliates and distributions payable. The carrying value of these items reasonably approximates their fair value based on their highly-liquid nature and/or short-term maturities. Due to the short-term nature of these instruments, Level 1 inputs are utilized to estimate the fair value of the cash and cash equivalents and restricted cash and Level 2 inputs are utilized to estimate the fair value of the remaining financial instruments.
Financial Instruments Measured on a Nonrecurring Basis
Certain long-lived assets are measured at fair value on a non-recurring basis. These assets are not measured at fair value on an ongoing basis, but are subject to fair value adjustments (i.e., impairments) in certain circumstances. The fair value methodologies used to measure long-lived assets are described in Note 2 — Summary of Significant Accounting Policies — Investment Property and Lease Intangibles. The inputs associated with the valuation of long-lived assets are generally included in Level 3 of the fair value hierarchy as discussed below.
Impairment of Investment Property
Investment properties are reviewed for impairment at each reporting period if events or changes in circumstances indicate that the carrying amount may not be recoverable. For the year ended December 31, 2017, the Company determined that one of its properties was impaired as a result of deteriorating market conditions.
91
The changes in assumptions resulted in the net book value of the assets exceeding the projected undiscounted cash flows for the property. As a result, the assets were written down to fair value. The following table summarizes activity for the Company’s assets measured at fair value, on a non-recurring basis, for the years ended December 31, 2017, 2016 and 2015 (in thousands).
Basis of Fair Value Measurements | ||||||||||||||||||||||
During the year ended | Description | Fair Value of Assets | Quoted Prices In Active Markets for Identical Items (Level 1) | Significant Other Observable Inputs (Level 2) | Significant Unobservable Inputs (Level 3) | Impairment Loss | ||||||||||||||||
December 31, 2017 | Investment property | $ | 25,700 | $ | — | $ | — | $ | 25,700 | $ | 7,124 | |||||||||||
December 31, 2016 | Investment property | $ | — | $ | — | $ | — | $ | — | $ | — | |||||||||||
December 31, 2015 | Investment property | $ | — | $ | — | $ | — | $ | — | $ | — | |||||||||||
The Company’s estimated fair value of the investment property was based on a comparison of recent market activity and discounted cash flow models, which include estimates of property-specific inflows and outflows over a specific holding period. Significant unobservable quantitative inputs used in determining the fair value of the investment property for the period ended December 31, 2017 include: a discount rate of 9.0%; a capitalization rate of 7.5%; stabilized occupancy rate of 92.5%; and a current market rental rate of $28.00 per square foot. These inputs are based on the location, type and nature of each property, current and anticipated market conditions, and management’s knowledge and expertise in real estate.
12. REPORTABLE SEGMENTS
The Company’s real estate investments are geographically diversified and management evaluates the operating performance of each at an individual investment level and considers each investment to be an operating segment. The Company has aggregated all of its operating segments into four reportable segments based on the location of the segment and the underlying asset class. Management has aggregated the Company’s investments that are not office properties in “other” based on the geographic location of the investment due to the Company’s ownership of interests in various different types of investments that do not stand alone as their own reportable segment.
• | Domestic office investments (9 investments) |
• | Domestic other investments (5 investments) |
• | International office investments (9 investments) |
• | International other investments (11 investments) |
The tables below provide additional information related to each of the Company’s segments, geographic location and a reconciliation to the Company’s net income (loss), as applicable. “Corporate-Level Accounts” includes amounts incurred by the corporate-level entities which are not allocated to any of the reportable segments (all amounts are in thousands, except for percentages):
Years Ended December 31, | |||||||||||||
2017 | 2016 | 2015 | |||||||||||
Total Revenue | |||||||||||||
Domestic office investments | $ | 173,949 | $ | 177,048 | $ | 168,962 | |||||||
Domestic other investments | 93,748 | 123,384 | 119,083 | ||||||||||
International office investments | 92,617 | 110,308 | 123,010 | ||||||||||
International other investments | 43,335 | 67,168 | 65,818 | ||||||||||
Total Revenue | $ | 403,649 | $ | 477,908 | $ | 476,873 | |||||||
92
For the years ended December 31, 2017, 2016 and 2015, the Company’s total revenue was attributable to the following countries:
Years Ended December 31, | |||||||||
2017 | 2016 | 2015 | |||||||
United States | 65 | % | 62 | % | 60 | % | |||
United Kingdom | 9 | % | 15 | % | 17 | % | |||
Australia | 9 | % | 7 | % | 8 | % | |||
Germany | 6 | % | 5 | % | 4 | % | |||
Poland | 6 | % | 5 | % | 5 | % | |||
Russia | 3 | % | 3 | % | 3 | % | |||
France | 2 | % | 3 | % | 3 | % | |||
For the years ended December 31, 2017, 2016 and 2015, the Company’s property revenues in excess of expenses by segment was as follows:
Years Ended December 31, | |||||||||||||
2017 | 2016 | 2015 | |||||||||||
Property revenues in excess of expenses (1) | |||||||||||||
Domestic office investments | $ | 108,638 | $ | 113,763 | $ | 107,116 | |||||||
Domestic other investments | 59,218 | 78,729 | 76,835 | ||||||||||
International office investments | 57,966 | 85,986 | 97,644 | ||||||||||
International other investments | 31,988 | 47,181 | 45,608 | ||||||||||
Total property revenues in excess of expenses | $ | 257,810 | $ | 325,659 | $ | 327,203 | |||||||
(1) | Revenues less property operating expenses, real property taxes and property management fees. |
For the years ended December 31, 2017 and 2016, the Company’s total assets by segment was as follows:
Years Ended December 31, | |||||||||
2017 | 2016 | ||||||||
Total Assets | |||||||||
Domestic office investments | $ | 1,146,312 | $ | 1,454,943 | |||||
Domestic other investments | 794,558 | 901,120 | |||||||
International office investments | 1,053,971 | 1,003,616 | |||||||
International other investments | 429,827 | 584,726 | |||||||
Corporate-level accounts | 301,529 | 44,027 | |||||||
Total Assets | $ | 3,726,197 | $ | 3,988,432 | |||||
93
For the years ended December 31, 2017 and 2016, the Company’s total assets were attributable to the following countries:
Years Ended December 31, | ||||||
2017 | 2016 | |||||
United States | 59 | % | 59 | % | ||
United Kingdom | 11 | % | 15 | % | ||
Australia | 9 | % | 8 | % | ||
Poland | 8 | % | 6 | % | ||
Russia | 2 | % | 2 | % | ||
France | 4 | % | 3 | % | ||
Germany | 7 | % | 7 | % | ||
For the years ended December 31, 2017, 2016 and 2015 the Company’s reconciliation to the Company’s property revenues in excess of expenses is as follows:
Years Ended December 31, | ||||||||||||
2017 | 2016 | 2015 | ||||||||||
Reconciliation to property revenues in excess of expenses | ||||||||||||
Net income (loss) | 375,607 | 157,227 | (4,954 | ) | ||||||||
Depreciation and amortization | 138,503 | 174,110 | 186,965 | |||||||||
Acquisition related expenses | 127 | 372 | 10,472 | |||||||||
Asset management and acquisition fees | 37,949 | 37,001 | 44,522 | |||||||||
General and administrative expenses | 9,250 | 11,149 | 8,597 | |||||||||
Impairment Losses | 7,124 | — | — | |||||||||
(Gain) loss on derivatives | 634 | 689 | (562 | ) | ||||||||
Equity in (earnings) losses of unconsolidated entity | — | (7,504 | ) | — | ||||||||
(Gain) loss on sale of real estate investments | (364,325 | ) | (127,294 | ) | (14,684 | ) | ||||||
Foreign currency (gains) losses | (10,046 | ) | 8,240 | 21,468 | ||||||||
Interest expense | 59,461 | 64,473 | 71,288 | |||||||||
Other (income) expenses | (680 | ) | (130 | ) | (427 | ) | ||||||
(Benefit) provision for income taxes | (8,705 | ) | 7,326 | 4,518 | ||||||||
Provision for income taxes related to the sale of real estate | 12,911 | — | — | |||||||||
Total property revenues in excess of expenses | $ | 257,810 | $ | 325,659 | $ | 327,203 | ||||||
13. SUPPLEMENTAL CASH FLOW DISCLOSURES
Supplemental cash flow disclosures for the years ended December 31, 2017, 2016, and 2015 (in thousands):
2017 | 2016 | 2015 | ||||||||||
Supplemental Disclosure of Cash Flow Information | ||||||||||||
Cash paid for interest | $ | 55,736 | $ | 59,612 | $ | 66,704 | ||||||
Cash paid for income taxes | $ | 7,292 | $ | 7,634 | $ | 6,696 | ||||||
Supplemental Schedule of Non-Cash Activities | ||||||||||||
Distributions declared and unpaid | $ | 303,131 | $ | 21,178 | $ | 19,837 | ||||||
Other receivables | $ | — | $ | — | $ | 5 | ||||||
Distributions reinvested | $ | 91,985 | $ | 94,071 | $ | 93,785 | ||||||
Shares tendered for redemption | $ | 11,695 | $ | 4,987 | $ | 5,245 | ||||||
Non-cash net liabilities acquired | $ | — | $ | 7,965 | $ | 10,516 | ||||||
Accrued additions to investment property | $ | 10,778 | $ | 2,602 | $ | 883 | ||||||
14. COMMITMENTS AND CONTINGENCIES
The Company may be subject to various legal proceedings and claims that arise in the ordinary course of business. These matters are generally covered by insurance. While the resolution of these matters cannot be predicted with certainty, management believes the final outcome of such matters will not have a material adverse effect on the Company’s consolidated financial statements.
94
15. QUARTERLY FINANCIAL DATA (UNAUDITED)
The following table presents selected unaudited quarterly financial data for each quarter during the years ended December 31, 2017 and 2016 (in thousands except per share amounts):
Quarters Ended | ||||||||||||||||
March 31, 2017 | June 30, 2017 | September 30, 2017 | December 31, 2017 | |||||||||||||
Revenues | $ | 106,366 | $ | 99,812 | $ | 100,360 | $ | 97,111 | ||||||||
Gain (loss) on sale of real estate investments | $ | 85,188 | $ | 55,416 | $ | 74,560 | $ | 149,161 | ||||||||
Net income (loss) | $ | 98,942 | $ | 67,150 | $ | 64,033 | $ | 145,482 | ||||||||
Net (income) loss attributable to noncontrolling interests | $ | (35,365 | ) | $ | (18,122 | ) | $ | 300 | $ | (1,470 | ) | |||||
Net income (loss) attributable to common stockholders | $ | 63,577 | $ | 49,028 | $ | 64,333 | $ | 144,012 | ||||||||
Income (loss) per common share, basic and diluted | $ | 0.23 | $ | 0.18 | $ | 0.23 | $ | 0.52 | ||||||||
Quarters Ended | ||||||||||||||||
March 31, 2016 | June 30, 2016 | September 30, 2016 | December 31, 2016 | |||||||||||||
Revenues | $ | 118,936 | $ | 121,637 | $ | 121,854 | $ | 115,481 | ||||||||
Gain (loss) on sale of real estate investments | $ | — | $ | — | $ | — | $ | 127,294 | ||||||||
Net income (loss) | $ | 6,476 | $ | 9,155 | $ | 12,368 | $ | 129,228 | ||||||||
Net (income) loss attributable to noncontrolling interests | $ | (685 | ) | $ | (745 | ) | $ | (597 | ) | $ | (536 | ) | ||||
Net income (loss) attributable to common stockholders | $ | 5,791 | $ | 8,410 | $ | 11,771 | $ | 128,692 | ||||||||
Income (loss) per common share, basic and diluted | $ | 0.02 | $ | 0.03 | $ | 0.04 | $ | 0.46 | ||||||||
Item 9. Changes in and Disagreements With Accountants on Accounting and Financial Disclosure
None.
Item 9A. Controls and Procedures
Disclosure Controls and Procedures
During the performance of our year end procedures on the consolidated financial statements to be included in our Annual Report on Form 10-K for the year ended December 31, 2017 (“Annual Report”), we identified a material weakness in certain internal controls over financial reporting pertaining to convertible preferred equity certificates (“CPECs”) of the Brindleyplace JV, a joint venture formed in 2010 to purchase a mixed-use property located in England (the “Property”). We owned 60% of the Brindleyplace JV and consolidated the joint venture for financial reporting purposes. Approximately 99% of the partners’ capital of the Brindleyplace JV was issued in the form of CPECs. The Brindleyplace JV sold the Property in February 2017 at a substantial gain and, as required by the joint venture agreement, redeemed the CPECs and distributed the remaining proceeds to the partners.
During the preparation of our Annual Report, we identified incorrect allocations of net income between our stockholders and the joint venture partner and incorrect classifications of certain redemptions as distributions pertaining to the CPECs of the Brindleyplace JV. These amounts primarily related to the sale of the Property and the redemption of the CPECs. We concluded
95
that since these items were not identified timely, they represent a material weakness in certain internal controls over financial reporting related to the CPECs of the Brindleyplace JV.
A material weakness is a deficiency, or a combination of deficiencies, in internal controls over financial reporting such that there is a reasonable possibility that a material misstatement of our annual or interim financial statements will not be prevented or detected on a timely basis. We believe this material weakness resulted from a deficiency in the design of our internal controls regarding the CPECs. Specifically, control activities were not designed to ensure that the income and distributions related to the CPEC structure, which were unique to our organizational structure, were properly reported in our consolidated financial statements on a timely basis. Since all CPECs were redeemed during 2017, the risks and related internal control associated with the material weakness noted above are no longer relevant and therefore no remediation was necessary.
In accordance with Exchange Act Rules 13a-15 and 15d-15, we carried out an evaluation, under the supervision and with the participation of management, including our Chief Executive Officer and Chief Financial Officer, of the effectiveness of our disclosure controls and procedures as of the end of the period covered by this report. Based on that evaluation, our Chief Executive Officer and Chief Financial Officer concluded that our disclosure controls and procedures were effective as of December 31, 2017, to provide reasonable assurance that information required to be disclosed in our reports filed or submitted under the Exchange Act is (i) recorded, processed, summarized and reported within the time periods specified in the Securities and Exchange Commission’s rules and forms, and (ii) accumulated and communicated to our management, including our Chief Executive Officer and Chief Financial Officer, as appropriate to allow timely decisions regarding required disclosure.
Management’s Report on Internal Control Over Financial Reporting
Our management is responsible for establishing and maintaining adequate internal controls over financial reporting. Our system of internal controls over financial reporting is designed to provide reasonable assurance regarding the reliability of financial reporting and the preparation of consolidated financial statements for external purposes in accordance with generally accepted accounting principles. Our internal controls over financial reporting includes those policies and procedures that:
(i) pertain to the maintenance of records that, in reasonable detail, accurately and fairly reflect the transactions and dispositions of our assets;
(ii) provide reasonable assurance that transactions are recorded as necessary to permit preparation of financial statements in accordance with generally accepted accounting principles, and that our receipts and expenditures are being made only in accordance with authorizations of our management and directors; and
(iii) provide reasonable assurance regarding prevention or timely detection of unauthorized acquisition, use or disposition of our assets that could have a material effect on the financial statements.
Because of its inherent limitations, internal controls over financial reporting may not prevent or detect misstatements. Also, projections of any evaluation of effectiveness to future periods are subject to the risk that controls may become inadequate because of changes in conditions, or that the degree of compliance with the policies or procedures may deteriorate.
Our management’s assessment of the effectiveness of our internal control system as of December 31, 2017 was based on the framework for effective internal control over financial reporting described in the 2013 Internal Control — Integrated Framework issued by the Committee of Sponsoring Organizations of the Treadway Commission (COSO). Based on our assessment, as of December 31, 2017, our system of internal control over financial reporting was effective at the reasonable assurance level.
This annual report does not include an attestation report of the Company’s independent registered public accounting firm regarding control over financial reporting. Management’s report was not subject to attestation by the company’s independent registered public accounting firm pursuant to Section 989G of the Dodd-Frank Wall Street and Consumer Protection Act, which exempts non-accelerated filers from the auditor attestation requirement of section 404 (b) of the Sarbanes-Oxley Act.
March 30, 2018
Change in Internal Controls
No changes have occurred in our internal controls over financial reporting (as defined in Rule 13a-15(f) of the Exchange Act) during the quarter ended December 31, 2017 that has materially affected, or is reasonably likely to materially affect, our internal controls over financial reporting.
96
Item 9B. Other Information
None.
PART III
97
Item 10. Directors, Executive Officers and Corporate Governance
As of the date of this report, our directors, their ages, their year first elected, their business experience and principal occupation, their directorships in public corporations and investment companies are as follows:
Name | Age | Year First Elected | Business Experience and Principal Occupation; Directorships in Public Corporations and Investment Companies | |||
Jeffrey C. Hines | 62 | 2008 | Mr. Hines joined Hines in 1982. He has served as the Chairman of our board of directors, and as Chairman of the managers of the general partner of our Advisor since December 2008. Mr. Hines has served as the Chairman of the board of directors of Hines Global Income Trust, Inc. (f/k/a/ Hines Global REIT II) ("Hines Global Income Trust") and Chairman of the managers of the general partner of Hines Global REIT II Advisors LP ("HGRIIALP"), the advisor to Hines Global Income Trust, since July 2013. Mr. Hines has also been the Chairman of the board of directors of Hines Real Estate Investment Trust, Inc. (“Hines REIT”), Chairman of the managers of the general partner of HALP Advisors Limited Partnership (“HALP”), the advisor to Hines REIT, and a member of the management board of the Hines US Core Office Fund LP (the “Core Fund”) since August 2003. He is also the co-owner and President and Chief Executive Officer of the general partner of Hines and is a member of Hines’ Executive Committee. Mr. Hines is responsible for overseeing all firm policies and procedures as well as day-to-day operations of Hines. He became President of the general partner of Hines in 1990 and Chief Executive Officer of the general partner of Hines in January 2008 and has overseen a major expansion of the firm’s personnel, financial resources, domestic and foreign market penetration, products and services. He has been a major participant in the development of the Hines domestic and international acquisition program and currently oversees a portfolio of $111 billion in assets under management. Mr. Hines graduated from Williams College with a B.A. in Economics and received his M.B.A. from Harvard Business School. We believe that Mr. Hines’ career, spanning more than 35 years in the commercial real estate industry, including his leadership of Hines, and the depth of his knowledge of Hines and its affiliates, qualifies him to serve on our board of directors. | |||
Colin P. Shepherd | 58 | 2012 | Mr. Shepherd joined Hines in 1982. Mr. Shepherd was elected to our board of directors in September 2012 and is currently Chairman of Hines’ Investments and Performance Committee and oversees the Investment Management and Research groups. He is a member of Hines’ Executive Committee and Investment Committee. He served as a Senior Vice President of Hines from June 1994 to April 2012, where he contributed to the development, acquisitions, operations, and transactions of more than 23 million square feet of commercial real estate in Los Angeles, Seattle, Salt Lake City, Orange County, San Diego, and Houston. He graduated from Massachusetts Institution of Technology with a B.S. in Civil Engineering and received his M.S. in Management from Massachusetts Institute of Technology. We believe that Mr. Shepherd’s significant experience in the commercial real estate industry, including his 35 year tenure at Hines and his vast knowledge of Hines’ financial and investment policies, qualifies him to serve on our board of directors. | |||
98
Name | Age | Year First Elected | Business Experience and Principal Occupation; Directorships in Public Corporations and Investment Companies | |||
Charles M. Baughn | 63 | 2008 | Mr. Baughn joined Hines in 1984. Mr. Baughn has served as a member of our board of directors and as a manager of the general partner of our Advisor since December 2008. In addition, Mr. Baughn has been a member of the board of directors of Hines REIT since April 2008 and as a manager of the general partner of HALP since August 2003. He served as Chief Executive Officer of Hines REIT and the general partner of HALP from August 2003 through April 1, 2008. Additionally, since July 2013, Mr. Baughn has served as a member of the board of directors of Hines Global Income Trust and as a member of the general partner of HGRIIALP. He has served as the Senior Managing Director and Chief Financial Officer of the general partner of Hines since 2012. In this role, he is responsible for overseeing Hines’ operating business including central services, balance-sheet related activities and bank and other debt financing. Previously, he also has served as an Executive Vice President and CEO-Capital Markets Group of the general partner of Hines from April 2001 through 2012 and, as such, was responsible for overseeing Hines’ capital markets group, which raises, places and manages equity and debt for Hines projects in the U.S. and internationally. Mr. Baughn is also a member of the Hines' Executive Committee and a director of Hines Securities, Inc. Until May 2015, Mr. Baughn also served as the Chief Executive Officer of our Dealer Manager. Mr. Baughn has also been a member of the management board of the Core Fund since 2003. During his tenure at Hines, he has contributed to the development or redevelopment of over 9 million square feet of office and special use facilities in the southwestern United States. He graduated from the New York State College of Ceramics at Alfred University with a B.A. and received his M.B.A. from the University of Colorado. Mr. Baughn holds Series 7, 24 and 63 securities licenses. We believe that Mr. Baughn’s experience in the commercial real estate industry during his more than 33 year career with Hines, including his familiarity with Hines’ financial and investment policies, qualifies him to serve on our board of directors. | |||
99
Name | Age | Year First Elected | Business Experience and Principal Occupation; Directorships in Public Corporations and Investment Companies | |||
Jack L. Farley | 53 | 2009 | Mr. Farley has served as an independent director since June 2009. Mr. Farley has served as the President and Chief Executive Officer of Apex Compressed Air Energy Storage LLC, since January 2011, the year the company was launched in order to develop, build, operate, and commercialize utility-scale compressed air energy storage assets. Prior to that he co-founded Liberty Green Renewables, LLC in June 2008 to pursue development, construction and operation of biomass-to-electricity generation projects in the Midwest and Southeast US. From 2003 to February 2008, Mr. Farley was Senior Vice President of Cinergy Corp., where he was responsible for the Power Trading and Marketing group. During his tenure, the group had approximately $30 billion of annual physical power sales and ranked in the top 15 in the US. Cinergy Corp. merged with Duke Energy (NYSE: DUK) in 2006. In October 2007, Fortis NV acquired Duke’s trading operations as a strategic enhancement to its nascent US banking activities. Prior to joining Cinergy/Duke, Mr. Farley was President of the West Region at Reliant Resources, Inc., where he managed a $1.1 billion portfolio of power generation assets, and was responsible for the development and construction of two combined-cycle gas turbine projects with a total investment of approximately $750 million. We believe that Mr. Farley’s extensive leadership experience and understanding of the requirements of managing a public company, acquired during his tenure at Cinergy Corp. and Duke Energy qualify him to serve on our board of directors. This experience along with Mr. Farley’s M.B.A. from The Wharton School and his involvement in the preparation of earnings statements and the compliance process for Sarbanes-Oxley requirements of public companies enable him to provide valuable insight to our board of directors and our Audit Committee, for which he serves as Chairman. | |||
100
Name | Age | Year First Elected | Business Experience and Principal Occupation; Directorships in Public Corporations and Investment Companies | |||
Thomas L. Mitchell | 57 | 2009 | Mr. Mitchell has served as an independent director since June 2009. Mr. Mitchell served as the Executive Vice President and Chief Financial Officer of Devon Energy Corporation (NYSE:DVN) from February 2014 to April 2017. Prior to February 2014, he served as the Executive Vice President and Chief Financial Officer of Midstates Petroleum Company, Inc. (NYSE: MPO), formerly Midstates Petroleum Company LLC, an exploration and production company, since 2011, and member of the Midstates board of directors from 2012 until January 2014. From 2006 to 2011, he was the Senior Vice President, Chief Financial Officer, Treasurer and Controller of Noble Corporation (NYSE: NE), a publicly-held offshore drilling contractor for the oil and gas industry. From 1997 to November 2006, Mr. Mitchell served as Vice President and Controller of Apache Corporation (NYSE, NASDAQ: APA), a publicly-held oil and gas exploration, development and production company. From 1996 to 1997, he served as Chief Accounting Officer and Controller of Apache, and from 1989 to 1996 he served Apache in various positions. Prior to joining Apache, Mr. Mitchell spent seven years at Arthur Andersen & Co., an independent public accounting firm, where he practiced as a Certified Public Accountant (currently inactive), managing clients in the oil and gas, banking, manufacturing and government contracting industries. Mr. Mitchell graduated with honors from Bob Jones University with a B.S. in Accounting. We believe Mr. Mitchell’s significant leadership experience at four public companies qualifies him to serve on our board of directors. In addition, through his previous experience in public accounting, Mr. Mitchell is able to provide valuable insight with respect to financial reporting processes and our system of internal controls. | |||
101
Name | Age | Year First Elected | Business Experience and Principal Occupation; Directorships in Public Corporations and Investment Companies | |||
John S. Moody | 69 | 2009 | Mr. Moody has served as an independent director since June 2009. Mr. Moody has been President of Parkside Capital, LLC in Houston since January 2006. Parkside Capital, LLC is the general partner and manager of Parkside Capital Land Fund, LTD., a Texas real estate private equity firm which invests in raw land in high growth markets in Texas. From January 2004 to December 2005, Mr. Moody was the President and Chief Executive Officer of HRO Asset Management, LLC, a real estate advisory business headquartered in New York City, where he oversaw the acquisition of $850 million of real estate assets. From September 2001 to December 2003, he was the President of Marsh & McLennan Real Estate Advisors, Inc., where he developed the real estate strategy for the Marsh & McLennan Companies, including directing the execution of all real estate leases, projects and transactions. Mr. Moody was also the President and Chief Executive Officer of Cornerstone Properties, Inc., a publicly-held equity REIT which acquired, developed and operated large scale Class A office buildings in major metropolitan markets throughout the U.S. During his tenure at Cornerstone, assets grew from $500 million to $4.8 billion. From 1991 to 1995, Mr. Moody was the President and Chief Executive Officer of Deutsche Bank Realty Advisors, Inc., where he oversaw a $2 billion equity and debt portfolio. Mr. Moody has been a member of the Board of Directors of Huron Consulting Group (NASDAQ: HURN), a publicly-held integrated strategic services provider since October 2005. Since September 2006, he has been a member of the Board of Directors of Potlatch Corporation (NYSE: PCH), a publicly-held REIT with approximately 1.6 million acres of forestland. He became the Vice Chairman of the Board of Directors of Potlatch in January 2009. Mr. Moody also has served as the Chairman of the board of directors of Four Corners Property Trust Inc. (NYSE: FCPT) since November 2015. Mr. Moody was a member of the Board of Directors and Chairman of the Compensation Committee of CRIIMI MAE, Inc., a publicly-held REIT, from January 2004 to January 2006. He was also a member of the Board of Directors and Chairman of the Compensation Committee of Keystone Property Trust, a publicly-held REIT, from 2001 to 2004. Mr. Moody graduated from Stanford University with a B.S. and received his J.D. with honors from the University of Texas. | |||
We believe that Mr. Moody’s significant experience in the commercial real estate industry qualifies him to serve as one of our directors. Drawing on this experience, Mr. Moody is able to provide valuable insight regarding our investment strategies, internal controls and financial risk exposures. In addition, through his experience serving on the boards of several public companies, Mr. Moody is well-versed in the requirements of serving on a public company board. | ||||||
102
Name | Age | Year First Elected | Business Experience and Principal Occupation; Directorships in Public Corporations and Investment Companies | |||
Peter Shaper | 52 | 2009 | Mr. Shaper has served as an independent director since June 2009. He has served as a director and member of the audit committee of HMS Income Fund, Inc. ("HMS") since May 2012. Mr. Shaper also has served as the Chairman and Chief Executive Officer of Greenwell Energy Solutions, an independent specialty chemical supplier to the upstream oil and gas industry, since 2012. Additionally, he is a founding partner of Genesis Park LP, a Houston-based private equity firm which was founded in 2000 and primarily focuses on buyouts, partnering strategies with public corporations and growth financing bringing each company capital, commercial execution capabilities and a depth of experience in mergers and acquisitions. Mr. Shaper also was the Chief Executive Officer of Harris CapRock Communications, Inc., a global provider of broadband communications to remote locations via satellite with revenues of over $300 million from 2002 through June 2011, when he resigned. From 1998 to 2000, Mr. Shaper was the president of Donnelley Marketing, a Division of First Data Corporation, where he was directly responsible for the turnaround and eventual sale of the $100 million revenue database marketing company to a strategic buyer. In 1996, Mr. Shaper helped found the Information Management Group, or IMG, as its Executive Vice President of Operations and Chief Financial Officer. IMG grew to over $600 million in revenue during Mr. Shaper’s tenure. Prior to joining IMG, Mr. Shaper was with a Dallas-based private equity firm, where he was responsible for investments in numerous technology-oriented companies, as well as assisting those companies with developing long-term strategies and financial structures. Mr. Shaper also has several years’ experience with the international consulting firm McKinsey & Company. Mr. Shaper graduated from Stanford University with a B.S. in industrial engineering and received his M.B.A. from Harvard Business School. We believe Mr. Shaper’s significant experience as a senior executive officer of sophisticated companies such as Greenwell Energy Solutions, Harris CapRock Communications, Genesis Park and Donnelley Marketing/First Data, as well as his experience founding and leading IMG, qualify him to serve on our board of directors. | |||
As of the date of this report, our executive officers, their ages and their experiences are as follows:
103
Name and Title | Age | Experience | ||
Sherri W. Schugart, President and Chief Executive Officer | 52 | Ms. Schugart joined Hines in 1995. In February 2016, Ms. Schugart was appointed as a member of Hines’ Executive Committee. Ms. Schugart has served as President and Chief Executive Officer for us and for the general partner of our Advisor since March 2013. Ms. Schugart has also served as President and Chief Executive Officer for Hines REIT, the general partner of HALP and the Core Fund, since March 2013. Ms. Schugart has also served as President and Chief Executive Officer for Hines Global Income Trust and the general partner of HGRIIALP since August 2013. Also since March 2013, Ms. Schugart has served as the President and Chief Executive Officer of HMS and HMS Adviser GP LLC (the “HMS GP”), the general partner of the adviser to HMS. Additionally, in February 2014, Ms. Schugart was appointed as the Chairperson of the board of directors of HMS. HMS is a public specialty finance company sponsored by Hines, which was formed in 2011 and intends to make debt and equity investments in companies with revenues generally between $10 million and $3 billion that operate in diverse industries. Prior to March 2013, Ms. Schugart had served as the Chief Operating Officer for us and the general partner of our Advisor and as the Chief Operating Officer of Hines REIT, the general partner of HALP and the Core Fund since November 2011. In these roles, Ms. Schugart was responsible for the execution of each entity’s business plan and oversight of day-to-day business operations, including issues related to portfolio strategy, asset management and all other operational and financial matters of each entity. Ms. Schugart also served as Chief Financial Officer for us and the general partner of our Advisor from inception in December 2008 through October 2011. Ms. Schugart also served as the Chief Financial Officer for Hines REIT and the general partner of HALP from August 2003 through October 2011 and as the Chief Financial Officer of the Core Fund from July 2004 through October 2011. In these roles, her responsibilities included oversight of financial and portfolio management, equity and debt financing activities, investor relations, accounting, financial reporting, compliance and administrative functions in the U.S. and internationally. She has also been a Senior Managing Director of the general partner of Hines since October 2007 and has served as a director of the Dealer Manager since August 2003. Prior to holding these positions, she was a Vice President in Hines Capital Markets Group raising equity and debt financing for various Hines investment vehicles in the U.S. and internationally. Ms. Schugart has been responsible for arranging and managing more than $10 billion in equity and debt for Hines’ public and private investment funds. Prior to joining Hines, Ms. Schugart spent eight years with Arthur Andersen LLP, where she served both public and private clients in the real estate, construction, finance and banking industries. She holds a Bachelor of Business Administration degree in Accounting from Southwest Texas State University. | ||
104
Name and Title | Age | Experience | ||
Ryan T. Sims, Chief Financial Officer and Secretary | 46 | Mr. Sims joined Hines in August 2003. Since November 2011, Mr. Sims has served as the Chief Financial Officer and Secretary for us and the general partner of our Advisor. Since November 2011, Mr. Sims has also served as the Chief Financial Officer and Secretary of Hines REIT, the general partner of HALP and the Core Fund. Also since 2011, Mr. Sims has served as the Chief Financial Officer and Secretary of HMS and of the general partner of the adviser to HMS. Since August 2013, Mr. Sims has served as the Chief Financial Officer and Secretary of Hines Global Income Trust and the general partner of HGRIIALP. In these roles, Mr. Sims is responsible for the oversight of financial operations, equity and debt financing activities, investor relations, accounting, financial reporting, tax, legal, compliance and administrative functions in the U.S. and internationally. From December 2008 until November 2011, Mr. Sims served as the Chief Accounting Officer for us and the general partner of our Advisor. From April 2008 until November 2011, Mr. Sims also served as the Chief Accounting Officer of Hines REIT, the general partner of HALP and the Core Fund. In these roles, he was responsible for the oversight of the accounting, financial reporting and SEC reporting functions, as well as the Sarbanes-Oxley compliance program in the U.S. and internationally. He was also responsible for establishing the companies’ accounting policies and ensuring compliance with those policies in the U.S. and internationally. He has also previously served as a Senior Controller for Hines REIT and the general partner of its advisor from August 2003 to April 2008 and the Core Fund from July 2004 to April 2008. Prior to joining Hines, Mr. Sims was a manager in the audit practice of Arthur Andersen LLP and Deloitte & Touche LLP, serving clients primarily in the real estate industry. He holds a Bachelor of Business Administration degree in Accounting from Baylor University and is a certified public accountant. | ||
David L. Steinbach, Chief Investment Officer | 41 | Mr. Steinbach joined Hines in 1999. Mr. Steinbach has served as the Chief Investment Officer for us and the general partner of our Advisor since July 2014. Mr. Steinbach has also served as the Chief Investment Officer for Hines Global Income Trust and the general partner of HGRIIALP since July 2014. In these roles, he is responsible for management of the real estate acquisition program in the U.S. and internationally. He has served as a Managing Director of the general partner of Hines since February 2011. He has been responsible for the acquisition of over $4 billion in assets for various Hines affiliates in the U.S. and internationally. Prior to this role he served in various roles in which he was responsible for acquisitions, asset management and property dispositions on behalf of Hines REIT, Hines Global Income Trust and the Core Fund, both in the U.S. and internationally. He graduated from Texas A&M University with a Bachelors and Masters in Business Administration. | ||
105
Name and Title | Age | Experience | ||
Kevin L. McMeans, Asset Management Officer | 53 | Mr. McMeans joined Hines in 1992. Since December 2008, Mr. McMeans has served as the Asset Management Officer for us and the general partner of our Advisor. Mr. McMeans has also served as the Asset Management Officer of Hines REIT and the general partner of HALP since April 2008. Mr. McMeans also has served as Asset Management Officer for Hines Global Income Trust and the general partner of HGRIIALP since August 2013. He also has served as the Asset Management Officer of the Core Fund since January 2005. Since February 2015, he has served as the Senior Managing Director of Investment Management of the general partner of Hines. Prior to February 2015, he also served as a Managing Director of Investment Management of the general partner of Hines. In these roles, he is responsible for overseeing the management of the various investment properties owned by each of the funds in the U.S. and internationally. He previously served as the Chief Financial Officer of Hines Corporate Properties, an investment venture established by Hines with a major U.S. pension fund, from 2001 through June 2004. In this role, Mr. McMeans was responsible for negotiating and closing debt financings, underwriting and evaluating new investments, negotiating and closing sale transactions and overseeing the administrative and financial reporting requirements of the venture and its investors. Before joining Hines, Mr. McMeans spent four and a half years at Deloitte & Touche LLP in the audit department. He graduated from Texas A&M University with a B.S. in Computer Science. | ||
J. Shea Morgenroth, Chief Accounting Officer and Treasurer | 42 | Mr. Morgenroth joined Hines in October 2003. Since November 2011, Mr. Morgenroth has served as the Chief Accounting Officer and Treasurer for us and the general partner of our Advisor. Mr. Morgenroth has also served as Chief Accounting Officer and Treasurer of Hines REIT and the general partner of HALP since November 2011. Mr. Morgenroth has also served as Chief Accounting Officer and Treasurer for Hines Global Income Trust and the general partner of HGRIIALP since August 2013. In these roles, Mr. Morgenroth is responsible for the oversight of the treasury, accounting, financial reporting and SEC reporting functions, as well as the Sarbanes-Oxley compliance program in the U.S. and internationally. Prior to his appointment, Mr. Morgenroth served as a Senior Controller for us and the general partner of our Advisor from December 2008 until November 2011 and for Hines REIT and the general partner of HALP from January 2008 until November 2011 and as a Controller for Hines REIT and HALP from October 2003 to January 2008. In these roles, he was responsible for the management of the accounting, financial reporting and SEC reporting functions. Prior to joining Hines, Mr. Morgenroth was a manager in the audit practice of Arthur Andersen LLP and Deloitte & Touche LLP, serving clients primarily in the real estate industry. He holds a Bachelor of Business Administration degree in Accounting from Texas A&M University and is a certified public accountant. | ||
Audit Committee
Our board of directors has determined that each member of our Audit Committee is independent within the meaning of the applicable requirements set forth in or promulgated under the Exchange Act, as well as in the NYSE rules. In addition, our board of directors has determined that Jack L. Farley is an “audit committee financial expert” within the meaning of the applicable rules promulgated by the SEC. Unless otherwise determined by the board of directors, no member of the committee may serve as a member of the Audit Committee of more than two other public companies.
106
Code of Business Conduct and Ethics
Our board of directors has adopted a Code of Business Conduct and Ethics, which is applicable to our directors and officers, including our principal executive officer, principal financial officer, principal accounting officer or controller and other persons performing similar functions, whether acting in their capacities as our officers or in their capacities as officers of our Advisor or its general partner. The Code of Business Conduct and Ethics covers topics including conflicts of interest, confidentiality of information, full and fair disclosure, reporting of violations and compliance with laws and regulations. Our Code of Business Conduct and Ethics is available, free of charge, on the Corporate Governance section of our website, www.hinessecurities.com/reits/hines-global-reit/corporate-governance/. You may also obtain a copy of this code by writing to: Hines Global REIT Investor Relations, 2800 Post Oak Boulevard, Suite 5000, Houston, Texas 77056-6118. Waivers from our Code of Business Conduct and Ethics are discouraged, but any waivers from the Code of Business Conduct and Ethics that relate to any executive officer or director must be approved by our Nominating and Corporate Governance Committee and will be posted on our website at www.hinessecurities.com/reits/hines-global-reit/corporate-governance/ within four business days of any such waiver.
Section 16(a) Beneficial Ownership Reporting Compliance
Section 16(a) of the Exchange Act requires our directors and executive officers to file initial reports of ownership, reports of changes in ownership and annual reports of ownership with the SEC. These persons are required by SEC regulations to furnish us with copies of all Section 16 forms that they file with the SEC. To our knowledge, there are no persons who beneficially own more than 10% of a registered class of our equity securities.
Based solely on our review of the copies of such forms received by us or written representations from certain reporting persons, we believe that in 2017 our directors and executive officers complied with all filing requirements under Section 16(a).
Item 11. Executive Compensation
Director Compensation
Our Compensation Committee designs our director compensation with the goals of attracting and retaining highly qualified individuals to serve as independent directors and to fairly compensate them for their time and efforts. Because of our unique attributes as an externally-managed REIT, service as an independent director on our board requires a substantial time commitment. The Compensation Committee balances these considerations with the principles that our independent director compensation program should be transparent and, in part, should align directors’ interests with those of our stockholders.
The following table sets forth information regarding compensation paid to or earned by our directors during 2017.
2017 Director Compensation
Name | Fees Earned or Paid in Cash | Aggregate Stock Awards (1)(2) | Option Awards | Non-Equity Incentive Plan Compensation | Change in Pension Value and Non-Qualified Deferred Compensation Earnings | All Other Compensation | Total Compensation |
Jack L. Farley | $118,429 | $30,000 | $— | $— | $— | $— | $148,429 |
Thomas L. Mitchell | $113,429 | $30,000 | $— | $— | $— | $— | $143,429 |
John S. Moody | $130,929 | $30,000 | $— | $— | $— | $— | $160,929 |
Peter Shaper | $107,429 | $30,000 | $— | $— | $— | $— | $137,429 |
Jeffery C. Hines, Colin P. Shepherd and Charles M. Baughn (3) | $— | $— | $— | $— | $— | $— | $— |
(1) | Each of Messrs. Farley, Mitchell, Moody and Shaper received 2,991.027 restricted common shares upon his re-election to our board of directors following our 2017 annual meeting. The shares were issued without registration |
107
under the Securities Act of 1933, as amended (the “Securities Act”), in reliance upon the exemption from registration contained in Section 4(a)(2) of the Securities Act for transactions not involving any public offering.
(2) | The value of common stock awards was calculated based on the estimated net asset value, or NAV of $10.03 per share as of December 31, 2016 which was the estimated NAV per share most recently determined by our board of directors prior to the September 5, 2017 grant date of the awards. |
(3) | Messrs. Hines, Shepherd and Baughn, who are employees of Hines, receive no compensation for serving as members of our board of directors. |
We paid our independent directors an annual fee of $40,000, and a fee of $2,000 for each meeting of the board (or any committee thereof) attended in person for the period from January 1, 2017 through September 4, 2017. Effective as of September 5, 2017, the annual fee to be paid to our independent directors increased to $50,000, and for the period from September 5, 2017 through December 31, 2017, we paid the annual fees to our independent directors at this new rate on a pro rata basis. We paid each of our independent directors a fee of $750 for each board or committee meeting attended via teleconference, regardless of its length. In the event that a committee meeting was held on the same day as a meeting of our board of directors, each independent director received $1,500 for each committee meeting attended in person on such day.
We paid the following annual retainers to the Chairpersons of our board committees for 2017:
• | $7,500 to the Chairperson of the Conflicts Committee; |
• | $10,000 to the Chairperson of the Audit Committee; |
• | $5,000 to the Chairperson of the Compensation Committee; and |
• | $5,000 to the Chairperson of the Nominating and Corporate Governance Committee. |
In addition to the annual retainers, we paid monthly retainers to the members of the Conflicts Committee for the three months ended March 31, 2017, of $7,500 to the Chairperson of the Conflicts Committee and $5,000 to the other members of the Conflicts Committee. The board discontinued the additional monthly retainers, effective April 1, 2017.
All directors are reimbursed by us for reasonable out-of-pocket expenses incurred in connection with attendance at board or committee meetings.
For the year ended December 31, 2016, each independent director reelected to the board (whether through a stockholder meeting or by directors to fill a vacancy on the board) was granted $25,000 in restricted shares on or about the date of election or reelection. Effective as of September 5, 2017, the amount of restricted shares to be granted to each independent director who is elected or reelected to the board increased to $30,000. These restricted shares will fully vest on the earlier to occur of: (i) the first anniversary of the applicable grant date, subject to the independent director serving continuously as an independent director through and until the first anniversary of the applicable grant date; (ii) the termination of service as an independent director due to the independent director’s death or disability; or (iii) a change in control of the Company, subject to the independent director serving continuously through and until the date of the change in control of the Company.
Executive Compensation
We have no employees. Our day-to-day management functions are performed by our Advisor and its affiliates. All of our executive officers are employed by and receive compensation from our Advisor or its affiliates, for all of their services to the Hines organization, including their service as our executive officers. The compensation received by our executive officers is not paid or determined by us, but rather by our Advisor or affiliates of our Advisor based on all the services provided by these individuals to the Hines organization, including us. As a result, we do not have and our compensation committee has not considered, a compensation policy or program for our executive officers and have not included a “Compensation Discussion and Analysis,” or “Compensation Committee Report” in this Annual Report on Form 10-K. Please see “Item 13. Certain Relationships and Related Transactions, and Director Independence” for a discussion of fees and expenses payable to our Advisor and its affiliates.
Compensation Committee Interlocks and Insider Participation
108
During 2017, our Compensation Committee consisted of Messrs. Farley, Mitchell, Moody and Shaper, our four independent directors. None of our executive officers served as a director or member of the compensation committee of an entity whose executive officers included a member of our board of directors or Compensation Committee.
109
Item 12. Security Ownership of Certain Beneficial Owners and Management and Related Stockholder Matters
Ownership
The following table shows, as of March 1, 2018, the amount of our common stock beneficially owned (unless otherwise indicated) by (1) any person who is known by us to be the beneficial owner of more than 5% of our outstanding common shares, (2) our directors, (3) our executive officers, and (4) all of our directors and executive officers as a group. Except as otherwise indicated, all shares are owned directly, and the owner of such shares has the sole voting and investment power with respect thereto.
Common Shares Beneficially Owned | (2) | |||||||
Name of Beneficial Owner (1) | Position | Number of Common Shares | Percentage of Class | |||||
Jeffrey C. Hines | Chairman of the Board of Directors | 1,111 | * (3) (4) | |||||
Colin P. Shepherd | Director | — | — | |||||
Charles M. Baughn | Director | 8,765 | * | |||||
Jack L. Farley | Independent Director | 8,804 | * | |||||
Thomas L. Mitchell | Independent Director | 8,081 | * | |||||
John S. Moody | Independent Director | 8,081 | * | |||||
Peter Shaper | Independent Director | 8,081 | * | |||||
Sherri W. Schugart | President and Chief Executive Officer | 2,222 | * | |||||
Ryan T. Sims | Chief Financial Officer and Secretary | 1,667 | * | |||||
David L. Steinbach | Chief Investment Officer | — | — | |||||
Kevin L. McMeans | Asset Management Officer | 1,667 | * | |||||
J. Shea Morgenroth | Chief Accounting Officer and Treasurer | 1,667 | * | |||||
All directors and executive officers as a group | 50,146 | * | ||||||
* Amount represents less than 1%
(1) | The address of each person listed is c/o Hines Global REIT, Inc., 2800 Post Oak Boulevard, Suite 5000, Houston, Texas 77056-6618. |
(2) | For purposes of this table, “beneficial ownership” is determined in accordance with Rule 13d-3 under the Exchange Act, pursuant to which a person is deemed to have “beneficial ownership” of shares of our stock that the person has the right to acquire within 60 days. For purposes of computing the percentage of outstanding shares of the Company’s stock held by each person or group of persons named in the table, any shares that such person or persons have the right to acquire within 60 days of March 1, 2018 are deemed to be outstanding, but are not deemed to be outstanding for the purpose of computing the percentage ownership of any other persons. |
(3) | Includes 1,111.111 common shares owned directly by Hines Global REIT Investor Limited Partnership. Mr. Hines is deemed to be the beneficial owner of the shares owned by Hines Global REIT Investor Limited Partnership. |
(4) | This amount does not include the (i) 21,111.111 partnership interests (the “OP Units”) in Hines Global REIT Properties LP (the “Operating Partnership”) and (ii) the special partnership interests (the “Special OP Units”) of the Operating Partnership owned by Hines Global REIT Associates Limited Partnership. Limited partners in the Operating Partnership may request repurchase of their OP Units for cash or, at our option, common shares on a one-for-one basis, beginning one year after such OP Units were issued. The holder of the Special OP Units is entitled to distributions from the Operating Partnership under certain circumstances. In addition, under the Advisory Agreement, if we are not advised by an entity affiliated with Hines, Hines or its affiliates may cause the Operating Partnership to purchase some or all of the Special OP Units or any other OP Units then held by such entities for cash (or in certain cases, a promissory note) or our shares as determined by the seller. Mr. Hines and Gerald D. Hines indirectly own and/or control Hines Global REIT Associates Limited Partnership. |
110
Item 13. Certain Relationships and Related Transactions, and Director Independence
Our Advisor
We do not have employees. Subject to the supervision of our board of directors, our day-to-day operations are conducted by our Advisor in accordance with the Advisory Agreement. Our Advisor is an affiliate of Hines and is wholly-owned, indirectly, by, or for the benefit of, the Chairman of our board of directors, Jeffrey C. Hines, and his father, Gerald D. Hines. All of our executive officers are employed by, and all of our executive officers actively participate in, the management of our Advisor and its affiliates. Jeffrey C. Hines serves as the Chairman of the Managers of the general partner of our Advisor and Charles M. Baughn serves as a Manager of the general partner of our Advisor.
Our executive officers have control and primary responsibility for the management decisions of our Advisor, including the selection of investment properties to be recommended to our board of directors, the negotiations for these investments, and the property management and leasing of properties we acquire directly. The Advisory Agreement was renewed as of December 27, 2017 and has a term ending December 31, 2018 that may be renewed for an unlimited number of successive periods (up to one year at a time) upon the mutual consent of the parties. Renewals of the agreement must be approved by the Conflicts Committee. The Advisory Agreement may be terminated:
• | immediately by us (i) in the event our Advisor commits fraud, criminal conduct, willful misconduct or negligent breach of fiduciary duty, (ii) upon the bankruptcy of our Advisor or its involvement in similar insolvency proceedings or (iii) in the event of a material breach of the Advisory Agreement by our Advisor that remains uncured after 10 days’ written notice; |
• | without cause or penalty by us or by our Advisor upon 60 days’ written notice; or |
• | immediately by our Advisor upon our bankruptcy or involvement in similar insolvency proceedings or any material breach of the Advisory Agreement by us that remains uncured after 10 days’ written notice. |
The Advisor and its affiliates receive compensation and are reimbursed for certain expenses in connection with services provided to us. These payments are summarized below. In the event the Advisory Agreement is terminated, our Advisor will be paid all earned, accrued and unpaid compensation and expense reimbursements within 30 days. Upon termination, we may also be obligated to purchase certain ownership interests owned by our Advisor or other affiliates of Hines under certain circumstances.
The following summarizes fees our Advisor earned under the Advisory Agreement during 2017:
• | Under the Advisory Agreement, we reimbursed our Advisor for all costs incurred by our Advisor or its affiliates in connection with our public offerings up to a limit (when combined with commissions and the Dealer Manager fee paid in connection with the offering of primary shares) of 15% of aggregate gross proceeds. Such costs consist of, among other costs, expenses of the Company’s organization, actual legal, accounting, bona fide out-of-pocket itemized and detailed due diligence costs, printing, filing fees, transfer agent costs, postage, escrow fees, data processing fees, advertising and sales literature and other offering-related costs. During 2014, we were engaged in our second public offering through April 2014 and thereafter, we continued to offer shares pursuant to our distribution reinvestment plan. We incurred approximately $61,000 for the year ended December 31, 2017 as reimbursement to our Advisor or its affiliates for issuer costs they incurred as a result of our public offerings. |
• | Under the Advisory Agreement we pay our Advisor an acquisition fee in connection with investments we make equal to 0.50% of (i) the purchase price of real estate investments we acquire directly, including any debt attributable to such investments or the principal amounts of any loans originated directly by us, or (ii) when we invest indirectly through another entity, our pro rata share of the gross asset value of real estate investments held by the entity through which we invest. Under the Advisory Agreement, we also reimburse our Advisor for certain acquisition expenses incurred in connection with the purchase of real estate investments. Our Advisor did not earn any acquisition fees during the year ended December 31, 2017. For the year ended December 31, 2017, we incurred $127,000 as reimbursement to our advisor for acquisition expenses our Advisor incurred on our behalf |
• | Under the Advisory Agreement, we pay our Advisor a monthly asset management fee equal to 0.125% of the net equity capital we have invested in real estate investments at the end of each month. The Advisor earned $37.9 million in asset management fees during the year ended December 31, 2017. |
111
• | Under the Advisory Agreement, we pay our Advisor a disposition fee equal to 1.0% of (i) the sales price of any real estate investments sold, held directly by us, or (ii) when we hold investments indirectly through another entity, our pro rata share of the sales price of the real estate investment sold by that entity. The Advisor earned $8.2 million in disposition fees during the year ended December 31, 2017 related to the sale of 6 of our properties. |
• | Likewise, under the Advisory Agreement, we may reimburse our Advisor and its affiliates for certain expenses they incur in connection with administrative and operating services they provide to us. Under our charter, we may not make reimbursements for administrative and operating expenses during any four consecutive fiscal quarters in excess of the greater of (i) 2.0% of our average invested assets or (ii) 25.0% of our net income. If our reimbursements to our Advisor for administrative and operating expenses exceed this limit, our Advisor will be required to disclose such fact to stockholders and may be required to refund such excess. In 2017, these limits were not exceeded. In 2017, our Advisor incurred $7.3 million in expenses, such as general and administrative expenses, on our behalf, which were reimbursed by the Company. See “Hines - Property Management Agreements” below for additional information concerning expense reimbursements to Hines. |
We also agreed to indemnify our Advisor against losses it incurs in connection with its performance of its obligations under the Advisory Agreement, subject to terms and conditions in the Advisory Agreement.
Hines Global REIT Associates Limited Partnership, an affiliate of Hines, as the holder of the Special OP Units in the Operating Partnership, will be entitled to receive distributions from the Operating Partnership in an amount equal to 15% of distributions, including from sales of real estate investments, refinancings and other sources, but only after our stockholders have received (or are deemed to have received), in the aggregate, cumulative distributions equal to their invested capital plus an 8.0% cumulative, non-compounded annual pre-tax return on such invested capital. The Special OP Units may be converted into OP Units that, at the election of the holder, will be repurchased for cash (or, in the case of (iii) below, a promissory note) or our shares, following: (i) the listing of our common stock on a national securities exchange, or (ii) a merger, consolidation or sale of substantially all of our assets or any similar transaction or any transaction pursuant to which a majority of our board of directors then in office are replaced or removed or (iii) the occurrence of certain events that result in the termination or non-renewal of the Advisory Agreement.
Hines
Property Management Agreements
Hines or its affiliates manage some of the properties in which we invest. When we acquire properties directly, we expect that we will pay Hines property management fees, leasing fees, tenant construction fees and other fees customarily paid to a property manager. Hines is wholly-owned by Jeffrey C. Hines and his father, Gerald D. Hines.
During the year ended December 31, 2017, Hines earned the following amounts pursuant to property management agreements under which Hines manages some of our properties:
• | $7.2 million in property management fees; |
• | $2.7 million in leasing commissions; and |
• | $11.1 million, for all costs Hines incurred in providing property management and leasing services pursuant to the property management and leasing agreements. Included in this reimbursement of operating costs are the cost of personnel and overhead expenses related to such personnel located at the property as well as off-site personnel located in Hines’ headquarters and regional offices, to the extent the same relate to or support the performance of Hines’ duties under the agreements. |
WaterWall Place
In December 2011, a wholly-owned subsidiary of the Operating Partnership entered into a Limited Partnership Agreement with an affiliate of Hines for the formation of Hines One WaterWall Holdings LP (the “WaterWall Place JV”), a Delaware limited liability company, for the purpose of developing a residential/living project in Houston, Texas. An affiliate of Hines serves as the initial general partner and as the development partner and the subsidiary of the Operating Partnership is the limited partner. Hines owns a 7% interest in the joint venture and we own the remaining 93% interest through our subsidiary. In addition, subject to certain return thresholds being achieved, the WaterWall Place JV agreement provides that Hines may
112
receive certain incentive distributions in the event the residential/living project is liquidated. Hines did not receive any incentive distributions as of December 31, 2017.
The Aviva Coral Gables JV
In July 2012, a wholly-owned subsidiary of the Operating Partnership entered into a Limited Partnership Agreement with an affiliate of Hines for the formation of Hines Ponce & Bird Holdings LP, a Delaware limited liability company, for the purpose of developing a residential/living project in Miami, Florida. Hines served as the initial general partner and as the development partner and the subsidiary of the Operating Partnership was the initial limited partner. Hines owned a 17% interest in the joint venture and we owned the remaining 83% interest through our subsidiary. As compensation for providing development management services, Hines was paid a fee equal to 4% of the development project costs. In addition, subject to certain return thresholds being achieved, the Aviva Coral Gables JV agreement provided that Hines may receive certain incentive distributions in the event the residential/living project was liquidated. The project was completed in April 2015. Hines received total distributions of $21.0 million from the Aviva Coral Gables JV in June 2017, which included a return of capital, preferred return distributions, and incentive distributions based on the return thresholds set forth in the Aviva Coral Gables JV agreement having been achieved. These distributions represented 37.3% of the total distributions made by the Aviva Coral Gables JV from the sale of the property.
@1377
In November 2011, a wholly-owned subsidiary of the Operating Partnership entered into a loan agreement with an affiliate of Hines to provide pre-construction financing for the development of a residential/living project in Atlanta, Georgia referred to as @1377. The project was completed in 2014 and sold on June 24, 2016. Subsequent to the initial loan being repaid, we provided a preferred equity investment in the project of $3.6 million, representing a 51.7% ownership interest in the project. @1377 was financed with a $23.3 million secured loan made by Cadence Bank, N.A., which was solely guaranteed by our joint venture partner, and a $3.2 million mezzanine loan commitment plus accrued interest made by us. The borrower repaid the outstanding principal balance of the loan upon the sale of the property. In addition, subject to certain return thresholds being achieved, the @1377 partnership agreement provided that Hines would receive certain incentive distributions. In connection with the sale of @1377, Hines received total distributions of $15.7 million from the @1377 partnership in June 2016, which included a return of capital, preferred return distributions, and incentive distributions based on the return thresholds set forth in the @1377 partnership agreement having been achieved. These distributions represented 58% of the total distributions from the @1377 partnership.
Ownership Interests
The Operating Partnership
We are the sole general partner of the Operating Partnership and owned a 99.99% interest in the Operating Partnership at December 31, 2017. Hines Global REIT Associates Limited Partnership, an affiliate of Jeffrey C. Hines, owned a 0.01% interest in the Operating Partnership at December 31, 2017. An affiliate of Jeffrey C. Hines also owns 1,111.111 shares of our common stock.
Policies and Procedures for Review of Related Party Transactions
Potential conflicts of interest exist among us, Hines, our Advisor and other affiliates of Hines in relation to our existing agreements and how we will operate. Currently, four of our seven directors are independent directors, and each of our independent directors serves on the Conflicts Committee of our board of directors. The Conflicts Committee reviews and approves all matters that our board of directors believes may involve conflicts of interest.
To reduce the effect on us of potential conflicts of interest described above, the Advisory Agreement and our charter include a number of restrictions relating to transactions we enter into with Hines and its affiliates. These restrictions include, among others, the following:
• | We will not accept goods or services from Hines or its affiliates unless a majority of our directors (including a majority of our independent directors) approves the transaction related thereto as fair and reasonable to us and on terms and conditions not less favorable than terms that would be available from unaffiliated third parties. |
• | We will not purchase or lease a property in which Hines or its affiliates has an interest without a determination by a majority of our directors (including a majority of our independent directors) not otherwise interested in the transaction |
113
determine that the transaction is fair and reasonable to us and at a price no greater than the cost to Hines or such affiliate for the property, unless:
• | there is substantial justification for any amount in excess of the cost to Hines; |
• | our disinterested directors determine the excess to be reasonable; and |
• | appropriate disclosure is made to the disinterested directors with respect to the transaction. |
• | The fair market value of any asset we acquire from Hines or one of its affiliates will be determined by an independent expert selected by our independent directors. We generally will not acquire property from Hines or its affiliates at a price that exceeds the appraised value of the property. The only exception will be in the case of a development, redevelopment or refurbishment project that we agree to acquire prior to completion of the project, when the appraised value will be based upon the completed value of the project. We will not sell or lease a property to Hines or its affiliates or to our directors unless a majority of our directors (including a majority of our independent directors) not otherwise interested in the transaction determines the transaction to be fair and reasonable to us. |
• | We will not enter into joint ventures with affiliates of Hines unless a majority of our directors (including a majority of our independent directors) not otherwise interested in the transaction approves the transaction as being fair and reasonable to us and determines that our investment is on terms substantially similar to the terms of third parties making comparable investments. |
• | We will not make any loan to Hines, its affiliates or to our directors, except in the case of loans to our subsidiaries and mortgage loans for property appraised by an independent expert. Any such loans must be approved by a majority of our directors (including a majority of our independent directors) not otherwise interested in the transaction as fair, competitive and commercially reasonable, and on terms no less favorable to us than loans between unaffiliated parties in the same circumstance. |
• | Hines and its affiliates will be entitled to reimbursement, at cost, for actual expenses incurred by them on behalf of us or joint ventures in which we are a joint venture partner, subject to the limitation on reimbursement of operating expenses to the extent that they exceed the greater of 2% of our average invested assets or 25% of our net income. |
The Conflicts Committee also must review and approve any transaction between us and our affiliates, on the one hand, and any director (including any independent director) or the director’s affiliates or related persons on the other hand. All related party transactions must be approved by a majority of the disinterested members of the board of directors.
Director Independence
Our board of directors has determined that each of our independent directors is independent within the meaning of the applicable (i) provisions set forth in our Charter, and (ii) requirements set forth in the Exchange Act and the applicable SEC rules, and (iii) although our shares are not listed on the New York Stock Exchange (the “NYSE”), under the independence rules set forth in the NYSE Listed Company Manual. Our board of directors follows the NYSE rules governing independence as part of its policy of maintaining strong corporate governance practices. To be considered independent under the NYSE rules, the board of directors must determine that a director does not have a material relationship with us and/or our consolidated subsidiaries (either directly or as a partner, stockholder or officer of an organization that has a relationship with any of those entities, including Hines and its affiliates). Under the NYSE rules, a director will not be independent if:
• | the director was employed by us within the last three years; |
• | an immediate family member of the director was employed by us as an executive officer within the last three years; |
• | the director, or an immediate family member of the director, received more than $120,000 during any 12-month period within the last three years in direct compensation from us, other than director and committee fees and pension or other forms of deferred compensation for prior service (provided such compensation is not contingent in any way on continued service); |
• | the director is a current partner or employee of a firm that is our internal or external auditor, the director has an immediate family member who is a current partner of such a firm, the director has an immediate family member who is a current employee of such a firm and personally works on our audit, or the director or an immediate family member |
114
was within the last three years a partner or employee of such a firm and personally worked on our audit within that time;
• | the director or an immediate family member is, or has been with the last three years, employed as an executive officer of another company where any of our present executive officers at the same time serves or served on that company’s compensation committee; or |
• | the director was an executive officer or an employee (or an immediate family member of the director was an executive officer) of a company that makes payments to, or receives payments from, us for property or services in an amount which, in any of the last three fiscal years, exceeded the greater of $1,000,000 or 2% of such other company’s consolidated gross revenues. |
Item 14. Principal Accounting Fees and Services
Deloitte & Touche LLP, the member firms of Deloitte Touche Tohmatsu, and their respective affiliates (collectively “Deloitte & Touche”) serve as our principal accounting firm. Deloitte & Touche audited our financial statements for the years ended December 31, 2017 and 2016. Deloitte & Touche reports directly to our Audit Committee.
Fees
Deloitte & Touche’s aggregate fees billed to us for the fiscal years ended December 31, 2017 and 2016 are as follows:
2017 | 2016 | |||||||
Audit Fees: | $ | 1,320,500 | $ | 1,253,500 | ||||
Audit-Related Fees (1): | $ | — | $ | — | ||||
Tax Fees: | $ | — | $ | — | ||||
All Other Fees: | $ | — | $ | — | ||||
Total Fees: | $ | 1,320,500 | $ | 1,253,500 | ||||
(1) These fees primarily relate to internal control attestation consultations, accounting consultations and other attestation services.
Pre-approval Policies and Procedures
Our Audit Committee has adopted a pre-approval policy requiring the Audit Committee to pre-approve all audit and permissible non-audit services to be performed by Deloitte & Touche. In determining whether or not to pre-approve services, the Audit Committee will consider whether the service is a permissible service under the rules and regulations promulgated by the SEC, and, if permissible, the potential effect of such services on the independence of Deloitte & Touche. All services performed for us in 2017 were pre-approved or ratified by our Audit Committee.
115
PART IV
Item 15. Exhibits, Financial Statement Schedules
(a)(1) Financial Statements
Hines Global REIT, Inc.
Consolidated Financial Statements — as of December 31, 2017 and 2016 and for the Years Ended December 31, 2017, 2016 and 2015
Report of Independent Registered Public Accounting Firm | |
Audited Consolidated Financial Statements | |
Consolidated Balance Sheets | |
Consolidated Statements of Operations and Comprehensive Income (Loss) | |
Consolidated Statements of Equity | |
Consolidated Statements of Cash Flows | |
Notes to Consolidated Financial Statements | |
(2) Financial Statement Schedules
Schedule II — Valuation and Qualifying Accounts is set forth beginning on page 105 hereof.
Schedule III — Real Estate Assets and Accumulated Depreciation is set forth beginning on page 106 hereof.
Schedule IV —Mortgage Loans on Real Estate is set forth beginning on page 109 hereof.
All other schedules for which provision is made in the applicable accounting regulations of the SEC are not required under the related instructions or are not applicable and therefore have been omitted.
(b) Exhibits
Reference is made to the Index beginning on page 111 for a list of all exhibits filed as a part of this report.
116
Hines Global REIT, Inc.
Schedule II — Valuation and Qualifying Accounts
Description | Balance at the Beginning of the Period | Charged to Costs and Expenses | Deductions (a) | Balance at the End of the Period | ||||||||||||
(amounts in thousands) | ||||||||||||||||
Allowance for Doubtful Accounts as of December 31, 2017 | $ | 2,508 | $ | 1,542 | $ | (256 | ) | $ | 3,794 | |||||||
Deferred Tax Asset Valuation Allowance as of December 31, 2017 | $ | 98 | $ | 8,809 | $ | (7,518 | ) | $ | 1,389 | |||||||
Allowance for Doubtful Accounts as of December 31, 2016 | $ | 1,666 | $ | 1,091 | $ | (249 | ) | $ | 2,508 | |||||||
Allowance for Doubtful Accounts as of December 31, 2015 | $ | 1,872 | $ | 558 | $ | (764 | ) | $ | 1,666 | |||||||
(a) | Write-offs of accounts receivable previously reserved. |
117
Schedule III — Real Estate Assets and Accumulated Depreciation
December 31, 2017
Initial Cost (b) | Gross Amount at Which Carried at 12/31/2017 | ||||||||||||||||||||||||||||||||||||||||||
Description (a) | Location | Encumbrances | Land | Buildings and Improvements | Total | Costs Capitalized Subsequent to Acquisition (c) | Land | Buildings and Improvements | Total (d) | Accumulated Depreciation (e) | Date of Construction | Date Acquired | |||||||||||||||||||||||||||||||
FM Logistic | Moscow, Russia | — | 5,320 | 51,588 | 56,908 | (29,252 | ) | 2,573 | 25,083 | 27,656 | (4,207 | ) | 1998 - 2004 | April - 11 | |||||||||||||||||||||||||||||
Gogolevsky 11 | Moscow, Russia | — | — | 85,126 | 85,126 | (42,102 | ) | — | 43,024 | 43,024 | (7,764 | ) | 1996 | August - 11 | |||||||||||||||||||||||||||||
250 Royall | Canton, Massachusetts | — | 8,910 | 22,860 | 31,770 | (10,695 | ) | 6,656 | 14,419 | 21,075 | — | 2005 | September - 11 | ||||||||||||||||||||||||||||||
Campus at Marlborough | Marlborough, Massachusetts | — | 23,790 | 54,230 | 78,020 | 2,142 | 23,310 | 56,852 | 80,162 | (8,697 | ) | 1999 | October - 11 | ||||||||||||||||||||||||||||||
9320 Excelsior | Hopkins, Minnesota | — | 2,730 | 51,110 | 53,840 | — | 2,730 | 51,110 | 53,840 | (7,684 | ) | 2010 | December - 11 | ||||||||||||||||||||||||||||||
WaterWall Place | Houston, Texas | 44,897 | 8,229 | 54,825 | 63,054 | 214 | 8,229 | 55,039 | 63,268 | (6,064 | ) | 2012 | December - 11 | ||||||||||||||||||||||||||||||
Poland Logistics Portfolio | Upper Silesia, Warsaw and Wroclaw, Poland | 71,183 | 25,893 | 97,627 | 123,520 | (5,554 | ) | 23,246 | 94,720 | 117,966 | (17,625 | ) | 1995 - 2009 | March - 12 & October - 12 | |||||||||||||||||||||||||||||
100 Brookes St. | Brisbane, Australia | 28,098 | 8,600 | 41,404 | 50,004 | (11,378 | ) | 6,603 | 32,023 | 38,626 | (4,359 | ) | 2008 | July - 12 | |||||||||||||||||||||||||||||
Minneapolis Retail Center | Minneapolis, Minnesota | 65,500 | 30,792 | 78,711 | 109,503 | 19,672 | 30,792 | 98,383 | 129,175 | (11,067 | ) | 1974 | August - 12 & December - 12 | ||||||||||||||||||||||||||||||
550 Terry Francois | San Francisco, California | — | 41,270 | 109,760 | 151,030 | 68 | 41,270 | 109,828 | 151,098 | (14,632 | ) | 2002 | August - 12 | ||||||||||||||||||||||||||||||
One Westferry Circus | London, England | 64,757 | — | 48,874 | 48,874 | (4,138 | ) | — | 44,736 | 44,736 | (5,448 | ) | 1992 | February - 13 | |||||||||||||||||||||||||||||
465 Victoria | Sydney, Australia | 41,528 | 26,566 | 48,788 | 75,354 | (15,209 | ) | 20,245 | 39,900 | 60,145 | (4,588 | ) | 1995 | February - 13 | |||||||||||||||||||||||||||||
Riverside Center | Boston, Massachusetts | — | 45,888 | 125,014 | 170,902 | 440 | 45,888 | 125,454 | 171,342 | (14,982 | ) | 2000 | March - 13 | ||||||||||||||||||||||||||||||
New City | Warsaw, Poland | 80,831 | — | 115,208 | 115,208 | (7,772 | ) | — | 107,436 | 107,436 | (8,424 | ) | 2010 | March - 13 | |||||||||||||||||||||||||||||
825 Ann | Brisbane, Australia | 63,247 | 20,669 | 83,802 | 104,471 | (25,394 | ) | 15,626 | 63,451 | 79,077 | (7,401 | ) | 2013 | April - 13 | |||||||||||||||||||||||||||||
The Campus at Playa Vista | Los Angeles, California | 150,000 | 41,160 | 125,567 | 166,727 | 79 | 41,160 | 125,646 | 166,806 | (14,813 | ) | 2009-2010 | May - 13 | ||||||||||||||||||||||||||||||
Perspective Defense | Paris, France | 83,853 | 29,039 | 109,704 | 138,743 | (9,026 | ) | 26,533 | 103,184 | 129,717 | (11,785 | ) | 2007 | June - 13 | |||||||||||||||||||||||||||||
The Markets at Town Center | Jacksonville, Florida | — | 52,130 | 76,067 | 128,197 | 18 | 52,130 | 76,085 | 128,215 | (8,452 | ) | 2009 | July - 13 | ||||||||||||||||||||||||||||||
The Avenue at Murfreesboro | Nashville, Tennessee | — | 54,940 | 71,990 | 126,930 | 1,212 | 54,940 | 73,202 | 128,142 | (7,916 | ) | 2007 | August - 13 | ||||||||||||||||||||||||||||||
2300 Main | Irvine, California | — | 3,570 | 27,940 | 31,510 | 24 | 3,570 | 27,964 | 31,534 | (3,033 | ) | 2002 | August - 13 | ||||||||||||||||||||||||||||||
Fiege Mega Centre | Erfurt, Germany | 26,898 | 10,107 | 36,005 | 46,112 | (5,551 | ) | 8,852 | 31,709 | 40,561 | (3,329 | ) | 1995 | October - 13 | |||||||||||||||||||||||||||||
55 M Street | Washington, D.C. | — | 24,810 | 85,277 | 110,087 | 678 | 24,810 | 85,955 | 110,765 | (8,772 | ) | 2009 | December - 13 | ||||||||||||||||||||||||||||||
The Rim | San Antonio, Texas | — | 102,170 | 150,321 | 252,491 | 3,570 | 102,170 | 153,891 | 256,061 | (12,174 | ) | 2006-2014 | February - 14, April - 15, December - 15, & December - 16 | ||||||||||||||||||||||||||||||
25 Cabot Square | London, England | 166,951 | — | 165,121 | 165,121 | 3,366 | — | 168,487 | 168,487 | (12,805 | ) | 1991 | March - 14 | ||||||||||||||||||||||||||||||
Simon Hegele Logistics | Forchheim, Germany | 41,904 | 13,245 | 56,428 | 69,673 | (5,285 | ) | 12,207 | 52,181 | 64,388 | (4,356 | ) | 2012-2014 | June - 14 & January - 15 | |||||||||||||||||||||||||||||
818 Bourke | Melbourne, Australia | 65,562 | 36,487 | 82,867 | 119,354 | (13,340 | ) | 32,009 | 74,005 | 106,014 | (5,908 | ) | 2008 | October - 14 | |||||||||||||||||||||||||||||
The Summit | Bellevue, Washington | 170,000 | 68,090 | 217,974 | 286,064 | 4,369 | 68,090 | 222,343 | 290,433 | (15,597 | ) | 2002, 2005 | March - 15 | ||||||||||||||||||||||||||||||
Harder Logistics Portfolio | Nuremberg, Karlsdorf, and Duisburg, Germany | 81,068 | 16,362 | 89,368 | 105,730 | 11,564 | 18,137 | 99,157 | 117,294 | (5,885 | ) | 2003, 2010, 2015 | April - 15 & December - 15 | ||||||||||||||||||||||||||||||
$ | 1,246,277 | $ | 700,767 | $ | 2,363,556 | $ | 3,064,323 | $ | (137,280 | ) | $ | 671,776 | $ | 2,255,267 | $ | 2,927,043 | $ | (237,767 | ) | ||||||||||||||||||||||||
118
(a) | Assets consist of quality office, mixed-use and retail properties, industrial/distribution facilities and residential/living development. |
(b) | Components of initial cost for properties acquired using a foreign currency were converted using the currency exchange rate as of the date of acquisition. |
(c) | Includes the effect of changes in the exchange rate between the date of acquisition and December 31, 2017 for properties that are denominated in a foreign currency. |
(d) | The aggregate cost for federal income tax purposes is $3.0 billion as of December 31, 2017. |
(e) | Real estate assets are depreciated or amortized using the straight-line method over the useful lives of the assets by class. The estimated useful lives for computing depreciation are generally 10 years for furniture and fixtures, 15-20 years for electrical and mechanical installations and 40 years for buildings. |
The changes in total real estate assets for the years ended December 31, (in thousands):
2017 | 2016 | 2015 | ||||||||||
Gross real estate assets | ||||||||||||
Balance, beginning of period | $ | 3,296,583 | $ | 3,468,188 | $ | 3,103,520 | ||||||
Additions during the period: | ||||||||||||
Acquisitions | — | 34,396 | 479,628 | |||||||||
Other additions | 58,628 | 20,154 | 10,905 | |||||||||
Disposals of fully-depreciated assets | (215 | ) | (132 | ) | (38 | ) | ||||||
Costs of real estate sold | (539,324 | ) | (135,519 | ) | (10,101 | ) | ||||||
Impairment losses | (10,731 | ) | — | — | ||||||||
Effect of changes in foreign currency exchange rates | 122,102 | (90,504 | ) | (115,726 | ) | |||||||
Balance, end of period | $ | 2,927,043 | $ | 3,296,583 | $ | 3,468,188 | ||||||
Accumulated Depreciation | ||||||||||||
Balance, beginning of period | $ | (246,940 | ) | $ | (200,311 | ) | $ | (138,821 | ) | |||
Depreciation | (63,056 | ) | (69,805 | ) | (68,722 | ) | ||||||
Effect of changes in foreign currency exchange rates | (10,363 | ) | 8,562 | 6,184 | ||||||||
Disposals of fully-depreciated assets | 215 | 132 | 38 | |||||||||
Impairment losses | 3,607 | — | — | |||||||||
Retirement or sales of assets | 78,770 | 14,482 | 1,010 | |||||||||
Balance, end of period | $ | (237,767 | ) | $ | (246,940 | ) | $ | (200,311 | ) | |||
119
Schedule IV — Mortgage Loans on Real Estate
December 31, 2017
(amounts in thousands)
Changes in mortgage loans on real estate are summarized below (in thousands):
2017 | 2016 | 2015 | ||||||||||
Balance at beginning of period | $ | 15,224 | $ | 55,408 | $ | 75,040 | ||||||
Additions during period: | ||||||||||||
New loans | — | — | — | |||||||||
Additional advances on existing loans | 2,296 | 6,073 | 13,183 | |||||||||
Interest income added to principal | — | 694 | 754 | |||||||||
Deductions during period: | ||||||||||||
Collection of principal | (7,178 | ) | (46,951 | ) | (33,569 | ) | ||||||
Sale of loan | (10,342 | ) | — | — | ||||||||
Balance at close of period | $ | — | $ | 15,224 | $ | 55,408 | ||||||
120
Item 16. Form 10-K Summary
None.
* * * * * *
121
INDEX TO EXHIBITS
Exhibit No. | Description | ||
3.1 | |||
3.2 | |||
3.3 | |||
3.4 | |||
4.1 | |||
10.1* | |||
21.1* | |||
23.1* | |||
31.1* | |||
31.2* | |||
32.1* | |||
99.1* | |||
99.2* | |||
99.3* | |||
99.4* | |||
99.5 | |||
101* | The following materials from Hines Global REIT, Inc.’s Annual Report on Form 10-K for the year ended December 31, 2017, filed on March 30, 2018, are formatted in XBRL (eXtensible Business Reporting Language): (i) Consolidated Balance Sheets, (ii) Consolidated Statements of Operations and Comprehensive Income (Loss), (iii) Statements of Equity, (iv) of Cash Flows, and (v) Notes to the Consolidated Financial Statements. | ||
* Filed herewith
122
SIGNATURES
Pursuant to the requirements of Section 13 or 15(d) of the Securities Exchange Act of 1934, the Registrant has duly caused this Report to be signed on its behalf by the undersigned, thereunto duly authorized representative.
HINES GLOBAL REIT, INC. (registrant) | ||
March 30, 2018 | By: | /s/ Sherri W. Schugart |
Sherri W. Schugart | ||
President and Chief Executive Officer | ||
Pursuant to the requirements of the Securities Exchange Act of 1934, this Report has been signed below by the following persons on behalf of the Registrant and in the capacities indicated on March 30, 2018.
Signature | Title | Date |
/s/ Jeffrey C. Hines | Chairman of the Board of Directors | March 30, 2018 |
Jeffrey C. Hines | ||
/s/ Sherri W. Schugart | President and Chief Executive Officer | March 30, 2018 |
Sherri W. Schugart | (Principal Executive Officer) | |
/s/ Ryan T. Sims | Chief Financial Officer and Secretary | March 30, 2018 |
Ryan T. Sims | (Principal Financial Officer) | |
/s/ J. Shea Morgenroth | Chief Accounting Officer and Treasurer | March 30, 2018 |
J. Shea Morgenroth | (Principal Accounting Officer) | |
/s/ Charles M. Baughn | Director | March 30, 2018 |
Charles M. Baughn | ||
/s/ Jack L. Farley | Director | March 30, 2018 |
Jack L. Farley | ||
/s/ Colin P. Shepherd | Director | March 30, 2018 |
Colin P. Shepherd | ||
/s/ Thomas L. Mitchell | Director | March 30, 2018 |
Thomas L. Mitchell | ||
/s/ John S. Moody | Director | March 30, 2018 |
John S. Moody | ||
/s/ Peter Shaper | Director | March 30, 2018 |
Peter Shaper | ||
123