Attached files
| file | filename |
|---|---|
| EX-10.6 - EX-10.6 - OSIRIS THERAPEUTICS, INC. | a2234906zex-10_6.htm |
| EX-32.1.1 - EX-32.1.1 - OSIRIS THERAPEUTICS, INC. | a2234906zex-32_11.htm |
| EX-31.2.1 - EX-31.2.1 - OSIRIS THERAPEUTICS, INC. | a2234906zex-31_21.htm |
| EX-31.1.1 - EX-31.1.1 - OSIRIS THERAPEUTICS, INC. | a2234906zex-31_11.htm |
| EX-23.1.1 - EX-23.1.1 - OSIRIS THERAPEUTICS, INC. | a2234906zex-23_11.htm |
| EX-21 - EX-21 - OSIRIS THERAPEUTICS, INC. | a2234906zex-21.htm |
| EX-10.9 - EX-10.9 - OSIRIS THERAPEUTICS, INC. | a2234906zex-10_9.htm |
| EX-10.5 - EX-10.5 - OSIRIS THERAPEUTICS, INC. | a2234906zex-10_5.htm |
| EX-3.2 - EX-3.2 - OSIRIS THERAPEUTICS, INC. | a2234906zex-3_2.htm |
Use these links to rapidly review the document
TABLE OF CONTENTS
CONSOLIDATED FINANCIAL STATEMENTS INDEX
UNITED STATES
SECURITIES AND EXCHANGE COMMISSION
Washington, D.C. 20549
Form 10-K
ý |
ANNUAL REPORT PURSUANT TO SECTION 13 OR 15(d) OF THE SECURITIES EXCHANGE ACT OF 1934: |
|
For the fiscal years ended December 31, 2015, December 31, 2016 and December 31, 2017 |
||
o |
TRANSITION REPORT PURSUANT TO SECTION 13 OR 15(d) OF THE SECURITIES EXCHANGE ACT OF 1934: |
|
For the transition period from to |
||
Commission file number 001-32966
Osiris Therapeutics, Inc.
(Exact name of registrant as specified in its charter)
| Maryland (State or other jurisdiction of incorporation or organization) |
71-0881115 (I.R.S. Employer Identification No.) |
|
7015 Albert Einstein Drive, Columbia, Maryland (Address of principal executive offices) |
21046-1707 (Zip Code) |
443-545-1800
(Registrant's telephone number, including area code)
Securities registered pursuant to Section 12(b) of the Act: None
Securities registered pursuant to Section 12(g) of the Act: Common Stock, $0.001 par value.
Indicate by check mark if the registrant is a well-known seasoned issuer, as defined in Rule 405 of the Securities Act. Yes o No ý
Indicate by check mark if the registrant is not required to file reports pursuant to Section 13 or Section 15(d) of the Act. Yes o No ý
Indicate by check mark whether the registrant (1) has filed all reports required to be filed by Section 13 or 15(d) of the Securities Exchange Act of 1934 during the preceding 12 months (or for such shorter period that the registrant was required to file such reports), and (2) has been subject to such filing requirements for the past 90 days. Yes o No ý
Indicate by check mark whether the registrant has submitted electronically and posted on its corporate Web site, if any, every Interactive Data File required to be submitted and posted pursuant to Rule 405 of Regulation S-T (§ 232.405 of this chapter) during the preceding 12 months (or for such shorter period that the registrant was required to submit and post such files). Yes o No ý
Indicate by check mark if disclosure of delinquent filers pursuant to Item 405 of Regulation S-K is not contained herein, and will not be contained, to the best of registrant's knowledge, in definitive proxy or information statements incorporated by reference in Part III of this Form 10-K or any amendment to this Form 10-K. o
Indicate by check mark whether the registrant is a large accelerated filer, an accelerated filer, a non-accelerated filer, a smaller reporting company, or an emerging growth company. See definitions of "large accelerated filer," "accelerated filer," "smaller reporting company," and "emerging growth company" in Rule 12b-2 of the Exchange Act. (Check one):
| Large accelerated filer o | Accelerated filer ý | Non-accelerated filer o (Do not check if a smaller reporting company) |
Smaller reporting company o Emerging reporting company o |
If an emerging growth company, indicate by check mark if the registrant has elected not to use the extended transition period for complying with any new or revised financial accounting standards provided pursuant to Section 13(a) of the Exchange Act. o
Indicate by check mark whether the registrant is a shell company (as defined in Rule 12b-2 of the Exchange Act). Yes o No ý
On June 30, 2017, the last business day of the registrant's most recently completed second fiscal quarter, the aggregate market value of voting Common Stock held by non-affiliates of the registrant, based upon the last sale price of the Common Stock reported on the Pink OTC Markets Inc. was approximately $105,750,650.
The number of shares of the registrant's Common Stock outstanding as of March 23, 2018 was 34,525,886.
Osiris Therapeutics, Inc. (the "Company") is filing this comprehensive Annual Report on Form 10-K for the fiscal years ended December 31, 2015, 2016 and 2017 (the "Comprehensive Form 10-K" or "this Form 10-K") as part of its efforts to become current in its filing obligations under the Securities Exchange Act of 1934, as amended (the "Exchange Act"). Although the Company has regularly made filings through Current Reports on Form 8-K when required or as it otherwise deemed appropriate, this Comprehensive Form 10-K is the Company's first annual periodic filing with the Securities and Exchange Commission (the "SEC") since the filing of the Amendment to its Annual Report on Form 10-K (the "2014 Form 10-K/A") for the year ended December 31, 2014 on March 27, 2017. Included in this Comprehensive Form 10-K are the Company's audited financial statements for the fiscal years ended December 31, 2015, 2016 and 2017 and the Company's unaudited financial statements for the quarterly periods ended March 31, 2016, June 30, 2016, September 30, 2016, March 31, 2017, June 30, 2017 and September 30, 2017, none of which have been previously filed with the SEC. In addition, the Comprehensive Form 10-K also includes restated 2015 interim financial statements in Note 15 (Selected Quarterly Data (Unaudited)) to the Company's financial statements included in Part II, Item 8 of this Form 10-K. The Company previously restated certain financial information included in its Quarterly Reports on Form 10-Q for the quarters ended March 31, 2015 and June 30, 2015 in its Quarterly Report on Form 10-Q for the quarter ended September 30, 2015, and this Comprehensive Form 10-K further restates the restated financial information for the quarters ended March 31, 2015 and June 30, 2015. The corrections contained in these unaudited quarterly restated financial statements, which we refer to herein as the "2015 Interim Period Restatement," were prepared following an independent review by the Audit Committee (the "Audit Committee") of the Company's Board of Directors (the "Board") into certain accounting matters, which is further described herein. The Company refers to the 2015 Interim Period Restatement and the restatement of its 2014 financial statements included in the 2014 Form 10-K/A as the "Restatement."
We have not amended, and do not intend to amend, our Quarterly Reports on Form 10-Q for the quarters ended March 31, 2015, June 30, 2015 and September 30, 2015. We also do not intend to file separate Annual Reports on Form 10-K for the years ended December 31, 2015 and December 31, 2016 or our Quarterly Reports on Form 10-Q for the 2016 and 2017 interim periods.
The 2015 Interim Period Restatement
As previously described in the Company's 2014 Form 10-K/A, the Audit Committee, in consultation with management, concluded that the Company's unaudited interim financial statements previously issued in the Company's Quarterly Reports on Form 10-Q for the quarters ended March 31, 2015, June 30, 2015 and September 30, 2015 should not be relied upon due to errors identified in such financial statements. As described in more detail in Note 15 (Selected Quarterly Data (Unaudited)) to the Company's financial statements included in Part II, Item 8 of this Form 10-K, in the aggregate, the 2015 Interim Period Restatement decreased revenue and net income for the nine-month period ended September 30, 2015 by approximately $12.4 million and approximately $18.4 million, respectively.
Internal Control Over Financial Reporting
The Company identified material weaknesses in its internal control over financial reporting as of December 31, 2017. As a result of the material weaknesses, management concluded that the Company's internal control over financial reporting was not effective as of December 31, 2017. The Company has implemented and continues to implement measures to remediate these material weaknesses. See Part II, Item 9A, "Controls and Procedures" of this Form 10-K for more information about the material weaknesses and our remediation activities.
ii
OSIRIS THERAPEUTICS, INC.
Annual Report on Form 10-K
Fiscal Years Ended December 31, 2015, December 31, 2016 and December 31, 2017
iii
CAUTIONARY STATEMENTS ABOUT FORWARD-LOOKING INFORMATION
This Form 10-K includes "forward-looking statements" within the meaning of Section 21E of the Exchange Act. Statements included or incorporated herein which are not historical facts are forward looking statements. When used in this Form 10-K, the words "estimates," "expects," "anticipates," "projects," "plans," "intends," "believes," "forecasts," "will" and variations of such words or similar expressions are intended to identify forward-looking statements, but these terms are not the exclusive means of identifying forward looking statements.
Forward-looking statements reflect management's current views with respect to future events and performance and are based on currently available information and management's assumptions regarding future events. While management believes that its assumptions are reasonable, forward-looking statements are subject to various known and unknown risks and uncertainties and actual results may differ materially from those expressed or implied herein. In connection with the "safe harbor provisions" of the Private Securities Litigation Reform Act of 1995, we note that certain factors, among others, which could cause future results to differ materially from the forward-looking statements, expectations and assumptions expressed or implied herein are discussed in greater detail under Part II, Item 7, "Management's Discussion and Analysis of Financial Condition and Results of Operations" and Part I, Item 1A, "Risk Factors," and may be discussed elsewhere herein or in other documents we file with the SEC. Examples of forward-looking statements may include, without limitation, statements regarding any of the following: risks relating to the Restatement and related legal proceedings; our delisting from the NASDAQ Stock Market ("NASDAQ"); the outcome of pending legal proceedings and government investigations; our ability to improve our internal control over financial reporting, including our ability to remediate material weaknesses; our product development efforts; our ability to successfully navigate regulatory requirements applicable to our products and product candidates; the success of our product candidates in development; implementation of our corporate strategy; our financial performance; our research and development activities and projected expenditures; our anticipated timeline and commercialization strategy for our products under development; our cash needs; patents, trademarks and other proprietary rights; the safety and ability of our products to perform as intended or expected; our ability to supply a sufficient amount of our marketed products or product candidates and, if or insofar as approved or otherwise commercially available, future products to meet demand; our ability to commercialize and distribute our current and any future marketed products; our relationships with third parties with whom we contract; our ability to maintain and benefit from our arrangements with third parties; our costs to comply with governmental regulations; our plans for or success of sales and marketing; our plans regarding manufacturing; our ability to establish and maintain, and the ability of our customers and end users to obtain, reimbursement for our commercially available products from Medicare and other third-party payors; types of regulatory frameworks we expect will be applicable to our products and potential products; and results of our scientific research.
Except as otherwise required by law, we undertake no obligation to publicly update or revise any forward-looking statements to reflect subsequent events or circumstances and do not intend to do so.
When we use the terms "Osiris," "the Company," "we," "us," and "our" we mean Osiris Therapeutics, Inc., a Maryland corporation.
1
Overview
Osiris Therapeutics, Inc., together with our wholly-owned subsidiary, Osiris Therapeutics International GmbH (collectively, "we," "us," "our," or the "Company"), researches, develops, manufactures and commercializes regenerative medicine products intended to improve the health and lives of patients and lower overall healthcare costs. We have achieved commercial success with products in orthopedics, sports medicine and wound care, including the Grafix product line, Stravix, BIO4 and Cartiform. We continue to advance our research and development ("R&D") by focusing on innovation in regenerative medicine, including the development of bioengineered stem cell and tissue-based products.
We began operations in 1992 and were a Delaware corporation until, with the approval of our stockholders, we reincorporated as a Maryland corporation in May 2010. Our principal executive offices are located at 7015 Albert Einstein Drive, Columbia, MD 21046, and our telephone number is (443) 545-1800.
Osiris®, Grafix®, Grafix CORE®, Grafix PRIME®, Grafix XC®, Stravix®, Cartiform®, Prestige™, OvationOS®, Ovation™, TruSkin® and Menvivo™ are trademarks of the Company. BIO4® is a trademark of Howmedica Osteonics Corp., a subsidiary of Stryker Corporation ("Stryker"). Prochymal® is a trademark of Mesoblast Limited. Any other trademarks referred to in this Annual Report on Form 10-K are the property of their owners.
Our History
From May 2010 to October 2013, we operated in two business segments, therapeutics and biosurgery. Our therapeutics business focused on developing biologic stem cell drug candidates from a readily available source—adult human bone marrow. Our biosurgery business, now our only segment, focuses on using unique tissue preservation technologies to develop viable human tissue products designed to improve wound closure and surgical outcomes for patients and physicians over standard of care alone.
In October 2013, we sold our therapeutics business, including Prochymal, a stem cell drug for treatment of graft versus host disease, and related assets, to Mesoblast International SARL ("Mesoblast"), a wholly-owned subsidiary of Mesoblast Limited.
Since 2013, we have focused our resources on our biosurgery business. We have built a substantial direct sales force dedicated exclusively to sell our Grafix and Stravix products and entered into exclusive agreements to market and distribute BIO4 and Cartiform. We are a fully integrated company, having developed capabilities in R&D, manufacturing, marketing and sales of our products. We are focused on our long-term commercial growth of through the delivery of differentiated products for use across multiple fields of medicine with clear value propositions to patients, providers and third-party payors.
Market Overview
Regenerative medicine focuses on the process of creating living, functional tissues to repair or replace tissue or organ function lost due to age, disease, damage, or congenital defects. This field of medicine includes wound care, orthopedic and sports medicine. Examples of products designed to address needs of wound care, orthopedics and sports medicine are skin substitutes, bone grafts and articular cartilage grafts, respectively.
2
Skin substitutes are utilized in a variety of medical fields, including wound care, in which repair and regeneration of damaged tissues are required. They represent the largest wound care market segment of products, often referred to as wound biologics, a large and diverse group of advanced wound care products with the potential to support natural wound healing processes. These products are used in conjunction with standard of care when the standard of care alone are not effective for a patient. Examples of skin substitutes include human placental tissue-based products, like our Grafix and Stravix products. Grafix and Stravix are used primarily for treating chronic wounds of different causes (i.e., diabetic foot ulcers ("DFUs"), venous leg ulcers ("VLUs"), pressure ulcers, arterial ulcers, and severe burns), as well as a limited number of challenging-to-heal surgical and trauma wounds.
Bone grafts are used in a variety of orthopedic surgical procedures to fill bone voids to help facilitate repair and regeneration of the bone. Bone grafting is one of most frequent types of surgical procedures performed on bones. Bone grafts have a wide array of product types, including viable bone matrix allografts, like our BIO4 product. BIO4 is primarily used to fill bone voids and for bone fusion procedures, assisting in the natural healing process of the bone.
Osteochondral allografts are used in articular cartilage repair procedures to repair cartilage lesions and, when necessary, underlying bone issues. Osteochondral grafting procedures are primarily performed in the knee, but can also be used in other joints. Examples of osteochondral allografts include fresh stored osteochondral allografts or, like our product, Cartiform, cryopreserved viable osteochondral allograft. Cartiform is primarily used to treat articular cartilage lesions in the knee and, with the variety of sizes, other joints as well.
Scientific Background and Our Technology
After being founded on a discovery of mesenchymal stem cells ("MSCs") in adult human bone marrow, and through more than 25 years of R&D, we have gained a deep understanding of cell biology and the importance of MSCs and other biological factors in tissue repair and regeneration. With our knowledge, we have developed our current portfolio of products and Prochymal, the first approved MSC drug for treatment of graft versus host disease in Canada and New Zealand. As described above, Mesoblast acquired Prochymal in connection with the sale of our therapeutics business.
Our current regenerative medicine products consist of unique placental, bone and cartilage tissue allografts. To manufacture our products, we rely on a unique proprietary tissue cryopreservation technique, which retains the native tissue components, including mesenchymal stem cells, growth factors and extracellular matrix, and the tissue's inherent functionalities. Our cryopreservation technology serves as the manufacturing backbone for all of our current products including Grafix and Stravix as wound covers, BIO4 for bone repair and regeneration, and Cartiform for repair and regeneration of articular cartilage.
Cryopreservation is the conventional method for long-term storage of living cells and tissues. However, this method requires ultra-low temperature (below –80 Celsius degrees) equipment for storage and shipment, which creates a barrier to widespread use. In 2017, we announced the development of our Prestige Lyotechnology, a new tissue preservation technology which we believe will allow for storage and shipment of living tissue, including our products, at room temperature. We believe that this novel technology will have tremendous practical significance for both scientific and clinical applications, because it is designed to eliminate the need to preserve and transport our products at constant ultra-low temperatures.
Products and Pipeline
All of our current commercialized products are marketed as human cells, tissues and cellular and tissue-based products ("HCT/Ps"), as defined by the United States Food and Drug Administration ("FDA"), that are regulated solely under Section 361 of the Public Health Service Act ("361 HCT/Ps"),
3
and consequently, do not require pre-market approval from the FDA. Nevertheless, to support our reimbursement efforts for certain products, we have performed clinical studies to demonstrate the products' benefits to healthcare providers and third-party payors as described in greater detail below. Commercialization of future biological drug product candidates in the United States by us, if any, may require the submission of Investigational New Drug Applications ("INDs") and Biologics License Applications ("BLAs") and can occur only after successful completion of clinical trials and governmental agency approval.
The table below summarize the status of our products.
361 HCT/Ps
Product
|
Field of Use | Status (Market or Discontinued) | ||
|---|---|---|---|---|
| Grafix | Wounds and Surgical Procedures | Market | ||
| Stravix | Wounds and Surgical Procedures | Market | ||
| BIO4 (formerly, OvationOS) | Bone repair | Market | ||
| Cartiform | Cartilage repair | Market | ||
| Menvivo | Meniscus repair | Market, but not actively distributed | ||
| TruSkin | Wounds | Market, but not actively distributed | ||
| Ovation | Surgical applications | Discontinued (2014) |
Products Requiring Pre-Marketing Approval (IND/BLA)
While we are focused on the development and commercialization of 361 HCT/Ps, we have early discovery and development programs for biological product candidates, including our cellular drug program. In recent years, we have reduced our spending on R&D in an effort to conserve resources. We do not expect to file an IND for, or pursue clinical trials of, any of our biological product candidates in 2018.
Current Products
Our current products are:
Grafix is a product line of several products, Grafix PRIME, Grafix XC and Grafix CORE, and was initially launched in 2010. They are cryopreserved placental membranes that retain the extracellular matrix, growth factors, endogenous cells, including neonatal mesenchymal stem cells, and fibroblasts of the native tissue, all of which are beneficial in supporting natural wound repair. Grafix PRIME and Grafix XC (a larger size for surgical applications) are derived from the amnion and Grafix CORE is derived from the chorion. The amnion is the innermost membrane and the chorion is the outermost membrane of the placenta. Our Grafix products are flexible and conforming wound covers designed for direct application to hard-to-treat acute and chronic wounds, including but not limited to DFUs, VLUs and burns.
A significant market for Grafix is chronic wounds, which are primarily treated in a hospital outpatient setting. Reimbursement by public and private providers for outpatient treatments typically requires approvals from third-party payors, which may be granted after in depth and sometimes independent reviews. To support these reimbursement efforts for use of Grafix, we conducted several clinical studies. One of these studies, Protocol 302, was a clinical study comparing Grafix to conventional wound care. The study evaluated the efficacy and safety of Grafix for the treatment of chronic DFUs. Patients were randomized and received either Grafix with standard of care or standard of care alone for a chronic DFU. On August 13, 2013, we reported that Protocol 302 had met its
4
primary endpoint, which was complete wound closure by week 12. The study also met all top-line secondary endpoints, demonstrating faster wound closure and a statistically significant reduction in the number of treatments needed to achieve wound closure. We published the results of this study in the International Wound Journal in July 2014.
We used Protocol 302 data to gather evidence to further support our belief that using Grafix for chronic DFUs reduces the overall cost of treatment when compared to the standard of care. We published the evidence in the Journal of Clinical Diabetes and Practice in 2016, which showed that the patients treated with Grafix experienced fewer wound-related infections and hospitalizations, due to wounds closing faster than the patients treated with standard of care alone. The fewer adverse events and hospitalizations resulted in estimated savings for Grafix patients versus control patients of approximately $14,000 per patient.
In 2015, we conducted another study, Protocol 310, to evaluate the safety and efficacy of Grafix for the treatment of complex DFUs with exposed tendon and/or bone. Patients with type 1 or type 2 diabetes and a complex DFU with exposed tendon and/or bone were eligible for inclusion. Twenty-seven of the 31 enrolled patients completed the study. The primary endpoint, 100% wound granulation (formation of new soft tissue to cover exposed bone or tendon) by week 16, was met by 96% of the patients completing the study, and complete wound closure occurred in 59% of those patients. We published the results of this study in the International Wound Journal in 2017.
We received an 'untitled letter' dated September 26, 2013 (the "Untitled Letter") from the FDA stating that Grafix and Ovation did not meet the definition of a 361 HCT/P. Among the grounds for the FDA's position were our marketing claims, including wound healing claims for Grafix. We revised all of our marketing claims for Grafix and resolved all issues with the Untitled Letter, which included the discontinuance of Ovation in 2014. Grafix remains on the market as a 361 HCT/P. In April 2016, the FDA performed a routine inspection of the Company, which included a follow-up on our corrective actions to close out the Untitled Letter. In May 2016, we received an FDA Establishment Inspection Report, which stated that there were no observations, findings, warnings or untitled letters for either the routine inspection or the Untitled Letter follow-up.
With respect to the above mentioned wound healing claims, we commenced a clinical trial in 2015 to support a BLA covering such expanded claims for Grafix, which we referred to in the IND as OTI-15-01. In October 2016, we announced plans to terminate further enrollment in the trial and complete treatment of the 53 patients then enrolled. Treatment of the 53 patients was completed in April 2017. The decision to terminate further enrollment in the trial reflects our desire to allocate our limited R&D resources to other clinical programs.
Stravix is a viable cryopreserved human placental tissue, comprised of amniotic and connective layers of umbilical tissue that has been developed as a wound cover or surgical wrap to support soft tissue repair. It retains native components of the umbilical tissue including the extracellular matrix, growth factors and endogenous viable cells including epithelial cells, fibroblasts and MSCs. Stravix conforms to the site of injury and requires minimal preparation prior to use. It is thicker and has a stronger tensile strength than our Grafix products. Stravix was launched in late 2015.
BIO4 is a viable bone matrix containing endogenous bone forming cells including MSCs, osteoprogenitor cells, osteoblasts, osteoinductive and angiogenic growth factors. It possesses all four characteristics involved in bone repair and regeneration: osteoconductive, osteoinductive, osteogenic, and angiogenic. BIO4 is an alternative to autograft (or a graft of tissue from one's own body) which requires a procedure of harvesting a patient's own bone ("donor" site) and is associated with donor site morbidity. Originally branded as OvationOS and launched in 2014, BIO4 is marketed and distributed exclusively by Stryker under the brand name BIO4 since 2015.
5
Cartiform is a viable osteochondral allograft that contains extracellular matrix, chondrogenic factors and endogenous viable chondrocytes native to the cartilage tissue. The intact architecture of native cartilage is preserved in Cartiform. Cartiform is intended to treat osteochondral defects. Cartiform can fit to any surface contour. Cartiform was launched in 2012 and is exclusively available through Arthrex, Inc. ("Arthrex").
Menvivo was developed for repair of the meniscus following partial meniscectomy. Menvivo is processed from donated human meniscus tissue and maintains the structural and mechanical properties of the tissue. Extracellular matrix, biological factors and endogenous viable cells of fresh meniscal tissue are retained in Menvivo. Although Menvivo is available to the market as a 361 HCT/P, we have no current plans to actively distribute this product because the proper use of this product requires the development of new implantation techniques and instruments.
TruSkin is a cryopreserved viable skin allograft designed to address unmet medical needs of chronic wounds, such as DFUs, VLUs, pressure ulcers, surgical wounds, and wounds with exposed bone, tendon, joint capsule and muscle. TruSkin retains the extracellular matrix, growth factors and endogenous living skin cells of native tissue, making it an alternative to fresh skin allograft. We introduced TruSkin in November 2015. Although TruSkin is available to the market as a 361 HCT/P, we are not actively distributing it because reimbursement for this product is limited.
Discontinued Product
Ovation was a chorion suspension retaining tissue native matrix, the growth factors and the endogenous cells, including fibroblasts and mesenchymal stem cells. We marketed Ovation from early 2011 until October of 2014. The Untitled Letter discussed above stated that Ovation did not meet the regulatory requirements to be classified as a 361 HCT/Ps. We committed to the FDA to discontinue the Ovation product line by the second half of 2014, and such discontinuation was completed in October 2014.
Reimbursement
Physicians, hospitals and other healthcare providers use our current products. Our non-government customers depend on third-party payors to reimburse them for the cost of our products. Third-party payors include, but are not limited to, Medicare, managed care networks and private insurance plans. Reimbursement by third-party payors may be subject to periodic adjustments as a result of legislative, regulatory and policy changes, as well as budgetary pressures. Even though our customers' obligations to pay us for our products are not contingent on whether adequate third-party reimbursement is available, possible reductions in, or eliminations of, coverage or reimbursement by third-party payors affects our customers' ability to purchase our products.
Medicare
Medicare is the largest third-party payor in the United States. Medicare is a health insurance program primarily for individuals 65 years of age and older and younger individuals with certain disabilities. The Centers for Medicare and Medicaid Services ("CMS") administers the Medicare program through twelve Medicare Administrative Contractors ("MACs"). A MAC is a multi-state and private healthcare insurer that has been awarded by CMS a geographic jurisdiction to process Medicare Part A and Part B medical claims for Medicare fee-for-service beneficiaries. Although the overall Medicare reimbursement framework was developed in accordance with the Social Security Act and the applicable CMS regulations, each MAC has the discretion to decide whether to cover our products.
Grafix. Effective January 2013, CMS issued permanent Healthcare Common Procedure Coding System ("HCPCS") Q-codes for Grafix, which assist healthcare providers in facilitating reimbursement in the commercial and Medicare patient populations. Since March 2016, all MACs provide coverage for
6
our Grafix products for the treatment of certain chronic wounds, including DFUs. For Medicare reimbursement purposes, CMS has classified our Grafix products as skin substitutes. The majority of Grafix is used in hospital outpatient departments ("HOPDs"). In these settings, Medicare reimburses skin substitutes only in bundled arrangements, meaning Medicare pays the facility for our product and the related application procedure in the form of a single payment. CMS also assigns skin substitutes to either the low cost bundle group or high cost bundle group depending on the product's average weighted mean unit cost. Grafix has been assigned to the high cost group. The national average high cost bundle reimbursement for each application was $1,406.87 in 2015, $1,411.21 in 2016 and $1,427.16 in 2017. For 2018, reimbursement is set at $1,568.32 per application. For private office procedures, reimbursement is based on the average sales price ("ASP") as published by CMS. As of January 1, 2018, the ASP for Grafix CORE is $139.45 and for Grafix PRIME is $134.38. No ASP is published for Grafix XC.
Stravix. CMS has also classified Stravix as a skin substitute, which is also mainly used in HOPDs, but it has not been assigned a specific HCPCS Q-code. Since Stravix does not have a specific Q-code, it is classified in the low cost bundle group. The national average low cost bundle reimbursement for each application was $428.67 in 2016 and $452.91 in 2017. For 2018, reimbursement is set at $488.17 per application. No ASP is published by CMS for private office procedures.
BIO4 and Cartiform. BIO4 and Cartiform are used in the operating room setting. They are bundled as part of a hospital's claim for operating room services under a diagnosis-related group ("DRG") for inpatient admissions and under an ambulatory payment classification ("APC") for outpatient procedures. Medicare pays a single amount for a patient's inpatient hospitalization based on the applicable DRG, which depends on the patient's diagnosis, the surgical procedures involved, and the patient's age and gender. When the surgery is performed on an outpatient basis, Medicare pays for it based on the APC applicable to the surgical procedure.
Private Third-Party Payors
Private third-party payors include, but are not limited to, private health insurance plans and managed care networks. Each private health insurance plan and managed care network has its own coverage and reimbursement policies applicable to our products. Even if a plan covers our products, the reimbursement amount may not cover the entire costs of our product, which could adversely impact the demand for our products.
Intellectual Property
We have intellectual property (patents, licenses, know-how and trademarks) related to our products, manufacturing processes and other technologies. Our strategy to protect our intellectual property position includes generally seeking patent protection for our technology and products primarily in the United States, Canada and the European Union. The intellectual property position of biotechnology firms generally is highly uncertain and involves complex legal and factual questions. Our success will depend, in part, on whether we can:
- •
- obtain patents to protect our own technologies and products;
- •
- protect our trade secrets and know-how;
- •
- obtain licenses or the right to use the technologies of third-parties, which may be protected by patents;
- •
- obtain trademarks to protect our brand names; and
- •
- conduct our business without infringing the intellectual property and proprietary rights of others.
7
Patent Rights
Our success depends, in part, on our ability to obtain patents, maintain trade secret protection, and operate without infringing on the proprietary rights of third parties. Our policy is to file patent applications to protect technology, inventions and improvements that we consider important to our business and operations. We have 7 patents and 28 pending patent applications in the United States Patent and Trademark Office. We also have patents and pending patent applications in the European Patent Office and the patent offices of other foreign jurisdictions. We may need to defend patents from challenges by others from time to time in the future. Certain of our U.S. patents may also be challenged by parties who file a request for post-grant review or inter partes reexamination under the America Invents Act of 2011 or ex parte reexamination. Post-grant proceedings are increasingly common in the United States and are costly to defend. Our patent rights may not provide us with a proprietary position or competitive advantages against competitors. Furthermore, even if the outcome is favorable to us, the enforcement of our intellectual property rights can be expensive and time consuming.
Licenses and Related Rights
We sold our culturally expanded mesenchymal stem cell ("ceMSC") technology (including our stem cell drug Prochymal and other related assets) to Mesoblast, a wholly owned subsidiary of Mesoblast Limited, in October 2013. Pursuant to the purchase agreement with Mesoblast, we retained a royalty free license to all transferred intellectual property, insofar as necessary to continue in our current business. We have agreed not to compete with Mesoblast in the ceMSC business through October 2021, but we retain the rights to develop any other MSC technologies that do not involve culture expansion of cells.
Trade Secrets and Know-How
We also rely upon trade secrets to protect our proprietary information and technology. A significant amount of our technology, including aspects of the manufacturing processes for our products, is maintained by us as trade secrets. Through our experience with MSC-based and tissue-based product development, we have developed expertise and know-how in this field. To protect our know-how in manufacturing processes, we enter into confidentiality agreements with our employees, consultants and contractors, manufacturers, outside collaborators, sponsored researchers, advisors and other third parties. These agreements generally provide for protection of confidential information and technology, restrictions on the use of materials and assignment of inventions conceived during the term of the agreement. These agreements may not effectively prevent disclosure of or otherwise protect our confidential information and technology.
Trademarks
Osiris®, Grafix®, Grafix CORE®, Grafix PRIME®, Grafix XC®, Stravix®, Cartiform®, Prestige™, OvationOS®, Ovation™, TruSkin® and Menvivo™ are trademarks of the Company. We believe that trademark protection is an important part of establishing product and brand recognition. We own a number of registered trademarks and trademark applications in the U.S., Canada and in various other countries throughout the world. U.S. federal registrations for trademarks remain in force for 10 years and may be renewed every 10 years after issuance, provided the mark is still being used in commerce. Trademark registrations in Canada remain in force for 15 years and may be renewed every 15 years after issuance, and are vulnerable to cancellation thereafter if the mark is not being used in commerce. Other countries generally have similar but varying terms and renewal policies with respect to trademarks registered in those countries.
8
Manufacturing
Our current products are derived from human tissue donated for transplantation. Grafix and Stravix are derived from living human donors' placental tissues, and BIO4 and Cartiform are derived from donated human cadaveric bone and cartilage tissues. We contract with tissue recovery agencies for both placental and cadaveric tissue for our products. These agencies operate on a fee-for-service basis. As needed, we intend to enter into contracts with additional tissue recovery agencies to fulfill expected product demand. We have not experienced significant supply issues with tissue recovery agencies, and placental tissue and cadaveric donor bone and cartilage have been generally available to us in sufficient quantities and on acceptable terms. However, there are a limited number of tissue supply agencies and it requires a long-lead time to order large quantities of placental and cadaveric tissue. This means that a sudden increase in demand or a supply shortage may prevent us from producing sufficient quantities of our products.
We currently manufacture all of our supply of Grafix and Stravix products at our facility in Columbia, Maryland. Currently, we outsource manufacturing of all of our supply of BIO4 and Cartiform to Aziyo Biologics, Inc. ("Aziyo"). Having a single manufacturing source for each of our products could limit our distribution capabilities, increase our distribution costs or cause production delays, any of which can damage our reputation and adversely affect our results of operations. We have entered into an agreement with another third party to manufacture BIO4 and Cartiform and are in advanced discussions with the same third party to establish it as a manufacturer of all of our products in order to increase our manufacturing capacity. A lengthy disruption or shutdown of, or a shortage of supply at, our current manufacturing facilities or the manufacturing facilities of Aziyo or another outsourced contract manufacturer, whether due to the occurrence of natural disasters, the need to comply with the requirements of directives from government agencies, such as the FDA, the lack of supply of human tissue, or otherwise, could have a material adverse effect on our business, financial condition and results of operations.
Sales, Marketing and Distribution
Grafix and Stravix: We currently sell Grafix and Stravix through the efforts of our internal direct sales and marketing departments, as well as through a small number of specialty distributors for certain target markets. We focus our marketing efforts for these products in four specific channels: HOPDs, inpatient surgical procedures, private physician offices, and Department of Veteran Affairs ("VA") and Department of Defense ("DOD") hospitals. For our VA and DOD customers, our products are distributed exclusively through resellers designated as Service-Disabled, Veteran-Owned Small Businesses ("SDVOSBs"). SDVOSBs are eligible for set-asides and other preferences in the federal contracting process. For the VA, SDVOSBs enter into Federal Supply Schedule or Strategic Acquisition Center contracts and for the DOD, SDVOSBs enter into Distribution and Pricing contracts.
BIO4: In December 2014, we entered into an exclusive agreement with Howmedica Osteonics Corp., also referred to as Stryker Orthopaedics, a subsidiary of Stryker Corporation, for the marketing and distribution of BIO4. We are responsible for supply, manufacturing, inventory management, shipments to customers, continued research and product improvement activities. Stryker is responsible for the sales and marketing of BIO4 for use in all surgical applications, including spine, trauma, extremity, cranial, and foot and ankle surgery. We collaborate with Stryker on the design and conduct of clinical development programs.
The agreement with Stryker provides for an initial four-year exclusive term, which commenced on the date of Stryker's initial commercial sale of BIO4 in February 2015. The term may be extended by Stryker for an additional exclusive period of four years or an additional non-exclusive period of two years. If Stryker extends the term on an exclusive basis, it has the option to further extend the term on an exclusive basis for two more years. We received an initial exclusivity fee of $5.0 million in 2015 and
9
are entitled to receive additional fees upon any exercise by Stryker of its right to extend the initial term, whether on an exclusive or non-exclusive basis. These additional fees are reduced on a sliding scale if Stryker meets certain revenue thresholds during the initial term or if revenue goals are not met as a result of us not fulfilling our supply obligations. Stryker is entitled to a certain percentage of sales of allograft services for BIO4 and has limited early termination rights.
Cartiform: In October 2014, we entered into an exclusive agreement for our cartilage product, Cartiform, with Arthrex. The agreement with Arthrex provides Arthrex with exclusive commercial distribution rights to Cartiform. We are responsible for manufacturing, continued research and product improvement activities. We collaborate with Arthrex on the design and conduct of clinical development programs. The agreement provides for an initial eight-year exclusive term with automatic renewals of additional two-year periods. Pursuant to the agreement, Arthrex is entitled to a certain commission on Cartiform sales.
Information regarding our revenue from sales of the above products is set forth under the heading Results of Operations in Part II, Item 7 of this Form 10-K and is incorporated by reference in this Item 1.
Competition
In the marketplace, we compete with other companies and organizations that are marketing or developing products competitive with Grafix, Stravix and our other products and products under development. Companies competing with our products include, but are not limited to: Organogenesis Inc., the manufacturer of Apligraf® and Dermagraft®, MiMedx Group, Inc., the manufacturer of EpiFix®, and Integra LifeSciences Corporation, the manufacturer of Integra, all of which compete with Grafix and Stravix. BIO4 competes with bone tissue products such as Osteocel® marketed by NuVasive, Inc. and Trinity® marketed by Orthofix International NV, while Cartiform competes with cartilage allografts such as ProChondrix® marketed by AlloSource and DeNovo® marketed by Zimmer Biomet Holdings, Inc. In addition to those listed above, we have other existing and potential competitors developing a variety of products for the same conditions for which we market our products.
Government Regulation
Regulation by governmental authorities in the United States and other countries is a significant factor in the development, manufacture, commercialization and reimbursement of our products. Our current products, Grafix, Stravix, BIO4 and Cartiform, are HCT/Ps that we believe qualify under 21 CFR Part 1271 to be regulated solely under Section 361 of the Public Health Services Act. Such 361 HCT/Ps are regulated differently from biologics and drugs, and do not require pre-marketing approval. Some of our product candidates in early development may require pre-marketing approval of a BLA, referred to as licensure, by the FDA, prior to commercialization.
Criteria for Qualifying as a 361 HCT/P
361 HCT/Ps are human cells, tissues, or cellular and tissue-based products that are intended for implantation, transplantation, infusion, or transfer into a human recipient and that meet all of the following criteria set forth under 21 CFR Part 1271:
- •
- The product is minimally manipulated;
- •
- The product is intended for homologous use only, as reflected in its labeling, advertising and all other indications of the manufacturer's objective intent;
10
- •
- The manufacture of the product does not involve the combination with another article except for water, crystalloids, or a sterilizing,
preserving, or storage agent, provided that the addition of such articles does not raise new clinical safety concerns with respect to the product; and
- •
- The product does not have a systemic effect and is not dependent on the metabolic activity of living cells for its primary function (or if it does, it meets other criteria not applicable to our products, such as being limited to use in first or second degree blood relatives).
These criteria form the framework governing our advertising and promotional activities for 361 HCT/Ps. For additional information on FDA's regulation of 361 HCT/P advertising and promotion, refer to the risk factor entitled, "Our business is subject to an inherently uncertain and evolving area of regulation." under "Risk Factors" in Part I, Item 1A of this Form 10-K
We believe all of our current products (Grafix, Stravix, BIO4, and Cartiform), as well as our tissue products being developed using our Prestige Lyotechnology, meet, or will meet, the FDA's current interpretations of the criteria for 361 HCT/Ps. For additional information about the FDA regulatory history of our products, which informs our belief that our products qualify as 361 HCT/Ps, refer to the risk factor entitled, "Should the FDA determine that any of our current products do not meet regulatory requirements that permit qualifying human cells, tissues and cellular and tissue-based products to be manufactured, stored, labeled and distributed without pre-marketing approval, we may be required to stop manufacturing and distributing such products." under "Risk Factors" in Part I, Item 1A of this Form 10-K.
FDA Regulation of 361 HCT/Ps
The FDA has specific regulations governing HCT/Ps, including some regulations specific to 361 HCT/Ps, which are set forth in 21 CFR Part 1271. All establishments that manufacture 361 HCT/Ps must register and list their HCT/Ps with the FDA's Center for Biologics Evaluation and Research ("CBER") within five days after commencing operations. In addition, establishments are required to update their registration annually in December or within 30 days of certain changes, and submit changes in HCT/P listing at the time of or within six months of such change.
The regulations in 21 CFR Part 1271 requires us to comply with donor screening, eligibility and testing requirements and federally mandated current Good Tissue Practices ("cGTPs") regulations to prevent the introduction, transmission and spread of communicable diseases. The cGTPs govern, as may be applicable, the facilities, controls, and methods used in the manufacture of all HCT/Ps, including processing, storage, recovery, labeling, packaging, and distribution of 361 HCT/Ps. cGTPs require us, and our contract manufacturers, among other things, to maintain a quality program, train personnel, control and monitor environmental conditions as appropriate, control and validate processes, properly store, handle and test our products and raw materials, maintain our facilities and equipment, keep records, and comply with standards regarding recovery, pre-distribution, distribution, tracking and labeling of our products, and complaint handling. 21 CFR Part 1271 also mandates compliance with adverse event and cGTP deviation reporting and labeling requirements.
Although we do not currently import any human tissue for our products, we have executed contracts with potential suppliers of placental tissue sourced from Canada, and we are currently in the process of qualifying those suppliers. In the event that we import placental tissue, we will be required to satisfy the regulations on importing 361 HCT/Ps. Those regulations require that the importer of record of HCT/Ps notify the FDA prior to, or at the time of, importation and provide sufficient information for the FDA to make an admissibility decision. In addition, the importer must hold the HCT/P intact and under conditions necessary to prevent transmission of communicable disease until an admissibility decision is made by the FDA.
11
The FDA conducts periodic inspections of HCT/P manufacturing facilities, and contract manufacturers' facilities, to assess compliance with cGTP. Such inspections can occur at any time with or without written notice at such frequency as determined by the FDA in its sole discretion. To determine compliance with the applicable provisions, the inspection may include, but is not limited to, an assessment of the establishment's facilities, equipment, finished and unfinished materials, containers, processes, HCT/Ps, procedures, labeling, records, files, papers, and controls required to be maintained under 21 CFR Part 1271. If the FDA were to find serious non-compliant manufacturing or processing practices during such an inspection, it could take regulatory actions that could adversely affect our business, results of operations, financial condition and cash flows. For additional information on these potential enforcement actions, refer to the risk factor entitled, "Our business is subject to continuing regulatory compliance by the FDA and other authorities, which is costly and our failure to comply could result in negative effects on our business." under "Risk Factors" in Part I, Item 1A of this Form 10-K
FDA Regulatory Approval Process for Biologics
If the FDA determines that any of our current products do not qualify as 361 HCT/Ps, such products would then be regulated as biological products and would require pre-marketing approval of a BLA, also known as licensure, from the FDA before they could be marketed again in the United States. In addition, certain of our product candidates in early stage development may constitute biological product candidates requiring licensure. For such biological product candidates, the FDA generally requires the following steps prior to their introduction into interstate commerce:
- •
- performance of preclinical (animal and laboratory) tests, in accordance with the FDA's current Good Laboratory Practice ("cGLP") regulations
and other applicable requirements;
- •
- submissions to the FDA of an IND, which must become effective before clinical trials may commence;
- •
- approval by an independent institutional review board ("IRB") of each clinical site before a clinical trial is initiated;
- •
- performance of adequate and well-controlled clinical trials according to FDA's current Good Clinical Practice ("cGCP") regulations, and any
additional requirements for the protection of human research subjects and their health information, to establish the safety, purity and potency of the investigational biological product in the
intended target population for its intended use;
- •
- establishment and validation of a consistent and reproducible manufacturing process intended for commercial use, including the collection of
appropriate manufacturing data;
- •
- preparation and submission to FDA of a BLA for marketing approval that includes substantial evidence of safety, purity and potency from results
of nonclinical testing and clinical trials;
- •
- satisfactory completion of an FDA Advisory Committee review, unless waived by the FDA;
- •
- satisfactory completion of an FDA inspection of the manufacturing facility or facilities where the biological product candidate is produced to
assess compliance with current Good Manufacturing Practices ("cGMPs") and to assure that the facilities, methods and controls are adequate to preserve the biological product candidate's identity,
safety, strength, quality, potency and purity;
- •
- potential FDA inspection of the nonclinical and clinical trial sites that generated the data in support of the BLA; and
- •
- FDA review and approval of the BLA before any commercial sale or shipment of the product can begin again.
For additional information on the requirements for licensure, refer to the risk factor entitled, "If the FDA determines that any of our current products are not 361 HCT/Ps, or that any of our future
12
products are not 361 HCT/Ps, we will be required to seek and obtain pre-marketing regulatory approval." under "Risk Factors" in Part I, Item 1A of this Form 10-K.
Federal Regulation of Clinical Laboratories
Our communicable disease testing is performed by laboratories registered with the FDA to perform donor testing and certified to perform such testing on human specimens in accordance with the Clinical Laboratory Improvement Amendments of 1988 ("CLIA") and 42 CFR Part 493, or that has met equivalent requirements as determined by CMS. CLIA extends federal oversight to clinical laboratories that examine or conduct testing on materials derived from the human body for the purpose of providing information for the diagnosis, prevention, or treatment of disease or for the assessment of the health of human beings. CLIA requires that these laboratories be certified by the government, satisfy governmental quality and personnel standards, undergo proficiency testing, be subject to biennial inspections and remit fees. The sanctions for failure to comply with CLIA include suspension, revocation, or limitation of a laboratory's CLIA certificate necessary to conduct business, fines, or criminal penalties.
National Organ Transplant Act
Procurement of certain human organs and tissues for transplantation is subject to the restrictions of the National Organ Transplant Act ("NOTA"), which prohibits the transfer of certain human organs, including skin and related tissue, for valuable consideration, but permits reasonable payment associated with the removal, transportation, implantation, processing, preservation, quality control and storage of human tissue and skin. We reimburse tissue banks, hospitals and physicians for their services associated with the recovery, storage and transportation of donated human tissue.
State Tissue Bank Regulations and Related Accreditation
Certain state and local governments regulate our business. As required, we maintain state licensure as a human tissue bank in Maryland, California, Florida, and New York. We believe these are the only states in which this specific licensure is required for us. We also received and actively maintain American Association of Tissue Banks ("AATB") accreditation. In January 2016 the 14th Edition of the AATB standards went into effect, which included specific standards for recovery, screening, testing, labeling and processing of placental tissue. We believe we are compliant in all material respects with AATB standards and our state licensure requirements.
Privacy Law
Federal and state laws govern our ability to obtain and, in some cases, to use and disclose data we need to conduct research activities. Through the Health Insurance Portability and Accountability Act of 1996 ("HIPAA"), Congress required the Department of Health and Human Services ("HHS") to issue a series of regulations establishing standards for the electronic transmission of certain health information by healthcare providers, hospitals, health plans and healthcare clearinghouses, which are known as "Covered Entities". Among these regulations were standards for the privacy of individually identifiable health information ("PHI"). HIPAA applies to us because we are a "Business Associate", meaning that we are a third-party who performs functions or services involving PHI for or on behalf of Covered Entities. Congress also enacted the Health Information Technology for Economic and Clinical Health Act ("HITECH"). Among other changes to the laws governing PHI, HITECH strengthened and expanded HIPAA requirements, increased penalties for violations, gave patients new rights to restrict uses and disclosures of their health information and imposed a number of privacy and security requirements directly on Business Associates. Under HITECH, we must report unauthorized use or disclosure of PHI that meets the definition of a breach to our Covered Entities. We have adopted
13
privacy policies and procedures designed to comply with the applicable requirements set forth in HIPAA and HITECH.
HIPAA and HITECH do not preempt, or override, state privacy laws that provide even more protection for individuals' health information. These laws' requirements could further complicate our ability to obtain necessary research data from our research collaborators. In addition, certain state privacy and genetic testing laws may directly regulate our research activities, affecting the manner in which we use and disclose individuals' health information, potentially increasing our cost of doing business, and exposing us to liability claims. Patients and research collaborators may also have contractual rights that further limit our ability to use and disclose individually identifiable health information. Any claims that we have violated individuals' privacy rights or breached our contractual obligations, even if we are not found liable, could be expensive and time-consuming to defend and could result in adverse publicity that could harm our business.
Healthcare Fraud and Abuse Laws
In the United States, we are subject to laws and regulations pertaining to healthcare fraud and abuse, including anti-kickback laws and physician self-referral laws that regulate the means by which companies in the healthcare industry may market their products to hospitals and healthcare professionals and may compete by discounting the prices of their products. Our products also are subject to regulation regarding reimbursement, and United States healthcare laws apply when a customer submits a claim for a product that is reimbursed under a federally funded healthcare program. These laws require that we exercise care in designing our sales and marketing practices, including involving interactions with healthcare professionals. For additional description of these laws and their applicability to us, refer to the risk factor entitled, "We and our distributor sales representatives must comply with U.S. federal and state fraud and abuse laws, including anti-kickback and false claims laws and equivalent foreign rules." under "Risk Factors" in Part I, Item 1A of this Form 10-K.
Hazardous Materials
We also are subject to various local, state and federal laws and regulations relating to safe working conditions, laboratory and manufacturing practices, the distribution of human tissue and tissue products, experimental use of animals and the use and disposal of hazardous or potentially hazardous substances, including chemicals, micro-organisms and various radioactive compounds used in connection with our R&D activities. These laws include, but are not limited to, the Occupational Safety and Health Act, the Toxic Test Substances Control Act and the Resource Conservation and Recovery Act. Although we believe that our safety procedures for handling and disposing of these materials comply with the standards prescribed by state and federal regulations, we cannot assure you that accidental contamination or injury to employees and third parties from these materials will not occur. We may not have adequate insurance to cover claims arising from our use and disposal of these hazardous substances.
Foreign Regulation
In the event we decide to distribute our products outside of the United States, we will be required to seek approval for the manufacturing and marketing of each of our products from regulatory authorities in foreign countries prior to the commencement of marketing of the product in those countries. The approval procedure varies among countries, may involve preclinical testing and clinical trials, and the time required may differ from that required by the FDA. For example, although there is now a centralized European Union approval mechanism in place, the mechanism applies only to certain specific medicinal product categories. Each European country also may impose certain of its own procedures and requirements in addition to those requirements set out in the appropriate legislation, many of which could be time-consuming and expensive.
14
Employees
As of March 23, 2018, we had 337 full-time employees and 13 part-time employees. Of this total, 16 were engaged in R&D and clinical studies, 80 were engaged in manufacturing activities, 164 were engaged in sales and marketing activities, 23 were engaged in reimbursement and market access activities and 67 were engaged in administration, finance, and facilities. None of our employees are represented by a labor union or covered under a collective bargaining agreement, and we have not experienced any work stoppages.
Available Information
Our reports filed with the SEC can be found on our website at www.osiris.com under the "Investors" heading free of charge. These include our Annual Reports on Form 10-K, Quarterly Reports on Form 10-Q, Current Reports on Form 8-K, and any amendments to those reports filed or furnished pursuant to Section 13(a) or 15(d) of the Securities Exchange Act of 1934. We make these reports available as soon as reasonably practicable after they are electronically filed with, or furnished to, the SEC.
You can also obtain these reports from the SEC's Public Reference Room, which is located at 100 F Street, NE, Washington, D.C. 20549. Information on the operation of the Public Reference Room is available by phone (1-800-SEC-0330) or on the Internet (www.sec.gov). This site contains reports, proxy and information statements, and other information regarding issuers that file electronically with the SEC.
The content on any website referred to in this Form 10-K is not incorporated by reference into this Form 10-K unless expressly noted.
We are subject to numerous risks and uncertainties. In addition to the other information contained in this report, you should carefully consider the risks and uncertainties described below. These risks are not the only ones that we may face. Additional risks not presently known to us or that we currently consider immaterial may also impact our business operations. Our actual results could differ materially from those anticipated in our forward-looking statements as a result of known and unknown risks including the risks described below or elsewhere in this report.
Risks Related to Our Business
Our operating results may fluctuate significantly as a result of a variety of factors, many of which are outside of our control.
The following factors, among others, may negatively affect our operating results:
- •
- Failure to obtain reimbursement approvals by, and adequate and timely reimbursements from, third-party payors, such as Medicare and private
health plans, for our products;
- •
- Removal of our products from the Federal Supply Schedule or change in the prices that government customers will pay for our products;
- •
- Our ability to attract and retain key personnel;
- •
- The announcement or introduction of new or improved products by our competitors;
- •
- Our ability to obtain the necessary quantities of human tissue to manufacture our products;
- •
- Our ability to upgrade and develop our systems and infrastructure to accommodate our growth, including adding more manufacturing capacity to enable us to continue to meet market demand;
15
- •
- Our ability to manage our relationships with third parties that help us research, develop, manufacture, market and distribute our products;
- •
- The amount and timing of operating costs and capital expenditures relating to the expansion of our business, operations and infrastructure;
- •
- Our ability to comply with regulatory requirements related to the marketing, manufacturing and distribution of our products and product
candidates, including FDA regulations; and
- •
- General economic conditions as well as economic conditions specific to the healthcare industry.
We have based our current and future expense levels largely on our investment plans and estimates of future events, although certain of our expense levels are, to a large extent, fixed. We may be unable to adjust spending in a timely manner to compensate for any unexpected revenue shortfall. Accordingly, any significant shortfall in revenue relative to our planned expenditures would have an immediate adverse effect on our business, financial condition and results of operations. Further, as a strategic response to changes in the competitive environment, we may from time to time make certain pricing, service or marketing decisions that could have a material adverse effect on our business, financial condition and results of operations. Due to the foregoing factors, among others, our revenue and operating results are and will remain difficult to forecast.
We have a history of operating losses and may not achieve or sustain profitability.
We have incurred losses in each year since our inception (except fiscal years 2009, 2010, 2011, 2013 and 2017), and may incur additional losses in the future. As of December 31, 2017, we had an accumulated deficit of approximately $242 million. In earlier years, these losses resulted principally from costs incurred in our R&D programs. In recent years, these losses resulted principally from our growing sales and marketing expenses, primarily due to the expansion of our sales force which was internalized in 2014, and from our growing general and administrative expenses. Our general and administrative expenses included approximately $8.1 million and $9.5 million in 2016 and 2017, respectively, related to the Restatement.
We expect to continue to incur significant operating expenses in the foreseeable future as we seek to:
- •
- continue to add sales, operational and financial personnel either through additional employees or outsourcing, consistent with expanding our
operations and improving our internal control over financial reporting;
- •
- expand our manufacturing capacity;
- •
- continue to pursue clinical studies for our products to support our reimbursement efforts;
- •
- manage regulatory issues and requirements related to the marketing, manufacturing and distribution of our products and product candidates,
including issues related to FDA regulation and third-party payor reimbursement; and
- •
- maintain, expand and protect our intellectual property.
The extent of our future operating losses or profits is highly uncertain, and we may not achieve or sustain profitability. If we are unable to achieve and then maintain profitability, the market value of our common stock will decline.
16
We continue to expand our sales and marketing capabilities, and there can be no assurance that these efforts will result in significant increases in sales.
Since 2014, we have been engaged in a major initiative to build and expand our internal sales and marketing capabilities. As a result, we have and are continuing to hire direct sales personnel for certain of our products to allow us to reach new customers. Due to the unique nature of our products, we spend significant time and resources on recruiting, training, retaining, motivating and managing our sales personnel. The increased expenses associated with these selling efforts impact our operating results, and there can be no assurance that we will be successful in significantly increasing sales of our products.
We may have difficulty managing growth in our business, which could have a material adverse effect on our business, financial condition and results of operations.
As we expand our activities there will be additional demands on our financial, operational and management resources. To manage the growth of our operations and personnel, we must both modify our existing operational and financial systems, procedures and controls and implement new systems, procedures and controls. We must also expand our finance, administrative and operations staff. Management may be unable to hire, train, retain, motivate and manage necessary personnel or to identify, manage and exploit existing and potential strategic relationships and market opportunities. The failure to manage growth effectively could have a material adverse effect on our business, financial condition and results of operations.
Our revenues depend on obtaining coverage and adequate reimbursement from public and private insurers and health systems.
Our success depends on the extent to which reimbursement for the costs of our products will be available from third-party payors, such as government health administration authorities, private health insurers, health maintenance organizations and pharmacy benefit management companies. A significant number of government and private third-party payors currently do not provide coverage and reimbursement for our products. If we are not successful in obtaining coverage and adequate reimbursement for our products from more third-party payors, our ability to sell our products will be adversely affected. Therefore, our ability to grow our revenues is dependent on our ability to meet the requirements for coverage of additional third-party payors, and to negotiate acceptable reimbursement with such payors once our products have been approved for coverage. Even if we do succeed in obtaining widespread coverage and adequate reimbursement for our products, future changes in coverage and reimbursement policies could have a negative impact on our business, financial condition and results of operations.
Our products may have higher costs than more traditional products, due to the higher cost and complexity associated with their research, development and production, and the complexity associated with their distribution. This higher cost and complexity can make it more difficult to obtain adequate coverage and reimbursement.
Our products may have higher costs or fees associated with them compared with more traditional products, due to the higher cost and complexity associated with their research, development and production, and the complexity associated with their distribution—which requires special handling, storage and shipment procedures and protocols. This, in turn, makes it more difficult for us to obtain approval for coverage and reimbursement from third-party payors for our products and the procedures in which they are used, particularly if we cannot demonstrate a favorable cost-benefit relationship. Third-party payors may also deny coverage because the product has not received approval from the FDA or other government regulators that they believe is necessary, or they believe that the product is experimental, unnecessary or inappropriate.
17
Even though we are not required to conduct clinical trials in order to market our products in the United States, we may nevertheless be required to conduct one or more clinical studies, and to publish one or more peer reviewed journal articles supporting the product, before we are able to obtain third-party reimbursement. We may also be required to conduct additional clinical studies that compare the cost effectiveness of our products to other available therapies before third-party payors will provide reimbursement. Conducting clinical studies is expensive and results in delays in wide scale commercialization and reimbursement. In addition, even if our products otherwise meet the requirements for reimbursement, pricing negotiations with third-party payors may take months or longer and result in significant delay in obtaining approval for reimbursement.
Coverage and reimbursement policies also sometimes differ depending upon the setting in which the product is to be used. The use of our products in a hospital setting as part of a surgical or other more extensive procedure may have a coverage and reimbursement pathway that differs from a use in an outpatient setting for a more narrowly defined procedure. Thus, for example, the coverage and reimbursement pathway for Grafix—which we expect to be used more often in an outpatient setting—may differ from that for BIO4—which we expect to be used more often in an in-patient hospital setting as part of a surgical procedure. These differences may limit or make coverage and reimbursement more difficult for some products as compared to others, and influence our product development and marketing efforts in ways that may ultimately prove to be detrimental to our business. Payors' coverage and reimbursement policies also are subject to change, and the policies in effect at the time a product is marketed may be different from the policies in place when a coverage and reimbursement strategy was developed.
In addition, third-party payors are increasingly challenging the price and cost-effectiveness of medical products and services, and many limit coverage and reimbursement for newly approved healthcare products. In particular, third-party payors may limit the indications for which they will reimburse patients who use our products, or they may not provide reimbursement for our products separately from the procedures in which they are used, to encourage providers to select products based on cost-effectiveness or for other reasons. Cost-control initiatives could decrease the price for our products, which would result in lower product revenue to us.
To continue our commercial expansion, we must convince more physicians that our products are appropriate alternatives to traditional methods and products and that our products should be used in their procedures.
While many physicians are using our products, we must continue our efforts to convince other physicians that our products are appropriate alternatives to traditional methods and products. We believe physicians will only adopt our products if they determine, based on experience, clinical data and published peer reviewed journal articles, that the use of our products in a particular procedure is a favorable alternative to conventional methods. Physicians may be slow to change their practices for the following reasons, among others:
- •
- their lack of experience in the field using our products;
- •
- lack of evidence supporting additional patient benefits and our products over conventional methods;
- •
- perceived liability risks generally associated with the use of new products and procedures;
- •
- limited availability of reimbursement from third-party payors;
- •
- the exclusion of our products on the formulary of their affiliated hospital or group purchasing organization ("GPO"), which would preclude
their use of our product; and
- •
- the time that must be dedicated to training physicians on how to use our products.
18
In addition, hospital acquisition decisions often are affected by physicians' assessments of products. If physicians do not support adoption of our products or if we are unable to demonstrate favorable long-term clinical data, hospitals may not use our products, which would significantly reduce our ability to achieve expected revenue.
The potential of our products and products under development may not be realized, including products based on our Prestige Lyotechnology.
We are continually evaluating the potential of our current products and products under development. Our products are susceptible to various risks, including undesirable and unintended side effects, inadequate efficacy or other characteristics that may prevent or limit their commercial use, or if required, pre-marketing approval. We have invested substantial time and resources in developing additional products, including products using our novel Prestige Lyotechnology, a proprietary method to preserve living cells and tissues at room temperatures. Further commercialization of any new products, especially products based on new technologies, will require additional development, clinical evaluation, significant marketing efforts and substantial additional investment before they can provide us with any revenue. Despite our efforts, any such products may not become commercially successful products for a number of reasons, including:
- •
- we may experience delays in our development programs;
- •
- any products that are approved may not be accepted in the marketplace by patients, physicians or payors;
- •
- we may not be able to manufacture any such products in sufficient commercial quantities; and
- •
- rapid technological change may make such products obsolete.
If the potential of our products is not realized, the value of our products, technology and development programs could be significantly reduced.
Some product development programs are based on novel technologies, such as our Prestige Lyotechnology, which are inherently risky.
We are subject to the risks of failure inherent in the development of products based on new technologies, such as our Prestige Lyotechnology. The novel nature of our technology platforms and product candidates creates significant challenges in regards to product development and optimization, processing and manufacturing, government regulation and/or approval, third-party reimbursement and market acceptance. Therefore, the pathway to development and commercialization of our products may be more complex and lengthy than other products. Additionally, tissue- and cell-based products are subject to donor-to-donor variability, which can make standardization more difficult. As a result, the development and commercialization pathway for our products is subject to increased uncertainty.
We depend on key personnel.
Our current and future success depends to a significant extent on the skills, experience and efforts of our scientific, management, technical and sales personnel. None of our employees is employed for a specified term, and we have experienced significant turnover. Competition for personnel is intense. We may be unable to retain our current personnel or attract or integrate other qualified scientific, management, technical or sales personnel in the future which could harm our business and might significantly delay or prevent the achievement of research, development, sales or other business objectives.
19
We are in a highly competitive and evolving field and face competition from well-established tissue product manufacturers as well as new market entrants.
Our business is in a very competitive and evolving field. Competition from other companies and from research and academic institutions is intense and widespread, expected to increase, subject to rapid change and could be significantly affected by new product introductions. The presence of this competition in our market may lead to pricing pressure, which would limit our ability to sell our products at a price that would make us profitable or prevent us from selling our products at all. Our ability to successfully compete will depend on whether we can perfect and protect our intellectual property rights related to our technologies as well as to develop new technologies and new applications for our technologies. Our failure to compete effectively would have a material adverse effect on our business, financial condition and results of operations.
Our products could become obsolete due to rapid technological change.
The technologies underlying our products are subject to rapid and profound technological change. Competition intensifies as technical advances in each field are made and become more widely known. We can give no assurance that others will not develop services, products or processes with significant advantages over the products that we offer or are developing. Any such occurrence could have a material adverse effect on our business, financial condition and results of operations.
Many of our competitors have greater resources or capabilities than we have, or may succeed in developing new or better products more quickly than we do.
In the marketplace, we compete with other companies and organizations that are marketing or developing products competitive with Grafix, Stravix and our other products and products under development. In many cases, the competing product or candidate is based on bioengineering or other technologies. Companies competing with our products include, but are not limited to: Organogenesis Inc., the manufacturer of Apligraf® and Dermagraft®, MiMedx Group, Inc., the manufacturer of EpiFix®, and Integra LifeSciences Corporation, the manufacturer of Integra, all of which compete with Grafix and Stravix. BIO4 competes with bone tissue products such as Osteocel® marketed by NuVasive, Inc. and Trinity® marketed by Orthofix International NV, while Cartiform competes with cartilage allografts such as ProChondrix® marketed by AlloSource and DeNovo® marketed by Zimmer Biomet Holdings, Inc. In addition to those listed above, we have other existing and potential competitors developing a variety of products for the same conditions for which we market our products. Many of our current and potential competitors have greater financial and human resources than we have, including more experience in R&D and more established marketing and distribution capabilities.
The biotechnology industry is characterized by rapid technological change, resulting in new product introductions and other technological advancements. Because FDA approval is generally not required for tissue-based products which are not more than minimally manipulated, competitors might choose to enter this market and produce a substantially similar product, and we may not be able to prevent the marketing and distribution of any such similar products by others. Should others produce a substantially similar product or a new product that renders our current or future products obsolete, we could be subject to increased competition and our potential revenue from distribution of these products may be limited.
Our products are derived from human tissue and therefore have the potential for disease transmission.
Our products consist of human tissue: Grafix is manufactured from human placental tissue; Stravix is manufactured from human placental tissue comprised of amniotic and connective layers of umbilical
20
tissue; BIO4 is manufactured from cadaveric donor bone; and Cartiform is manufactured from cadaveric donor cartilage.
The utilization of human tissue creates the potential for transmission of communicable disease, including, but not limited to, human immunodeficiency virus, Zika virus, viral hepatitis, syphilis, Creutzfeldt-Jakob disease (the human form of "mad cow" disease) and other viral, fungal or bacterial pathogens. We, and our suppliers of human adult cadaveric bone, cartilage and placenta tissue are required to comply with federal and state regulations and applicable standards intended to prevent communicable disease transmission. Although we and our suppliers have strict quality controls over the procurement and processing of our tissue:
- •
- we can provide no assurance that these quality controls will be adequate;
- •
- we or our suppliers may fail to comply with such regulations and standards;
- •
- even with compliance, our products might nevertheless be viewed by the public as being associated with transmission of disease; and
- •
- a patient that contracts an infectious disease might assert that the use of our products resulted in disease transmission, even if the patient became infected through another source.
Any actual or alleged transmission of communicable disease could result in patient claims, litigation, distraction of management's attention and potentially increased expenses. Further, any failure in screening, whether by us or other manufacturers of similar products, could adversely affect our reputation, the support we receive from the medical community and overall demand for our products. As a result, such actions or claims, whether or not directed at us, could have a material adverse effect on our reputation with our customers and our ability to distribute our products, which could have a material adverse effect on our business, financial condition and results of operations.
Ethical, legal and other concerns surrounding the use of human tissue may negatively affect public perception of us or our products, or may result in increased scrutiny of our products and product candidates from a regulatory approval perspective, thereby reducing demand for our products, restricting our ability to market our products or adversely affecting the market price for our common stock.
The commercial success of our products depends in part on general public acceptance of the use of human tissue as a part of the treatment of human diseases and other conditions. The use of human tissue including placental tissue from full-term normal pregnancies, which is discarded otherwise, has been the subject of debate regarding related ethical, legal and social issues. We do not use embryonic stem cells or fetal tissue, but the public may fail to differentiate our use of adult tissue, including placental tissue from the use by others of embryonic stem cells or fetal tissue. Ethical concerns have been raised by some about the use of donated human tissue in a for-profit setting. This could result in a negative perception of our company or our products.
Future adverse events in the field of cellular-based therapy or changes in public policy could also result in greater governmental regulation of our products and potential regulatory uncertainty or delay relating to any required testing or approval.
Our dependence upon human tissue necessary to produce our products may impact our ability to produce these products on a large scale.
As an accredited and licensed tissue bank, we acquire some of our tissue supply through our own collection efforts. The remaining portion of our tissue supply is obtained through third-party donor agencies. We and our supplier agencies may not be able to collect sufficient amounts of tissue to meet the demand. Shortages or disruptions in the supply of human tissue can adversely impact our ability to fulfill orders, resulting in decreased sales. For example, in 2016, the FDA issued guidance regarding the
21
Zika virus, which limited our supply of placental tissue for a period of time. Since 2016, we have added additional donor agencies and initiated our own collection efforts. Nevertheless, there can be no assurance that any change in guidance from the FDA or future outbreaks of Zika would not hamper our ability to acquire human placental issue to meet our manufacturing needs.
The availability of donated tissue could also be adversely impacted by public opinion of the donor process as well as our own reputation in the industry. Moreover, the use of human tissue as a part of the treatment for human disease and medical conditions has increased over recent years and continues to increase, creating greater and continually increasing competition and demand for donated human tissue. Even if we are successful in our efforts to expand our compliment of products, we may not be able to secure quantities of human tissue sufficient to meet the demand.
We may not be able to process our products in sufficient quantities to meet market demand or expand our market for the products.
We currently manufacture all of our supply of Grafix and Stravix products at our facility in Columbia, Maryland. Currently, we outsource manufacturing of all of our supply of BIO4 and Cartiform to Aziyo Biologics. Having a single manufacturing source for each of our products could limit our distribution capabilities, increase our distribution costs or cause production delays, any of which can damage our reputation and adversely affect our results of operations. We have entered into an agreement with another third party to manufacture BIO4 and Cartiform and are in advanced discussions with the same third party to establish it as a manufacturer of all of our products in order to increase our manufacturing capacity. A lengthy disruption or shutdown of, or a shortage of supply at, our current manufacturing facilities or the manufacturing facilities of Aziyo or another outsourced contract manufacturer, whether due to the occurrence of natural disasters, the need to comply with the requirements of directives from government agencies, such as the FDA, the lack of supply of human tissue, or otherwise, could have a material adverse effect on our business, financial condition and results of operations.
In addition, our product supply chain and manufacturing infrastructure depends on the performance of a number of complex contracts between us on the one hand and our suppliers on the other. If any of our suppliers, contract manufacturers or other service providers cannot or do not perform their contractual obligations, then our production efforts may suffer. If we cannot or do not perform our contractual obligations, then we may be subject to arbitration, mediation or litigation that could have a material adverse effect on us.
Reliance on third parties entails risks to which we would not be subject if we manufactured all of our products and product components ourselves, including:
- •
- reliance on third parties for regulatory compliance and quality assurance;
- •
- the possible breach of the manufacturing agreement by the third party; and
- •
- the possible termination or nonrenewal of the agreement by the third party, based on its own business priorities, at a time that is costly or inconvenient for us.
We use or may use third parties to help us develop, manufacture, market and/or distribute our products, and our business may be impaired if our third-party relationships are unsuccessful.
We have arrangements in place with third parties that help us with certain aspects of our business. Each third party supports us in differing capacities, including our R&D, human tissue supply, regulatory compliance, tissue procurement, manufacturing, testing, or marketing and distribution
22
efforts. We are subject to a number of risks associated with our dependence upon our third-party relationships, including:
- •
- the third parties may not cooperate with us or perform their obligations under our agreements with them;
- •
- we cannot control the quality, amount and timing of the third parties' resources that will be devoted to performing their responsibilities
under our agreements with them, and they may choose to pursue alternative technologies in preference to those being developed or commercialized with us;
- •
- the third parties may refuse or fail to perform their responsibilities in a timely manner, including breach;
- •
- a third party may terminate its agreement with us for reasons outside our control, and in some cases on limited notice;
- •
- business combinations and changes in a third party's business strategy may adversely affect the third party's willingness or ability to
complete its obligations;
- •
- loss of significant rights to the other party if we fail to meet our obligations under our agreements;
- •
- the ability of a third party to successfully market and promote our products;
- •
- withdrawal of support by the third party following development or acquisition by the third party of competing products; and
- •
- disagreements with a third party regarding our agreement with such third party or ownership of intellectual property or other proprietary rights.
Due to these factors and other possible events, we could suffer delays or experience additional costs in the research, development, supply, manufacture, distribution or sale of our products or we may become involved in litigation or arbitration, which would be time consuming and expensive.
We also rely upon third parties for services and raw materials needed for the manufacture and testing of our products.
In order to produce our products, we require biological media, reagents and other highly specialized materials. This is in addition to the human tissue donations used to manufacture our products. These items must be manufactured and supplied to us in sufficient quantities and in compliance with FDA cGTP regulations. To meet these requirements, we either order from or have entered into supply agreements with firms that manufacture these components to cGTP standards and testing service agreements to perform the necessary quality testing.
We rely on third-party suppliers, contract manufacturers and service providers and commodity markets to secure raw materials, parts, components and sub-assembly systems used in our products or to manufacture our products, which expose us to volatility in the prices and availability of these materials. Some of these suppliers or their sub-suppliers are limited or sole-source suppliers. Some of these suppliers or their sub-suppliers are located outside of the United States. A disruption in deliveries from our third-party suppliers, capacity constraints, production disruptions, price increases, or decreased availability of raw materials or commodities, including as a result of catastrophic events, could have an adverse effect on our ability to meet our commitments to customers or increase our operating costs. Quality and sourcing issues experienced by third-party suppliers can also adversely affect the quality of our products and result in liability and reputational harm.
23
The purchase of components and products from international sources subjects us to extensive U.S. and foreign governmental trade, import, export and customs regulations and laws. If we, our product candidates, or the manufacturing facilities for our product candidates or components, fail to comply with applicable regulatory requirements, a regulatory agency may seize or detain products or refuse to permit the import of products.
Our most significant third-party arrangement is an exclusive agreement with a subsidiary of Stryker for the distribution of BIO4, and our success with this product depends upon the success of this relationship.
We are party to an exclusive service agreement with Stryker for the commercialization of our viable bone matrix allograft under the name BIO4. Pursuant to the agreement, Stryker is the exclusive worldwide marketer and distributor of allograft services for BIO4 for use in surgical applications, including spine, trauma, extremity, cranial and foot and ankle surgery. This agreement is subject to all of the risks and uncertainties applicable to third-party arrangements generally, including those described above.
The agreement with Stryker provides for an initial four-year exclusive term, which commenced in 2015. The term may be extended by Stryker for an additional exclusive period of four years or an additional non-exclusive period of two years. If Stryker extends the term on an exclusive basis, it has the option to further extend the term on an exclusive basis for two more years. We received an initial exclusivity fee of $5.0 million and are entitled to receive additional fees upon any exercise by Stryker of its right to extend the initial term, whether on an exclusive or non-exclusive basis. These additional fees are reduced on a sliding scale if Stryker meets certain revenue thresholds during the initial term or if revenue goals are not met as a result of us not fulfilling our supply obligations. Stryker is entitled to a certain percentage of sales of allograft services for BIO4 and has limited early termination rights. The success of this agreement for us will in part depend upon Stryker's success in marketing and promoting BIO4.
Stryker has significantly greater resources than we do, and this agreement is not as core to its business as it is to ours. We rely upon Stryker's continued performance under this agreement, and any determination by Stryker not to proceed or perform, or any material adverse event that affects Stryker's ability or desire to perform may have a material adverse effect on our business.
We may also enter into additional third-party agreements in the future. If we fail to maintain our existing or any future relationships for any reason, we would need to undertake on our own and at our own expense, or find other third parties, to perform the activities we currently anticipate will be performed by third parties. This may substantially increase our cash requirements. We may not have the capability or financial capacity to undertake these activities on our own, or we may not be able to enter third-party relationships on acceptable terms, or at all. This may limit the programs we can pursue and result in significant delays in the development, sale and manufacture of our products, and may have a material adverse effect on our business.
We distribute products through distribution arrangements that sometimes involve the consignment of inventory to third parties, which results in additional risk and uncertainty as to the viability of consigned inventory, inventory accounting and tax consequences.
We have historically distributed our products either ourselves or through qualified third-party distributors. In some situations, we store consigned inventory on site in freezers at end-use hospital or clinic facilities. We commercialize Grafix and Stravix through the efforts of our own direct distribution and marketing staff, as well as through a network of specialty distributors for certain target markets. BIO4 is sometimes commercialized through a consignment arrangement, and our agreement with Stryker and the end users includes consignment terms, as does our agreement with Arthrex and the end users for Cartiform.
24
Inventory management, revenue recognition, and inventory and receivables accounting are complicated by a consignment arrangement. Because our consigned inventory must be stored at –80° C, it is at risk of thawing, resulting in the total loss of that inventory, which risk of loss is borne by us. From the revenue recognition perspective, no revenue is recognized upon the placement of inventory into consignment, as we retain title and maintain the inventory on our balance sheet. For these products, revenue is recognized when we receive appropriate notification that the product has been used in a surgical procedure. The Restatement corrected, among other things, errors in our prior revenue recognition related to various distributor agreements, including several with consigned inventory. If we are unable to track and maintain proper controls related to consigned inventory, we could experience difficulty in accurately managing and accounting for these consignment arrangements and any related tax implications.
We monitor and verify the condition and status of all consigned inventory on at least a quarterly basis at our expense. We have increased the controls related to consigned inventory, which has increased our operating expenses, and we will likely incur additional expenses in connection with our future planned improvements in our controls related to consigned inventory. In addition, the FDA's, The American Association of Tissue Banks' and other accrediting agencies' rules, regulations or standards require that we monitor our consigned inventory, and require tracking of human tissue and inventory as it moves through the supply chain.
Moreover, should the FDA or any other regulatory authority determine that we are unable for any reason to continue to distribute consigned inventory, either on account of the viability of that inventory or because of the withdrawal of necessary approvals or other qualifications allowing for the distribution and sale of that inventory, the value of that inventory may have to be completely written off and our balance sheet adjusted accordingly. The complexity of our inventory management, or the application of rules, regulations and standards to our product inventory, or the occurrence of any of these negative events, could have an adverse effect on our business, financial condition and results of operations.
We have no control over whether third parties with whom we contract can comply with applicable regulatory requirements.
Our raw material suppliers, contract manufacturers and distributors, and other third parties that we contract with are subject to many or all of the risks and uncertainties to which we are subject. Similar to us, they are subject to ongoing, periodic, unannounced inspection by the FDA and corresponding state and foreign agencies or their designees to ensure strict compliance with applicable regulations and other governmental regulations and corresponding foreign standards. However, we do not control compliance with these regulations and standards by our suppliers, distributors and other third parties with which we contract. They might not be able to comply with these regulatory requirements. If they fail to comply with applicable regulations, the FDA or other regulatory authorities could issue orders of retention, recall, destruction or cessation of manufacturing, or impose sanctions on us, including fines, injunctions, civil penalties, denial of any required marketing approval, delays, suspension or withdrawal of approvals, license revocation, product seizures or recalls, operating restrictions and criminal prosecutions. Any of these actions could significantly and adversely affect the supply and distribution of our products and could have a material adverse effect on our business, financial condition and results of operations.
25
In addition to costs incurred in product development and management of the reimbursement processes, we will incur additional operating expenses in connection with the expansion of our business.
We expect to continue to incur significant operating expenses in connection with our planned expansion of our business as we seek to:
- •
- continue to develop, expand and support our distribution network of third-party distributors and independent sales professionals for the
distribution of Grafix, BIO4, Cartiform and other products;
- •
- continue to expand and support our internal sales force and marketing capabilities, through the hiring of sales and marketing professionals and
building an internal sales and marketing organization;
- •
- hire or engage additional manufacturing, quality control, quality assurance and management personnel as necessary to expand our manufacturing
operations;
- •
- expand our manufacturing capacity for our products, all of which must be manufactured in an FDA compliant and validated product manufacturing
facility; and
- •
- expand and protect our intellectual property portfolio for our products.
Our ability to scale up our production capabilities for larger quantities of these products remains to be proven. Our costs in marketing and distributing these products will also increase as production increases.
Our future capital needs are uncertain and we may need to raise funds in the future, and such funds may not be available on acceptable terms or at all, especially if we fail to relist our common stock for trading on NASDAQ.
Continued expansion of our business will be expensive and we may seek funds from public and private stock offerings, borrowings under future credit facilities or other sources. Our capital requirements will depend on many factors, including:
- •
- the revenues generated by sales of our products;
- •
- the costs associated with expanding our sales and marketing efforts;
- •
- the costs associated with the Restatement and the resolution of related legal proceedings;
- •
- the expenses we incur in manufacturing and managing the supply chain for our products;
- •
- the costs of developing and commercializing new products or technologies;
- •
- the cost of maintaining current products as 361 HCT/Ps or obtaining regulatory approval through the BLA regulatory pathway if any of our
products lose their 361 HCT/P status;
- •
- the number and timing of any acquisitions and other strategic transactions;
- •
- the costs associated with capital expenditures; and
- •
- unanticipated general and administrative expenses.
As a result of these factors, we may seek to raise capital, and such capital may not be available on favorable terms, or at all, especially if we fail to relist our common stock for trading on NASDAQ. Furthermore, if we issue equity or debt securities to raise capital, our existing stockholders may experience dilution, and the new equity or debt securities may have rights, preferences and privileges senior to those of our existing stockholders. In addition, if we raise capital through collaboration, licensing or other similar arrangements, it may be necessary to relinquish valuable rights to our products, potential products or proprietary technologies, or grant licenses on terms that are not
26
favorable to us. If we cannot raise capital on acceptable terms, we may not be able to develop or enhance our products, execute our business plan, take advantage of future opportunities, or respond to competitive pressure, changes in our supplier relationships, or unanticipated customer requirements. Any of these events could adversely affect our ability to achieve our development and commercialization goals, which could have a material adverse effect on our business, financial condition and results of operations.
If our manufacturing and storage facility is damaged or destroyed, our business and prospects would be negatively affected.
If our manufacturing and storage facility or the equipment in the facility were to be significantly damaged or destroyed, we could suffer a loss of some or all of the stored product, raw and other materials and work in process.
We lease 61,203 square feet of space in Columbia, Maryland that houses essentially all of our operations. Currently, we maintain insurance coverage totaling $21.75 million against damage to our property and equipment, an additional $7.35 million to cover business interruption and extra expenses, including R&D restoration expenses. If we have underestimated our insurance needs, we will not have sufficient insurance to cover losses above and beyond the limits on our policies.
The use of our products in human subjects may expose us to product liability claims, and we may not be able to obtain adequate insurance.
We face an inherent risk of product liability claims and only have limited safety data for our products. We derive the raw materials for our products from human donor sources, the production process is complex and the handling requirements are specific, all of which increase the likelihood of quality failures and subsequent product liability claims. We may not be able to obtain or maintain product liability insurance on acceptable terms with adequate coverage, or at all. If we are unable to obtain insurance, or if claims against us substantially exceed our coverage, then our business could be adversely impacted. Whether or not we are ultimately successful in any product liability litigation, such litigation could consume substantial amounts of our financial and managerial resources and could result in, among other things:
- •
- significant awards against us;
- •
- substantial litigation costs;
- •
- recall of the product;
- •
- injury to our reputation; or
- •
- adverse regulatory action.
Any of these results could have a material adverse effect on our business, financial condition and results of operations.
We may implement a product recall or voluntary market withdrawal, which could significantly increase our costs, damage our reputation and disrupt our business.
The manufacturing and marketing of our tissue products involve an inherent risk that our tissue products or processes do not meet applicable quality standards and requirements. In that event, we may voluntarily implement a recall, report a HCT/P deviation or market withdrawal or may be required to do so by a regulatory authority. A recall or market withdrawal of one of our products would be costly and would divert management resources. A recall, HCT/P deviation or market withdrawal regarding one of our products, or a similar product manufactured by another entity, also could impair sales of
27
our products as a result of confusion concerning the scope of the recall or withdrawal, or as a result of the damage to our reputation for quality and safety.
We and our distributor sales representatives must comply with U.S. federal and state fraud and abuse laws, including anti-kickback and false claims laws and equivalent foreign rules.
We are exposed to the risk that our employees, independent contractors, principal investigators, consultants, vendors or third-party distributors may engage in fraudulent or other illegal activity. Misconduct by these parties could include, among other infractions or violations, intentional, reckless and/or negligent conduct or unauthorized activity that violates FDA regulations, manufacturing standards, federal and state healthcare fraud and abuse laws and regulations, laws that require the true, complete and accurate reporting of financial information or data, other commercial or regulatory laws or requirements and equivalent foreign rules. We have policies and procedures intended to prohibit and deter such conduct, including a Code of Ethics for Interactions with Healthcare Professionals, a Code of Conduct, and a Whistleblower Policy. However, it is not always possible to identify and deter misconduct by our employees and third parties. Our precautions to detect and prevent this activity may not be effective in controlling unknown or unmanaged risks or losses or in protecting us from governmental investigations or other actions or lawsuits stemming from a failure to be in compliance with such laws or regulations.
There are numerous U.S. federal and state laws pertaining to healthcare fraud and abuse, including anti-kickback and false claims laws. These laws are complex, and even minor irregularities can potentially give rise to claims that a statute or prohibition has been violated. Our and our distributor's relationships with physicians, other healthcare professionals and hospitals are subject to scrutiny under these laws. The laws that may affect our ability to operate include:
- •
- the federal Anti-Kickback Statute, which prohibits, among other things, knowingly and willfully soliciting, receiving, offering or paying
remuneration, directly or indirectly, in cash or in kind, to induce or reward either the referral of an individual for, or the purchase, order or recommendation of, items or services for which payment
may be made, in whole or in part, under federal healthcare programs, such as the Medicare and Medicaid programs. There can be both criminal and civil penalties for violations;
- •
- the federal civil False Claims Act, which prohibits, among other things, individuals or entities from knowingly presenting, or causing to be
presented, false or fraudulent claims for payment of government funds or knowingly making, using or causing to be made or used, a false record or statement to induce a false claim payment. There are
also criminal penalties, including imprisonment and criminal fines, for making or presenting a false or fictitious or fraudulent claim to the federal government;
- •
- HIPAA, which created federal criminal laws that prohibit, among other actions, knowingly and willfully executing, or attempting to execute, a
scheme to defraud any healthcare benefit program including private third-party payors;
- •
- the federal Physician Payment Sunshine Act, which requires manufacturers of drugs, biologics and medical supplies for which payment is available under Medicare, Medicaid or the Children's Health Insurance Program to report annually (with certain exceptions) to CMS information related to payments or other "transfers of value" made to physicians and teaching hospitals, and requires applicable manufacturers and group purchasing organizations to report annually to CMS ownership and investment interests held by physicians and their immediate family members and payments or other "transfers of value" to such physician owners;
28
- •
- the federal Foreign Corrupt Practices Act and similar anti-bribery laws in other jurisdictions, which generally prohibit companies and their
intermediaries from making improper payments to government officials and/or other persons for the purpose of obtaining or retaining business; and
- •
- analogous state and foreign law equivalents of each of the above federal laws, such as:
- •
- anti-kickback and false claims laws which may apply to items or services reimbursed by any third-party payor, including commercial
insurers; or
- •
- state laws that require biologic and drug manufacturers to report information related to payments and other transfers of value to physicians and other healthcare providers or marketing expenditures, many of which differ from each other in significant ways and may not have the same effect, thus complicating compliance efforts.
Violations of any of the laws described above or any other governmental regulations are punishable by significant civil, criminal and administrative penalties, damages, fines and exclusion from government-funded healthcare programs, such as Medicare and Medicaid. Although compliance programs can mitigate the risk of investigation and prosecution for violations of these laws, the risks cannot be entirely eliminated. Moreover, achieving and sustaining compliance with applicable federal and state privacy, security and fraud laws may prove costly.
In the course of conducting our business, we must adequately address quality issues that may arise with our products, as well as defects in third-party components included in our products. Although we have established internal procedures to minimize risks that may arise from quality issues, we may not be able to eliminate or mitigate occurrences of these issues and associated liabilities. If the quality of our products does not meet the expectations of physicians or patients, then our brand and reputation could suffer and our business could be adversely impacted.
A significant portion of our revenues and accounts receivable come from government accounts.
We have significant sales to the federal government (whether we are selling our products directly to government accounts or through our current distributors). Any disruption of our products on the Federal Supply Schedule or a change in the way the federal government purchases products like ours, or the price it is willing to pay for our products, could materially and adversely affect our business, results of operations and financial condition.
Changes in internal purchasing procedures by the VA may have an adverse effect on our ability to sell our products to VA hospitals and may have a material adverse effect on our sales and results of operations.
Recently, the VA announced a change in its internal purchasing procedures, which requires internal pre-authorization by a warranted contracting officer for purchases of certain types of products, including Grafix and Stravix, for greater than $3,500, except for VA-owned inventory or a consignment agreement negotiated by a VA contracting officer. Pre-authorization delays the purchase of our products. In addition, a pre-authorized product may only be used for the patient for whom authorization was granted. If such product is not used for the authorized patient, it may not be used for any other patient and the product must be returned. These and other changes in purchasing procedures and policies by the VA could have an adverse effect on our ability to sell our products to VA hospitals.
The ongoing cost-containment efforts of GPOs and integrated delivery networks ("IDNs") may have a material adverse effect on our results of operations.
Many customers for our products use GPOs or are members of IDNs in an effort to contain costs. GPOs and IDNs negotiate pricing arrangements with medical supply manufacturers and distributors, which negotiated prices are made available to a GPO's or IDN's affiliated hospitals and
29
other members. If we are not one of the providers selected by a GPO or IDN, affiliated hospitals and other members may be less likely to purchase our products, and, if the GPO or IDN has negotiated a strict compliance contract for another manufacturer's products, we may be precluded from making sales to members of the GPO or IDN for the duration of the contractual arrangement. Our failure to respond to the cost-containment efforts of GPOs and IDNs may cause us to lose market share to our competitors and could have a material adverse effect on our sales and results of operations.
Significant disruptions of information technology systems or breaches of information security could adversely affect our business.
We rely to a large extent upon information technology systems to operate our business. We collect, store and transmit large amounts of confidential information (including, but not limited to, personal information and intellectual property). We also have outsourced significant elements of our operations to third parties, including vital components of our information technology infrastructure. As a result, many third-party vendors may or could have access to our confidential information. The size and complexity of our information technology and information security systems, and those of our third-party vendors (and the large amounts of confidential information that is present on them), make such systems potentially vulnerable to service interruptions or to security breaches from inadvertent or intentional actions by our employees or vendors, or from malicious attacks by third parties. Such attacks are of ever-increasing levels of sophistication and are made by groups and individuals with a wide range of motives (including, but not limited to, industrial espionage and market manipulation) and expertise. Our efforts to prevent service interruptions or security breaches may not be sufficient. Any interruption or breach in our systems could result in the loss of critical or sensitive confidential information or intellectual property, allow third parties to gain material, inside information that they could use to trade our securities, and could result in financial, legal, business, operational and reputational harm to us.
We may expand our business through acquisitions, licenses, investments and other commercial arrangements in other companies or technologies, which contain significant risks.
We periodically evaluate strategic opportunities to acquire companies, divisions, technologies, products and rights through licenses, distribution agreements, investments or outright acquisitions to grow our business. In connection with one or more of those transactions, we may:
- •
- issue additional equity securities that would dilute our stockholders' value;
- •
- use cash that we may need in the future to operate our business;
- •
- incur debt that could have terms unfavorable to us or that we might be unable to repay;
- •
- structure the transaction in a manner that has unfavorable tax consequences, such as a stock purchase that does not permit a step-up in the tax
basis for the assets acquired;
- •
- be unable to realize the anticipated benefits, such as increased revenues, cost savings or synergies from additional sales;
- •
- be unable to secure the services of key employees related to the acquisition; and
- •
- be unable to succeed in the marketplace with the acquisition.
Any of these items could materially and adversely affect our revenues, financial condition and profitability. Business acquisitions also involve the risk of unknown liabilities associated with the acquired business, which could be material. Incurring unknown liabilities or the failure to realize the anticipated benefits of an acquisition could materially and adversely affect our business if we are unable to recover our initial investment. Inability to recover our investment, or any write off of such
30
investment, associated goodwill or assets, could have a material adverse effect on our business, financial condition and results of operations.
Risks Related to Regulatory Approval and Other Government Regulations
Should the FDA determine that any of our current products do not meet regulatory requirements that permit qualifying human cells, tissues and cellular and tissue-based products to be manufactured, stored, labeled and distributed without pre-marketing approval, we may be required to stop manufacturing and distributing such products.
The FDA has developed a tiered, risk-based regulatory framework for human cells, tissues and cellular and tissue-based products, or so-called 361 HCT/Ps (meaning that they comply with section 361 of the Public Health Service Act and with 21 CFR Part 1271). The framework includes criteria for facility management, quality assurance, donor selection and manufacture of 361 HCT/Ps. We believe that commercial sale of Grafix, Stravix, BIO4 and Cartiform meets the regulatory definition of 361 HCT/P products and as a result do not require the FDA's pre-marketing approval. Specifically, we believe all of our current products:
- •
- are minimally manipulated;
- •
- are intended for homologous use only, as reflected in our labeling, advertising, and all other indications of our objective intent
(e.g., that Grafix be used only as a wound cover, that Stravix be used only as a surgical cover, that BIO4 be used only for
augmentation of bone defects, and that Cartiform be used only as an osteochondral allograft);
- •
- are not combined with another article except for water, crystalloids, or a sterilizing, preserving or storage agent in a manner that raises no
new clinical safety concerns; and
- •
- do not have a systemic effect and are not dependent on the metabolic activity of living cells for their primary function.
These criteria form the framework governing our advertising and promotional activities. If we advertise or promote any product in a manner that conveys an intent that it be used for non-homologous uses, that suggests that the product's primary function depends on systemic effects or the metabolic activity of living cells, or that indicates that our manufacturing process manipulates the product more than minimally by altering the original relevant characteristics of the tissue relating to its utility for reconstruction, repair, or replacement, we will risk causing our products to no longer qualify as 361 HCT/Ps.
On September 26, 2013, we received the Untitled Letter from the FDA. The agency uses untitled letters to communicate violations that the FDA does not consider of regulatory significance sufficient to lead to an enforcement action. The Untitled Letter stated that Grafix and Ovation did not meet the definition of a 361 HCT/P. Among the grounds for the FDA's position were our marketing claims, including wound healing claims for Grafix. Specifically, the Untitled Letter indicated that Grafix did not meet the requirements because it is dependent upon the metabolic activity of living cells for its primary function and is not intended for autologous use or allogeneic use in a first or second degree relative. On September 30, 2013, we provided clarifying information to the FDA addressing these concerns. Specifically, we communicated that while Grafix does retain the natural cell population, it is not enriched or expanded in any way; instead, the tissue is preserved so that it closely resembles the source tissue in its native state in accordance with the FDA's definition of minimal manipulation.
In order to make our marketing claims for Grafix clearer, we committed to the FDA to update our labeling and marketing materials for Grafix to that of a wound cover. By October 2014, we completed all commitments made to the FDA, including the discontinuance of Ovation. In April 2016, the FDA performed a routine inspection of us, which included follow-up on the actions taken to address the
31
Untitled Letter. In May 2016, we received an FDA Establishment Inspection Report which stated that there were no observations, findings, warnings or untitled letters for either the routine inspection or the Untitled Letter follow-up.
In March 2017, we completed the development of Prestige Lyotechnology as an alternative to cryopreservation, which previously had been the only method available for long-term preservation of living cells and tissues, and which we are using to process our current products. We designed our new technology to preserve living cells within tissues while stored at room temperatures. We intend to use Prestige Lyotechnology in developing placental products. We believe that any products based on our new technology will also comply with the above requirements for 361 HCT/Ps.
We engage in ongoing communication with FDA representatives regarding the applicable regulatory requirements and pathways for our products and product candidates. Determining whether a product complies with these regulatory requirements and pathways is complex and dependent upon numerous factors and subject to varying interpretations and conclusions. In November 2017, the FDA finalized its Guidance Document entitled "Regulatory Considerations for Human Cell, Tissues, and Cellular Tissue-Based Products: Minimal Manipulation and Homologous Use." This document provides the FDA's current guidance on 361 HCT/Ps. Specifically, it clarifies the FDA's definitions of minimal manipulation and homologous use. The FDA has given affected companies until November 2020 to determine if they meet the requirements and, if not, to file an IND.
We believe all of our current products (Grafix, Stravix, BIO4 and Cartiform), as well as our products being developed using our Prestige Lyotechnology, meet, or will meet, the FDA's current interpretations. However, the FDA may not agree with our views on these matters. Should the FDA decide that our current and future products do not meet the regulatory definition of 361 HCT/Ps, we will not be able to produce and distribute these products unless and until we submit a BLA and obtain pre-marketing approval from the FDA, which would require clinical trials and could take years to obtain, at significant expense. This or any other determination by the FDA that adversely affects our ability to produce or to market any of our products or product candidates would have a material adverse effect on our business, financial condition and results of operations.
Our business is subject to an inherently uncertain and evolving area of regulation.
The regulatory framework that the FDA has developed for 361 HCT/Ps is inherently uncertain and the FDA's regulation of 361 HCT/Ps is evolving. The FDA may alter or recalibrate its regulatory interpretations and enforcement activities, including in the event a competitor obtains pre-marketing approval for a product similar to any of our products. Further, the FDA could require that our products, which lack pre-marketing approval by the FDA, be taken off the market.
In addition, while the FDA's advertising and promotional labeling regulations do not apply to 361 HCT/Ps, the agency could become more exacting with regard to acceptable advertising and promotional activities for 361 HCT/Ps. Specifically, under FDA regulations, a manufacturer may not promote a 361 HCT/P in a manner that communicates an objective intent of the manufacturer for the HCT/P to be used for non-homologous uses. In addition, a manufacturer risks undermining its product's 361 status if it describes its product in a way that suggests that the product does not otherwise meet the criteria for qualifying as a 361 HCT/P, such as by emphasizing the metabolic activity of live cells in the product. Because various government agencies that regulate HCT/Ps, such as the FDA and CMS, employ different terms to describe HCT/Ps and apply different criteria to its decisions, a risk exists that our sales representatives and other employees may use terms applicable to one regulatory regime that are detrimental in another regulatory regime. An example would be that describing an HCT/P as treating a wound for purposes of justifying reimbursement could be interpreted by the FDA as implying that the manufacturer intends the product to be used for non-homologous wound healing.
32
If the FDA determines that any of our current products are not 361 HCT/Ps, or that any of our future products are not 361 HCT/Ps, we will be required to seek and obtain pre-marketing regulatory approval.
If the FDA determines that one or more of our current products do not meet the criteria for 361 HCT/Ps, we will need to pursue pre-marketing approval applicable to biologics in the United States, which is also referred to as licensure. We are currently considering product candidates that require licensure from the FDA. In the United States, a company must complete rigorous preclinical testing and extensive clinical trials that demonstrate the safety, purity and potency of a biological product in order to apply for licensure to market the product. The steps generally required by the FDA include:
- •
- performance of preclinical (animal and laboratory) tests, in accordance with the FDA's cGLP regulations and other applicable requirements;
- •
- submissions to the FDA of an IND, which must become effective before clinical trials may commence;
- •
- approval by an independent IRB of each clinical site before a clinical trial is initiated;
- •
- performance of adequate and well-controlled clinical trials according to the FDA's cGCP regulations, and any additional requirements for the
protection of human research subjects and their health information to establish the safety, purity and potency of the investigational biological product in the intended target population for its
intended use:
- •
- establishment and validation of a consistent and reproducible manufacturing process intended for commercial use, including the collection of
appropriate manufacturing data;
- •
- preparation and submission to the FDA of a BLA for marketing approval that includes substantial evidence of safety, purity and potency from
results of nonclinical testing and clinical trials;
- •
- satisfactory completion of an FDA inspection of the manufacturing facility or facilities where the biological product candidate is produced to
assess compliance with cGMPs and to assure that the facilities, methods and controls are adequate to preserve the biological product candidate's identity, safety, strength, quality, potency and
purity;
- •
- potential FDA inspection of the nonclinical and clinical trial sites that generated the data in support of the BLA; and
- •
- FDA review and approval of the BLA before any commercial sale or shipment of the product can begin again.
The processes are expensive and can take many years to complete. If we are required to obtain pre-marketing approval from the FDA for any of our existing or future products, we may not be able to demonstrate the safety, purity and potency of our products to the satisfaction of regulatory authorities. The start of clinical trials can be delayed or take longer than anticipated for many and varied reasons, many of which are out of our control. Safety concerns may emerge that could lengthen the ongoing clinical trials or require additional clinical trials to be conducted. Promising results in early clinical trials may not be replicated in subsequent clinical trials. Regulatory authorities may also require additional testing, and we may be required to demonstrate that our products represent an improved form of treatment over existing therapies, which we may be unable to do without conducting further clinical trials. Moreover, if the FDA grants regulatory approval of a product, the approval may be limited to specific indications or limited with respect to its distribution. Expanded or additional indications for approved products may not be approved, which could limit our revenue opportunities.
33
Our business is subject to continuing regulatory compliance by the FDA and other authorities, which is costly and our failure to comply could result in negative effects on our business.
As discussed above, the FDA has specific regulations governing our tissue-based products, or HCT/Ps. The FDA's regulation of HCT/Ps includes requirements for registration and listing of products, donor screening and testing, manufacture and distribution, labeling, record keeping and adverse-reaction reporting, and inspection and enforcement. The FDA has broad regulatory and enforcement powers.
If we fail to comply with the FDA regulations regarding our tissue-based products, the FDA could take enforcement action, including, without limitation, any of the following sanctions that may be relevant to our current or future business operations, and the manufacture of our products or processing of our tissue could be delayed or terminated:
- •
- untitled letters and warning letters;
- •
- orders of retention, recall, destruction and cessation of manufacturing;
- •
- product seizures, injunctions and civil penalties;
- •
- operating restrictions;
- •
- refusing applications for licensure of new products;
- •
- suspending current applications for licensure, or revoking or suspending licenses already granted;
- •
- refusal to allow the importation of our products or raw materials; and
- •
- criminal prosecution.
It is likely that the FDA's regulation of HCT/Ps will continue to evolve in the future. Complying with any such new regulatory requirements may entail significant time delays and expense, which could have a material adverse effect on our business, financial condition and results of operation.
In addition to FDA regulations, we are subject to other laws, rules, regulations and standards regarding the use of human tissue.
We are registered with the FDA as a tissue bank. In addition, some states have their own tissue banking regulations. We are licensed as a tissue bank in Maryland, California, New York and Florida. If we fail to comply with any of the requirements for licensure as a tissue bank, we will not be able to operate as a tissue bank and collect and store donor tissue. The loss of this licensure could adversely impact the quantity of human tissue available to us and our ability to process our products, which could have a material adverse effect on our business, financial condition and results of operations.
In addition, procurement of certain human organs and tissues for transplantation is subject to the restrictions of NOTA, which prohibits the transfer of certain human organs, including skin and related tissue, for valuable consideration, but permits reasonable payment associated with the removal, transportation, implantation, processing, preservation, quality control and storage of human tissue and skin. We reimburse tissue banks, hospitals and physicians for their services associated with the recovery, storage and transportation of donated human tissue. If we were to be found to have violated NOTA's prohibition on the sale or transfer of human tissue for valuable consideration, we would potentially be subject to criminal enforcement sanctions, which could materially and adversely affect our business, financial condition and results of operations.
34
Our business involves the use of hazardous materials that could expose us to environmental and other liability.
We have facilities in Maryland that are subject to various local, state and federal laws and regulations relating to safe working conditions, laboratory and manufacturing practices, and the use and disposal of hazardous or potentially hazardous substances, including chemicals, micro-organisms and various radioactive compounds used in connection with our R&D and manufacturing activities. These laws include the Occupational Safety and Health Act, the Toxic Test Substances Control Act and the Resource Conservation and Recovery Act. We cannot assure you that accidental contamination or injury to our employees and third parties from hazardous materials will not occur. We do not have insurance to cover claims arising from our use and disposal of these hazardous substances other than limited clean-up expense coverage for environmental contamination due to an otherwise insured peril, such as fire.
Federal and state laws that protect the privacy and security of personal information may increase our costs and limit our ability to collect and use that information and subject us to liability if we are unable to fully comply with such laws.
Numerous federal and state laws, rules and regulations govern the collection, dissemination, use, security and confidentiality of personal information, including individually identifiable health information. These laws include:
- •
- Provisions of HIPAA that limit how covered entities and business associates may use and disclose PHI, provide certain rights to individuals
with respect to that information and impose certain security requirements;
- •
- HITECH, which strengthens and expands the HIPAA Privacy Rule and Security Rules and imposes data breach notification obligations;
- •
- Other federal and state laws restricting the use and protecting the privacy and security of personal information, including health information,
many of which are not preempted by HIPAA;
- •
- Federal and state consumer protection laws; and
- •
- Federal and state laws regulating the conduct of research with human subjects.
As part of our business operations, including our medical record keeping, third-party billing and reimbursement and R&D activities, we collect and maintain PHI in paper and electronic format. Standards related to health information, whether implemented pursuant to HIPAA, HITECH, state laws, federal or state action or otherwise, could have a significant effect on the manner in which we handle personal information, including healthcare-related data, and communicate with payors, providers, patients, donors and others, and compliance with these standards could impose significant costs on us or limit our ability to offer services, thereby negatively impacting the business opportunities available to us.
If we are alleged to not comply with existing or new laws, rules and regulations related to personal information we could be subject to litigation and to sanctions that include monetary fines, civil or administrative penalties, civil damage awards or criminal penalties.
We face significant uncertainty in the industry due to government healthcare reform.
There have been and continue to be proposals by the federal government, state governments, regulators and third-party payors to control healthcare costs, and generally, to reform the healthcare system in the United States. With the Trump Administration and the 115th Congress, there have been certain regulatory and legislative changes to the Patient Protection and Affordable Care Act (the
35
"Affordable Care Act"). For example, the Tax Cuts and Jobs Act enacted on December 22, 2017, eliminated the shared responsibility payment for individuals who fail to maintain minimum essential coverage under section 5000A of the Internal Revenue Code of 1986, commonly referred to as the individual mandate, beginning in 2019. Additional legislative changes to and regulatory changes under the Affordable Care Act remain possible. However, it remains unclear how any new regulations or legislation might affect the prices we may obtain for any of our products. Any reduction in reimbursement from Medicare and other government programs may result in a similar reduction in payments from private payors. The implementation of cost containment measures or other healthcare reforms may harm our business and prevent us from being able to attain and maintain profitability. We also cannot predict what further reform proposals, if any, will be adopted, when they will be adopted, or what impact they may have on us.
Risks Related to Intellectual Property
Given our limited patent position in regard to our products, if we are unable to protect the confidentiality of our proprietary information and know-how related to these products, our competitive position would be impaired and our business, financial condition and results of operations could be adversely affected.
Our success depends, in part, on our ability to obtain patents, maintain trade secret protection and operate without infringing on the proprietary rights of third parties. Our policy is to file patent applications to protect technology, inventions and improvements that we consider important to our business and operations. We hold an ownership interest in a number of pending and issued patents in the United States and foreign countries with respect to our products and technologies.
We have pending patent applications in the United States Patent and Trademark Office, the European Patent Office, and the patent offices of other foreign jurisdictions, and it is possible that we will need to defend patents from challenges by others from time to time in the future. Certain of our U.S. patents may also be challenged by parties who file a request for post-grant review or inter partes reexamination under the America Invents Act of 2011 or ex parte reexamination. Post-grant proceedings are increasingly common in the United States and are costly to defend. Our patent rights may not provide us with a proprietary position or competitive advantages against competitors. Furthermore, even if the outcome is favorable to us, the enforcement of our intellectual property rights can be extremely expensive and time consuming.
A significant amount of our technology, including our information regarding the manufacturing process for our products, is patent pending, unpatented or is maintained by us as trade secrets or confidential know-how. In an effort to protect this proprietary information, we require our employees, consultants, service providers, advisors and other third parties to execute confidentiality agreements upon the commencement of their relationships with us. These agreements require that all confidential information developed by the individual or entity or made known to the individual or entity by us during the individual's or entity's relationship with us be kept confidential and not disclosed to third parties without prior written consent by us. These agreements, however, may not provide us with adequate protection against improper use or disclosure of trade secrets or confidential information, and these agreements may be breached. For example, a portion of the manufacturing methodology and know-how for Grafix is protected by trade secret or through confidentiality arrangements. A breach of confidentiality could affect our competitive position. Also, others may independently develop substantially equivalent proprietary information and techniques or otherwise gain access to our trade secrets or know-how.
Adequate remedies may not exist in the event of unauthorized use or disclosure of our confidential information. The disclosure of our trade secrets or know-how could impair our competitive position and could have a material adverse effect on our business, financial condition and results of operations.
36
If our patent position does not adequately protect our products, others could compete against us more directly, which would harm our business and have a material adverse effect on our business, financial condition and results of operations.
Patent law relating to the patentability and scope of claims in the biotechnology field is evolving and our patent rights are subject to this additional uncertainty. The degree of patent protection that will be afforded to our products in the United States and other important commercial markets is uncertain and is dependent upon the scope of protection decided upon by the patent offices, courts and governments in these countries. There is no certainty that our existing patents or others, if obtained, will provide us protection from competition or provide commercial benefit. Others may independently develop similar products or processes to those developed by us, duplicate any of our products or processes or, if patents are issued to us, design around any products and processes covered by our patents. We expect to, when appropriate, file product and process applications with respect to our inventions. However, we may not file any such applications or, if filed, the patents may not be issued. Patents issued to or licensed by us may be infringed by the products or processes of others.
Because of the extensive time required for development, testing and regulatory review of a potential product, it is possible that, before any of our products can be commercialized, any related patent may expire or remain in force for only a short period following commercialization, thereby reducing any advantages of the patent. A portion of our technology, including certain know-how regarding the production processes for our products, is unpatented and is maintained by us as trade secrets. The lack of patent protection for our products reduces the barrier for entry by others and makes these products susceptible to increased competition, which could be harmful to our business.
If we infringe or are alleged to infringe intellectual property rights of third parties, it will adversely affect our business, financial condition and results of operations.
Our research, development and commercialization activities, and the manufacture or distribution of our products, may infringe or be alleged to infringe patents owned by third parties and to which we do not hold licenses or other rights. There may be patent applications that have been filed but not published that, when issued, could be asserted against us. These third parties could bring claims against us that would cause us to incur substantial expenses and, if successful against us, could cause us to pay substantial damages. Further, if a patent infringement suit were brought against us, we could be enjoined from certain activities including a stop or delay in research, development, manufacturing or sales activities related to the product or technology that is the subject of the suit.
As a result of patent infringement claims, or in order to avoid potential claims, we may choose or be required to seek a license from the third party. These licenses may not be available on acceptable terms, or at all. Even if we are able to obtain a license, the license would likely obligate us to pay license fees or royalties or both, and the rights granted to us might be nonexclusive, which could result in our competitors gaining access to the same intellectual property. Ultimately, we could be prevented from commercializing a product, or be forced to cease some aspect of our business operations, if, as a result of actual or threatened patent infringement claims, we are unable to enter into licenses on acceptable terms.
The cost to us of any patent litigation or other proceeding, even if resolved in our favor, could be substantial. Some of our competitors may be able to sustain the costs of such litigation or proceedings more effectively than we can because of their greater financial resources. Patent litigation and other proceedings may also absorb significant management time. Uncertainties resulting from the initiation and continuation of patent litigation or other proceedings could have a material adverse effect on our ability to compete in the marketplace and, as a result, on our business, financial condition and results of operations.
37
We may become involved in lawsuits or administrative proceedings to protect or enforce our patents or the patents of our service providers or licensors, which could be expensive and time consuming.
Litigation may be necessary to enforce patents issued or licensed to us, to protect trade secrets or know-how, or to determine the scope and validity of proprietary rights. Litigation, post-grant review, reexamination, opposition or interference proceedings could result in substantial additional costs and diversion of management focus. If we are ultimately unable to protect our technology, trade secrets or know-how, we may be unable to operate profitably.
Competitors may infringe our patents or the patents of our service providers or licensors. As a result, we may be required to file infringement claims to protect our proprietary rights. This can be expensive, particularly for a company of our size, and time-consuming. In addition, in an infringement proceeding, a court may decide that a patent of ours is invalid or is unenforceable, or may refuse to enjoin the other party from using the technology at issue. An adverse determination of any litigation or defense proceedings could put one or more of our patents at risk of being invalidated or interpreted narrowly. Interference proceedings brought by the United States Patent and Trademark Office may be necessary to determine the priority of inventions with respect to our patent applications or those of our service providers or licensors. Litigation or interference proceedings may fail and, even if successful, may result in substantial costs and distraction to our management. We may not be able, alone or with our service providers and licensors, to prevent misappropriation of our proprietary rights.
Furthermore, though we would seek protective orders where appropriate, because of the substantial amount of discovery required in connection with intellectual property litigation, there is a risk that some of our confidential information could be compromised by disclosure during this type of litigation. In addition, during this kind of litigation, there could be public announcements of the results of hearings, motions or other interim proceedings or developments. If investors perceive these results to be negative, the market price for our common stock could be significantly harmed.
The prosecution and enforcement of patents licensed to us by third parties are not within our control, and without these technologies, our products may not be successful and our business would be harmed if the patents were infringed or misappropriated.
We have obtained licenses from third parties for patents and patent application rights, allowing us to use intellectual property rights owned by or licensed to these third parties. We do not control the maintenance, prosecution, enforcement or strategy for many of these patents or patent application rights and as such are dependent in part on the owners of the intellectual property rights to maintain their viability. Their failure to do so could significantly impair our ability to exploit these technologies.
Risks Related to Our Common Stock
Our common stock has been delisted from trading on NASDAQ, which we expect to continue to have a material effect on us and our stockholders.
As a result of the Restatement, we are delinquent in the filing of our Annual Reports on Form 10-K for the years ended December 31, 2015 and December 31, 2016, and our Quarterly Reports on Form 10-Q for the quarters ended March 31, 2016, June 30, 2016, September 30, 2016, March 31, 2017, June 30, 2017 and September 30, 2017. NASDAQ formally delisted our common stock on April 28, 2017 as a result of our failure to timely file our SEC reports. There can be no assurance whether or when our common stock will again be listed for trading on NASDAQ or any other national securities exchange. Further, the market price of our shares might decline and become more volatile, and our stockholders may find that their ability to trade in our stock is limited. Furthermore, institutions whose charters do not allow them to hold securities in unlisted companies might sell our shares, which could have a further adverse effect on the price of our stock.
38
The trading price of the shares of our common stock is highly volatile, and purchasers of our common stock could incur substantial losses.
Our stock price is volatile. The stock market in general and the market for biotechnology companies in particular have experienced extreme volatility that has often been unrelated to the operating performance of particular companies. As a result of this volatility, investors may not be able to sell their common stock at or above the price they paid for it. The market price for our common stock may be influenced by many factors, including:
- •
- reduced access to a trading market for our common stock as a result of our delisting from NASDAQ;
- •
- loss of investor confidence in us due to the Restatement;
- •
- the recent changes in our senior management team and departures of other key personnel;
- •
- the outcome of the existing lawsuits against us and the announcement of any future litigation matters, if any;
- •
- the marketing and distribution of new products by our competitors;
- •
- regulatory developments in the United States, generally or specific to us and our products;
- •
- changes in the structure of healthcare payment systems;
- •
- expiration or termination of our significant relationships with third parties;
- •
- market conditions in the pharmaceutical and biotechnology sectors and issuance of securities analysts' reports or recommendations;
- •
- sales of substantial amounts of our stock by existing stockholders;
- •
- sales of our stock by insiders;
- •
- variations in our financial results or those of companies that are perceived to be similar to us;
- •
- general economic, industry and market conditions;
- •
- announcements by us of significant acquisitions, strategic partnerships, joint ventures or capital commitments;
- •
- commercial, stockholder class action and derivative, intellectual property or product liability litigation against us; and
- •
- the other factors described in this "Risk Factors" section.
There is no significant trading market or price discovery available for our common stock and purchasers of our common stock may be unable to sell their shares.
Our common stock is currently quoted on the Pink OTC Markets Inc., referred to as the "pink sheets"; however trading to date has been limited. If activity in the market for shares of our common stock does not increase, purchasers of our shares may find it difficult to sell their shares. The pink sheets are a less recognized market than the NASDAQ and other stock exchanges and are often characterized by low trading volume and significant price fluctuations. These and other factors may further impair our stockholders' ability to sell their shares when they want to and/or could depress our stock price. As a result, stockholders may find it difficult to dispose of their shares or obtain accurate quotations of the price of our securities because smaller quantities of shares could be bought and sold, transactions could be delayed, and security analyst and news coverage of our Company may be limited. These factors could result in lower prices and larger spreads in the bid and ask prices for our shares of common stock.
39
We do not intend to pay cash dividends.
We currently do not intend to pay cash dividends for the foreseeable future. We currently intend to retain earnings, if any, to finance our operations and growth. As a result, capital appreciation, if any, of our common stock will be an investor's only source of potential gain from our common stock for the foreseeable future.
Certain provisions of Maryland law and of our charter and bylaws contain provisions that could delay and discourage takeover attempts and any attempts to replace our current directors by stockholders.
Certain provisions of Maryland General Corporation Law ("MGCL") and of our Maryland charter and Maryland bylaws contain provisions that may make it more difficult to or prevent a third party from acquiring control of us or changing our Board and management. These include, but are not limited to, the following:
- •
- authorization of the board of directors to issue shares of preferred stock generally without stockholder approval;
- •
- requirements that special meetings of stockholders may only be called by stockholders, upon request of stockholders holding at least 20% of the
capital stock issued and outstanding; and
- •
- requirements that our stockholders comply with advance notice procedures in order to nominate candidates for election to our Board or to place stockholders' proposals on the agenda for consideration at stockholder meetings.
Maryland law also prohibits "business combinations" between us and an interested stockholder or an affiliate of an interested stockholder for five years after the most recent date on which the interested stockholder becomes an interested stockholder. These business combinations include a merger, consolidation, share exchange or, in certain circumstances specified in the statute, an asset transfer or issuance or reclassification of equity securities. Maryland law defines an interested stockholder as any person who beneficially owns 10% or more of the voting power of the corporation's stock, or an affiliate or associate of the corporation who, at any time within the two-year period prior to the date in question, was the beneficial owner of 10% or more of the voting power of the corporation's then-outstanding voting stock. A person is not an interested stockholder if the board of directors of the corporation approved in advance the transaction by which the person otherwise would have become an interested stockholder. However, such approval may be conditional.
After the five-year prohibition, any business combination between the corporation and an interested stockholder or an affiliate of an interested stockholder generally must be recommended by the board of directors and approved by the affirmative vote of at least 80% of the votes entitled to be cast by holders of the then-outstanding shares of voting stock, and two-thirds of the votes entitled to be cast by holders of the voting stock other than stock held by the interested stockholder with whom or with whose affiliate the business combination is to be effected or stock held by an affiliate or associate of the interested stockholder. These super-majority vote requirements do not apply if the holders of the common stock receive a minimum price, as defined under Maryland law, for their stock in the form of cash or other consideration in the same form as previously paid by the interested stockholder for its stock.
The statute permits various exemptions from its provisions, including business combinations that are approved or exempted by the board of directors before the time that the interested stockholder becomes an interested stockholder. Our Board has not exempted us from the business combination statute. Consequently, unless the Board adopts an exemption from this statute in the future, the statute will be applicable and may affect business combinations between us and other persons. The statute may discourage others from trying to acquire control of us or increase the difficulty of consummating any such acquisition.
40
Subtitle 8 of Title 3 of the MGCL ("Subtitle 8") permits a Maryland corporation with a class of equity securities registered under the Exchange Act, and with at least three independent directors to elect to be subject to any or all of five provisions:
- •
- a classified board;
- •
- a two-thirds vote requirement to remove a director;
- •
- a requirement that the number of directors be fixed only by the vote of the directors;
- •
- a requirement that a vacancy on the board be filled only by the remaining directors and for the remainder of the full term of the directorship
in which the vacancy occurred; and
- •
- a majority requirement for the calling of a special meeting of stockholders.
An eligible Maryland corporation like us can elect into this statute by provision in its charter or bylaws or by a resolution of its board of directors, without stockholder approval. Furthermore, we can elect to be subject to the above provisions regardless of any contrary provisions in the charter or bylaws. Pursuant to Subtitle 8, we have elected to provide that vacancies on our Board may be filled only by the remaining directors and for the remainder of the full term of the class of directors in which the vacancy occurred.
Concentration of ownership of our common stock among our existing executive officers, directors and principal stockholders may prevent others from influencing significant corporate decisions, and provisions in our charter allowing for a stockholder vote by consent in lieu of a meeting may make it easier for stockholders holding a majority of our common stock to take action.
Our executive officers, directors and beneficial owners of 5% or more of our common stock and their affiliates, in aggregate, beneficially own approximately 52.3% of our outstanding common stock as of March 28, 2018. Included among this 52.3%, Peter Friedli, the Chairman of the Board, and certain entities with which he is affiliated, beneficially own approximately 42.9% of our outstanding common stock as of March 28, 2018. These persons, acting together, will be able to significantly influence all matters requiring stockholder approval, including the election and removal of directors and any merger or other significant corporate transactions. The interests of this group of stockholders may not coincide with our interests or the interests of other stockholders.
Moreover, as permitted by the MGCL, our charter provides that the holders of common stock entitled to vote generally in the election of directors may take action or consent to any action by delivering a consent in writing or by electronic transmission of the stockholders entitled to cast not less than the minimum number of votes (which is generally either a majority of votes cast or a majority of votes entitled to be cast) that would be necessary to authorize or take the action at a stockholders meeting if the corporation gives notice of the action not later than ten (10) days after the effective date of the action to each holder of the class of common stock and to each stockholder who, if the action had been taken at a meeting, would have been entitled to notice of the meeting.
Accordingly, these persons acting together, and Mr. Friedli specifically, currently has, and will continue to have, a significant influence over the outcome of all corporate actions requiring stockholder approval, including any actions that may be taken by stockholder consent in lieu of a meeting.
Risks Related to the Restatement of Financial Statements and Failure to File SEC Reports
We have restated our prior financial statements, which may lead to additional risks and uncertainties, including loss of investor confidence and negative impacts on our stock price.
As discussed in the 2014 Form 10-K/A, we have restated our audited financial statements for the year ended December 31, 2014, and as discussed in Note 15 to our financial statements included in
41
Part II, Item 8 of this Form 10-K, our unaudited interim financial statements for the periods ended March 31, 2015, June 30, 2015 and September 30, 2015. We have filed this Form 10-K to, among other things, reflect the restatement of our 2015 interim financial statements.
As a result of the Restatement, we have become subject to a number of additional costs and risks, including costs for accounting and legal fees in connection with or related to the Restatement and the remediation of our material weaknesses in internal control over financial reporting. In addition, the attention of our management team has been diverted by these efforts. We are subject to stockholder and other actions in connection with the Restatement and related matters. In addition, the Restatement and related matters could impair our reputation or could cause our counterparties to lose confidence in us. Each of these occurrences could have a material adverse effect on our business, financial condition, results of operations and stock price.
Our management has identified material weaknesses in the Company's internal control over financial reporting which could, if not remediated, result in additional material misstatements in our consolidated financial statements. We may be unable to develop, implement and maintain appropriate controls in future periods.
Our management is responsible for establishing and maintaining adequate internal control over financial reporting, and the Sarbanes-Oxley Act of 2002 and SEC rules require that our management report annually on the effectiveness of the Company's internal control over financial reporting. Among other things, our management must conduct an assessment of the Company's internal control over financial reporting to allow management to report on, and our independent registered public accounting firm to audit, the effectiveness of the Company's internal control over financial reporting, as required by Section 404 of the Sarbanes-Oxley Act. As disclosed in Part II, Item 9A, "Controls and Procedures" of this Form 10-K, our management, with the participation of our current Interim Chief Executive Officer and our current Chief Financial Officer, has determined that we had material weaknesses in the Company's internal control over financial reporting as of December 31, 2017. Some of these material weaknesses contributed to the material misstatements in our previously filed annual audited and interim unaudited consolidated financial statements, which were restated as part of the Restatement.
A "material weakness" is a deficiency, or a combination of deficiencies, in internal control over financial reporting, such that there is a reasonable possibility that a material misstatement of our annual or interim consolidated financial statements will not be prevented or detected on a timely basis. We are actively engaged in developing and implementing a remediation plan designed to address such material weaknesses. However, additional material weaknesses in the Company's internal control over financial reporting may be identified in the future. Any failure to implement or maintain required new or improved controls, or any difficulties we encounter in their implementation, could result in additional material weaknesses, or could result in material misstatements in our consolidated financial statements. These misstatements could result in a further restatement of our consolidated financial statements, cause us to fail to meet our reporting obligations, reduce our ability to obtain financing or cause investors to lose confidence in our reported financial information, leading to a decline in our stock price.
Although we are working to remedy the ineffectiveness of the Company's internal control over financial reporting, there can be no assurance as to when the remediation plan will be fully developed and implemented. Until our remediation plan is fully implemented, our management will continue to devote significant time, attention and financial resources to these efforts. If we do not complete our remediation in a timely fashion, or at all, or if our remediation plan is inadequate, there will continue to be an increased risk that we will be unable to timely file future periodic reports with the SEC and that our future consolidated financial statements could contain errors that will be undetected. Further and continued determinations that there are material weaknesses in the effectiveness of the Company's
42
internal control over financial reporting could also reduce our ability to obtain financing or could increase the cost of any financing we obtain and require additional expenditures of both money and our management's time to comply with applicable requirements. For more information relating to the Company's internal control over financial reporting, the material weaknesses that existed as of December 31, 2017 and the remediation activities undertaken by us, see Part II, Item 9A, "Controls and Procedures" of this Form 10-K.
We and certain of our former executive officers and current and former directors have been named as defendants in litigation actions that could result in substantial costs and divert management's attention.
We are currently party to legal and other proceedings which are described under Part II, Item 3, "Legal Proceedings," of this Form 10-K. We, and certain of our former executive officers and current and former directors, have been named as defendants in a purported class action lawsuit that allege, among other things, that the defendants made materially false or misleading statements and material omissions in the Company's SEC filings in violations of federal securities laws. Further, stockholder derivative complaints have been filed in Maryland state and federal court against individual members of the Company's Board and certain former executive officers alleging, among other things, that the defendants (i) violated their fiduciary duties to the Company's stockholders; (ii) abused their ability to control and influence the Company; (iii) engaged in gross mismanagement of the assets and business of the Company and (iv) were unjustly enriched at the expense of, and to the detriment of, the Company. The resolution of these matters may result in significant damages, costs, and expenses, which could have a material adverse impact on our business, financial condition and results of operations.
In addition, we could face suspension or disbarment from contracting with the VA and other government agencies as a result of the legal and other proceedings which are described under Part II, Item 3, "Legal Proceedings," of this Form 10-K.
Our failure to timely file certain periodic reports with the SEC poses significant risks to our business, each of which could materially and adversely affect our financial condition and results of operations.
We failed to file our Annual Reports on Form 10-K for the years ended December 31, 2015 and December 31, 2016 and our Quarterly Reports on Form 10-Q for the quarters ended March 31, 2016, June 30, 2016, September 30, 2016, March 31, 2017, June 30, 2017 and September 30, 2017. Consequently, we were not compliant with the periodic reporting requirements under the Exchange Act. We are filing this comprehensive Form 10-K as part of our effort to become current in our filing obligations under the Exchange Act. Our failure to file those and possibly future periodic reports with the SEC could subject us to enforcement action by the SEC. Any of these events could materially and adversely affect our financial condition and results of operations and our ability to register with the SEC public offerings of our securities for our benefit or the benefit of our security holders. We have not amended, and do not intend to amend, our Quarterly Reports on Form 10-Q for the 2015 interim periods. We also do not intend to file separate Annual Reports on Form 10-K for the years ended December 31, 2015 and December 31, 2016 or Quarterly Reports on Form 10-Q for the 2016 and 2017 interim periods.
Our failure to prepare and timely file our periodic reports with the SEC limits our access to the public markets to raise debt or equity capital.
We did not file our Annual Reports on Form 10-K for the years ended December 31, 2015 and December 31, 2016 and our Quarterly Reports on Form 10-Q for the quarters ended March 31, 2016, June 30, 2016, September 30, 2016, March 31, 2017, June 30, 2017 and September 30, 2017 as required by the SEC. Because we have not complied with our reporting requirements with the SEC, we are limited in our ability to access the public markets to raise debt or equity capital. Our limited ability to access the public markets could prevent us from pursuing transactions or implementing business
43
strategies that we might otherwise believe are beneficial to our business. Even if we regain and maintain compliance with our SEC reporting obligations prospectively, until one year from the date we regain and maintain status as a current filer, we will be ineligible to use shorter and less costly filing forms, such as Form S-3, to register our securities for sale. We may use Form S-1 to register a sale of our stock to raise capital or complete acquisitions, but doing so would likely take longer than using a shorter and less costly form, increase transaction costs and adversely impact our ability to raise capital or complete acquisitions of other companies in a timely manner.
ITEM 1B. Unresolved Staff Comments.
Not Applicable.
Our corporate headquarters are located in Columbia, Maryland, where we lease 61,203 square feet of laboratory, production, warehouse and office space, currently at a rent and associated expenses of approximately $1.5 million per annum. Our lease expires in October 2023, and includes options to extend the term for two additional five-year periods.
From time to time in the ordinary course of business, we are subject to claims, asserted or unasserted, or named as a party to lawsuits, arbitrations or investigations. Litigation, in general, and intellectual property and securities litigation in particular, can be expensive and disruptive to normal business operations. Moreover, the results of legal proceedings cannot be predicted with any certainty and in the case of more complex legal proceedings, such as intellectual property and securities litigation, the results are difficult to predict. Except as described below, we are not aware of any asserted or unasserted legal proceedings or claims that we believe would have a material adverse effect on our business, financial condition or results of operations.
Securities Class Action.
On November 23, 2015, a putative class action lawsuit was filed in the United States District Court for the District of Maryland by a single plaintiff, individually and on behalf of other persons similarly situated, against the Company and three current or former executive officers of the Company. The action, captioned Kiran Kumar Nallagonda v. Osiris Therapeutics, Inc. et al., Case 1:15-cv-03562 (the "Nallagonda Action"), alleges, among other things, that the defendants made materially false or misleading statements and material omissions in the Company's SEC filings in violation of the federal securities laws. The complaint seeks certification as a class action, unspecified damages and reimbursement of attorneys' fees. On March 21, 2016, the Court entered an order appointing Dr. Raffy Mirzayan as lead plaintiff and the firm of Hagens Berman Sobol Shapiro LLP as legal counsel. On January 17, 2018, the Court entered an order providing that the lead plaintiff shall have 45 days to file an amended complaint. On March 11, 2018, we entered into a memorandum of understanding to settle the Nallagonda Action. A memorandum of understanding is not a definitive settlement agreement. By the terms of the memorandum, the Company agreed in principle to a total payment of $18.5 million in cash. A definitive settlement agreement resulting from the memorandum is expected to be entered into in the second quarter of 2018 and will require court approval. We can provide no assurance, however, that a definitive settlement agreement will be reached, or that it will be approved by the court.
Shareholder Derivative Actions.
On March 2, 2016, a shareholder derivative complaint was filed in the Circuit Court for Howard County in the State of Maryland (Case No. 13C16106811) by a single plaintiff, derivatively and on
44
behalf of the Company, against certain current and former directors and certain former executive officers. This action, captioned Kevin Connelley v. Lode Debrabandere et al., alleges that each of the individual directors and officers named as defendants (i) violated their fiduciary duties to the Company's shareholders; (ii) abused their ability to control and influence the Company; (iii) engaged in gross mismanagement of the assets and business of the Company; and (iv) was unjustly enriched at the expense of, and to the detriment of, the Company. The alleged claims generally relate to the matters that are the subject of the Nallagonda Action. The plaintiff seeks, among other things, unspecified monetary damages, reimbursement of attorneys' fees and shareholder votes on amendments to the Company's Articles of Incorporation and Bylaws with respect to various corporate governance policies. On June 2, 2016, the Court entered an order that, subject to certain qualifications, stayed the action until 30 days after the entry of an order either: (1) denying all motions to dismiss in the Nallagonda Action, or (2) finally dismissing the Nallagonda Action with prejudice.
On February 9, 2017, a shareholder derivative complaint was filed in the United States District Court for the District of Maryland (Case No. 1:17-cv-00381-JKB) by a single plaintiff, derivatively and on behalf of the Company, against certain current and former directors. This action, captioned Recupero v. Friedli et al., alleges, among other things, that each of the individual directors named as defendants (i) violated their fiduciary duties to the Company's shareholders, including that such violations constituted constructive fraud; (ii) engaged in gross mismanagement of the assets and business of the Company; and (iii) was unjustly enriched at the expense of, and to the detriment of, the Company. The plaintiff seeks, among other things, unspecified monetary damages, reimbursement of attorneys', accountants' and experts' fees, and that the Company take all necessary actions to improve and comply with corporate governance, internal procedures and existing laws. On March 28, 2017, the Court entered an order that stays the action until: (1) the Nallagonda Action is dismissed with prejudice and all appeals relating thereto have been exhausted; (2) all motions to dismiss the Nallagonda Action are denied; or (3) either party provides 30 days' notice that they no longer consent to a stay.
On May 11, 2017, a shareholder derivative complaint was filed in the Circuit Court for Howard County in the State of Maryland, (Case No. 13C17111441) by a single plaintiff, derivatively on behalf of the Company, against certain former executive officers and certain current and former directors. The action, captioned Brian Lee v. Peter Friedli, et. al., alleges that each of the individual defendants violated their fiduciary duties by allegedly failing to adopt and implement adequate accounting and financial reporting systems and for allegedly causing the Company to make false and misleading statements regarding its financial condition. The alleged claims generally relate to the matters that are the subject of the Nallagonda Action and seek substantially similar relief. On September 5, 2017, the defendants moved to either stay or dismiss the plaintiffs' complaint. That motion was subsequently withdrawn. On February 14, 2018, the plaintiff filed an amended derivative complaint. No defendant has yet responded to that pleading.
On December 21, 2017, a shareholder derivative action was filed in the United States District Court for the District of Maryland (Case No. 1:17-cv-03777) by a single plaintiff, derivatively and on behalf of the Company, against certain former executive officers and certain current and former directors. The action, captioned Todd Salley v. Lode Debrabandere, et. al., alleges that each of the individual defendants violated their fiduciary duties by failing to maintain adequate internal controls and by causing the Company to make false and misleading statements regarding the Company's financial condition. The alleged claims generally relate to the matters that are the subject of the Nallagonda Action and seek substantially similar relief. No defendant has yet responded to the complaint.
The Company has reached an agreement in principle with the plaintiffs in the shareholder derivative actions to resolve the derivative matters by adopting certain governance changes. We expect that the plaintiffs will seek recovery of attorney's fees and we cannot currently predict the amount of
45
such attorney's fees that we may be required to pay, if any. We can provide no assurance that we will be able to reach a definitive global settlement with the derivate plaintiffs or that any such settlement will be approved by the courts.
Government Investigations
As previously disclosed, on November 2, 2017, the Company announced the resolution of an investigation by the SEC into the Company's historical accounting practices. The Company agreed to settle with the SEC, without admitting or denying the allegations of the SEC, by consenting to the entry of a final judgment, subject to court approval, that permanently restrains and enjoins the Company from violating certain provisions of the federal securities laws. As part of the settlement, the Company paid a civil penalty in the amount of $1.5 million. On November 7, 2017, this settlement was approved by the United States District Court for the District of Maryland, through entry of a final judgment, resolving as to the Company the matters alleged by the SEC in the civil complaint against the Company. The SEC civil case is continuing against four former Company officers.
The Company previously announced that a criminal investigation was being conducted by the U.S. Attorney's Office for the Southern District of New York ("SDNY") relating to matters that were also being investigated by the SEC. The SDNY investigation resulted in a former chief financial officer of the Company entering into a guilty plea with the government. As previously disclosed, based on communications the Company has had with the SDNY since that time and given that sentencing of the former company officer has now occurred, the Company believes that, subject to any newly discovered information, the SDNY has concluded the criminal investigation with respect to Company-related matters.
The Company believes that both the previously disclosed SEC and SDNY investigations are concluded with respect to the Company.
ITEM 4. Mine Safety Disclosures.
Not Applicable.
46
ITEM 5. Market for Registrant's Common Equity, Related Stockholder Matters and Issuer Purchases of Equity Securities.
During the years ended December 31, 2015 and December 31, 2016, our common stock traded on NASDAQ under the symbol "OSIR." As a result of the Restatement and our failure to file SEC reports, we were not in compliance with NASDAQ's requirements for continued listing and, as a result, our common stock was suspended from trading on NASDAQ on March 14, 2017 and delisted from NASDAQ on April 28, 2017. Our common stock is currently quoted on the Pink OTC Markets Inc., referred to as the "pink sheets" under the symbol "OSIR"; however trading since the delisting has been limited. The pink sheets market quotations reflect inter-dealer prices, without retail mark-up, mark-down or commission, and may not necessarily represent actual transactions.
The following table lists the high and low sale prices per share for our common stock based on the prices as reported on NASDAQ or as listed on the pink sheets, as applicable, for the periods indicated.
| |
2017 | 2016 | 2015 | ||||||||||||||||
|---|---|---|---|---|---|---|---|---|---|---|---|---|---|---|---|---|---|---|---|
| |
High | Low | High | Low | High | Low | |||||||||||||
Quarter Ended |
|||||||||||||||||||
March 31 |
$ | 6.06 | $ | 2.85 | $ | 10.42 | $ | 4.86 | $ | 18.26 | $ | 14.69 | |||||||
June 30 |
6.75 | 4.45 | 6.57 | 4.72 | 20.15 | 14.95 | |||||||||||||
September 30 |
6.96 | 4.60 | 5.93 | 4.69 | 22.37 | 16.81 | |||||||||||||
December 31 |
6.22 | 4.20 | 6.89 | 4.01 | 18.34 | 9.87 | |||||||||||||
Stockholders
As of March 23, 2018, there were approximately 121 stockholders of record of our common stock.
Dividends
On September 16, 2015, the Board declared a special cash dividend of $0.20 per share of common stock payable to stockholders of record as of October 16, 2015. The dividend was paid on October 30, 2015. As the Company had an accumulated deficit at the time the dividends were declared, these dividends were recorded as a reduction to additional paid-in capital.
No other dividends were granted during the years ended December 31, 2015, December 31, 2016 and December 31, 2017. We do not plan to pay cash dividends in the foreseeable future and we currently intend to retain earnings, if any, to finance our operations and growth.
Unregistered Sales of Securities and Use of Proceeds
We granted stock options to certain of our executive officers in 2016 and 2017. See Part II, Item 11, "Executive Compensation—Long-term Incentive Compensation" of this Form 10-K for more information about our stock option grants.
Issuer Purchase of Equity Securities
There were no repurchases by us of our securities during 2017, 2016 or 2015 other than in connection with exercise of stock options.
Stock Performance Graph
The following graph shows the cumulative total return, assuming the investment of $100 on December 31, 2012, on an investment in each of our common stock, the NASDAQ Composite Index
47
(U.S. and Foreign) and the NASDAQ Biotechnology Index through December 31, 2017. The comparisons in the table are required by the SEC and are not intended to forecast or be indicative of possible future performance of our common stock.
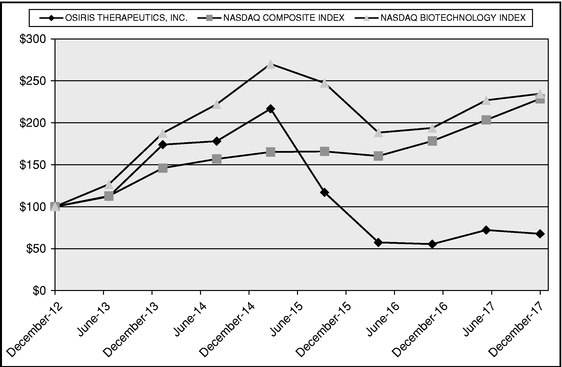
Value of $100 invested on December 31, 2012 in stock or index, including reinvestment of dividends, for fiscal years ended December 31:
| |
31-Dec- 2012 |
30-Jun- 2013 |
31-Dec- 2013 |
30-Jun- 2014 |
31-Dec- 2014 |
30-Jun- 2015 |
31-Dec- 2015 |
30-Jun- 2016 |
31-Dec- 2016 |
30-Jun- 2017 |
31-Dec- 2017 |
|||||||||||||||||||||||
|---|---|---|---|---|---|---|---|---|---|---|---|---|---|---|---|---|---|---|---|---|---|---|---|---|---|---|---|---|---|---|---|---|---|---|
OSIRIS THERAPEUTICS, INC. |
100.00 | 112.14 | 179.06 | 173.94 | 178.06 | 216.70 | 117.01 | 57.38 | 55.35 | 72.14 | 67.63 | |||||||||||||||||||||||
NASDAQ COMPOSITE INDEX |
100.00 | 112.71 | 138.32 | 145.99 | 156.85 | 165.15 | 165.84 | 160.38 | 178.28 | 203.36 | 228.63 | |||||||||||||||||||||||
NASDAQ BIOTECHNOLOGY INDEX |
100.00 | 126.72 | 165.61 | 187.75 | 222.08 | 270.10 | 247.44 | 188.25 | 193.79 | 226.84 | 234.60 | |||||||||||||||||||||||
Securities Authorized for Issuance under Equity Compensation Plans
In April 2006, we adopted our 2006 Omnibus Plan. We amended and restated this plan in 2008 and 2010, and further amended it in 2012 and 2014, in each case to, among other things, increase the number of shares available for grant (the "Amended and Restated 2006 Omnibus Plan"). As a result of the 2014 amendment, the Amended and Restated 2006 Omnibus Plan has a termination date of May 6, 2024. The Amended and Restated 2006 Omnibus Plan was approved by our stockholders and authorizes the issuance of various forms of stock-based awards, including incentive and non-qualified stock options, stock purchase rights, stock appreciation rights, restricted and unrestricted stock awards
48
and performance units. A total of 3,000,000 shares of our common stock were reserved for issuance under the Amended and Restated 2006 Omnibus Plan. As of December 31, 2017:
Plan Category
|
Number of Securities to be Issued Upon Exercise of Outstanding Options, Warrants and Rights |
Weighted-Average Exercise Price of Outstanding Options, Warrants and Rights ($/Sh) |
Number of Securities Remaining Available for Future Issuance Under Equity Compensation Plans |
|||||||
|---|---|---|---|---|---|---|---|---|---|---|
Equity compensation plans approved by security holders |
623,126 | 11.63 | 1,431,209 | |||||||
Equity compensation plans not approved by security holders |
— | — | — | |||||||
ITEM 6. Selected Financial Data.
The selected financial information set forth below for each of the years ended December 31, 2017, 2016, 2015, 2014 and 2013 has been derived from our audited consolidated financial statements. The information below should be read in conjunction with "Management's Discussion and Analysis of
49
Financial Condition and Results of Operations" included in Part II, Item 7 of this Form 10-K and our financial statements included in Part II, Item 8 of this Form 10-K.
| |
Year ended December 31, | |||||||||||||||
|---|---|---|---|---|---|---|---|---|---|---|---|---|---|---|---|---|
(in thousands)
|
2017 | 2016 | 2015 | 2014 | 2013 | |||||||||||
Statement of Operations Data: |
||||||||||||||||
Revenue |
$ | 118,514 | $ | 109,374 | $ | 79,707 | $ | 50,835 | $ | 25,698 | ||||||
Cost of revenue |
32,681 | 30,733 | 27,020 | 9,886 | 6,851 | |||||||||||
| | | | | | | | | | | | | | | | | |
Gross profit |
85,833 | 78,641 | 52,687 | 40,949 | 18,847 | |||||||||||
| | | | | | | | | | | | | | | | | |
Operating expenses: |
||||||||||||||||
Research and development |
4,138 | 6,324 | 4,867 | 3,414 | 4,330 | |||||||||||
Sales and marketing |
61,545 | 59,057 | 56,627 | 36,384 | 13,810 | |||||||||||
General and administrative |
22,139 | 17,356 | 9,498 | 8,135 | 2,718 | |||||||||||
Settlement of SEC and shareholder actions |
— | — | 15,212 | — | — | |||||||||||
| | | | | | | | | | | | | | | | | |
Total operating expenses |
87,822 | 82,737 | 86,204 | 47,933 | 20,858 | |||||||||||
| | | | | | | | | | | | | | | | | |
Loss from continuing operations |
(1,989 | ) | (4,096 | ) | (33,517 | ) | (6,984 | ) | (2,011 | ) | ||||||
Other (expense) income, net |
(645 | ) | 417 | (1,693 | ) | (1,771 | ) | 414 | ||||||||
| | | | | | | | | | | | | | | | | |
Loss before income taxes from continuing operations |
(2,634 | ) | (3,679 | ) | (35,210 | ) | (8,755 | ) | (1,597 | ) | ||||||
Income tax benefit (expense) |
1,398 | (70 | ) | (544 | ) | (97 | ) | 994 | ||||||||
| | | | | | | | | | | | | | | | | |
Net loss from continuing operations |
(1,236 | ) | (3,749 | ) | (35,754 | ) | (8,852 | ) | (603 | ) | ||||||
Income (loss) from discontinued operations, net of tax |
10,021 | — | — | (1,118 | ) | 43,063 | ||||||||||
| | | | | | | | | | | | | | | | | |
Net income (loss) |
$ | 8,785 | $ | (3,749 | ) | $ | (35,754 | ) | $ | (9,970 | ) | $ | 42,460 | |||
| | | | | | | | | | | | | | | | | |
| | | | | | | | | | | | | | | | | |
| | | | | | | | | | | | | | | | | |
Net loss per share from continuing operations: |
||||||||||||||||
Basic |
$ | (0.04 | ) | $ | (0.11 | ) | $ | (1.04 | ) | $ | (0.26 | ) | $ | (0.02 | ) | |
Diluted |
$ | (0.04 | ) | $ | (0.11 | ) | $ | (1.04 | ) | $ | (0.26 | ) | $ | (0.02 | ) | |
Net income (loss) per share from discontinued operations: |
||||||||||||||||
Basic |
$ | 0.29 | $ | — | $ | — | $ | (0.03 | ) | $ | 1.29 | |||||
Diluted |
$ | 0.29 | $ | — | $ | — | $ | (0.03 | ) | $ | 1.29 | |||||
Net income (loss) per share: |
||||||||||||||||
Basic |
$ | 0.25 | $ | (0.11 | ) | $ | (1.04 | ) | $ | (0.29 | ) | $ | 1.27 | |||
Diluted |
$ | 0.25 | $ | (0.11 | ) | $ | (1.04 | ) | $ | (0.29 | ) | $ | 1.27 | |||
Weighted average common shares outstanding: |
||||||||||||||||
Basic |
34,524 | 34,499 | 34,422 | 34,263 | 33,307 | |||||||||||
Diluted |
34,525 | 34,499 | 34,422 | 34,263 | 33,307 | |||||||||||
50
| |
At December 31, | |||||||||||||||
|---|---|---|---|---|---|---|---|---|---|---|---|---|---|---|---|---|
(in thousands)
|
2017 | 2016 | 2015 | 2014 | 2013 | |||||||||||
Balance Sheet Data: |
||||||||||||||||
Cash and investment securities |
$ | 27,888 | $ | 26,662 | $ | 33,953 | $ | 50,104 | $ | 59,010 | ||||||
Working capital(1) |
37,825 | 46,121 | 52,789 | 77,096 | 73,420 | |||||||||||
Total assets |
78,122 | 71,817 | 73,666 | 88,450 | 92,201 | |||||||||||
Long-term liabilities |
1,626 | 20,940 | 23,263 | 3,589 | 355 | |||||||||||
Dividends paid(2) |
— | — | 6,891 | — | — | |||||||||||
Accumulated deficit |
(242,338 |
) |
(251,123 |
) |
(247,374 |
) |
(211,620 |
) |
(201,650 |
) |
||||||
Total stockholders' equity |
41,394 | 32,501 | 36,542 | 75,681 | 81,053 | |||||||||||
- (1)
- Working
capital is computed as current assets less current liabilities.
- (2)
- On September 16, 2015, the Board declared a special cash dividend of $0.20 per share of common stock payable to stockholders of record as of October 16, 2015. The dividend was paid on October 30, 2015.
ITEM 7. Management's Discussion and Analysis of Financial Condition and Results of Operations.
The following Management's Discussion and Analysis of Financial Condition and Results of Operations ("MD&A") is intended to help the reader understand our results of operations, financial condition and our current business environment. This MD&A is provided as a supplement to—and should be read in conjunction with—our consolidated financial statements and the accompanying notes thereto included in Part II, Item 8 of this Form 10-K.
This MD&A is organized into the following sections:
- •
- Restatement and Related Actions—a brief overview of the Restatement and related
legal proceedings; and the related costs and expenses.
- •
- Overview of Osiris—a general description of our business, products and history.
- •
- Critical Accounting Policies—a discussion of accounting policies that require
critical judgments and estimates.
- •
- Recent and Pending Accounting Pronouncements—a discussion of recent and pending
accounting policies under review by us that require critical judgments and estimates.
- •
- Results of Operations—an analysis of our consolidated results of operations for the
three years presented in our consolidated financial statements.
- •
- Quarterly Results of Operations—an analysis of our consolidated unaudited quarterly
results of operations for the quarterly periods in 2017, 2016 and 2015.
- •
- Liquidity and Capital Resources—an analysis of our liquidity and financial positions; cash flows; off-balance sheet arrangements and aggregate contractual obligations.
Restatement and Related Actions
As discussed in the 2014 Form 10-K/A and the Explanatory Note, we restated our audited financial statements for the year ended December 31, 2014 in the 2014 Form 10-K/A.
We have restated our unaudited interim financial statements for the quarters ended March 31, 2015, June 30, 2015 and September 30, 2015 in this Form 10-K. For more information about the 2015 Interim Period Restatement, see Note 15 to our consolidated financial statements included in Part II, Item 8 of this Form 10-K. The determination to restate our financial statements was made by the Audit
51
Committee upon management's recommendation to address discovered errors. As a result of the Restatement, we have become subject to a number of additional costs and risks, including costs for accounting and legal fees in connection with or related to the Restatement and the remediation of material weaknesses in our internal control over financial reporting. In addition, we have been subject to stockholder, governmental and other actions in connection with the Restatement and related matters. See "Legal Proceedings" in Part I, Item 3 of this Form 10-K and the risks described under the heading "Risks Related to the Restatement of Financial Statements and Failure to File SEC Reports" under "Risk Factors" in Part I, Item 1A of this Form 10-K.
Expenses Incurred
In 2017 and 2016, we recorded $9.5 million and $8.1 million, respectively, of expenses for professional fees related to the Restatement and the related legal proceedings. These expenses are included in "General and administrative expenses" in the accompanying Consolidated Statements of Comprehensive Income (Loss). These expenses, all of which were expensed as incurred, include costs of (i) outside professionals engaged by the Audit Committee and a special committee of the Board to review certain matters related to the Restatement; (ii) outside accounting professionals we engaged to assist with the Restatement and recommend improvements to our internal control over financial reporting; (iii) our former independent registered public accounting firm related to its re-audit of our 2014 consolidated financial statements as part of the Restatement, (iv) our current independent registered public accounting firm related to its audits of our 2015 and 2016 consolidated financial statements incurred, (v) reimbursement of expenses of certain current and former officers and directors related to legal proceedings; and (vi) our outside legal counsel related to these matters.
Legal Proceedings
As previously disclosed, we believe that both the previously disclosed SEC and SDNY investigations are now concluded with respect to the Company. In November 2017, we paid a civil penalty in the amount of $1.5 million as part of the SEC settlement, which we recorded as an expense in the fourth quarter of 2015. The SEC civil case is continuing against four of our former officers. We are currently advancing expenses incurred by three of these former officers.
As discussed above, on March 11, 2018, we entered into a memorandum of understanding to settle the securities class action lawsuit. By the terms of the memorandum, the Company agreed in principle to a total payment of $18.5 million in cash, which was recorded as an expense in the fourth quarter of 2015. A definitive settlement agreement resulting from the memorandum is expected to be entered into in the second quarter of 2018 and will require court approval. Of the $18.5 million settlement payment, we expect to be reimbursed approximately $4.8 million from our insurance carrier, which we recorded as a receivable in the fourth quarter of 2015.
Future Costs
We expect to continue to incur significant legal and other professional services expenses associated with the Restatement and the resolution of the related legal proceedings in 2018. We will recognize these expenses as services are received. Costs related to the Restatement that may be incurred in 2018 may also include payments of expenses incurred by certain current and former officers and directors related to these matters; and incremental expenses for remediation activities related to improving our internal control over financial reporting.
Insurance Coverage
We maintained $5.0 million of director's and officer's liability insurance coverage during the years ended December 31, 2017, 2016 and 2015. Approximately $0.2 million has been paid to us as of December 31, 2017 for reimbursable expenses incurred by us and the remaining $4.8 million will be used to contribute to the settlement of the securities class action described above.
52
Remediation
Our management, with the oversight of the Audit Committee, has undertaken a plan to remediate our material weaknesses. Our remediation efforts are intended to address the identified material weaknesses as well as to strengthen our overall financial control environment. See Part II, Item 9A, "Controls and Procedures" of this Form 10-K for more information about the material weaknesses and our remediation activities.
Overview of Osiris
Osiris Therapeutics, Inc. researches, develops, manufactures, markets and sells regenerative medicine products intended to improve the health and lives of patients and lower overall healthcare costs. We have achieved commercial success with products in orthopedics, sports medicine and wound care, including the Grafix product line, Stravix, BIO4 and Cartiform. We continue to advance our R&D by focusing on innovation in regenerative medicine, including the development of bioengineered stem cell and tissue-based products.
We are a fully integrated company, having developed capabilities in research and development, manufacturing, marketing and sales of our products. We are focused on the long-term commercial growth of the Company through the delivery of differentiated products for use across multiple fields of medicine with clear value propositions to patients, healthcare providers and third-party payors.
Our History
We began operations in 1992 and were a Delaware corporation until, with the approval of our stockholders, we reincorporated as a Maryland corporation in May 2010.
From May 2010 to October 2013, we operated as two business segments, therapeutics and biosurgery. Our therapeutics business focused on developing biologic stem cell drug candidates from a readily available source—adult bone marrow. Our biosurgery business, now our only segment, focuses on using unique tissue preservation technologies to develop viable human tissue products designed to improve wound closure and surgical outcomes for patients and physicians over standard of care alone.
In October 2013, we sold our therapeutics business, including Prochymal, a stem cell drug for treatment of graft versus host disease, and related assets, to Mesoblast. The agreement with Mesoblast provided for the receipt of $50 million in initial consideration and up to an additional $50 million in payments upon Mesoblast achieving certain clinical and regulatory milestones.
Since 2013, we have focused our resources on our biosurgery business and have built a substantial direct sales force dedicated exclusively to sell our Grafix and Stravix products. As a result, sales of our Grafix products increased significantly. However, the contribution of our Grafix product line to our operating income has been limited due to the heavy investment in sales and marketing. We operate in a competitive and challenging business environment and recognize that our execution of our product development and market penetration strategy will face a number of challenges. As a result, we may experience variability in our overall results, and in our quarter to quarter revenue.
In September 2013, we received the Untitled Letter from the FDA stating that Grafix and Ovation did not meet the definition of a 361 HCT/P. Among the grounds for the FDA's position were our marketing claims, including wound healing claims for Grafix. We revised all of our marketing claims for Grafix and resolved all issues with the Untitled Letter, which included the discontinuance of Ovation in 2014. Grafix remains on the market as a 361 HCT/P. Production of Ovation was discontinued in the third quarter of 2014 and we sold or shipped to consignees all of our remaining Ovation inventory by the end of October 2014.
53
In the fourth quarter of 2014, we executed marketing and distribution agreements with the Stryker and Arthrex for the distribution of BIO4 and Cartiform, respectively. Sales under these exclusive distribution arrangements commenced in 2015.
Critical Accounting Policies
The preparation of consolidated financial statements and related disclosures in conformity with generally accepted accounting principles in the United States ("GAAP") requires management to make judgments, assumptions and estimates that affect the amounts reported. Due to the inherent uncertainty involved in making those assumptions, actual results could differ from those estimates. We believe that the most significant estimates that affect our financial statements are those that relate to the fair value of our available for sale investments, the amounts of our deferred tax assets and liabilities and related valuation allowance, the net realizable value of inventory and related allowance for obsolescence, the ultimate realizability of our accounts receivable and estimates of collectability, the reserve for sales returns, and the fair value of our share-based awards. Note 2, "Summary of Significant Accounting Policies," to our consolidated financial statements included in Part II, Item 8 of this Form 10-K describes the significant accounting policies and methods used in the preparation of our consolidated financial statements.
The policies and estimates discussed in this section are considered critical because they had or could have a material impact on our consolidated financial statements and because they require significant judgments, assumptions or estimates. We base our estimates on historical experience and other assumptions that we believe to be reasonable under the circumstances. Actual results may differ from these estimates and such differences could be material. We have reviewed these critical accounting policies and related disclosures with the Audit Committee.
Revenue Recognition
We recognize revenue from the sales of our products when (i) title and the risk of loss pass to the customer; (ii) persuasive evidence of an arrangement exists; (iii) sales amounts are fixed and determinable; and (iv) collectability is reasonably assured. Due to the nature of the products and the manufacturing process, we generally do not allow sales returns or refunds unless the product is returned in the original shipping container and is determined to be salable.
Title and the risk of loss generally passes to the customer upon receipt of the product by our customer when acceptance of ownership risks occurs. Many of our customers accept the risks of ownership only when they use (implant) our product; for shipments to these customers, title and risk of loss passes upon product use and prior to such use we classify products shipped to these customers as consignment inventory pending receipt of such notice.
Based on our collection history with certain customers, collectability is not reasonably assured until actual cash payment is received. Thus, we recognize revenue for those customers when cash is received.
We record deferred revenue when we receive payments prior to the time we recognize revenue.
Investments and Other Comprehensive Income
Investments consist primarily of marketable securities with a total portfolio duration of approximately two years. Investments classified as available for sale are valued at their fair value, with unrealized gains and losses reported as a separate component of stockholders' equity in accumulated other comprehensive income. All realized gains and losses on our investments available for sale are recognized in results of operations when earned, as other income (expense), net.
Investments classified as available for sale are evaluated periodically to determine whether a decline in their value is "other than temporary." The term "other than temporary" is not intended to
54
indicate a permanent decline in value; rather, it means that the prospects for near term recovery of value is not necessarily favorable, or that there is a lack of evidence to support fair values equal to, or greater than, the carrying value of the security. We review criteria such as the magnitude and duration of the decline, as well as the reasons for the decline, to predict whether the loss in value is other than temporary. If a decline in value is determined to be other than temporary, the carrying value of the security is reduced and a corresponding charge to earnings is recognized.
Trade Accounts Receivable
Accounts receivable are reported at their net realizable value. We consider receivables outstanding longer than the time specified in the respective customer's contract to be past due. In making the determination of the appropriate allowance for doubtful accounts, management considers prior experience with customers, analysis of accounts receivable aging reports, changes in customer payment patterns, and historical write-offs.
Inventory Valuation
Inventory consists of raw materials, products in process, finished goods available for sale and products held by customers under consignment sales arrangements. We determine our inventory values using the first-in, first-out method. Inventory is valued at the lower of cost or net realizable value and excludes units that we anticipate distributing for clinical evaluation.
Valuation of Long-lived Assets
We review the carrying value of long-lived assets whenever events or changes in circumstances indicate that the carrying amount of an asset or group of assets may not be fully recoverable. Factors that would require an impairment assessment include, among other things, a significant change in the extent or manner in which an asset is used, a continual decline in our operating performance, or a fundamental change in our business condition. If an impairment indicator is present, we evaluate recoverability by a comparison of the carrying amount of the assets to future undiscounted net cash flows expected to be generated by the assets. Assets are grouped at the lowest level for which there is identifiable cash flows that are largely independent of the cash flows generated by other asset groups. If the total of the expected undiscounted future cash flows is less than the carrying amount of the asset, an impairment loss is recognized for the difference between the fair value and carrying value of the asset group. Fair value is generally determined by estimates of discounted cash flows. The discount rate used in any estimate of discounted cash flows would be the rate required for a similar investment of like risk. There were no impairment losses recognized during the years 2017, 2016 or 2015.
Fair Value Accounting
We disclose the fair value of our financial assets in our consolidated financial statements included in Part II, Item 8 of this Form 10-K. Fair value is defined as the price at which an asset could be exchanged or a liability transferred (an exit price) in an orderly transaction between knowledgeable, willing parties in the principal or most advantageous market for the asset or liability. Where available, fair value is based on observable market prices or parameters or derived from such prices or parameters. Where observable prices or inputs are not available, valuation models are applied.
We estimated the fair value of stock options using the Black-Scholes option-pricing model. Fair value is amortized on an accelerated basis over the requisite service periods of the awards. We generally issue stock option awards that vest over four years and have a ten-year contractual life. The
55
fair value of stock options granted during each of the years was estimated using the following weighted-average assumptions:
| |
Year ended December 31, |
|||||||||
|---|---|---|---|---|---|---|---|---|---|---|
| |
2017 | 2016 | 2015 | |||||||
Interest rate |
2.0 | % | 1.0 | % | 1.8 | % | ||||
Dividend yield |
0.0 | % | 0.0 | % | 0.0 | % | ||||
Term (in years) |
6.2 | 3.7 | 6.2 | |||||||
Volatility |
71.9 | % | 67.4 | % | 69.4 | % | ||||
Interest Rate—The risk-free interest rate was determined using the yield available for zero-coupon United States government issues with a remaining term approximating the expected life of the options.
Dividend—On September 16, 2015, we declared a non-recurring, special cash dividend to shareholders. We do not expect to pay a dividend in the foreseeable future, and as such, the expected dividend yield is zero.
Term—Since the Company has limited option exercise history, it has generally elected to estimate the expected life of an award based upon the SEC-approved "simplified method" noted under the provisions of Staff Accounting Bulletin No. 107 with the continued use of this method extended under the provisions of Staff Accounting Bulletin No. 110.
Volatility—Expected volatility is based on the historical volatility of the Company's common stock, which we believe will be indicative of future experience.
Research and Development Costs
Our R&D costs are expensed as incurred. R&D consists of expenses incurred in identifying, developing and testing tissue-based products. These expenses consist primarily of salaries and related expenses for personnel, fees paid to professional service providers for independent monitoring and analysis of our clinical studies, costs of contract research, costs of facilities, and costs of manufacturing clinical study materials and quality control supplies.
Income Taxes
Significant judgment is required in determining our provision for income taxes and income tax assets and liabilities, including evaluating uncertainties in the application of accounting principles and complex tax laws.
Deferred tax liabilities and assets are recognized for the estimated future tax consequences of temporary differences, income tax credits and net operating loss carryforwards. Temporary differences are primarily the result of the differences between the tax bases of assets and liabilities and their financial reporting values. Deferred tax liabilities and assets are measured by applying the enacted statutory tax rates applicable to the future years in which deferred tax liabilities or assets are expected to be settled or realized. Valuation allowances are established when necessary to reduce deferred tax assets to the amount expected to be realized. Income tax expense, if any, consists of the taxes payable for the current period and the change during the period in deferred tax assets and liabilities.
We recognize the impact of a tax position in our consolidated financial statements if that position is more likely than not to be sustained upon an examination based on the technical merits of the position. Although we believe that we have adequately reserved for our uncertain tax positions, we can provide no assurance that the final tax outcome of these matters will not be materially different. We make adjustments to these reserves when facts and circumstances change, such as the closing of a tax
56
audit or the refinement of an estimate. To the extent that the final tax outcome of these matters is different than the amounts recorded, such differences will affect the provision for income taxes in the period in which such determination is made and could have a material impact on our business, financial condition and results of operations. The provision for income taxes includes the effects of any reserves that we believe are appropriate, as well as the related net interest and penalties.
On December 22, 2017, the President of the United States signed into law the Tax Cuts and Jobs Act of 2017 (the "Tax Act") which included significant changes to the existing income tax laws for domestic corporations. Key features of the Tax Act effective in 2018 include:
- •
- Reduction of the corporate tax rate from 35% to 21%;
- •
- Elimination of the alternative minimum tax ("AMT");
- •
- Refundability of AMT credit carryforwards as of December 31, 2017
- •
- Changes in the deductibility of certain aspects of executive compensation;
- •
- Changes in the deductibility of certain entertainment and recreation expenses; and
- •
- Changes in incentive tax breaks for U.S. production activities.
As a result of the refundability of the AMT credit carryforwards, we recorded a receivable of $1.5 million as of December 31, 2017. Because of our existing Federal net operating loss carryforwards and current expectations as to the recovery of our net deferred tax assets, we believe that the Tax Act will not have significant additional impacts on our financial results and financial position, including on our liquidity, for the foreseeable future. See Note 12 to the consolidated financial statements in Part II, Item 8 of this Form 10-K.
Recent and Pending Accounting Pronouncements
See Note 2 to our consolidated financial statements included in Part II, Item 8 of this Form 10-K for a full description of recent accounting pronouncements and our expectation of their impact on our consolidated financial statements.
57
Results of Operations
The following tables setting forth selected financial data for the years ended December 31, 2017, 2016, 2015 and 2014 have been prepared in accordance with GAAP:
| |
Year ended December 31, | ||||||||||||
|---|---|---|---|---|---|---|---|---|---|---|---|---|---|
(in thousands)
|
2017 | 2016 | 2015 | 2014 | |||||||||
Revenue |
$ | 118,514 | $ | 109,374 | $ | 79,707 | $ | 50,835 | |||||
Cost of revenue |
32,681 | 30,733 | 27,020 | 9,886 | |||||||||
| | | | | | | | | | | | | | |
Gross profit |
85,833 | 78,641 | 52,687 | 40,949 | |||||||||
| | | | | | | | | | | | | | |
Operating expenses: |
|||||||||||||
Research and development |
4,138 | 6,324 | 4,867 | 3,414 | |||||||||
Sales and marketing |
61,545 | 59,057 | 56,627 | 36,384 | |||||||||
General and administrative |
22,139 | 17,356 | 9,498 | 8,135 | |||||||||
Settlement of SEC and shareholder actions |
— | — | 15,212 | — | |||||||||
| | | | | | | | | | | | | | |
Total operating expenses |
87,822 | 82,737 | 86,204 | 47,933 | |||||||||
| | | | | | | | | | | | | | |
Loss from continuing operations |
(1,989 | ) | (4,096 | ) | (33,517 | ) | (6,984 | ) | |||||
Other income (expense), net |
(645 | ) | 417 | (1,693 | ) | (1,771 | ) | ||||||
| | | | | | | | | | | | | | |
Loss before income taxes from continuing operations |
(2,634 | ) | (3,679 | ) | (35,210 | ) | (8,755 | ) | |||||
Income tax benefit (expense) |
1,398 | (70 | ) | (544 | ) | (97 | ) | ||||||
| | | | | | | | | | | | | | |
Net loss from continuing operations |
(1,236 | ) | (3,749 | ) | (35,754 | ) | (8,852 | ) | |||||
Mesoblast income (loss) from discontinued operations, net of tax(1) |
10,021 | — | — | (1,118 | ) | ||||||||
| | | | | | | | | | | | | | |
Net income (loss) |
$ | 8,785 | $ | (3,749 | ) | $ | (35,754 | ) | $ | (9,970 | ) | ||
| | | | | | | | | | | | | | |
| | | | | | | | | | | | | | |
| | | | | | | | | | | | | | |
- (1)
- In October 2013, we sold our therapeutics business to Mesoblast. The agreement with Mesoblast provided for the receipt of $50 million in initial consideration and up to an additional $50 million in payments upon Mesoblast achieving certain clinical and regulatory milestones. In addition, we are entitled to earn single to low double-digit percentage cash royalties on future sales by Mesoblast of Prochymal and other products utilizing the acquired technology. Our former therapeutics business generated royalty revenue and related expenses in 2014. See Note 4 to the Consolidated Financial Statements in Part II, Item 8 of this Form 10-K.
| |
Year Ended December 31, | ||||||||||||||||||||||||
|---|---|---|---|---|---|---|---|---|---|---|---|---|---|---|---|---|---|---|---|---|---|---|---|---|---|
| |
2017 | 2016 | 2015 | 2014 | |||||||||||||||||||||
Product
|
Product Revenue |
Percent of Total |
Product Revenue |
Percent of Total |
Product Revenue |
Percent of Total |
Product Revenue |
Percent of Total |
|||||||||||||||||
Grafix/Stravix |
$ | 85,344 | 72.0 | % | $ | 82,317 | 75.3 | % | $ | 62,050 | 77.8 | % | $ | 36,069 | 71.0 | % | |||||||||
BIO4 |
24,166 | 20.4 | % | 19,442 | 17.8 | % | 7,864 | 9.9 | % | 713 | 1.4 | % | |||||||||||||
Cartiform |
8,988 | 7.6 | % | 7,492 | 6.8 | % | 5,089 | 6.4 | % | 1,683 | 3.3 | % | |||||||||||||
Ovation |
— | — | % | — | — | % | 4,701 | 5.9 | % | 12,370 | 24.3 | % | |||||||||||||
Other |
16 | — | % | 123 | 0.1 | % | 3 | — | % | — | — | % | |||||||||||||
| | | | | | | | | | | | | | | | | | | | | | | | | | |
Total |
$ | 118,514 | 100.0 | % | $ | 109,374 | 100.0 | % | $ | 79,707 | 100.0 | % | $ | 50,835 | 100.0 | % | |||||||||
| | | | | | | | | | | | | | | | | | | | | | | | | | |
| | | | | | | | | | | | | | | | | | | | | | | | | | |
| | | | | | | | | | | | | | | | | | | | | | | | | | |
- (1)
- The Stravix product line was launched in late 2015; however, the first sale of the product did not occur until January 2016. As a result, the amount of product revenue and percentage of total in 2015 and 2014 represent sales of Grafix products only.
58
Annual Comparisons for the years ended December 31, 2017, 2016, 2015 and 2014
Revenue
Revenue was $118.5 million for the year ended December 31, 2017, which increased $9.1 million, or 8.4%, compared with revenue of $109.4 million in 2016. The increase in revenue was due to the following:
- •
- Grafix/Stravix revenue increased $3.0 million, or 3.7%, primarily due to increased market awareness and acceptance as we increased
selling efforts.
- •
- BIO4 revenue increased $4.7 million, or 24.3%, primarily due to increased market presence through our distribution
arrangement with Stryker.
- •
- Cartiform revenue increased $1.5 million, or 20.0%, primarily due to increased market presence through our distribution arrangement with Arthrex.
Revenue was $109.4 million for the year ended December 31, 2016, which increased $29.7 million, or 37.2%, compared with revenue of $79.7 million in 2015.
- •
- Grafix/Stravix revenue increased $20.3 million, or 32.7%, due to continued marketing and sale of the products, increased Medicare
coverage, and an increase in the size of our sales force. The Stravix product line was launched in late 2015.
- •
- BIO4 revenue increased $11.6 million, or 147.2%, primarily due to increased market awareness through our distribution
arrangement with Stryker.
- •
- Cartiform revenue increased $2.4 million, or 47.2%, primarily due to increased market awareness through our distribution arrangement with Arthrex.
Revenue was $79.7 million for the year ended December 31, 2015, which increased $28.9 million, or 56.8%, compared with revenue of $50.8 million in 2014.
- •
- Grafix revenue increased $26.0 million, or 72.0%, primarily due to expansion of our in-house sales and marketing teams, as well as
increased sales from our third-party product distributors. In addition, Grafix obtained Medicare coverage in 2015, which further aided sales.
- •
- Commercial sales of BIO4 began in the second half of 2014. In the fourth quarter of 2014, we entered into an agreement with
Stryker for the exclusive distribution of BIO4. The initial commercial sales of BIO4 under the distribution agreement began in the first quarter of 2015 resulting in an
increase of revenue of $7.2 million in 2015 compared to 2014.
- •
- Commercial sales of our Cartiform product began in 2012. In the fourth quarter 2014, we entered into an agreement with Arthrex for the
exclusive distribution of Cartiform. The initial commercial sales of Cartiform under the distribution agreement began in the first quarter of 2015 resulting in an increase in revenue of
$3.4 million compared to 2014.
- •
- Production of Ovation was discontinued in the third quarter of 2014 and we sold or shipped to consignees all of our remaining Ovation inventory by the fourth quarter of 2014.
Gross Profit and Gross Margin
Gross profit is affected by a number of factors including product mix, cost of labor and raw materials, unit volumes, pricing, competition, new products, new customer programs, and capacity utilization. In the case of new products and new customer programs, profitability normally lags revenue growth due to product start-up costs, lower manufacturing volumes in the start-up phase, operational inefficiencies, and under-absorbed overhead. Gross margin can improve over time if manufacturing
59
volumes increase and if our utilization rates and overhead absorption improves. As a result of these and other factors, our gross margin may vary from period to period.
Gross profit was $85.8 million for the year ended December 31, 2017, which increased $7.2 million, or 9.1%, compared with gross profit of $78.6 million in 2016. Gross margin improved to 72.4% for the year ended December 31, 2017, compared with 71.9% in 2016. The primary reason for the increase in gross profit was an increase in pricing in late 2016, along with higher sales. Gross margin also improved as a result of manufacturing efficiencies from higher production volume.
Gross profit was $78.6 million for the year ended December 31, 2016, which increased $26.0 million, or 49.3%, compared with gross profit of $52.7 million in 2015. Gross margin improved to 71.9% for the year ended December 31, 2016, compared with 66.1% in 2015. The primary reason for the increase in gross profit was higher sales volume. Gross margin improved as a result of manufacturing efficiencies from higher production volume, the addition of a contract manufacturer for certain cadaveric tissue (which decreased production costs), and, in connection with the Restatement, the reversal of the recognition of revenue from two distributors in 2015, which we changed from the accrual basis of accounting to the cash basis of accounting, but continued to recognize the costs as products were shipped.
Gross profit was $52.7 million for the year ended December 31, 2015, which increased $11.7 million, or 28.7%, compared with gross profit of $40.9 million in 2014. Gross profit increased primarily due to higher sales volume. Gross margin decreased to 66.1% for the year ended December 31, 2015, compared with 80.6% in 2014. As noted above, in connection with the Restatement, we reversed the recognition of revenue from two distributors in 2015, which we changed from the accrual basis of accounting to the cash basis of accounting, but continued to recognize the costs as products were shipped.
Research and Development Expenses
Our R&D expenses of $4.1 million in 2017 and $6.3 million in 2016 were primarily related to four clinical studies in 2017 and 2016. R&D expenses declined in 2017 compared to 2016, primarily due to the cancellation of three clinical studies in the fourth quarter of 2016 that began in 2015 and 2016 as we re-evaluated our market opportunities and research priorities.
Our R&D expenses of $6.3 million in 2016 and $4.9 million in 2015 were primarily related to four clinical studies that began in 2015 and 2016. R&D expenses increased in 2016 compared to 2015, primarily due to the addition of clinical studies during 2016.
Our R&D expenses of $4.9 million in 2015 with $3.4 million in 2014. The increase of $1.5 million in 2015 compared to 2014 was primarily related to clinical studies that began in 2015 to evaluate the safety and effectiveness of Grafix for the treatment of complex, diabetic foot wounds.
Sales and Marketing Expenses
Sales and marketing expenses totaled $61.5 million, or 50.1% of sales, during the year ended December 31, 2017, compared with $59.1million, or 54.0% of sales for the year ended December 31, 2016. The increase in sales and marketing expense of $2.4 million was primarily due to higher labor costs, including commissions.
Sales and marketing expenses totaled $59.1 million, or 54.0% of sales, during the year ended December 31, 2016, compared with $56.6 million, or 71.0% of sales for the year ended December 31, 2015. The $2.5 million increase in sales and marketing expense was primarily due to higher labor costs, including commissions.
60
Sales and marketing expenses totaled $56.6 million, or 71.0% of sales, during the year ended December 31, 2015, compared with $36.4 million, or 71.6% of sales for the year ended December 31, 2014. The increase in sales and marketing expense of $20.2 million was primarily due to higher labor costs, including commissions of $13.8 million, and higher travel related costs of $2.7 million, higher contract services of $0.9 million, and higher costs in general as we expanded our sales, marketing and reimbursement support capabilities.
General and Administrative Expenses
General and administrative expenses totaled $22.1 million, or 18.7% of sales, during the year ended December 31, 2017, compared with $17.4 million, or 15.9% of sales, for the year ended December 31, 2016. This increase of $4.7 million was due to higher labor costs of $2.7 million, as we added finance, human resources, and information technology personnel to support operations, and higher professional fees of $1.9 million, primarily related to the Restatement and the related legal proceedings. In 2017, general and administrative expenses included $9.5 million of expenses for professional fees related to the Restatement and the related legal proceedings.
General and administrative expenses totaled $17.4 million, or 15.9% of sales, during the year ended December 31, 2016, compared with $9.5 million, or 11.9% of sales for the year ended December 31, 2015. This increase of $7.9 million was primarily due to higher professional fees, primarily related to the Restatement and the related legal matters. In 2016, general and administrative expenses included $8.1 million of expenses for professional fees related to the Restatement and the related legal proceedings.
General and administrative expenses totaled $9.5 million, or 11.9% of sales, during the year ended December 31, 2015, compared with $8.1 million, or 16.0% of sales for the year ended December 31, 2014. This increase of $1.4 million was primarily due to higher professional fees. In 2015, general and administrative expenses included $0.5 million of expenses for professional fees related to the Restatement and the related legal proceedings.
Settlement of SEC and Shareholder Actions
In November 2017, we paid a civil penalty in the amount of $1.5 million as part of the SEC settlement with regard to the SEC investigation previously discussed, all of which was recorded as expenses in the fourth quarter of 2015. As discussed above, we are a party to a securities class action and multiple shareholder derivative actions. On March 11, 2018, we entered into a memorandum of understanding to settle the securities class action lawsuit. By the terms of the memorandum, the Company agreed in principle to a total payment of $18.5 million in cash. A definitive settlement agreement resulting from the memorandum is expected to be entered into in the second quarter of 2018 and will require court approval. Of the $18.5 million settlement payment, we expect to be reimbursed approximately $4.8 million from our insurance carrier, which we recorded as a receivable in 2015. As a result, we recorded the net amount of $13.7 million as a pretax expense in the fourth quarter of 2015.
Other Income (Expense), net
Other expense, net in 2017 was $0.6 million, a decrease of $1.2 million compared to other income, net of $0.4 million in 2016. The decrease is primarily due to a loss recognized in 2017 on the sale of Mesoblast Limited common stock.
Other income, net in 2016 was $0.4 million, an increase of $2.1 million compared to other expense net of $1.7 million in 2015. The increase is primarily due to a loss recognized in 2015 related to Mesoblast Limited common stock.
61
Other expense, net in 2015 was $1.7 million, which was comparable to other expense net of $1.8 million in 2014.
Income Taxes
Income tax benefit from continuing operations for 2017 was $1.4 million primarily due to the release of the valuation allowance on the AMT carryforwards, offset by state tax expense where the Company did not have state credit or net operating losses available.
Income tax expense from continuing operations for 2016 was $0.1 million primarily due to state tax obligations.
Income tax expense from continuing operations for 2015 was $0.5 million and was primarily due to an uncertain tax position relating to state taxes, compared to the expense from continuing operations of $0.1 million in 2014, which consisted primarily of AMT and state taxes.
Because realization of deferred tax assets is dependent upon future earnings, a full valuation allowance has been recorded on the net deferred tax assets as of December 31, 2017, 2016 and 2015, which relate primarily to net operating loss and various business tax credit carryforwards. In the event that we become profitable, we have general business credits (before a 100% valuation allowance) of approximately $0.4 million that may be utilized to reduce our federal tax. As discussed above under "Critical Accounting Policies—Income Taxes," the Tax Act enacted on December 22, 2017 reduced the U.S. corporate income tax rate from a maximum of 35% to 21% and reduced the valuation allowance previously recognized on AMT credit carryforwards, which will be refundable credits.
Mesoblast Income (Loss) from Discontinued Operations
As noted above, in October 2013, we sold our therapeutics business to Mesoblast. The agreement with Mesoblast provided for the receipt of $50 million in initial consideration and up to an additional $50 million in payments upon Mesoblast achieving certain clinical and regulatory milestones. In addition, we are entitled to earn royalties on future sales by Mesoblast of Prochymal and other products utilizing the acquired technology. We received all of the initial consideration by April 2014, consisting of $35 million in cash and $15 million of Mesoblast Limited common stock which we classified as a trading security. The Mesoblast Limited common stock was subject to a holding period which was ultimately extended to May 2015. During this holding period, Mesoblast Limited provided us limited protection against a decline in the market value of the stock. In May 2015, concurrent with the expiration of the holding period, Mesoblast paid us $6.2 million representing the decline in the market value of the stock through that date. Later in 2015, we sold all of the Mesoblast Limited common stock for $6.8 million, resulting in a realized loss of $2.6 million, which was recorded in other income (expense), net in our consolidated statement of comprehensive income (loss) for the year ended December 31, 2015.
As noted above, in connection with the sale of our therapeutics business to Mesoblast, we are entitled to receive contingent consideration as a result of Mesoblast achieving certain milestones. In July 2017, we received contingent consideration of $10.0 million in Mesoblast Limited common stock and $350 thousand in cash as a milestone payment. We recorded $10.0 million, net of $0.3 million in tax, in discontinued operations in 2017. All of the Mesoblast Limited common stock was sold in 2017, resulting in a loss of approximately $1.9 million, which was reported in other income (expense), net in our consolidated statement of comprehensive income (loss) for the year ended December 31, 2017.
62
Selected Unaudited Quarterly Financial Data
The following table sets forth selected financial data for each of the periods indicated. Amounts are computed independently each quarter, therefore, the sum of the quarterly amounts may not equal the total amount for the respective year due to rounding.
| |
For the Quarters Ended | ||||||||||||||||||||||||||||||||||||
|---|---|---|---|---|---|---|---|---|---|---|---|---|---|---|---|---|---|---|---|---|---|---|---|---|---|---|---|---|---|---|---|---|---|---|---|---|---|
(in thousands)
|
Dec. 31, 2017 |
Sept. 30, 2017 |
June 30, 2017 |
Mar. 31, 2017 |
Dec. 31, 2016 |
Sept. 30, 2016 |
June 30, 2016 |
Mar. 31, 2016 |
Dec. 31, 2015 |
Sept. 30, 2015 (restated) |
June 30, 2015 (restated) |
Mar. 31, 2015 (restated) |
|||||||||||||||||||||||||
Statement of Operations Data: |
|||||||||||||||||||||||||||||||||||||
Revenue |
$ | 32,576 | $ | 29,806 | $ | 29,151 | $ | 26,981 | $ | 29,090 | $ | 29,506 | $ | 27,327 | $ | 23,451 | $ | 24,806 | $ | 23,562 | $ | 19,077 | $ | 12,262 | |||||||||||||
Cost of revenue |
9,276 | 7,926 | 7,668 | 7,811 | 8,192 | 7,740 | 8,284 | 6,517 | 8,048 | 7,901 | 5,438 | 5,633 | |||||||||||||||||||||||||
| | | | | | | | | | | | | | | | | | | | | | | | | | | | | | | | | | | | | | |
Gross profit |
23,300 | 21,880 | 21,483 | 19,170 | 20,898 | 21,766 | 19,043 | 16,934 | 16,758 | 15,661 | 13,639 | 6,629 | |||||||||||||||||||||||||
| | | | | | | | | | | | | | | | | | | | | | | | | | | | | | | | | | | | | | |
Operating expenses: |
|||||||||||||||||||||||||||||||||||||
Research and development |
1,086 | 909 | 924 | 1,219 | 1,452 | 1,853 | 1,524 | 1,495 | 1,530 | 1,237 | 1,097 | 1,003 | |||||||||||||||||||||||||
Sales and marketing |
17,289 | 14,825 | 14,698 | 14,733 | 15,394 | 15,346 | 14,742 | 13,575 | 14,547 | 15,451 | 14,243 | 12,386 | |||||||||||||||||||||||||
General and administrative |
5,219 | 6,634 | 5,427 | 4,859 | 5,385 | 3,264 | 6,254 | 2,453 | 2,362 | 2,424 | 2,481 | 2,231 | |||||||||||||||||||||||||
Settlement of SEC and shareholder actions |
— | — | — | — | — | — | — | — | 15,212 | — | — | — | |||||||||||||||||||||||||
| | | | | | | | | | | | | | | | | | | | | | | | | | | | | | | | | | | | | | |
Total operating expenses |
23,594 | 22,368 | 21,049 | 20,811 | 22,231 | 20,463 | 22,520 | 17,523 | 33,651 | 19,112 | 17,821 | 15,620 | |||||||||||||||||||||||||
| | | | | | | | | | | | | | | | | | | | | | | | | | | | | | | | | | | | | | |
Income (loss) from continuing operations |
(294 | ) | (488 | ) | 434 | (1,641 | ) | (1,333 | ) | 1,303 | (3,477 | ) | (589 | ) | (16,893 | ) | (3,451 | ) | (4,182 | ) | (8,991 | ) | |||||||||||||||
Other (expense) income, net |
726 | (1,763 | ) | 356 | 36 | 194 | 83 | 74 | 66 | (1,122 | ) | (1,175 | ) | (158 | ) | 762 | |||||||||||||||||||||
| | | | | | | | | | | | | | | | | | | | | | | | | | | | | | | | | | | | | | |
Income (loss) before income taxes from continuing operations |
432 | (2,251 | ) | 790 | (1,605 | ) | (1,139 | ) | 1,386 | (3,403 | ) | (523 | ) | (18,015 | ) | (4,626 | ) | (4,340 | ) | (8,229 | ) | ||||||||||||||||
Income tax (expense) benefit |
1,264 | 198 | (32 | ) | (32 | ) | (84 | ) | (60 | ) | 95 | (21 | ) | (2 | ) | (25 | ) | (24 | ) | (493 | ) | ||||||||||||||||
| | | | | | | | | | | | | | | | | | | | | | | | | | | | | | | | | | | | | | |
Net income (loss) from continuing operations |
1,696 | (2,053 | ) | 758 | (1,637 | ) | (1,223 | ) | 1,326 | (3,308 | ) | (544 | ) | (18,017 | ) | (4,651 | ) | (4,364 | ) | (8,722 | ) | ||||||||||||||||
| | | | | | | | | | | | | | | | | | | | | | | | | | | | | | | | | | | | | | |
Mesoblast income from discontinued operations, net of tax |
210 | 9,811 | — | — | — | — | — | — | — | — | — | — | |||||||||||||||||||||||||
| | | | | | | | | | | | | | | | | | | | | | | | | | | | | | | | | | | | | | |
Net income (loss) |
$ | 1,906 | $ | 7,758 | $ | 758 | $ | (1,637 | ) | $ | (1,223 | ) | $ | 1,326 | $ | (3,308 | ) | $ | (544 | ) | $ | (18,017 | ) | $ | (4,651 | ) | $ | (4,364 | ) | $ | (8,722 | ) | |||||
| | | | | | | | | | | | | | | | | | | | | | | | | | | | | | | | | | | | | | |
| | | | | | | | | | | | | | | | | | | | | | | | | | | | | | | | | | | | | | |
| | | | | | | | | | | | | | | | | | | | | | | | | | | | | | | | | | | | | | |
Net income per share from continuing operations: |
|||||||||||||||||||||||||||||||||||||
Basic |
$ | 0.05 | $ | (0.06 | ) | $ | 0.02 | $ | (0.05 | ) | $ | (0.04 | ) | $ | 0.04 | $ | (0.10 | ) | $ | (0.02 | ) | $ | (0.52 | ) | $ | (0.14 | ) | $ | (0.13 | ) | $ | (0.25 | ) | ||||
Diluted |
$ | 0.05 | $ | (0.06 | ) | $ | 0.02 | $ | (0.05 | ) | $ | (0.04 | ) | $ | 0.04 | $ | (0.10 | ) | $ | (0.02 | ) | $ | (0.52 | ) | $ | (0.14 | ) | $ | (0.13 | ) | $ | (0.25 | ) | ||||
Net income per share from discontinued operations |
|||||||||||||||||||||||||||||||||||||
Basic |
$ | 0.01 | $ | 0.28 | $ | — | $ | — | $ | — | $ | — | $ | — | $ | — | $ | — | $ | — | $ | — | $ | — | |||||||||||||
Diluted |
$ | 0.01 | $ | 0.28 | $ | — | $ | — | $ | — | $ | — | $ | — | $ | — | $ | — | $ | — | $ | — | $ | — | |||||||||||||
Net income (loss) per share |
|||||||||||||||||||||||||||||||||||||
Basic |
$ | 0.06 | $ | 0.22 | $ | 0.02 | $ | (0.05 | ) | $ | (0.04 | ) | $ | 0.04 | $ | (0.10 | ) | $ | (0.02 | ) | $ | (0.52 | ) | $ | (0.14 | ) | $ | (0.13 | ) | $ | (0.25 | ) | |||||
Diluted |
$ | 0.06 | $ | 0.22 | $ | 0.02 | $ | (0.05 | ) | $ | (0.04 | ) | $ | 0.04 | $ | (0.10 | ) | $ | (0.02 | ) | $ | (0.52 | ) | $ | (0.14 | ) | $ | (0.13 | ) | $ | (0.25 | ) | |||||
Weighted average common shares outstanding: |
|||||||||||||||||||||||||||||||||||||
Basic |
34,526 | 34,526 | 34,526 | 34,520 | 34,501 | 34,501 | 34,500 | 34,495 | 34,472 | 34,444 | 34,411 | 34,358 | |||||||||||||||||||||||||
Diluted |
34,526 | 34,526 | 34,529 | 34,520 | 34,501 | 34,501 | 34,500 | 34,495 | 34,472 | 34,444 | 34,411 | 34,358 | |||||||||||||||||||||||||
Balance Sheet Data: |
|||||||||||||||||||||||||||||||||||||
Cash and investment securities |
$ | 27,888 | $ | 31,774 | $ | 22,163 | $ | 22,588 | $ | 26,662 | $ | 29,286 | $ | 30,213 | $ | 32,099 | $ | 33,953 | $ | 43,372 | $ | 46,961 | $ | 47,219 | |||||||||||||
Working capital(1) |
37,825 | 38,975 | 31,290 | 30,995 | 46,121 | 47,634 | 46,458 | 49,907 | 52,789 | 55,056 | 66,228 | 69,843 | |||||||||||||||||||||||||
Total assets |
78,122 | 77,116 | 68,112 | 67,575 | 71,817 | 72,194 | 71,165 | 72,592 | 73,666 | 78,222 | 80,204 | 83,736 | |||||||||||||||||||||||||
Long-term liabilities |
1,626 | 1,953 | 1,817 | 2,134 | 20,940 | 21,251 | 21,123 | 21,440 | 23,263 | 3,588 | 3,910 | 4,228 | |||||||||||||||||||||||||
Accumulated deficit |
(242,338 | ) | (244,244 | ) | (252,002 | ) | (252,760 | ) | (251,123 | ) | (249,900 | ) | (251,226 | ) | (247,918 | ) | (247,374 | ) | (229,357 | ) | (224,706 | ) | (220,342 | ) | |||||||||||||
Dividends paid |
— | — | — | — | — | — | — | — | 6,891 | — | — | — | |||||||||||||||||||||||||
Total stockholders' equity |
41,394 | 39,592 | 31,852 | 31,279 | 32,501 | 33,813 | 32,341 | 35,520 | 36,542 | 53,633 | 64,554 | 67,886 | |||||||||||||||||||||||||
- (1)
- Working capital is computed as current assets less current liabilities.
Quarterly Results of Operations
First Quarter Comparisons for the three months ended March 31, 2017, 2016, 2015 and 2014
Revenue
Revenue was $27.0 million for the three months ended March 31, 2017, $23.5 million for the three months ended March 31, 2016, $12.3 million for the three months ended March 31, 2015 and $7.2 million for the three months ended March 31, 2014. Revenue increased $3.5 million, or 15.1%, for
63
the three months ended March 31, 2017 compared to the three months ended March 31, 2016 primarily due to higher sales of Grafix/Stravix totaling $1.8 million, BIO4 totaling $1.4 million and Cartiform totaling $0.4 million, as a result of increased market awareness and acceptance. Revenue increased $11.2 million, or 91.3%, for the three months ended March 31, 2016 compared to the three months ended March 31, 2015 primarily due to higher sales of Grafix/Stravix totaling $7.2 million, BIO4 totaling $4.0 million and Cartiform totaling $0.9 million primarily due to the expansion of our in-house sales and marketing departments, launch of our Stravix product line in late 2015, increased Medicare coverage for our Grafix/Stravix products and continued improvement in market awareness and acceptance of our products. This increase was offset by a decrease in Ovation sales of $0.9 million as that product was discontinued in 2014. Revenue increased $5.1 million, or 71.3%, for the three months ended March 31, 2015 compared to the three months ended March 31, 2014 primarily due to expansion of our in-house sales and marketing departments, increased sales from third party distributors, and new distribution agreements for our BIO4 and Cartiform product lines.
Gross Profit and Gross Margin
Gross profit was $19.2 million for the three months ended March 31, 2017, $16.9 million for the three months ended March 31, 2016, $6.6 million for the three months ended March 31, 2015 and $6.1 million for the three months ended March 31, 2014.
Gross profit increased $2.3 million, or 13.2%, for the three months ended March 31, 2017 compared to the three months ended March 31, 2016 primarily due to higher sales volume. Gross margin was comparable for the two periods.
Gross profit increased $10.3 million, or 155.5%, for the three months ended March 31, 2016 compared to the three months ended March 31, 2015 primarily due to higher sales volume. Gross margin improved to 72.2% compared to 54.1% in the prior year period. In connection with the Restatement, we reversed the recognition of revenue from two distributors in 2015, which we changed from the accrual basis of accounting to the cash basis of accounting, but continued to recognize the costs as products were shipped.
Gross profit increased $0.5 million, or 8.6%, for the three months ended March 31, 2015 compared to the three months ended March 31, 2014 primarily due to higher sales volume. Gross margin decreased to 54.1% from 85.3% as a result of reversing the recognition of revenue from two distributors in 2015, which we changed from the accrual basis of accounting to the cash basis of accounting, which we continued to recognize the costs as products were shipped.
Research and Development Expenses
Our R&D expenses were $1.2 million for the three months ended March 31, 2017, $1.5 million for the three months ended March 31, 2016, $1.0 million for the three months ended March 31, 2015 and $0.5 million for the three months ended March 31, 2014. Our R&D expenses decreased $0.3 million, or 18.5%, for the three months ended March 31, 2017 compared to the three months ended March 31, 2016 primarily due to the cancellation of three clinical studies in the fourth quarter of 2016. Our R&D expenses increased $0.5 million, or 49.1%, for the three months ended March 31, 2016 compared to the three months ended March 31, 2015 primarily due to higher expenses resulting from clinical studies that began in 2015. Our R&D expenses increased $0.5 million, or 109.8%, for the three months ended March 31, 2015 compared to the three months ended March 31, 2014 primarily due to clinical studies that were initiated during the 2015 quarter.
Sales and Marketing Expenses
Sales and marketing expenses totaled $14.7 million for the three months ended March 31, 2017, $13.6 million for the three months ended March 31, 2016, $12.4 million for the three months ended
64
March 31, 2015 and $5.8 million for the three months ended March 31, 2014. Sales and marketing expenses increased $1.1 million, or 8.5%, for the three months ended March 31, 2017 compared to the three months ended March 31, 2016 primarily due to higher labor costs, including commissions. Sales and marketing expenses increased $1.2 million, or 9.6%, for the three months ended March 31, 2016 compared to the three months ended March 31, 2015 primarily due to higher labor costs, including commissions. Sales and marketing expenses increased $6.6 million, or 114.4%, for the three months ended March 31, 2015 compared to the three months ended March 31, 2014 primarily due to higher labor costs, including commissions of $5.1 million, resulting from expansion of our sales force and higher commissions and higher travel costs of $1.0 million.
General and Administrative Expenses
General and administrative expenses totaled $4.9 million for the three months ended March 31, 2017, $2.5 million for the three months ended March 31, 2016, $2.2 million for the three months ended March 31, 2015 and $1.4 million for the three months ended March 31, 2014. General and administrative increased $2.4 million, or 98.1%, for the three months ended March 31, 2017 compared to the three months ended March 31, 2016 primarily due to higher professional fees of $0.9 million, primarily related to the Restatement and the related legal proceedings, and higher labor costs of $0.6 million as we added administrative staff to support operations. General and administrative for the three months ended March 31, 2016 was comparable to the three months ended March 31, 2015. General and administrative expenses increased $0.8 million, or 57.3%, for the three months ended March 31, 2015 compared to the three months ended March 31, 2014 primarily due to higher labor costs of $0.4 million and higher professional fees of $0.4 million.
Other Income (Expense), net
Other income, net was $36 thousand for the three months ended March 31, 2017, $66 thousand for the three months ended March 31, 2016 and $0.8 million for the three months ended March 31, 2015 and other expense, net was $0.1 million for the three months ended March 31, 2014. Other income, net was relatively constant for the three months ended March 31, 2017 compared to the three months ended March 31, 2016. Other income, net decreased $0.7 million for the three months ended March 31, 2016 compared to the three months ended March 31, 2015 primarily due to reimbursement for services rendered to Mesoblast of $0.4 million and income recognized on the disposal of fixed assets in 2015 of $0.2 million. Other income, net increased $0.9 million for the three months ended March 31, 2015 compared to the three months ended March 31, 2014 primarily due to the reimbursement for services rendered to Mesoblast of $0.4 million and a gain on the disposal of fixed assets of $0.2 million.
Income Taxes
Our tax expense from continuing operations was $32 thousand for the three months ended March 31, 2017, $21 thousand for the three months ended March 31, 2016, $493 thousand for the three months ended March 31, 2015 and $0 for the three months ended March 31, 2014. Our tax expense for the three months ended March 31, 2017 was comparable to the three months ended March 31, 2016 primarily due to net loss in each period. Our tax expense decreased $472 thousand for the three months ended March 31, 2016 compared to the three months ended March 31, 2015 primarily due to a 2015 uncertain tax position relating to state income taxes. Our tax expense increased $493 thousand for the three months ended March 31, 2015 compared to the three months ended March 31, 2014 primarily due to a 2015 uncertain tax position relating to state income taxes.
65
Second Quarter Comparisons for the three months ended June 30, 2017, 2016, 2015 and 2014
Revenue
Revenue was $29.2 million for the three months ended June 30, 2017, $27.3 million for the three months ended June 30, 2016, $19.1 million for the three months ended June 30, 2015 and $9.2 million for the three months ended June 30, 2014. Revenue increased $1.9 million, or 6.7%, for the three months ended June 30, 2017 compared to the three months ended June 30, 2016 primarily due to higher sales of Grafix/Stravix of $1.0 million, BIO4 of $0.6 million and Cartiform of $0.2 million. Revenue increased $8.2 million, or 43.2%, for the three months ended June 30, 2016 compared to the three months ended June 30, 2015 primarily due to higher sales of Grafix/Stravix of $5.6 million, BIO4 of $3.4 million and Cartiform of $0.7 million, partially offset by lower sales of Ovation of $1.5 million as that product was discontinued. Revenue increased $9.9 million, or 107.2%, for the three months ended June 30, 2015 compared to the three months ended June 30, 2014 primarily due to expansion of our in-house sales and marketing departments, increased sales from third party distributors, and new distribution agreements for our BIO4 and Cartiform product lines.
Gross Profit and Gross Margin
Gross profit was $21.5 million for the three months ended June 30, 2017, $19.0 million for the three months ended June 30, 2016, $13.6 million for the three months ended June 30, 2015 and $7.1 for the three months ended June 30, 2014.
Gross profit increased $2.5 million, or 12.8%, for the three months ended June 30, 2017 compared to the three months ended June 30, 2016 primarily due to higher sales volume. Gross margin increased to 73.7% in the three months ended June 30, 2017 from 69.7% in the three months ended June 30, 2016 primarily due to higher costs of materials in the 2016 period.
Gross profit increased $5.4 million, or 39.6%, for the three months ended June 30, 2016 compared to the three months ended June 30, 2015 primarily due to higher sales volume. Gross margin decreased to 69.7% in the three months ended June 30, 2016 from 71.5% in the three months ended June 30, 2015 primarily due to higher costs of materials in the 2016 period.
Gross profit increased $6.5 million, or 90.8%, for the three months ended June 30, 2015 compared to the three months ended June 30, 2014 primarily due to higher sales volume. Gross margin decreased to 71.5% in 2015 from 77.6% in 2014 due a reversal of revenue from two distributors in 2015, which we changed from the accrual basis of accounting to the cash basis of accounting, but continued to recognize the costs as products were shipped.
Research and Development Expenses
Our R&D expenses were $0.9 million for the three months ended June 30, 2017, $1.5 million for the three months ended June 30, 2016, $1.1 million for the three months ended June 30, 2015 and $1.0 million for the three months ended June 30, 2014. Our R&D expenses decreased $0.6 million, or 39.4%, for the three months ended June 30, 2017 compared to the three months ended June 30, 2016 primarily due to the cancellation of three clinical studies in the fourth quarter of 2016. Our R&D expenses increased $0.4 million, or 38.9%, for the three months ended June 30, 2016 compared to the three months ended June 30, 2015 primarily due to higher expenses resulting from clinical studies that began in 2015. Our R&D expenses were relatively constant in three months ended June 30, 2015 compared to the three months ended June 30, 2014.
Sales and Marketing Expenses
Sales and marketing expenses totaled $14.7 million for the three months ended June 30, 2017, $14.7 million for the three months ended June 30, 2016, $14.2 million for the three months ended
66
June 30, 2015 and $8.0 million for the three months ended June 30, 2014. Sales and marketing expenses were relatively constant for the three months ended June 30, 2017 compared to the three months ended June 30, 2016. Sales and marketing expenses increased $0.5 million, or 3.5%, for the three months ended June 30, 2016 compared to the three months ended June 30, 2015 primarily due to higher labor costs, including commissions, of $1.3 million, partially offset by lower contract services of $0.6. million Sales and marketing expenses increased $6.2 million, or 77.7%, for the three months ended June 30, 2015 compared to the three months ended June 30, 2014 primarily due to higher labor costs, including commissions, of $3.7 million, higher travel costs of $0.8 million, higher contract services of $0.8 million as well as higher other operating costs as we expanded our sales force and marketing efforts.
General and Administrative Expenses
General and administrative expenses totaled $5.4 million for the three months ended June 30, 2017, $6.3 million for the three months ended June 30, 2016, $2.5 million for the three months ended June 30, 2015 and $1.6 million for the three months ended June 30, 2014. General and administrative expense decreased $0.9 million, or 13.2%, for the three months ended June 30, 2017 compared to the three months ended June 30, 2016 primarily due to lower professional fees. General and administrative expense increased $3.8 million, or 152.1%, for the three months ended June 30, 2016 compared to the three months ended June 30, 2015 primarily due to higher professional fees related to the Restatement and the related legal proceedings. General and administrative expense increased $0.9 million, or 52.3%, for the three months ended June 30, 2015 compared to the three months ended June 30, 2014 primarily due to higher labor cost.
Other Income (Expense), net
Other income, net was $0.4 million for the three months ended June 30, 2017, $0.1 million for the three months ended June 30, 2016, and other expense, net was $0.2 million for the three months ended June 30, 2015, and $1.2 million for the three months ended June 30, 2014. Other income, net increased $0.3 million, for the three months ended June 30, 2017 compared to the three months ended June 30, 2016 primarily due to higher interest income from a note receivable from a distributor. Other income, net for the three months ended June 30, 2016 increased $0.3 million compared to other expense, net of $0.2 million in 2015, primarily due to unrealized losses on Mesoblast Limited common stock in 2015. Other expense, net for the three months ended June 30, 2015 decreased $1.0 million compared to other expense, net of $1.2 million in 2014 primarily due to unrealized losses on Mesoblast Limited common stock in 2015.
Income Taxes
Our income tax (benefit) expense from continuing operations was $32 thousand for the three months ended June 30, 2017, $(95) thousand for the three months ended June 30, 2016, $24 thousand for the three months ended June 30, 2015 and $21 thousand for the three months ended June 30, 2014. Our tax expense for the three months ended June 30, 2017, June 30, 2016 and June 30, 2015 was comparable to the three months ended June 30, 2016, June 30, 2015 and June 30, 2014 and was primarily due to our net loss in each period.
Third Quarter Comparisons for the three months ended September 30, 2017, 2016, 2015 and 2014
Revenue
Revenue was $29.8 million for the three months ended September 30, 2017, $29.5 million for the three months ended September 30, 2016, $23.6 million for the three months ended September 30, 2015 and $16.3 million for the three months ended September 30, 2014. Revenue increased $0.3 million, or
67
1.0%, for the three months ended September 30, 2017 compared to the three months ended September 30, 2016 primarily due to higher sales of BIO4 of $0.6 million and Cartiform of $0.4 million, partially offset by lower sales of Grafix/Stravix of $0.6 million. Revenue increased $5.9 million, or 25.2%, for the three months ended September 30, 2016 compared to the three months ended September 30, 2015 primarily due to higher sales of Grafix/Stravix totaling $3.2 million, BIO4 of $2.8 million and Cartiform of $0.7 million, partially offset by lower sales of Ovation of $0.8 million as that product was discontinued. Revenue increased $7.3 million, or 44.5%, for the three months ended September 30, 2015 compared to the three months ended September 30, 2014 primarily due to expansion of our in-house sales and marketing departments, increased sales from third party distributors, and new distribution agreements for our BIO4 and Cartiform product lines.
Gross Profit and Gross Margin
Gross profit was $21.9 million for the three months ended September 30, 2017, $21.8 million for the three months ended September 30, 2016, $15.7 million for the three months ended September 30, 2015 and $12.8 million for the three months ended September 30, 2014.
Gross profit increased $0.1 million, or 0.5%, for the three months ended September 30, 2017 compared to the three months ended September 30, 2016 primarily due to higher sales volume. Gross margins were comparable for the two periods.
Gross profit increased $6.1 million, or 39.0%, for the three months ended September 30, 2016 compared to the three months ended September 30, 2015 primarily due to higher sales volume. Gross margin increased to 73.8% in 2016 from 66.5% in 2015 primarily due to higher cost of inventory in 2015 as production was reduced to reduce inventory levels that had built up.
Gross profit increased $2.9 million, or 22.5%, for the three months ended September 30, 2015 compared to the three months ended September 30, 2014 primarily due to higher sales volume. Gross margin decreased to 66.5% in 2015 from 78.4% in 2014 primarily due to higher cost of inventory in 2015 as we reduced production for a period of time to reduce inventory levels.
Research and Development Expenses
Our R&D expenses were $0.9 million for the three months ended September 30, 2017, $1.9 million for the three months ended September 30, 2016, $1.2 million for the three months ended September 30, 2015 and $0.9 million for the three months ended September 30, 2014. Our R&D expenses decreased $1.0 million, or 50.9%, for the three months ended September 30, 2017 compared to the three months ended September 30, 2016 primarily due to the cancellation of three clinical studies in the fourth quarter of 2016. Our R&D expenses increased $0.7 million, or 49.8%, for the three months ended September 30, 2016 compared to the three months ended September 30, 2015 primarily due to higher expenses resulting from clinical studies that began in 2015. Our R&D expenses increased $0.3 million, or 35.5%, for the three months ended September 30, 2015 compared to the three months ended September 30, 2014 primarily due to higher expenses resulting from clinical studies that began in 2015.
Sales and Marketing Expenses
Sales and marketing expenses totaled $14.8 million for the three months ended September 30, 2017, $15.3 million for the three months ended September 30, 2016, $15.5 million for the three months ended September 30, 2015 and $10.0 million for the three months ended September 30, 2014. Sales and marketing expenses decreased $0.5 million during the three months ended September 30, 2017 compared to the three months ended September 30, 2016, primarily due to lower labor and commission expenses. Sales and marketing were relatively constant for the three months ended September 30, 2016 compared to the three months ended September 30, 2015. Sales and marketing expenses increased
68
$5.5 million, or 55.0%, for the three months ended September 30, 2015 compared to the three months ended September 30, 2014 primarily due to higher labor costs, including commissions, of $3.8 million, higher travel costs of $0.5 million, as well as higher other operating costs as we expanded our sales force and marketing efforts.
General and Administrative Expenses
General and administrative expenses totaled $6.6 million for the three months ended September 30, 2017, $3.3 million for the three months ended September 30, 2016, $2.4 million for the three months ended September 30, 2015 and $1.8 million for the three months ended September 30, 2014. General and administrative increased $3.3 million, or 103.2%, for the three months ended September 30, 2017 compared to the three months ended September 30, 2016 primarily due to higher professional fees of $2.7 million primarily associated with the Restatement and the related legal proceedings, as well as higher labor costs of $0.7 million. General and administrative increased $0.9 million, or 34.7%, for the three months ended September 30, 2016 compared to the three months ended September 30, 2015 primarily due to higher professional fees. General and administrative increased $0.6 million, or 33.3%, for the three months ended September 30, 2015 compared to the three months ended September 30, 2014 primarily due to higher professional fees.
Other Income (Expense), net
Other expense, net was $1.8 million for the three months ended September 30, 2017, other income, net was $0.1 million for the three months ended September 30, 2016 and other expense, net was $1.2 million for the three months ended September 30, 2015 and $0.4 million for the three months ended September 30, 2014. Other expense, net for the three months ended September 30, 2017 increased $1.9 million compared to 2016 primarily due to losses recognized on Mesoblast Limited common stock. Other income, net increased $1.3 million for the three months ended September 30, 2016 compared to the three months ended September 30, 2015 primarily due to realized losses on Mesoblast Limited common stock and our available for sale investments recognized in the 2015 period. Other expense, net for the three months ended September 30, 2015 increased $0.8 million compared to the 2014 period primarily due to losses recognized on Mesoblast Limited common stock.
Income Taxes
Our income tax (benefit) expense from continuing operations was $(198) thousand for the three months ended September 30, 2017, $60 thousand for the three months ended September 30, 2016, $25 thousand for the three months ended September 30, 2015 and $23 thousand for the three months ended September 30, 2014. Our tax benefit for the three months ended September 30, 2017 increased compared to the three months ended September 30, 2016 due to an operating loss in 2017. Our tax expense decreased for the three months ended September 30, 2016 compared to the three months ended September 30, 2015 primarily due to a non-recurring true-up. Our tax expense for the three months ended September 30, 2015 was comparable to the three months ended September 30, 2014 as a result of our net loss in each period.
Mesoblast Income from Discontinued Operations
In connection with the sale of our therapeutics business to Mesoblast, we are entitled to receive contingent consideration as a result of Mesoblast achieving certain milestones. In July 2017, we received before tax $10.0 million in Mesoblast Limited common stock and approximately $0.4 million in cash as a milestone payment, net of taxes of $0.3 million, which are recorded as a discontinued operation.
69
Liquidity and Capital Resources
Liquidity
At December 31, 2017, we had $3.1 million in cash and $24.8 million in investments available for sale. As a result of the Restatement and related legal proceedings, we have and will continue to incur significant professional fees, well beyond historical levels. We expect this trend to continue in 2018 until these matters are fully resolved. In connection with the settlement of the class action described above, we expect to pay approximately $13.7 million in 2018 as part of the settlement amount not covered by insurance.
Even after taking into consideration the settlement of the class action described above, we anticipate our cash on hand, investments and cash flows from operations will be sufficient to finance our operations for the next twelve months.
Cash Flows
The following table sets forth a summary of our cash flows for each of our three most recently completed fiscal years:
| |
Year Ended December 31, | |||||||||
|---|---|---|---|---|---|---|---|---|---|---|
(In thousands)
|
2017 | 2016 | 2015 | |||||||
Net cash used in operating activities |
(5,223 | ) | (6,238 | ) | (10,979 | ) | ||||
Net cash provided by investing activities |
5,343 | 2 | 24,072 | |||||||
Net cash provided by financing activities |
128 | (75 | ) | (6,157 | ) | |||||
Operating Activities
Net cash used in operating activities was $5.2 million during 2017, and was primarily due to our loss from continuing operations of $1.2 million, plus a realized loss on investment of approximately $2.0 million, and changes in operating assets and liabilities, which included an increase in accounts receivable, net, of $2.8 million, an increase in prepaid and other current assets of $1.6 million, due in part to an increase in income tax receivable, and a net decrease in accounts payable, accrued expenses and other liabilities of $1.1 million, and payment of an accrued civil penalty of $1.5 million to the SEC in 2017.
Net cash used in operating activities was $6.2 million during 2016, and was primarily due to our net loss of $3.7 million, and increases of $4.4 million in accounts receivable, net, and $1.8 million in inventory, both due to growth of our business. These increases were partially offset by a $2.3 million increase in accounts payable, accrued expenses and other liabilities, which was due in part to higher professional fees resulting from the Restatement and the related legal proceedings.
Net cash used in operating activities was $11.0 million during 2015, and was primarily due to our net loss from continuing operations of $35.8 million and a $5.4 million increase in accounts receivable, net. Partially offsetting these items were accruals of $15.2 million for settlement of SEC and securities legal proceedings, net of an insurance receivable, a $4.4 million net increase in accounts payable, accrued expenses, and other liabilities, primarily due to higher accrued commissions resulting from new distributor agreements effective in 2015, $2.8 million in non-cash share-based compensation, a $2.5 million realized net loss on investments, and a $4.1 million decrease in prepaid expenses and other assets, primarily due to a reduction in prepaid commissions and receivable from Mesoblast for the guaranteed payments.
70
Investing Activities
Net cash provided by investing activities was $5.3 million during 2017, and was primarily due to the net proceeds from the sale of Mesoblast Limited common stock of approximately $7.9 million, partially offset by $2.0 million in purchases of property and equipment made during the year.
Net cash provided by investing activities was $2 thousand during 2016, and was primarily due to net proceeds from the sale of investments of $1.4 million, offset by $1.4 million in purchases of property and equipment made during the year.
Net cash provided by investing activities was $24.1 million during 2015, and was primarily due to $18.8 million in net proceeds from the sale of investments, including proceeds from the sale of Mesoblast Limited common stock, and $6.2 million in guaranteed payments from Mesoblast, partially offset by $0.9 million in purchases of property and equipment made during the year.
Financing Activities
Net cash provided by financing activities was $0.1 million during 2017, and reflects the proceeds from the exercise of options to purchase our common stock.
Net cash used in financing activities was $0.1 million during 2016, and primarily reflects the principal payments on capital lease obligations.
Net cash used in financing activities was $6.2 million during 2015, and primarily reflects $6.9 million payment of a special dividend, partially offset by $0.8 million in proceeds from the exercise of stock options to purchase our common stock, net of repurchases of common stock.
Off-Balance Sheet Arrangements
We had no off-balance sheet financing arrangements as of December 31, 2017, 2016 or 2015.
Contractual Obligations
The following table sets forth our estimates as to the amounts and timing of contractual payments for our most significant contractual obligations at December 31, 2017:
| |
Payment Due by Fiscal Year | |||||||||||||||
|---|---|---|---|---|---|---|---|---|---|---|---|---|---|---|---|---|
Contractual Obligations
|
Total | Less Than 1-Year |
Years 1-3 | Years 4-5 | More Than 5-Years |
|||||||||||
| |
(amounts in thousands) |
|||||||||||||||
Operating leases |
$ | 7,408 | $ | 1,139 | $ | 2,552 | $ | 2,600 | $ | 1,117 | ||||||
| | | | | | | | | | | | | | | | | |
Total contractual obligations |
$ | 7,408 | $ | 1,139 | $ | 2,552 | $ | 2,600 | $ | 1,117 | ||||||
| | | | | | | | | | | | | | | | | |
| | | | | | | | | | | | | | | | | |
| | | | | | | | | | | | | | | | | |
Operating leases consist of our lease for 61,203 square feet of laboratory, production, warehouse and office space in Columbia, Maryland, which lease expires in 2023.
71
The contractual obligations table does not include obligations relating to contract research organizations ("CROs"). CROs perform many of the tasks required under our clinical studies, and we utilize their expertise to ensure objectivity of the clinical results. We pay fees directly to the CROs for their professional services, which may be payable upon specified study milestones or as they provide services, depending on the structure of the contract. We are also responsible for reimbursing the CROs for certain pass through expenses they incur in administering the study. The timing of our payments to the CROs is dependent upon the progress of the various studies, which is highly variable dependent upon the speed with which the CROs are able to enroll patients and testing sites. As such, we are unable to specifically predict the timing of future payments to CROs in connection with a specific clinical study.
ITEM 7A. Quantitative and Qualitative Disclosures about Market Risk.
We are exposed to market risks from changes in interest rates through our investments, which consist primarily of corporate and government bonds. Due to the short duration of our investment portfolio and the high quality of our investments, an immediate 10% change in interest rates would not have a material effect on the value of our portfolio. Therefore, we would not expect our operating results or cash flows to be affected to any material degree by the effect of a sudden change in market interest rates on our securities portfolio.
We do not currently have any material foreign currency exposure.
ITEM 8. Financial Statements and Supplementary Data
See our consolidated financial statements beginning on page F-1
ITEM 9. Changes in and Disagreements with Accountants on Accounting and Financial Disclosure.
As previously disclosed in our Current Report on Form 8-K filed with the SEC on December 17, 2015, on December 11, 2015, we received notice from our independent registered public accounting firm, BDO USA, LLP ("BDO") that they intended to resign. On December 14, 2015, we received written notice of BDO's resignation, effective the same day. Notwithstanding the resignation, BDO continued to perform procedures to complete the restatement of our 2014 financial statements. BDO had previously served as our independent registered public accounting firm since September 19, 2013.
The reports of BDO on our consolidated financial statements as of and for the fiscal years ended December 31, 2014 and December 31, 2013 did not contain any adverse opinion or disclaimer of opinion, nor were they qualified or modified as to uncertainty, audit scope, or accounting principles, except that, as previously disclosed on our Current Report on Form 8-K filed with the SEC on November 20, 2015 (the "November 20 Form 8-K"), BDO advised that their opinion on the effectiveness of our internal control over financial reporting as of December 31, 2014 should no longer be relied upon due to management's identification of a material weakness in our internal control over financial reporting related to the timing of revenue recognition under certain distribution contracts.
During the fiscal years ended December 31, 2014 and December 31, 2013, and through December 14, 2015, there were (i) no "disagreements" as that term is defined in Item 304(a)(1)(iv) of Regulation S-K and the related instructions, between us and BDO on any matter of accounting principles or practices, financial statement disclosure or auditing scope or procedure, which disagreements, if not resolved to the satisfaction of BDO, would have caused BDO to make reference to the subject matter of the disagreements in its reports on the financial statements for such years, except for the disagreements described below and (ii) no "reportable events" as that term is defined in Item 304(a)(1)(v) of Regulation S-K, except for the material weakness previously disclosed in our November 20 Form 8-K.
72
During preparation for filing of our Quarterly Report on Form 10-Q for the quarter ended September 30, 2015 (the "Third Quarter 2015 Form 10-Q"), we and BDO had a disagreement about the timing of revenue recognition under certain distributor contracts and about our related internal control over financial reporting. As previously disclosed, we accounted for and recognized revenue under certain distributor contracts as reflected in our previously filed audited financial statements for the year ended December 31, 2014 and unaudited interim financial statements for the quarters ended March 31, 2015 and June 30, 2015. During BDO's review of our third quarter 2015 financial statements, BDO subsequently recommended that we (1) change our accounting related to one distributor contract in the fourth quarter of 2014 due to the failure to meet certain revenue recognition criteria under GAAP and (2) reassess our evaluation of internal control over financial reporting to consider whether a material weakness existed with respect to revenue recognition. Our former management (including a former chief executive officer and a former chief financial officer) initially disagreed with, but ultimately implemented, BDO's recommendations, as reflected in our Third Quarter 2015 Form 10-Q, November 20 Form 8-K and the 2014 Form 10-K/A.
As previously announced in our Current Report on Form 8-K filed with the SEC on May 18, 2017, on May 17, 2017 Ernst & Young LLP ("Ernst & Young") was formally engaged by us as our independent registered public accounting firm.
ITEM 9A. Controls and Procedures.
Evaluation of Disclosure Controls and Procedures
We maintain disclosure controls and procedures that are designed to ensure that information required to be disclosed in our reports filed or submitted under the Exchange Act is recorded, processed, summarized, and reported within the time periods specified in the SEC's rules and forms, and that such information is accumulated and communicated to our management, including our Interim Chief Executive Officer and Chief Financial Officer, as appropriate, to allow for timely decisions regarding required disclosure.
Our management, under the supervision and with the participation of our Interim Chief Executive Officer and Chief Financial Officer, has carried out an evaluation of the effectiveness of the design and operation of our disclosure controls and procedures (as defined in Rules 13a-15(e) and 15d-15(e) under the Exchange Act) as of December 31, 2017. Based upon that evaluation, and in light of the material weaknesses in the design and operation of our internal control over financial reporting disclosed below, our Interim Chief Executive Officer and Chief Financial Officer concluded that, as of the end of the period covered by this report, our disclosure controls and procedures were not effective.
Management's Annual Report on Internal Control over Financial Reporting
Our management, under the supervision of our Interim Chief Executive Officer and Chief Financial Officer, is responsible for the preparation, integrity and fair presentation of information in our financial statements, including estimates and judgments. The financial statements presented in this Annual Report on Form 10-K have been prepared in accordance with GAAP. Our management believes the financial statements and other financial information included in this Annual Report on Form 10-K fairly present, in all material respects, our financial condition, results of operations, cash flows and notes thereto as of and for the periods presented in this Annual Report on Form 10-K.
Our management is responsible for establishing and maintaining adequate internal control over financial reporting and for the assessment of the effectiveness of internal control over financial reporting. Internal control over financial reporting is defined in Rules 13a-15(f) and 15d-15(f) under the Exchange Act as a process designed by, or supervised by, our principal executive and principal financial officers, to provide reasonable assurance regarding the reliability of financial reporting and the preparation of financial statements for external purposes in accordance with GAAP.
73
Our internal control over financial reporting is supported by written policies and procedures that
- •
- pertain to the maintenance of records that, in reasonable detail, accurately and fairly reflect our transactions and dispositions of our
assets;
- •
- provide reasonable assurance that transactions are recorded as necessary to permit preparation of financial statements in accordance with GAAP,
and that our receipts and expenditures are being made only in accordance with authorizations of our management and directors; and
- •
- provide reasonable assurance regarding prevention or timely detection of unauthorized acquisition, use, or disposition of our assets that could have a material effect on the financial statements.
Because of its inherent limitations, internal control over financial reporting may not prevent or detect misstatements. Projections of any evaluation of the effectiveness of such controls to future periods are subject to the risk that controls may become inadequate because of changes in conditions, or that the degree of compliance with the policies or procedures may deteriorate.
In connection with the preparation of our annual financial statements, our management, under the supervision of our Interim Chief Executive Officer and Chief Financial Officer, has undertaken an assessment of the effectiveness of our internal control over financial reporting as of December 31, 2017 based on the criteria established in Internal Control—Integrated Framework (2013) issued by the Committee of Sponsoring Organizations of the Treadway Commission (the "COSO Framework"). Management's assessment included an evaluation of the design and operational effectiveness of our internal control over financial reporting. Based on this assessment, and in light of the material weaknesses in the design and operation of our internal control over financial reporting disclosed below, management has concluded that our internal control over financial reporting was not effective as of December 31, 2017 because we did not sufficiently establish, implement, or execute adequately designed and effective operating controls.
A material weakness is a deficiency, or combination of deficiencies, in internal control over financial reporting, such that there is a reasonable possibility that a material misstatement of our annual or interim financial statements will not be prevented or detected on a timely basis. We identified material weaknesses in internal control over financial reporting in the 2014 Form 10-K/A. The Audit Committee, the Board and management initiated extensive remediation efforts, as discussed below in "Remediation Activities in Response to Material Weaknesses," to begin to remediate the material weaknesses in control activities that existed at December 31, 2014. These material weaknesses cannot be considered remediated until the applicable remedial controls operate for a sufficient period of time and management is able to conclude, through testing, that these controls are operating effectively consistent with the monitoring component of the COSO Framework. As of December 31, 2017, we identified the following control deficiencies that we believe constituted individually, and in the aggregate, material weaknesses in the control activity components of the COSO Framework, which are pervasive across our internal control processes, some of which include material weaknesses previously disclosed in our Form 10-K/A for the fiscal year ended as of December 31, 2014:
- •
- Revenue Recognition. We did not maintain effective controls over the timing and manner of revenue recognition and failed to properly and timely assess the four basic criteria required to recognize revenue: (1) persuasive evidence that an agreement exists, (2) delivery has occurred or services have been rendered, (3) the seller's price is fixed or determinable, and (4) collectability is reasonably assured. None of our controls related to revenue recognition were effective, including revenue recognition in connection with distributor sales arrangements, consignment sales arrangements and "bill and hold" arrangements, assessing and documenting the creditworthiness of our customers, distinguishing and assessing shipping terms and title transfer, assessing our role (as principal or agent) in third-party distribution arrangements, reconciling
74
- •
- Processing of Directors' Expense Reports. We did not design and maintain
effective processes and controls over expense reimbursement for directors.
- •
- Inventory. We did not design and maintain effective processes and controls
over the computation of costs, quantities and reserves for recording inventory. This material weakness in internal control over financial reporting includes the previously identified material weakness
of valuation of inventory included in the 2014 Form 10-K/A.
- •
- Reserves, Estimates, and Valuation Accounts. We did not maintain effective
processes and controls over reserves, estimates, and valuation accounts, including the collectability of accounts receivable and determining our bad debt reserve, rebates reserve, returns reserve,
income tax valuation allowance and uncertain tax positions. This material weakness in internal control over financial reporting includes the previously identified material weakness related to our bad
debt reserve included in the 2014 Form 10-K/A.
- •
- Purchasing and Disbursements. We did not maintain effective controls over
the purchasing of goods and services, including the processing and payment of vendor invoices, the classification of various expenses, capitalization of assets and the processing of employee payroll
and other compensation arrangements. This material weakness in internal control over financial reporting includes the previously identified material weakness of costs and expenses included in the 2014
Form 10-K/A.
- •
- Information Technology. The COSO Framework groups information technology related controls into two types: general controls and application-specific controls. General controls include controls over data center operations, systems software controls, access security controls, and system development and program change controls; application controls encompass the manner in which different applications interface with each other and exchange data, and are designed to control information processing and ensure the completeness and accuracy of transaction processing authorization and validity. We did not have effectively designed controls and did not maintain effective operating controls over our use of information technology in either general controls or application controls as of December 31, 2017.
internal records with records from third-party distributors and end-use customers, gathering appropriate supporting documentation for transactions, reviewing, approving and documenting customer credits and receiving requisite documentation in connection with transactions. The lack of appropriate controls over revenue activities led to material errors occurring and going undetected in our interim and annual financial statements in 2014 previously reported in the 2014 Form 10-K/A and our interim financial statements previously reported in our Quarterly Reports on Form 10-Q for the quarters ended March 31, 2015, June 30, 2015 and September 30, 2015. This material weakness in internal control over financial reporting regarding revenue recognition includes the previously identified material weaknesses regarding consignment arrangements and revenue recognition under distribution sales arrangements included in the 2014 Form 10-K/A and affected our assessment of the adoption of the new revenue recognition rules under Accounting Standards Codification No. 606.
Changes in Internal Control over Financial Reporting
With the exception of the remediation efforts described below, there have been no changes in our internal control over financial reporting that occurred in the annual period covered by this report that materially affected, or is reasonably likely to materially affect, our internal control over financial reporting. The Audit Committee, the Board and current management are committed to remediating the material weaknesses in our internal control environment. As a result, we have initiated the remediation efforts outlined below, but these efforts are ongoing and cannot be considered remediated until the
75
applicable remedial controls operate for a sufficient period of time and management has concluded, through testing, that these controls are operating effectively.
Remediation Activities in Response to Material Weaknesses
Our management, with the oversight of the Audit Committee, has undertaken a plan to remediate the material weaknesses identified above. Our remediation efforts, which are either implemented or in the process of being implemented, are intended to address the identified material weaknesses and include:
- •
- We have implemented or are in the process of implementing new and enhanced controls for proper revenue recognition. These controls
include:
- •
- the timely assessment of the four basic criteria: (1) persuasive evidence that an agreement exists, (2) delivery has
occurred or services have been rendered, (3) the seller's price is fixed and determinable, and (4) collectability is reasonably assured;
- •
- requiring sale and distribution contracts to be reviewed and approved by both our legal and finance departments;
- •
- performing formal, thorough accounting analyses of revenue agreements, taking into account all terms and conditions and correctly
applying the applicable accounting guidance;
- •
- establishing a new monthly process of reconciling billing with revenue;
- •
- reviewing, approving and documenting customer credits issued for returns, refunds, price adjustments and similar commercial
accommodations;
- •
- preparing estimates of product returns in arrangements that contain rights of return;
- •
- preparing, reviewing and approving journal entries and ensuring that such journal entries are properly supported and posted to the
general ledger in a timely manner;
- •
- engaging a third-party consulting firm to assist in the evaluation of new revenue recognition guidance, which we adopted on
January 1, 2018;
- •
- implementing procedures to monitor and analyze consignment inventories, such as periodic field counts held at customer sites;
- •
- implementing a company-wide budgeting and forecasting process; and
- •
- performing controls on a timely basis with adequate precision, and sufficiently documenting performance of the control in a
reasonable manner.
- •
- We have implemented or are in the process of implementing new and enhanced controls relating to expense reimbursement for our directors,
including the adoption of a formal director expense reimbursement policy.
- •
- We have implemented or are in the process of implementing new and enhanced controls over inventory. These controls include:
- •
- implementing procedures to monitor and analyze consignment inventories, such as periodic field counts held at customer sites;
- •
- enhancements to ensure that once a finished good has been determined to be damaged, obsolete or otherwise not fit for sale, it is
reserved for or written off on a timely basis;
- •
- additional review of our inventory reserve analysis, including the involvement of both finance and operational executives;
76
- •
- additional analysis of inventory on hand at the product line level, which we expect to provide better controls to assess excess
and obsolete inventory based on the current inventory on hand in relation to the demand forecast and related reserve;
- •
- hiring of accounting personnel with relevant cost accounting experience whose daily job responsibility is to monitor, analyze and
develop processes to properly value our inventory levels; and
- •
- preparing standard inventory cost valuation reserves, purchase price and manufacturing inventory variance adjustments, and
obsolescence reserves.
- •
- We have implemented or are in the process of implementing new and enhanced controls for developing and evaluating the appropriateness of
reserves, estimates, and valuation accounts. These controls include:
- •
- implementing new procedures to assess the collectability of trade accounts receivable and determine our bad debt reserve, which
will be overseen by our recently hired credit and collections manager;
- •
- assessing the collectability of accounts receivable and determining an allowance for doubtful accounts;
- •
- estimating an allowance for returns under existing "rights of return" provisions;
- •
- engaging a third-party tax expert to assist in estimating deferred income tax assets, deferred income tax liabilities, uncertain
tax positions, and valuation allowances;
- •
- assessing accruals;
- •
- assessing "other-than-temporary" impairments of investments;
- •
- preparing, reviewing and approving journal entries and ensuring that such journal entries are properly posted to the general
ledger in a timely manner; and
- •
- performing controls on a timely basis with adequate precision, and sufficiently documenting performance of the control in a
reasonable manner.
- •
- We have implemented or are in the process of implementing new and enhanced controls over purchasing and disbursements. These controls
include:
- •
- approving and validating vendor invoices received by verifying purchase authorization and the receipt of the goods or services;
- •
- reviewing the classification of costs, expenses and capital purchases;
- •
- preparing, reviewing and approving journal entries and ensuring that such journal entries are properly posted to the general
ledger in a timely manner; and
- •
- performing controls on a timely basis with adequate precision, and sufficiently documenting performance of the control in a
reasonable manner.
- •
- We implemented or are in the process of implementing new and enhanced controls for information technology. These controls
include:
- •
- requiring management and departmental approval for all levels of access to financial systems prior to such access being granted to
new employees or transfers;
- •
- requiring IT and departmental managers to periodically review all system access to ensure granted access remains appropriate;
77
- •
- a new termination policy requiring that all access held by terminated employees is terminated in a timely manner;
- •
- clearly segregating duties and information access among employees, including limiting administrative rights and "privileged
access" rights to financial systems to certain IT management members;
- •
- requiring that all new programs and changes to existing programs be formally approved by appropriate levels of management, and
that all programs and changes be fully developed and tested in a test environment prior to migration into the production environment; and
- •
- reviewing, on an annual basis, internal controls existing at third party/vendor service organizations to evaluate whether information processed by those parties is complete and accurate and can be relied upon.
Management is implementing and monitoring the effectiveness of these and other processes, procedures and controls and will make any further changes deemed appropriate. Management believes our planned remedial efforts will effectively remediate the identified material weaknesses. As we continue to evaluate and work to improve our internal control over financial reporting, management may determine to take additional measures to address control deficiencies or determine to modify the remediation plan described above.
If not remediated, these control deficiencies could result in further material misstatements to our financial statements.
Remediation of Previously Reported Material Weakness Related to Control Environment. During the years ended December 31, 2016 and December 31, 2017, we implemented the following remediation actions to address a material weakness previously identified in our control environment:
- •
- Our former chief executive officer, our two former chief financial officers and our former general counsel who were in office during the
restated periods in 2014 and 2015 are no longer with the Company.
- •
- We have made substantial changes at the Board level. Four of the five non-executive directors of our Board were elected in 2016 and 2017, with
two of the four having served as chief financial officers of public companies and another as general counsel of a public company. The Board appointed a new chairman of the Audit Committee in 2017.
- •
- Our Board directed our senior management to ensure that a proper and consistent compliance culture is communicated throughout the organization,
which emphasizes the importance of internal control over financial reporting.
- •
- To ensure we have a sufficient complement of personnel with an appropriate level of knowledge, experience, and training commensurate with our
financial management and reporting requirements, we added or replaced personnel in a number of key financial positions including our Chief Financial Officer, corporate controller, cost accounting
manager, revenue recognition manager and several other accounting positions. We also added contract personnel to assist with the completion of our 2015, 2016 and 2017 financial statements and in
connection with the review and implementation of our internal control structure. Our customer service department, which is responsible for order entry and sales activity reporting, was moved from the
sales function to report to the finance function.
- •
- We provided and continue to provide appropriate and relevant continuing professional education and training to all finance and accounting personnel.
78
We believe that these remediation efforts have improved our internal control over financial reporting, as well as our disclosure controls and procedures, and that the previously identified material weakness related to our control environment has been remediated as of December 31, 2017.
Our independent registered public accounting firm is engaged to express an opinion on our internal control over financial reporting as of December 31, 2017, which opinion is included in its report in Part II, Item 8 of this Form 10-K under the caption "Report of Independent Registered Public Accounting Firm—Internal Control Over Financial Reporting."
None.
79
ITEM 10. Directors, Executive Officers and Corporate Governance.
Board of Directors
Our Charter and Bylaws provide that our business is to be managed by or under the direction of our Board. Our Board is currently comprised of six directors, all of whom have terms expiring at the next annual meeting. In each case, the directors remain in office, notwithstanding the expiration of the otherwise applicable term, until their respective successors have been duly elected and qualified, or until their earlier death, resignation, retirement or removal.
The current members of our Board, along with the positions and ages of such members, are as follows:
Name
|
Age | Positions | |||
|---|---|---|---|---|---|
Peter Friedli |
64 | Chairman of the Board | |||
David L. White |
49 | Chairman, Audit Committee | |||
Uwe Sommer |
62 | Chairman, Compensation Committee and Nominating Committee | |||
Thomas M. Brandt |
66 | Director | |||
Thomas J. Knapp |
65 | Director | |||
Willi Miesch |
54 | Director(1) | |||
- (1)
- Mr. Miesch was appointed to the Board in February 2018.
Set forth below are descriptions of the backgrounds and principal occupations of each of our current directors, and the period during which each director has served as a member of the Board.
Peter Friedli, age 64, is a co-founder of the Company and, except for the period between February and June 2004, has been a director since January 1996. Since 2012, Mr. Friedli has served as the President and sole owner of Peter Friedli & Co., Inc. Since 1986, Mr. Friedli has served as a principal of Friedli Corporate Finance, Inc., a leading Swiss venture capital firm, which has made significant investments in the biotechnology industry and has been the primary source of financing for the Company. Since 1997, Mr. Friedli has served as the President of New Venturetec Ltd., a Swiss publicly traded investment company, and its wholly-owned subsidiary, Venturetec, Inc. Mr. Friedli has worked in the field of international management consulting for service and industrial companies in Europe and the United States throughout his career and serves as a director for certain private companies. Mr. Friedli brings to our Board his extensive experience as an independent investment manager in venture capital, specialization in investments domiciled in the United States in the areas of biotechnology and technology, service on the boards of other companies and organizations, and a longtime commitment to the Company. Mr. Friedli is the largest single shareholder of the Company.
Thomas M. Brandt, age 66, was appointed to the Board in March 2016. Mr. Brandt served as a board member of TeleCommunication Systems Inc. ("TCS") (NASDAQ:TSYS), a wireless communications company that specialized in 911 support, cybersecurity and wireless infrastructure, from 2009 until its sale to Comtech Telecommunications Corp. in February 2016, and was Chief Financial Officer of TCS beginning in 1997. Mr. Brandt led TCS through its initial public offering in 2000 and helped the company grow from $25 million of revenue in 1998 to nearly $400 million in 2015. Prior to working at TCS, Mr. Brandt was Chief Financial Officer of Digex, Inc. (NASDAQ:DIGX), an internet service provider, where he helped lead its 1996 initial public offering. Earlier in his career, he worked in the audit practice of Price Waterhouse for 12 years. Currently, Mr. Brandt serves as a member of the boards of Antenna Research Associates and the YMCA of Central Maryland, as well as on the Maryland Supplemental Retirement Plans Board. Mr. Brandt is a Certified Public Accountant
80
(inactive) with a Bachelor of Arts degree in management science and economics from Duke University and a Master of Business Administration degree from the Wharton School of the University of Pennsylvania. Mr. Brandt brings to our Board his previous experience as a chief financial officer of public companies and his work at an independent auditing firm.
Thomas J. Knapp, age 65, was appointed to the Board in February 2017. Mr. Knapp is currently a consultant for SELLAS Life Sciences Group, Inc. (NASDAQ:SLS), which completed its merger with Galena Biopharma, Inc. ("Galena") (NASDAQ:GALE) in December 2017. From June 2015 to December 2017, Mr. Knapp served as Interim General Counsel and Corporate Secretary of Galena. Previously, from February 2010 to July 2015, he was Executive Vice President, Chief Legal Officer and Corporate Secretary of Sucampo Pharmaceuticals, Inc. (NASAQ:SCMP). His other experience includes serving as Vice President, General Counsel and Corporate Secretary at NorthWestern Corporation and in senior in-house attorney positions at The Boeing Company and The Burlington Northern & Santa Fe Railway Company. Mr. Knapp has over 25 years of corporate and law firm experience with regulated industries, which experience includes federal and state regulatory matters, federal government affairs, risk management, compliance, litigation, complex commercial transactions and corporate governance. Mr. Knapp brings to our Board his vast legal experience working with companies in regulated industries as well as his knowledge regarding the pharmaceutical industry.
Willi Miesch, age 54, was appointed to the Board in February 2018. Since 1998, Mr. Miesch has served as Chief Executive Officer of Medartis AG, a medical technology company. Prior to working at Medartis AG, he held executive roles at Institut Straumann AG Switzerland and USA and Stratec Medical. Mr. Miesch has extensive entrepreneurial experience developing healthcare companies and marketing medical devices. Mr. Miesch has a Superior Technician degree from ABB Engineering School Baden and completed postgraduate studies in market-oriented Business Management at the University of Central Switzerland. Mr. Miesch brings to our Board his leadership experience and marketing expertise.
Uwe Sommer, age 62, was appointed to the Board in February 2017. Mr. Sommer was Chief Executive Officer of UTM Luxemburg SCA ("UTM Luxemburg") from May 2017 to August 2017. Prior to UTM Luxemburg, Mr. Sommer served in various management positions at Lindt & Sprüngli AG, including as Head of Marketing & Sales, from 1993 to 2017. Earlier in his career, Mr. Sommer held executive roles with Johnson & Johnson, Mars, Incorporated, and Procter & Gamble Co. He has degrees in Economics from University Kiel (Germany) and Marketing and Economics from Penn State University. Mr. Sommer brings to our Board his leadership experience in global marketing and sales, including managing distribution in markets including Europe, Japan, the Middle East, Africa and the United States.
David L. White, age 49, was appointed to the Board in May 2017. Mr. White is currently an independent management consultant. From September 2006 to June 2016, Mr. White served as Senior Vice President, Chief Financial Officer and Treasurer of Choice Hotels International, Inc. ("Choice Hotels") (NYSE: CHH), a hospitality holding corporation. Prior to joining Choice Hotels, he held positions with Ernst & Young, Arthur Andersen LLP and Statoil Energy, Inc. Mr. White has more than 25 years of corporate finance and public accounting experience with a track record of achievement in financial management, business and capital allocation strategy, and public company reporting, compliance and governance. Mr. White brings to our Board his extensive background in corporate finance and public accounting.
81
Executive Officers
The following table sets forth certain information concerning our current executive officers.
Name
|
Age | Positions | Employment Date |
|||
|---|---|---|---|---|---|---|
Jason Keefer(1) |
46 | Interim President and Chief Executive Officer | February 2018 | |||
Linda L. Chang |
52 | Chief Financial Officer | May 2017 | |||
Alla Danilkovitch, Ph.D. |
54 | Chief Scientific Officer | April 2003 |
- (1)
- Linda Palczuk, our former President and Chief Executive Officer, resigned from the Company, effective as of February 9, 2018. Jason Keefer is currently serving as our Interim President and Chief Executive Officer and has been employed by the Company since February 2014.
Set forth below are descriptions of the backgrounds of each of our current executive officers.
Jason Keefer, age 46, was appointed to serve as Interim President and Chief Executive Officer, effective as of February 9, 2018. Mr. Keefer joined the Company in 2014, was named Vice President, Marketing in August 2016 and previously served as our Interim Chief Executive Officer from June 2017 to July 2017. Mr. Keefer assumed the additional responsibilities to lead Market Access in October 2017. Prior to joining the Company, Mr. Keefer served as Zone Sales Director, Central United States, for Shire Plc, where he was employed from 2011 to 2014, and he worked at Pfizer Inc. from 1998 to 2011. He has 20 years of experience in the pharmaceutical and medical device industries and has held roles in sales, training, senior sales management and marketing. Mr. Keefer earned his Bachelor of Arts degree from Colgate University.
Linda L. Chang, age 52, was appointed Chief Financial Officer, effective as of May 17, 2017. Ms. Chang was most recently Senior Vice President, Chief Financial Officer of Therabron Therapeutics from December 2015 to February 2017 where she led the Finance, Strategic Planning and Legal functions. Previously, Ms. Chang served as Senior Vice President, Chief Financial Officer, Treasurer and Corporate Secretary at PharmAthene Inc. ("PharmAthene") (NYSE: PIP) from November 2011 to April 2015. While at PharmAthene, Ms. Chang was responsible for all financial operations including corporate accounting, SEC reporting, tax, treasury, financial planning, investor relations and capital access. Prior to PharmAthene, Ms. Chang held roles of increasing responsibility in the financial groups at Human Genome Sciences (NASDAQ:HGSI), Booz Allen Hamilton Inc. (NYSE: BAH), Grant Thornton LLP and Otsuka America Pharmaceuticals. Ms. Chang has over 20 years of finance and executive leadership experience. She holds a Bachelor of Science degree in Business Administration from the University of California, Riverside, Master of Business Administration degree as well as a Master of Accountancy degree from the University of Georgia. She is also a Certified Public Accountant (inactive).
Alla Danilkovitch, Ph.D., age 54, has served as our Chief Scientific Officer since April 2015. Dr. Danilkovitch joined the Company in 2003 and previously served as our Vice President of Research & Development and, prior to that, as our Head of Discovery. Dr. Danilkovitch has over 25 years of broad biomedical research experience including stem cell biology, immunology and cancer research. Prior to joining the Company in April 2003, Dr. Danilkovitch conducted research at the National Cancer Institute of National Institutes of Health, the Max-Plank Institute of Biochemistry in Munich and at Moscow State University. Dr. Danilkovitch earned a Doctor of Philosophy degree in cell biology and a Master of Science degree in cellular immunology and microbiology from Moscow State University.
82
Section 16(a) Beneficial Ownership Reporting Compliance
Section 16(a) of the Exchange Act requires that our executive officers and directors, and persons who own more than 10% of a registered class of our equity securities, file reports of ownership and changes in ownership on Forms 3, 4 and 5 with the SEC and the NYSE. Executive officers, directors and greater than 10% shareholders are required by the SEC to furnish us with copies of all Forms 3, 4 and 5 that they file.
Based on our review of the copies of such forms, and/or on written representations from the reporting persons that they were not required to file a Form 5 for the fiscal year, we believe that these filing requirements were satisfied by the reporting persons during the years ended December 31, 2017, 2016 and 2015, except for the following:
- •
- A Form 3 reporting no beneficial ownership was filed late for Linda L. Chang following her appointment as Chief Financial Officer.
- •
- A Form 3 was filed late for Jason Keefer following his appointment as Interim Chief Executive Officer.
- •
- A Form 3 reporting no beneficial ownership and a Form 4 reporting the acquisition of stock options of the Company were filed late
for Linda Palczuk following her appointment as Chief Executive Officer.
- •
- A Form 4 reporting the acquisition of stock options of the Company was filed late for Alla Danilkovitch, our Chief Scientific Officer.
- •
- Forms 3 reporting no beneficial ownership were filed late for each of David L. White and Thomas J. Knapp following their appointment to the Board.
Codes of Conduct and Ethics
We have adopted a Corporate Code of Conduct that applies to all of our employees, including our Chief Executive Officer and Chief Financial Officer, and every member of our Board. We have also adopted a Code of Business Conduct and Ethics for Members of the Board of Directors and Executive Officers. Copies of these documents are publicly available on the Investors Relations—Corporate Governance section of our website at http://investor.osiris.com/corporate-governance. Disclosure regarding any amendments to, or waivers from, provisions of our Corporate Code of Conduct or our Code of Business Conduct and Ethics for Members of the Board of Directors and Executive Officers that apply to our directors and principal executive and financial officers will be posted on our website at http://investor.osiris.com/corporate-governance.
Audit Committee
We have an Audit Committee consisting of the following directors, all of whom were determined to be independent under the independence standards promulgated by the SEC and by the NASDAQ rules, as such standards apply specifically to members of audit committees: David L. White (Chairman), Thomas M. Brandt and Thomas J. Knapp. The Board has determined that Mr. White is an "audit committee financial expert," as defined by the rules and regulations of the SEC. The current charter for the Audit Committee is posted on the Company's website at http://investor.osiris.com/corporate-governance. Pursuant to its charter, the Audit Committee's general responsibilities include:
- •
- Overseeing financial and compliance functions as assigned by the Board;
- •
- Reviewing areas of potential significant financial risk to the Company;
- •
- Monitoring the independence and performance of the independent registered public accounting firm; and
83
- •
- Providing an avenue of communication among the independent auditors, management, our internal audit function and the Board.
ITEM 11. Executive Compensation.
Compensation Discussion and Analysis
Overview
The Compensation Committee of the Board (the "Compensation Committee") is composed entirely of independent directors, as such term is defined by the NASDAQ rules. The Compensation Committee, which currently consists of Uwe Sommer (Chairman) and Thomas J. Knapp, is responsible for establishing and administering our executive compensation policies. The Compensation Committee consisted of Yves Huwler (Chairman) and Jay Moyes for the year ended December 31, 2016 and Yves Huwler (Chairman) and Hans Klingemann for the year ended December 31, 2015. This Compensation Discussion and Analysis addresses the material elements of compensation of our named executive officers. With respect to any particular fiscal year, "named executive officer" includes each person who served as Chief Executive Officer or Chief Financial Officer for any part of the applicable fiscal year, and our other most highly compensated executive officers for such year as determined by the rules of the SEC.
General Compensation Policy
The objectives of our executive compensation program are to:
- •
- Provide a competitive compensation package that will attract and retain talent and reward performance;
- •
- Support the achievement of desired company performance; and
- •
- Align the interests of executives with the long-term interests of stockholders through award opportunities that can result in ownership of common stock or the payment of cash if performance goals are met during a specified period.
Our executive compensation program is designed to promote the attraction, performance and retention of executives. The Compensation Committee reviews the allocation of compensation components at least once per fiscal year to help ensure alignment with strategic and operating goals, competitive market practices, and legislative and regulatory changes. The Compensation Committee does not apply a specific formula to determine the allocation between cash and non-cash forms of compensation. Certain compensation components, such as base salaries and benefits, are intended primarily to attract and retain qualified executives. Other compensation elements, such as annual and long-term incentive opportunities, are designed to motivate and reward performance. Annual incentives are intended to motivate named executive officers to achieve specific operating objectives for the fiscal year. Long-term incentives are intended to reward long-term Company performance and achievement of specific financial goals and to align named executive officers' interest with those of stockholders.
Elements of Executive Compensation
Our executive compensation program is comprised of: (i) base salary, which is set on an annual basis; (ii) annual incentive opportunities, which are based on overall company and individual performance; and (iii) long-term incentive opportunities typically in the form of stock option grants or cash incentives, with the objective of aligning the named executive officers' long-term interests with those of the stockholders and encouraging the achievement of superior results over an extended period.
The Compensation Committee performs annual reviews of executive compensation to confirm the competitiveness of the overall executive compensation packages compared with the Compensation
84
Committee members' general understanding of the compensation packages in the biotechnology industry. The Compensation Committee does not employ a third party compensation consultant, nor does it benchmark against the compensation practices of other similarly situated companies.
In considering compensation of executives, one of the factors the Compensation Committee takes into account is the anticipated tax treatment of various components of compensation, including the impact of and requirements of Section 162(m) of the Internal Revenue Code of 1986, as amended (the "Code"). Section 162(m) of the Code generally disallows a tax deduction for compensation in excess of $1 million per year to certain "covered employees," including our named executive officers. While the Compensation Committee believes that it is important for it to retain flexibility in designing compensation programs that are in the best interests of the Company and its stockholders, even if such approach results in certain amounts not being deductible under Section 162(m) of the Code, we do not expect Section 162(m) of the Code to have a material effect on us.
Say-on-Pay Vote
At our annual shareholders meeting in 2014, we provided our shareholders with the opportunity to cast an advisory vote on executive compensation. Approximately 99% of the votes cast on this "2014 say-on-pay vote" were voted in favor of the proposal. At our 2011 shareholders meeting, our shareholders voted in favor of the proposal to hold say-on-pay votes every third year and, since we did not hold a meeting in 2017, we plan to hold such vote at our next annual meeting of shareholders in 2018. In addition, we will hold a vote on the frequency of such votes at our next annual meeting of shareholders. In the future, we will continue to consider the outcome of our say-on-pay votes when making compensation decisions for the named executive officers.
Risk Considerations in Compensation Decisions
The Compensation Committee believes that pay for performance is an important part of its compensation objectives, but recognizes the risk that incentivizing specific measures of performance may pose to the Company as a whole if personnel were to act in ways designed primarily to maximize their compensation. Beginning in 2017, the Compensation Committee has engaged in more active discussions with management regarding our progress in the pursuit of our overall corporate objectives and the contributions made by members of our management team and our employees. Through this process, and given our relative size and number of employees, our Compensation Committee is able to develop an understanding of the issues of importance relative to its duties and responsibilities, including in matters of risk management associated with our compensation program. On an annual basis, typically in March, the Compensation Committee and the Chairman meet both with and without management present, and considers annual compensation issues, including salary adjustments, annual incentive opportunities and long-term incentive awards. One of the issues considered at that meeting is the mix of compensation to be paid or awarded to management and our employees, and the implication of that mix and specific compensation elements on risk. The Compensation Committee considers whether our compensation program and practices reward reasonable, without encouraging unreasonable, risk-taking and whether the incentive opportunities achieve the proper balance between the need to reward employees for our overall success and the need to protect the Company. While our current compensation program is in part performance-based, our Compensation Committee does not believe that it encourages excessive risk-taking that is reasonably likely to have a material adverse effect on us.
Management's Role in Determining Executive Compensation
Our Compensation Committee approves the compensation for all of the named executive officers. Our Chief Executive Officer and Chairman provide our Compensation Committee with recommendations regarding compensation for the other named executive officers. Our Compensation
85
Committee reviews such recommendations and approves annual compensation for named executive officers, consisting of base salary and any annual cash incentive (discussed below). Our Compensation Committee may request additional information and analysis and ultimately determines in its discretion, based on its own analysis and judgment and the recommendations of the Chief Executive Officer and Chairman, whether to approve any recommended changes in compensation.
Base Salary
Our Compensation Committee reviews base salary levels for our named executive officers on an annual basis. Base salaries are set competitively relative to the general understanding of the Compensation Committee of the compensation practices of other companies in the biotechnology industry and other comparable companies. In determining salaries, the Compensation Committee also takes into consideration individual experience and performance. In setting base salaries, the Compensation Committee also takes into account the level of competition among biotechnology companies to attract and retain personnel. The Compensation Committee does not, however, employ a third party compensation consultant, nor does it benchmark against the compensation practices of others. Our goal is to pay each named executive officer a base salary sufficient to remain competitive in the market.
The Compensation Committee or the Board approved the 2015 annual base salaries for each of the 2015 named executive officers in 2015, as set forth below (together with the 2014 base salary of each of our 2015 named executive officers):
Name
|
Position(s) During 2015 | 2015 Base Salary ($) |
2014 Base Salary ($) |
||||||
|---|---|---|---|---|---|---|---|---|---|
Lode Debrabandere, Ph.D. |
President and Chief Executive Officer | 396,000 | 360,000 | ||||||
Bobby Dwayne Montgomery(1) |
Chief Business Officer | 275,000 | 250,000 | ||||||
Philip R. Jacoby, Jr.(2) |
Former Chief Financial Officer, Treasurer and Secretary | 217,000 | 217,000 | ||||||
Gregory I. Law(3) |
Chief Financial Officer, Treasurer and Secretary | 220,000 | 220,000 | ||||||
Jonathan M. Hopper, M.B.Ch.B. |
Chief Medical Officer | 285,000 | 285,000 | ||||||
Alla Danilkovitch, Ph.D. |
Chief Scientific Officer | 210,000 | 200,000 | ||||||
- (1)
- Mr. Montgomery
was appointed as Chief Business Officer, effective as of September 17, 2015. Prior to his appointment to Chief Business Officer, he
served as our General Manager, Orthopedics and Sports Medicine.
- (2)
- Mr. Jacoby
resigned as Chief Financial Officer, Treasurer and Secretary, effective as of September 17, 2015.
- (3)
- Mr. Law was appointed as Chief Financial Officer, Treasurer and Secretary effective as of September 17, 2015. Prior his appointment, Mr. Law served as Vice President of Finance and Principal Accounting Officer.
86
The Compensation Committee or the Board approved the 2016 annual base salaries for each of the 2016 named executive officers in 2016, as set forth below (together with the 2015 base salary of each of our 2016 named executive officers):
Name
|
Position(s) During 2016 | 2016 Base Salary ($) |
2015 Base Salary ($) |
||||||
|---|---|---|---|---|---|---|---|---|---|
Lode Debrabandere, Ph.D.(1) |
Former President and Chief Executive Officer | 396,000 | 396,000 | ||||||
Bobby Dwayne Montgomery(2) |
Former President and Chief Executive Officer | 300,000 | 275,000 | ||||||
David A. Dresner(3) |
Interim President and Chief Executive Officer | 360,000 | — | ||||||
Gregory I. Law |
Chief Financial Officer, Treasurer and Secretary | 220,000 | 220,000 | ||||||
Jonathan M. Hopper, M.B.Ch.B.(4) |
Former Chief Medical Officer | 285,000 | 285,000 | ||||||
Alla Danilkovitch, Ph.D. |
Chief Scientific Officer | 220,000 | 210,000 | ||||||
Frank D. Czworka, Jr.(5) |
Former Chief Operating Officer | 290,000 | 290,000 | ||||||
R. Alberto Avendano, M.D.(6) |
Chief Medical Officer | 270,000 | — | ||||||
Philip R. Jacoby, Jr. |
Principal Accounting Officer | 217,000 | 217,000 | ||||||
- (1)
- Dr. Debrabandere
resigned as President and Chief Executive Officer and as a member of the Board, effective as of February 3, 2016.
- (2)
- Mr. Montgomery
was appointed Interim President and Chief Executive Officer, effective as of February 3, 2016. Mr. Montgomery was appointed
President and Chief Executive Officer and to the Board, effective as of March 3, 2016. He resigned from both positions effective as of June 9, 2016.
- (3)
- Mr. Dresner
was appointed as Interim President and Chief Executive Officer, effective as of June 9, 2016.
- (4)
- Dr. Hopper
resigned as Chief Medical Officer, effective as of April 12, 2016.
- (5)
- Mr. Czworka
was appointed as Chief Operating Officer, effective as of February 3, 2016 and the position was eliminated effective as of March 6,
2016.
- (6)
- Dr. Avendano was appointed as Chief Medical Officer, effective as of October 3, 2016.
87
The Compensation Committee or the Board approved the 2017 annual base salaries for each of our 2017 named executive officers in 2017, as set forth below (together with the 2016 base salary of each of our 2017 named executive officers):
Name
|
Position(s) During 2017 | 2017 Base Salary ($) |
2016 Base Salary ($) |
||||||
|---|---|---|---|---|---|---|---|---|---|
Jason Keefer(1) |
Interim President and Chief Executive Officer | 210,000 | 210,000 | ||||||
Linda Palczuk(2) |
Former President and Chief Executive Officer | 450,000 | — | ||||||
Gregory I. Law(3) |
Former Chief Financial Officer, Treasurer and Secretary | 220,000 | 220,000 | ||||||
David A. Dresner(4) |
Former Interim President and Chief Executive Officer | 360,000 | 360,000 | ||||||
Linda Chang(5) |
Chief Financial Officer | 320,000 | — | ||||||
Alla Danilkovitch, Ph.D. |
Chief Scientific Officer | 250,000 | 220,000 | ||||||
R. Alberto Avendano, M.D.(6) |
Former Chief Medical Officer | 270,000 | 270,000 | ||||||
- (1)
- Mr. Keefer
served as Interim President and Chief Executive Officer from June 21, 2017 to July 10, 2017 and was reappointed to the same position,
effective as of February 9, 2018. Prior to each of his appointments to Interim President and Chief Executive Officer, Mr. Keefer served as the Company's Vice President of Marketing.
- (2)
- Ms. Palczuk
was appointed as President and Chief Executive Officer, effective as of July 10, 2017 and resigned, effective as of February 9,
2018.
- (3)
- Mr. Law
resigned as Chief Financial Officer, Treasurer and Secretary effective as of May 31, 2017.
- (4)
- Mr. Dresner
served as Interim President and Chief Executive Officer from June 10, 2016 until June 21, 2017.
- (5)
- Ms. Chang
was appointed as Chief Financial Officer, effective as of May 17, 2017.
- (6)
- Dr. Avendano resigned as Chief Medical Officer, effective as of January 27, 2017.
Although we do not benchmark against the compensation practices of other companies, based on our general understanding of base salaries of comparable companies in the biotechnology industry, we believe the 2017, 2016 and 2015 base salaries for our named executive officers are and were consistent with the range of salaries received by similarly situated executives at other companies in the industry.
Annual Incentive Bonuses
The Company's overriding objective, and the objective of our named executive officers, during calendar years 2017, 2016 and 2015 was to expand our commercialization efforts through the addition of new products and the building of internal and external sales and distribution capabilities. We also focused on continuing our product development programs based on novel technologies, such as Prestige Lyotechnology. Although we did not establish individual performance metrics for the years ending December 31, 2017, December 31, 2016 and December 31, 2015, we reviewed the performance of our named executive officers following the close of each fiscal year and evaluated the contributions of each executive to meeting the Company's objectives for the preceding fiscal year. Based on these evaluations, and subject to our Compensation Committee's discretion, we determined the annual bonuses for each named executive officer.
For fiscal year 2015, Bobby Dwayne Montgomery, Interim President and Chief Executive Officer, was awarded an annual bonus of $25,000, representing 100% of his targeted bonus, and Alla Danilkovitch, Chief Scientific Officer, was awarded an annual bonus of $50,000, representing 100% of her targeted bonus. For fiscal year 2016, Dr. Danilkovitch was awarded an annual bonus of $30,000. No
88
other named executive officer was awarded a bonus for that year. Our decision to award the above bonuses was based on the performance of each individual and for purposes of employee retention.
Exercise of Discretion in Executive Compensation Decisions
Subject to the terms of any binding agreements that provide otherwise, the Compensation Committee has complete discretion to withhold payment pursuant to any of our incentive compensation plans irrespective of whether we or our named executive officers have successfully met any goals set under these plans. The Compensation Committee also typically has the authority to grant payments under any of the plans despite the non-attainment by us or our named executive officers of any pre-established goals. For 2016 and 2015, the Compensation Committee did not exercise such discretion in the payment of awards to our named executive officers. For 2017, the Compensation Committee will meet in March 2018 to determine whether to exercise its discretion.
Long-term Incentive Compensation
Long-term incentive compensation, including stock options and cash incentives, allows the named executive officers to share in any appreciation in the value of our common stock. The Compensation Committee believes that long-term incentive compensation aligns named executive officers' interests with those of the stockholders. The amounts of the awards are designed to reward past performance and create incentives to meet long-term objectives. Awards are made at a level calculated to be competitive within the biotechnology industry, as well as a broader group of companies of comparable size and complexity. In determining the amount of any stock option grant, the Compensation Committee takes into account the number of shares held by the executive prior to the grant. Below outlines the stock options we granted to our named executive officers during 2017, 2016 and 2015:
- •
- We granted stock options to Ms. Palczuk to purchase 25,000 shares at the exercise price of $6.67 upon her appointment as President and
Chief Executive Officer in 2017. The options vest in equal installments on the first, second, third and fourth anniversary of the award date. On the date of her departure from the Company,
February 9, 2018, no options were vested and the grant was forfeited.
- •
- We granted stock options to Dr. Danilkovitch to purchase 50,000 shares at the exercise price of $6.80 in 2017 and 25,000 shares at the
exercise price of $18.40 in 2015. The options vest in equal installments on the first, second, third and fourth anniversary of the award date.
- •
- We granted stock options to Mr. Keefer to purchase 16,000 shares at the exercise price of $6.80 in 2017. The options vest in equal
installments on the first, second, third and fourth anniversary of the award date. In 2015, we granted stock options to Mr. Keefer to purchase 1,000 shares at the exercise price of $19.20. The
vested and unvested options from this grant were cancelled in 2017.
- •
- We granted Mr. Dresner, our former Interim Chief Executive Officer, stock options to purchase 5,000 shares each month from June 2016 to
October 2016, for a total of 25,000 shares, at the exercise prices of $5.12, $5.03, $5.48, $5.30 and $4.75, respectively. Each of the options vested on the applicable award date.
- •
- We granted stock options to Mr. Montgomery to purchase 10,000 shares at the exercise price of $7.39 in 2016 and 12,500 shares at the exercise price of $18.40 in 2015. The options vest in equal installments on the first, second, third and fourth anniversary of the award date. On the date of his resignation for medical reasons, June 9, 2016, 19,375 options were unvested and forfeited. The remaining balance of 3,125 vested options were forfeited September 5, 2017, in accordance with the terms of the Company's Amended and Restated 2006 Omnibus Plan, which provides that an employee who departs on account of disability has twelve months from the departure date to exercise vested options.
89
- •
- We granted stock options to Dr. Debrabandere to purchase 75,000 shares at the exercise price of $18.40 in 2015. The options vest in
equal installments on the first, second, third and fourth anniversary of the award date. On the date of his departure from the Company, February 16, 2016, no options were vested and the grant
was forfeited.
- •
- We granted stock options to Dr. Avendano to purchase 20,000 shares at the exercise price of $4.96 in 2016 upon his appointment as Chief
Medical Officer. The options vest in equal installments on the first, second, third and fourth anniversary of the award date. On the date of his departure from the Company, January 27, 2017, no
options were vested and the grant was forfeited.
- •
- We granted stock options to Mr. Czworka to purchase 25,000 shares at the exercise price of $18.40 in 2015. The options vest in equal installments on the first, second, third and fourth anniversary of the award date. On the date of his departure from the Company, March 6, 2016, 18,749 options were unvested and forfeited. The remaining balance of 6,251 vested options were forfeited 90 days after his departure.
These option awards were intended to align the interests of the named executive officers with those of the Company's stockholders with respect to long-term increases in the price of the Company's stock, and are consistent with the goals of our long-term incentive compensation program as a whole.
While stock option awards may remain an important component of our long-term incentive plan for our named executive officers, we expect that the award of performance-based cash awards will play a larger role in our long-term incentive strategy in the future.
Executive Benefits and Perquisites
Our healthcare, insurance, 401(k) plans, and other welfare and employee-benefit programs are the same for all eligible employees, including the named executive officers. In certain situations, we have provided named executive officers with expense reimbursements relating to relocation and housing allowances. The value of any perquisites provided to named executive officers are presented in the "All Other Compensation" column (and described in the related footnotes) of the Summary Compensation Table.
Retirement/Post-Employment Benefits
We do not provide any retirement programs, pension benefits or deferred compensation plans to our named executive officers other than our 401(k) plan, which is available to all employees. Prior to April 2015, we did not make any matching contributions to the 401(k) plan. In April 2015, we began matching 50% of employee contributions up to a limit of 4% of eligible compensation. This employer match is discretionary, subject to the approval of the Board on an annual basis. The value of any matching contributions provided to named executive officers are presented in the "All Other Compensation" column (and described in the related footnotes) of the Summary Compensation Table.
Compensation Committee Interlocks and Insider Participation.
No member of the compensation committee who served on the compensation committee in 2015, 2016 or 2017 was an officer or employee of the Company during 2015, 2016 or 2017, was formerly an officer of the Company, or had any relationships requiring disclosure by the Company under the SEC's rules regarding certain relationships and related party transactions. None of our named executive officers served as a member of the compensation committee (or other board committee performing similar functions or, in the absence of such committee, the entire board) of another corporation where one of the named executive officers of the other corporation served on our compensation committee or as one of our directors. None of our named executive officers served as a director of another
90
corporation, where one of the named executive officers of the other corporation served on our compensation committee.
Compensation Committee Report
The Compensation Committee has reviewed and discussed the foregoing Compensation Discussion and Analysis required by Item 402(b) of Regulation S-K with management and, based on such review and discussions, the Compensation Committee recommended to our Board that the Compensation Discussion and Analysis be included in this Annual Report on Form 10-K.
| Compensation Committee Members: | ||
Uwe Sommer (Chairman) Thomas J. Knapp |
This Compensation Committee Report shall not be deemed incorporated by reference by any general statement incorporating by reference this Form 10-K into any filing under the Securities Act of 1933 or under the Securities Exchange Act of 1934, except to the extent that the Company specifically incorporates this information by reference, and shall not otherwise be deemed filed under the Securities Act of 1933 and the Securities Exchange Act of 1934, and shall not be deemed soliciting material.
91
Summary Compensation Table
The following table shows the total compensation paid or accrued during fiscal 2017, 2016 and 2015 to our named executive officers during those respective periods.
Name and Principal Position
|
Year | Salary ($) |
Bonus ($)(1) |
Option Awards ($)(2) |
All Other Compensation ($)(3) |
Total ($) |
||||||||||||
|---|---|---|---|---|---|---|---|---|---|---|---|---|---|---|---|---|---|---|
Current Executive Officers |
||||||||||||||||||
Jason Keefer(4) |
2017 | 210,735 | — | 71,197 | 132,647 | 414,579 | ||||||||||||
Interim President and CEO |
2016 | — | — | — | — | — | ||||||||||||
|
2015 | — | — | — | — | — | ||||||||||||
Linda Chang(5) |
2017 |
203,703 |
— |
— |
3,704 |
207,407 |
||||||||||||
Chief Financial Officer |
2016 | — | — | — | — | — | ||||||||||||
|
2015 | — | — | — | — | — | ||||||||||||
Alla Danilkovitch, Ph.D. |
2017 |
243,349 |
— |
221,689 |
4,855 |
469,893 |
||||||||||||
Chief Scientific Officer |
2016 | 217,837 | 30,000 | — | 4,359 | 252,196 | ||||||||||||
|
2015 | 211,196 | 50,000 | 292,834 | 3,235 | 557,265 | ||||||||||||
Former Executive Officers |
|
|||||||||||||||||
Linda Palczuk(6) |
2017 | 216,811 | — | 109,317 | 40,712 | 366,840 | ||||||||||||
Former President and CEO |
2016 | — | — | — | — | — | ||||||||||||
|
2015 | — | — | — | — | — | ||||||||||||
David A. Dresner(7) |
2017 |
173,115 |
30,000 |
— |
834 |
203,949 |
||||||||||||
Former Interim President and CEO |
2016 | 196,084 | — | 27,920 | — | 224,004 | ||||||||||||
|
2015 | — | — | — | — | — | ||||||||||||
Gregory I. Law(8) |
2017 |
109,154 |
— |
— |
52,197 |
161,351 |
||||||||||||
Former Chief Financial Officer |
2016 | 220,846 | — | — | 4,404 | 225,250 | ||||||||||||
|
2015 | 220,846 | — | — | 3,385 | 224,231 | ||||||||||||
R. Alberto Avendano, M.D.(9) |
2017 |
27,241 |
— |
— |
3,592 |
30,833 |
||||||||||||
Former Chief Medical Officer |
2016 | 67,500 | — | 61,886 | 8,302 | 137,688 | ||||||||||||
|
2015 | — | — | — | — | — | ||||||||||||
Lode Debrabandere, Ph.D.(10) |
2017 |
— |
— |
— |
— |
— |
||||||||||||
Former President and CEO |
2016 | 80,432 | — | — | 2,472 | 82,904 | ||||||||||||
|
2015 | 390,323 | — | 878,500 | 31,063 | 1,299,886 | ||||||||||||
Bobby Dwayne Montgomery(11) |
2017 |
— |
— |
— |
— |
— |
||||||||||||
Former President and CEO |
2016 | 206,292 | — | 46,653 | 5,330 | 258,275 | ||||||||||||
|
2015 | 271,047 | 25,000 | 146,417 | 4,240 | 446,704 | ||||||||||||
Frank D. Czworka, Jr.(12) |
2017 |
— |
— |
— |
— |
— |
||||||||||||
Former Chief Operating Officer |
2016 | 68,302 | — | — | 50,128 | 118,430 | ||||||||||||
|
2015 | 285,115 | — | 292,833 | 4,881 | 592,829 | ||||||||||||
Jonathan M. Hopper, M.B.Ch.B.(13) |
2017 |
— |
— |
— |
— |
— |
||||||||||||
Former Chief Medical Officer |
2016 | 108,660 | — | — | 1,973 | 110,633 | ||||||||||||
|
2015 | 286,096 | — | — | 4,385 | 290,481 | ||||||||||||
Philip R. Jacoby, Jr.(14) |
2017 |
— |
— |
— |
— |
— |
||||||||||||
Former Chief Financial Officer |
2016 | 24,719 | — | — | 294 | 25,013 | ||||||||||||
|
2015 | 217,835 | — | — | 6,209 | 224,044 | ||||||||||||
- (1)
- Unless otherwise noted, represents bonus payments that were paid in 2017 on account of named executive officer performance in 2016 and bonus payments paid in 2016 on account of named executive officer performance in 2015, as applicable.
92
- (2)
- These
amounts reflect the non-cash aggregate grant date fair value of these awards computed in accordance with FASB ASC Topic 718 "Stock Compensation," which
includes the effect of estimated forfeitures. The assumptions and methodologies used to calculate the amounts reported are discussed in Note 8 (Share-Based Compensation and Employee Benefit
Plans) to the Company's financial statements included in Part II, Item 8 of this Form 10-K. Under GAAP, compensation expense with respect to stock awards and option awards granted
to our employees is generally recognized over the vesting periods applicable to the awards.
- (3)
- Unless
otherwise noted, all other compensation represents matching contributions under our 401(k) plan.
- (4)
- Mr. Keefer
served as Interim President and Chief Executive Officer from June 21, 2017 to July 10, 2017 and was reappointed for the same
positions, effective as of February 9, 2018. All other compensation represents commissions earned in 2017 and matching contributions under our 401(k) plan. As Mr. Keefer was not a named
executive officer prior to 2017, his summary compensation information for 2015 and 2016 is omitted.
- (5)
- Ms. Chang
was appointed as Chief Financial Officer, effective as of May 19, 2017.
- (6)
- Ms. Palczuk's
all other compensation is comprised of a $25,000 lump sum payment made under the Separation and Release Agreement, between the Company and
Ms. Palczuk, dated February 9, 2018, matching contributions under our 401(k) plan, and reimbursement for rent she paid for an apartment. Ms. Palczuk was appointed as President and
Chief Executive Officer, effective as of July 10, 2017 and resigned from the position, effective as of February 9, 2018.
- (7)
- Mr. Dresner's
bonus amount represents amounts paid to him under the terms of the June 23, 2016 letter agreement between the Company and
Mr. Dresner. Mr. Dresner served as Interim President and Chief Executive Officer from June 10, 2016 until June 21, 2017.
- (8)
- Mr. Law's
all other compensation represents severance benefits paid to him in 2017 and matching contributions under our 401(k) plan, and insurance benefits.
Mr. Law was appointed as Chief Financial Officer, effective as of September 17, 2015, and resigned from the position, effective as of May 31, 2017.
- (9)
- Dr. Avendano's
all other compensation represents matching contributions under our 401(k) plan and housing allowance. Dr. Avendano was appointed as
Chief Medical Officer, effective as of October 3, 2016 and resigned from the position, effective as of January 27, 2017.
- (10)
- Dr. Debrabandere's
all other compensation represents matching contributions under our 401(k) plan, housing allowance, and insurance benefits.
Dr. Debrabandere resigned as President and Chief Executive Officer, effective as of February 3, 2016.
- (11)
- Mr. Montgomery's
all other compensation represents matching contributions under our 401(k) plan, and insurance benefits. Mr. Montgomery was appointed
as President and Chief Executive Officer and to the Board, effective as of March 3, 2016. He resigned from both positions effective as of June 9, 2016. Prior his appointment,
Mr. Montgomery served as the Company's Interim President and Chief Executive Officer, effective as of February 3, 2016. Prior to February 2016, he served as the Company's General
Manager, Orthopedics and Sports Medicine.
- (12)
- Mr. Czworka's
all other compensation represents matching contributions under our 401(k) plan, insurance benefits and severance benefits earned and paid in
2016. Mr. Czworka was appointed as Chief Operating Officer, effective as of February 3, 2016, and the position was eliminated effective as of March 6, 2016. Prior to his
appointment to Chief Operating Officer, Mr. Czworka served as the Company's Vice President and General Manager of Wound Care.
- (13)
- Mr. Hopper
resigned as Chief Medical Officer on April 12, 2016.
- (14)
- Mr. Jacoby's all other compensation represents matching contributions under our 401(k) plan and insurance benefits. Mr. Jacoby resigned as Chief Financial Officer, effective as of September 17, 2015. Following his resignation, he served as the Company's Principal Accounting Officer through the end of his employment, effective as of April 5, 2016.
93
Grants of Plan-Based Awards
The following table provides information on equity awards granted in 2015 to our 2015 named executive officers:
Name
|
Grant Date | All Other Option Awards: Number of Securities Underlying Options (#)(1) |
Exercise or Base Price of Option Awards ($/Sh)(2) |
Grant Date Fair Value of Option Awards ($) |
||||||||
|---|---|---|---|---|---|---|---|---|---|---|---|---|
Alla Danilkovitch, Ph.D. |
3/6/2015 | 25,000 | 18.40 | 292,834 | ||||||||
Bobby Dwayne Montgomery |
3/6/2015 | 12,500 | 18.40 | 146,417 | ||||||||
Lode Debrabandere, Ph.D. |
3/6/2015 | 75,000 | 18.40 | 878,500 | ||||||||
Frank D. Czworka, Jr. |
3/6/2015 | 25,000 | 18.40 | 292,833 | ||||||||
- (1)
- Represents
stock options awarded by the Compensation Committee, which vest in equal installments on the first, second, third and fourth anniversary of the award
date, assuming the named executive officer is still employed by the Company on that date.
- (2)
- The exercise price of each option was the closing price of our stock on the grant date.
The following table provides information on equity awards granted in 2016 to our 2016 named executive officers:
Name
|
Grant Date | All Other Option Awards: Number of Securities Underlying Options (#) |
Exercise or Base Price of Option Awards ($/Sh)(2) |
Closing Price of Securities Underlying Options on Grant Date ($/Sh) |
Grant Date Fair Value of Option Awards ($) |
||||||||||
|---|---|---|---|---|---|---|---|---|---|---|---|---|---|---|---|
David A. Dresner(1) |
6/30/2016 | 5,000 | 5.12 | 5.09 | 6,464 | ||||||||||
|
7/11/2016 | 5,000 | 5.03 | 5.05 | 6,357 | ||||||||||
|
8/10/2016 | 5,000 | 5.48 | 5.07 | 5,786 | ||||||||||
|
9/12/2016 | 5,000 | 5.30 | 5.27 | 5,142 | ||||||||||
|
10/10/2016 | 5,000 | 4.75 | 4.78 | 4,170 | ||||||||||
Bobby Dwayne Montgomery*(3) |
3/4/2016 | 10,000 | 7.39 | 7.28 | 46,653 | ||||||||||
R. Alberto Avendano, M.D.(3) |
10/3/2016 | 20,000 | 4.96 | 4.92 | 61,886 | ||||||||||
- (1)
- Represents
stock options awarded under the terms of the June 23, 2016 letter agreement between the Company and Mr. Dresner, each of which vested on the
applicable award date.
- (2)
- The
exercise price of each option was the closing price of our stock for the trading day prior to the grant date.
- (3)
- Represents
stock options awarded by the Board or Compensation Committee, which vest in equal installments on the first, second, third and fourth anniversary of the
award date, assuming the named executive officer is still employed by the Company on that date.
- *
- Indicates individuals who were no longer executive officers as of December 31, 2016.
94
The following table provides information on equity awards granted in 2017 to our 2017 named executive officers:
Name
|
Grant Date | All Other Option Awards: Number of Securities Underlying Options (#)(1) |
Exercise or Base Price of Option Awards ($/Sh) |
Grant Date Fair Value of Stock and Option Awards ($) |
||||||||
|---|---|---|---|---|---|---|---|---|---|---|---|---|
Jason Keefer |
7/19/2017 | 16,000 | 6.80 | (2) | 71,197 | |||||||
Alla Danilkovitch, Ph.D. |
7/19/2017 | 50,000 | 6.80 | (2) | 221,689 | |||||||
Linda Palczuk |
7/10/2017 | 25,000 | 6.67 | (3) | 109,317 | |||||||
- (1)
- Represents
stock options awarded by the Board or Compensation Committee, which vest in equal installments on the first, second, third and fourth anniversary of the
award date, assuming the named executive officer is still employed by the Company on that date.
- (2)
- The
exercise price of each option was the closing price of our stock on the grant date.
- (3)
- The exercise price of each option was the closing price of our stock for the trading day prior to the grant date. The closing price of our stock on the grant date was $6.60.
Equity Compensation Plan Information
Under our Amended and Restated 2006 Omnibus Plan, a total of 3,000,000 shares of common stock were reserved for issuance pursuant to the plan as of December 31, 2015, December 31, 2016 and December 31, 2017. Our stockholders have approved our Amended and Restated 2006 Omnibus Plan. Currently, all outstanding awards under the Amended and Restated 2006 Omnibus Plan consist of qualified and non-qualified stock options.
The following table provides information about our equity compensation plans as of December 31, 2015:
Plan Category
|
Number of Securities to be Issued Upon Exercise of Outstanding Options, Warrants and Rights |
Weighted-Average Exercise Price of Outstanding Options, Warrants and Rights ($/Sh) |
Number of Securities Remaining Available for Future Issuance Under Equity Compensation Plans |
|||||||
|---|---|---|---|---|---|---|---|---|---|---|
Equity compensation plans approved by security holders |
1,514,679 | 13.20 | 595,031 | |||||||
Equity compensation plans not approved by security holders |
— | — | — | |||||||
The following table provides information about our equity compensation plans as of December 31, 2016:
Plan Category
|
Number of Securities to be Issued Upon Exercise of Outstanding Options, Warrants and Rights |
Weighted-Average Exercise Price of Outstanding Options, Warrants and Rights ($/Sh) |
Number of Securities Remaining Available for Future Issuance Under Equity Compensation Plans |
|||||||
|---|---|---|---|---|---|---|---|---|---|---|
Equity compensation plans approved by security holders |
840,054 | 12.33 | 1,239,281 | |||||||
Equity compensation plans not approved by security holders |
— | — | — | |||||||
95
The following table provides information about our equity compensation plans as of December 31, 2017:
Plan Category
|
Number of Securities to be Issued Upon Exercise of Outstanding Options, Warrants and Rights |
Weighted-Average Exercise Price of Outstanding Options, Warrants and Rights ($/Sh) |
Number of Securities Remaining Available for Future Issuance Under Equity Compensation Plans |
|||||||
|---|---|---|---|---|---|---|---|---|---|---|
Equity compensation plans approved by security holders |
623,126 | 11.63 | 1,431,209 | |||||||
Equity compensation plans not approved by security holders |
— | — | — | |||||||
96
Outstanding Equity Awards at Fiscal Year-End
The following table provides information on the outstanding equity awards held by our 2015 named executive officers as of December 31, 2015:
| |
Option Awards | ||||||||||||
|---|---|---|---|---|---|---|---|---|---|---|---|---|---|
| |
Number of Securities Underlying Unexercised Options (#) |
|
|
||||||||||
| |
Option Exercise Price ($) |
Option Expiration Date(1) |
|||||||||||
Name
|
Exercisable | Unexercisable | |||||||||||
Alla Danilkovitch, Ph.D. |
3,000 | — | 12.50 | 7/26/2017 | |||||||||
|
3,000 | — | 17.10 | 10/2/2018 | |||||||||
|
8,000 | — | 7.74 | 3/12/2020 | |||||||||
|
5,000 | — | 6.46 | 5/27/2020 | |||||||||
|
9,000 | — | 7.13 | 2/14/2021 | |||||||||
|
3,500 | 2,500 | 5.08 | 3/23/2022 | |||||||||
|
5,000 | 5,000 | 7.73 | 2/12/2023 | |||||||||
|
5,000 | 15,000 | 14.00 | 5/6/2024 | |||||||||
|
— | 25,000 | 18.40 | 3/6/2025 | |||||||||
Bobby Dwayne Montgomery |
6,250 | 18,750 | 12.39 | 9/5/2017 | |||||||||
|
— | 12,500 | 18.40 | 9/5/2017 | |||||||||
Lode Debrabandere, Ph.D.(2) |
15,000 | — | 23.62 | 2/5/2017 | |||||||||
|
11,250 | — | 6.46 | 12/31/2017 | |||||||||
|
25,000 | — | 7.13 | 12/31/2017 | |||||||||
|
15,000 | — | 12.01 | 2/4/2018 | |||||||||
|
35,000 | — | 18.60 | 2/23/2019 | |||||||||
|
25,000 | — | 7.74 | 3/12/2020 | |||||||||
|
3,750 | — | 6.46 | 5/27/2020 | |||||||||
|
18,750 | 6,250 | 5.08 | 3/23/2022 | |||||||||
|
15,000 | 15,000 | 7.73 | 2/12/2023 | |||||||||
|
37,500 | 112,500 | 14.93 | 2/6/2024 | |||||||||
|
— | 75,000 | 18.40 | 3/6/2025 | |||||||||
Gregory I. Law |
5,000 | 15,000 | 13.05 | 8/29/2017 | |||||||||
Philip R. Jacoby, Jr.(3) |
3,000 | — | 23.62 | 1/21/2017 | |||||||||
|
3,000 | — | 12.50 | 1/21/2017 | |||||||||
|
10,000 | — | 17.10 | 1/21/2017 | |||||||||
|
10,000 | — | 18.60 | 1/21/2017 | |||||||||
|
5,516 | — | 7.13 | 1/21/2017 | |||||||||
|
7,665 | 5,000 | 5.08 | 1/21/2017 | |||||||||
|
5,000 | 10,000 | 7.73 | 1/21/2017 | |||||||||
Jonathan M. Hopper, M.B.Ch.B.(4) |
6,250 | 18,750 | 13.12 | 7/11/2016 | |||||||||
Frank D. Czworka, Jr.(5) |
10,000 | 10,000 | 7.73 | 6/4/2016 | |||||||||
|
7,500 | 22,500 | 15.58 | 6/4/2016 | |||||||||
|
— | 25,000 | 18.40 | 6/4/2016 | |||||||||
|
17,500 | — | 5.08 | 8/22/2021 | |||||||||
|
7,500 | 3,750 | 5.08 | 3/23/2022 | |||||||||
- (1)
- Options
expire on the tenth anniversary of the award date and vest in equal installments on the first, second, third and fourth anniversary of the award date. Upon
termination of employment, vested options remain exercisable for up to 90-days if the former employee left in good standing.
- (2)
- On the date of Dr. Debrabandere's departure from the Company, February 16, 2016, 163,749 options were unvested and forfeited. A total of 210,001 vested options were forfeited May 16,
97
2016, and the remaining balance of 36,250 vested options were forfeited December 31, 2017, in accordance with the terms of the February 22, 2016 Separation and Release Agreement.
- (3)
- Mr. Jacoby's
balance of 15,000 unvested options were forfeited January 21, 2016. Since Mr. Jacoby departed the Company due to medical reasons, the
remaining balance of 44,181 vested options were forfeited January 21, 2017, in accordance with the terms of the Company's Amended and Restated 2006 Omnibus Plan, which provides that an employee
who departs on account of disability has twelve months from the departure date to exercise vested options.
- (4)
- On
the date of Mr. Hopper's departure from the Company, April 12, 2016, 18,750 unvested options were forfeited. The remaining balance of 6,250 vested
options were forfeited July 11, 2016.
- (5)
- On the date of Mr. Czworka's departure from the Company, March 6, 2016, 49,999 unvested options were forfeited. The remaining balance of 28,751 vested options were forfeited June 4, 2016.
The following table provides information on the outstanding equity awards held by our 2016 named executive officers as of December 31, 2016:
| |
Option Awards | ||||||||||||
|---|---|---|---|---|---|---|---|---|---|---|---|---|---|
| |
Number of Securities Underlying Unexercised Options (#) |
|
|
||||||||||
| |
Option Exercise Price ($) |
Option Expiration Date(1) |
|||||||||||
Name
|
Exercisable | Unexercisable | |||||||||||
Alla Danilkovitch, Ph.D. |
3,000 | — | 12.50 | 7/26/2017 | |||||||||
|
3,000 | — | 17.10 | 10/2/2018 | |||||||||
|
8,000 | — | 7.74 | 3/12/2020 | |||||||||
|
5,000 | — | 6.46 | 5/27/2020 | |||||||||
|
9,000 | — | 7.13 | 2/14/2021 | |||||||||
|
6,000 | — | 5.08 | 3/23/2022 | |||||||||
|
7,500 | 2,500 | 7.73 | 2/12/2023 | |||||||||
|
10,000 | 10,000 | 14.00 | 5/6/2024 | |||||||||
|
6,250 | 18,750 | 18.40 | 3/6/2025 | |||||||||
David A. Dresner(2) |
5,000 | — | 4.75 | 12/31/2017 | |||||||||
|
5,000 | — | 5.03 | 12/31/2017 | |||||||||
|
5,000 | — | 5.12 | 12/31/2017 | |||||||||
|
5,000 | — | 5.30 | 12/31/2017 | |||||||||
|
5,000 | — | 5.48 | 12/31/2017 | |||||||||
Bobby Dwayne Montgomery(3) |
12,500 | — | 12.39 | 9/5/2017 | |||||||||
|
3,125 | — | 18.40 | 9/5/2017 | |||||||||
Lode Debrabandere, Ph.D.(4) |
11,250 | — | 6.46 | 12/31/2017 | |||||||||
|
25,000 | — | 7.13 | 12/31/2017 | |||||||||
Gregory I. Law(5) |
10,000 | 10,000 | 13.05 | 8/29/2017 | |||||||||
R. Alberto Avendano, M.D.(6) |
— | 20,000 | 4.96 | 4/27/2017 | |||||||||
- (1)
- Other
than the options awarded to Mr. Dresner, options expire on the tenth anniversary of the award date and vest in equal installments on the first, second,
third and fourth anniversary of the award date. Upon termination of employment, vested options remain exercisable for up to 90 days if the former employee departed in good standing.
- (2)
- Under the terms of the June 23, 2016 letter agreement between the Company and Mr. Dresner, Mr. Dresner's options vested on the applicable award date and expired December 31, 2017. Upon Mr. Dresner's resignation, his vested options were exercisable for 90 days following said resignation.
98
- (3)
- Mr. Montgomery's
vested stock options were forfeited September 5, 2017, in accordance with the terms of the Company's Amended and Restated 2006 Omnibus
Plan, which provides that an employee who departs on account of disability has twelve months from the departure date to exercise vested options.
- (4)
- On
the date of Dr. Debrabandere's departure from the Company, February 16, 2016, 163,749 options were unvested and forfeited. A total of 210,001 vested
options were forfeited May 16, 2016, and the remaining balance of 36,250 vested options were forfeited December 31, 2017, in accordance with the terms of the February 22, 2016
Separation and Release Agreement with the Company.
- (5)
- On
the date of Mr. Law's departure from the Company, May 31, 2017, 10,000 options were unvested and forfeited. The remaining balance of 10,000 vested
options were forfeited August 29, 2017.
- (6)
- On the date of Dr. Avendano's departure from the Company, January 27, 2017, 20,000 unvested options were forfeited.
The following table provides information on the outstanding equity awards held by our 2017 named executive officers as of December 31, 2017:
| |
Option Awards | ||||||||||||
|---|---|---|---|---|---|---|---|---|---|---|---|---|---|
| |
Number of Securities Underlying Unexercised Options (#) |
|
|
||||||||||
| |
Option Exercise Price ($) |
Option Expiration Date(1) |
|||||||||||
Name
|
Exercisable | Unexercisable | |||||||||||
Jason Keefer |
— | 16,000 | 6.80 | 7/19/2027 | |||||||||
Alla Danilkovitch, Ph.D. |
3,000 | — | 17.10 | 10/2/2018 | |||||||||
|
8,000 | — | 7.74 | 3/12/2020 | |||||||||
|
5,000 | — | 6.46 | 5/27/2020 | |||||||||
|
9,000 | — | 7.13 | 2/14/2021 | |||||||||
|
6,000 | — | 5.08 | 3/23/2022 | |||||||||
|
10,000 | — | 7.73 | 2/12/2023 | |||||||||
|
15,000 | 5,000 | 14.00 | 5/6/2024 | |||||||||
|
12,500 | 12,500 | 18.40 | 3/6/2025 | |||||||||
|
— | 50,000 | 6.80 | 7/19/2027 | |||||||||
Linda Palczuk(2) |
— | 25,000 | 6.67 | 7/10/2027 | |||||||||
- (1)
- Options
expire on the tenth anniversary of the award date and vest in equal installments on the first, second, third and fourth anniversary of the award date. Upon
termination of employment, vested options remain exercisable for up to 90-days if the former employee left in good standing.
- (2)
- On the date of Ms. Palczuk's departure from the Company, February 9, 2018, no options were vested and the grant was forfeited.
Option Exercises and Stock Vested
The following table provides information on the options exercised by the 2015 named executive officers during the fiscal year ending December 31, 2015:
| |
Option Awards | ||||||
|---|---|---|---|---|---|---|---|
Name
|
Number of Shares Acquired on Exercise (#)) |
Value Realized on Exercise ($) |
|||||
Alla Danilkovitch, Ph.D. |
6,575 | 111,100 | |||||
Lode Debrabandere, Ph.D. |
37,500 | 143,250 | |||||
Philip R. Jacoby, Jr. |
20,000 | 223,966 | |||||
99
The following table provides information on the options exercised by the 2016 named executive officers during the fiscal year ending December 31, 2016:
| |
Option Awards | ||||||
|---|---|---|---|---|---|---|---|
Name
|
Number of Shares Acquired on Exercise (#)) |
Value Realized on Exercise ($) |
|||||
Frank D. Czworka, Jr. |
4,947 | 35,500 | |||||
The following table provides information on the options exercised by the 2017 named executive officers during the fiscal year ending December 31, 2017:
| |
Option Awards | ||||||
|---|---|---|---|---|---|---|---|
Name
|
Number of Shares Acquired on Exercise (#) |
Value Realized on Exercise ($) |
|||||
David A. Dresner |
25,000 | 3,850 | |||||
Employment Contracts, Termination of Employment and Change in Control Arrangements
Except in the case of Dr. Debrabandere, Ms. Palczuk and Ms. Chang, none of our employees employed by us during fiscal 2017, 2016 or 2015 were employed for a specified term, and each employee's employment with us was subject to termination at any time by either party for any reason, with or without cause.
Mr. Debrabandere
We had previously entered into an employment agreement with Dr. Debrabandere. Dr. Debrabandere resigned as President and Chief Executive Officer on February 3, 2016. On February 22, 2016, we entered into a Separation and Release Agreement with Dr. Debrabandere, that provides for, among other terms, (i) a separation date of February 16, 2016 (the "Separation Date"), (ii) a consulting period from the Separation Date through May 31, 2016 for Dr. Debrabandere to assist with the smooth and orderly transition of his former responsibilities, (iii) reimbursement for the extension of certain employee benefits during the consulting period if elected by Dr. Debrabandere, (iv) extension of the expiration date to December 31, 2017 for up to 36,250 previously granted and exercisable stock options at their existing exercise prices, (v) non-disparagement, (vi) compliance with certain post-employment restrictions in Dr. Debrabandere's Employment Agreement, including with respect to confidentiality, inventions and patents, non-competition and non-solicitation, and (vii) a release of claims by Dr. Debrabandere.
Ms. Palczuk
On June 24, 2017, we entered into an employment agreement with Ms. Palczuk. Ms. Palczuk resigned as President and Chief Executive Officer effective as of February 9, 2018. On February 9, 2018, we entered into a Separation and Release Agreement with Ms. Palczuk, that provides for, among other terms, (i) a separation date of February 9, 2018, (ii) a lump sum payment to Ms. Palczuk of $25,000, (iii) up to $4,800 to reimburse Ms. Palczuk for costs associated with the termination of her apartment and furniture rentals, (iv) provision of health benefits through the end of February 2018, (v) mutual non-disparagement, (vi) compliance with certain post-employment restrictions in Ms. Palczuk's employment agreement, including with respect to confidentiality, inventions and patents, non-competition and non-solicitation, and (vii) a release of claims by Ms. Palczuk.
100
Ms. Chang
On April 17, 2017, we entered into an offer agreement with Ms. Chang, our Chief Financial Officer. Pursuant to the agreement, Ms. Chang's base annual salary is three hundred twenty thousand dollars ($320,000). Ms. Chang will be eligible for an annual performance-based bonus of up to eighty thousand dollars ($80,000), to be determined by the Compensation Committee. Ms. Chang shall also be entitled to participate in the Company's long-term incentive plan and other benefit plans generally available to other executives. In the event of a change in control of the Company any grants or awards under the long-term incentive plan shall immediately vest. Ms. Chang will be entitled to a severance payment equal to six months of her base salary in certain circumstances.
Ms. Chang also entered into our employee confidentiality, noncompetition and invention agreement which provides, among other restrictions, that for six months after her termination of employment, Ms. Chang will not solicit our employees or customers and will not, directly or indirectly become employed by or affiliated with any company in a division or business line which is competitive with our business.
Compensation of Directors
All directors are reimbursed for their out-of-pocket expenses incurred in attending meetings. Each director who is not an employee is eligible to receive compensation from us for his or her services as a member of our Board or any of its standing committees. Director compensation is determined by the Compensation Committee, subject to approval by the entire Board. In determining compensation for directors, the Compensation Committee's decision is generally guided by three goals: compensation should fairly pay the directors for work required of directors of a company of our size and scope; compensation should align directors' interests with the long-term interests of stockholders; and the structure of the compensation should be simple, transparent and easy for stockholders to understand. The Company generally pays directors for services performed in any particular year after the year-end.
The following table summarizes compensation earned by our non-employee directors for their service on our Board during the fiscal year ended December 31, 2015.
Name
|
Fees ($)(1) | Stock Awards ($) |
Option Awards ($) |
All Other Compensation ($) |
Total | |||||||||||
|---|---|---|---|---|---|---|---|---|---|---|---|---|---|---|---|---|
Peter Friedli |
150,000 | — | — | — | 150,000 | |||||||||||
Jay M. Moyes |
60,000 | — | — | — | 60,000 | |||||||||||
Yves Huwyler |
60,000 | — | — | — | 60,000 | |||||||||||
Hans Klingemann, M.D., Ph.D. |
60,000 | — | — | — | 60,000 | |||||||||||
- (1)
- Annual fee for non-employee directors other than the Chairman is set at $60,000.
The following table summarizes compensation earned by our non-employee directors for their service on our Board during the fiscal year ended December 31, 2016.
Name
|
Fees ($)(1) | Stock Awards ($) |
Option Awards ($) |
All Other Compensation ($) |
Total | |||||||||||
|---|---|---|---|---|---|---|---|---|---|---|---|---|---|---|---|---|
Peter Friedli |
150,000 | — | — | — | 150,000 | |||||||||||
Jay M. Moyes |
60,000 | — | — | — | 60,000 | |||||||||||
Thomas M. Brandt, Jr.(2) |
60,000 | — | — | — | 60,000 | |||||||||||
Yves Huwyler |
60,000 | — | — | — | 60,000 | |||||||||||
Hans Klingemann, M.D., Ph.D.* |
60,000 | — | — | — | 60,000 | |||||||||||
- (1)
- Annual
fee for non-employee directors other than the Chairman is set at $60,000.
- (2)
- Mr. Brandt
has a Director Agreement which provides for, among other things, an annual payment of $60,000.
- *
- Indicates individuals who were no longer directors as of December 31, 2016.
101
The following table summarizes compensation earned by our non-employee directors for their service on our Board during the fiscal year ended December 31, 2017.
Name
|
Fees ($)(1) | Stock Awards ($) |
Option Awards ($) |
All Other Compensation ($) |
Total | |||||||||||
|---|---|---|---|---|---|---|---|---|---|---|---|---|---|---|---|---|
Peter Friedli |
150,000 | — | — | — | 150,000 | |||||||||||
Jay M. Moyes* |
57,041 | — | — | — | 57,041 | |||||||||||
Thomas M. Brandt, Jr.(2) |
60,000 | — | — | — | 60,000 | |||||||||||
Yves Huwyler* |
15,000 | — | — | — | 15,000 | |||||||||||
Thomas J. Knapp |
53,918 | — | — | — | 53,918 | |||||||||||
Uwe Sommer |
53,918 | — | — | — | 53,918 | |||||||||||
David L. White |
35,507 | — | — | — | 35,507 | |||||||||||
- (1)
- Annual
fee for non-employee directors other than the Chairman is set at $60,000. Fees for directors who only served for a portion of 2017 have been pro-rated.
- (2)
- Mr. Brandt
has a Director Agreement which provides for, among other things, an annual payment of $60,000.
- *
- Indicates individuals who were no longer directors as of December 31, 2017.
See the Summary Compensation Table for disclosures related to compensation paid to our named executive officers serving on the Board during the years ended December 31, 2016 and December 31, 2015.
Chief Executive Officer Pay Ratio
We believe our executive compensation program must be consistent and internally equitable to motivate our employees to perform in ways that enhance shareholder value. Presented below is the ratio of annual total compensation of our former Chief Executive Officer, Linda Palczuk, to the annual total compensation of our median employee (excluding our former Chief Executive Officer). The ratio presented below is a reasonable estimate calculated in a manner consistent with Item 402(u) of Regulation S-K under the Exchange Act.
Ms. Palczuk served as Chief Executive Officer from June 24, 2017 to February 9, 2018. Because Ms. Palczuk did not serve as our Chief Executive Officer for the entirety of 2017, for purposes of this disclosure, the annual total compensation for the Chief Executive Officer was determined by annualizing the compensation of Ms. Palczuk based on her position as Chief Executive Officer as of December 31, 2017. This amount differs from Ms. Palczuk's "Total Compensation" reported in the Summary Compensation Table on page 91 of this Form 10-K, which is not annualized and therefore reflects only the compensation Ms. Palczuk earned or was paid during the portion of the year for which she served as Chief Executive Officer.
In identifying our median employee, we calculated the annual total cash compensation of each employee other than our Chief Executive Officer for the year ended December 31, 2017. Total cash compensation for these purposes included base salary, bonus, commissions and 401(k) match, and was calculated using internal payroll/tax records.
We selected the median employee based on the 350 full-time, part-time, temporary and seasonal workers who were employed as of December 31, 2017.
The 2017 annual total compensation as determined under Item 402 of Regulation S-K for our Chief Executive Officer was $600,853. The 2017 annual total compensation as determined under Item 402 of Regulation S-K for our median employee was $93,000. The ratio of our Chief Executive
102
Officer's annual total compensation to our median employee's total compensation for fiscal year 2017 is 6.46 to 1.
ITEM 12. Security Ownership of Certain Beneficial Owners and Management and Related Stockholder Matters.
The following table sets forth certain information with respect to the beneficial ownership of our common stock as of March 23, 2018 for (a) each of our current directors and the named executive officers, (b) all of our current directors and named executive officers as a group, and (c) each stockholder that it knows to be the beneficial owner of more than 5% of our common stock. Beneficial ownership is determined in accordance with the rules of the SEC and includes voting or investment power with respect to the securities. We deem shares of common stock that may be acquired by an individual or group within 60 days of March 23, 2018 pursuant to the exercise of options to be outstanding for the purpose of computing the percentage ownership of such individual or group, but those shares are not deemed to be outstanding for the purpose of computing the percentage ownership of any other person shown in the table. Except as indicated in footnotes to this table, we believe that the stockholders named in this table have sole voting and investment power with respect to all shares of common stock shown to be beneficially owned by them based on information provided to us by these stockholders. Percentage of ownership is based on 34,525,886 shares of common stock outstanding on March 23, 2018.
Name and Address of Beneficial Owners
|
Amount and Nature of Beneficial Ownership |
Percent of Class(2) |
|||||
|---|---|---|---|---|---|---|---|
Named Executive Officers and Directors(1) |
|||||||
Thomas M. Brandt |
— | ||||||
Linda L. Chang |
— | ||||||
Alla Danilkovitch |
89,125 | (3) | |||||
Peter Friedli |
14,810,455 | (4) | 42.9 | % | |||
Jason Keefer |
— | ||||||
Thomas J. Knapp |
— | ||||||
Willi Miesch |
— | ||||||
Uwe Sommer |
108,500 | ||||||
David L. White |
— | ||||||
All directors and named executive officers as a group (9 persons) |
15,008,080 | 43.4 | % | ||||
Other 5% Stockholders |
9,882,181 | 28.4 | % | ||||
Venturetec, Inc. |
4,103,301 | 11.9 | % | ||||
Thomas Schmidheiny |
3,060,767 | (5) | 8.9 | % | |||
BIH SA |
2,658,113 | 7.7 | % | ||||
- (1)
- Mailing
address for all directors and officers is c/o Osiris Therapeutics, Inc., 7015 Albert Einstein Drive, Columbia, Maryland 21046.
- (2)
- Percentage not provided if less than 1%.
103
- (3)
- Consists
of 9,375 shares owned by Dr. Danilkovitch and 79,750 shares issuable upon exercise of options. Dr. Danilkovitch separately has 61,250 options
that have not yet vested.
- (4)
- Consists
of 10,204,404 shares owned directly by Peter Friedli & Co., Inc., 4,103,301 shares held by Venturetec, Inc., 500,000 shares held
by Mr. Friedli's minor daughter and 2,750 shares held by his spouse. Mr. Friedli is the sole owner of Peter Friedli &Co., Inc. and serves as its president.
Mr. Friedli holds approximately a 2% interest in, and serves as the president of, New Venturetec Ltd., the parent of Venturetec, Inc. and through ownership of a convertible note
holds another 19% interest in Venturetec, Inc., for which he serves as President. Mr. Friedli has disclaimed beneficial ownership in the shares held by his daughter and spouse and has
disclaimed beneficial interest in the shares held by Venturetec, Inc., beyond the extent of his pecuniary interest therein.
- (5)
- Consists of 402,654 shares owned directly by Mr. Schmidheiny and 2,658,113 shares owned by BIH SA. Mr. Schmidheiny is the Chairman and controlling shareholder of BIH SA.
Information regarding securities authorized for issuance under equity compensation plans is set forth under the heading Securities Authorized for Issuance under Equity Compensation Plans in Part II, Item 5 of this Form 10-K and is incorporated by reference in this Item 12.
ITEM 13. Certain Relationships and Related Transactions, and Director Independence.
The Audit Committee reviews and approves all related person transactions, as defined by SEC rules. The Audit Committee may approve only those related party transactions that are in, or are not inconsistent with, the best interests of us and our stockholders, as the Audit Committee determines in good faith. In making such a determination, the Audit Committee is required to consider all of the relevant facts and circumstances relating to the transaction including, but not limited to, the following:
- •
- the benefits to the Company;
- •
- if the transaction involves a director, a member of the director's immediate family or entity affiliated with the director, the impact on the
director's independence;
- •
- the availability of other sources for comparable products or services;
- •
- the terms of the transaction; and
- •
- the terms available to unrelated third parties.
The following were the related person transactions of the Company during 2015, 2016 and 2017:
Prolexys Pharmaceuticals, Inc. During the third quarter of 2011 we entered into a research agreement with Prolexys Pharmaceuticals, Inc. ("Prolexys") under which we conducted an early stage clinical trial investigating a novel compound as a product candidate for cancer therapeutics. This contract was filed as an exhibit to, and discussed in, our Current Report on Form 8-K filed with the SEC on September 14, 2011 because of the related nature of the management and ownership of Prolexys and our management and certain of our significant stockholders. We did not incur any third-party costs related to our work with Prolexys and we were contributing only the efforts of employees. All third-party costs associated with the Prolexys clinical trial and related work were paid directly by Prolexys. The amount of our internal resources contributed to Prolexys pursuant to the agreement was not material. The clinical trial ended and we ceased contributing the efforts of our employees to Prolexys in 2015. This arrangement was part of our efforts to expand our portfolio of product candidates, but we never considered this arrangement to be material. Prolexys ceased to be in business in late 2015.
At the time Prolexys ceased to be in business, Prolexys was 35.7% owned by BIH SA, which owns 7.7% of our outstanding common stock; 24.3% owned by Peter Friedli who is the Chairman of
104
the Board and direct owner of 29.6% of our common stock; and 13.8% owned by Venturetec, Inc., which holds 11.9% of our common stock. Peter Friedli is the President and an approximately 2% owner of New Venturetec Ltd.
The Board and Audit Committee, including all of our independent directors, but with Mr. Friedli abstaining, unanimously approved this transaction.
BioForceRX LLC. We paid BioForceRX LLC, a professional recruiting and consulting firm, approximately $129,500 in 2015 for various recruiting services, primarily involving our sales force, pursuant to a Contingency Recruitment Services and Fee Agreement, dated 2014 (the "Recruitment Agreement"). The owner of BioForceRX LLC is Kathleen Czworka, the spouse of Frank Czworka, our former Vice President and General Manager of Wound Care from August 2011 to February 2016. Mr. Czworka also served as our Chief Operating Officer from February 2, 2016 until March 6, 2016 when the Chief Operating Officer position was eliminated. The parties agreed to terminate the Recruitment Agreement by a letter agreement, dated July 7, 2016, under which we paid $32 thousand as full payment for all outstanding fees and expenses.
Our Board has determined that the following members of the Board qualify as "independent" under the definition promulgated by NASDAQ: Thomas M. Brandt, Thomas J. Knapp, Willi Miesch, Uwe Sommer and David L. White. Furthermore, our Board has determined that none of the current members of the Audit Committee, the Compensation Committee or the Nominating Committee of the Board has any material relationship with us (directly or as a partner, stockholder or officer of an organization that has a relationship with us), and therefore, each committee is "independent" within the meaning of the NASDAQ standards and the rules and regulations of the SEC.
ITEM 14. Principal Accounting Fees and Services.
BDO acted as our independent registered public accounting firm and also provided certain other services for the fiscal year ended December 31, 2014. As previously described in our Current Report on Form 8-K filed on December 17, 2015, on December 14, 2015, we received written notice of BDO's resignation, effective the same day. Notwithstanding the resignation, BDO continued to perform procedures to complete the amendment to our annual report on Form 10-K for the fiscal year ended December 31, 2014.
Pursuant to the rules of the SEC, the following table sets forth the amount of audit fees, audit-related fees, tax fees, and all other fees billed for services by BDO for the audit of our financial statements and the effectiveness of internal control over financial reporting for the year ended December 31, 2014.
| |
Fiscal Year Ended 12/31/2014 ($) |
|||
|---|---|---|---|---|
Audit Fees(1) |
$ | 2,274,759 | ||
Audit-Related Fees(2) |
50,000 | |||
Tax Fees(3) |
— | |||
All Other Fees(4) |
— | |||
| | | | | |
Total |
$ | 2,324,759 | ||
| | | | | |
| | | | | |
| | | | | |
- (1)
- Audit fees consisted principally of fees billed to the Company for professional services performed for the audit of financial statements included in the Form 10-K, Form 10-K/A, for review of financial statements included in the Forms 10-Q, for the audit of our internal control over financial reporting and for services generally only the independent
105
registered public accounting firm can reasonably be expected to provide, such as statutory and regulatory filings or engagements.
- The
amount for fiscal 2014 was revised to include $2,053,804 for professional services rendered in connection with the restatement of our previously
issued consolidated financial statements and related disclosures in our Form 10-K/A for the fiscal year ended December 31, 2014 and related quarterly reports previously filed on
Form 10-Q.
- (2)
- Audit-related
fees consisted principally of fees billed to the Company for assurance and related services performed that are reasonably related to the performance of
the audit or review of our financial statements, including due diligence related to mergers and acquisitions, audits of employee benefit and compensation plans, audits of carve-out entities, and other
agreed upon procedures to meet various statutory and regulatory requirements.
- (3)
- Tax
fees are fees billed to the Company for professional services performed with respect to U.S. federal, state and local tax planning, advice and compliance,
assistance with tax audits and appeals and the preparation of original and amended tax returns for the Company.
- (4)
- All other fees are fees for any permissible services performed that do not meet the above category descriptions, however, we generally do not engage our independent registered public accountants for "other" services.
As previously announced in our Current Report on Form 8-K filed with the SEC on May 18, 2017, Ernst & Young was formally engaged by us as our independent registered public accounting firm on May 17, 2017.
Pursuant to the rules of the SEC, the following table sets forth the amount of audit fees, audit-related fees, tax fees, and all other fees billed for services by Ernst & Young for the audit of our financial statements and the effectiveness of internal control over financial reporting for the years ended December 31, 2017, 2016 and 2015.
| |
Fiscal Year Ended 12/31/2017 ($) |
Fiscal Year Ended 12/31/2016 ($) |
Fiscal Year Ended 12/31/2015 ($) |
|||||||
|---|---|---|---|---|---|---|---|---|---|---|
Audit Fees(1) |
$ | 1,550,000 | $ | 1,550,000 | $ | 1,200,000 | ||||
Audit-Related Fees(2) |
— | — | — | |||||||
Tax Fees(3) |
— | — | — | |||||||
All Other Fees(4) |
— | — | — | |||||||
| | | | | | | | | | | |
Total |
$ | 1,550,000 | $ | 1,550,000 | $ | 1,200,000 | ||||
| | | | | | | | | | | |
| | | | | | | | | | | |
| | | | | | | | | | | |
- (1)
- Audit
fees are fees billed to the Company for professional services performed for the audit of financial statements included in the Form 10-K, for review of
quarterly unaudited financial information included as a footnote in the annual financial statements, and for the audit of our internal control over financial reporting.
- (2)
- Audit-related fees consisted principally of fees billed to the Company for assurance and related services performed that are reasonably related to the performance of the audit or review of our financial statements, including due diligence related to mergers and acquisitions, audits of employee benefit and compensation plans, audits of carve-out entities, and other agreed upon procedures to meet various statutory and regulatory requirements.
106
- (3)
- Tax
fees are fees billed to the Company for professional services performed with respect to U.S. federal, state and local tax planning, advice and compliance,
assistance with tax audits and appeals and the preparation of original and amended tax returns for the Company.
- (4)
- All other fees are fees for any permissible services performed that do not meet the above category descriptions, however, we generally do not engage our independent registered public accountants for "other" services.
Under our pre-approval policy, concurrent with the appointment of the independent registered public accounting firm, the Audit Committee specifically pre-approves the recurring audit and audit-related services and estimated fees. All the work performed for the Company by (i) BDO for the audit of our financial statements for the fiscal year December 31, 2014 and the related fees and (ii) Ernst & Young for the audit of our financial statements for the fiscal years ended December 31, 2017, 2016 and 2015 and the related fees, were pre-approved by the Audit Committee.
The Audit Committee has considered whether the provision of audit and non-audit services by Ernst & Young to the Company for fiscal years 2017, 2016 and 2015 is compatible with maintaining the auditor's independence. We have been advised by Ernst & Young that neither the firm, nor any member of the firm, has any financial interest, direct or indirect, in any capacity in the Company.
107
ITEM 15. Exhibits and Financial Statement Schedules.
- (A)
- The
following documents are filed as part of this report:
- (1)
- The
financial statements are included in Part II, Item 8 of this Form 10-K
- (2)
- SCHEDULE II-Valuation and Qualifying Accounts
OSIRIS THERAPEUTICS, INC.
SCHEDULE II—VALUATION AND QUALIFYING ACCOUNTS
FOR THE YEARS ENDED DECEMBER 31, 2017, 2016, AND 2015
| (in 000's) |
Balance at Beginning of Year |
Additions | Deductions | Balance at End of Year |
|||||||||
|---|---|---|---|---|---|---|---|---|---|---|---|---|---|
Inventory Reserve: |
|||||||||||||
2017 |
$ | 2,444 | $ | 3,555 | $ | (3,992 | ) | $ | 2,007 | ||||
2016 |
2,603 | 4,208 | (4,367 | ) | 2,444 | ||||||||
2015 |
692 | 3,570 | (1,659 | ) | 2,603 | ||||||||
Net Deferred Tax Asset Valuation Allowance: |
|||||||||||||
2017 |
$ | 17,308 | $ | — | $ | (7,096 | ) | 10,212 | |||||
2016 |
16,662 | 646 | — | 17,308 | |||||||||
2015 |
4,332 | 12,330 | — | 16,662 | |||||||||
- (3)
- Exhibits:
108
109
| Exhibit Number |
Description of Exhibit | ||
|---|---|---|---|
| 101 | The following materials from the Registrant's Annual Report on Form 10-K for the year ended December 31, 2017, formatted in Extensible Business Reporting Language (XBRL), include: (i) the Statements of Income, (ii) the Balance Sheets, (iii) the Statements of Cash Flows, and (iv) related notes (filed herewith). | ||
- †
- Incorporated herein by reference to corresponding Exhibit to the Registrant's Registration Statement on Form S-1, which was declared effective by the SEC on August 3, 2006.
None.
110
Pursuant to the requirements of Section 13 or 15(d) of the Securities Exchange Act of 1934, the registrant has duly caused this report to be signed on its behalf by the undersigned, thereunto duly authorized.
| |
|
|
||
|---|---|---|---|---|
| OSIRIS THERAPEUTICS, INC. | ||||
March 28, 2018 |
By: |
/s/ JASON KEEFER Jason Keefer Interim President and Chief Executive Officer |
||
Pursuant to the requirements of the Securities Exchange Act of 1934, this report has been signed below by the following persons on behalf of the registrant and in the capacities and on the dates indicated.
| |
|
|
||
|---|---|---|---|---|
| /s/ JASON KEEFER Jason Keefer |
Interim President and Chief Executive Officer (principal executive officer) | March 28, 2018 | ||
/s/ LINDA L. CHANG Linda L. Chang |
Chief Financial Officer (principal financial officer and principal accounting officer) |
March 28, 2018 |
||
/s/ PETER FRIEDLI Peter Friedli |
Director |
March 28, 2018 |
||
/s/ THOMAS M. BRANDT Thomas M. Brandt |
Director |
March 28, 2018 |
||
/s/ THOMAS J. KNAPP Thomas J. Knapp |
Director |
March 28, 2018 |
||
/s/ WILLI MIESCH Willi Miesch |
Director |
March 28, 2018 |
||
/s/ UWE SOMMER Uwe Sommer |
Director |
March 28, 2018 |
||
/s/ DAVID L. WHITE David L. White |
Director |
March 28, 2018 |
111
OSIRIS THERAPEUTICS, INC.
CONSOLIDATED FINANCIAL STATEMENTS
INDEX
F-1
Report of Independent Registered Public Accounting Firm
To the Shareholders and the Board of Directors of Osiris Therapeutics, Inc.
Opinion on Internal Control over Financial Reporting
We have audited Osiris Therapeutics, Inc.'s internal control over financial reporting as of December 31, 2017, based on criteria established in Internal Control—Integrated Framework issued by the Committee of Sponsoring Organizations of the Treadway Commission (2013 framework) (the COSO criteria). In our opinion, because of the effect of the material weaknesses described below on the achievement of the objectives of the control criteria, Osiris Therapeutics, Inc. (the Company) has not maintained effective internal control over financial reporting as of December 31, 2017, based on the COSO criteria.
A material weakness is a deficiency, or combination of deficiencies, in internal control over financial reporting, such that there is a reasonable possibility that a material misstatement of the company's annual or interim financial statements will not be prevented or detected on a timely basis. As more fully described in Management's Annual Report on Internal Control over Financial Reporting included in Item 9A, management has identified material weaknesses in control activities related to revenue recognition; processing of directors' expense reports; inventory; reserves, estimates and valuation accounts; purchasing and disbursements; and information technology.
We also have audited, in accordance with the standards of the Public Company Accounting Oversight Board (United States) (PCAOB), the consolidated balance sheets of Osiris Therapeutics, Inc. as of December 31, 2017, 2016, and 2015, and the related consolidated statements of comprehensive income (loss), stockholders' equity and cash flows for each of the three years in the period ended December 31, 2017, and the related notes and the financial statement schedule listed in the Index at Item 15(A)(2). These material weaknesses were considered in determining the nature, timing and extent of audit tests applied in our audit of the 2017 consolidated financial statements, and this report does not affect our report dated March 28, 2018, which expressed an unqualified opinion thereon.
Basis for Opinion
The Company's management is responsible for maintaining effective internal control over financial reporting and for its assessment of the effectiveness of internal control over financial reporting included in the accompanying Management's Report on Internal Control over Financial Reporting included in Item 9A Controls and Procedures. Our responsibility is to express an opinion on the Company's internal control over financial reporting based on our audit. We are a public accounting firm registered with the PCAOB and are required to be independent with respect to the Company in accordance with the U.S. federal securities laws and the applicable rules and regulations of the Securities and Exchange Commission and the PCAOB.
We conducted our audit in accordance with the standards of the PCAOB. Those standards require that we plan and perform the audit to obtain reasonable assurance about whether effective internal control over financial reporting was maintained in all material respects.
Our audit included obtaining an understanding of internal control over financial reporting, assessing the risk that a material weakness exists, testing and evaluating the design and operating effectiveness of internal control based on the assessed risk, and performing such other procedures as we considered necessary in the circumstances. We believe that our audit provides a reasonable basis for our opinion.
F-2
Definition and Limitations of Internal Control Over Financial Reporting
A company's internal control over financial reporting is a process designed to provide reasonable assurance regarding the reliability of financial reporting and the preparation of financial statements for external purposes in accordance with generally accepted accounting principles. A company's internal control over financial reporting includes those policies and procedures that (1) pertain to the maintenance of records that, in reasonable detail, accurately and fairly reflect the transactions and dispositions of the assets of the company; (2) provide reasonable assurance that transactions are recorded as necessary to permit preparation of financial statements in accordance with generally accepted accounting principles, and that receipts and expenditures of the company are being made only in accordance with authorizations of management and directors of the company; and (3) provide reasonable assurance regarding prevention or timely detection of unauthorized acquisition, use, or disposition of the company's assets that could have a material effect on the financial statements.
Because of its inherent limitations, internal control over financial reporting may not prevent or detect misstatements. Also, projections of any evaluation of effectiveness to future periods are subject to the risk that controls may become inadequate because of changes in conditions, or that the degree of compliance with the policies or procedures may deteriorate.
/s/ Ernst & Young LLP
Baltimore,
Maryland
March 28, 2018
F-3
Report of Independent Registered Public Accounting Firm
To the Shareholders and the Board of Directors of Osiris Therapeutics, Inc.
Opinion on the Financial Statements
We have audited the accompanying consolidated balance sheets of Osiris Therapeutics, Inc. (the Company) as of December 31, 2017, 2016, and 2015, and the related consolidated statements of comprehensive income (loss), stockholders' equity and cash flows for each of the three years in the period ended December 31, 2017, and the related notes and the financial statement schedule listed in the Index at Item 15(A)(2) (collectively referred to as the "consolidated financial statements"). In our opinion, the consolidated financial statements present fairly, in all material respects, the financial position of the Company at December 31, 2017, 2016, and 2015, and the results of its operations and its cash flows for each of the three years in the period ended December 31, 2017, in conformity with U.S. generally accepted accounting principles.
We also have audited, in accordance with the standards of the Public Company Accounting Oversight Board (United States) (PCAOB), the Company's internal control over financial reporting as of December 31, 2017, based on criteria established in Internal Control-Integrated Framework issued by the Committee of Sponsoring Organizations of the Treadway Commission (2013 framework), and our report dated March 28, 2018 expressed an adverse opinion thereon.
Basis for Opinion
These financial statements are the responsibility of the Company's management. Our responsibility is to express an opinion on the Company's financial statements based on our audits. We are a public accounting firm registered with the PCAOB and are required to be independent with respect to the Company in accordance with the U.S. federal securities laws and the applicable rules and regulations of the Securities and Exchange Commission and the PCAOB.
We conducted our audits in accordance with the standards of the PCAOB. Those standards require that we plan and perform the audit to obtain reasonable assurance about whether the financial statements are free of material misstatement, whether due to error or fraud. Our audits included performing procedures to assess the risks of material misstatement of the financial statements, whether due to error or fraud, and performing procedures that respond to those risks. Such procedures included examining, on a test basis, evidence regarding the amounts and disclosures in the financial statements. Our audits also included evaluating the accounting principles used and significant estimates made by management, as well as evaluating the overall presentation of the financial statements. We believe that our audits provide a reasonable basis for our opinion.
/s/ Ernst & Young LLP
We have served as the Company's auditor since 2017.
Baltimore,
Maryland
March 28, 2018
F-4
OSIRIS THERAPEUTICS, INC.
CONSOLIDATED BALANCE SHEETS
(amounts in thousands, except per share data)
| |
As of December 31, | |||||||||
|---|---|---|---|---|---|---|---|---|---|---|
| |
2017 | 2016 | 2015 | |||||||
Assets |
||||||||||
Current Assets |
||||||||||
Cash and cash equivalents |
$ | 3,081 | $ | 2,833 | $ | 9,144 | ||||
Short-term investments |
24,807 | 23,829 | 24,809 | |||||||
Trade receivables, net |
26,053 | 23,248 | 18,799 | |||||||
Inventory, net |
11,278 | 11,366 | 9,577 | |||||||
Insurance receivable |
4,788 | — | — | |||||||
Prepaid expenses and other current assets |
2,920 | 3,221 | 4,321 | |||||||
| | | | | | | | | | | |
Total current assets |
72,927 | 64,497 | 66,650 | |||||||
Property and equipment, net |
3,587 | 2,390 | 2,077 | |||||||
Insurance receivable |
— | 4,788 | 4,788 | |||||||
Other assets |
1,608 | 142 | 151 | |||||||
| | | | | | | | | | | |
Total assets |
$ | 78,122 | $ | 71,817 | $ | 73,666 | ||||
| | | | | | | | | | | |
| | | | | | | | | | | |
| | | | | | | | | | | |
Liabilities and Equity |
||||||||||
Current liabilities |
||||||||||
Accounts payable |
$ | 5,269 | $ | 5,559 | $ | 4,749 | ||||
Accrued liabilities |
9,399 | 11,001 | 7,321 | |||||||
Accrued shareholder litigation |
18,500 | — | — | |||||||
Other current liabilities |
1,934 | 1,816 | 1,791 | |||||||
| | | | | | | | | | | |
Total current liabilities |
35,102 | 18,376 | 13,861 | |||||||
Accrued shareholder litigation |
— | 18,500 | 18,500 | |||||||
Other long term liabilities |
1,626 | 2,440 | 4,763 | |||||||
| | | | | | | | | | | |
Total liabilities |
36,728 | 39,316 | 37,124 | |||||||
| | | | | | | | | | | |
Equity |
||||||||||
Common stock, $.001 par value, 90,000 shares authorized, 34,526, 34,501 and 34,495 shares issued and outstanding at December 31, 2017, 2016 and 2015, respectively |
35 | 35 | 35 | |||||||
Additional paid-in capital |
283,905 | 283,678 | 284,024 | |||||||
Accumulated other comprehensive loss |
(208 | ) | (89 | ) | (143 | ) | ||||
Accumulated deficit |
(242,338 | ) | (251,123 | ) | (247,374 | ) | ||||
| | | | | | | | | | | |
Total equity |
41,394 | 32,501 | 36,542 | |||||||
| | | | | | | | | | | |
Total liabilities and equity |
$ | 78,122 | $ | 71,817 | $ | 73,666 | ||||
| | | | | | | | | | | |
| | | | | | | | | | | |
| | | | | | | | | | | |
See accompanying notes to consolidated financial statements
F-5
OSIRIS THERAPEUTICS, INC.
CONSOLIDATED STATEMENTS OF COMPREHENSIVE INCOME (LOSS)
(amounts in thousands, except per share data)
| |
Year ended December 31, | |||||||||
|---|---|---|---|---|---|---|---|---|---|---|
| |
2017 | 2016 | 2015 | |||||||
Revenue |
$ | 118,514 | $ | 109,374 | $ | 79,707 | ||||
Cost of revenue |
32,681 | 30,733 | 27,020 | |||||||
| | | | | | | | | | | |
Gross profit |
85,833 | 78,641 | 52,687 | |||||||
| | | | | | | | | | | |
Operating expenses: |
||||||||||
Research and development |
4,138 | 6,324 | 4,867 | |||||||
Sales and marketing |
61,545 | 59,057 | 56,627 | |||||||
General and administrative |
22,139 | 17,356 | 9,498 | |||||||
Settlement of SEC and shareholder actions |
— | — | 15,212 | |||||||
| | | | | | | | | | | |
Total operating expenses |
87,822 | 82,737 | 86,204 | |||||||
Loss from continuing operations |
(1,989 | ) | (4,096 | ) | (33,517 | ) | ||||
Other income (expense), net |
(645 | ) | 417 | (1,693 | ) | |||||
| | | | | | | | | | | |
Loss before income taxes from continuing operations |
(2,634 | ) | (3,679 | ) | (35,210 | ) | ||||
Income tax benefit (expense) |
1,398 | (70 | ) | (544 | ) | |||||
| | | | | | | | | | | |
Net loss from continuing operations |
(1,236 | ) | (3,749 | ) | (35,754 | ) | ||||
Discontinued operations, net of tax |
10,021 | — | — | |||||||
| | | | | | | | | | | |
Net income (loss) |
8,785 | (3,749 | ) | (35,754 | ) | |||||
Other comprehensive income (loss): |
||||||||||
Unrealized (loss) gain on investments |
(119 | ) | 54 | (89 | ) | |||||
| | | | | | | | | | | |
Comprehensive income (loss) |
$ | 8,666 | $ | (3,695 | ) | $ | (35,843 | ) | ||
| | | | | | | | | | | |
| | | | | | | | | | | |
| | | | | | | | | | | |
Net loss per share from continuing operations: |
||||||||||
Basic |
$ | (0.04 | ) | $ | (0.11 | ) | $ | (1.04 | ) | |
| | | | | | | | | | | |
| | | | | | | | | | | |
| | | | | | | | | | | |
Diluted |
$ | (0.04 | ) | $ | (0.11 | ) | $ | (1.04 | ) | |
| | | | | | | | | | | |
| | | | | | | | | | | |
| | | | | | | | | | | |
Net income per share from discontinued operations: |
||||||||||
Basic |
$ | 0.29 | $ | — | $ | — | ||||
| | | | | | | | | | | |
| | | | | | | | | | | |
| | | | | | | | | | | |
Diluted |
$ | 0.29 | $ | — | $ | — | ||||
| | | | | | | | | | | |
| | | | | | | | | | | |
| | | | | | | | | | | |
Net income (loss) per share: |
||||||||||
Basic |
$ | 0.25 | $ | (0.11 | ) | $ | (1.04 | ) | ||
| | | | | | | | | | | |
| | | | | | | | | | | |
| | | | | | | | | | | |
Diluted |
$ | 0.25 | $ | (0.11 | ) | $ | (1.04 | ) | ||
| | | | | | | | | | | |
| | | | | | | | | | | |
| | | | | | | | | | | |
Weighted average common shares outstanding: |
||||||||||
Basic |
34,524 | 34,499 | 34,422 | |||||||
| | | | | | | | | | | |
| | | | | | | | | | | |
| | | | | | | | | | | |
Diluted |
34,525 | 34,499 | 34,422 | |||||||
| | | | | | | | | | | |
| | | | | | | | | | | |
| | | | | | | | | | | |
See accompanying notes to consolidated financial statements
F-6
OSIRIS THERAPEUTICS, INC.
CONSOLIDATED STATEMENTS OF STOCKHOLDERS' EQUITY
(amounts in thousands, except for share data)
| |
Common Stock | |
Accumulated Other Comprehensive (Loss) Income |
|
|
||||||||||||||
|---|---|---|---|---|---|---|---|---|---|---|---|---|---|---|---|---|---|---|---|
| |
Additional Paid-in Capital |
Accumulated Deficit |
Total Equity |
||||||||||||||||
| |
Shares | Amount | |||||||||||||||||
Balance at January 1, 2015 |
34,345,688 | $ | 35 | $ | 287,320 | $ | (54 | ) | $ | (211,620 | ) | $ | 75,681 | ||||||
Stock issued upon exercise of stock options, net of shares acquired |
149,647 | — | 781 | — | — | 781 | |||||||||||||
Stock based compensation |
— | — | 2,814 | — | — | 2,814 | |||||||||||||
Common stock special dividend |
— | — | (6,891 | ) | — | — | (6,891 | ) | |||||||||||
Unrealized loss on available for sale investments |
— | — | — | (89 | ) | — | (89 | ) | |||||||||||
Net loss |
— | — | — | — | (35,754 | ) | (35,754 | ) | |||||||||||
| | | | | | | | | | | | | | | | | | | | |
Balance at December 31, 2015 |
34,495,335 | $ | 35 | $ | 284,024 | $ | (143 | ) | $ | (247,374 | ) | $ | 36,542 | ||||||
Stock issued upon exercise of stock options, net of shares acquired |
5,551 | — | (5 | ) | — | — | (5 | ) | |||||||||||
Stock based compensation (benefit) |
— | — | (341 | ) | — | — | (341 | ) | |||||||||||
Unrealized loss on available for sale investments |
— | — | — | 54 | — | 54 | |||||||||||||
Net loss |
— | — | — | — | (3,749 | ) | (3,749 | ) | |||||||||||
| | | | | | | | | | | | | | | | | | | | |
Balance at December 31, 2016 |
34,500,886 | $ | 35 | $ | 283,678 | $ | (89 | ) | $ | (251,123 | ) | $ | 32,501 | ||||||
Stock issued upon exercise of stock options, net of shares acquired |
25,000 | — | 128 | — | — | 128 | |||||||||||||
Stock based compensation |
— | — | 99 | — | — | 99 | |||||||||||||
Unrealized loss on available for sale investments |
— | — | — | (119 | ) | — | (119 | ) | |||||||||||
Net income |
— | — | — | — | 8,785 | 8,785 | |||||||||||||
| | | | | | | | | | | | | | | | | | | | |
Balance at December 31, 2017 |
34,525,886 | $ | 35 | $ | 283,905 | $ | (208 | ) | $ | (242,338 | ) | $ | 41,394 | ||||||
| | | | | | | | | | | | | | | | | | | | |
| | | | | | | | | | | | | | | | | | | | |
| | | | | | | | | | | | | | | | | | | | |
See accompanying notes to consolidated financial statements
F-7
OSIRIS THERAPEUTICS, INC.
CONSOLIDATED STATEMENTS OF CASH FLOWS
(amounts in thousands)
| |
Year ended December 31, | |||||||||
|---|---|---|---|---|---|---|---|---|---|---|
| |
2017 | 2016 | 2015 | |||||||
CASH FLOWS FROM OPERATING ACTIVITIES |
||||||||||
Net income (loss) |
$ | 8,785 | $ | (3,749 | ) | $ | (35,754 | ) | ||
Adjustments to reconcile net income (loss) to net cash used in operating activities: |
||||||||||
Receipt of Mesoblast common stock |
(10,000 | ) | — | — | ||||||
Settlement of SEC and shareholder actions, net of insurance |
(1,500 | ) | — | 15,212 | ||||||
Loss (gain) on disposal of fixed assets |
123 | 44 | (106 | ) | ||||||
Realized loss on investments |
2,028 | 8 | 2,502 | |||||||
Depreciation |
688 | 993 | 1,035 | |||||||
Stock-based compensation expense (benefit) |
99 | (341 | ) | 2,814 | ||||||
Changes in assets and liabilities |
||||||||||
Trade receivables, net |
(2,805 | ) | (4,449 | ) | (5,426 | ) | ||||
Inventory, net |
88 | (1,789 | ) | 247 | ||||||
Prepaid expenses and other assets |
(1,641 | ) | 782 | 4,095 | ||||||
Accounts payable, accrued expenses, and other liabilities |
(1,088 | ) | 2,263 | 4,402 | ||||||
| | | | | | | | | | | |
Net cash used in operating activities |
(5,223 | ) | (6,238 | ) | (10,979 | ) | ||||
CASH FLOWS FROM INVESTING ACTIVITIES |
||||||||||
Purchase of property and equipment, net |
(2,008 | ) | (1,350 | ) | (927 | ) | ||||
Proceeds from sale of investments |
32,857 | 14,485 | 120,203 | |||||||
Purchases of investments |
(25,506 | ) | (13,133 | ) | (101,384 | ) | ||||
Proceeds from Mesoblast guaranteed payment |
— | — | 6,180 | |||||||
| | | | | | | | | | | |
Net cash provided by investing activities |
5,343 | 2 | 24,072 | |||||||
CASH FLOWS FROM FINANCING ACTIVITIES |
||||||||||
Proceeds from the exercise of options to purchase common stock |
128 | 27 | 987 | |||||||
Repurchases of common stock |
— | (32 | ) | (206 | ) | |||||
Payment of dividend |
— | — | (6,891 | ) | ||||||
Other |
— | (70 | ) | (47 | ) | |||||
| | | | | | | | | | | |
Net cash provided by (used in) financing activities |
128 | (75 | ) | (6,157 | ) | |||||
NET INCREASE (DECREASE) IN CASH AND CASH EQUIVALENTS |
248 |
(6,311 |
) |
6,936 |
||||||
Cash and cash equivalents, beginning of period |
2,833 | 9,144 | 2,208 | |||||||
| | | | | | | | | | | |
Cash and cash equivalents, end of period |
$ | 3,081 | $ | 2,833 | $ | 9,144 | ||||
| | | | | | | | | | | |
| | | | | | | | | | | |
| | | | | | | | | | | |
Supplemental disclosure of cash flow information |
||||||||||
Cash paid during the period for: |
||||||||||
Income taxes paid, net of refunds |
$ | 134 | $ | 93 | $ | 2,453 | ||||
See accompanying notes to consolidated financial statements
F-8
OSIRIS THERAPEUTICS, INC.
NOTES TO CONSOLIDATED FINANCIAL STATEMENTS
1. Description of Business
Osiris Therapeutics, Inc. ("we", "us", "our", "Osiris", or the "Company") researches, develops, manufactures and commercializes regenerative medicine products intended to improve the health and lives of patients and lower overall healthcare costs. We are headquartered in Columbia, Maryland. We continue to advance our research and development ("R&D") by focusing on innovation in regenerative medicine, including the development of bioengineered stem cell and tissue-based products. We have achieved commercial success with products in orthopedics, sports medicine and wound care.
We operate in one segment and are focused on using unique tissue preservation technologies to develop viable human tissue products designed to improve wound closure and surgical outcomes for patients and physicians over standard of care alone. We launched Grafix in 2010, Ovation in 2011 and discontinued it in 2014, Cartiform in 2012, BIO4 (previously branded as OvationOS) in 2014 and Stravix in late 2015. Sales of these products have increased with the expansion of our direct sales force and distribution network and the broadening of our reimbursement coverage. Our direct sales force focuses exclusively on Grafix and Stravix sales. We entered into two exclusive distribution agreements in the fourth quarter of 2014, with a subsidiary of Stryker Corporation ("Stryker") for the marketing and distribution of BIO4, and with Arthrex, Inc. ("Arthrex") for the marketing and distribution of Cartiform. The first sales under these agreements began in 2015.
We are a fully integrated company, having developed capabilities in research and development, manufacturing, marketing and sales of our products. We are focused on the long-term commercial growth of the Company through the delivery of differentiated products for use across multiple fields of medicine with clear value propositions to patients, providers and third-party payors.
2. Summary of Significant Accounting Policies
Principles of Consolidation
The consolidated financial statements include the accounts of the Company and its wholly-owned subsidiary, Osiris Therapeutics International GmbH, which was formed in 2016. All intercompany transactions have been eliminated in consolidation. Osiris Therapeutics International GmbH does not have any operations.
Use of Estimates
We make certain estimates and assumptions in preparing our consolidated financial statements in accordance with generally accepted accounting principles in the United States ("GAAP"). These estimates and assumptions affect the reported amount of assets and liabilities, the disclosure of contingent assets and liabilities at the date of the consolidated financial statement and the reported amounts of revenue and expenses for the period presented. Actual results may differ from these estimates.
Cash and Cash Equivalents
Cash and cash equivalents includes all financial instruments purchased with an initial maturity of three months or less when purchased.
F-9
OSIRIS THERAPEUTICS, INC.
NOTES TO CONSOLIDATED FINANCIAL STATEMENTS (Continued)
2. Summary of Significant Accounting Policies (Continued)
Investments
All of the Company's investments are classified as "available-for-sale" and are carried at fair value, with the exception of the Mesoblast Limited common stock, which was classified as a trading security (see Note 4). Securities which have been classified as Level 1 are measured using quoted market prices in active markets for identical assets or liabilities while those which have been classified as Level 2 are measured using quoted prices for identical assets and liabilities in markets that are not active (see Note 4). The Company's policy is to classify all investments with contractual maturities within one year as current. Investment income is recognized when earned and reported net of investment expenses. Net unrealized holding gains or losses are excluded from earnings and are reported as "Accumulated other comprehensive income (loss)" in the accompanying consolidated balance sheets and consolidated statements of comprehensive income (loss) until realized, unless the losses are deemed to be other-than-temporary. Realized gains or losses, including any provision for other-than-temporary declines in value, are included in "Other income (expense)" in the accompanying consolidated statements of comprehensive income (loss).
If a debt security is in an unrealized loss position and the Company has the intent to sell the debt security, or it is more likely than not that the Company will have to sell the debt security before recovery of its amortized cost basis, the decline in value is deemed to be other-than-temporary and is recorded to other-than-temporary impairment losses recognized in income in the consolidated statements of comprehensive income (loss). For impaired debt securities that the Company does not intend to sell or it is more likely than not that the Company will not have to sell such securities, but the Company expects that it will not fully recover the amortized cost basis, the credit component of the other-than-temporary impairment is recognized in other-than-temporary impairment losses recognized in income in the consolidated statements of comprehensive income (loss) and the non-credit component of the other-than-temporary impairment is recognized in other comprehensive income (loss).
The credit component of an other-than-temporary impairment is determined by comparing the net present value of projected future cash flows with the amortized cost basis of the debt security. The net present value is calculated by discounting the best estimate of projected future cash flows at the effective interest rate implicit in the debt security at the date of acquisition. Cash flow estimates are driven by assumptions regarding probability of default, including changes in credit ratings, and estimates regarding timing and amount of recoveries associated with a default. Furthermore, unrealized losses entirely caused by non-credit related factors related to debt securities for which the Company expects to fully recover the amortized cost basis continue to be recognized in accumulated other comprehensive income (loss).
As of December 31, 2015, 2016 and 2017, there were no unrealized losses that the Company believed to be other-than-temporary.
Trade Receivables, net
Trade receivables, net are reported net of an allowance for doubtful accounts. We consider receivables outstanding longer than the time specified in the respective customer's contract to be past due. In making the determination of the appropriate allowance for doubtful accounts, management considers prior experience with customers, analysis of accounts receivable aging reports, changes in customer payment patterns, and historical write-offs.
F-10
OSIRIS THERAPEUTICS, INC.
NOTES TO CONSOLIDATED FINANCIAL STATEMENTS (Continued)
2. Summary of Significant Accounting Policies (Continued)
Inventory, net
Inventory, net consists of raw materials, products in process, finished goods available for sale and products held by customers under consignment sales arrangements. We determine our inventory values using the first-in, first-out method. The Company periodically reviews its quantities of inventories on hand and compares these amounts to the expected usage of each particular product. The Company records as a charge to Cost of revenue any amounts required to reduce the carrying value of inventories to net realizable value. Inventory excludes units that we anticipate distributing for clinical evaluation.
Property and Equipment, net
Property and equipment, net are valued at cost less accumulated depreciation. Depreciation is recognized on a straight-line basis over the estimated useful lives of the related assets and is allocated between cost of sales and selling, general and administrative expenses. Maintenance and repairs, which do not improve or extend the life of the respective assets, are charged to expense as incurred. Assets recorded under capital leases are included in property and equipment and are amortized using the straight-line method over the shorter of the estimated useful lives of the assets or the lease term and is recorded in depreciation expense in the consolidated statements of comprehensive income (loss).
We review long-lived assets, which consist solely of property and equipment, for impairment whenever events or changes in circumstances indicate that the carrying amount of an asset or group of assets may not be fully recoverable based on the criteria for accounting for the impairment or disposal of long-lived assets under Accounting Standard Code ("ASC") Topic 360, Property, Plant and Equipment. These events or changes in circumstances may include a significant deterioration of operating results, changes in business plans, or changes in anticipated future cash flows. If an impairment indicator is present, we evaluate recoverability by a comparison of the carrying amount of the assets group to future undiscounted net cash flows expected to be generated by the assets group. Assets are grouped at the lowest level for which there is identifiable cash flows that are largely independent of the cash flows generated by other asset groups. If the total of the expected undiscounted future cash flows is less than the carrying amount of the asset, an impairment loss is recognized for the difference between the fair value and carrying value of assets within the group. Fair value is generally determined by estimates of discounted cash flows. The discount rate used in any estimate of discounted cash flows would be the rate required for a similar investment of like risk. There were no impairment losses recognized during the years ended December 31, 2017, 2016 or 2015.
F-11
OSIRIS THERAPEUTICS, INC.
NOTES TO CONSOLIDATED FINANCIAL STATEMENTS (Continued)
2. Summary of Significant Accounting Policies (Continued)
Accrued liabilities
As of December 31, 2017, 2016 and 2015, accrued liabilities consisted of:
| |
December 31, | |||||||||
|---|---|---|---|---|---|---|---|---|---|---|
| (in $000's) |
2017 | 2016 | 2015 | |||||||
Payroll and related |
$ | 1,980 | $ | 2,170 | $ | 1,811 | ||||
Commissions |
5,651 | 4,614 | 3,754 | |||||||
Accounting and audit fees |
905 | 1,277 | 281 | |||||||
Lease liabilities |
120 | 67 | 62 | |||||||
SEC action(1) |
— | 1,500 | — | |||||||
Other |
743 | 1,373 | 1,413 | |||||||
| | | | | | | | | | | |
Total |
9,399 | 11,001 | 7,321 | |||||||
| | | | | | | | | | | |
| | | | | | | | | | | |
| | | | | | | | | | | |
- (1)
- Included as a long-term liability as of December 31, 2015. (See Note 13).
Revenue Recognition
We recognize revenue from sales of our products when title and the risk of loss pass to the customer, persuasive evidence of an arrangement exists, sales amounts are fixed or determinable and collectability is reasonably assured. In situations where collection of receivables is not reasonably assured, we recognize revenue upon the receipt of cash.
Our policy is to recognize revenue when title to the product, ownership and risk of loss transfer to the customer, which is either the date of receipt by the customer or when we receive appropriate notification that the product has been used or implanted. A provision for estimated returns, discounts, rebates and other incentives is recorded as a reduction of revenues in the same period that the revenue is recognized.
We sell our products through our internal direct sales force and our distributor network. Our distributors typically act as our selling agents, selling our products to end-use (clinical provider) customers in exchange for earning sales commissions and administrative support fees. Revenue from sales to distributors who act as agents to Osiris is recorded at the sales price to the end-use customer, and the commission expense and administrative support fees paid to the distributor are recorded as sales and marketing expenses.
At times, we enter into revenue arrangements that include multiple elements, including exclusivity provisions, participation in joint steering committees, as well as sales of our products and provisioning of various other services. We evaluate each deliverable to determine whether it represents a separate unit of accounting based on the following criteria: (i) if the delivered item has value to the customer on a standalone basis, and (ii) if the contract includes a general right of return relative to the delivered item, and delivery or performance of the undelivered item(s) is considered probable and substantially in the control of the vendor. Revenue is then allocated to the units of accounting based on an estimate of each unit's relative selling price and is recognized based on the underlying characteristics of each element.
F-12
OSIRIS THERAPEUTICS, INC.
NOTES TO CONSOLIDATED FINANCIAL STATEMENTS (Continued)
2. Summary of Significant Accounting Policies (Continued)
In December 2014, we entered into exclusive distribution agreements with a subsidiary of Stryker Corporation for the marketing and distribution of BIO4, previously branded by the Company as OvationOS, our viable bone matrix allograft. Pursuant to the agreement, Stryker has been granted worldwide distribution rights to the product and any improvements, for all surgical applications. We are responsible for supply, manufacturing, inventory management, shipments to customers, continued research and product improvement activities. We maintain all inventory and collection risk and we control the product. We recognize revenue as principal in the arrangement, for the amounts charged to end-use customers for the allografts. Commissions and administrative support fees paid to Stryker are accounted for as selling expenses, as Stryker is acting as an outside sales and marketing agent for the Company. We received an up-front payment of $5.0 million from Stryker in 2015, related to its initial exclusivity, and are entitled to additional fees upon any exercise by Stryker of its right to extend the initial term, whether on an exclusive or non-exclusive basis. The exclusivity fee is recognized as a reduction of commission expense over the four-year term of the agreement. At December 31, 2017, 2016 and 2015, we had remaining balances of $1.4 million, $2.5 million, and $3.8 million, respectively, related to the exclusivity payment of which $1.25 million was classified as other current liabilities in the consolidated balance sheets at the end of each year. The long-term portion of the exclusivity payment is included in other long-term liabilities in the consolidated balance sheets at the end of each year.
In October 2014, we entered into an exclusive marketing and sales representative agreement for our cartilage product, Cartiform, with Arthrex. The agreement provides Arthrex with exclusive commercial distribution rights to Cartiform beginning in 2015. We are responsible for manufacturing, continued research and product improvement activities. Pursuant to the agreement, Arthrex is entitled to a certain commission on Cartiform sales. We maintain all inventory and collection risk. We recognize revenue as principal in the agreement, for the amounts charged to end-use customers for the allografts. We account for the commission payment to Arthrex as sales and marketing expense, as Arthrex is acting as outside sales and marketing agent for the Company.
Research and Development Costs
R&D expenditures are charged to expense as incurred. R&D expenses include the costs of certain personnel, preclinical studies, clinical trials, regulatory affairs, biostatistical data analysis, and manufacturing costs for development of drug materials for use in clinical trials. We accrue R&D expenses for activity as incurred during the fiscal year and prior to receiving invoices from clinical sites and third party clinical research organizations.
Share-Based Compensation
We account for share-based employee compensation under the fair value recognition and measurement provisions in accordance with applicable accounting standards, which require all share-based payments to employees, including grants of stock options, to be measured based on the grant date fair value of the awards, with the resulting expense generally recognized on an accelerated basis over the period during which the employee is required to perform service in exchange for the award.
Income Taxes
We use the asset and liability method of accounting for income taxes. Deferred tax assets and liabilities are determined based on differences between the financial reporting and tax bases of assets
F-13
OSIRIS THERAPEUTICS, INC.
NOTES TO CONSOLIDATED FINANCIAL STATEMENTS (Continued)
2. Summary of Significant Accounting Policies (Continued)
and liabilities and are measured using the enacted tax rates and laws that are expected to be in effect when the differences are expected to reverse. The effect on deferred tax assets and liabilities of a change in tax rates is recognized in the period that such tax rate changes are enacted. The measurement of a deferred tax asset is reduced, if necessary, by a valuation allowance if it is more likely than not that some portion or all of the deferred tax asset will not be realized.
We use a recognition threshold and a measurement attribute for the financial statement recognition and measurement of tax positions taken or expected to be taken in a tax return. For those benefits to be recognized, a tax position must be more-likely-than-not to be sustained upon examination by taxing authorities. We recognize interest and penalties accrued on any unrecognized tax exposures as a component of income tax expense.
On December 22, 2017, the Tax Cuts and Jobs Act of 2017 (the "Tax Act") was enacted into law and the new legislation contains certain key tax provisions that affected the Company, including a reduction of the corporate income tax rate to 21% effective January 1, 2018, the repeal of Alternative Minimum Tax ("AMT") (and changes to the utilization of AMT credit carryforwards that exist at December 31, 2017), among others. We are required to recognize the effect of the tax law changes in the period of enactment, such as re-measuring our U.S. deferred tax assets and liabilities as well as reassessing the net realizability of our deferred tax assets and liabilities. In December 2017, the Securities and Exchange Commission (the "SEC") issued Staff Accounting Bulletin No. 118, Income Tax Accounting Implications of the Tax Cuts and Jobs Act (SAB 118), which allows us to record provisional amounts during a measurement period not to extend beyond one year of the enactment date. Since the Tax Act was passed late in the fourth quarter of 2017, and ongoing guidance and accounting interpretation is expected over the next 12 months, we consider the deferred tax re-measurements and other items to be incomplete due to the forthcoming guidance and our ongoing analysis of final year-end data and tax positions. We expect to complete our analysis within the measurement period in accordance with SEC Staff Accounting Bulletin No. 118, although we do not expect there to be any adjustment to the income tax expense on our statements of operations during the measurement period. See Note 12 for additional information.
Concentration of Risk
We maintain cash with high credit quality financial institutions and do not believe we are exposed to a significant credit risk, although such balances exceed federally insured limits. We also invest excess cash in investment-grade securities, generally with average maturities of approximately two years.
Accounting Pronouncements Adopted
In August 2014, the Financial Accounting Standards Board ("FASB") issued Accounting Standards Update ("ASU") 2014-15, "Presentation of Financial Statements—Going Concern (Subtopic 205-40): Disclosure of Uncertainties about an Entity's Ability to Continue as a Going Concern" ("ASU 2014-15"), that requires management to evaluate whether there are conditions and events that raise substantial doubt about the Company's ability to continue as a going concern within one year after the financial statements are issued or available to be issued on both an interim and annual basis. Management is required to provide certain footnote disclosures if it concludes that substantial doubt exists or when its plans alleviate substantial doubt about the Company's ability to continue as a going concern. ASU 2014-15 was effective for all entities for the annual period ending after December 15, 2016, and
F-14
OSIRIS THERAPEUTICS, INC.
NOTES TO CONSOLIDATED FINANCIAL STATEMENTS (Continued)
2. Summary of Significant Accounting Policies (Continued)
for annual and interim periods thereafter, with early adoption permitted. We adopted ASU 2014-15 as of the annual period ended December 31, 2016, and its adoption did not have any significant impact on our consolidated financial statements.
In July 2015, the FASB issued ASU No. 2015-11, Inventory (Topic 330), Simplifying the Measurement of Inventory. This standard replaces the lower of cost or market test with a lower of cost or net realizable value test when cost is determined on a first-in, first-out or average cost basis. We adopted this standard in the first quarter of 2017 on a prospective basis. The adoption of this standard did not have a material impact on our consolidated financial statements.
In November 2015, the FASB issued ASU 2015-17, Balance Sheet Classification of Deferred Taxes. The new guidance requires that all deferred taxes be presented as noncurrent, rather than separated into current and noncurrent amounts. We adopted this guidance in the first quarter of fiscal year 2015 on a prospective basis. The adoption of this standard did not have a material impact on our financial position.
In March 2016, the FASB issued ASU 2016-09, "Compensation—Stock Compensation Topic 718: Improvements to Employee Share-Based Payment Accounting", which is intended to simplify several aspects of the accounting for share-based payment transactions, including the income tax consequences, classification of awards as either equity or liabilities, and classification on the statement of cash flows. We adopted this guidance as of January 1, 2017. From January 1, 2017 onward, in accordance with the new guidance, no excess tax benefits or tax deficiencies will be recognized in additional paid in capital. We presented the impact of classifying excess tax benefits as an operating activity in the consolidated statement of cash flows beginning in 2017 and prior periods were not adjusted. We will continue to estimate forfeitures and recognize expense, net of estimated forfeitures. The adoption of the remaining amendments did not have a material impact on our consolidated financial statements.
Accounting Pronouncements Not Yet Adopted
In May 2014, the FASB issued ASU No. 2014-09, "Revenue from Contracts with Customers (Topic 606)". The ASU outlines a single set of comprehensive principles for recognizing revenue under U.S. GAAP and supersedes existing revenue recognition guidance. The main principle of the ASU is that revenue should be recognized to depict the transfer of promised goods or services to customers in an amount that reflects the consideration to which the entity expects to be entitled in exchange for those goods or services. The Company will apply the ASU and its related updates on a modified retrospective basis as of January 1, 2018. The Company has completed a comprehensive assessment of customer contracts and evaluated the effect the ASU will have on the Company's financial statements and related disclosures. The Company has concluded that the adoption of the ASU will not have a material impact on the consolidated financial statements. As such, no cumulative catch-up adjustment will be recorded. The primary impact of adoption will be expanded disclosures that will enable users to better understand the nature, amount, timing, and uncertainty of revenues and cash flows arising from contracts with customers. Additionally, the Company has made appropriate revisions to its accounting policies, procedures, and the design of our internal controls, which took effect starting January 1, 2018, to comply with the effective date of the standard.
In January 2016, the FASB issued ASU 2016-01, "Financial Instruments—Overall (Subtopic 825-10): Recognition and Measurement of Financial Assets and Financial Liabilities," which requires various changes to the measurement and disclosure of equity investments. Among a number of changes,
F-15
OSIRIS THERAPEUTICS, INC.
NOTES TO CONSOLIDATED FINANCIAL STATEMENTS (Continued)
2. Summary of Significant Accounting Policies (Continued)
ASU 2016-01 will eliminate the available-for-sale classification for equity securities with readily determinable fair values, and any changes in fair value of those equity securities will be included as an adjustment to earnings, rather than other comprehensive income (loss). The ASU will be adopted by the Company in the first quarter of 2018. As the Company does not hold any equity securities at December 31, 2017, the ASU will not have any impact upon adoption.
In February 2016, the FASB issued ASU No. 2016-02, "Leases (Topic 842)". The ASU requires, among other things, a lessee to recognize assets and liabilities associated with the rights and obligations attributable to most leases but also recognize expenses similar to current lease accounting. The ASU also requires certain qualitative and quantitative disclosures designed to assess the amount, timing and uncertainty of cash flows arising from leases, along with additional key information about leasing arrangements. The guidance is effective for fiscal years, and interim periods within those fiscal years, beginning after December 15, 2018. The new guidance must be adopted using a modified retrospective transition and provides for certain practical expedients. The Company is in the process of analyzing initial data gathered to evaluate the impact of adopting the ASU on its consolidated financial statements, the related systems required to capture the increased reporting and disclosures associated with the ASU, and its use of practical expedients. The Company will apply the ASU and its related updates on a modified retrospective basis as of January 1, 2019. The adoption of the guidance will likely have a material effect on the consolidated balance sheets, resulting in the recording of an operating lease asset and liability.
In June 2016, the FASB issued ASU 2016-13, "Financial Instruments—Credit Losses Topic 326". The guidance eliminates the probable initial recognition threshold that was previously required prior to recognizing a credit loss on financial instruments. The credit loss estimate can now reflect an entity's current estimate of all future expected credit losses. Under the previous guidance, an entity only considered past events and current conditions. The guidance is effective for fiscal years beginning after December 15, 2019, including interim periods within those fiscal years. Early adoption is permitted for fiscal years beginning after December 15, 2018, including interim periods within those fiscal years. The adoption of certain amendments of this guidance must be applied on a modified retrospective basis and the adoption of the remaining amendments must be applied on a prospective basis. We currently expect that the adoption of this guidance will likely change the way we assess the collectability of our receivables and recoverability of other financial instruments. We have not yet begun to evaluate the specific impacts of this guidance nor have we determined the manner in which we will adopt this guidance.
In August 2016, the FASB issued ASU No. 2016-15, "Statement of Cash Flows (Topic 203)". The ASU addresses eight specific cash flow issues and clarifies their presentation and classification in the statement of cash flows. The ASU is effective for fiscal years beginning after December 15, 2017 and is to be applied retrospectively. The Company concluded that the adoption of the ASU will not have a material impact on the consolidated financial statements and will apply the ASU and its related updates beginning in the first quarter of 2018.
F-16
OSIRIS THERAPEUTICS, INC.
NOTES TO CONSOLIDATED FINANCIAL STATEMENTS (Continued)
3. Investments
Our investments consisted of the following as of December 31, 2017, 2016 and 2015:
| |
December 31, 2017 | ||||||||||||
|---|---|---|---|---|---|---|---|---|---|---|---|---|---|
| (in $000's) |
Amortized cost |
Gross unrealized gains |
Gross unrealized losses |
Estimated fair Value |
|||||||||
U.S. government agencies |
$ | 6,077 | $ | — | $ | (73 | ) | $ | 6,004 | ||||
Obligations of government sponsored enterprises(1) |
3,737 | — | (31 | ) | 3,706 | ||||||||
Corporate debt securities |
12,479 | 21 | (66 | ) | 12,434 | ||||||||
Foreign government bonds |
2,689 | — | (26 | ) | 2,663 | ||||||||
| | | | | | | | | | | | | | |
Total |
$ | 24,982 | $ | 21 | $ | (196 | ) | $ | 24,807 | ||||
| | | | | | | | | | | | | | |
| | | | | | | | | | | | | | |
| | | | | | | | | | | | | | |
- (1)
- Includes investments in notes issued by the Federal Home Loan Bank and the Federal Farm Credit Bank.
| |
December 31, 2016 | ||||||||||||
|---|---|---|---|---|---|---|---|---|---|---|---|---|---|
| (in $000's) |
Amortized cost |
Gross unrealized gains |
Gross unrealized losses |
Estimated fair Value |
|||||||||
U.S. government agencies |
$ | 5,124 | $ | 3 | $ | (32 | ) | $ | 5,095 | ||||
Obligations of government sponsored enterprises(1) |
2,601 | — | (25 | ) | 2,576 | ||||||||
Corporate debt securities |
11,983 | 29 | (27 | ) | 11,985 | ||||||||
Foreign government bonds |
4,176 | 8 | (11 | ) | 4,173 | ||||||||
| | | | | | | | | | | | | | |
Total |
$ | 23,884 | $ | 40 | $ | (95 | ) | $ | 23,829 | ||||
| | | | | | | | | | | | | | |
| | | | | | | | | | | | | | |
| | | | | | | | | | | | | | |
- (1)
- Includes investments in notes issued by the Federal Home Loan Bank and the Federal Farm Credit Bank.
| |
December 31, 2015 | ||||||||||||
|---|---|---|---|---|---|---|---|---|---|---|---|---|---|
| (in $000's) |
Amortized cost |
Gross unrealized gains |
Gross unrealized losses |
Estimated fair Value |
|||||||||
U.S. government agencies |
$ | 6,613 | $ | — | $ | (12 | ) | $ | 6,601 | ||||
Obligations of government sponsored enterprises(1) |
2,559 | — | (35 | ) | 2,524 | ||||||||
Corporate debt securities |
11,641 | 1 | (82 | ) | 11,560 | ||||||||
Foreign government bonds |
4,139 | 2 | (17 | ) | 4,124 | ||||||||
| | | | | | | | | | | | | | |
Total |
$ | 24,952 | $ | 3 | $ | (146 | ) | $ | 24,809 | ||||
| | | | | | | | | | | | | | |
| | | | | | | | | | | | | | |
| | | | | | | | | | | | | | |
- (1)
- Includes investments in notes issued by the Federal Home Loan Bank and the Federal Farm Credit Bank.
F-17
OSIRIS THERAPEUTICS, INC.
NOTES TO CONSOLIDATED FINANCIAL STATEMENTS (Continued)
3. Investments (Continued)
The following tables summarize the securities with unrealized losses, aggregated by investment category and length of time that individual securities have been in a continuous unrealized loss position, as of December 31, 2017, 2016 and 2015:
| |
December 31, 2017 | ||||||||||||||||||
|---|---|---|---|---|---|---|---|---|---|---|---|---|---|---|---|---|---|---|---|
| |
Less than 12 Months | 12 Months or More | Total | ||||||||||||||||
| (in $000's) |
Fair Value | Unrealized Loss |
Fair Value | Unrealized Loss |
Fair Value | Unrealized Loss, net |
|||||||||||||
U.S. government agencies |
$ | 1,073 | $ | (3 | ) | $ | 4,931 | $ | (70 | ) | $ | 6,004 | $ | (73 | ) | ||||
Obligations of government sponsored enterprises(1) |
1,298 | (6 | ) | 2,408 | (25 | ) | 3,706 | (31 | ) | ||||||||||
Corporate debt securities |
1,920 | (3 | ) | 10,514 | (43 | ) | 12,434 | (46 | ) | ||||||||||
Foreign government bonds |
597 | (3 | ) | 2,066 | (22 | ) | 2,663 | (25 | ) | ||||||||||
| | | | | | | | | | | | | | | | | | | | |
Total |
$ | 4,888 | $ | (15 | ) | $ | 19,919 | $ | (160 | ) | $ | 24,807 | $ | (175 | ) | ||||
| | | | | | | | | | | | | | | | | | | | |
| | | | | | | | | | | | | | | | | | | | |
| | | | | | | | | | | | | | | | | | | | |
- (1)
- Includes investments in notes issued by the Federal Home Loan Bank and the Federal Farm Credit Bank.
| |
December 31, 2016 | ||||||||||||||||||
|---|---|---|---|---|---|---|---|---|---|---|---|---|---|---|---|---|---|---|---|
| |
Less than 12 Months | 12 Months or More | Total | ||||||||||||||||
| (in $000's) |
Fair Value | Unrealized Gain |
Fair Value | Unrealized Loss |
Fair Value | Unrealized Gain (Loss), net |
|||||||||||||
U.S. government agencies |
$ | 400 | $ | — | $ | 4,695 | $ | (30 | ) | $ | 5,095 | $ | (30 | ) | |||||
Obligations of government sponsored enterprises(1) |
— | — | 2,576 | (25 | ) | 2,576 | (25 | ) | |||||||||||
Corporate debt securities |
1,516 | 3 | 10,470 | — | 11,986 | 3 | |||||||||||||
Foreign government bonds |
2,442 | 7 | 1,730 | (10 | ) | 4,172 | (3 | ) | |||||||||||
| | | | | | | | | | | | | | | | | | | | |
Total |
$ | 4,358 | $ | 10 | $ | 19,471 | $ | (65 | ) | $ | 23,829 | $ | (55 | ) | |||||
| | | | | | | | | | | | | | | | | | | | |
| | | | | | | | | | | | | | | | | | | | |
| | | | | | | | | | | | | | | | | | | | |
- (1)
- Includes investments in notes issued by the Federal Home Loan Bank and the Federal Farm Credit Bank.
F-18
OSIRIS THERAPEUTICS, INC.
NOTES TO CONSOLIDATED FINANCIAL STATEMENTS (Continued)
3. Investments (Continued)
| |
December 31, 2015 | ||||||||||||||||||
|---|---|---|---|---|---|---|---|---|---|---|---|---|---|---|---|---|---|---|---|
| |
Less than 12 Months | 12 Months or More | Total | ||||||||||||||||
| (in $000's) |
Fair Value | Unrealized Loss |
Fair Value | Unrealized Loss |
Fair Value | Unrealized Loss |
|||||||||||||
U.S. government agencies |
$ | 4,174 | $ | (4 | ) | $ | 2,427 | $ | (7 | ) | $ | 6,601 | $ | (11 | ) | ||||
Obligations of government sponsored enterprises(1) |
— | — | 2,524 | (35 | ) | 2,524 | (35 | ) | |||||||||||
Corporate debt securities |
1,429 | (5 | ) | 10,132 | (76 | ) | 11,561 | (81 | ) | ||||||||||
Foreign government bonds |
— | 4,123 | (16 | ) | 4,123 | (16 | ) | ||||||||||||
| | | | | | | | | | | | | | | | | | | | |
Total |
$ | 5,603 | $ | (9 | ) | $ | 19,206 | $ | (134 | ) | $ | 24,809 | $ | (143 | ) | ||||
| | | | | | | | | | | | | | | | | | | | |
| | | | | | | | | | | | | | | | | | | | |
| | | | | | | | | | | | | | | | | | | | |
- (1)
- Includes investments in notes issued by the Federal Home Loan Bank and the Federal Farm Credit Bank.
The following table summarizes maturities of our investments available-for-sale as of December 31, 2017:
| |
December 31, 2017 | ||||||
|---|---|---|---|---|---|---|---|
| (in $000's) |
Cost | Fair Value | |||||
Maturities: |
|||||||
Within 1 year |
$ | 4,904 | $ | 4,889 | |||
After 1 year through 5 years |
20,078 | 19,918 | |||||
| | | | | | | | |
Total investments available for sale |
$ | 24,982 | $ | 24,807 | |||
| | | | | | | | |
| | | | | | | | |
| | | | | | | | |
Realized losses, net of investment income were $2.0 million, $8 thousand, and $2.5 million, for the years ended December 31, 2017, 2016 and 2015, respectively, and have been included as a component of "Other income (expense) net," in the accompanying consolidated statements of comprehensive income (loss). Realized losses for the years ended December 31, 2017 and 2015 include losses on sale of Mesoblast Limited common stock of 1.9 million and $2.6 million, respectively, which was classified as a trading security (see Note 4).
4. Discontinued Operations
In October 2013, we sold our therapeutics business, including Prochymal, a stem cell drug for treatment of graft versus host disease, and related assets, to Mesoblast International SARL ("Mesoblast"), a wholly-owned subsidiary of Mesoblast Limited. The agreement with Mesoblast provided for the receipt of $50 million in initial consideration and up to an additional $50 million in payments upon Mesoblast achieving certain clinical and regulatory milestones. In addition, we were entitled to earn royalties on future sales by Mesoblast of Prochymal and other products utilizing the acquired technology. We received all of the initial consideration by April 2014, consisting of $35 million in cash and $15 million of Mesoblast Limited common stock which we classified as a trading security. The Mesoblast Limited common stock was subject to a holding period which was ultimately extended to May 2015. During this holding period, Mesoblast Limited provided us limited protection against a decline in the market value of the stock. In May 2015, concurrent with the expiration of the holding period, Mesoblast paid us $6.2 million representing the decline in the market value of the stock
F-19
OSIRIS THERAPEUTICS, INC.
NOTES TO CONSOLIDATED FINANCIAL STATEMENTS (Continued)
4. Discontinued Operations (Continued)
through that date. Later in 2015, we sold all of the Mesoblast Limited common stock for $6.8 million, resulting in a realized loss of $2.6 million which was recorded in other income (expense), net in our consolidated statement of comprehensive income (loss) for the year ended December 31, 2015.
As noted above, in connection with the sale of our therapeutics business to Mesoblast, we are entitled to receive contingent consideration as a result of Mesoblast achieving certain milestones. In July 2017, the company settled any and all contingent consideration due from Mesoblast in regards to the sale of the therapeutics business. As part of the settlement, we received contingent consideration of $10.0 million in Mesoblast Limited common stock (classified as a trading security) and $350 thousand in cash as a milestone payment. We recorded income of $10.0 million, net of $0.3 million in income tax expense, in discontinued operations in 2017. All of the Mesoblast Limited common stock was sold in 2017, resulting in a loss of approximately $1.9 million, which was reported in other income (expense), net in our consolidated statement of comprehensive income (loss) for the year ended December 31, 2017.
5. Inventory, net
Inventory, net consists of the following:
| |
December 31, | |||||||||
|---|---|---|---|---|---|---|---|---|---|---|
| (in $000's) |
2017 | 2016 | 2015 | |||||||
Raw materials and supplies |
$ | 1,330 | $ | 1,406 | $ | 1,054 | ||||
Work-in-process |
5,605 | 6,880 | 4,104 | |||||||
Finished goods |
6,350 | 5,524 | 7,022 | |||||||
| | | | | | | | | | | |
|
13,285 | 13,810 | 12,180 | |||||||
Reserve for excess and obsolete inventory |
(2,007 |
) |
(2,444 |
) |
(2,603 |
) |
||||
| | | | | | | | | | | |
Inventory, net |
$ | 11,278 | $ | 11,366 | $ | 9,577 | ||||
| | | | | | | | | | | |
| | | | | | | | | | | |
| | | | | | | | | | | |
Work-in-process inventory is largely product that is in quarantine pending completion of our quality assurance procedures. Finished goods inventory includes gross consigned inventory of $1.5 million, $1.8 million and $1.7 million as of December 31, 2017, 2016 and 2015, respectively. This consigned finished goods inventory was reduced by reserves of $0.6 million, $1.2 million and $1.0 million as of December 31, 2017, 2016 and 2015, respectively.
F-20
OSIRIS THERAPEUTICS, INC.
NOTES TO CONSOLIDATED FINANCIAL STATEMENTS (Continued)
6. Property and Equipment, net
Property and equipment, net consisted of the following:
| |
|
December 31, | ||||||||||
|---|---|---|---|---|---|---|---|---|---|---|---|---|
| |
Depreciable Life (in years) |
|||||||||||
| (in $000's) |
2017 | 2016 | 2015 | |||||||||
Laboratory and manufacturing equipment |
3-7 | $ | 3,083 | $ | 2,451 | $ | 1,709 | |||||
Computer hardware, furniture and fixtures |
3-7 | 1,134 | 1,121 | 1,076 | ||||||||
Leasehold improvements |
(A) | 6,344 | 5,104 | 4,756 | ||||||||
| | | | | | | | | | | | | |
|
10,561 | 8,676 | 7,541 | |||||||||
Accumulated depreciation and amortization |
(6,974 | ) | (6,286 | ) | (5,464 | ) | ||||||
| | | | | | | | | | | | | |
Property and equipment, net |
$ | 3,587 | $ | 2,390 | $ | 2,077 | ||||||
| | | | | | | | | | | | | |
| | | | | | | | | | | | | |
| | | | | | | | | | | | | |
- (A)
- Shorter of economic life or lease term.
Depreciation expense was $0.7 million, $1.0 million, and $1.0 million for the years ended December 31, 2017, 2016 and 2015, respectively.
7. Dividend
On September 16, 2015, the Board declared a special cash dividend of $0.20 per common share payable to stockholders of record as of October 16, 2015. The special dividend, in the aggregate amount of $6.9 million, was paid on October 30, 2015. As we had an accumulated deficit at the time the dividends were declared, these dividends were recorded as a reduction to additional paid-in capital.
8. Share-Based Compensation and Employee Benefit Plans
In April 2006, we adopted our 2006 Omnibus Plan. We amended and restated this plan in 2008, 2010, 2012 and 2014, in each case to, among other things, increase the number of shares available for grant (the "Amended and Restated 2006 Omnibus Plan"). As a result of the 2014 amendment, the Amended and Restated 2006 Omnibus Plan has a termination date of May 2024. In addition, we had previously established our Amended and Restated 1994 Stock Incentive Plan. Both plans authorize the issuance of various forms of stock-based awards, including incentive and non-qualified stock options, stock purchase rights, stock appreciation rights and restricted and unrestricted stock awards. A total of 3,000,000 shares of our common stock have been reserved for issuance under the Amended and Restated 2006 Omnibus Plan, and 736,378 shares are reserved under our Amended and Restated 1994 Stock Incentive Plan. We ceased all grants under the Amended and Restated 1994 Stock Incentive Plan concurrent with our initial public offering in August 2006. As a result, no shares are currently available for future awards under the Amended and Restated 1994 Stock Incentive Plan. At December 31, 2017, there were approximately 1,431,209 shares available for future awards under the Amended and Restated 2006 Omnibus Plan.
F-21
OSIRIS THERAPEUTICS, INC.
NOTES TO CONSOLIDATED FINANCIAL STATEMENTS (Continued)
8. Share-Based Compensation and Employee Benefit Plans (Continued)
A summary of stock option activity for the years ended December 31, 2017, 2016 and 2015 is as follows:
| |
Number of Options (in thousands) |
Weighted Average Exercise Price |
Weighted Average Remaining Contractual Life (in years) |
Aggregate Intrinsic Value(1) (in $000's) |
|||||||||
|---|---|---|---|---|---|---|---|---|---|---|---|---|---|
Outstanding at January 1, 2015 |
1,609 | $ | 12.01 | ||||||||||
Granted |
234 | 17.68 | |||||||||||
Exercised |
(179 | ) | 7.46 | ||||||||||
Forfeited or cancelled |
(149 | ) | 14.30 | ||||||||||
| | | | | | | | | | | | | | |
Outstanding at December 31, 2015 |
1,515 | 13.20 | |||||||||||
Granted |
55 | 5.48 | |||||||||||
Exercised |
(30 | ) | 5.09 | ||||||||||
Forfeited or cancelled |
(700 | ) | 13.99 | ||||||||||
| | | | | | | | | | | | | | |
Outstanding December 31, 2016 |
840 | 12.33 | |||||||||||
Granted |
109 | 6.77 | |||||||||||
Exercised |
(25 | ) | 5.14 | ||||||||||
Forfeited or cancelled |
(258 | ) | 13.13 | ||||||||||
Expired |
(43 | ) | 7.83 | ||||||||||
| | | | | | | | | | | | | | |
Outstanding at December 31, 2017 |
623 | $ | 11.63 | 6.4 | $ | 34 | |||||||
| | | | | | | | | | | | | | |
| | | | | | | | | | | | | | |
| | | | | | | | | | | | | | |
Vested at December 31, 2017 |
419 | $ | 12.02 | 5.5 | $ | 34 | |||||||
| | | | | | | | | | | | | | |
| | | | | | | | | | | | | | |
| | | | | | | | | | | | | | |
Vested and expected to vest at December 31, 2017 |
528 | $ | 12.23 | 6.2 | $ | 34 | |||||||
| | | | | | | | | | | | | | |
| | | | | | | | | | | | | | |
| | | | | | | | | | | | | | |
- (1)
- The aggregate intrinsic value is based upon the difference between the Company's closing stock price at the date of the Consolidated Balance Sheet and the exercise price of the stock option for in-the-money stock options. The intrinsic value of outstanding stock options fluctuates based upon the trading value of the Company's Common stock.
The weighted-average grant date fair value of stock options granted during the years ended December 31, 2017, 2016 and 2015 was $4.42, $2.48 and $11.31, respectively. The total fair value of shares vested during the years ended December 31, 2017, 2016 and 2015 was $1.0 million, $1.9 million and $2.1 million, respectively.
F-22
OSIRIS THERAPEUTICS, INC.
NOTES TO CONSOLIDATED FINANCIAL STATEMENTS (Continued)
8. Share-Based Compensation and Employee Benefit Plans (Continued)
Options outstanding at December 31, 2017 are summarized below:
| |
Options Outstanding | Options Exercisable | ||||||||||||||
|---|---|---|---|---|---|---|---|---|---|---|---|---|---|---|---|---|
Range of Exercise Prices
|
Number Outstanding (in thousands) |
Weighted Average Remaining Contractual Life (in years) |
Weighted Average Exercise Price |
Number Outstanding (in thousands) |
Weighted Average Exercise Price |
|||||||||||
$4.01-$7.25 |
185 | 7.2 | $ | 6.46 | 76 | $ | 6.03 | |||||||||
$7.26-$12.75 |
112 | 5.0 | 9.20 | 107 | 9.03 | |||||||||||
$12.76-$16.00 |
176 | 6.5 | 14.13 | 129 | 14.10 | |||||||||||
$16.01-$19.36 |
150 | 6.2 | 16.89 | 107 | 16.77 | |||||||||||
| | | | | | | | | | | | | | | | | |
|
623 | 6.4 | $ | 11.63 | 419 | $ | 12.02 | |||||||||
| | | | | | | | | | | | | | | | | |
| | | | | | | | | | | | | | | | | |
| | | | | | | | | | | | | | | | | |
We estimated the fair value of stock options using the Black-Scholes option-pricing model. Fair value is amortized on an accelerated basis over the requisite service periods of the awards. We generally issue stock option awards that vest over four years and have a ten-year contractual life. The fair value of stock options granted during each of the years was estimated using the following weighted-average assumptions:
| |
Year ended December 31, |
|||||||||
|---|---|---|---|---|---|---|---|---|---|---|
| |
2017 | 2016 | 2015 | |||||||
Interest rate |
2.0 | % | 1.0 | % | 1.8 | % | ||||
Dividend yield |
0.0 | % | 0.0 | % | 0.0 | % | ||||
Term (in years) |
6.2 | 3.7 | 6.2 | |||||||
Volatility |
71.9 | % | 67.4 | % | 69.4 | % | ||||
Interest Rate—The risk-free interest rate was determined using the yield available for zero-coupon United States government issues with a remaining term approximating the expected life of the options.
Dividend—On September 16, 2015, we declared a non-recurring, special cash dividend to shareholders. We do not expect to pay a dividend in the foreseeable future, and as such, the expected dividend yield is zero.
Term—Since the Company has limited option exercise history, it has generally elected to estimate the expected life of an award based upon the SEC-approved "simplified method" noted under the provisions of Staff Accounting Bulletin No. 107 with the continued use of this method extended under the provisions of Staff Accounting Bulletin No. 110.
Volatility—Expected volatility is based on the historical volatility of the Company's common stock, which we believe will be indicative of future experience.
The table below reflects the total share-based compensation expense (benefit), including the expense (benefit) related to share-based payments to our non-employee directors, recognized in our statements of comprehensive loss for the years ended December 31, 2017, 2016 and 2015. Share-based
F-23
OSIRIS THERAPEUTICS, INC.
NOTES TO CONSOLIDATED FINANCIAL STATEMENTS (Continued)
8. Share-Based Compensation and Employee Benefit Plans (Continued)
compensation benefit is the result of the cancellation of option awards prior to vesting for which compensation expense had previously been recorded.
| |
Year ended December 31, | |||||||||
|---|---|---|---|---|---|---|---|---|---|---|
| (in $000's) |
2017 | 2016 | 2015 | |||||||
Cost of product revenue |
$ | 51 | $ | 109 | $ | 187 | ||||
Sales and marketing |
(17 | ) | (6 | ) | 1,383 | |||||
Research and development |
123 | 150 | 218 | |||||||
General and administrative |
(58 | ) | (594 | ) | 1,026 | |||||
| | | | | | | | | | | |
Total |
$ | 99 | $ | (341 | ) | $ | 2,814 | |||
| | | | | | | | | | | |
| | | | | | | | | | | |
| | | | | | | | | | | |
As of December 31, 2017, there was $0.2 million of total unrecognized compensation expense related to non-vested stock options, which is expected to be recognized over a weighted-average period of 1.4 years. We estimate expected forfeitures and recognize expense only for those option grants expected to vest. Our estimate of expected forfeitures may be adjusted throughout the requisite service period based on the extent to which actual forfeitures differ, or are likely to differ, from our previous estimates. At the end of the service period, compensation cost will have been recognized only for those awards for which the employee has provided the requisite service.
401(k) Plan
We sponsor a 401(k) plan. We match employee contributions based upon the amount of the employees' contributions, subject to certain limitations and vesting requirements, and we may make a discretionary contribution. Company matching contributions to the 401(k) plan totaled $0.4 million, $0.4 million and $25 thousand for the years ended December 31, 2017, 2016 and 2015, respectively. There were no discretionary contributions made in 2017, 2016 or 2015.
Basic net earnings per share ("EPS") is calculated by dividing net earnings (loss) by the weighted average number of common shares outstanding for the applicable period. Diluted net EPS is computed based on the weighted average number of common shares outstanding increased by the number of additional shares that would have been outstanding had the potentially dilutive common shares been issued and reduced by the number of shares the Company could have repurchased with the proceeds from the issuance of the potentially dilutive shares. As a result of our net losses from continuing operation for the years ended December 31, 2017, 2016 and 2015, potentially dilutive stock options of approximately 0.7 million, 0.8 million and 1.5 million, respectively, were considered anti-dilutive and were excluded from the computation of diluted EPS. Potentially dilutive stock options of approximately 0.7 million were considered anti-dilutive and were excluded from the computation of diluted EPS from discontinued operations for the year ended December 31, 2017.
10. Financial Instruments and Fair Value
Fair value is defined as the price at which an asset could be exchanged or a liability transferred (an exit price) in an orderly transaction between knowledgeable, willing parties in the principal or most advantageous market for the asset or liability. Where available, fair value is based on observable
F-24
OSIRIS THERAPEUTICS, INC.
NOTES TO CONSOLIDATED FINANCIAL STATEMENTS (Continued)
10. Financial Instruments and Fair Value (Continued)
market prices or parameters or derived from such prices or parameters. Where observable prices or inputs are not available, valuation models are applied.
Financial assets recorded at fair value in the accompanying financial statements are categorized based upon the level of judgment associated with the inputs used to measure their fair value. The levels are directly related to the amount of subjectivity associated with the inputs to fair valuation of these assets and liabilities, and are as follows:
| Level 1 | Inputs are unadjusted, quoted prices in active markets for identical assets at the reporting date. Active markets are those in which transactions for the asset or liability occur in sufficient frequency and volume to provide pricing information on an ongoing basis. | |
Level 2 |
Inputs are other than quoted prices included in Level 1, which are either directly or indirectly observable for the asset or liability through correlation with market data at the reporting date and for the duration of the instrument's anticipated life. |
|
Level 3 |
Unobservable inputs that are supported by little or no market activity and that are significant to the fair value of the assets or liabilities and which reflect management's best estimate of what market participants would use in pricing the asset or liability at the reporting date. Consideration is given to the risk inherent in the valuation technique and the risk inherent in the inputs to the model. |
When quoted prices in active markets for identical assets are available, we use these quoted market prices to determine the fair value of financial assets and classify these assets as Level 1. In other cases where a quoted market price for identical assets in an active market is either not available or not observable, we obtain the fair value from a third-party vendor that uses pricing models, such as matrix pricing, to determine fair value. These financial assets would then be classified as Level 2. In the event quoted market prices were not available, we would determine fair value using broker quotes or an internal analysis of each investment's financial statements and cash flow projections. In these instances, financial assets would be classified based upon the lowest level of input that is significant to the valuation. Thus, financial assets might be classified in Level 3 even though there could be some significant inputs that may be readily available.
Assets and liabilities measured at fair value on a recurring basis are summarized below as of December 31, 2017, 2016 and 2015:
| |
December 31, 2017 | ||||||||||||
|---|---|---|---|---|---|---|---|---|---|---|---|---|---|
| (in $000's) |
Level 1 | Level 2 | Level 3 | Total | |||||||||
Assets |
|||||||||||||
Investments: Available for Sale Securities |
|||||||||||||
U.S. government agencies |
$ | — | $ | 6,004 | $ | — | 6,004 | ||||||
Obligations of government sponsored enterprises |
— | 3,706 | — | 3,706 | |||||||||
Corporate debt securities |
— | 12,434 | — | 12,434 | |||||||||
Foreign government bonds |
— | 2,663 | — | 2,663 | |||||||||
| | | | | | | | | | | | | | |
Total investments |
$ | — | $ | 24,807 | $ | — | $ | 24,807 | |||||
| | | | | | | | | | | | | | |
| | | | | | | | | | | | | | |
| | | | | | | | | | | | | | |
F-25
OSIRIS THERAPEUTICS, INC.
NOTES TO CONSOLIDATED FINANCIAL STATEMENTS (Continued)
10. Financial Instruments and Fair Value (Continued)
| |
December 31, 2016 | ||||||||||||
|---|---|---|---|---|---|---|---|---|---|---|---|---|---|
| (in $000's) |
Level 1 | Level 2 | Level 3 | Total | |||||||||
Assets |
|||||||||||||
Investments: Available for Sale Securities |
|||||||||||||
U.S. government agencies |
$ | — | $ | 5,095 | $ | — | $ | 5,095 | |||||
Obligations of government sponsored enterprises |
— | 2,576 | — | 2,576 | |||||||||
Corporate debt securities |
— | 11,985 | — | 11,985 | |||||||||
Foreign government bonds |
— | 4,173 | — | 4,173 | |||||||||
| | | | | | | | | | | | | | |
Total investments |
$ | — | $ | 23,829 | $ | — | $ | 23,829 | |||||
| | | | | | | | | | | | | | |
| | | | | | | | | | | | | | |
| | | | | | | | | | | | | | |
| |
December 31, 2015 | ||||||||||||
|---|---|---|---|---|---|---|---|---|---|---|---|---|---|
| (in $000's) |
Level 1 | Level 2 | Level 3 | Total | |||||||||
Assets |
|||||||||||||
Investments: Available for Sale Securities |
|||||||||||||
U.S. government agencies |
$ | — | $ | 6,601 | $ | — | $ | 6,601 | |||||
Obligations of government sponsored enterprises |
— | 2,524 | — | 2,524 | |||||||||
Corporate debt securities |
— | 11,560 | — | 11,560 | |||||||||
Foreign government bonds |
— | 4,124 | — | 4,124 | |||||||||
| | | | | | | | | | | | | | |
Total investments |
$ | — | $ | 24,809 | $ | — | $ | 24,809 | |||||
| | | | | | | | | | | | | | |
| | | | | | | | | | | | | | |
| | | | | | | | | | | | | | |
For the years ended December 31, 2017, 2016 and 2015 the Company did not transfer any assets between fair value levels.
The carrying value of financial instruments, including trade receivables, accounts payable, and accrued liabilities approximates fair value because of the short-term maturity of these items. The estimated fair value of the Company's capital lease obligations also approximates their carrying values, which was based on current interest rates for similar types of borrowings and is in Level 2 of the fair value hierarchy. The estimated fair values may not represent actual values of the financial instruments that could be realized as of the balance sheet date or that will be realized in the future.
All of the Company's investments at each year end are classified as "available-for-sale" and are carried at fair value.
11. Related Party Transactions
BioForceRX LLC. The Company paid BioForceRX LLC, a professional recruiting and consulting firm, approximately $129,500 in 2015 for various recruiting services, primarily involving the Company's sales force, pursuant to a Contingency Recruitment Services and Fee Agreement, dated 2014 (the "Recruitment Agreement"). The owner of BioForceRX LLC was Kathleen Czworka, the spouse of Frank Czworka, the Company's former Vice President and General Manager of Wound Care from August 2011 to February 2016. Mr. Czworka also served as the Company's Chief Operating Officer from February 2, 2016 until March 6, 2016 when the Chief Operating Officer position was eliminated. The parties agreed to terminate the Recruitment Agreement by a letter agreement, dated July 7, 2016, under which the Company paid $32,000 as full payment for all outstanding fees and expenses.
F-26
OSIRIS THERAPEUTICS, INC.
NOTES TO CONSOLIDATED FINANCIAL STATEMENTS (Continued)
11. Related Party Transactions (Continued)
Peter Friedli. In connection with the restatement of the Company's 2014 financial statements included in the Amendment to its Annual Report on Form 10-K for the year ended December 31, 2014, the Audit Committee evaluated certain issues related to director expense reimbursements. On the basis of that review, the Audit Committee determined that certain requests for reimbursement submitted between 2012 and 2015 by the Company's Chairman of the Board to the Company's former Chief Financial Officer should not have been paid. In December 2016, the Chairman returned to the Company $216 thousand representing the full amount that the Audit Committee determined should not have been paid. The $216 thousand was recorded in prepaid and other current assets as of December 31, 2015.
12. Income Taxes
The benefit and expense for income taxes consisted of the following:
| |
Year ended December 31, | |||||||||
|---|---|---|---|---|---|---|---|---|---|---|
| (in $000's) |
2017 | 2016 | 2015 | |||||||
Current: |
||||||||||
Federal |
$ | (1,526 | ) | $ | — | $ | (3 | ) | ||
State |
128 | 104 | 547 | |||||||
| | | | | | | | | | | |
Total current provision |
(1,398 | ) | 104 | 544 | ||||||
Deferred: |
||||||||||
Federal |
— | (31 | ) | — | ||||||
State |
— | (3 | ) | — | ||||||
| | | | | | | | | | | |
Total deferred (benefit) expense |
— | (34 | ) | — | ||||||
| | | | | | | | | | | |
Income tax (benefit) expense |
$ | (1,398 | ) | $ | 70 | $ | 544 | |||
| | | | | | | | | | | |
| | | | | | | | | | | |
| | | | | | | | | | | |
A reconciliation of the federal statutory rate to the effective income tax rate is as follows:
| |
Year ended December 31, | |||||||||
|---|---|---|---|---|---|---|---|---|---|---|
| |
2017 | 2016 | 2015 | |||||||
Federal income tax rate |
35.0 | % | 35.0 | % | 35.0 | % | ||||
State income taxes |
0.9 | % | 0.2 | % | 2.7 | % | ||||
Nondeductible expenses |
(16.2 | )% | (13.9 | )% | (2.6 | )% | ||||
Stock-based compensation |
(2.7 | )% | (12.0 | )% | (1.7 | )% | ||||
Domestic manufacturing deduction |
— | — | 0.9 | % | ||||||
Valuation allowance |
220.2 | % | (17.6 | )% | 167.0 | % | ||||
Credits |
2.1 | % | 6.2 | % | (202.4 | )% | ||||
Change in tax rate |
(184.8 | )% | (1.1 | )% | 0.1 | % | ||||
Other |
(1.4 | )% | 1.3 | % | (0.6 | )% | ||||
| | | | | | | | | | | |
Effective tax rate |
53.1 | % | (1.9 | )% | (1.6 | )% | ||||
| | | | | | | | | | | |
| | | | | | | | | | | |
| | | | | | | | | | | |
F-27
OSIRIS THERAPEUTICS, INC.
NOTES TO CONSOLIDATED FINANCIAL STATEMENTS (Continued)
12. Income Taxes (Continued)
The components of our net deferred tax assets and liabilities at December 31 are as follows:
| |
December 31, | |||||||||
|---|---|---|---|---|---|---|---|---|---|---|
| (in $000's) |
2017 | 2016 | 2015 | |||||||
Deferred tax assets arising from: |
||||||||||
Net operating losses and credits |
$ | 528 | $ | 2,933 | $ | 2,034 | ||||
Inventory adjustments |
2,114 | 3,334 | 5,407 | |||||||
Accrued expenses and reserves |
7,449 | 10,217 | 9,113 | |||||||
Property and equipment |
488 | 1,140 | 983 | |||||||
Stock compensation |
64 | 132 | 725 | |||||||
Deferred rent |
265 | 261 | 94 | |||||||
Deferred revenue |
316 | 954 | — | |||||||
Other |
197 | 215 | 238 | |||||||
| | | | | | | | | | | |
Deferred tax assets |
11,421 | 19,186 | 18,594 | |||||||
Less: valuation allowance |
(10,212 | ) | (17,308 | ) | (16,662 | ) | ||||
| | | | | | | | | | | |
Net deferred tax assets |
1,209 | 1,878 | 1,932 | |||||||
Deferred tax liabilities arising from: |
||||||||||
Insurance receivable |
(1,209 | ) | (1,827 | ) | (1,831 | ) | ||||
Other |
— | (51 | ) | (101 | ) | |||||
| | | | | | | | | | | |
Net deferred tax asset (liability) |
$ | — | $ | — | — | |||||
| | | | | | | | | | | |
| | | | | | | | | | | |
| | | | | | | | | | | |
As of December 31, 2017, 2016 and 2015, our net income tax receivable was $2.0 million, $2.3 million and $2.6 million, respectively, which were recorded in prepaid expenses and other current assets on the consolidated balance sheets. Also, the Company had an AMT credit carryforward that is now refundable under the Tax Act of approximately $1.5 million that is recorded in other assets on the consolidated balance sheet as of December 31, 2017.
As of December 31, 2017, we had federal operating loss carryforwards and credits of approximately $0.4 million expiring beginning in 2025, and state operating loss carryforwards and credits of approximately $131 thousand, net of federal benefit, expiring beginning in 2035. The Tax Act, reduced the U.S. corporate income tax rate from a maximum of 35% to 21%. As a result of the reduction in the U.S. corporate income tax rate from 35% to 21% under the Tax Act, the Company re-measured its ending net deferred tax assets at December 31, 2017 and recorded a provisional tax expense of $4.8 million that was offset by the release of valuation allowance in the same amount.
Our ability to realize our deferred tax assets depends primarily upon the generation of sufficient future taxable income to allow for the utilization of the deductible temporary differences and upon tax planning strategies. Realization of net deferred tax assets is dependent on our ability to generate future taxable income, which is uncertain. We have recorded valuation allowances of $10.2 million, $17.3 million and $16.7 million, against our net deferred tax assets as of December 31, 2017, 2016 and 2015, respectively, as we believe it is more likely than not that the assets will not be realized.
Utilization of the net operating losses and credit carryforwards may be subject to an annual limitation due to the ownership change limitations provided by the Internal Revenue Code of 1986, as amended, and similar state provisions. We have not performed a detailed analysis to determine whether
F-28
OSIRIS THERAPEUTICS, INC.
NOTES TO CONSOLIDATED FINANCIAL STATEMENTS (Continued)
12. Income Taxes (Continued)
an ownership change under Section 382 of the Internal Revenue Code occurred. The effect of an ownership change would be the imposition of an annual limitation on the use of credits attributable to periods before the change and could result in a reduction in the total credits available.
The Company has filed previous tax returns whereby a carryforward for orphan drug credits were included. Through December 31, 2017, the Company has still not utilized such credits. As of the filing date of this Annual Report on Form 10-K, the Company was in the process of obtaining documentation and support for these credits. The Company has not included these orphan drug credits in the table above that details out our net deferred tax assets and liabilities due to the lack of support. If and when this documentation or support of the orphan drug tax credit is obtained, we may have the ability to offset future income taxes of up to $71.3 million. This deferred tax asset, had it been recorded, would have had a full valuation allowance against it.
We are subject to income taxes in the United States and several states. Tax regulations within each jurisdiction are subject to the interpretation of the related tax laws and regulations and require significant judgment to apply. We had tax net operating losses and credit carryforwards that are subject to examination for a number of years beyond the year in which they are generated for tax purposes. Since a portion of these carryforwards may be utilized in the future, many of these attribute carryforwards remain subject to examination.
Our policy is to recognize interest and penalties related to income tax matters in income tax expense. Interest and penalties related to uncertain tax positions of $34 thousand, $31 thousand and $112 thousand were recognized during the years ended December 31, 2017, 2016 and 2015, respectively related to state tax nexus issues. As of December 31, 2017, 2016 and 2015, accrued interest and penalties were $176 thousand, $142 thousand, and $112 thousand, respectively, and are recorded as other long term liabilities on the consolidated balance sheets. As of December 31, 2017, our total unrecognized tax benefits would favorably affect our effective tax rate if recognized. We do not believe it is reasonably possible that the amount of unrecognized tax benefits will materially change within the next 12 months. We file income tax returns in the United States and various state and local jurisdictions and remain subject to examinations by these jurisdictions for years 2005-2017.
The aggregate change in the balance of unrecognized tax benefits, (which includes the $71.3 million orphan drug credits on our tax returns as discussed above for all periods), and which excludes interest and penalties is as follows:
| |
Year ended December 31, |
|||||||||
|---|---|---|---|---|---|---|---|---|---|---|
| |
2017 | 2016 | 2015 | |||||||
Balance, beginning of year |
$ | 71,665 | $ | 71,665 | $ | 71,279 | ||||
Increase in current year position |
89 | — | 386 | |||||||
Decrease in prior year position |
— | — | — | |||||||
| | | | | | | | | | | |
Balance, end of year |
$ | 71,754 | $ | 71,665 | $ | 71,665 | ||||
| | | | | | | | | | | |
| | | | | | | | | | | |
| | | | | | | | | | | |
F-29
OSIRIS THERAPEUTICS, INC.
NOTES TO CONSOLIDATED FINANCIAL STATEMENTS (Continued)
13. Commitments and Contingencies
Leases
We lease facilities and equipment under various non-cancellable operating lease agreements expiring through 2023. Rent expense was $1.4 million, $1.4 million and $1.5 million for the years ended December 31, 2017, 2016 and 2015, respectively.
At December 31, 2017, the Company's minimum obligations under non-cancellable operating leases are as follows:
| (in $000's) |
|
|||
|---|---|---|---|---|
2018 |
$ | 1,139 | ||
2019 |
1,270 | |||
2020 |
1,282 | |||
2021 |
1,288 | |||
2022 |
1,312 | |||
Thereafter |
1,117 | |||
| | | | | |
Total |
$ | 7,408 | ||
| | | | | |
| | | | | |
| | | | | |
Legal
The Company is party to outstanding legal proceedings, investigations and claims as described below. The Company cannot predict with any certainty the final outcome of any legal proceedings, investigations (including any settlement discussions with the government seeking to resolve such investigations) or claims made against it as described in the paragraphs below, and there can be no assurance that the ultimate resolution of any such matter will not have a material adverse impact on the Company's consolidated financial position, results of operations, or cash flows.
The Company records accruals for certain outstanding legal proceedings, investigations or claims when it is probable that a liability will be incurred and the amount of the loss can be reasonably estimated. The Company evaluates, on a quarterly basis, developments in legal proceedings, investigations and claims that could affect the amount of any accrual, as well as any developments that would make a loss contingency both probable and reasonably estimable. When a loss contingency is not both probable and reasonably estimable, the Company does not accrue the loss. However, if the loss (or an additional loss in excess of the accrual) is at least a reasonable possibility and material, then the Company discloses a reasonable estimate of the possible loss or range of loss, if such reasonable estimate can be made. If the Company cannot make a reasonable estimate of the possible loss, or range of loss, then that is disclosed.
The assessments of whether a loss is probable or a reasonable possibility, and whether the loss or range of loss is reasonably estimable, often involve a series of complex judgments about future events. Among the factors that the Company considers in this assessment are the nature of existing legal proceedings, investigations and claims, the asserted or possible damages or loss contingency (if reasonably estimable), the progress of the matter, existing law and precedent, the opinions or views of legal counsel and other advisers, the involvement of the U.S. Government and its agencies in such proceedings, the Company's experience in similar matters and the experience of other companies, the facts available to the Company at the time of assessment, and how the Company intends to respond, or has responded, to the proceeding, investigation or claim. The Company's assessment of these factors
F-30
OSIRIS THERAPEUTICS, INC.
NOTES TO CONSOLIDATED FINANCIAL STATEMENTS (Continued)
13. Commitments and Contingencies (Continued)
may change over time as individual proceedings, investigations or claims progress. For matters where the Company is not currently able to reasonably estimate the range of reasonably possible loss, the factors that have contributed to this determination include the following: (i) the damages sought are indeterminate, or an investigation has not manifested itself in a filed civil or criminal complaint, (ii) the matters are in the early stages, (iii) the matters involve novel or unsettled legal theories or a large or uncertain number of actual or potential cases or parties, and/or (iv) discussions with the government or other parties in matters that may be expected ultimately to be resolved through negotiation and settlement have not reached the point where the Company believes a reasonable estimate of loss, or range of loss, can be made. In such instances, the Company believes that there is considerable uncertainty regarding the timing or ultimate resolution of such matters, including a possible eventual loss, fine, penalty or business impact, if any.
In addition, the Company does not accrue for estimated legal fees and other directly related costs as they are expensed as incurred.
In addition to the matters described in the paragraphs below, in the normal course of its business, the Company is involved in various lawsuits from time to time and may be subject to certain other contingencies, none of which we believe to be material.
Based on our analysis and assessment as described above, including consultation with our legal counsel, management believes there are no matters that are probable or reasonably possible that require accrual or disclosure, except for the matters described below.
Securities Class Action
On November 23, 2015, a putative class action lawsuit was filed in the United States District Court for the District of Maryland by a single plaintiff, individually and on behalf of other persons similarly situated, against the Company and three current or former executive officers of the Company. The action, captioned Kiran Kumar Nallagonda v. Osiris Therapeutics, Inc. et al., Case 1:15-cv-03562 (the "Nallagonda Action"), alleges, among other things, that the defendants made materially false or misleading statements and material omissions in the Company's SEC filings in violation of the federal securities laws. The complaint seeks certification as a class action, unspecified damages and reimbursement of attorneys' fees. On March 21, 2016, the court entered an order appointing Dr. Raffy Mirzayan as lead plaintiff and the firm of Hagens Berman Sobol Shapiro LLP as lead counsel. On January 17, 2018, the Court entered an order providing that the lead plaintiff shall have 45 days to file an amended complaint. On March 11, 2018, we entered into a memorandum of understanding to settle the Nallagonda Action. A memorandum of understanding is not a definitive settlement agreement. By the terms of the memorandum, the Company agreed in principle to a total payment of $18.5 million in cash.
The Company recorded the $18.5 million shareholder settlement in Settlement of SEC and shareholders actions, net of the $4.8 million estimated insurance recovery in the consolidated statement of comprehensive income (loss) in the fourth quarter of 2015, which is the period in which the lawsuits were originally filed. The $18.5 million shareholder settlement liability was recorded in Accrued shareholder litigation in the Company's consolidated balance sheets as of December 31, 2015, 2016, and 2017. The $18.5 million shareholder settlement liability was recorded as a long-term liability in the Company's consolidated balance sheets as of December 31, 2015 and 2016 and as a current liability as of December 31, 2017 since the Company expects to pay the full $18.5 million settlement in 2018.
F-31
OSIRIS THERAPEUTICS, INC.
NOTES TO CONSOLIDATED FINANCIAL STATEMENTS (Continued)
13. Commitments and Contingencies (Continued)
The Company had a $5.0 million executive and corporate securities liability insurance policy in place at the time of the allegations. The Company expects to recover the remaining $4.8 million of unused policy coverage for the shareholder settlement in 2018. The $4.8 million insurance recovery was recorded as an offset to the $18.5 million shareholder settlement in the Company's consolidated statement of comprehensive income (loss) for the fourth quarter of 2015. The $4.8 million insurance receivable was recorded in Insurance receivable in the Company's consolidated balance sheets as of December 31, 2015, 2016, and 2017. The $4.8 million insurance receivable was recorded as a long-term asset in the Company's consolidated balance sheets as of December 31, 2015 and 2016 and as a current asset as of December 31, 2017 since the Company expects to receive the full $4.8 million insurance receivable in 2018.
Shareholder Derivative Actions
On March 2, 2016, a shareholder derivative complaint was filed in the Circuit Court for Howard County in the State of Maryland (Case No. 13C16106811) by a single plaintiff, derivatively and on behalf of the Company, against certain current and former directors and certain former executive officers. This action, captioned Kevin Connelley v. Lode Debrabandere et al., alleges that each of the individual directors and officers named as defendants (i) violated their fiduciary duties to the Company's shareholders; (ii) abused their ability to control and influence the Company; (iii) engaged in gross mismanagement of the assets and business of the Company; and (iv) was unjustly enriched at the expense of, and to the detriment of, the Company. The alleged claims generally relate to the matters that are the subject of the Nallagonda Action. The plaintiff seeks, among other things, unspecified monetary damages, reimbursement of attorneys' fees and shareholder votes on amendments to the Company's Articles of Incorporation and Bylaws with respect to various corporate governance policies. On June 2, 2016, the Court entered an order that, subject to certain qualifications, stayed the action until 30 days after the entry of an order either: (1) denying all motions to dismiss in the Nallagonda Action, or (2) finally dismissing the Nallagonda Action with prejudice.
On February 9, 2017, a shareholder derivative complaint was filed in the United States District Court for the District of Maryland (Case No. 1:17-cv-00381-JKB) by a single plaintiff, derivatively and on behalf of the Company, against certain current and former directors. This action, captioned Recupero v. Friedli et al., alleges, among other things, that each of the individual directors named as defendants (i) violated their fiduciary duties to the Company's shareholders, including that such violations constituted constructive fraud; (ii) engaged in gross mismanagement of the assets and business of the Company; and (iii) was unjustly enriched at the expense of, and to the detriment of, the Company. The plaintiff seeks, among other things, unspecified monetary damages, reimbursement of attorneys', accountants' and experts' fees, and that the Company take all necessary actions to improve and comply with corporate governance, internal procedures and existing laws. On March 28, 2017, the Court entered an order that stays the action until: (1) the Nallagonda Action is dismissed with prejudice and all appeals relating thereto have been exhausted; (2) all motions to dismiss the Nallagonda Action are denied; or (3) either party provides 30 days' notice that they no longer consent to a stay.
On May 11, 2017, a shareholder derivative complaint was filed in the Circuit Court for Howard County in the State of Maryland, (Case No. 13C17111441) by a single plaintiff, derivatively on behalf of the Company, against certain former executive officers and certain current and former directors. The action, captioned Brian Lee v. Peter Friedli, et. al., alleges that each of the individual defendants violated
F-32
OSIRIS THERAPEUTICS, INC.
NOTES TO CONSOLIDATED FINANCIAL STATEMENTS (Continued)
13. Commitments and Contingencies (Continued)
their fiduciary duties by allegedly failing to adopt and implement adequate accounting and financial reporting systems and for allegedly causing the Company to make false and misleading statements regarding its financial condition. The alleged claims generally relate to the matters that are the subject of the Nallagonda Action and seek substantially similar relief. On September 5, 2017, the defendants moved to either stay or dismiss the plaintiffs' complaint. That motion was subsequently withdrawn. On February 14, 2018, the plaintiff filed an amended derivative complaint. No defendant has yet responded to that pleading.
On December 21, 2017, a shareholder derivative action was filed in the United States District Court for the District of Maryland (Case No. 1:17-cv-03777) by a single plaintiff, derivatively and on behalf of the Company, against certain former executive officers and certain current and former directors. The action, captioned Todd Salley v. Lode Debrabandere, et. al., alleges that each of the individual defendants violated their fiduciary duties by failing to maintain adequate internal controls and by causing the Company to make false and misleading statements regarding the Company's financial condition. The alleged claims generally relate to the matters that are the subject of the Nallagonda Action and seek substantially similar relief. No defendant has yet responded to the complaint.
The Company has reached an agreement in principle with the plaintiffs in the shareholder derivative actions to resolve the derivative matters by adopting certain governance changes. We expect that the plaintiffs will seek recovery of attorney's fees and we cannot currently predict the amount of such attorney's fees that we may be required to pay, if any. We can provide no assurance that we will be able to reach a definitive global settlement with the derivate plaintiffs or that any such settlement will be approved by the courts. While we believe it is reasonably possible that we will incur losses associated with the shareholder derivative actions, it is not possible to estimate the amount of loss, if any, that might result from any settlements or other resolution. The Company will continue to evaluate information as it becomes known and will record an estimate for losses at the time or times when it is both probable that a loss has been incurred and the amount of the loss is reasonably estimable.
Government Investigations
On November 2, 2017, the Company announced the resolution of an investigation by the SEC into the Company's historical accounting practices. The Company agreed to settle with the SEC, without admitting or denying the allegations of the SEC, by consenting to the entry of a final judgment, subject to court approval, that permanently restrains and enjoins the Company from violating certain provisions of the federal securities laws. As part of the settlement, the Company paid a civil penalty in the amount of $1.5 million on November 9, 2017. This $1.5 million settlement was expensed by the Company in the fourth quarter of 2015. The $1.5 million settlement was included in other long-term liabilities and accrued liabilities in the consolidated balance sheets as of December 31, 2015 and 2016, respectively, and in settlement of SEC and shareholders actions in the consolidated statements of comprehensive income (loss) for the year ended December 31, 2015. On November 7, 2017, this settlement was approved by the United States District Court for the District of Maryland, through entry of a final judgment, resolving as to the Company the matters alleged by the SEC in the civil complaint against the Company. The SEC civil case is continuing against four former Company officers.
The Company previously announced that a criminal investigation was being conducted by the U.S. Attorney's Office for the Southern District of New York ("SDNY") relating to matters that were also
F-33
OSIRIS THERAPEUTICS, INC.
NOTES TO CONSOLIDATED FINANCIAL STATEMENTS (Continued)
13. Commitments and Contingencies (Continued)
being investigated by the SEC. The SDNY investigation resulted in a former chief financial officer of the Company entering into a guilty plea with the government. As previously disclosed, based on communications the Company has had with the SDNY since that time and given that sentencing of the former company officer has now occurred, the Company believes that, subject to any newly discovered information, the SDNY has concluded the criminal investigation with respect to Company-related matters.
The Company believes that both the previously disclosed SEC and SDNY investigations are concluded with respect to the Company.
14. Significant Distributors
We have historically provided credit in the normal course of business to contract counterparties and to the distributors of our products. Trade receivables in the accompanying consolidated balance sheets consist primarily of amounts due from distributors and end-user customers of our products. The concentration of the Company's business with a relatively small number of distributors may expose it to a material adverse effect if one or more of these large distributors were to experience financial difficulty or were to cease being a distributor for non-financial related issues. The Company's revenue concentrations through distributors of 10% or greater are as follows:
| |
Percentage of Revenue |
|||||||||
|---|---|---|---|---|---|---|---|---|---|---|
Distributor
|
2017 | 2016 | 2015 | |||||||
A |
21 | % | 18 | % | 12 | % | ||||
B |
8 | % | 15 | % | 16 | % | ||||
| | | | | | | | | | | |
Total |
29 | % | 33 | % | 28 | % | ||||
| | | | | | | | | | | |
| | | | | | | | | | | |
| | | | | | | | | | | |
The Company's accounts receivable concentrations of 10% or greater are as follows:
| |
Percentage of Receivables |
|||||||||
|---|---|---|---|---|---|---|---|---|---|---|
| |
December 31, | |||||||||
Distributor
|
2017 | 2016 | 2015 | |||||||
A |
24 | % | 18 | % | 19 | % | ||||
15. Selected Quarterly Data (Unaudited)
The following tables include the Company's condensed consolidated balance sheets, condensed consolidated statements of comprehensive income (loss), and condensed consolidated statements of cash flows for each quarter of the years ended December 31, 2017, 2016 and 2015. EPS is computed independently for each quarter presented, therefore, the sum of the quarterly EPS may not equal the total EPS for the year.
F-34
OSIRIS THERAPEUTICS, INC.
NOTES TO CONSOLIDATED FINANCIAL STATEMENTS (Continued)
15. Selected Quarterly Data (Unaudited) (Continued)
Condensed Consolidated Balance Sheets
(in thousands, except per share data)
| |
Unaudited | |||||||||
|---|---|---|---|---|---|---|---|---|---|---|
| |
March 31, 2017 |
June 30, 2017 |
September 30, 2017 |
|||||||
Assets |
||||||||||
Current Assets |
||||||||||
Cash and cash equivalents |
$ | 1,161 | $ | 1,625 | $ | 3,234 | ||||
Short-term investments |
21,427 | 20,538 | 28,540 | |||||||
Trade receivables, net |
23,014 | 23,414 | 22,028 | |||||||
Inventory, net |
11,199 | 11,633 | 12,414 | |||||||
Insurance receivable |
4,788 | 4,788 | 4,788 | |||||||
Prepaid expenses and other current assets |
3,568 | 3,735 | 3,542 | |||||||
| | | | | | | | | | | |
Total current assets |
65,157 | 65,733 | 74,546 | |||||||
Property and equipment, net |
2,281 | 2,242 | 2,467 | |||||||
Other assets |
137 | 137 | 103 | |||||||
| | | | | | | | | | | |
Total assets |
$ | 67,575 | $ | 68,112 | $ | 77,116 | ||||
| | | | | | | | | | | |
| | | | | | | | | | | |
| | | | | | | | | | | |
Liabilities and Equity |
||||||||||
Current liabilities |
||||||||||
Accounts payable |
$ | 3,936 | $ | 3,713 | $ | 5,014 | ||||
Accrued liabilities |
9,766 | 10,352 | 9,991 | |||||||
Accrued shareholder litigation |
18,500 | 18,500 | 18,500 | |||||||
Other current liabilities |
1,960 | 1,878 | 2,066 | |||||||
| | | | | | | | | | | |
Total current liabilities |
34,162 | 34,443 | 35,571 | |||||||
Other long-term liabilities |
2,134 | 1,817 | 1,953 | |||||||
| | | | | | | | | | | |
Total liabilities |
36,296 | 36,260 | 37,524 | |||||||
| | | | | | | | | | | |
Equity |
||||||||||
Common stock |
35 | 35 | 35 | |||||||
Additional paid-in capital |
283,895 | 283,854 | 283,856 | |||||||
Accumulated other comprehensive income (loss) |
109 | (35 | ) | (55 | ) | |||||
Accumulated deficit |
(252,760 | ) | (252,002 | ) | (244,244 | ) | ||||
| | | | | | | | | | | |
Total equity |
31,279 | 31,852 | 39,592 | |||||||
| | | | | | | | | | | |
Total liabilities equity |
$ | 67,575 | $ | 68,112 | $ | 77,116 | ||||
| | | | | | | | | | | |
| | | | | | | | | | | |
| | | | | | | | | | | |
F-35
OSIRIS THERAPEUTICS, INC.
NOTES TO CONSOLIDATED FINANCIAL STATEMENTS (Continued)
15. Selected Quarterly Data (Unaudited) (Continued)
Condensed Consolidated Statements of Comprehensive Income (Loss)
(in thousands, except per share data)
| |
Unaudited | ||||||||||||||||||
|---|---|---|---|---|---|---|---|---|---|---|---|---|---|---|---|---|---|---|---|
| |
2017 | ||||||||||||||||||
| |
Quarter Ended March 31 |
Quarter Ended June 30 |
Six Months Ended June 30 |
Quarter Ended September 30 |
Nine Months Ended September 30 |
Quarter Ended December 31 |
|||||||||||||
Revenue |
$ | 26,981 | $ | 29,151 | $ | 56,132 | $ | 29,806 | $ | 85,938 | $ | 32,576 | |||||||
Cost of revenue |
7,811 | 7,668 | 15,479 | 7,926 | 23,405 | 9,276 | |||||||||||||
| | | | | | | | | | | | | | | | | | | | |
Gross profit |
19,170 | 21,483 | 40,653 | 21,880 | 62,533 | 23,300 | |||||||||||||
| | | | | | | | | | | | | | | | | | | | |
Operating expenses: |
|||||||||||||||||||
Research and development |
1,219 | 924 | 2,143 | 909 | 3,052 | 1,086 | |||||||||||||
Sales and marketing |
14,733 | 14,698 | 29,431 | 14,825 | 44,256 | 17,289 | |||||||||||||
General and administrative |
4,859 | 5,427 | 10,286 | 6,634 | 16,920 | 5,219 | |||||||||||||
| | | | | | | | | | | | | | | | | | | | |
Total operating expenses |
20,811 | 21,049 | 41,860 | 22,368 | 64,228 | 23,594 | |||||||||||||
| | | | | | | | | | | | | | | | | | | | |
Income (loss) from continuing operations |
(1,641 | ) | 434 | (1,207 | ) | (488 | ) | (1,695 | ) | (294 | ) | ||||||||
Other income (expense) |
36 | 356 | 392 | (1,763 | ) | (1,371 | ) | 726 | |||||||||||
| | | | | | | | | | | | | | | | | | | | |
Income (loss) before income taxes from continuing operations |
(1,605 | ) | 790 | (815 | ) | (2,251 | ) | (3,066 | ) | 432 | |||||||||
Income tax benefit (expense) |
(32 | ) | (32 | ) | (64 | ) | 198 | 134 | 1,264 | ||||||||||
| | | | | | | | | | | | | | | | | | | | |
Net income (loss) from continuing operations |
(1,637 | ) | 758 | (879 | ) | (2,053 | ) | (2,932 | ) | 1,696 | |||||||||
Discontinued operations, net of tax |
— |
— |
— |
9,811 |
9,811 |
210 |
|||||||||||||
| | | | | | | | | | | | | | | | | | | | |
Net income (loss) |
(1,637 | ) | 758 | (879 | ) | 7,758 | 6,879 | 1,906 | |||||||||||
Other comprehensive income (loss) |
|||||||||||||||||||
Unrealized gain (loss) on investments |
198 | (144 | ) | 54 | (21 | ) | 33 | (152 | ) | ||||||||||
| | | | | | | | | | | | | | | | | | | | |
Comprehensive income (loss) |
$ | (1,439 | ) | $ | 614 | $ | (825 | ) | $ | 7,737 | $ | 6,912 | $ | 1,754 | |||||
| | | | | | | | | | | | | | | | | | | | |
| | | | | | | | | | | | | | | | | | | | |
| | | | | | | | | | | | | | | | | | | | |
Net income per share from continuing operations: |
|||||||||||||||||||
Basic |
$ | (0.05 | ) | $ | 0.02 | $ | (0.03 | ) | $ | (0.06 | ) | $ | (0.08 | ) | $ | 0.05 | |||
| | | | | | | | | | | | | | | | | | | | |
| | | | | | | | | | | | | | | | | | | | |
| | | | | | | | | | | | | | | | | | | | |
Diluted |
$ | (0.05 | ) | $ | 0.02 | $ | (0.03 | ) | $ | (0.06 | ) | $ | (0.08 | ) | $ | 0.05 | |||
| | | | | | | | | | | | | | | | | | | | |
| | | | | | | | | | | | | | | | | | | | |
| | | | | | | | | | | | | | | | | | | | |
Net income per share from discontinued operations: |
|||||||||||||||||||
Basic |
$ | — | $ | — | $ | — | $ | 0.28 | $ | 0.28 | $ | 0.01 | |||||||
| | | | | | | | | | | | | | | | | | | | |
| | | | | | | | | | | | | | | | | | | | |
| | | | | | | | | | | | | | | | | | | | |
Diluted |
$ | — | $ | — | $ | — | $ | 0.28 | $ | 0.28 | $ | 0.01 | |||||||
| | | | | | | | | | | | | | | | | | | | |
| | | | | | | | | | | | | | | | | | | | |
| | | | | | | | | | | | | | | | | | | | |
Net income (loss) per share: |
|||||||||||||||||||
Basic |
$ | (0.05 | ) | $ | 0.02 | $ | (0.03 | ) | $ | 0.22 | $ | 0.20 | $ | 0.06 | |||||
| | | | | | | | | | | | | | | | | | | | |
| | | | | | | | | | | | | | | | | | | | |
| | | | | | | | | | | | | | | | | | | | |
Diluted |
$ | (0.05 | ) | $ | 0.02 | $ | (0.03 | ) | $ | 0.22 | $ | 0.20 | $ | 0.06 | |||||
| | | | | | | | | | | | | | | | | | | | |
| | | | | | | | | | | | | | | | | | | | |
| | | | | | | | | | | | | | | | | | | | |
Weighted average common shares outstanding: |
|||||||||||||||||||
Basic |
34,520 | 34,526 | 34,523 | 34,526 | 34,524 | 34,526 | |||||||||||||
| | | | | | | | | | | | | | | | | | | | |
| | | | | | | | | | | | | | | | | | | | |
| | | | | | | | | | | | | | | | | | | | |
Diluted |
34,520 | 34,529 | 34,523 | 34,526 | 34,525 | 34,526 | |||||||||||||
| | | | | | | | | | | | | | | | | | | | |
| | | | | | | | | | | | | | | | | | | | |
| | | | | | | | | | | | | | | | | | | | |
F-36
OSIRIS THERAPEUTICS, INC.
NOTES TO CONSOLIDATED FINANCIAL STATEMENTS (Continued)
15. Selected Quarterly Data (Unaudited) (Continued)
Condensed Consolidated Statements of Cash Flows
(in thousands)
| |
Unaudited | |||||||||
|---|---|---|---|---|---|---|---|---|---|---|
| |
2017 | |||||||||
| |
Three Months Ended March 31 |
Six Months Ended June 30 |
Nine Months Ended September 30 |
|||||||
CASH FLOWS FROM OPERATING ACTIVITIES |
||||||||||
Net income (loss) |
$ | (1,637 | ) | $ | (879 | ) | $ | 6,879 | ||
Adjustments to reconcile net income (loss) to net cash used in operating activities: |
||||||||||
Receipt of Mesoblast common stock |
— | — | (10,000 | ) | ||||||
Loss on disposal of fixed assets |
— | 3 | 123 | |||||||
Realized loss on investments |
158 | 152 | 2,102 | |||||||
Depreciation |
176 | 345 | 518 | |||||||
Stock-based compensation expense |
88 | 47 | 49 | |||||||
Changes in operating assets and liabilities |
||||||||||
Accounts receivable, net |
234 | (166 | ) | 1,220 | ||||||
Inventory, net |
167 | (267 | ) | (1,048 | ) | |||||
Prepaid expenses, and other current assets |
(406 | ) | (797 | ) | (651 | ) | ||||
Accounts payable, accrued expenses, and other liabilities |
(3,020 | ) | (3,056 | ) | (1,791 | ) | ||||
| | | | | | | | | | | |
Net cash used in operating activities |
(4,240 | ) | (4,618 | ) | (2,599 | ) | ||||
CASH FLOWS FROM INVESTING ACTIVITIES |
||||||||||
Purchase of property and equipment, net |
(67 | ) | (200 | ) | (718 | ) | ||||
Proceeds from sale of investments |
5,758 | 8,238 | 23,250 | |||||||
Purchases of investments |
(3,251 | ) | (4,756 | ) | (19,660 | ) | ||||
| | | | | | | | | | | |
Net cash provided by investing activities |
2,440 | 3,282 | 2,872 | |||||||
CASH FLOWS FROM FINANCING ACTIVITIES |
||||||||||
Proceeds from the exercise of options to purchase common stock |
128 | 128 | 128 | |||||||
| | | | | | | | | | | |
Net cash provided by financing activities |
128 | 128 | 128 | |||||||
NET INCREASE (DECREASE) IN CASH AND CASH EQUIVALENTS |
(1,672 |
) |
(1,208 |
) |
401 |
|||||
Cash and cash equivalents, beginning of period |
2,833 | 2,833 | 2,833 | |||||||
| | | | | | | | | | | |
Cash and cash equivalents, end of period |
$ | 1,161 | $ | 1,625 | $ | 3,234 | ||||
| | | | | | | | | | | |
| | | | | | | | | | | |
| | | | | | | | | | | |
SUPPLEMENTAL INFORMATION |
||||||||||
Cash paid during the period for: |
||||||||||
Income tax |
$ | 63 | $ | 65 | $ | 75 | ||||
F-37
OSIRIS THERAPEUTICS, INC.
NOTES TO CONSOLIDATED FINANCIAL STATEMENTS (Continued)
15. Selected Quarterly Data (Unaudited) (Continued)
Condensed Consolidated Balance Sheets
(in thousands, except per share data)
| |
Unaudited | |||||||||
|---|---|---|---|---|---|---|---|---|---|---|
| |
March 31, 2016 |
June 30, 2016 |
September 30, 2016 |
|||||||
Assets |
||||||||||
Current Assets |
||||||||||
Cash and cash equivalents |
$ | 5,516 | $ | 3,551 | $ | 3,287 | ||||
Short-term investments |
26,583 | 26,662 | 25,999 | |||||||
Trade receivables, net |
18,850 | 20,125 | 20,928 | |||||||
Inventory, net |
10,371 | 9,785 | 10,344 | |||||||
Prepaid expenses and other current assets |
4,219 | 4,036 | 4,206 | |||||||
| | | | | | | | | | | |
Total current assets |
65,539 | 64,159 | 64,764 | |||||||
Property and equipment, net |
2,113 | 2,066 | 2,478 | |||||||
Insurance receivable |
4,788 | 4,788 | 4,788 | |||||||
Other assets |
152 | 152 | 164 | |||||||
| | | | | | | | | | | |
Total assets |
$ | 72,592 | $ | 71,165 | $ | 72,194 | ||||
| | | | | | | | | | | |
| | | | | | | | | | | |
| | | | | | | | | | | |
Liabilities and Equity |
||||||||||
Current liabilities |
||||||||||
Accounts payable |
$ | 4,515 | $ | 5,543 | $ | 5,977 | ||||
Accrued liabilities |
9,454 | 10,508 | 9,303 | |||||||
Other current liabilities |
1,663 | 1,650 | 1,850 | |||||||
| | | | | | | | | | | |
Total current liabilities |
15,632 | 17,701 | 17,130 | |||||||
Accrued shareholder litigation |
18,500 | 18,500 | 18,500 | |||||||
Other long-term liabilities |
2,940 | 2,623 | 2,751 | |||||||
| | | | | | | | | | | |
Total liabilities |
37,072 | 38,824 | 38,381 | |||||||
Equity |
||||||||||
Common stock |
35 | 35 | 35 | |||||||
Additional paid-in capital |
283,320 | 283,340 | 283,515 | |||||||
Accumulated other comprehensive income |
83 | 192 | 163 | |||||||
Accumulated deficit |
(247,918 | ) | (251,226 | ) | (249,900 | ) | ||||
| | | | | | | | | | | |
Total equity |
35,520 | 32,341 | 33,813 | |||||||
| | | | | | | | | | | |
Total liabilities and equity |
$ | 72,592 | $ | 71,165 | $ | 72,194 | ||||
| | | | | | | | | | | |
| | | | | | | | | | | |
| | | | | | | | | | | |
F-38
OSIRIS THERAPEUTICS, INC.
NOTES TO CONSOLIDATED FINANCIAL STATEMENTS (Continued)
15. Selected Quarterly Data (Unaudited) (Continued)
Condensed Consolidated Statements of Comprehensive Income (Loss)
(in thousands, except per share data)
| |
Unaudited | ||||||||||||||||||
|---|---|---|---|---|---|---|---|---|---|---|---|---|---|---|---|---|---|---|---|
| |
2016 | ||||||||||||||||||
| |
Quarter Ended March 31 |
Quarter Ended June 30 |
Six Months Ended June 30 |
Quarter Ended September 30 |
Nine Months Ended September 30 |
Quarter Ended December 31 |
|||||||||||||
Revenue |
$ | 23,451 | $ | 27,327 | $ | 50,778 | $ | 29,506 | $ | 80,284 | $ | 29,090 | |||||||
Cost of revenue |
6,517 | 8,284 | 14,801 | 7,740 | 22,541 | 8,192 | |||||||||||||
| | | | | | | | | | | | | | | | | | | | |
Gross profit |
16,934 | 19,043 | 35,977 | 21,766 | 57,743 | 20,898 | |||||||||||||
| | | | | | | | | | | | | | | | | | | | |
Operating expenses: |
|||||||||||||||||||
Research and development |
1,495 | 1,524 | 3,019 | 1,853 | 4,872 | 1,452 | |||||||||||||
Sales and marketing |
13,575 | 14,742 | 28,317 | 15,346 | 43,663 | 15,394 | |||||||||||||
General and administrative |
2,453 | 6,254 | 8,707 | 3,264 | 11,971 | 5,385 | |||||||||||||
| | | | | | | | | | | | | | | | | | | | |
Total operating expenses |
17,523 | 22,520 | 40,043 | 20,463 | 60,506 | 22,231 | |||||||||||||
| | | | | | | | | | | | | | | | | | | | |
Income (loss) from operations |
(589 | ) | (3,477 | ) | (4,066 | ) | 1,303 | (2,763 | ) | (1,333 | ) | ||||||||
Other income |
66 | 74 | 140 | 83 | 223 | 194 | |||||||||||||
| | | | | | | | | | | | | | | | | | | | |
Income (loss) before income taxes |
(523 | ) | (3,403 | ) | (3,926 | ) | 1,386 | (2,540 | ) | (1,139 | ) | ||||||||
Income tax (expense) benefit |
(21 | ) | 95 | 74 | (60 | ) | 14 | (84 | ) | ||||||||||
| | | | | | | | | | | | | | | | | | | | |
Net income (loss) |
(544 | ) | (3,308 | ) | (3,852 | ) | 1,326 | (2,526 | ) | (1,223 | ) | ||||||||
Other comprehensive income (loss) |
|||||||||||||||||||
Unrealized gain (loss) on investments |
226 | 109 | 335 | (29 | ) | 306 | (252 | ) | |||||||||||
| | | | | | | | | | | | | | | | | | | | |
Comprehensive income (loss) |
$ | (318 | ) | $ | (3,199 | ) | $ | (3,517 | ) | $ | 1,297 | $ | (2,220 | ) | $ | (1,475 | ) | ||
| | | | | | | | | | | | | | | | | | | | |
| | | | | | | | | | | | | | | | | | | | |
| | | | | | | | | | | | | | | | | | | | |
Basic and diluted net loss per share: |
|||||||||||||||||||
Basic and diluted |
$ | (0.02 | ) | $ | (0.10 | ) | $ | (0.11 | ) | $ | 0.04 | $ | (0.07 | ) | $ | (0.04 | ) | ||
| | | | | | | | | | | | | | | | | | | | |
| | | | | | | | | | | | | | | | | | | | |
| | | | | | | | | | | | | | | | | | | | |
Weighted average common shares outstanding: |
|||||||||||||||||||
Basic |
34,495 | 34,500 | 34,498 | 34,501 | 34,499 | 34,501 | |||||||||||||
Diluted |
34,495 | 34,500 | 34,498 | 34,501 | 34,499 | 34,501 | |||||||||||||
F-39
OSIRIS THERAPEUTICS, INC.
NOTES TO CONSOLIDATED FINANCIAL STATEMENTS (Continued)
15. Selected Quarterly Data (Unaudited) (Continued)
Condensed Consolidated Statements of Cash Flows
(in thousands)
| |
Unaudited | |||||||||
|---|---|---|---|---|---|---|---|---|---|---|
| |
2016 | |||||||||
| |
Three Months Ended March 31 |
Six Months Ended June 30 |
Nine Months Ended September 30 |
|||||||
CASH FLOWS FROM OPERATING ACTIVITIES |
||||||||||
Net loss |
$ | (544 | ) | $ | (3,852 | ) | $ | (2,526 | ) | |
Adjustments to reconcile net income (loss) to net cash used in operating activities: |
||||||||||
Loss on disposal of fixed assets |
44 | 44 | 44 | |||||||
Realized gain on investments |
— | — | (1 | ) | ||||||
Depreciation |
281 | 577 | 807 | |||||||
Stock-based compensation expense (benefit) |
(701 | ) | (678 | ) | (504 | ) | ||||
Changes in operating assets and liabilities |
||||||||||
Accounts receivable, net |
(51 | ) | (1,326 | ) | (2,129 | ) | ||||
Inventory, net |
(794 | ) | (208 | ) | (767 | ) | ||||
Prepaid expenses, and other current assets |
29 | 140 | (113 | ) | ||||||
Accounts payable, accrued expenses, and other liabilities |
1 | 1,754 | 1,328 | |||||||
| | | | | | | | | | | |
Net cash used in operating activities |
(1,735 | ) | (3,549 | ) | (3,861 | ) | ||||
CASH FLOWS FROM INVESTING ACTIVITIES |
||||||||||
Purchase of property and equipment, net |
(361 | ) | (610 | ) | (1,252 | ) | ||||
Proceeds from sale of investments |
4,902 | 5,004 | 6,972 | |||||||
Purchases of investments |
(6,380 | ) | (6,380 | ) | (7,641 | ) | ||||
| | | | | | | | | | | |
Net cash used in investing activities |
(1,839 | ) | (1,986 | ) | (1,921 | ) | ||||
CASH FLOWS FROM FINANCING ACTIVITIES |
||||||||||
Principal payments on capital lease obligations |
(53 | ) | (54 | ) | (71 | ) | ||||
Repurchases of common stock |
(1 | ) | (32 | ) | (32 | ) | ||||
Proceeds from the exercise of options to purchase common stock |
— | 28 | 28 | |||||||
| | | | | | | | | | | |
Net cash used in financing activities |
(54 | ) | (58 | ) | (75 | ) | ||||
NET DECREASE IN CASH AND CASH EQUIVALENTS |
(3,628 |
) |
(5,593 |
) |
(5,857 |
) |
||||
Cash and cash equivalents, beginning of period |
9,144 | 9,144 | 9,144 | |||||||
| | | | | | | | | | | |
Cash and cash equivalents, end of period |
$ | 5,516 | $ | 3,551 | $ | 3,287 | ||||
| | | | | | | | | | | |
| | | | | | | | | | | |
| | | | | | | | | | | |
SUPPLEMENTAL INFORMATION |
||||||||||
Cash paid during the period for: |
||||||||||
Income taxes |
$ | 9 | $ | 69 | $ | 85 | ||||
F-40
OSIRIS THERAPEUTICS, INC.
NOTES TO CONSOLIDATED FINANCIAL STATEMENTS (Continued)
15. Selected Quarterly Data (Unaudited) (Continued)
Restatement of the 2015 Unaudited Quarterly Financial Statements
As previously described in our Current Reports on Form 8-K filed on November 20, 2015 and on March 14, 2016, the Audit Committee of the Board of Directors (the "Audit Committee"), in consultation with management, concluded that our unaudited interim financial statements previously issued for the quarterly and year-to-date periods ended March 31, 2015, June 30, 2015 and September 30, 2015 should not be relied upon due to errors identified in such financial statements related to the timing of revenue recognition under contracts with distributors. The corrections contained in the below restated unaudited quarterly financial statements were prepared following an independent review by the Audit Committee into certain accounting matters (the "Independent Review") as described below, and a review by management of other accounting matters not specifically addressed by the Independent Review. The unaudited quarterly information for the quarter ended December 31, 2015 is presented below for the first time.
Impact of this Restatement
Based on the Independent Review and management's additional review procedures, the Audit Committee concluded, among other things, that there were both material and immaterial misstatements in the financial statements filed in the Company's Quarterly Reports on Form 10-Q for the quarters ended March 31, 2015, June 30, 2015 and September 30, 2015 and our financial statements previously filed in the Company's Quarterly Reports on Form 10-Q for said quarters that require restatement (the "2015 Quarterly Restatement").
The following summarizes the material errors corrected in the 2015 Quarterly Restatement.
Recognition of revenue under distributor sales arrangements
Based on the Audit Committee's Independent Review, the Company determined that it had erred in its application of GAAP with respect to the recognition of revenue arising from the certain distributor sales arrangements described below:
The Company provided unusually long payment terms to a distributor that was affiliated with another distributor. Granting a customer unusually long payment terms can cause the related sales transactions to fail the "fixed or determinable" criteria required under GAAP to recognize revenue. Because the Company does not have reliable information about when the distributor sold the products to the end-use customers, the revenue has been restated such that it is now recorded on cash basis, net of commission expense. In addition, for another distributor, the price was not fixed or determinable. Therefore, revenue arising from these two distributors did not meet the criteria for recognizing revenue under GAAP in the originally filed financial statements. The restated financial statements now account for revenue associated with these two distributors on a cash basis.
The Company utilizes a government contracting agent through which it sells to facilities of the United States Department of Veterans Affairs and the United States Department of Defense under the agent's GSA Federal Supply Schedule (the "VA agent"). It became evident that the VA agent's financial condition was weak, and collectability of the receivable was not reasonably assured at the time of shipment (which is a required criterion for recognizing revenue). The restated financial statements now account for revenue associated with this distributor on a cash basis. The Company also erred in reporting revenue from the VA agent net of the VA agent's fees. The Company's accounting policy
F-41
OSIRIS THERAPEUTICS, INC.
NOTES TO CONSOLIDATED FINANCIAL STATEMENTS (Continued)
15. Selected Quarterly Data (Unaudited) (Continued)
requires that revenue arising from contractual arrangements of this type be reported at the gross price paid by the end user, and that the related fees be reported as a sales expense. The restated financial statements now account for revenue associated with this distributor on a gross basis.
The Company improperly recognized revenue from bill and hold transactions with one distributor as they did not meet the requirements for revenue recognition under GAAP with respect to bill and hold sales. The restated financial statements now account for revenue associated with this distributor when the title and risk of loss transfer to the end customer.
The Company inappropriately recognized revenue related to sales transactions through one distributor upon shipment at the Company's list price instead of the actual price the distributor sold to the end customer. The restated financial statements now account for revenue associated with this distributor when the title and risk of loss transfer to the end customer at the price obtained by distributor.
The Company entered into arrangements with two distributors to sell products in specific countries. The Company prematurely recognized revenue as the distributors have the right to return the product if regulatory approval is not achieved. The distributors were unable to obtain regulatory approval and title and risk of loss never passed to the distributors. The upfront payment received was deferred until the agreement was terminated. The restated financial statements do not reflect any product revenue associated with these distributors.
Consistent with corrections in the Company's revenue recognition, the Company subsequently recognized cost of goods sold and commission expense in the period that revenue was recognized. For unrecoverable costs (revenue never recognized), the Company expensed the cost of goods sold in the period upon notification of usage and expensed the commissions in the period they were paid. The product costs arising from the distributor sales transactions for which revenue has been reversed due to the "fixed or determinable" criteria have also been reversed and added back into inventory. Similarly, sales commission expenses incurred during 2015 in connection with those specific sales transactions for which revenue has been reversed have also been reversed. For revenue that was reversed due to the collectability of the transaction not being reasonably assured, the inventory was expensed when title and risk of loss related to the product sale transferred to the customer. Agent fees for those transactions were expensed when paid, which was generally upon the collection of the revenue.
Valuation of inventory and accounting for consigned inventory quantities
Management determined that there were errors in the valuation of the Company's finished goods inventory resulting from computational errors, failure to update and apply current cost information in the calculation of unit costs, and non-timely identification and write-off of products that were no longer salable as determined by the Company's quality assurance procedures. In addition, management determined the need to establish a reserve for consigned finished goods inventory as the Company had not adequately monitored the ultimate disposition of consigned goods whereby some were returned, or scrapped, or used by the consignee. Lastly, management determined the need to establish a reserve for work-in-process inventory which largely consists of product in quarantine pending the outcome of the Company's quality assurance procedures. This process results in a reasonably consistent identification of product that is unsalable.
F-42
OSIRIS THERAPEUTICS, INC.
NOTES TO CONSOLIDATED FINANCIAL STATEMENTS (Continued)
15. Selected Quarterly Data (Unaudited) (Continued)
Collection of invoiced fees
Management determined that it did not correctly assess the collectability of accounts receivable and had not determined an appropriate allowance for doubtful accounts as of March 31, 2015, June 30, 2015 and September 30, 2015. Upon further analysis, it was determined that certain previously recognized receivables were not collected due to issues other than the inability of the customer to pay. The Company concluded that customer non-payment for these reasons should be considered adjustments to revenue for the related transactions.
Classification of costs and expenses to income statement captions
Management determined that errors had been made in classification of costs and expenses to condensed consolidated statements of comprehensive income (loss) captions.
Other adjustments
In addition to the error corrections mentioned above, adjustments were made to the financial statements for various immaterial errors identified by management and the Audit Committee during the 2015 Quarterly Restatement process.
Tax effect of Restatement adjustments
The Company adjusted income tax expense for each quarter and year to date periods to account for the impact of the adjustments in the 2015 Quarterly Restatement described above.
F-43
OSIRIS THERAPEUTICS, INC.
NOTES TO CONSOLIDATED FINANCIAL STATEMENTS (Continued)
15. Selected Quarterly Data (Unaudited) (Continued)
Condensed Balance Sheets
(in thousands)
| |
Unaudited | |||||||||
|---|---|---|---|---|---|---|---|---|---|---|
| |
March 31, 2015 | |||||||||
| |
Previously Reported(A) |
Adjustments | Restated | |||||||
Assets |
||||||||||
Current Assets |
||||||||||
Cash and cash equivalents |
$ | 3,704 | $ | 96 | $ | 3,800 | ||||
Short- term investments |
35,367 | (110 | ) | 35,257 | ||||||
Trading securities |
8,162 | — | 8,162 | |||||||
Trade receivables, net |
29,162 | (15,472 | ) | 13,690 | ||||||
Inventory, net |
12,494 | (3,227 | ) | 9,267 | ||||||
Prepaid expenses and other current assets |
8,158 | 3,131 | 11,289 | |||||||
| | | | | | | | | | | |
Total current assets |
97,047 | (15,582 | ) | 81,465 | ||||||
Property and equipment, net |
2,165 | 11 | 2,176 | |||||||
Other assets |
95 | — | 95 | |||||||
| | | | | | | | | | | |
Total assets |
$ | 99,307 | $ | (15,571 | ) | $ | 83,736 | |||
| | | | | | | | | | | |
| | | | | | | | | | | |
| | | | | | | | | | | |
Liabilities and Equity |
||||||||||
Current liabilities |
||||||||||
Accounts payable |
$ | 4,040 | $ | 397 | $ | 4,437 | ||||
Accrued liabilities |
5,258 | 529 | 5,787 | |||||||
Other current liabilities |
1,667 | (269 | ) | 1,398 | ||||||
| | | | | | | | | | | |
Total current liabilities |
10,965 | 657 | 11,622 | |||||||
Other long-term liabilities |
3,586 | 642 | 4,228 | |||||||
| | | | | | | | | | | |
Total liabilities |
14,551 | 1,299 | 15,850 | |||||||
| | | | | | | | | | | |
Equity |
||||||||||
Common stock |
35 | — | 35 | |||||||
Additional paid-in capital |
288,759 | (423 | ) | 288,336 | ||||||
Accumulated other comprehensive loss |
(144 | ) | 1 | (143 | ) | |||||
Accumulated deficit |
(203,894 | ) | (16,448 | ) | (220,342 | ) | ||||
| | | | | | | | | | | |
Total equity |
84,756 | (16,870 | ) | 67,886 | ||||||
| | | | | | | | | | | |
Total liabilities and equity |
$ | 99,307 | $ | (15,571 | ) | $ | 83,736 | |||
| | | | | | | | | | | |
| | | | | | | | | | | |
| | | | | | | | | | | |
- (A)
- Previously reported balances are from the Quarterly Report on Form 10-Q for the quarter ended September 30, 2015.
F-44
OSIRIS THERAPEUTICS, INC.
NOTES TO CONSOLIDATED FINANCIAL STATEMENTS (Continued)
15. Selected Quarterly Data (Unaudited) (Continued)
Condensed Balance Sheets
(in thousands)
| |
Unaudited | |||||||||
|---|---|---|---|---|---|---|---|---|---|---|
| |
June 30, 2015 | |||||||||
| |
Previously Reported(A) |
Adjustments | Restated | |||||||
Assets |
||||||||||
Current Assets |
||||||||||
Cash and cash equivalents |
$ | 1,563 | $ | 678 | $ | 2,241 | ||||
Short- term investments |
37,083 | (663 | ) | 36,420 | ||||||
Trading securities |
8,300 | — | 8,300 | |||||||
Trade receivables, net |
34,781 | (18,591 | ) | 16,190 | ||||||
Inventory, net |
13,903 | (4,553 | ) | 9,350 | ||||||
Prepaid expenses and other current assets |
1,943 | 3,524 | 5,467 | |||||||
| | | | | | | | | | | |
Total current assets |
97,573 | (19,605 | ) | 77,968 | ||||||
Property and equipment, net |
2,077 | 64 | 2,141 | |||||||
Other assets |
95 | — | 95 | |||||||
| | | | | | | | | | | |
Total assets |
$ | 99,745 | $ | (19,541 | ) | $ | 80,204 | |||
| | | | | | | | | | | |
| | | | | | | | | | | |
| | | | | | | | | | | |
Liabilities and Equity |
||||||||||
Current liabilities |
||||||||||
Accounts payable |
$ | 2,680 | $ | (105 | ) | $ | 2,575 | |||
Accrued liabilities |
5,417 | 2,130 | 7,547 | |||||||
Other current liabilities |
1,667 | (49 | ) | 1,618 | ||||||
| | | | | | | | | | | |
Total current liabilities |
9,764 | 1,976 | 11,740 | |||||||
Other long-term liabilities |
3,256 | 654 | 3,910 | |||||||
| | | | | | | | | | | |
Total liabilities |
13,020 | 2,630 | 15,650 | |||||||
| | | | | | | | | | | |
Equity |
||||||||||
Common stock |
35 | — | 35 | |||||||
Additional paid-in capital |
289,991 | (565 | ) | 289,426 | ||||||
Accumulated other comprehensive loss |
(202 | ) | 1 | (201 | ) | |||||
Accumulated deficit |
(203,099 | ) | (21,607 | ) | (224,706 | ) | ||||
| | | | | | | | | | | |
Total equity |
86,725 | (22,171 | ) | 64,554 | ||||||
| | | | | | | | | | | |
Total liabilities and equity |
$ | 99,745 | $ | (19,541 | ) | $ | 80,204 | |||
| | | | | | | | | | | |
| | | | | | | | | | | |
| | | | | | | | | | | |
- (A)
- Previously reported balances are from the Quarterly Report on Form 10-Q for the quarter ended September 30, 2015.
F-45
OSIRIS THERAPEUTICS, INC.
NOTES TO CONSOLIDATED FINANCIAL STATEMENTS (Continued)
15. Selected Quarterly Data (Unaudited) (Continued)
Condensed Balance Sheets
(in thousands)
| |
Unaudited | |||||||||
|---|---|---|---|---|---|---|---|---|---|---|
| |
September 30, 2015 | |||||||||
| |
Previously Reported(A) |
Adjustments | Restated | |||||||
Assets |
||||||||||
Current Assets |
||||||||||
Cash and cash equivalents |
$ | 15,799 | $ | 1,966 | $ | 17,765 | ||||
Short- term investments |
24,452 | (1,935 | ) | 22,517 | ||||||
Trading securities |
3,090 | — | 3,090 | |||||||
Trade accounts receivable, net of reserves |
37,857 | (19,956 | ) | 17,901 | ||||||
Inventory, net |
15,818 | (6,346 | ) | 9,472 | ||||||
Prepaid expenses and other current assets |
1,729 | 3,583 | 5,312 | |||||||
| | | | | | | | | | | |
Total current assets |
98,745 | (22,688 | ) | 76,057 | ||||||
Property and equipment, net |
2,180 | (110 | ) | 2,070 | ||||||
Other assets |
95 | — | 95 | |||||||
| | | | | | | | | | | |
Total assets |
$ | 101,020 | $ | (22,798 | ) | $ | 78,222 | |||
| | | | | | | | | | | |
| | | | | | | | | | | |
| | | | | | | | | | | |
Liabilities and Equity |
||||||||||
Current liabilities |
||||||||||
Accounts payable |
$ | 4,326 | $ | (102 | ) | $ | 4,224 | |||
Accrued liabilities |
5,298 | 3,072 | 8,370 | |||||||
Dividends payable |
6,890 | — | 6,890 | |||||||
Other current liabilities |
1,667 | (150 | ) | 1,517 | ||||||
| | | | | | | | | | | |
Total current liabilities |
18,181 | 2,820 | 21,001 | |||||||
Other long-term liabilities |
2,995 | 593 | 3,588 | |||||||
| | | | | | | | | | | |
Total liabilities |
21,176 | 3,413 | 24,589 | |||||||
| | | | | | | | | | | |
Equity |
||||||||||
Common stock |
35 | — | 35 | |||||||
Additional paid-in capital |
283,964 | (915 | ) | 283,049 | ||||||
Accumulated other comprehensive loss |
(94 | ) | — | (94 | ) | |||||
Accumulated deficit |
(204,061 | ) | (25,296 | ) | (229,357 | ) | ||||
| | | | | | | | | | | |
Total equity |
79,844 | (26,211 | ) | 53,633 | ||||||
| | | | | | | | | | | |
Total liabilities and equity |
$ | 101,020 | $ | (22,798 | ) | $ | 78,222 | |||
| | | | | | | | | | | |
| | | | | | | | | | | |
| | | | | | | | | | | |
- (A)
- Previously reported balances are from the Quarterly Report on Form 10-Q for the quarter ended September 30, 2015.
F-46
OSIRIS THERAPEUTICS, INC.
NOTES TO CONSOLIDATED FINANCIAL STATEMENTS (Continued)
15. Selected Quarterly Data (Unaudited) (Continued)
Condensed Consolidated Statements of Comprehensive income (loss)
(in thousands, except per share data)
| |
Unaudited | ||||||||||||||||
|---|---|---|---|---|---|---|---|---|---|---|---|---|---|---|---|---|---|
| |
Previously Reported(A) | |
|||||||||||||||
| |
2015 | |
|||||||||||||||
| |
Quarter Ended March 31 |
Quarter Ended June 30 |
Six Months Ended June 30 |
Quarter Ended September 30 |
Nine Months Ended September 30 |
Quarter Ended December 31 |
|||||||||||
Revenue |
$ | 19,215 | $ | 22,731 | $ | 41,946 | $ | 25,331 | $ | 67,277 | (B) | ||||||
Cost of revenue |
4,290 | 5,142 | 9,432 | 5,390 | 14,822 | ||||||||||||
| | | | | | | | | | | | | | | | | | |
Gross profit |
14,925 | 17,589 | 32,514 | 19,941 | 52,455 | ||||||||||||
| | | | | | | | | | | | | | | | | | |
Operating expenses: |
|||||||||||||||||
Research and development |
1,640 | 2,287 | 3,927 | 2,306 | 6,233 | ||||||||||||
Sales and marketing(C) |
12,736 | 14,029 | 26,765 | 17,325 | 44,090 | ||||||||||||
General and administrative |
— | — | — | — | — | ||||||||||||
| | | | | | | | | | | | | | | | | | |
Total operating expenses |
14,376 | 16,316 | 30,692 | 19,631 | 50,323 | ||||||||||||
| | | | | | | | | | | | | | | | | | |
Income from operations |
549 | 1,273 | 1,822 | 310 | 2,132 | ||||||||||||
Other income (expense) |
146 | (202 | ) | (56 | ) | (1,100 | ) | (1,156 | ) | ||||||||
| | | | | | | | | | | | | | | | | | |
Income (loss) before income taxes |
695 | 1,071 | 1,766 | (790 | ) | 976 | |||||||||||
Income tax (expense) benefit |
(210 | ) | (276 | ) | (486 | ) | 132 | (354 | ) | ||||||||
| | | | | | | | | | | | | | | | | | |
Net income (loss) |
485 | 795 | 1,280 | (658 | ) | 622 | |||||||||||
Other comprehensive income (loss) |
|||||||||||||||||
Unrealized gain (loss) on investments |
(90 | ) | (58 | ) | (148 | ) | 108 | (40 | ) | ||||||||
| | | | | | | | | | | | | | | | | | |
Comprehensive income (loss) |
$ | 395 | $ | 737 | $ | 1,132 | $ | (550 | ) | $ | 582 | ||||||
| | | | | | | | | | | | | | | | | | |
| | | | | | | | | | | | | | | | | | |
| | | | | | | | | | | | | | | | | | |
Basic and diluted net income (loss) per share: |
|||||||||||||||||
Basic and diluted |
$ | 0.02 | $ | 0.02 | $ | 0.04 | $ | (0.02 | ) | $ | 0.02 | ||||||
| | | | | | | | | | | | | | | | | | |
| | | | | | | | | | | | | | | | | | |
| | | | | | | | | | | | | | | | | | |
- (A)
- Previously
reported balances are from the Quarterly Report on Form 10-Q for the quarter ended September 30, 2015.
- (B)
- Fourth
quarter 2015 information is being presented for the first time.
- (C)
- Sales and marketing, as previously reported, also included general and administrative expense of $3,482, $6,278, and $5,463 for the quarters ended March 31, June 30 and September 30, respectively. These balances have been reclassified to conform to the current year presentation.
F-47
OSIRIS THERAPEUTICS, INC.
NOTES TO CONSOLIDATED FINANCIAL STATEMENTS (Continued)
15. Selected Quarterly Data (Unaudited) (Continued)
Condensed Consolidated Statements of Comprehensive income (loss)
(in thousands, except per share data)
| |
Unaudited | ||||||||||||||||
|---|---|---|---|---|---|---|---|---|---|---|---|---|---|---|---|---|---|
| |
Adjustments | |
|||||||||||||||
| |
2015 | |
|||||||||||||||
| |
Quarter Ended March 31 |
Quarter Ended June 30 |
Six Months Ended June 30 |
Quarter Ended September 30 |
Nine Months Ended September 30 |
Quarter Ended December 31 |
|||||||||||
Revenue |
$ | (6,953 | ) | $ | (3,654 | ) | $ | (10,607 | ) | $ | (1,769 | ) | $ | (12,376 | ) | (A) | |
Cost of revenue |
1,343 | 296 | 1,639 | 2,511 | 4,150 | ||||||||||||
| | | | | | | | | | | | | | | | | | |
Gross profit |
(8,296 | ) | (3,950 | ) | (12,246 | ) | (4,280 | ) | (16,526 | ) | |||||||
| | | | | | | | | | | | | | | | | | |
Operating expenses: |
|||||||||||||||||
Research and development |
(637 | ) | (1,190 | ) | (1,827 | ) | (1,069 | ) | (2,896 | ) | |||||||
Sales and marketing |
3,132 | 6,492 | 9,624 | 3,589 | 13,213 | ||||||||||||
General and administrative |
(1,251 | ) | (3,797 | ) | (5,048 | ) | (3,039 | ) | (8,087 | ) | |||||||
| | | | | | | | | | | | | | | | | | |
Total operating expenses |
1,244 | 1,505 | 2,749 | (519 | ) | 2,230 | |||||||||||
| | | | | | | | | | | | | | | | | | |
Loss from operations |
(9,540 | ) | (5,455 | ) | (14,995 | ) | (3,761 | ) | (18,756 | ) | |||||||
Other income (expense) |
616 | 44 | 660 | (75 | ) | 585 | |||||||||||
| | | | | | | | | | | | | | | | | | |
Income (loss) before income taxes |
(8,924 | ) | (5,411 | ) | (14,335 | ) | (3,836 | ) | (18,171 | ) | |||||||
Income tax (expense) benefit |
(283 | ) | 252 | (31 | ) | (157 | ) | (188 | ) | ||||||||
| | | | | | | | | | | | | | | | | | |
Net income (loss) |
(9,207 | ) | (5,159 | ) | (14,366 | ) | (3,993 | ) | (18,359 | ) | |||||||
Other comprehensive loss |
|||||||||||||||||
Unrealized gain (loss) on investments |
1 | — | 1 | (1 | ) | — | |||||||||||
| | | | | | | | | | | | | | | | | | |
Comprehensive income (loss) |
$ | (9,206 | ) | $ | (5,159 | ) | $ | (14,365 | ) | $ | (3,994 | ) | $ | (18,359 | ) | ||
| | | | | | | | | | | | | | | | | | |
| | | | | | | | | | | | | | | | | | |
| | | | | | | | | | | | | | | | | | |
- (A)
- Fourth quarter 2015 information is being presented for the first time.
F-48
OSIRIS THERAPEUTICS, INC.
NOTES TO CONSOLIDATED FINANCIAL STATEMENTS (Continued)
15. Selected Quarterly Data (Unaudited) (Continued)
Condensed Consolidated Statements of Comprehensive income (loss)
(in thousands, except per share data)
| |
Unaudited | ||||||||||||||||||
|---|---|---|---|---|---|---|---|---|---|---|---|---|---|---|---|---|---|---|---|
| |
Restated | |
|||||||||||||||||
| |
2015 | |
|||||||||||||||||
| |
Quarter Ended March 31 |
Quarter Ended June 30 |
Six Months Ended June 30 |
Quarter Ended September 30 |
Nine Months Ended September 30 |
Quarter Ended December 31 |
|||||||||||||
Revenue |
$ | 12,262 | $ | 19,077 | $ | 31,339 | $ | 23,562 | $ | 54,901 | $ | 24,806 | |||||||
Cost of revenue |
5,633 | 5,438 | 11,071 | 7,901 | 18,972 | 8,048 | |||||||||||||
| | | | | | | | | | | | | | | | | | | | |
Gross profit |
6,629 | 13,639 | 20,268 | 15,661 | 35,929 | 16,758 | |||||||||||||
| | | | | | | | | | | | | | | | | | | | |
Operating expenses |
|||||||||||||||||||
Research and development |
1,003 | 1,097 | 2,100 | 1,237 | 3,337 | 1,530 | |||||||||||||
Sales and marketing |
12,386 | 14,243 | 26,629 | 15,451 | 42,080 | 14,547 | |||||||||||||
General and administrative |
2,231 | 2,481 | 4,712 | 2,424 | 7,136 | 2,362 | |||||||||||||
Settlement of SEC and shareholder actions |
— | — | — | — | — | 15,212 | |||||||||||||
| | | | | | | | | | | | | | | | | | | | |
Total operating expenses |
15,620 | 17,821 | 33,441 | 19,112 | 52,553 | 33,651 | |||||||||||||
| | | | | | | | | | | | | | | | | | | | |
Loss from operations |
(8,991 | ) | (4,182 | ) | (13,173 | ) | (3,451 | ) | (16,624 | ) | (16,893 | ) | |||||||
Other income (expense) |
762 | (158 | ) | 604 | (1,175 | ) | (571 | ) | (1,122 | ) | |||||||||
| | | | | | | | | | | | | | | | | | | | |
Loss before income taxes |
(8,229 | ) | (4,340 | ) | (12,569 | ) | (4,626 | ) | (17,195 | ) | (18,015 | ) | |||||||
Income tax (expense) benefit |
(493 | ) | (24 | ) | (517 | ) | (25 | ) | (542 | ) | (2 | ) | |||||||
| | | | | | | | | | | | | | | | | | | | |
Net Loss |
(8,722 | ) | (4,364 | ) | (13,086 | ) | (4,651 | ) | (17,737 | ) | (18,017 | ) | |||||||
Other comprehensive income (loss) |
|||||||||||||||||||
Unrealized gain (loss) on investments |
(89 | ) | (58 | ) | (147 | ) | 107 | (40 | ) | (49 | ) | ||||||||
| | | | | | | | | | | | | | | | | | | | |
Comprehensive income Loss |
$ | (8,811 | ) | $ | (4,422 | ) | $ | (13,233 | ) | $ | (4,544 | ) | $ | (17,777 | ) | $ | (18,066 | ) | |
| | | | | | | | | | | | | | | | | | | | |
| | | | | | | | | | | | | | | | | | | | |
| | | | | | | | | | | | | | | | | | | | |
Basic and diluted net income (loss) per share: |
|||||||||||||||||||
Basic and diluted |
$ | (0.25 | ) | $ | (0.13 | ) | $ | (0.38 | ) | $ | (0.14 | ) | $ | (0.52 | ) | $ | (0.52 | ) | |
| | | | | | | | | | | | | | | | | | | | |
| | | | | | | | | | | | | | | | | | | | |
| | | | | | | | | | | | | | | | | | | | |
Weighted average common shares outstanding: |
|||||||||||||||||||
Basic and diluted |
34,358 | 34,411 | 34,384 | 34,444 | 34,404 | 34,472 | |||||||||||||
Impact of Prior Period Errors
Subsequent to the filing of the Amendment to its Annual Report on Form 10-K for the year ended December 31, 2014, the Company identified errors that existed in its financial statements as of December 31, 2014. These items have been recorded in the first quarter of 2015 in the foregoing condensed consolidated statements of comprehensive income (loss). Had these items been properly recorded in their proper period in 2014, net loss would have decreased by approximately $1.1 million for the three-month period ended March 31, 2015, the six-month period ended June 30, 2015, the nine-month period ended September 30, 2015 and the year ended December 31, 2015.
F-49
OSIRIS THERAPEUTICS, INC.
NOTES TO CONSOLIDATED FINANCIAL STATEMENTS (Continued)
15. Selected Quarterly Data (Unaudited) (Continued)
Condensed Statements of Cash Flows
(in thousands, except per share data)
| |
Unaudited | |||||||||
|---|---|---|---|---|---|---|---|---|---|---|
| |
Three Months Ended March 31, 2015 | |||||||||
| |
Previously Reported(A) |
Adjustments | Restated | |||||||
CASH FLOWS FROM OPERATING ACTIVITIES |
||||||||||
Net income (loss) |
$ | 485 | $ | (9,207 | ) | $ | (8,722 | ) | ||
Adjustments to reconcile net income (loss) to net cash used in operating activities: |
||||||||||
(Gain) loss on disposal of fixed assets |
— | (159 | ) | (159 | ) | |||||
Realized loss on investments |
19 | — | 19 | |||||||
Depreciation |
267 | (35 | ) | 232 | ||||||
Stock-based compensation expense (benefit) |
852 | (164 | ) | 688 | ||||||
Changes in operating assets and liabilities |
||||||||||
Accounts receivable, net |
(5,927 | ) | 5,610 | (317 | ) | |||||
Inventory, net |
(1,334 | ) | 1,891 | 557 | ||||||
Prepaid expenses, and other assets |
4,872 | (940 | ) | 3,932 | ||||||
Accounts payable, accrued expenses, and other liabilities |
407 | 2,685 | 3,092 | |||||||
| | | | | | | | | | | |
Net cash used in operating activities |
(359 | ) | (319 | ) | (678 | ) | ||||
CASH FLOWS FROM INVESTING ACTIVITIES |
||||||||||
Purchase of property and equipment, net |
(345 | ) | 175 | (170 | ) | |||||
Proceeds from sale of investments |
22,221 | 111 | 22,332 | |||||||
Purchases of investments |
(20,392 | ) | 183 | (20,209 | ) | |||||
| | | | | | | | | | | |
Net cash provided by investing activities |
1,484 | 469 | 1,953 | |||||||
CASH FLOWS FROM FINANCING ACTIVITIES |
||||||||||
Principal payments on capital lease obligations |
(11 | ) | — | (11 | ) | |||||
Proceeds from the exercise of options to purchase common stock |
328 | — | 328 | |||||||
Windfall tax benefit from stock-based compensation |
54 | (54 | ) | — | ||||||
| | | | | | | | | | | |
Net cash provided by financing activities |
371 | (54 | ) | 317 | ||||||
NET INCREASE IN CASH AND CASH EQUIVALENTS |
1,496 |
96 |
1,592 |
|||||||
Cash and cash equivalents, beginning of period |
2,208 | — | 2,208 | |||||||
| | | | | | | | | | | |
Cash and cash equivalents, end of period |
$ | 3,704 | $ | 96 | $ | 3,800 | ||||
| | | | | | | | | | | |
| | | | | | | | | | | |
| | | | | | | | | | | |
SUPPLEMENTAL INFORMATION |
||||||||||
Cash paid during the period for: |
||||||||||
Income taxes |
$ | 422 | $ | 500 | $ | 922 | ||||
- (A)
- Previously reported balances are from the Quarterly Report on Form 10-Q for the quarter ended September 30, 2015.
F-50
OSIRIS THERAPEUTICS, INC.
NOTES TO CONSOLIDATED FINANCIAL STATEMENTS (Continued)
15. Selected Quarterly Data (Unaudited) (Continued)
Condensed Statements of Cash Flows
(in thousands, except per share data)
| |
Unaudited | |||||||||
|---|---|---|---|---|---|---|---|---|---|---|
| |
Six Months Ended June 30, 2015 | |||||||||
| |
Previously Reported(A) |
Adjustments | Restated | |||||||
CASH FLOWS FROM OPERATING ACTIVITIES |
||||||||||
Net income (loss) |
$ | 1,280 | $ | (14,366 | ) | $ | (13,086 | ) | ||
Adjustments to reconcile net income (loss) to net cash used in operating activities: |
||||||||||
(Gain) loss on disposal of fixed assets |
— | (150 | ) | (150 | ) | |||||
Realized and unrealized loss on investments |
350 | 12 | 362 | |||||||
Depreciation |
547 | (62 | ) | 485 | ||||||
Stock-based compensation expense (benefit) |
1,631 | (239 | ) | 1,392 | ||||||
Guaranteed payments related to trading securities |
6,198 | (6,198 | ) | — | ||||||
Changes in operating assets and liabilities |
||||||||||
Accounts receivable, net |
(11,546 | ) | 8,729 | (2,817 | ) | |||||
Inventory, net |
(2,743 | ) | 3,217 | 474 | ||||||
Prepaid expenses, and other current assets |
4,492 | (1,749 | ) | 2,743 | ||||||
Accounts payable, accrued expenses, and other liabilities |
(1,113 | ) | 4,017 | 2,904 | ||||||
| | | | | | | | | | | |
Net cash used in operating activities |
(904 | ) | (6,789 | ) | (7,693 | ) | ||||
CASH FLOWS FROM INVESTING ACTIVITIES |
||||||||||
Purchase of property and equipment, net |
(537 | ) | 140 | (397 | ) | |||||
Proceeds from sale of investments |
52,902 | 907 | 53,809 | |||||||
Purchases of investments |
(52,919 | ) | 344 | (52,575 | ) | |||||
Proceeds from guaranteed payment |
— | 6,198 | 6,198 | |||||||
| | | | | | | | | | | |
Net cash provided by (used in) investing activities |
(554 | ) | 7,589 | 7,035 | ||||||
CASH FLOWS FROM FINANCING ACTIVITIES |
||||||||||
Principal payments on capital lease obligations |
(22 | ) | (1 | ) | (23 | ) | ||||
Proceeds from the exercise of options to purchase common stock |
716 | (2 | ) | 714 | ||||||
Windfall tax benefit from stock-based compensation |
119 | (119 | ) | — | ||||||
| | | | | | | | | | | |
Net cash provided by financing activities |
813 | (122 | ) | 691 | ||||||
NET INCREASE (DECREASE) IN CASH AND CASH EQUIVALENTS |
(645 |
) |
678 |
33 |
||||||
Cash and cash equivalents, beginning of period |
2,208 | — | 2,208 | |||||||
| | | | | | | | | | | |
Cash and cash equivalents, end of period |
$ | 1,563 | $ | 678 | $ | 2,241 | ||||
| | | | | | | | | | | |
| | | | | | | | | | | |
| | | | | | | | | | | |
SUPPLEMENTAL INFORMATION |
||||||||||
Cash paid during the period for: |
||||||||||
Income taxes |
$ | 1,994 | — | $ | 1,994 | |||||
- (A)
- Previously reported balances are from the Quarterly Report on Form 10-Q for the quarter ended September 30, 2015.
F-51
OSIRIS THERAPEUTICS, INC.
NOTES TO CONSOLIDATED FINANCIAL STATEMENTS (Continued)
15. Selected Quarterly Data (Unaudited) (Continued)
Condensed Statements of Cash Flows
(in thousands, except per share data)
| |
Unaudited | |||||||||
|---|---|---|---|---|---|---|---|---|---|---|
| |
Nine Months Ended September 30, 2015 | |||||||||
| |
Previously Reported(A) |
Adjustments | Restated | |||||||
CASH FLOWS FROM OPERATING ACTIVITIES |
||||||||||
Net income (loss) |
$ | 622 | $ | (18,359 | ) | $ | (17,737 | ) | ||
Adjustments to reconcile net income (loss) to net cash used in operating activities: |
||||||||||
(Gain) loss on disposal of fixed assets |
— | (134 | ) | (134 | ) | |||||
Realized and unrealized loss on investments |
1,548 | 59 | 1,607 | |||||||
Depreciation |
850 | (96 | ) | 754 | ||||||
Stock-based compensation expense (benefit) |
2,381 | (269 | ) | 2,112 | ||||||
Changes in operating assets and liabilities |
||||||||||
Accounts receivable, net |
(14,622 | ) | 10,094 | (4,528 | ) | |||||
Inventory, net |
(4,658 | ) | 5,010 | 352 | ||||||
Prepaid expenses, and other current assets |
4,463 | (1,512 | ) | 2,951 | ||||||
Accounts payable, accrued expenses, and other liabilities |
165 | 4,799 | 4,964 | |||||||
| | | | | | | | | | | |
Net cash used in operating activities |
(9,251 | ) | (408 | ) | (9,659 | ) | ||||
CASH FLOWS FROM INVESTING ACTIVITIES |
||||||||||
Purchase of property and equipment, net |
(943 | ) | 332 | (611 | ) | |||||
Proceeds from sale of investments |
146,958 | (42,948 | ) | 104,010 | ||||||
Purchases of investments |
(129,981 | ) | 45,127 | (84,854 | ) | |||||
Proceeds from Mesoblast payment |
6,198 | — | 6,198 | |||||||
| | | | | | | | | | | |
Net cash provided by investing activities |
22,232 | 2,511 | 24,743 | |||||||
CASH FLOWS FROM FINANCING ACTIVITIES |
||||||||||
Principal payments on capital lease obligations |
(34 | ) | (1 | ) | (35 | ) | ||||
Proceeds from the exercise of options to purchase common stock |
507 | 207 | 714 | |||||||
Repurchases of common stock |
— | (206 | ) | (206 | ) | |||||
Windfall tax benefit from stock-based compensation |
137 | (137 | ) | — | ||||||
| | | | | | | | | | | |
Net cash provided by financing activities |
610 | (137 | ) | 473 | ||||||
NET INCREASE IN CASH AND CASH EQUIVALENTS |
13,591 |
1,966 |
15,557 |
|||||||
Cash and cash equivalents, beginning of period |
2,208 | — | 2,208 | |||||||
| | | | | | | | | | | |
Cash and cash equivalents, end of period |
$ | 15,799 | $ | 1,966 | $ | 17,765 | ||||
| | | | | | | | | | | |
| | | | | | | | | | | |
| | | | | | | | | | | |
SUPPLEMENTAL INFORMATION |
||||||||||
Cash paid during the period for: |
||||||||||
Income taxes |
$ | 2,424 | $ | — | $ | 2,424 | ||||
NON-CASH FINANCING TRANSACTIONS |
||||||||||
Cash dividends declared |
$ | 6,890 | $ | 1 | $ | 6,891 | ||||
- (A)
- Previously reported balances are from the Quarterly Report on Form 10-Q for the quarter ended September 30, 2015.
F-52