Attached files
| file | filename |
|---|---|
| 8-K - 8-K - Air Transport Services Group, Inc. | a2018form8kcovermar21seapo.htm |
The global leader in midsize wide-body
leasing and operating solutions
Seaport Global Securities LLC
2018 Transports & Industrials Conference
Miami, Florida
March 21, 2018
Joe Hete
President & CEO
joe.hete@atsginc.com
Quint Turner
CFO
quint.turner@atsginc.com
(937) 366-2303
Joe Roux
Treasurer
Joe.roux@atsginc.com
Cautionary Statement Regarding Forward-Looking Statements
2
Except for historical information contained herein, the matters discussed in this presentation contain forward-looking statements
as that term is defined in the Private Securities Litigation Reform Act of 1995. These forward-looking statements involve risks and
uncertainties that are inherently difficult to predict. Words such as “projects,” “believes,” “anticipates,” “will,” “estimates,” “plans,”
“expects,” “intends” and similar words and expressions are intended to identify forward-looking statements. These forward-
looking statements are based on expectations, estimates and projections as of the date of this presentation and address
activities events or developments that we expect, believe or anticipate will or may occur in the future. Although we believe our
estimates and assumptions to be reasonable, they are inherently uncertain and involve a number of risks and uncertainties that
are beyond our control. In addition, management’s assumptions about future events may prove to be inaccurate. We caution all
readers that the forward-looking statements contained in this presentation are not guarantees of future performance, and we
cannot assure any reader that those statements will be realized or the forward-looking events and circumstances will occur.
There are a number of important factors that could cause Air Transport Services Group's ("ATSG's") actual results to differ
materially from those indicated by such forward-looking statements. These factors include, but are not limited to, changes in
market demand for our assets and services; our operating airlines' ability to maintain on-time service and control costs; the cost
and timing with respect to which we are able to purchase and modify aircraft to a cargo configuration; fluctuations in ATSG's
traded share price, which may result in mark-to-market charges on certain financial instruments; the number, timing and
scheduled routes of our aircraft deployments to customers, and other factors (including those listed under the heading “Risk
Factors”) that are contained from time to time in ATSG's filings with the U.S. Securities and Exchange Commission, including its
Annual Report on Form 10-K and Quarterly Reports on Form 10-Q. Readers should carefully review this presentation and should
not place undue reliance on ATSG's forward-looking statements. These forward-looking statements were based on information,
plans and estimates as of the date of this presentation. ATSG undertakes no obligation to update any forward-looking statements
to reflect changes in underlying assumptions or factors, new information, future events or other changes.
2
$197
$212
$268
$310E
2015 2016 2017 2018E
$619
$769
$1,068
2015 2016 2017
ATSG at a Glance
3
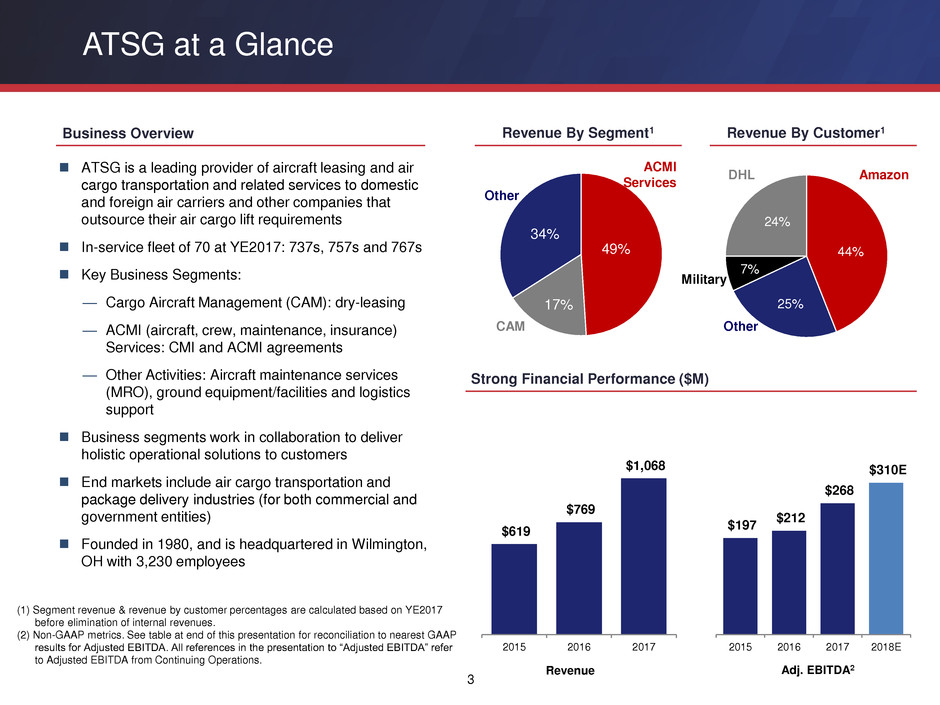
ATSG is a leading provider of aircraft leasing and air
cargo transportation and related services to domestic
and foreign air carriers and other companies that
outsource their air cargo lift requirements
In-service fleet of 70 at YE2017: 737s, 757s and 767s
Key Business Segments:
— Cargo Aircraft Management (CAM): dry-leasing
— ACMI (aircraft, crew, maintenance, insurance)
Services: CMI and ACMI agreements
— Other Activities: Aircraft maintenance services
(MRO), ground equipment/facilities and logistics
support
Business segments work in collaboration to deliver
holistic operational solutions to customers
End markets include air cargo transportation and
package delivery industries (for both commercial and
government entities)
Founded in 1980, and is headquartered in Wilmington,
OH with 3,230 employees
(1) Segment revenue & revenue by customer percentages are calculated based on YE2017
before elimination of internal revenues.
(2) Non-GAAP metrics. See table at end of this presentation for reconciliation to nearest GAAP
results for Adjusted EBITDA. All references in the presentation to “Adjusted EBITDA” refer
to Adjusted EBITDA from Continuing Operations.
Revenue Adj. EBITDA2
Revenue By Segment1 Revenue By Customer1 Business Overview
Strong Financial Performance ($M)
34%
17%
49%
ACMI
Services
CAM
Other
24%
44%
25%
7%
Amazon DHL
Other
Military
ATSG Operating Entities
Dry Leasing
Engine Leasing
Engine PBC
Services
CMI Services
ACMI Services
Wet2Dry transitioning
On-Demand Charter
Heavy and Line Maintenance
Component Services
Engineering Services
Passenger to Freighter Conversions
Boeing and Airbus Capability
Sort & Gateway
Operations
GSE Leasing
Facility
Support
Services
MHE Service
Leasing CMI & ACMI Services Aircraft Maintenance
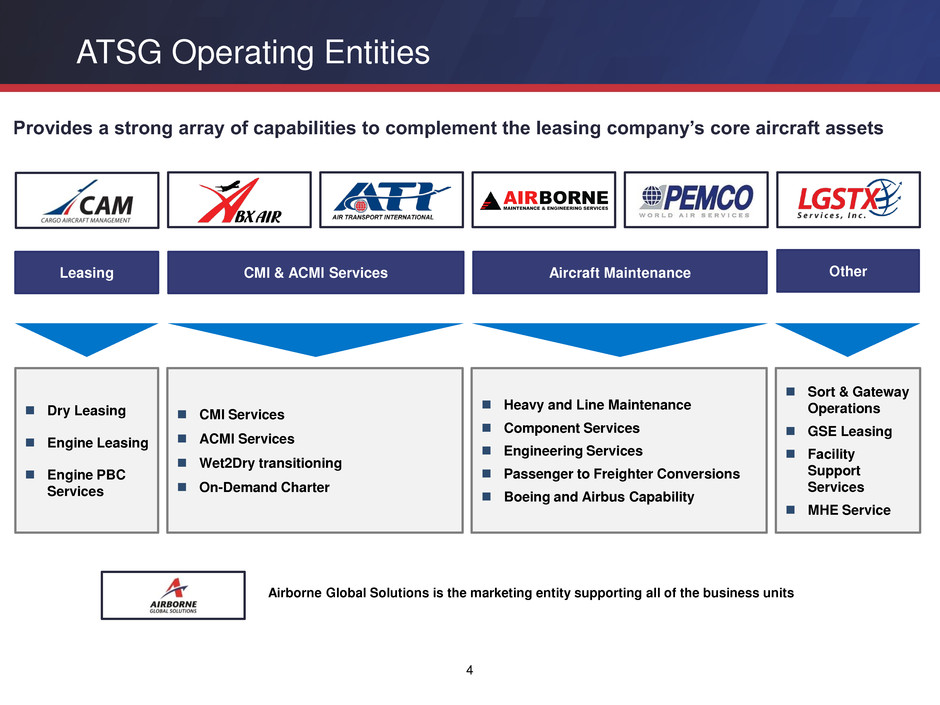
Provides a strong array of capabilities to complement the leasing company’s core aircraft assets
Airborne Global Solutions is the marketing entity supporting all of the business units
Other
4
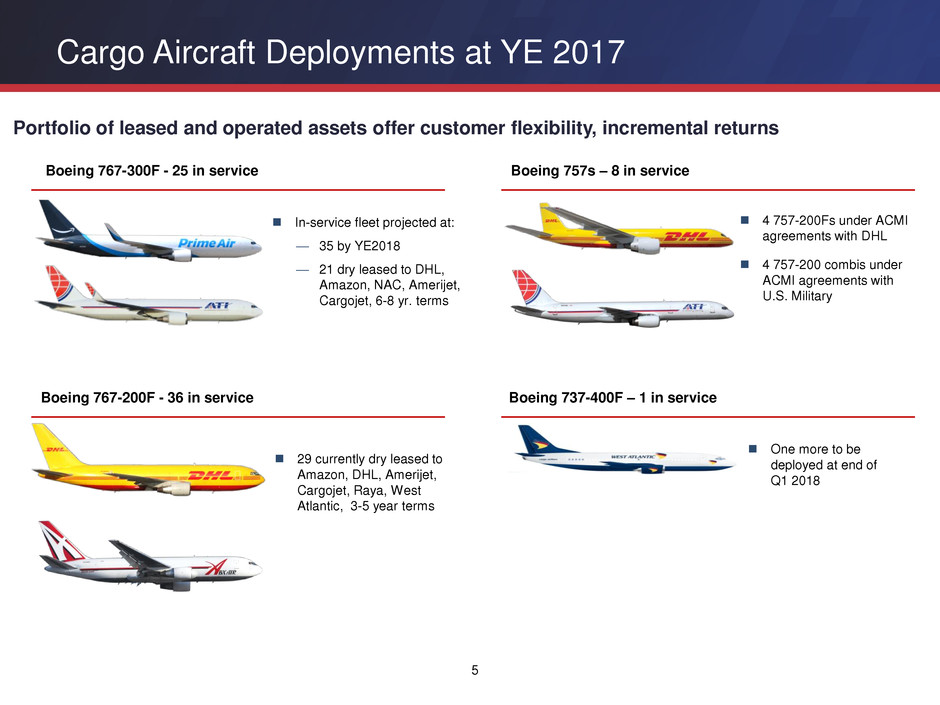
Cargo Aircraft Deployments at YE 2017
Boeing 767-300F - 25 in service
In-service fleet projected at:
— 35 by YE2018
— 21 dry leased to DHL,
Amazon, NAC, Amerijet,
Cargojet, 6-8 yr. terms
Boeing 757s – 8 in service
4 757-200Fs under ACMI
agreements with DHL
4 757-200 combis under
ACMI agreements with
U.S. Military
Boeing 737-400F – 1 in service
One more to be
deployed at end of
Q1 2018
Boeing 767-200F - 36 in service
29 currently dry leased to
Amazon, DHL, Amerijet,
Cargojet, Raya, West
Atlantic, 3-5 year terms
5
Portfolio of leased and operated assets offer customer flexibility, incremental returns
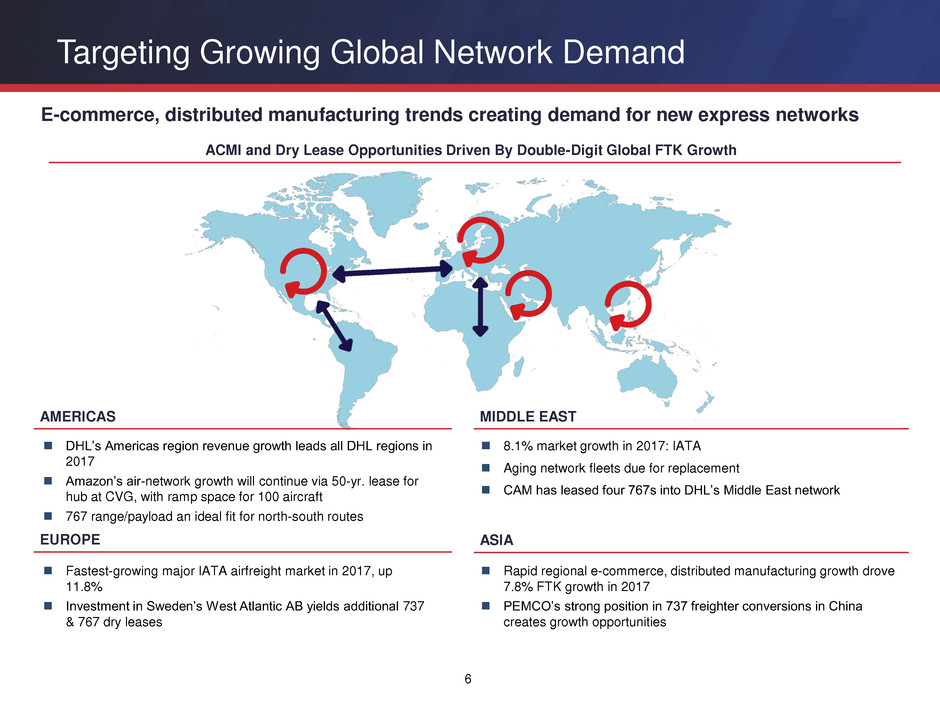
Targeting Growing Global Network Demand
6
8.1% market growth in 2017: IATA
Aging network fleets due for replacement
CAM has leased four 767s into DHL’s Middle East network
DHL’s Americas region revenue growth leads all DHL regions in
2017
Amazon’s air-network growth will continue via 50-yr. lease for
hub at CVG, with ramp space for 100 aircraft
767 range/payload an ideal fit for north-south routes
E-commerce, distributed manufacturing trends creating demand for new express networks
ACMI and Dry Lease Opportunities Driven By Double-Digit Global FTK Growth
MIDDLE EAST
ASIA
AMERICAS
EUROPE
Rapid regional e-commerce, distributed manufacturing growth drove
7.8% FTK growth in 2017
PEMCO’s strong position in 737 freighter conversions in China
creates growth opportunities
Fastest-growing major IATA airfreight market in 2017, up
11.8%
Investment in Sweden’s West Atlantic AB yields additional 737
& 767 dry leases
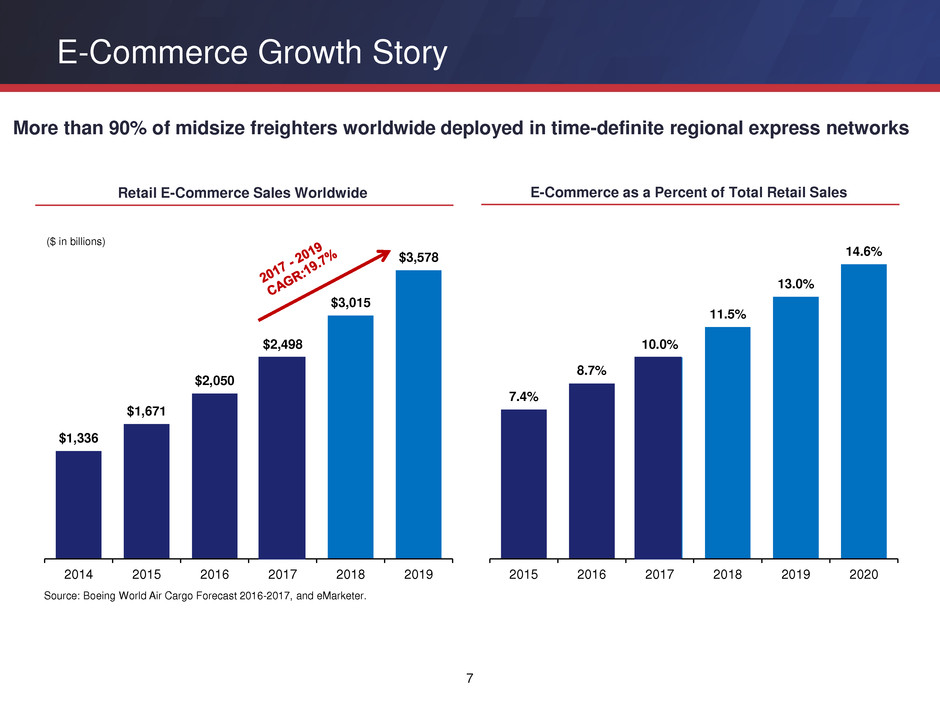
$1,336
$1,671
$2,050
$2,498
$3,015
$3,578
2014 2015 2016 2017 2018 2019
7.4%
8.7%
10.0%
11.5%
13.0%
14.6%
2015 2016 2017 2018 2019 2020
E-Commerce Growth Story
7
Source: Boeing World Air Cargo Forecast 2016-2017, and eMarketer.
($ in billions)
More than 90% of midsize freighters worldwide deployed in time-definite regional express networks
Retail E-Commerce Sales Worldwide E-Commerce as a Percent of Total Retail Sales
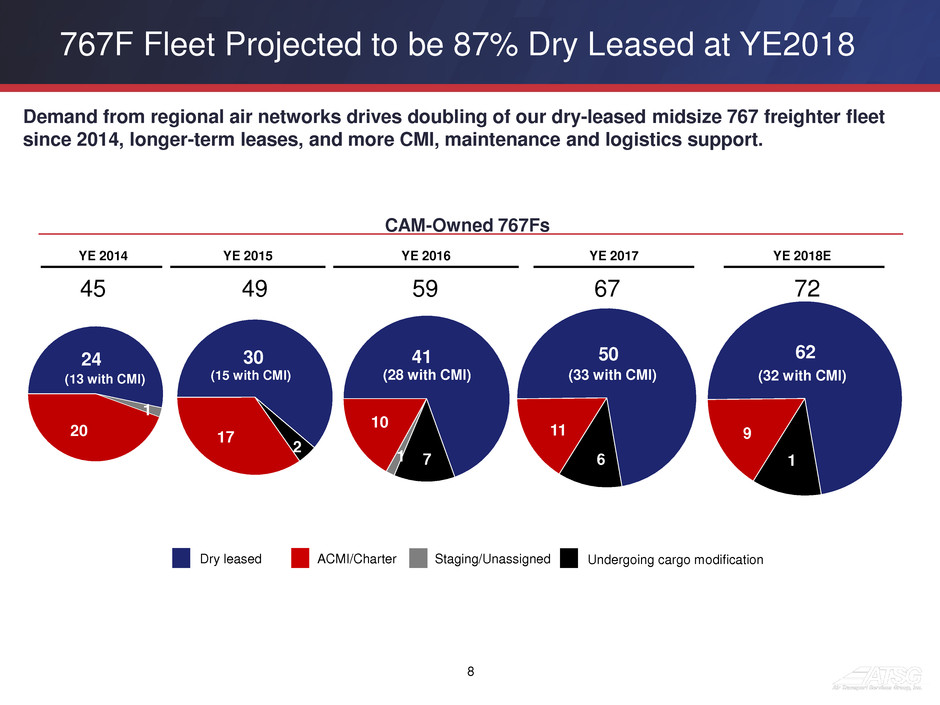
767F Fleet Projected to be 87% Dry Leased at YE2018
8
17
30
2
(15 with CMI)
Dry leased ACMI/Charter Staging/Unassigned Undergoing cargo modification
11
50
6
(33 with CMI)
10
41
7
(28 with CMI)
1
8
20
24
1
(13 with CMI)
2
Demand from regional air networks drives doubling of our dry-leased midsize 767 freighter fleet
since 2014, longer-term leases, and more CMI, maintenance and logistics support.
CAM-Owned 767Fs
YE 2014 YE 2015 YE 2016 YE 2017
9
62
1
(32 with CMI)
YE 2018E
45 49 59 67 72
In March 2016, entered into contract with CAM to lease twenty B767
freighter aircraft
— 12 B767-200 freighters under 5-year contracts
— 8 B767-300 freighters under 7-year contracts
Five-year CMI agreement to operate aircraft
All 20 aircraft now leased; final lease started in August 2017
LGSTX Services subsidiary provides gateway services
Long-term contracts since August 2003
CAM leases of sixteen 767 freighter aircraft under long-term and
short-term leases
ACMI and CMI agreements to operate 757 and 767 aircraft
Americas remains fastest growing region for DHL Express;
2017 revenues up 15.8% in Americas ex currency effects
Long-term Relationships with Key Customers
9
Provide 757 Combi aircraft to serve passenger and freight requests
Sole provider of combi service to military for 20+ years
Contract renewed effective January 2018 through December 2021
DHL
Amazon
U.S. Military
Other Business
10
6 large hangars, 600,000+ sq. ft. in OH & FL
Heavy maintenance
Narrowbody / widebody support of Boeing, Airbus &
regional aircraft types
Established relationships with major carriers in U.S. and
abroad
Contracts with Delta, American & Frontier for fleet
maintenance
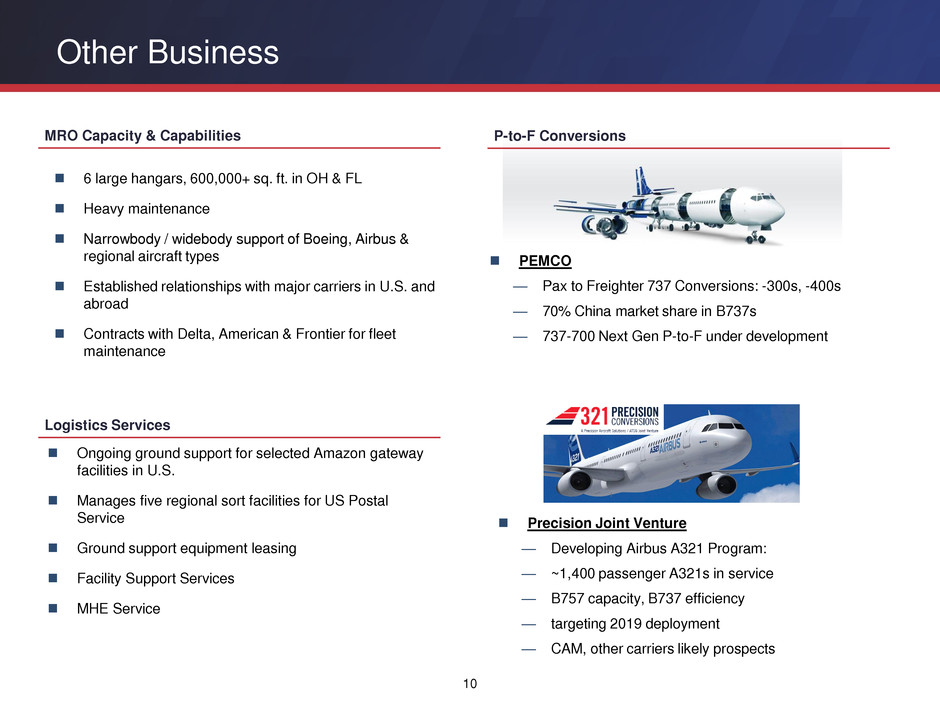
PEMCO
— Pax to Freighter 737 Conversions: -300s, -400s
— 70% China market share in B737s
— 737-700 Next Gen P-to-F under development
Precision Joint Venture
— Developing Airbus A321 Program:
— ~1,400 passenger A321s in service
— B757 capacity, B737 efficiency
— targeting 2019 deployment
— CAM, other carriers likely prospects
Ongoing ground support for selected Amazon gateway
facilities in U.S.
Manages five regional sort facilities for US Postal
Service
Ground support equipment leasing
Facility Support Services
MHE Service
MRO Capacity & Capabilities
Logistics Services
P-to-F Conversions
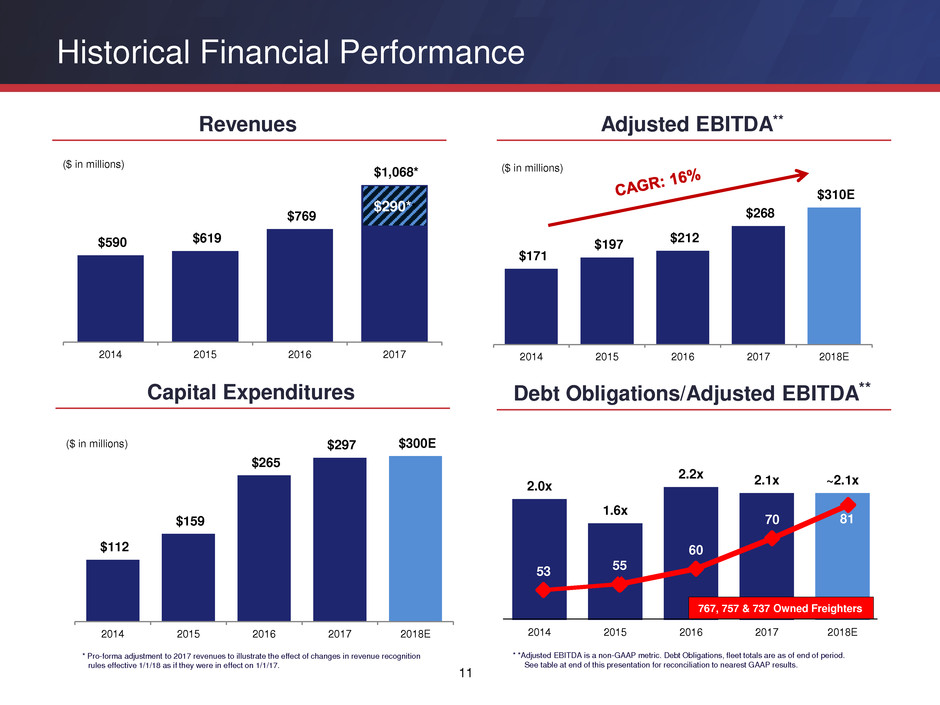
2.0x
1.6x
2.2x 2.1x ~2.1x
2014 2015 2016 2017 2018E
53 55
60
70 81
* *Adjusted EBITDA is a non-GAAP metric. Debt Obligations, fleet totals are as of end of period.
See table at end of this presentation for reconciliation to nearest GAAP results.
767, 757 & 737 Owned Freighters
11
$171
$197
$212
$268
$310E
2014 2015 2016 2017 2018E
Adjusted EBITDA** Revenues
Historical Financial Performance
($ in millions)
Capital Expenditures
($ in millions)
Debt Obligations/Adjusted EBITDA**
($ in millions)
$590 $619
$769
$1,068*
2014 2015 2016 2017
$112
$159
$265
$297 $300E
2014 2015 2016 2017 2018E
$290**
* Pro-forma adjustment to 2017 revenues to illustrate the effect of changes in revenue recognition
rules effective 1/1/18 as if they were in effect on 1/1/17.
$212
$268
2017 Results
12
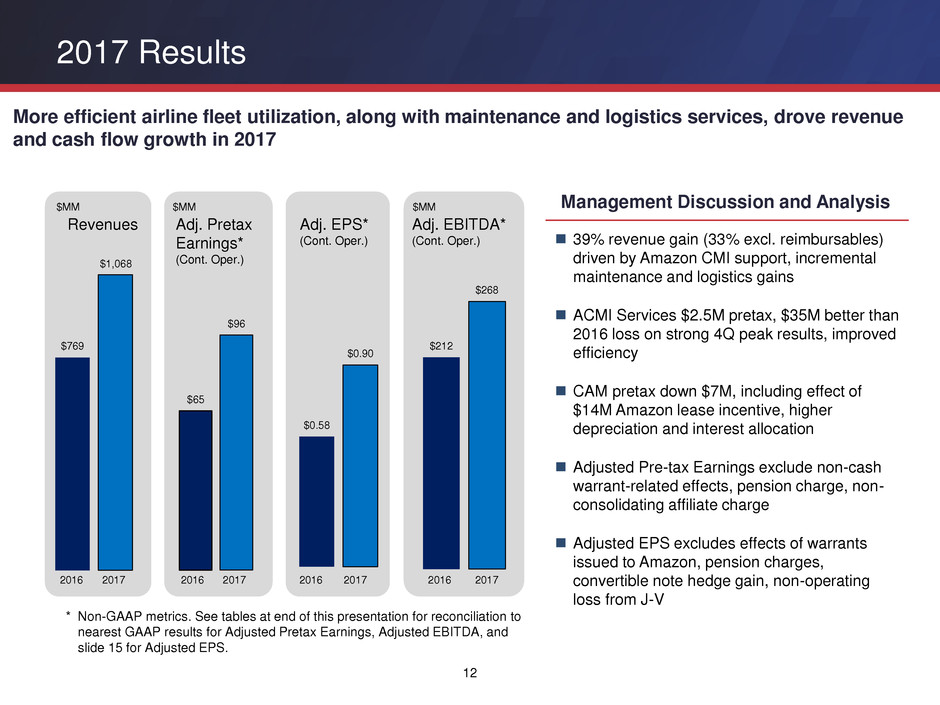
39% revenue gain (33% excl. reimbursables)
driven by Amazon CMI support, incremental
maintenance and logistics gains
ACMI Services $2.5M pretax, $35M better than
2016 loss on strong 4Q peak results, improved
efficiency
CAM pretax down $7M, including effect of
$14M Amazon lease incentive, higher
depreciation and interest allocation
Adjusted Pre-tax Earnings exclude non-cash
warrant-related effects, pension charge, non-
consolidating affiliate charge
Adjusted EPS excludes effects of warrants
issued to Amazon, pension charges,
convertible note hedge gain, non-operating
loss from J-V
Revenues Adj. Pretax
Earnings*
(Cont. Oper.)
Adj. EPS*
(Cont. Oper.)
Adj. EBITDA*
(Cont. Oper.)
2017
* Non-GAAP metrics. See tables at end of this presentation for reconciliation to
nearest GAAP results for Adjusted Pretax Earnings, Adjusted EBITDA, and
slide 15 for Adjusted EPS.
$MM $MM $MM
More efficient airline fleet utilization, along with maintenance and logistics services, drove revenue
and cash flow growth in 2017
Management Discussion and Analysis
$769
$65
$96
$0.58
$0.90
2016 2016 2017 2016 2017 2016 2017
$1,068
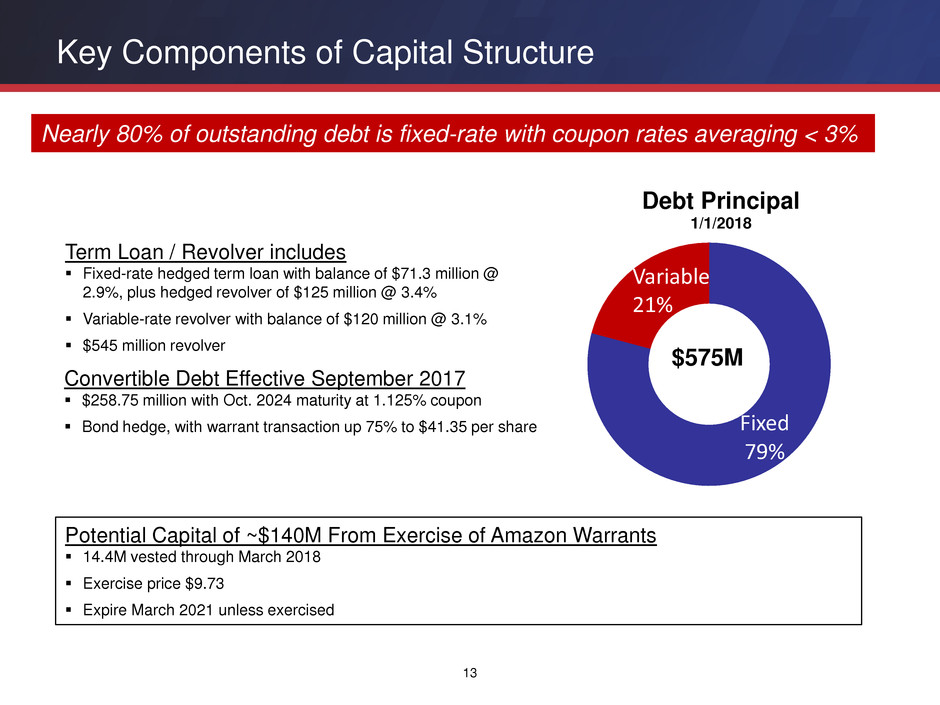
Key Components of Capital Structure
Term Loan / Revolver includes
Fixed-rate hedged term loan with balance of $71.3 million @
2.9%, plus hedged revolver of $125 million @ 3.4%
Variable-rate revolver with balance of $120 million @ 3.1%
$545 million revolver
Fixed
79%
Debt Principal
1/1/2018
Convertible Debt Effective September 2017
$258.75 million with Oct. 2024 maturity at 1.125% coupon
Bond hedge, with warrant transaction up 75% to $41.35 per share
Variable
21%
$575M
Nearly 80% of outstanding debt is fixed-rate with coupon rates averaging < 3%
Potential Capital of ~$140M From Exercise of Amazon Warrants
14.4M vested through March 2018
Exercise price $9.73
Expire March 2021 unless exercised
13
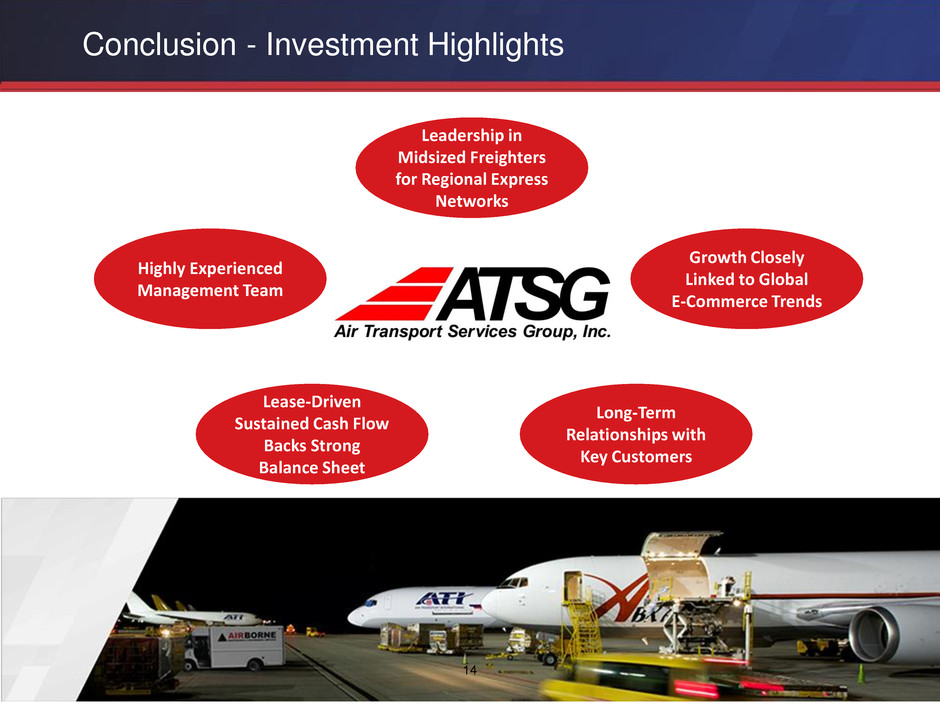
Conclusion - Investment Highlights
14
Growth Closely
Linked to Global
E-Commerce Trends
Long-Term
Relationships with
Key Customers
Leadership in
Midsized Freighters
for Regional Express
Networks
Highly Experienced
Management Team
Lease-Driven
Sustained Cash Flow
Backs Strong
Balance Sheet
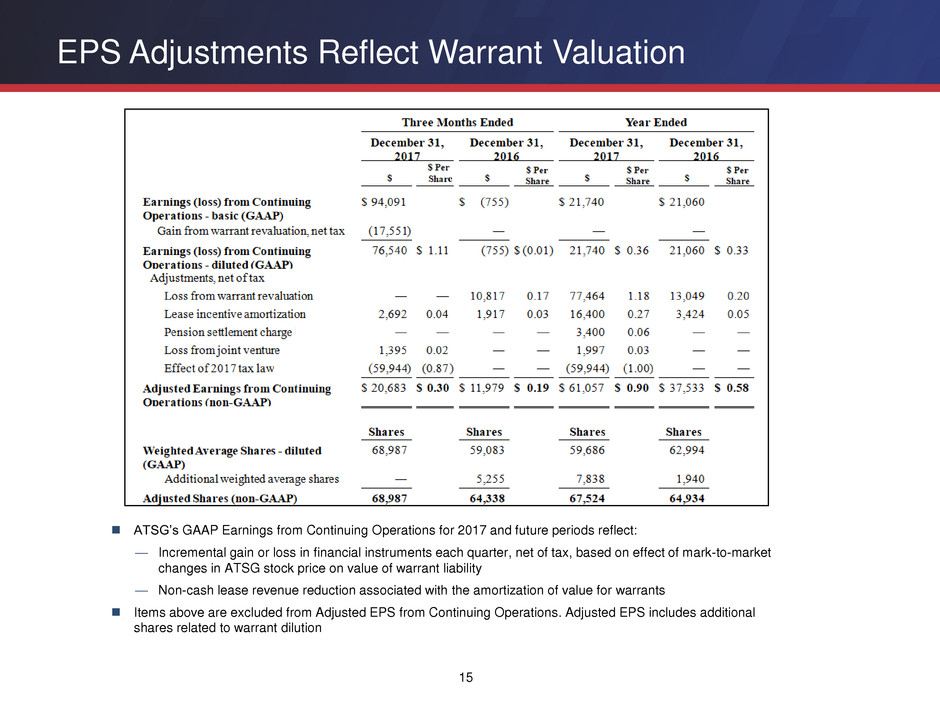
EPS Adjustments Reflect Warrant Valuation
15
ATSG’s GAAP Earnings from Continuing Operations for 2017 and future periods reflect:
— Incremental gain or loss in financial instruments each quarter, net of tax, based on effect of mark-to-market
changes in ATSG stock price on value of warrant liability
— Non-cash lease revenue reduction associated with the amortization of value for warrants
Items above are excluded from Adjusted EPS from Continuing Operations. Adjusted EPS includes additional
shares related to warrant dilution
e
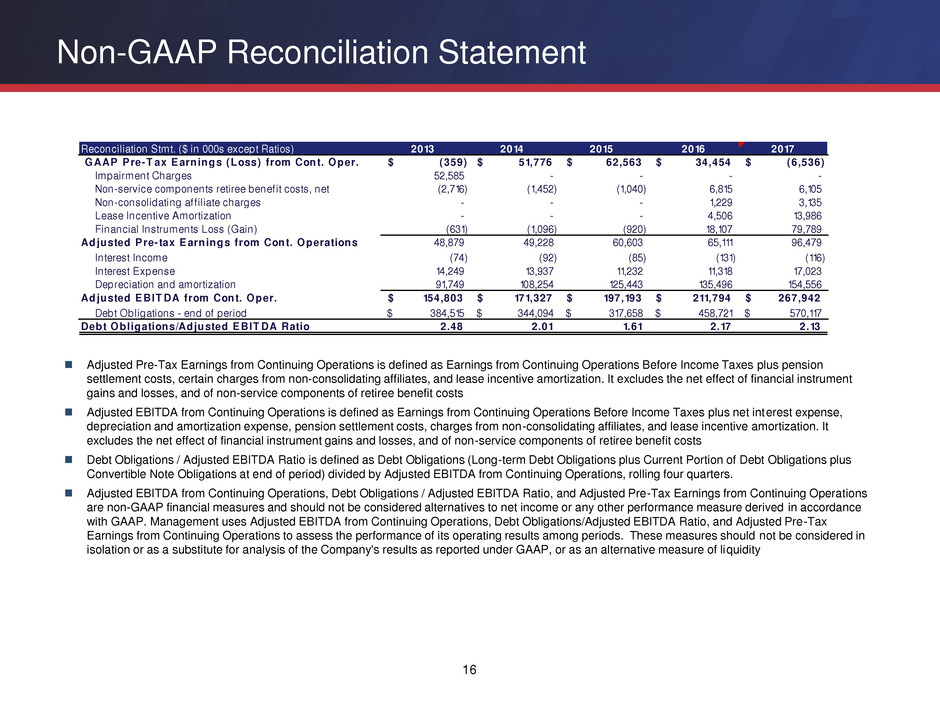
Non-GAAP Reconciliation Statement
16
Adjusted Pre-Tax Earnings from Continuing Operations is defined as Earnings from Continuing Operations Before Income Taxes plus pension
settlement costs, certain charges from non-consolidating affiliates, and lease incentive amortization. It excludes the net effect of financial instrument
gains and losses, and of non-service components of retiree benefit costs
Adjusted EBITDA from Continuing Operations is defined as Earnings from Continuing Operations Before Income Taxes plus net interest expense,
depreciation and amortization expense, pension settlement costs, charges from non-consolidating affiliates, and lease incentive amortization. It
excludes the net effect of financial instrument gains and losses, and of non-service components of retiree benefit costs
Debt Obligations / Adjusted EBITDA Ratio is defined as Debt Obligations (Long-term Debt Obligations plus Current Portion of Debt Obligations plus
Convertible Note Obligations at end of period) divided by Adjusted EBITDA from Continuing Operations, rolling four quarters.
Adjusted EBITDA from Continuing Operations, Debt Obligations / Adjusted EBITDA Ratio, and Adjusted Pre-Tax Earnings from Continuing Operations
are non-GAAP financial measures and should not be considered alternatives to net income or any other performance measure derived in accordance
with GAAP. Management uses Adjusted EBITDA from Continuing Operations, Debt Obligations/Adjusted EBITDA Ratio, and Adjusted Pre-Tax
Earnings from Continuing Operations to assess the performance of its operating results among periods. These measures should not be considered in
isolation or as a substitute for analysis of the Company's results as reported under GAAP, or as an alternative measure of liquidity
2013 2014 2015 2016 2017
(359)$ 51,776$ 62,563$ 34,454$ (6,536)$
Impairment Charges 52,585 - - - -
Non-service components retiree benefit costs, net (2,716) (1,452) (1,040) 6,815 6,105
Non-consolidating aff iliate charges - - - 1,229 3,135
Lease Incentive Amortization - - - 4,506 13,986
Financial Instruments Loss (Gain) (631) (1,096) (920) 18,107 79,789
48,879 49,228 60,603 65,111 96,479
Interest Income (74) (92) (85) (131) (116)
Interest Expense 14,249 13,937 11,232 11,318 17,023
Depreciation and amortization 91,749 108,254 125,443 135,496 154,556
154,803$ 171,327$ 197,193$ 211,794$ 267,942$
384,515$ 344,094$ 317,658$ 458,721$ 570,117$
2.48 2.01 1.61 2.17 2.13
Reconciliation Stmt. ($ in 000s except Ratios)
Debt Obligations/Adjusted E BIT DA Ratio
GAAP P re-T ax E arnings (Loss) f rom Cont. Oper.
Adjusted E BIT DA from Cont. Oper.
Debt Obligations - end of period
Adjusted P re- tax E arnings f rom Cont. Operations
