Attached files
| file | filename |
|---|---|
| EX-32.1 - EXHIBIT 32.1 - Aleris Corp | ex321-10k123117.htm |
| EX-31.2 - EXHIBIT 31.2 - Aleris Corp | ex312-10k123117.htm |
| EX-31.1 - EXHIBIT 31.1 - Aleris Corp | ex311-10k123117.htm |
| EX-21.1 - EXHIBIT 21.1 - Aleris Corp | exhibit211subsidiarylistin.htm |
| EX-10.7.2 - EXHIBIT 10.7.2 - Aleris Corp | ex1072-formoramendtoemplmt.htm |
UNITED STATES
SECURITIES AND EXCHANGE COMMISSION
Washington, D.C. 20549
FORM 10-K
x Annual Report Pursuant to Section 13 or 15(d) of the Securities Exchange Act of 1934 | ||||
For the Fiscal Year Ended December 31, 2017 | ||||
or | ||||
¨ Transition Report Pursuant to Section 13 or 15(d) of the Securities Exchange Act of 1934 | ||||
For the transition period from ____________________ to _____________________ | ||||
Commission File Number: 333-185443
_________________________________________
Aleris Corporation
(Exact name of registrant as specified in its charter)
__________________________________________
Delaware | 27-1539594 | |||
(State or other jurisdiction of incorporation or organization) | (I.R.S. Employer Identification No.) | |||
25825 Science Park Drive, Suite 400
Cleveland, Ohio 44122-7392
(Address of principal executive offices) (Zip code)
(216) 910-3400
(Registrant’s telephone number, including area code)
SECURITIES REGISTERED PURSUANT TO SECTION 12(b) OF THE ACT: None
SECURITIES REGISTERED PURSUANT TO SECTION 12(g) OF THE ACT: None
______________________________________________
Indicate by check mark if the registrant is a well-known seasoned issuer, as defined in Rule 405 of the Securities Act. Yes ¨ No x
Indicate by check mark if the registrant is not required to file reports pursuant to Section 13 or Section 15(d) of the Act. Yes x No ¨
Indicate by check mark whether the registrant (1) has filed all reports required to be filed by Section 13 or 15(d) of the Securities Exchange Act of 1934 during the preceding 12 months (or for such shorter period that the registrant was required to file such reports), and (2) has been subject to such filing requirements for the past 90 days. Yes ¨ No x
(Note: Registrant is a voluntary filer of reports required to be filed by certain companies under Sections 13 and 15(d) of the Securities Exchange Act of 1934 and has filed all reports that would have been required during the preceding 12 months, had it been subject to such filing requirements.)
Indicate by check mark whether the registrant has submitted electronically and posted on its corporate Web site, if any, every Interactive Data File required to be submitted and posted pursuant to Rule 405 of Regulation S-T (§ 232.405 of this chapter) during the preceding 12 months (or for such shorter period that the registrant was required to submit and post such files). Yes x No ¨
Indicate by check mark if disclosure of delinquent filers pursuant to Item 405 of Regulation S-K is not contained herein, and will not be contained, to the best of registrant’s knowledge, in definitive proxy or information statements incorporated by reference in Part III of this Form 10-K or any amendment to this Form 10-K. x
Indicate by check mark whether the registrant is a large accelerated filer, an accelerated filer, a non-accelerated filer, a smaller reporting company, or ermerging growth company. See the definitions of “large accelerated filer”, “accelerated filer”, “smaller reporting company” and “emerging growth company” in Rule 12b-2 of the Exchange Act.
Large accelerated filer ¨ Accelerated filer¨ Non-accelerated filer x Smaller reporting company ¨ Emerging growth company ¨
If an emerging growth company, indicate by check mark if the registrant has elected not to use the extended transition period for complying with any new or revised financial accounting standards provided pursuant to Section 13(a) of the Exchange Act. ¨
Indicate by check mark whether the registrant is a shell company (as defined in Rule 12b-2 of the Exchange Act). Yes ¨ No x
The registrant is a privately held corporation. As of June 30, 2017, the last business day of the registrant’s most recently completed second fiscal quarter, there was no established public trading market for the common stock of the registrant and therefore, an aggregate market value of the registrant’s common stock is not determinable.
There were 32,219,528 shares of the registrant’s common stock, par value $0.01 per share, outstanding as of February 15, 2018.
DOCUMENTS INCORPORATED BY REFERENCE: None
PART I | Page | |
Item 1. | ||
Item 1A. | ||
Item 1B. | ||
Item 2. | ||
Item 3. | ||
Item 4. | ||
PART II | ||
Item 5. | ||
Item 6. | ||
Item 7. | ||
Item 7A. | ||
Item 8. | ||
Item 9. | ||
Item 9A. | ||
Item 9B. | ||
PART III | ||
Item 10. | ||
Item 11. | ||
Item 12. | ||
Item 13. | ||
Item 14. | ||
PART IV | ||
Item 15. | ||
Item 16. | ||
Signatures | ||
2
PART I
ITEM 1. BUSINESS.
General
Aleris Corporation is a Delaware corporation with its principal executive offices located in Cleveland, Ohio. We are a holding company and currently conduct our business and operations through our direct wholly owned subsidiary, Aleris International, Inc. and its consolidated subsidiaries. As used in this annual report on Form 10-K, unless otherwise specified or the context otherwise requires, “Aleris,” “we,” “our,” “us,” and the “Company” refer to Aleris Corporation and its consolidated subsidiaries. Aleris International, Inc. is referred to herein as “Aleris International.”
The Company is majority owned by Oaktree Capital Management, L.P. (“Oaktree”) or its respective subsidiaries. The investment funds managed by Oaktree or its respective subsidiaries that are invested in the Company are referred to collectively as the “Oaktree Funds.”
On August 29, 2016, we entered into an Agreement and Plan of Merger (the “Merger Agreement”) with Zhongwang USA LLC, Zhongwang Aluminum Corporation, a direct, wholly owned subsidiary of Zhongwang USA (“Merger Sub”), and the stockholders representative party thereto, pursuant to which Merger Sub would have been merged with and into Aleris Corporation, on the terms and subject to the conditions set forth in the Merger Agreement, with Aleris Corporation as the surviving entity. The Merger Agreement automatically terminated by its terms on November 12, 2017.
On March 1, 2015, we finalized the sale of our Extrusions business to Sankyo Tateyama (“Sankyo”), a Japanese building products and extrusions manufacturer. This business included substantially all of the operations and assets previously reported in our Extrusions segment.
On February 27, 2015, we finalized the sale of our North American and European recycling and specification alloys businesses to Real Industry, Inc. (formerly known as Signature Group Holdings, Inc.) and certain of its affiliates. These businesses included substantially all of the operations and assets previously reported in our Recycling and Specification Alloys North America and Recycling and Specification Alloys Europe segments. The sale included 18 production facilities in North America and six in Europe.
We have reported the recycling and specification alloys and extrusions businesses as discontinued operations for all periods presented, and reclassified the results of operations of these businesses into a single caption on the accompanying Consolidated Statements of Operations as “Income (loss) from discontinued operations, net of tax.” For additional information, see Note 17, “Discontinued Operations,” to our audited consolidated financial statements included elsewhere in this annual report on Form 10-K. Except as otherwise indicated, the discussion of the Company’s business and financial information throughout this annual report on Form 10-K refers to the Company’s continuing operations and the financial position and results of operations of its continuing operations, while the presentation and discussion of our cash flows for the years ended December 31, 2015, 2014 and 2013 reflect the combined cash flows from our continuing and discontinued operations.
Available Information
We make available on or through our website (www.aleris.com) our reports on Forms 10-K, 10-Q and 8-K, and amendments thereto, as soon as reasonably practicable after we electronically file (or furnish, as applicable) such material with the Securities and Exchange Commission (“SEC”). The SEC maintains an internet site that contains these reports at www.sec.gov. We use our investor website (investor.aleris.com) as a channel of distribution of Company information. The information we post through this channel may be deemed material. Accordingly, investors should monitor this channel, in addition to following our press releases, SEC filings, and public conference calls and webcasts. None of the websites referenced in this annual report on Form 10-K or the information contained therein is incorporated herein by reference.
Company Overview
We are a global leader in the manufacture and sale of aluminum rolled products, with 13 production facilities located throughout North America, Europe and China. Our product portfolio ranges from the most technically demanding heat treated plate and sheet used in mission-critical applications to sheet produced through our low-cost continuous cast process. We possess a combination of technically advanced, flexible and low-cost manufacturing operations supported by an industry-leading research and development (“R&D”) platform. Our facilities are strategically located to serve our customers globally. Our diversified customer base includes a number of industry-leading companies such as Airbus, Audi, Boeing, Bombardier, Daimler, Embraer, Ford and Volvo. Our technological and R&D capabilities allow us to produce the most technically demanding products, many of which require close collaboration and, in some cases, joint development with our customers. For the year ended December 31, 2017, we generated revenues of $2.9 billion, of which approximately 55% were derived from North America, 37% were derived from Europe and the remaining 8% were derived from the rest of the world.
3
Company History
Our predecessor was formed at the end of 2004 through the merger of Commonwealth Industries, Inc. and IMCO Recycling, Inc. The predecessor’s business grew through a combination of organic growth and strategic acquisitions, the most significant of which was the 2006 acquisition of the downstream aluminum business of Corus Group plc (“Corus Aluminum”). The Corus Aluminum acquisition doubled our predecessor’s size and significantly expanded both its presence in Europe and its ability to manufacture higher value-added products, including aerospace and auto body sheet (“ABS”).
The predecessor was acquired by Texas Pacific Group (“TPG”) in December 2006 and taken private. In 2007, it sold its zinc business in order to focus on its core aluminum business. In 2009, the predecessor, along with certain of its U.S. subsidiaries, filed voluntary petitions for Chapter 11 bankruptcy protection in the United States Bankruptcy Court for the District of Delaware. The bankruptcy filings were the result of a liquidity crisis brought on by the global recession and financial crisis. The predecessor’s ability to respond to the liquidity crisis was constrained by its highly leveraged capital structure, which at filing included $2.7 billion of debt, resulting from the 2006 leveraged buyout of the predecessor by TPG. As a result of the severe economic decline, the predecessor experienced sudden and significant value reductions across each end-use industry it served and a precipitous decline in the London Metal Exchange (“LME”) price of aluminum. These factors reduced the availability of financing under the predecessor’s revolving credit facility and required the posting of cash collateral on aluminum hedges. The predecessor sought bankruptcy protection to alleviate its liquidity constraints and restructure its operations and financial position.
The Company was formed as a Delaware corporation in 2009 to acquire the assets and operations of the predecessor upon emergence from bankruptcy, which occurred on June 1, 2010. TPG exited our business during this time and we received significant support from new equity investors, led by the Oaktree Funds, the majority owner of Aleris Corporation, as well as certain investment funds managed by affiliates of Apollo Management Holdings, L.P. (“Apollo”) and Bain Capital Credit, LP (“Bain Capital Credit” and, together with the Oaktree Funds and Apollo, the “Investors”).
Since 2010, the Company has grown through the successful combination of strategic growth initiatives involving acquisitions, such as the 2014 acquisition of Nichols Aluminum LLC (“Nichols”), and investments in our existing facilities and in China. These initiatives were targeted at broadening our product offerings and geographic presence, diversifying our end-use customer base, increasing our scale and scope, and offering a higher value-added product mix. In 2015, we sold our recycling and specification alloys and extrusions businesses in order to focus on our aluminum rolled products business.
Business Segments
We report three operating segments based on the organizational structure that we use to evaluate performance, make decisions on resource allocations and perform business reviews of financial results. The Company’s operating segments (each of which is considered a reportable segment) are North America, Europe and Asia Pacific.
In addition to these reportable segments, we disclose corporate and other unallocated amounts, including start-up costs.
See Note 15, “Segment and Geographic Information,” to our audited consolidated financial statements included elsewhere in this annual report on Form 10-K for financial and geographic information about our segments.
4
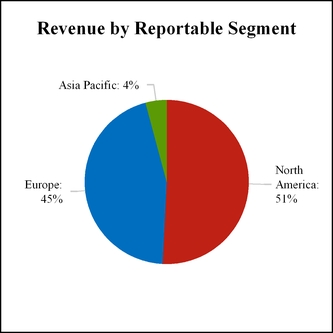
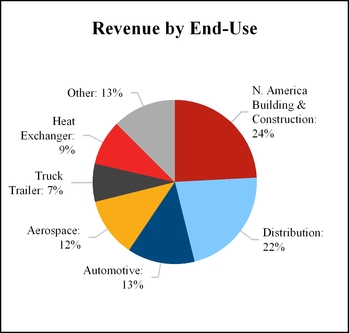
The following charts present the percentage of our consolidated revenue by reportable segment and by end-use for the year ended December 31, 2017:
North America
Our North America segment consists of nine manufacturing facilities located throughout the United States that produce rolled aluminum and coated products for the building and construction, truck trailer, automotive, consumer durables, other general industrial and distribution end-uses. Substantially all of our North America segment’s products are manufactured to specific customer requirements, using continuous cast and direct-chill technologies that provide us with significant flexibility to produce a wide range of products. Specifically, those products are integrated into, among other applications, building products, truck trailers, appliances, cars and recreational vehicles.
Our facility in Lewisport, Kentucky uses a direct-chill cast process which enables us to meet more technically demanding applications. We are investing approximately $425.0 million to build a new wide cold mill, two continuous annealing lines with pre-treatment (each, a “CALP”) and an automotive innovation center to support ABS production at our Lewisport facility (the “North America ABS Project”). We have also invested in upgrades to other key non-ABS equipment at the facility, including upgrading our ingot scalper and pre-heating furnace capabilities and widening the hot mill, to capture additional opportunities. Subsequent to a planned third quarter 2017 outage, which included a 60-day standstill of the facility’s hot mill, the Lewisport facility has started to ship autobody sheet and wide non-autobody sheet to customers using the re-engineered hot mill, the new wide cold mill and the first of the two CALPs. We have completed the construction and installation and are significantly through commissioning of the facility’s second CALP. We expect ABS shipments to meaningfully ramp up in 2018 and over the next several years based upon committed volumes and to account for a significantly higher percentage of our North America product mix. In particular, we have long term customer commitments for over 60% of our ABS capacity through 2025 with significant “take or pay” obligations. In connection with the North America ABS Project, the North America segment has been incurring costs associated with start-up activities, including the design and development of new products and processes, the manufacture of commissioning and trial products, and the development of sales and marketing efforts necessary to enter this new end-use. These start-up costs have been excluded from segment Adjusted EBITDA and segment income.
We have the largest footprint of continuous cast operations of any aluminum rolled products producer in North America. Our continuous cast operations have lower capital requirements and lower operating costs compared to our direct-chill cast operations. For our continuous cast operations, scrap input typically comprises over 90% of our overall metal needs, which provides substantial benefits, including metal cost savings. For the year ended December 31, 2017, approximately 99% of our North America revenues were derived using a formula pricing model which allows us to pass through risks from the volatility of aluminum price changes by charging a market-based aluminum price plus a conversion fee.
5
Our North America segment produces rolled aluminum products ranging from thickness (gauge) of 0.002 to 0.249 inches in widths of up to 84 inches. The following table summarizes our North America segment’s principal products, end-uses, major customers and competitors:
Principal end use/product category | Major customers | Competitors |
• Building and construction (roofing, rainware and siding) | • American Construction Metals, First American, Gentek Building Products, Kaycan, Midwest Metals, Omnimax, Ply Gem Industries, Quality Edge, Rollex | • Jupiter Aluminum, JW Aluminum, Arconic, Novelis |
• Metal distribution | • Champagne Metals, Metals USA, Reliance, Ryerson, Samuel & Son, Thyssenkrupp-KenMac | • Arconic, Novelis, Constellium, Ta-Chen, Asian-American, Metal Exchange |
• Truck trailer | • Great Dane, Hyundai Translead, Rockwell Metals, Utility Trailer | • Arconic, Novelis, Vulcan |
• Automotive | • Ford, Kamtek | • Arconic, Novelis, Constellium, Nanshan, AMAG, Hydro, Constellium UACJ JV |
• Consumer durables, specialty coil and sheet (cookware, fuel tanks, ventilation, cooling and lamp bases) | • ABB, Brunswick Boat Group, Cuprum Metales Laminados, Ermco Distribution Transformers, John R Wald | • Arconic, Novelis, Noranda, Skana Aluminum, Constellium |
• Converter foil, fins and tray materials | • D&W Fine Pack, HFA, Reynolds | • JW Aluminum, Gränges, Novelis, Skana Aluminum, SAPA |
Key operating and financial information for the segment is presented below:
North America | For the years ended December 31, | |||||||||||
(Dollars in millions, volumes in thousands of tons) | 2017 | 2016 | 2015 | |||||||||
Metric tons of finished product shipped | 462.0 | 486.3 | 492.8 | |||||||||
Revenues | $ | 1,467.8 | $ | 1,365.1 | $ | 1,532.8 | ||||||
Segment income (1) | $ | 88.0 | $ | 86.1 | $ | 107.9 | ||||||
Segment Adjusted EBITDA (1)(2) | $ | 96.5 | $ | 81.4 | $ | 109.1 | ||||||
Total segment assets | $ | 1,309.9 | $ | 1,180.2 | ||||||||
(1) | Segment income and segment Adjusted EBITDA exclude start-up operating losses and expenses incurred during the start-up period. For the years ended December 31, 2017, 2016 and 2015, start-up costs were $66.6 million, $41.5 million and $16.0 million, respectively. |
(2) | Segment Adjusted EBITDA is a non-GAAP financial measure. See Item 7. – “Management’s Discussion and Analysis of Financial Condition and Results of Operations – Our Segments” for a definition and discussion of segment Adjusted EBITDA and a reconciliation to segment income. |
Europe
Our Europe segment consists of two world-class aluminum rolling mills, one in Koblenz, Germany and the other in Duffel, Belgium, and an aluminum cast house in Germany. The segment produces aerospace plate and sheet, ABS, clad brazing sheet (clad aluminum material used for, among other applications, vehicle radiators and HVAC systems) and heat-treated plate for engineered product applications. Substantially all of our Europe segment’s products are manufactured to specific customer requirements using direct-chill cast technologies that allow us to use and offer a variety of alloys and products for a number of technically demanding end-uses, which command some of the highest margins in the industry.
For over a decade, we have been a leading supplier of automotive and aerospace aluminum rolled products in Europe. The technical and quality requirements needed to participate in these end-uses provides us with a competitive advantage. We continue to pursue technical and manufacturing initiatives, such as our wingskin project at our Koblenz, Germany facility, expected to be completed in the second half of 2018, which will allow us to produce aluminum for commercial aircraft wings to be used in the aerospace industry.
6
Our Europe segment produces rolled aluminum products ranging from thickness (gauge) of 0.00031 to 11.0 inches in widths of up to 138 inches. The following table summarizes our Europe segment’s principal products, end-uses, major customers and competitors:
Principal end use/product category | Major customers | Competitors |
• Aerospace plate and sheet | • Airbus, Boeing, Bombardier, Dassault, Embraer | • Arconic, AMAG, Constellium, Kaiser |
• Auto body sheet (inner, outer and structural parts) | • Audi, Daimler, Renault, Volvo, VW Group | • AMAG, Constellium, Hydro, Novelis |
• Brazing clad sheet (heat exchanger materials for automotive and general industrial) | • Mahle, Dana, Denso, Hanon, Modine, Chart | • Arconic, AMAG, Gränges, Hydro, UACJ |
• Industrial plate and sheet (tooling, molding, road & rail, shipbuilding, LNG, silos, anodizing qualities for architecture, multi-layer tubing, and general industry) | • Amari Group, Amco, Euramax, Gilette, Henco, Linde, Multivac, RemiClaeys, SAG, Thyssenkrupp | • Arconic, AMAG, Constellium, Hydro, Novelis, Elval |
Key operating and financial information for the segment is presented below:
Europe | For the years ended December 31, | |||||||||||
(Dollars in millions, volumes in thousands of tons) | 2017 | 2016 | 2015 | |||||||||
Metric tons of finished product shipped | 317.3 | 326.7 | 313.6 | |||||||||
Revenues | $ | 1,300.7 | $ | 1,222.6 | $ | 1,335.3 | ||||||
Segment income | $ | 127.4 | $ | 149.4 | $ | 131.8 | ||||||
Segment Adjusted EBITDA (1) | $ | 127.7 | $ | 151.3 | $ | 149.3 | ||||||
Total segment assets | $ | 738.4 | $ | 645.3 | ||||||||
(1) | Segment Adjusted EBITDA is a non-GAAP financial measure. See Item 7. – “Management’s Discussion and Analysis of Financial Condition and Results of Operations – Our Segments” for a definition and discussion of segment Adjusted EBITDA and a reconciliation to segment income. |
Asia Pacific
Our Asia Pacific segment consists of the Zhenjiang rolling mill that produces technically demanding and value-added plate products for aerospace, semiconductor equipment, general engineering, distribution and other end-uses worldwide. Substantially all of our Asia Pacific segment’s products are manufactured to specific customer requirements using direct-chill cast technologies that allow us to use and offer a variety of alloys and products principally for aerospace and also for a number of other technically demanding end-uses.
The Zhenjiang rolling mill commenced operations in the first quarter of 2013 and achieved Nadcap certification, an industry standard for the production of aerospace aluminum, in 2014. Since then, the Zhenjiang rolling mill has received qualifications from several industry-leading aircraft manufacturers, including Airbus, Boeing, Bombardier and COMAC, and is the only facility in Asia capable of meeting the exacting standards of the global aerospace industry.
We expect demand for aluminum plate in Asia to grow, driven by the development and expansion of industries serving aerospace, semiconductor, rail and other technically demanding applications. In anticipation of this demand, we built the Zhenjiang rolling mill with 250,000 tons of hot mill capacity and the capability to both expand into other high growth and high value-added products, including ABS, clad brazing sheet and other technically demanding products, as well as produce additional aerospace and heat treated plate with modest incremental investment. Currently, we are expanding our aerospace offerings by investing in technical and manufacturing initiatives to allow for the production of aluminum for commercial aircraft wings to be used in the aerospace industry, which is expected to be completed in early 2019.
7
The following table summarizes our Asia Pacific segment’s principal products, end-uses, major customers and competitors:
Principal end use/product category | Major customers | Competitors |
• Aerospace plate | • Airbus, All Metal Services, AVIC, Boeing, Bombardier, Castle Metals, Comac, Korean Aerospace Industries, TKA | • Arconic, Constellium, Chinalco, Kaiser, AMAG, Nanshan |
• Heat treated plate | • Clinton Aluminum, Hengtai, Jusung, Thyssenkrupp | • Arconic, AMAG, Kumz, Nanshan |
• Non-heat treated plate | • Kobelco Precision Parts, Korean Non Ferrous, Tozzhin | • UACJ, Alnan, SWA, NELA |
Key operating and financial information for the segment is presented below:
Asia Pacific | For the years ended December 31, | |||||||||||
(Dollars in millions, volumes in thousands of tons) | 2017 | 2016 | 2015 | |||||||||
Metric tons of finished product shipped | 26.9 | 22.2 | 21.8 | |||||||||
Revenues | $ | 122.3 | $ | 100.5 | $ | 96.4 | ||||||
Segment income | $ | 15.0 | $ | 10.8 | $ | — | ||||||
Segment Adjusted EBITDA (1) | $ | 12.6 | $ | 10.4 | $ | — | ||||||
Total segment assets | $ | 371.4 | $ | 358.6 | ||||||||
(1) | Segment Adjusted EBITDA is non-GAAP financial measure. See Item 7. – “Management’s Discussion and Analysis of Financial Condition and Results of Operations – Our Segments” for a definition and discussion of segment Adjusted EBITDA and a reconciliation to segment income. |
Industry Overview
Aluminum is a widely-used, attractive industrial material. Compared to several alternative metals such as steel and copper, aluminum is lightweight, has a high strength-to-weight ratio and is resistant to corrosion. Aluminum can be recycled repeatedly without any material decline in performance or quality. The recycling of aluminum delivers energy and capital investment savings relative to both the cost of producing primary aluminum and many other competing materials. The penetration of aluminum into a wide variety of applications continues to grow. We believe several factors support fundamental long-term growth in aluminum consumption in the end-uses we serve.
The global aluminum industry consists of primary aluminum producers with bauxite mining, alumina refining and aluminum smelting capabilities; aluminum semi-fabricated products manufacturers, including aluminum casters, recyclers, extruders and flat rolled products producers; and integrated companies that are present across multiple stages of the aluminum production chain. The industry is cyclical and is affected by global economic conditions, industry competition and product development.
Primary aluminum prices are determined by worldwide forces of supply and demand and, as a result, are volatile. This volatility has a significant impact on the profitability of primary aluminum producers whose selling prices are typically based upon prevailing LME prices while their costs to manufacture are not highly correlated to LME prices. We participate in select segments of the aluminum fabricated products industry, focusing on aluminum rolled products. We do not smelt aluminum, nor do we participate in other upstream activities, including mining bauxite or refining alumina. Since the majority of our products are sold on a market-based aluminum price plus conversion fee basis, we are less exposed to aluminum price volatility.
Sales and Marketing
We sell our products to end-users and distributors, principally for use in the aerospace, automotive, building and construction, truck trailer, consumer durables, other general industrial and distribution industries. Backlog as of December 31, 2017 and 2016 was approximately $114.3 million and $109.2 million, respectively, for North America, $244.5 million and $202.2 million, respectively, for Europe, and $39.1 million and $28.1 million, respectively, for Asia Pacific.
Sales of products are made through each segment’s own sales force, which are strategically located to provide international coverage, and through a broad network of sales offices and agents in North America and major European countries, as well as in Asia and Australia. The majority of our customer sales agreements in our segments are for a term of one year or less.
8
Competition
The worldwide aluminum industry is highly competitive. Aluminum competes with other materials such as steel, plastic, composite materials and glass for various applications.
We compete in the production and sale of rolled aluminum sheet and plate. In the sectors in which we compete, other industry leaders include Arconic, Constellium, Novelis, Kaiser, Hydro, JW Aluminum and Jupiter Aluminum. We compete with other rolled products suppliers on the basis of quality, price, timeliness of delivery and customer service.
Raw Materials and Supplies
A significant portion of the aluminum metal used by our North America segment is purchased aluminum scrap that is acquired from aluminum scrap dealers or brokers. We believe that this segment is one of the largest users of aluminum scrap (other than beverage can scrap) in North America. The remaining requirements of this segment are met with purchased primary metal and rolling slab, including metal produced in the U.S. and internationally.
Our Europe segment relies on a number of European smelters for primary aluminum and rolling slab. Due to a shortage of internal slab casting capacity, we contract with smelters and other third parties to provide slab that meets our specifications.
Our Asia Pacific segment relies primarily on domestic smelters for primary aluminum. A portion of the raw material used by this segment is imported in order to meet quality requirements.
We believe that the raw materials necessary to our business are and will continue to be available. In an effort to manage our exposure to commodity price fluctuations, we use a formula pricing model which allows us to pass through risks from the volatility of aluminum price changes by charging a market-based aluminum price plus a conversion fee for the substantial majority of our contracts, and we strive to manage the remaining key commodity risks through our hedging programs.
Energy Supplies
Our operations are fueled by natural gas and electricity, which represent the third largest component of our cost of sales, after metal and labor costs. We purchase the majority of our natural gas and electricity on a spot-market basis. However, in an effort to acquire the most favorable energy costs, we have secured some of our natural gas and electricity at fixed price commitments. We use forward contracts and options, as well as contractual price escalators, to reduce the risks associated with our natural gas requirements.
Research and Development
Our research and development organization includes three locations in Europe, one in North America and one in Asia, with a support staff focused on new product and alloy offerings and process performance technology. Research and development expenses were $16.0 million, $10.9 million and $11.2 million for the years ended December 31, 2017, 2016 and 2015, respectively.
Patents and Other Intellectual Property
We hold patents registered in the United States and other countries relating to our business. In addition to patents, we also possess other intellectual property, including trademarks, tradenames, know-how, developed technology and trade secrets. Although we believe these intellectual property rights are important to the operations of our specific businesses, we do not consider any single patent, trademark, tradename, know-how, developed technology, trade secret or any group of patents, trademarks, tradenames, know-how, developed technology or trade secrets to be material to our business as a whole.
Seasonality
Certain of our products are seasonal. Demand in the rolled products business is generally stronger in the spring and summer seasons due to higher demand in the building and construction industry. This typically results in higher operating income in our second and third quarters, followed by our first and fourth quarters.
Employees
As of December 31, 2017, we had a total of approximately 5,400 employees, which included approximately 1,900 employees engaged in administrative and supervisory activities and approximately 3,500 employees engaged in manufacturing, production and maintenance functions. In addition, collectively, approximately 64% of our U.S. employees and substantially all of our non-U.S. employees were covered by collective bargaining agreements. We believe our labor relations with employees have been satisfactory.
9
Environmental
Our operations are subject to federal, state, local and foreign environmental, health and safety laws and regulations, which govern, among other things, air emissions, wastewater discharges, the handling, storage, and disposal of hazardous substances and wastes, the investigation or remediation of contaminated sites and employee health and safety. These laws can impose joint and several liability for releases or threatened releases of hazardous substances upon statutorily defined parties, including us, regardless of fault or the lawfulness of the original activity or disposal. Given the changing nature of environmental, health and safety legal requirements, we may be required, from time to time, to incur substantial costs in order to achieve and maintain compliance with these laws and regulations. For example, we may be required to install additional pollution control equipment, make process changes, or take other environmental control measures at some of our facilities to meet future requirements.
We have been named as a potentially responsible party in certain proceedings initiated pursuant to the Comprehensive Environmental Response, Compensation, and Liability Act (“Superfund”) and similar state statutes and may be named a potentially responsible party in other similar proceedings in the future. We are performing operations and maintenance at two Superfund sites for matters arising out of past waste disposal activity associated with closed facilities. We are also under orders to perform environmental remediation by agencies in four states and one non-U.S. country at seven sites. It is not anticipated that the costs incurred in connection with the presently pending proceedings will, individually or in the aggregate, have a material adverse effect on our financial condition or results of operations. Currently, and from time to time, we are a party to notices of violation brought by governmental agencies concerning the laws governing environmental, health and safety matters, such as air emissions.
Our aggregate accrual for environmental matters was $22.1 million and $23.8 million at December 31, 2017 and 2016, respectively. Of these amounts, approximately $10.2 million and $11.5 million are indemnified at December 31, 2017 and 2016, respectively. Although the outcome of any such matters, to the extent they exceed any applicable accrual, could have a material adverse effect on our financial condition, results of operations or cash flows for the applicable period, we currently believe that any such outcome would not have a material adverse effect on our consolidated financial condition, results of operations or cash flows.
In addition, we have asset retirement obligations of $6.1 million and $4.7 million for the years ended December 31, 2017 and 2016, respectively, for costs related to the future removal of asbestos and costs to remove underground storage tanks. The related asset retirement costs are capitalized as long-lived assets (asset retirement cost), and are being amortized over the remaining useful life of the related asset. See Note 2, “Summary of Significant Accounting Policies,” and Note 8, “Asset Retirement Obligations,” to our audited consolidated financial statements included elsewhere in this annual report on Form 10-K.
The processing of scrap generates solid waste in the form of salt cake and baghouse dust. This material is disposed of at off-site landfills. If salt cake was ever classified as a hazardous waste in the U.S., the costs to manage and dispose of it would increase, which could result in significant increased expenditures.
Financial Information About Geographic Areas
See Note 15, “Segment and Geographic Information,” to our audited consolidated financial statements included elsewhere in this annual report on Form 10-K.
ITEM 1A. RISK FACTORS.
Risks Related to Our Business
If we fail to implement our business strategy, our financial condition and results of operations could be adversely affected.
Our future financial performance and success depend in large part on our ability to successfully implement our business strategy. We cannot assure you that we will be able to successfully implement our business strategy or be able to continue improving our operating results. In particular, we cannot assure you that we will be able to successfully execute our significant ongoing, or any future, strategic investments, achieve all operating cost savings targeted through focused productivity improvements and capacity optimization, further enhance our business and product mix, manage key commodity exposures and opportunistically pursue strategic transactions, some of which may be material. Implementation of our business strategy may be impacted by factors outside of our control, including competition, commodity price fluctuations, industry, legal and regulatory changes or developments and general economic conditions. Any failure to successfully implement our business strategy could adversely affect our financial condition and results of operations. We may, in addition, decide to alter or discontinue certain aspects of our business strategy at any time.
10
Although we have undertaken and expect to continue to undertake productivity and manufacturing system and process transformation initiatives to improve performance, we cannot assure you that all of these initiatives will be completed or that any estimated cost savings from such activities will be fully realized. Even when we are able to generate new efficiencies in the short- to medium-term, we may not be able to continue to reduce costs and increase productivity over the long-term.
We may undertake acquisitions or divestitures, or be the target of a strategic acquisition, which may not be successful, and which could adversely affect our business, financial condition and results of operations.
As part of our strategy, from time to time, we may consider acquisitions or strategic alliances, which may not be completed or, if completed, may not be ultimately beneficial to us. We also consider potential divestitures of businesses from time to time. We prudently evaluate these opportunities as potential enhancements to our existing operating platforms and continue to consider strategic alternatives on an ongoing basis, including having discussions concerning potential acquisitions, strategic alliances and divestitures that may be material.
There are numerous risks commonly encountered in business combinations, including the following:
▪ | our ability to identify appropriate acquisition targets and to negotiate acceptable terms for their acquisition; |
▪ | our ability to obtain all necessary regulatory approvals on the terms expected and/or to complete any acquisition in a timely manner or at all; |
▪ | our ability to integrate new businesses into our operations; |
▪ | the availability of capital on acceptable terms to finance acquisitions; |
▪ | the ability to generate the cost savings or synergies anticipated; |
▪ | the inaccurate assessment of undisclosed liabilities; |
▪ | increasing demands on our operational systems; and |
▪ | the amortization of acquired intangible assets. |
In addition, the process of integrating new businesses could cause the interruption of, or loss of momentum in, the activities of our existing businesses, the diversion of management’s attention or the loss of key employees, customers, suppliers or other business partners. Any delays or difficulties encountered in connection with the integration of new businesses or divestiture of existing assets or businesses could negatively impact our business, financial condition and results of operations. Furthermore, any acquisition we may make could result in significant increases in our outstanding indebtedness and debt service requirements. The terms of our indebtedness may limit the acquisitions, strategic alliances and divestitures that we can pursue.
There are numerous risks commonly encountered in divestitures, including the following:
▪ | our ability to identify appropriate assets or businesses for divestiture and buyers, and to negotiate favorable terms for the divestiture of such assets or businesses; |
▪ | diversion of resources and management’s attention from the operation of our business, including providing on-going services to the divested business; |
▪ | loss of key employees following such a transaction; |
▪ | difficulties in the separation of operations, services, products and personnel; |
▪ | retention of future liabilities as a result of contractual indemnity obligations; and |
▪ | loss of, or damage to our relationships with, our existing customers, suppliers or other business relationships. |
In addition, sellers typically retain certain liabilities or indemnify buyers for certain matters such as lawsuits, tax liabilities, product liability claims and environmental matters. The magnitude of any such retained liability or indemnification obligation may be difficult to quantify at the time of the transaction, may involve conditions outside our control and ultimately may be material. Also, as is typical in divestiture transactions, third parties may be unwilling to release us from guarantees or other credit support provided prior to the sale of the divested assets. As a result, after a divestiture, we may remain secondarily liable for the obligations guaranteed or supported to the extent that the buyer of the assets fails to perform these obligations.
We cannot readily predict the timing or size of any future acquisition, strategic alliance or divestiture, and there can be no assurance that we will realize any anticipated benefits from any such acquisition, strategic alliance or divestiture. If we do not realize any such anticipated benefits, our business, financial condition and results of operations could be materially adversely affected.
In addition, we may receive inquiries relating to potential strategic transactions, including from third parties who may seek to merge with or acquire us. We will continue to consider and discuss such transactions as we deem appropriate. Such potential transactions may divert management’s attention, may cause us to incur various costs and expenses in evaluating and pursuing such transactions, whether or not they are completed, and are subject to numerous risks, including the risk that we may not be able to complete a transaction that has been announced.
11
The cyclical nature of the metals industry, our end-uses and our customers’ industries could negatively affect our financial condition and results of operations.
The metals industry in general is cyclical in nature. It tends to reflect and be amplified by changes in general and local economic conditions. These conditions include the level of economic growth, financing availability, the availability of affordable raw materials and energy sources, employment levels, interest rates, consumer confidence and housing demand. Historically, in periods of recession or periods of minimal economic growth, metals companies have often tended to underperform other sectors. We are particularly sensitive to trends in the key end-uses we serve, such as the automotive, aerospace, heat exchanger, building and construction and truck trailer industries. During recessions or periods of low growth, these industries typically experience major cutbacks in production, resulting in decreased demand for aluminum, which can lead to significant fluctuations in demand and pricing for our products and services.
Demand for our automotive and heat exchanger products is dependent on the production of cars, light trucks and heavy duty vehicles and trailers. The automotive industry is highly cyclical, as new vehicle demand is dependent on consumer spending and is tied closely to the strength of the overall economy, including credit markets and interest rates. In addition, the automotive industry is sensitive to consumer preferences regarding vehicle ownership and usage and vehicle size, fuel prices, regulatory requirements and levels of competition. Production cuts by manufacturers may adversely affect the demand for our products. Many automotive-related manufacturers and first tier suppliers are burdened with substantial structural costs, including pension, healthcare and labor costs that have resulted in severe financial difficulty, including bankruptcy, for several of them. A worsening of these companies’ financial condition or their bankruptcy could have further serious effects on the conditions of the automotive industry, which directly affects the demand for our products. In addition, sensitivity to fuel prices and consumer preferences can influence consumer demand for vehicles that have a higher content of aluminum. The loss of business with respect to, or a lack of commercial success of, one or more particular vehicle models for which we are a significant supplier could have a materially adverse impact on our financial condition and results of operations.
We derive a portion of our revenues from products sold to the aerospace industry, which is highly cyclical and tends to decline in response to overall declines in the general economy. The commercial aerospace industry is historically driven by demand from commercial airlines for new aircraft. Demand for commercial aircraft is influenced by airline industry profitability, trends in airline passenger traffic, the state of the U.S. and global economies and numerous other factors, including the availability of financing, regulatory requirements, the retirement of older aircraft and the effects of terrorism. A number of major airlines have undergone bankruptcy or comparable insolvency proceedings and experienced financial strain from competitive pressures and volatile fuel prices. Despite existing backlogs, continued financial uncertainty in the industry, inadequate liquidity of certain airline companies, production issues and delays in the launch of new aircraft programs at major aircraft manufacturers, stock variations in the supply chain, terrorist acts or the increased threat of terrorism may lead to reduced demand for new aircraft that utilize our products, which could materially adversely affect our financial condition and results of operations.
Because we generally have high fixed costs, our near-term profitability is significantly affected by decreased processing volume. Accordingly, reduced demand and pricing pressures may significantly reduce our profitability and adversely affect our financial condition. Economic downturns in regional and global economies or a prolonged recession in our principal industry end-uses have had a negative impact on our operations in the past and could have a negative impact on our future financial condition or results of operations. Although we continue to seek to diversify our business on a geographic and industry end-use basis, we cannot assure you that diversification will significantly mitigate the effect of cyclical downturns.
In addition, the market price of aluminum has historically been subject to significant cyclical price fluctuations. Although in recent years global economic and commodity trends have been increasingly correlated, the timing of changes in the market price of aluminum is largely unpredictable. Changes in the market price of aluminum impact the selling prices of our products and the benefit we gain from using scrap in our manufacturing process. Market prices of aluminum are dependent upon supply and demand and a variety of factors over which we have minimal or no control, including:
▪ | regional and global economic conditions; |
▪ | availability and relative pricing of metal substitutes; |
▪ | labor costs; |
▪ | energy prices; |
▪ | governmental regulations; |
▪ | seasonal factors and weather; and |
▪ | import and export levels and/or restrictions. |
Furthermore, we depend upon third-party transportation providers for delivery of products to us and to our customers, and we are sensitive to cyclical and other trends that impact such providers. Transportation disruptions or other conditions in the transportation industry, including, but not limited to, increases in fuel prices, disruptions in rail service, port congestion or
12
shortages of truck drivers, could increase our costs and disrupt our operations and our ability to service our customers on a timely basis.
We may encounter increases in the cost, or limited availability, of raw materials and energy, which could cause our cost of sales to increase thereby reducing our operating results and limiting our operating flexibility.
We require substantial amounts of raw materials and energy in our business, consisting principally of primary aluminum, aluminum scrap, alloys and other materials and energy, including natural gas. Any substantial increases in the cost of raw materials or energy could cause our operating costs to increase and negatively affect our financial condition and results of operations.
Primary aluminum, aluminum scrap, rolling slab and alloy prices are subject to significant cyclical price fluctuations. Metallics (primary aluminum and aluminum scrap) represent the largest component of our costs of sales. We purchase aluminum primarily from aluminum producers, aluminum scrap dealers and other intermediaries. We have limited control over the price or availability of these supplies.
In particular, the availability and price of aluminum scrap and rolling slab depend on a number of factors outside our control, including general economic conditions, international demand for metallics and internal recycling activities by primary aluminum producers and other consumers of aluminum. Increased regional and global demand for aluminum scrap can have the effect of increasing the prices that we pay for these raw materials thereby increasing our cost of sales. We may not be able to adjust the selling prices for our products to recover the increases in scrap prices. If scrap prices were to increase significantly without a commensurate increase in the traded value of the primary metals, our future financial condition and results of operations could be affected by higher costs and lower profitability.
After raw material and labor costs, energy costs represent the third largest component of our cost of sales. The price of natural gas, and therefore the costs, can be particularly volatile. Price and volatility can differ by global region based on supply and demand, political issues, government regulation and the imposition of further taxes on energy, among other things. As a result, our natural gas costs may fluctuate dramatically, and we may not be able to reduce the effect of higher natural gas costs on our cost of sales. If natural gas costs increase, our financial condition and results of operations may be adversely affected. Although we attempt to mitigate volatility in natural gas costs through the use of hedging and the inclusion of price escalators in certain of our long-term supply contracts, we may not be able to eliminate or reduce the effects of such cost volatility. Furthermore, in an effort to offset the effect of increasing costs, we may also limit our potential benefit from declining costs.
We may be unable to manage effectively our exposure to commodity price fluctuations, and our hedging activities may affect profitability in a changing metals price environment and subject our earnings to greater volatility from period-to-period.
Significant increases in the price of primary aluminum, aluminum scrap, alloys, hardeners, or energy would cause our cost of sales to increase significantly and, if not offset by product price increases, would negatively affect our financial condition and results of operations. We are substantial consumers of raw materials, and by far the largest input cost in producing our goods is the cost of aluminum. The cost of energy used by us is also substantial. Customers pay for our products based on the price of the aluminum contained in the products, plus a “rolling margin” or “conversion margin” fee (the “Price Margin”), or based on a fixed price. Although we generally use this pricing mechanism to pass changes in the price of aluminum through to our customers, we may not be able to pass on the entire cost of the increases to our customers. In most end-uses and by industry convention, however, we offer our products at times on a fixed price basis as a service to the customer. This commitment to supply an aluminum-based product to a customer at a fixed price often extends months, but sometimes years, into the future. Such commitments require us to purchase raw materials in the future, exposing us to the risk that increased aluminum or energy prices will increase the cost of our products, thereby reducing or eliminating the Price Margin we receive when we deliver the product. These risks may be exacerbated by the failure of our customers to pay for products on a timely basis, or at all.
The overall price of primary aluminum consists of several components, including the underlying base metal component, which is typically based on quoted prices from the London Metal Exchange (LME) and the regional premium, which comprises the incremental price over the base LME component that is associated with the delivery of metal to a particular region as further described below. The LME price is typically driven by macroeconomic factors, global supply and demand of aluminum (including expectations for growth and contraction and the level of global inventories) and financial investors. Speculative trading in aluminum and the influence of hedge funds and other financial institutions participating in commodity markets have contributed to higher levels of price volatility. Furthermore, the North America and Europe segments are exposed to variability in the market price of a regional premium differential (referred to as “Midwest Premium” in the U.S. and “Rotterdam Premium” in Europe) charged by industry participants to deliver aluminum from the smelter to the manufacturing facility. This premium differential also fluctuates in relation to several conditions, including based on the supply of and demand for metal in a particular region, associated transportation costs and the extent of warehouse financing transactions, which limit the amount of physical metal flowing to consumers and increases the price differential as a result. During times of greater volatility in the
13
premium, the variability in our earnings can also increase. In addition to impacting the price we pay for the raw materials we purchase, changing premium differentials impact our customers, who may delay purchases from us during times of uncertainty with respect to the premium differential or seek to purchase alternative materials or lower priced imported products which are not susceptible to the changes in these premium differentials. The North America and Europe segments follow a pattern of increasing or decreasing their selling prices to customers in response to changes in the Midwest Premium and the Rotterdam Premium. In addition, aluminum prices could fluctuate as a result of LME warehousing rules. Warehousing rules could also cause an increase in the supply of aluminum which may cause regional delivery premiums and LME aluminum prices to fall. A sustained weak LME aluminum pricing environment or adverse changes in LME aluminum prices or regional premiums, or the inability to pass through any fluctuation in aluminum prices or regional premiums to our customers, could have a material adverse effect on our business, financial condition, results of operations and cash flow.
As we maintain large quantities of base inventory, significant and rapid decreases in the price of primary aluminum would reduce the realizable value of our inventory, negatively affecting our financial condition and results of operations. In addition, a decrease in aluminum prices between the date of purchase and the final settlement date on derivative contracts used to mitigate the risk of price fluctuations may require us to post additional margin, which, in turn, could place a significant demand on our liquidity.
We purchase and sell LME forwards, futures and options contracts to reduce our exposure to changes in aluminum, copper and zinc prices. While exchanges have recently begun to offer derivative financial instruments to hedge premium differentials, we are only beginning to use these markets in our risk management practices. Despite the use of LME forwards, futures and options contracts, we remain exposed to the variability in prices of aluminum scrap and premium differentials. We depend on scrap for our operations, and seek to take advantage of the lower price of scrap metals compared to primary aluminum to provide a cost-competitive product. While aluminum scrap is typically priced in relation to prevailing LME prices, it may also be priced at a discount to LME aluminum (depending upon the quality of the material supplied). This discount is referred to in the industry as the “scrap spread” and fluctuates depending upon industry conditions. At this time, financial instruments are not readily available to effectively hedge against the scrap spread, and to the extent this spread narrows, our competitive advantage may be reduced. In addition, we purchase forwards, futures or options contracts to reduce our exposure to changes in natural gas and fuel prices and currency risks. To the extent our hedging contracts fix prices or exchange rates, if prices or exchange rates are below the fixed prices or rates established by such contracts, then our income and cash flows will be lower than they otherwise would have been.
The ability to realize the benefit of our hedging program is dependent upon factors beyond our control, such as counterparty risk as well as our customers making timely payment to us for products. In addition, at certain times, hedging options may be unavailable or not available on terms acceptable to us. In certain scenarios when market price movements result in a decline in value of our current derivatives position, our mark-to-market expense may exceed our credit line and counterparties may request the posting of cash collateral. We do not account for our forwards, futures, or options contracts as hedges of the underlying risks. As a result, unrealized gains and losses on our derivative financial instruments must be reported in our consolidated results of operations. The inclusion of such unrealized gains and losses in earnings may produce significant period to period earnings volatility that is not necessarily reflective of our underlying operating performance. See Item 7A. - “Quantitative and Qualitative Disclosures about Market Risk.”
A deterioration of our financial position or a downgrade of our ratings by a credit rating agency could impair our business, financial condition and results of operations, and our business relationships could be adversely affected.
A deterioration of our financial position or a downgrade of our credit ratings could adversely affect our financing, limit our access to the capital or credit markets or our liquidity facilities, or otherwise adversely affect our ability to obtain new financing on favorable terms or at all, result in more restrictive covenants in agreements governing the terms of any future indebtedness that we incur, or otherwise impair our business, financial condition and results of operations. Moreover, it could also increase our borrowing costs, trigger the posting of cash collateral and have an adverse effect on our business relationships with customers, suppliers and hedging counterparties. As discussed above, we enter into various forms of hedging arrangements against commodity, energy and currency risks. Financial strength and credit ratings are important to the availability and terms of these hedging and financing activities. As a result, any downgrade of our credit ratings may make it more costly for us to engage in these activities.
The profitability of our operations depends, in part, on the availability of an adequate source of supplies.
The availability and price of aluminum could impact our margins and our ability to meet customer volumes. We rely on third parties for the supply of aluminum. There can be no assurance that we will be able to maintain or renew, or obtain replacements for, any of our supply arrangements on terms that are as favorable as our existing agreements or at all. In the future, we may face an increased risk of supply to meet our demand due to issues affecting suppliers, including their rising costs of production, their ability to extend short-term credit to us and their ability to sustain their business, and we may be required to
14
purchase aluminum from alternative sources, which may not be available in sufficient quantities or on favorable terms. Our inability to satisfy our future supply needs may impact our profitability and expose us to penalties as a result of contractual commitments with some of our customers.
In addition, the price and availability of aluminum may be influenced by factors beyond our control, such as weak or deteriorating economic conditions, changes in world politics or regulatory requirements, trade restrictions and forces of supply and demand, which may cause regional supply constraints or may cause rapid aluminum price fluctuations. In particular, we depend on scrap for our operations and acquire our scrap inventory from numerous sources. These suppliers generally are not bound by long-term contracts and have no obligation to sell scrap metal to us. In periods of low industry prices, suppliers may elect to hold scrap and wait for higher prices, which may cause periodic supply interruptions. In addition, the slowdown in industrial production and consumer consumption in the U.S. during the previous economic crisis reduced the supply of scrap metal available to us. Furthermore, exports of scrap out of North America and Europe can negatively impact scrap availability and scrap spreads. If an adequate supply of scrap metal is not available to us, we would be unable to use recycled metals in our products at desired volumes and our results of operations and financial condition would be materially and adversely affected.
Our operating segments also depend on external suppliers for rolling slab for certain products. The availability of rolling slab is dependent upon a number of factors, including general economic conditions, which can impact the supply of available rolling slab and LME pricing, where lower LME prices may cause certain rolling slab producers to curtail production. If rolling slab is less available, our margins could be impacted by higher premiums that we may not be able to pass along to our customers or we may not be able to meet the volume requirements of our customers, which may cause sales losses or result in damage claims from our customers. We maintain long-term contracts for certain volumes of our rolling slab requirements, for the remainder we depend on annual and spot purchases. If we enter into a period of persistent short supply, we could incur significant capital expenditures to internally produce 100% of our rolling slab requirements.
Our business requires substantial amounts of capital to operate; failure to maintain sufficient liquidity will have a material adverse effect on our financial condition and results of operations.
Our business requires substantial amounts of cash to operate and our liquidity and ability to access capital can be adversely affected by a number of factors, including many factors outside our control. For example, fluctuations in the LME prices for aluminum may result in increased cash costs for metal or scrap. In addition, if aluminum price movements result in a negative valuation of our current financial derivative positions, our counterparties may require posting of cash collateral. Furthermore, in an environment of falling LME prices, the borrowing base under Aleris International’s asset backed multi-currency revolving credit facility (the “ABL Facility”) may shrink, which would constrain our liquidity. The borrowing base may also fluctuate due to, in part, seasonal working capital increases. As a result of these factors, both our borrowing base and ABL Facility utilization may fluctuate on a monthly basis. In addition, even if the borrowing base would provide sufficient liquidity to fund our operations, capital expenditures and debt service obligations, the indentures governing the Senior Notes may restrict our ability to borrow under the ABL Facility. We cannot assure you that we will be able to draw under the ABL Facility in an amount sufficient to fund our liquidity needs.
We may not be able to compete successfully in the industry end-uses we serve and aluminum may become less competitive with alternative materials, which could reduce our share of industry sales, sales volumes and selling prices.
Aluminum competes with other materials such as steel, plastic, composite materials and glass for various applications. Higher aluminum prices relative to substitute materials tend to make aluminum products less competitive with these alternative materials. In addition, environmental and other regulations may also increase our costs, which we may seek to pass on to our customers. These regulations may make our products less competitive as compared to materials that are subject to fewer regulations. The willingness of customers to accept substitutions for aluminum could reduce demand or prices for our products, either of which could materially and adversely affect our business, financial condition, results of operations and cash flows.
Our aerospace and automotive customers use and continue to evaluate the further use of alternative materials to aluminum in order to reduce the weight and increase the efficiency of their products. Although trends in “light-weighting” have generally increased rates of using aluminum as a substitute for another material, the willingness of customers to accept substitutions for aluminum, or the ability of large customers to exert leverage in the marketplace to reduce the pricing for fabricated aluminum products, could adversely affect the demand for our products, and thus materially adversely affect our financial position, results of operations and cash flows. In addition, the automotive industry, while motivated to reduce vehicle weight through the use of aluminum, may revert to steel or other materials for certain applications.
We compete in the production and sale of rolled aluminum products with a number of other aluminum rolling mills, including large, single-purpose sheet mills, continuous casters and other multi-purpose mills, some of which are larger and have greater financial and technical resources than we do. We compete on the basis of quality, price, timeliness of delivery, technological innovation and customer service. Producers with a different cost basis may, in certain circumstances, have a competitive pricing advantage. Our competitors may be better able to withstand reductions in price or other adverse industry or
15
economic conditions. In addition, a current or new competitor may also add or build new capacity, which could diminish our profitability by decreasing the equilibrium prices in our marketplace. Our competitive position may also be adversely affected by industry consolidation and economies of scale in purchasing, production and sales, which accrue to the benefit of some of our competitors. In addition, technological innovation is important to our customers who require us to lead or keep pace with new innovations to address their needs, and new product offerings or new technologies in the marketplace may compete with or replace our products. If we do not compete successfully, our share of industry sales, sales volumes and selling prices may be negatively impacted.
As we increase our international business, we encounter the risk that governments could take actions to enhance local production or local ownership at our expense. In addition, new competitors could emerge globally in emerging or transitioning markets with abundant natural resources, low-cost labor and energy, and lower environmental and other standards. This may pose a significant competitive threat to our business. Our competitive position may also be affected by exchange rate fluctuations that may make our products less competitive. Changes in regulation that have a disproportionately negative effect on us or our methods of production may also diminish our competitive advantage and industry position.
Additional competition could result in a reduced share of industry sales, reduced prices for our products and services, or increased expenditures, which could decrease revenues, reduce volumes or increase costs, all of which could have a negative effect on our financial condition and results of operations.
The loss of certain members of our management may have an adverse effect on our operating results.
Our success will depend, in part, on the efforts of our senior management and other key employees. These individuals possess sales, marketing, engineering, manufacturing, financial and administrative skills that are critical to the operation of our business. If we lose or suffer an extended interruption in the services of one or more of our senior management or other key employees, our financial condition and results of operations may be negatively affected. Moreover, competition for the pool of qualified individuals may be high, and we may not be able to attract and retain qualified personnel to replace or succeed members of our senior management or other key employees, should the need arise.
If we were to lose order volumes from any of our largest customers, our sales volumes, revenues and cash flows could be reduced.
Our business is exposed to risks related to customer concentration. Our ten largest customers were responsible for less than 33% of our consolidated revenues for the year ended December 31, 2017. No one customer accounted for more than 10% of those revenues. A loss of order volumes from, a loss of industry share by, or a significant downturn or deterioration in the business or financial condition of, any major customer could negatively affect our financial condition and results of operations by lowering sales volumes, increasing costs and lowering profitability. If we fail to successfully maintain, renew, renegotiate or re-price our long-term agreements or related arrangements with our largest customers, or if we fail to successfully replace business lost from any such customers, our results of operations, financial condition and cash flows could be materially adversely affected.
Our strategy of having dedicated facilities and arrangements with customers subjects us to the inherent risk of increased dependence on a single or a few customers with respect to these facilities. In such cases, our failure to renew such arrangements on terms as favorable as our existing contracts, the loss of such a customer, or the reduction of that customer’s business at one or more of our facilities, could negatively affect our financial condition and results of operations, and we may be unable to timely replace, or replace at all, lost order volumes. In addition, several of our customers have become involved in bankruptcy or insolvency proceedings and have defaulted on their obligations to us in recent years. Similar incidents in the future would adversely impact our financial condition and results of operations.
Customers in our end-uses, including aerospace and automotive, may consolidate and grow in a manner that could affect their relationships with us. For example, if one of our competitors’ customers acquires any of our customers, we may lose that acquired customer’s business. Additionally, if our customers become larger and more concentrated, they could exert pricing pressure on all suppliers, including us. Accordingly, our ability to maintain or raise prices in the future may be limited, including during periods of raw material and other cost increases. If we are forced to reduce prices or to maintain prices during periods of increased costs, or if we lose customers because of consolidation, pricing or other methods of competition, our financial position, results of operations and cash flows may be adversely affected.
We do not have long-term contractual arrangements with a substantial number of our customers, and our sales volumes and revenues could be reduced if our customers switch their suppliers.
Approximately 63% of our consolidated revenues for the year ended December 31, 2017 were generated from customers who do not have long-term contractual arrangements with us. These customers purchase products and services from us on a purchase order basis and may choose not to continue to purchase our products and services. Any significant loss of these
16
customers or a significant reduction in their purchase orders could have a material negative impact on our sales volume and business.
Our business requires substantial capital investments that we may be unable to fulfill, and we may be unable to timely complete our expected capital investments or may be unable to achieve the anticipated benefits of such investments.
Our operations are capital intensive. Our capital expenditures were $207.7 million, $358.1 million and $313.6 million for the years ended December 31, 2017, 2016 and 2015, respectively. Capital expenditures over the past three years include spending related to maintenance and our strategic investments, including investments of approximately $425.0 million to build a new wide cold mill, two CALPs and an automotive innovation center in Lewisport, Kentucky in connection with our North America ABS Project. We have also invested in upgrades to other key non-ABS equipment at the facility, including upgrading our ingot scalper and pre-heating furnace capabilities and widening the hot mill, to capture additional opportunities. We began shipping ABS from this facility in the fourth quarter of 2017.
There can be no assurance that we will be able to complete our capital expenditure projects, which includes spending related to maintenance and strategic investments, on schedule or at all, or that we will be able to execute such projects quickly enough to respond to changing industry conditions or that we will be able to achieve the anticipated benefits of such capital expenditures. In particular, our capital expenditure projects may not result in the improvements in our business that we anticipate and the realization of any return on these projects is dependent on a number of factors, including general economic conditions, customer preferences and other events beyond our control, whether our assumptions in making the investment were correct and changes in the factors underlying our investment decision. In addition, if we are unable to, or determine not to, complete any capital expenditure project, or such projects are delayed, we will not realize the anticipated benefits of such investments, which may adversely affect our business, financial condition and results of operations.
In recent periods, we have not generated sufficient cash flows from operations to fund our capital expenditure requirements. In the future, we may not generate sufficient operating cash flows and our external financing sources may not be available in an amount sufficient to enable us to make anticipated capital expenditures, service or refinance our indebtedness or fund other liquidity needs. If we are not able to reduce our high leverage and fund capital expenditures through the generation of cash flows from our business, we would have to do one or more of the following: raise additional capital through debt or equity issuances or both; cancel, delay or reduce current and future business initiatives; or sell properties or assets. If the cost of our capital expenditures exceed budgeted amounts, and/or the time period for completion is longer than initially anticipated, our business, financial condition and results of operations could be materially adversely affected. In addition, capital expenditure projects may require planned outages at existing facilities and/or cause production inefficiencies. Such outages, production inefficiencies and other operational difficulties have resulted, and may in the future result, in significant production downtime at facilities undergoing capital expenditure projects, which has negatively impacted, and may in the future negatively impact, our business, results of operations and financial condition. For example, our 2017 results of operations were negatively impacted by an extended planned hot mill outage at our Lewisport facility in connection with the North America ABS Project.
Our production capacity might not be able to meet end-use demand or changing industry conditions.
We may be unable to meet end-use demand or changing industry conditions due to production capacity constraints or operational challenges. Meeting such demand may require us to make substantial capital investments to repair, maintain, upgrade and expand our facilities and equipment. Notwithstanding our ongoing plans and investments to increase our capacity, we may not be able to expand our production capacity quickly enough in response to changing industry conditions, and there can be no assurance that our production capacity will be able to meet our existing obligations and the growing end-use demand for our products. In addition, if we are unable to expand our production capacity, make upgrades or repairs or purchase new plants and equipment, we may be unable to take advantage of improved industry conditions or increased demand for our products and our financial condition and results of operations could be adversely affected by operational difficulties, higher maintenance costs, lower sales volumes due to the impact of reduced product quality, penalties for late deliveries, reputational harm and other competitive influences.
Reductions in demand for our products may be more severe than, and may occur prior to, reductions in demand for our customers’ products.
Customers purchasing our products, such as those in the cyclical aerospace industry, generally require significant lead time in production of their own products. Therefore, demand for our products may increase prior to demand for our customers’ products. Conversely, demand for our products may decrease as our customers anticipate a downturn in their respective businesses. As demand for our customers’ products begins to soften, our customers could meet the reduced demand for their products using their existing inventory without replenishing the inventory, which would result in a reduction in demand for our products greater than the reduction in demand for their products. Further, the reduction in demand for our products can be exacerbated if inventory levels held by our customers exceed normal levels and our customers can use existing inventory for their own production requirements. This amplified reduction in demand for our products while our customers consume their
17
inventory to meet their business needs, or “destocking,” may adversely affect our financial condition, results of operations and cash flows.
We may not be able to successfully develop and implement new technology initiatives.
We have invested in, and are involved with, a number of technology and process initiatives, including those related to the production of more technologically advanced aluminum for commercial aircraft wings to be used in the aerospace industry. Several technical aspects of these initiatives are still unproven and the eventual commercial outcomes cannot be assessed with any certainty. Even if we are successful with these initiatives, we may not be able to deploy them in a timely fashion or at all. Accordingly, the costs and benefits from our investments in new technologies and the consequent effects on our financial results may vary from present expectations.
Our Asia Pacific operations may require significant funding support that we may be unable to fulfill.
The Zhenjiang rolling mill began limited production in the beginning of 2013. We continued the start-up phase of that operation through 2014, growing our sales as the year progressed, and exited the start-up phase of operations in the first quarter of 2015. The mill required funding for residual capital expenditures, working capital, and principal and interest on third party debt, reaching an aggregate of $28.5 million in 2017. This funding was obtained from capital provided by us.
Significant investment in the Zhenjiang rolling mill is needed to fund our anticipated future sales growth. Working capital requirements are anticipated to be funded with cash generated from the Zhenjiang rolling mill operations and capital provided by us. We also have an RMB 410.0 million (or equivalent to approximately $63.0 million as of December 31, 2017) revolving credit facility (the “Zhenjiang Revolver”) provided by the People’s Bank of China. As of December 31, 2017, we had no amounts outstanding under the Zhenjiang Revolver. The Chinese government exercises significant control over economic growth in China through the allocation of resources, including imposing policies that impact particular industries or companies in different ways, so we may experience future disruptions to our access to capital in the Chinese region. In addition, we have to meet certain conditions to be able to draw on the Zhenjiang Revolver. We cannot be certain that we will be able to draw any amounts committed under the Zhenjiang Revolver in the future. We also may not generate sufficient operating cash flows and our external financing sources may not be available in an amount sufficient to enable us to fund the anticipated working capital needs of the Zhenjiang rolling mill. To the extent that funding is not available under the Zhenjiang Revolver, we may need to further increase the amount of capital necessary to fund the Zhenjiang rolling mill from our own or other sources of capital. The availability of financing, as well as future actions or policies of the Chinese government, could materially affect the funding of our working capital needs in China, which may diminish or delay our ability to produce and sell material from the Zhenjiang rolling mill.
Our business involves significant activity in Europe, and adverse conditions and disruptions in European economies could have a material adverse effect on our operations or financial performance.
A material portion of our sales are generated by customers located in Europe and the euro is the functional currency of substantially all of our European-based operations. The financial markets remain concerned about the ability of certain European countries to finance their deficits and service growing debt burdens amidst difficult economic conditions. This loss of confidence led to rescue measures by Eurozone countries and the International Monetary Fund. Despite these measures, concerns persist regarding the debt burden of certain Eurozone countries and their ability to meet future financial obligations, the overall stability of the euro and the suitability of the euro as a single currency given the diverse economic and political circumstances in individual Eurozone countries. The interdependencies among European economies and financial institutions have also exacerbated concern regarding the stability of European financial markets generally. These concerns could lead to the re-introduction of individual currencies in one or more Eurozone countries, or, in more extreme circumstances, the possible dissolution of the euro currency entirely. Should the euro dissolve entirely, the legal and contractual consequences for holders of euro-denominated obligations would be determined by laws in effect at such time. These potential developments, or market perceptions concerning these and related issues, could materially adversely affect the value of our euro-denominated assets and obligations. In addition, concerns over financial institutions in Europe and globally could have a material adverse impact on the capital markets generally. Persistent disruptions in the European financial markets, the overall stability of the euro and the suitability of the euro as a single currency, the failure of a significant European financial institution or additional political and regulatory developments, could have a material adverse impact on our operations or financial performance.
In addition, the outcome of the United Kingdom referendum where voters elected for the United Kingdom to leave the European Union (Brexit) could have implications on economic conditions globally as a result of changes in policy direction which may in turn influence the economic outlook for the European Union and its key trading partners. There can be no assurance that the actions we have taken or may take in response to global economic conditions more generally may be sufficient to counter any continuation or recurrence of the downturn or disruptions. A significant global economic downturn or disruptions in the financial markets would have a material adverse effect on our operations or financial performance.
18
Our international operations expose us to certain risks inherent in doing business abroad.
We have operations in the United States, Germany, Belgium and China. We continue to explore opportunities to expand our international operations. Our international operations generally are subject to risks, including:
▪ | changes in U.S. and international governmental regulations, trade policy and laws, including tax laws and regulations; |
▪ | compliance with U.S. and foreign anti-corruption and trade control laws, such as the Foreign Corrupt Practices Act, export controls and economic sanction programs, including those administered by the U.S. Treasury Department’s Office of Foreign Assets Control; |
▪ | currency exchange rate fluctuations; |
▪ | tariffs and other trade barriers; |
▪ | the potential for nationalization of enterprises or government policies favoring local production; |
▪ | renegotiation or nullification of existing agreements; |
▪ | interest rate fluctuations; |
▪ | high rates of inflation; |
▪ | currency restrictions and limitations on repatriation of funds; |
▪ | differing protections for intellectual property and enforcement thereof; |
▪ | differing and, in some cases, more stringent labor regulations; |
▪ | divergent environmental laws and regulations; and |
▪ | political, economic and social instability. |
The occurrence of, or uncertainty related to, any of these events (or the perception that such events may occur) could cause our costs to rise, limit growth opportunities, have a negative effect on our operations and our ability to plan for future periods or cause our customers to delay or reduce their spending. In certain regions, the degree of these risks may be higher due to more volatile economic conditions, less developed and predictable legal and regulatory regimes and increased potential for various types of adverse governmental action. In particular, while it is too early to predict how the recently enacted 10% tariff on imported aluminum will impact our business, the tariff may cause customers to delay or reduce their spending or seek substitute materials as a result of increased costs or may cause foreign countries to impose tariffs on certain of our products.
The financial condition and results of operations of some of our operating entities are reported in various currencies and then translated into U.S. dollars at the applicable exchange rate for inclusion in our consolidated financial statements. As a result, appreciation of the U.S. dollar against these currencies may have a negative impact on reported revenues and operating profit while depreciation of the U.S. dollar against these currencies may generally have a positive effect on reported revenues and operating profit. In addition, a portion of the revenues generated by our international operations are denominated in U.S. dollars, while the majority of costs incurred are denominated in local currencies. As a result, appreciation in the U.S. dollar may have a positive impact on margins at the time of sale and on the subsequent translation of the resulting accounts receivable until collection, while depreciation of the U.S. dollar may have the opposite effect. While we engage in hedging activity to attempt to mitigate currency risk, this may not fully protect our business, financial condition or results of operations from adverse effects due to currency fluctuations.
Current environmental liabilities as well as the cost of compliance with, and liabilities under, environmental, health and safety laws could increase our operating costs and negatively affect our financial condition and results of operations.
Our operations are subject to federal, state, local and foreign laws and regulations, which govern, among other things, air emissions, wastewater discharges, the handling, storage and disposal of hazardous substances and wastes, the investigation and remediation of contaminated sites and employee health and safety. Future environmental, health and safety regulations could impose stricter compliance requirements on the industries in which we operate. We could incur substantial costs in order to achieve and maintain compliance with these laws and regulations. For example, additional pollution control equipment, process changes, or other environmental control measures may be needed at some of our facilities to meet future requirements. Additionally, evolving regulatory standards and expectations can result in increased litigation and/or increased costs, all of which can have a material and adverse effect on earnings and cash flows.
Financial responsibility for contaminated property can be imposed on us where current or past operations have had an environmental impact. Such liability can include the cost of investigating and remediating contaminated soil or ground water, fines and penalties sought by environmental authorities, and damages arising out of personal injury, contaminated property and other toxic tort claims, as well as lost or impaired natural resources. Certain environmental laws impose strict, and in certain circumstances joint and several, liability for certain kinds of matters, such that a person can be held liable without regard to fault for all of the costs of a matter even though others were also involved or responsible. The costs of all such matters have not been material to net income (loss) for any accounting period since January 1, 2013. However, future remedial requirements at currently or formerly owned or operated properties or adjacent areas, or at properties to which we have disposed of hazardous
19
substances, could result in significant liabilities. We are subject to or a party to certain environmental claims and matters and there can be no assurance that those matters will be resolved favorably or that such matters will not adversely affect our business, results of operations or financial condition. See Item 1. – “Business – Environmental.” We have accrued costs relating to these matters that are reasonably expected to be incurred based on available information. However, it is possible that actual costs may differ, perhaps significantly, from the amounts expected or accrued. Similarly, the timing of those expenditures may occur faster than anticipated. These differences could negatively affect our financial position, results of operations and cash flows.
Changes in environmental, health and safety requirements or changes in their enforcement could materially increase our costs. For example, if salt cake, a by-product from some of our operations, were to become classified as a hazardous waste in the U.S., the costs to manage and dispose of it would increase and could result in significant increased expenditures.
New governmental regulation relating to greenhouse gas emissions may subject us to significant new costs and restrictions on our operations.
Climate change is receiving increasing attention worldwide. Many scientists, legislators and others attribute climate change to increased levels of greenhouse gases, including carbon dioxide, which has led to significant legislative and regulatory efforts to limit greenhouse gas emissions. New laws enacted could directly and indirectly affect our customers and suppliers (through an increase in the cost of production or their ability to produce satisfactory products) or our business (through an impact on the availability or raw materials, our operations or demand for our products), any of which could have a material adverse effect on our business, financial condition and results of operations. There are legislative and regulatory initiatives in various jurisdictions that would regulate greenhouse gas emissions through a cap-and-trade system under which emitters would be required to buy allowances to offset emissions of greenhouse gas. In addition, several states, including states where we have manufacturing facilities, are considering various greenhouse gas registration and reduction programs. Certain of our manufacturing facilities use significant amounts of energy, including electricity and natural gas, and certain of our facilities emit amounts of greenhouse gas above certain minimum thresholds that are likely to be affected by existing proposals. Greenhouse gas regulation could increase the price of the electricity we purchase, increase costs for our use of natural gas, potentially restrict access to or the use of natural gas, require us to purchase allowances to offset our own emissions or result in an overall increase in our costs of raw materials, capital expenditures and insurance premiums or deductibles, any one of which could significantly increase our costs, reduce our competitiveness in a global economy or otherwise negatively affect our business, operations or financial results. While future global emission regulation appears likely, it is too early to predict how this regulation may affect our business, operations or financial results.
We could experience labor disputes and work stoppages that could disrupt our business.
Approximately 64% of our U.S. employees and substantially all of our non-U.S. employees, located primarily in Europe where union membership is common, are represented by unions or equivalent bodies and are covered by collective bargaining or similar agreements which are subject to periodic renegotiation. Although we believe that we will successfully negotiate new collective bargaining agreements when the current agreements expire, these negotiations may not prove successful, may result in a significant increase in the cost of labor, or may break down and result in the disruption or cessation of our operations.
Labor negotiations may not conclude successfully, and, in that case or any other, work stoppages or labor disturbances may occur. Existing collective bargaining agreements may not prevent a strike or work stoppage at our facilities. Any such stoppages or disturbances may have a negative impact on our financial condition and results of operations by limiting plant production, sales volumes and profitability.
Further aluminum industry consolidation could impact our business.
The aluminum industry has experienced consolidation over the past several years, and there may be further industry consolidation in the future. Although current industry consolidation has not yet had a significant negative impact on our business, if we do not have sufficient industry end-use presence or are unable to differentiate ourselves from our competitors, we may not be able to compete successfully against other companies. If as a result of consolidation, our competitors are able to obtain more favorable terms from suppliers or otherwise take actions that could increase their competitive strengths, our competitive position and therefore our business, results of operations and financial condition may be materially adversely affected.
Our operations present significant risk of injury or death. We may be subject to claims that are not covered by or exceed our insurance.
Because of the heavy industrial activities conducted at our facilities, there exists a risk of injury or death to our employees or other visitors, notwithstanding the safety precautions we take. Our operations are subject to regulation by various federal, state and local agencies responsible for employee health and safety, including the Occupational Safety and Health
20
Administration, which has from time to time levied fines against us for certain isolated incidents. While we have in place policies to minimize such risks, we may nevertheless be unable to avoid material liabilities for any employee death or injury that may occur in the future. These types of incidents may not be covered by or may exceed our insurance coverage and may have a material adverse effect on our results of operations and financial condition.
We are subject to unplanned business interruptions that may materially adversely affect our business.
Our operations may be materially adversely affected by unplanned business interruptions caused by events such as explosions, fires, war or terrorism, inclement weather, natural disasters, accidents, equipment failures, information technology systems and process failures, electrical blackouts or outages, transportation interruptions and supply interruptions. Our suppliers and customers may also experience unplanned interruptions, which may cause our cost of sales to increase, if we are required to make alternate supply arrangements, or our sales to decrease, if customers are required to delay their purchases. Operational interruptions at one or more of our production facilities could cause substantial losses and delays in our production capacity or increase our operating costs. In addition, replacement of assets damaged by such events could be difficult or expensive, and to the extent these losses are not covered by insurance or if our insurance policies have significant deductibles, our financial position, results of operations and cash flows may be materially adversely affected by such events. Furthermore, because customers may be dependent on planned deliveries from us, customers that have to reschedule or cancel their own production due to our delivery delays or operational challenges may be able to pursue financial claims against us, and we may incur costs to correct such problems in addition to any liability resulting from such claims. Interruptions may also harm our reputation among actual and potential customers, potentially resulting in a loss of business.
Derivatives legislation could have an adverse impact on our ability to hedge risks associated with our business and on the cost of our hedging activities.
We use over-the-counter (“OTC”) derivatives products to hedge our metal commodity, energy and currency risks and, historically, our interest rate risk. Legislation has been adopted to increase the regulatory oversight of the OTC derivatives markets and impose restrictions on certain derivatives transactions and participants in these markets, which could affect the use of derivatives in hedging transactions. In the U.S., for example, the Dodd-Frank Wall Street Reform and Consumer Protection Act (the “Dodd-Frank Act” or “Dodd-Frank”) includes extensive provisions regulating the derivatives market, and many of the regulations implementing the derivatives provisions have become effective and additional requirements may become effective in the future. As such, we have become and could continue to become subject to additional regulatory costs, both directly and indirectly, through increased costs of doing business with more market intermediaries that are now subject to extensive regulation pursuant to the Dodd-Frank Act. For example, derivatives dealers may seek to pass to us the cost of any increased margin, capital or other regulatory requirements that they are subject to under Dodd-Frank, which could have an adverse effect on our ability to hedge risks associated with our business and on the cost of our hedging activities. In addition, if major financial institutions are forced to operate under more restrictive capital constraints and regulations, there could be less liquidity in the derivative markets, which could have a negative effect on our ability to hedge and transact with creditworthy counterparties. As the regulatory regime is still developing and additional regulations have not been finalized or fully implemented, the ultimate costs of Dodd-Frank, especially in light of a recent executive order calling for a full review, and legislation currently being considered by congress seeking to roll back or eliminate parts, of Dodd-Frank and the regulations promulgated under it, and similar legislation in other jurisdictions, including the European Union member states, on our business remain uncertain. However, any such costs could be significant and have an adverse effect on our results of operations and financial condition. Additional regulations or changes to existing regulations in the U.S. or internationally that impact the derivatives market and market participants could also add significant cost or operational constraints that might have an adverse effect on our results of operations and financial condition or could require us to change certain of our business practices or develop a new compliance infrastructure.
Our pension obligations are currently underfunded. We may have to make significant cash payments to our pension plans, which would reduce the cash available for our business and have an adverse effect on our financial condition, results of operations and ability to satisfy our obligations under our indebtedness.
Our U.S. defined benefit pension plans cover certain salaried and non-salaried employees at our corporate headquarters and within our North America segment. The plan benefits are based on age, years of service and employees’ eligible compensation during employment for all employees not covered under a collective bargaining agreement and on stated amounts based on job grade and years of service prior to retirement for non-salaried employees covered under a collective bargaining agreement. Our funding policy for the U.S. defined benefit pension plans is to make annual contributions based on advice from our actuaries and the evaluation of our cash position, but not less than minimum statutory requirements. All of the minimum funding requirements of the U.S. Internal Revenue Code (“Code”) and the Employee Retirement Income Security Act of 1974, as amended (“ERISA”), for these plans have been met as of December 31, 2017, at which time, the U.S. defined benefit pension plans, in the aggregate, were underfunded (on a Generally Accepted Accounting Principles in the United States of America (“GAAP”) basis) by approximately $45.2 million. The liabilities could increase or decrease, depending on a number of
21
factors, including future changes in benefits, investment returns, and the assumptions used to calculate the liability. The current underfunded status of the U.S. defined benefit plans requires us to notify the Pension Benefit Guaranty Corporation (“PBGC”) of certain “reportable events” (within the meaning of ERISA), including if we pay certain extraordinary dividends. Under Title IV of ERISA, the PBGC has the authority under certain circumstances or upon the occurrence of certain events to terminate an underfunded pension plan. One such circumstance is the occurrence of an event that unreasonably increases the risk of unreasonably large losses to the PBGC. We believe it is unlikely that the PBGC would terminate any of our plans, which would result in our incurring a liability to the PBGC that could be equal to the entire amount of the underfunding. However, in the event we increase our indebtedness and/or pay an extraordinary dividend, the PBGC could enter into a negotiation with us that could cause us to materially increase or accelerate our funding obligations under our U.S. defined benefit pension plans. The occurrence of either of those actions could have an adverse effect on our financial condition, results of operations and ability to satisfy our obligations under our indebtedness.
We are subject to risks relating to our information technology systems.
Our global operations are managed through numerous information technology systems, some of which are managed by third parties, which we rely on to effectively manage our business, data, accounting, financial reporting, communications, supply chain, order entry and fulfillment and other business processes. Additionally, we collect and store sensitive data, including intellectual property, proprietary business information, as well as personally identifiable information of our employees, in data centers and on information technology networks. If these systems or networks are damaged or cease to function properly, we may suffer an interruption in our ability to manage and operate the business which may have a material adverse effect on our financial condition and results of operations. Cyber security risks have generally increased in recent years because of the proliferation of new technologies and the increased sophistication and activities of perpetrators of cyber-attacks.
Despite security measures and business continuity plans, our information systems and networks may be vulnerable to damage, disruptions or shutdowns due to attacks by hackers or breaches due to errors or malfeasance by employees and others who have access to our systems and networks or other disruptions, including as a result of natural disasters or other catastrophic events. The occurrence of any of these events could compromise our systems or networks and the information stored there could be accessed, publicly disclosed, lost or stolen. Any such access, disclosure or loss of information could result in legal claims or proceedings, liability or regulatory penalties under privacy laws, or could disrupt our operations, cause us to lose business and reduce the competitive advantage we hope to derive from our investment in new or proprietary business initiatives.
We are continually modifying and enhancing our information systems and technology to increase safety, productivity and efficiency, and to ensure that we are protected against and are able to remediate evolving cyber-threats. As new systems and technologies are implemented, we could experience unanticipated difficulties resulting in unexpected costs and adverse impacts to our manufacturing and other business processes. When implemented, the information systems and technology may not provide the benefits anticipated and could add costs and complications to ongoing operations, which may have a material adverse effect on our reputation, financial condition and results of operations.
Changes in applicable domestic or foreign tax laws and regulations or disputes with taxing authorities could adversely affect our business, financial condition and profitability by increasing our tax liabilities and tax compliance costs.
The Company is subject to income taxes in the United States and various foreign jurisdictions. Changes in applicable domestic or foreign tax laws and regulations, or their interpretation and application, including the possibility of retroactive effect, could affect the Company’s business, financial condition and profitability by increasing our tax liabilities and tax compliance costs. The Company’s future results of operations could be adversely affected by changes in its effective tax rate as a result of a change in the mix of earnings in jurisdictions with differing statutory tax rates, changes in the overall profitability of the Company, changes in tax legislation and rates, changes in generally accepted accounting principles and changes in the valuation of deferred tax assets and liabilities. In particular, on December 22, 2017, H.R. 1 (commonly referred to as the “Tax Cuts and Jobs Act”) was signed into law. The Tax Cuts and Jobs Act makes extensive changes to the U.S. tax laws and, among other things, includes changes to U.S. federal tax rates, imposes significant additional limitations on the deductibility of interest, allows for the expensing of capital expenditures, and puts into effect the migration from a “worldwide” system of taxation to a territorial system. In particular, the Tax Cuts and Jobs Act limits our annual deduction for business interest expense to an amount equal to 30% of our “adjusted taxable income” (as defined in the Code) for the taxable year. We expect to be significantly impacted by the limitation on the deductibility of business interest expense, though we expect to offset this impact through utilization of our net operating losses. Notwithstanding the reduction in the corporate income tax rate, the overall impact of the Tax Cuts and Jobs Act is uncertain, and our business and financial condition could be adversely affected. Our net deferred tax assets and liabilities have been revalued at the newly enacted U.S. corporate rate, and the impact has been recognized in our tax provision for the year ended December 31, 2017. The impact on the year ended December 31, 2017 and
22
on future years may be material to the consolidated financial statements. We continue to examine the impact the Tax Cuts and Jobs Act may have on our business.
Our internal controls over financial reporting and our disclosure controls and procedures may not prevent all possible errors that could occur.
Each quarter, our chief executive officer and chief financial officer evaluate our internal controls over financial reporting and our disclosure controls and procedures, which includes a review of the objectives, design, implementation and effect of the controls relating to the information generated for use in our financial reports. In the course of our controls evaluation, we seek to identify data errors or control problems and to confirm that appropriate corrective action, including process improvements, are being undertaken. The overall goals of these various evaluation activities are to monitor our internal controls over financial reporting and our disclosure controls and procedures and to make modifications as necessary. Our intent in this regard is that our internal controls over financial reporting and our disclosure controls and procedures will be maintained as dynamic systems that change (including with improvements and corrections) as conditions warrant. A control system, no matter how well designed and operated, can provide only reasonable, not absolute, assurance that the control system’s objectives will be satisfied. These inherent limitations include the possibility that judgments in our decision-making could be faulty, and that isolated breakdowns could occur because of simple human error or mistake. We cannot provide absolute assurance that all possible control issues within our company have been detected. The design of our system of controls is based in part upon certain assumptions about the likelihood of events, and there can be no assurance that any design will succeed absolutely in achieving our stated goals. Because of the inherent limitations in any control system, misstatements could occur and not be detected. If we fail to maintain the adequacy of our internal controls, we could be subject to regulatory scrutiny, civil or criminal penalties and/or stockholder litigation. Any inability to provide reliable financial reports could harm our business.
Risks Related to Our Indebtedness
Our substantial leverage and debt service obligations could adversely affect our financial condition and restrict our operating flexibility.
We have substantial consolidated debt and, as a result, significant debt service obligations. As of December 31, 2017, our total consolidated indebtedness was $1.8 billion, excluding $40.3 million of outstanding letters of credit. We also would have had the ability to borrow up to $123.4 million under the ABL Facility. Aleris Zhenjiang has a $63.0 million (on a U.S. dollar equivalent subject to exchange rate fluctuations) revolving credit facility, none of which was borrowed at December 31, 2017. Aleris Zhenjiang is an unrestricted subsidiary and non-guarantor under the indentures governing the $500.0 million aggregate original principal amount of 7 7/8% Senior Notes due 2020 (the “7 7/8% Senior Notes”) and the $800.0 million aggregate principal amount of 91/2% Senior Secured Notes due 2021 (the “91/2% Senior Secured Notes” and, together with the 7 7/8% Senior Notes, the “Senior Notes”).
Our substantial level of debt and debt service obligations could have important consequences, including the following:
▪ | making it more difficult for us to satisfy our obligations with respect to our indebtedness, which could result in an event of default under the indentures governing the Senior Notes and the agreements governing our other indebtedness; |
▪ | limiting our ability to obtain additional financing on satisfactory terms to fund our working capital requirements, capital expenditures, acquisitions, investments, debt service requirements and other general corporate requirements; |
▪ | increasing our vulnerability to general economic downturns, competition and industry conditions, which could place us at a competitive disadvantage compared to our competitors that are less leveraged and therefore we may be unable to take advantage of opportunities that our leverage prevents us from exploiting; |
▪ | exposing our cash flows to changes in floating rates of interest such that an increase in floating rates could negatively impact our cash flows; |
▪ | imposing additional restrictions on the manner in which we conduct our business under financing documents, including restrictions on our ability to pay dividends, make investments, incur additional debt and sell assets; and |
▪ | reducing the availability of our cash flows to fund our working capital requirements, capital expenditures, acquisitions, investments, other debt obligations and other general corporate requirements, because we will be required to use a substantial portion of our cash flows to service debt obligations. |
The occurrence of any one of these events could have an adverse effect on our business, financial condition, results of operations, cash flows and ability to satisfy our obligations under our indebtedness.
23
The ABL Facility matures on June 15, 2020, the 7 7/8% Senior Notes mature on November 1, 2020 and the 91/2% Senior Notes mature on April 1, 2021. On or before the applicable maturity dates, we will need to refinance such indebtedness, which we may seek to refinance at any time. We cannot assure you the timing of any potential refinancing, that we will be able to access the capital or credit markets or refinance any of our indebtedness on attractive terms on or before maturity or on commercially reasonable terms or at all.
Despite current indebtedness levels, we and our subsidiaries may still be able to incur substantially more debt. This could further exacerbate the risks associated with our substantial leverage.
We and our subsidiaries may be able to incur substantial additional indebtedness, including secured indebtedness, in the future. Although the credit agreement governing the ABL Facility and the indentures governing the Senior Notes contain restrictions on the incurrence of additional indebtedness, these restrictions are subject to a number of significant qualifications and exceptions, and any indebtedness incurred in compliance with these restrictions could be substantial. Aleris International’s ability to borrow under the ABL Facility will remain limited by the amount of the borrowing base and may be restricted by the indentures governing the Senior Notes. In addition, the credit agreement governing the ABL Facility and the indentures governing the Senior Notes allow Aleris International to incur a significant amount of indebtedness in connection with acquisitions and a significant amount of purchase money debt and foreign subsidiary debt. If new debt is added to our and/or our subsidiaries’ current debt levels, the related risks that we and they face would be increased.
To service our indebtedness, we will require a significant amount of cash. Our ability to generate cash depends on many factors beyond our control, and any failure to meet our debt obligations could harm our business, financial condition and results of operations.
Our ability to satisfy our debt obligations will primarily depend upon our future operating performance. As a result, prevailing economic conditions and financial, business and other factors, many of which are beyond our control, will affect our ability to make these payments to satisfy our debt obligations. Included in such factors are the requirements, under certain scenarios, of our counterparties that we post cash collateral to maintain our hedging positions and the timing and costs of current and future capital expenditure projects. In addition, LME price declines, by reducing the borrowing base, could limit availability under the ABL Facility and further constrain our liquidity. Even if the borrowing base would provide sufficient liquidity to fund our operations, capital expenditures and debt service obligations, the indentures governing the Senior Notes may restrict our ability to borrow under the ABL Facility.
If we do not generate sufficient cash flow from operations to satisfy our debt obligations, including payments on the Senior Notes, we may have to undertake alternative financing plans, such as refinancing or restructuring our indebtedness, selling assets, reducing or delaying capital investments or seeking to raise additional capital. Our ability to restructure or refinance our debt will depend on the condition of the capital and credit markets and our financial condition at such time. Any refinancing of our debt could be at higher interest rates and may require us to comply with more onerous covenants, which could further restrict our business operations. The terms of existing or future debt instruments, including the credit agreement governing the ABL Facility and the indentures governing the Senior Notes, may restrict us from adopting some of these alternatives, which in turn could exacerbate the effects of any failure to generate sufficient cash flow to satisfy our debt obligations. In addition, any failure to make payments of interest and principal on our outstanding indebtedness on a timely basis would likely result in a reduction of our credit rating, which could harm our ability to incur additional indebtedness on acceptable terms.
Our inability to generate sufficient cash flow to satisfy our debt obligations, or to refinance our obligations at all or on commercially reasonable terms, would have an adverse effect, which could be material, on our business, financial condition and results of operations, may restrict our current and future operations, particularly our ability to respond to business changes or to take certain actions, and would have an adverse effect on our ability to satisfy our debt service obligations.
The terms of the ABL Facility and the indentures governing the Senior Notes may restrict our current and future operations, particularly our ability to respond to changes in our business or to take certain actions.
The credit agreement governing the ABL Facility and the indentures governing the Senior Notes contain, and the terms of any future indebtedness of ours would likely contain, a number of restrictive covenants that impose significant operating and financial restrictions, including restrictions on our ability to engage in acts that may be in our best long-term interests. The credit agreement governing the ABL Facility and the indentures governing the Senior Notes include covenants that, among other things, restrict the ability of Aleris International and certain of its subsidiaries’ to:
▪ | incur additional indebtedness; |
▪ | pay dividends on capital stock and make other restricted payments; |
▪ | make investments and acquisitions; |
▪ | engage in transactions with our affiliates; |
24
▪ | sell assets; |
▪ | merge or consolidate with other entities; and |
▪ | create liens. |
In addition, Aleris International’s ability to borrow under the ABL Facility is limited by a borrowing base and may be restricted by the indentures governing the Senior Notes. Under certain circumstances, the ABL Facility requires Aleris International to comply with a minimum fixed charge coverage ratio and may require Aleris International to reduce its debt or take other actions in order to comply with this ratio. See Note 9, “Long-Term Debt,” to our audited consolidated financial statements included elsewhere in this annual report on Form 10-K for further details. Moreover, the ABL Facility provides discretion to the agent bank acting on behalf of the lenders to impose additional availability and other reserves, which could materially impair the amount of borrowings that would otherwise be available to Aleris International. There can be no assurance that the agent bank will not impose such reserves or, were it to do so, that the resulting impact of this action would not materially and adversely impair our liquidity.
A breach of any of these provisions could result in a default under the ABL Facility or either of the indentures governing the Senior Notes, as the case may be, that would allow lenders or noteholders, as applicable, to declare the applicable outstanding debt immediately due and payable. If we are unable to pay those amounts because we do not have sufficient cash on hand or are unable to obtain alternative financing on acceptable terms, the lenders or noteholders, as applicable, could initiate a bankruptcy proceeding or, in the case of the ABL Facility and the 9½% Senior Secured Notes, proceed against any assets that serve as collateral to secure such debt. The lenders under the ABL Facility will also have the right in these circumstances to terminate any commitments they have to provide further borrowings.
These restrictions could limit our ability to obtain future financings, make needed capital expenditures, withstand future downturns in our business or the economy in general or otherwise conduct necessary corporate activities. We may also be prevented from taking advantage of business opportunities that arise because of limitations imposed on Aleris International and its subsidiaries by the restrictive covenants under the ABL Facility and the Senior Notes.
ITEM 1B. UNRESOLVED STAFF COMMENTS.
None.
ITEM 2. PROPERTIES.
Our production and manufacturing facilities are listed below by reportable segment.
Reportable Segment | Location | Owned / Leased | ||
North America | Clayton, New Jersey | Owned | ||
Buckhannon, West Virginia | Owned | |||
Ashville, Ohio | Owned | |||
Richmond, Virginia | Owned | |||
Uhrichsville, Ohio | Owned | |||
Lewisport, Kentucky | Owned | |||
Davenport, Iowa (1) | Owned | |||
Lincolnshire, Illinois | Owned | |||
Europe | Duffel, Belgium | Owned | ||
Koblenz, Germany | Owned | |||
Voerde, Germany | Owned | |||
Asia Pacific | Zhenjiang, PRC | Granted Land Rights | ||
(1)Two facilities at this location.
25
The following table presents the average operating rates for each of our three operating segments’ facilities for the years ended December 31, 2017, 2016 and 2015:
For the years ended December 31, | ||||||
Segment | 2017 | 2016 | 2015 | |||
North America | 70% | 73% | 75% | |||
Europe | 86 | 90 | 90 | |||
Asia Pacific | 84 | 78 | 89 | |||
The Zhenjiang rolling mill is located in Zhenjiang City, Jiangsu Province in China and has been granted a 50 year right to occupy the land on which the factory resides.
Our Cleveland, Ohio corporate facility houses our principal executive offices, as well as our offices for North America, and we currently lease approximately 57,419 square feet for those purposes.
We believe that our facilities are suitable and adequate for our operations.
ITEM 3. LEGAL PROCEEDINGS.
We are a party from time to time to what we believe are routine litigation and proceedings considered part of the ordinary course of our business. We believe that the outcome of such existing proceedings would not have a material adverse effect on our financial position, results of operations or cash flows.
ITEM 4. MINE SAFETY DISCLOSURES.
None.
PART II
ITEM 5. MARKET FOR REGISTRANT’S COMMON EQUITY, RELATED STOCKHOLDER MATTERS AND ISSUER PURCHASES OF EQUITY SECURITIES.
Market Information
Our common stock is privately held. There is no established public trading market for our common stock.
Holders
As of February 15, 2018, there were 222 holders of our common stock.
Dividends
We do not intend to pay any cash dividends on our common stock for the foreseeable future and instead may retain earnings, if any, for future operation and expansion and debt repayment. Any decision to declare and pay dividends in the future will be made at the discretion of our Board of Directors and will depend on, among other things, our results of operations, cash requirements, financial condition, contractual restrictions and other factors that our Board of Directors may deem relevant.
We depend on our subsidiaries for cash and unless we receive dividends, distributions, advances, transfers of funds or other cash payments from our subsidiaries, we will be unable to pay any cash dividends on our common stock in the future. However, none of our subsidiaries are obligated to make funds available to us for payment of dividends. Further, the ABL Facility, the indentures governing the Senior Notes and the China Loan Facility (as defined in Item 7 below) contain a number of covenants that, among other things and subject to certain exceptions, restrict the ability of our subsidiaries to pay dividends on their capital stock and make other restricted payments. See Item 7. – “Management’s Discussion and Analysis of Financial Condition and Results of Operations – Liquidity and Capital Resources” for further details of the ABL Facility, the Senior Notes and the China Loan Facility.
Securities Authorized for Issuance Under Equity Compensation Plans
For information on the Aleris Corporation 2010 Equity Compensation Plan, see Item 11. – “Executive Compensation – Equity compensation plan information.”
26
Recent Sales of Unregistered Securities
None.
Purchases of Equity Securities by the Issuer and Affiliated Purchasers
None.
ITEM 6. SELECTED FINANCIAL DATA.
The following table presents the selected historical financial and other operating data of the Company derived from our consolidated financial statements. The audited consolidated statements of operations, consolidated statements of comprehensive (loss) income, consolidated statements of cash flows and consolidated statements of changes in stockholders’ equity and redeemable noncontrolling interest for the years ended December 31, 2017, 2016 and 2015 and the audited consolidated balance sheet as of December 31, 2017 and 2016 are included elsewhere in this annual report on Form 10-K. See Item 8. – “Financial Statements and Supplementary Data.”
We have reported the recycling and specification alloys and extrusions businesses as discontinued operations for all periods presented, and reclassified the results of operations of these businesses into a single caption on the accompanying Consolidated Statements of Operations as “Income (loss) from discontinued operations, net of tax.” For additional information, see Note 17, “Discontinued Operations,” to our audited consolidated financial statements included elsewhere in this annual report on Form 10-K. Except as otherwise indicated, the discussion of the Company’s business and financial information throughout this annual report on Form 10-K refers to the Company’s continuing operations and the financial position and results of operations of its continuing operations, while the presentation and discussion of our cash flows for the years ended December 31, 2015, 2014 and 2013 reflect the combined cash flows from our continuing and discontinued operations.
The following information should be read in conjunction with, and is qualified by reference to, our “Management’s Discussion and Analysis of Financial Condition and Results of Operations,” our consolidated audited financial statements and the notes included elsewhere in this annual report on Form 10-K, as well as other financial information included in this annual report on Form 10-K.
27
(Dollars in millions, metric tons in thousands) | For the years ended December 31, | ||||||||||||||||||
2017 | 2016 | 2015 | 2014 | 2013 | |||||||||||||||
Statement of Operations Data (a): | |||||||||||||||||||
Revenues | $ | 2,857.3 | $ | 2,663.9 | $ | 2,917.8 | $ | 2,882.4 | $ | 2,520.8 | |||||||||
Operating (loss) income | (14.7 | ) | 51.9 | (8.3 | ) | 11.7 | 26.2 | ||||||||||||
(Loss) income from continuing operations before income taxes | (174.0 | ) | (32.3 | ) | (95.0 | ) | (75.7 | ) | (77.2 | ) | |||||||||
Net (loss) income attributable to Aleris Corporation | (210.6 | ) | (75.6 | ) | 48.7 | 87.1 | (37.1 | ) | |||||||||||
Balance Sheet Data (at end of period) (a): | |||||||||||||||||||
Cash and cash equivalents | $ | 102.4 | $ | 55.6 | $ | 62.2 | $ | 28.6 | $ | 51.3 | |||||||||
Total assets (b) | 2,644.4 | 2,389.9 | 2,160.5 | 2,853.0 | 2,468.9 | ||||||||||||||
Total debt (b) | 1,780.5 | 1,466.2 | 1,118.3 | 1,478.2 | 1,229.3 | ||||||||||||||
Redeemable noncontrolling interest | — | — | — | 5.7 | 5.7 | ||||||||||||||
Total Aleris Corporation stockholders’ equity (c) | 92.7 | 216.6 | 327.2 | 292.6 | 368.4 | ||||||||||||||
Other Financial Data: | |||||||||||||||||||
Net cash (used) provided by: | |||||||||||||||||||
Operating activities | $ | (31.4 | ) | $ | 12.0 | $ | 119.5 | $ | — | $ | 31.9 | ||||||||
Investing activities | (210.7 | ) | (354.6 | ) | 273.7 | (265.3 | ) | (235.4 | ) | ||||||||||
Financing activities | 290.5 | 338.1 | (359.9 | ) | 246.1 | (331.6 | ) | ||||||||||||
Depreciation and amortization | 115.7 | 104.9 | 123.8 | 157.6 | 129.5 | ||||||||||||||
Capital expenditures | (207.7 | ) | (358.1 | ) | (313.6 | ) | (164.8 | ) | (238.3 | ) | |||||||||
Other Data (a): | |||||||||||||||||||
Metric tons of finished product shipped: | |||||||||||||||||||
North America | 462.0 | 486.3 | 492.8 | 482.0 | 372.3 | ||||||||||||||
Europe | 317.3 | 326.7 | 313.6 | 301.6 | 297.7 | ||||||||||||||
Asia Pacific | 26.9 | 22.2 | 21.8 | 12.8 | 4.8 | ||||||||||||||
Intra-entity shipments | (6.6 | ) | (6.2 | ) | (5.8 | ) | (2.6 | ) | (1.5 | ) | |||||||||
Total | 799.6 | 829.0 | 822.4 | 793.8 | 673.3 | ||||||||||||||
(a) | As a result of the divestitures of the recycling and specification alloys and extrusions businesses in 2015, the Company has presented the results of operations and financial position of these former businesses as discontinued operations for all periods presented. |
(b) | Total assets and total debt at December 31, 2014 and 2013 were not restated upon the adoption of Accounting Standards Update No. 2015-03, “Interest-Imputation of Interest (Subtopic 835-30): Simplifying the Presentation of Debt Issuance Costs.” |
(c) | We paid $313.0 million ($10.00 per share) in cash dividends to our stockholders during the year ended December 31, 2013. |
ITEM 7. MANAGEMENT’S DISCUSSION AND ANALYSIS OF FINANCIAL CONDITION AND RESULTS OF OPERATIONS.
The following Management’s Discussion and Analysis of Financial Condition and Results of Operations (“MD&A”) is intended to help you understand our operations as well as the industry in which we operate. This discussion should be read in conjunction with our audited consolidated financial statements and notes and other financial information appearing elsewhere in this annual report on Form 10-K. Our discussions of our financial condition and results of operations also include various forward-looking statements about our industry, the demand for our products and services and our projected results. These statements are based on certain assumptions that we consider reasonable. For more information about these assumptions and other risks relating to our businesses and our Company, you should refer to Item 1A. – “Risk Factors.”
Forward-Looking Statements
This annual report on Form 10-K contains forward-looking statements that are based on current expectations, estimates, forecasts and projections about us and the industry in which we operate and beliefs and assumptions made by our management. Statements contained in this annual report that are not historical in nature are considered to be forward-looking statements. They include statements regarding our expectations, hopes, beliefs, estimates, intentions or strategies regarding the future. Statements regarding future costs and prices of commodities, production volumes, industry trends, anticipated cost savings, anticipated benefits from new products, facilities, acquisitions or divestitures, projected results of operations, achievement of production efficiencies, capacity expansions, future prices and demand for our products and estimated cash flows and sufficiency of cash flows to fund operations, capital expenditures and debt obligations are forward-looking statements. The words “may,” “could,” “would,” “should,” “will,” “believe,” “expect,” “anticipate,” “plan,” “estimate,” “target,” “project,” “look forward to,” “intend” and similar expressions are intended to identify forward-looking statements.
28
Forward-looking statements should be read in conjunction with the cautionary statements and other important factors included in this annual report under “Business,” “Risk Factors,” and this “Management’s Discussion and Analysis of Financial Condition and Results of Operations” which include descriptions of important factors which could cause actual results to differ materially from those contained in the forward-looking statements. Our expectations, beliefs and projections are expressed in good faith, and we believe we have a reasonable basis to make these statements through our management’s examination of historical operating trends, data contained in our records and other data available from third parties, but there can be no assurance that our management’s expectations, beliefs or projections will result or be achieved.
Forward-looking statements involve known and unknown risks and uncertainties, which could cause actual results to differ materially from those contained in or implied by any forward-looking statement. Important factors that could cause actual results to differ materially from the forward-looking statements include, but are not limited to:
▪ | our ability to successfully implement our business strategy; |
▪ | the success of past and future acquisitions or divestitures; |
▪ | the cyclical nature of the aluminum industry, material adverse changes in the aluminum industry or our end-uses, such as global and regional supply and demand conditions for aluminum and aluminum products, and changes in our customers’ industries; |
▪ | increases in the cost, or limited availability, of raw materials and energy; |
▪ | our ability to enter into effective metal, energy and other commodity derivatives or arrangements with customers to manage effectively our exposure to commodity price fluctuations and changes in the pricing of metals, especially LME-based aluminum prices; |
▪ | our ability to generate sufficient cash flows to fund our operations, capital expenditure requirements and to meet our debt obligations; |
▪ | competitor pricing activity, competition of aluminum with alternative materials and the general impact of competition in the industry end-uses we serve; |
▪ | our ability to retain the services of certain members of our management; |
▪ | the loss of order volumes from any of our largest customers; |
▪ | our ability to retain customers, a substantial number of whom do not have long-term contractual arrangements with us; |
▪ | risks of investing in and conducting operations on a global basis, including political, social, economic, currency and regulatory factors; |
▪ | variability in general economic and political conditions on a global or regional basis; |
▪ | current environmental liabilities and the cost of compliance with and liabilities under health and safety laws; |
▪ | labor relations (i.e., disruptions, strikes or work stoppages) and labor costs; |
▪ | our internal controls over financial reporting and our disclosure controls and procedures may not prevent all possible errors that could occur; |
▪ | our levels of indebtedness and debt service obligations, including changes in our credit ratings, material increases in our cost of borrowing or the failure of financial institutions to fulfill their commitments to us under committed facilities; |
▪ | our ability to access credit or capital markets; |
▪ | the possibility that we may incur additional indebtedness in the future; and |
▪ | limitations on operating our business and incurring additional indebtedness as a result of covenant restrictions under our indebtedness, and our ability to pay amounts due under our outstanding indebtedness. |
The above list is not exhaustive. Some of these factors and additional risks, uncertainties and other factors that may cause our actual results, performance or achievements to be different from those expressed or implied in our written or oral forward-looking statements may be found under “Risk Factors” contained in this annual report.
These factors and other risk factors disclosed in this annual report and elsewhere are not necessarily all of the important factors that could cause our actual results to differ materially from those expressed in any of our forward-looking statements. Other unknown or unpredictable factors could also harm our results. Consequently, there can be no assurance that the actual results or developments anticipated by us will be realized or, even if substantially realized, that they will have the expected consequences to, or effects on, us. Given these uncertainties, you are cautioned not to place undue reliance on such forward-looking statements.
The forward-looking statements contained in this annual report are made only as of the date of this annual report. Except to the extent required by law, we do not undertake, and specifically decline any obligation, to update any forward-looking statements or to publicly announce the results of any revisions to any of such statements to reflect future events or developments.
29
Basis of Presentation
The financial information included in this annual report on Form 10-K represents our consolidated financial position as of December 31, 2017 and 2016 and our consolidated results of operations and cash flows for the years ended December 31, 2017, 2016 and 2015. We completed the sale of our former recycling and specification alloys and extrusions businesses in 2015. Accordingly, we have reported these businesses as discontinued operations for all periods presented, and reclassified the results of operations of these businesses as discontinued operations. For additional information, see Note 17, “Discontinued Operations” to our audited consolidated financial statements included elsewhere in this annual report on Form 10-K. Except as otherwise indicated, the discussion of the Company’s business and financial information throughout this MD&A refers to the Company’s continuing operations and the financial position and results of operations of its continuing operations, while the presentation and discussion of our combined cash flows reflect the cash flows of our continuing and discontinued operations.
Overview
This overview summarizes our MD&A, which includes the following sections:
▪ | Our Business – a general description of our operations, recent strategic initiatives, the aluminum industry, our critical measures of financial performance and our operating segments; |
▪ | Fiscal 2017 Summary and Outlook – a discussion of the key financial highlights for 2017, as well as material trends and uncertainties that may impact our business in the future; |
▪ | Results of Operations – an analysis of our consolidated and segment operating results and production for the years presented in our consolidated financial statements; |
▪ | Liquidity and Capital Resources – an analysis and discussion of our cash flows and current sources of capital; |
▪ | Non-GAAP Financial Measures – an analysis and discussion of key financial performance measures, including EBITDA, Adjusted EBITDA and commercial margin, as well as reconciliations to the applicable generally accepted accounting principles in the United States of America (“GAAP”) performance measures; |
▪ | Exchange Rates – a discussion of our subsidiaries’ functional currencies and the related currency translation adjustments; |
▪ | Contractual Obligations – a summary of our estimated significant contractual cash obligations and other commercial commitments at December 31, 2017; |
▪ | Environmental Contingencies - a summary of environmental laws and regulations that govern our operations; and |
▪ | Critical Accounting Policies and Estimates – a discussion of the accounting policies that require us to make estimates and judgments. |
Our Business
We are a global leader in the manufacture and sale of aluminum rolled products, with 13 production facilities located throughout North America, Europe and China. Our product portfolio ranges from the most technically demanding heat treated plate and sheet used in mission-critical applications to sheet produced through our low-cost continuous cast process. We possess a combination of technically advanced, flexible and low-cost manufacturing operations supported by an industry-leading research and development (“R&D”) platform. Our facilities are strategically located to serve our customers globally. Our diversified customer base includes a number of industry-leading companies in the aerospace, automotive, truck trailer and building and construction end-uses. Our technological and R&D capabilities allow us to produce the most technically demanding products, many of which require close collaboration and, in some cases, joint development with our customers.
London Metal Exchange (“LME”) aluminum prices and regional premium differentials (referred to as “Midwest Premium” in the U.S. and “Rotterdam Premium” in Europe) serve as the pricing mechanisms for both the aluminum we purchase and the products we sell. In addition, we depend on scrap for our operations, which is typically priced in relation to prevailing LME prices, but may also be priced at a discount to LME aluminum (depending upon the quality of the material supplied). Aluminum and other metal costs represented in excess of 69% of our costs of sales for the year ended December 31, 2017. Aluminum prices are determined by worldwide forces of supply and demand, and, as a result, aluminum prices are volatile. Average LME aluminum prices per ton for the years ended December 31, 2017, 2016 and 2015 were $1,968, $1,604 and $1,663, respectively. For the full year, average LME aluminum prices per ton were approximately 23% higher than 2016. As our invoiced prices are, in most cases, established months prior to physical delivery, the impact of aluminum price changes on our revenues may not correspond to LME and regional premium price changes for the applicable period.
30
Our business model strives to reduce the impact of aluminum price fluctuations on our financial results and protect and stabilize our margins, principally through pass-through pricing (market-based aluminum price plus a conversion fee) and derivative financial instruments.
As a result of using LME aluminum prices and regional premium differentials to both buy our raw materials and to sell our products, we are able to pass through aluminum price changes in the majority of our commercial transactions. Consequently, while our revenues can fluctuate significantly as aluminum prices change, we would expect the impact of these price changes on our profitability to be less significant. Approximately 93% of our sales for the year ended December 31, 2017 were generated from aluminum pass-through arrangements. In addition to using LME prices and regional premiums to establish our invoice prices to customers, we use derivative financial instruments to further reduce the impacts of changing aluminum prices. Derivative financial instruments are entered into at the time fixed prices are established for aluminum purchases or sales, on a net basis, and allow us to fix the margin to be realized on our long-term contracts and on short-term contracts where selling prices are not established at the same time as the physical purchase price of aluminum. However, as we have elected not to account for our derivative financial instruments as hedges for accounting purposes, changes in the fair value of our derivative financial instruments are included in our results of operations immediately. These changes in fair value (referred to as “unrealized gains and losses”) can have a significant impact on our pre-tax income in the same way LME aluminum and regional premium prices can have a significant impact on our revenues. In assessing the performance of our operating segments, we exclude these unrealized gains and losses, electing to include them only at the time of settlement to better match the period in which the underlying physical purchases and sales affect earnings.
Although our business model strives to reduce the impact of aluminum price fluctuations on our financial results, it cannot eliminate the impact completely. For example, as discussed in further detail below, at times the profitability of our North America segment is impacted by changes in scrap aluminum prices whose movement may not be correlated to movements in LME prices. Furthermore, certain segments are exposed to variability in the previously mentioned regional premium differentials charged by industry participants to deliver aluminum from the smelter to the manufacturing facility. This premium differential fluctuates in relation to several conditions, including the extent of warehouse financing transactions, which limit the amount of physical metal flowing to consumers and increase the price differential as a result. In addition to impacting the price we pay for the raw materials we purchase, our customers may be reluctant to place orders with us during times of uncertainty in the pricing of the Midwest Premium or Rotterdam Premium.
For additional information on the key factors impacting our profitability, see “– Critical Measures of Our Financial Performance” and “– Our Segments,” below.
Recent Strategic Initiatives
We are continuing to implement our previously announced project to add autobody sheet (“ABS”) capabilities at our aluminum rolling mill in Lewisport, Kentucky (the “North America ABS Project”). We are investing approximately $425.0 million to build a new wide cold mill, two continuous annealing lines with pre-treatment (each, a “CALP”) and an automotive innovation center at this facility. We have completed the construction and installation and are significantly through commissioning of the facility’s second CALP. We have also invested in upgrades to other key non-ABS equipment at the facility, including upgrading our ingot scalper and pre-heating furnace and widening the hot mill, to capture additional opportunities. Subsequent to a planned third quarter 2017 outage, which included a 60-day standstill of the facility’s hot mill, the Lewisport facility has started to ship autobody sheet and wide non-autobody sheet to customers using the re-engineered hot mill, the new wide cold mill and the first of the two CALPs. The investments position us to meet significant growth in demand for ABS in North America as the automotive industry pursues broader aluminum use for the production of lighter, more fuel-efficient vehicles.
The Aluminum Industry
Aluminum is a widely-used, attractive industrial material. Compared to several alternative metals such as steel and copper, aluminum is lightweight, has a high strength-to-weight ratio and is resistant to corrosion. Aluminum can be recycled repeatedly without any material decline in performance or quality. The recycling of aluminum delivers energy and capital investment savings relative to both the cost of producing primary aluminum and many other competing materials. The penetration of aluminum into a wide variety of applications continues to grow. We believe several factors support fundamental long-term growth in aluminum consumption in the end-uses we serve.
The global aluminum industry consists of primary aluminum producers with bauxite mining, alumina refining and aluminum smelting capabilities; aluminum semi-fabricated products manufacturers, including aluminum casters, recyclers, extruders and flat rolled products producers; and integrated companies that are present across multiple stages of the aluminum production chain. The industry is cyclical and is affected by global economic conditions, industry competition and product development.
31
Primary aluminum prices are determined by worldwide forces of supply and demand and, as a result, are volatile. This volatility has a significant impact on the profitability of primary aluminum producers whose selling prices are typically based upon prevailing LME prices while their costs to manufacture are not highly correlated to LME prices. We participate in select segments of the aluminum fabricated products industry, focusing on aluminum rolled products. We do not smelt aluminum, nor do we participate in other upstream activities, including mining bauxite or refining alumina. Since the majority of our products are sold on a market-based aluminum price plus conversion fee basis, we are less exposed to aluminum price volatility.
Critical Measures of Our Financial Performance
The financial performance of our operating segments is the result of several factors, the most critical of which are as follows:
▪ | volumes; |
▪ | commercial margins; and |
▪ | cash conversion costs. |
The financial performance of our business is determined, in part, by the volume of metric tons shipped and processed. Increased production volume will result in lower per unit costs, while higher shipped volumes will result in additional revenue and associated margins. As a significant component of our revenue is derived from aluminum prices that we generally pass through to our customers, we measure the performance of our segments based upon a percentage of commercial margin and commercial margin per ton in addition to a percentage of revenue and revenue per ton. Commercial margin removes the hedged cost of the metal we purchase and metal price lag (as defined below) from our revenue. Commercial margins capture the value-added components of our business and are impacted by factors, including rolling margins (the fee we charge to convert aluminum), product yields from our manufacturing process, the value-added mix of products sold and scrap spreads, which management are able to influence more readily than aluminum prices and, therefore, provide another basis upon which certain elements of our segments’ performance can be measured.
Although our conversion fee-based pricing model is designed to reduce the impact of changing primary aluminum prices, we remain susceptible to the impact of these changes and changes in premium differentials on our operating results. This exposure exists because of changes in metal prices during the period of time between the pricing of our metal purchases, the holding and processing of the metal, and the pricing of the finished product for sale to our customer. As we typically purchase metal prior to having a fixed selling price, and value our inventories under the first-in, first-out method, this lag will, generally, increase our earnings in times of rising aluminum prices and decrease our earnings in times of declining aluminum prices.
Our exposure to changing primary aluminum prices and premium differentials, both in terms of liquidity and operating results, is greater for fixed price sales contracts and other sales contracts where aluminum price changes are not able to be passed along to our customers. In addition, our operations require that a significant amount of inventory be kept on hand to meet future production requirements. This base level of inventory is also susceptible to changing primary aluminum prices and premium differentials to the extent it is not committed to fixed price sales orders.
In order to reduce these exposures, we focus on reducing working capital and offsetting future physical purchases and sales. We also utilize various derivative financial instruments designed to reduce the impact of changing primary aluminum prices on these net physical purchases and sales and on inventory for which a fixed sale price has not yet been determined. Our risk management practices reduce but do not eliminate our exposure to changing primary aluminum prices. In addition, exchanges have only recently begun to offer derivative financial instruments to hedge premium differentials. These markets are becoming more liquid and we are beginning to utilize these markets in our risk management practices. At this time, however, derivative financial instruments are not available to effectively hedge against changing scrap prices. While we have limited our exposure to unfavorable primary aluminum price changes, we have also limited our ability to benefit from favorable price changes. Further, our counterparties may require that we post cash collateral if the fair value of our derivative liabilities exceed the amount of credit granted by each counterparty, thereby reducing our liquidity. As of December 31, 2017 and 2016, no cash collateral was posted.
We refer to the estimated difference between the price of primary aluminum included in our revenues and the price of aluminum impacting our cost of sales, net of realized gains and losses from our hedging activities, as “metal price lag.” The aluminum price used in the metal price lag calculation for all segments includes the regional premium. Metal price lag will, generally, increase our earnings and net income and loss attributable to Aleris Corporation before interest, taxes, depreciation and amortization and income from discontinued operations, net of tax (“EBITDA”) in times of rising primary aluminum prices and decrease our earnings and EBITDA in times of declining primary aluminum prices. We seek to reduce this impact through the use of derivative financial instruments. We exclude metal price lag from our determination of Adjusted EBITDA because it is not an indicator of the performance of our underlying operations. We also exclude the impact of metal price lag from our measurement of commercial margin to more closely align the metal prices inherent in our sales prices to those included in our cost of sales.
32
In addition to rolling margins and product mix, commercial margins are impacted by the differences between changes in the prices of primary and scrap aluminum, as well as the availability of scrap aluminum, particularly in our North America segment where aluminum scrap is used more frequently than in our European and Asia Pacific operations. As we price our product using the prevailing price of primary aluminum but purchase large amounts of scrap aluminum to produce our products, we benefit when primary aluminum price increases exceed scrap price increases. Conversely, when scrap price increases exceed primary aluminum price increases, our commercial margin will be negatively impacted. The difference between the price of primary aluminum and scrap prices is referred to as the “scrap spread” and is impacted by the effectiveness of our scrap purchasing activities, the supply of scrap available and movements in the terminal commodity markets, such as the price of aluminum.
Our operations are labor intensive and also require a significant amount of energy (primarily natural gas and electricity) be consumed to melt scrap or primary aluminum and to re-heat and roll aluminum slabs into rolled products. As a result, we incur a significant amount of fixed and variable labor and overhead costs which we refer to as conversion costs. Conversion costs excluding depreciation expense, or cash conversion costs, on a per ton basis are a critical measure of the effectiveness of our operations.
Commercial margin, EBITDA and Adjusted EBITDA are non-GAAP financial measures that have limitations as analytical tools and should be considered in addition to, and not in isolation, or as a substitute for, or as superior to, our measures of financial performance prepared in accordance with GAAP. For additional information regarding non-GAAP financial measures, see “-Non-GAAP Financial Measures.”
Our Segments
We report three operating segments based on the organizational structure that we use to evaluate performance, make decisions on resource allocations and perform business reviews of financial results. The Company’s operating segments (each of which is considered a reportable segment) are North America, Europe and Asia Pacific.
In addition to analyzing our consolidated operating performance based upon revenues and Adjusted EBITDA, we measure the performance of our operating segments using segment income and loss, segment Adjusted EBITDA and commercial margin. Segment income and loss includes gross profits, segment specific realized gains and losses on derivative financial instruments, segment specific other income and expense, segment specific selling, general and administrative (“SG&A”) expenses and an allocation of certain functional SG&A expenses. Segment income and loss excludes provisions for and benefits from income taxes, restructuring items, interest, depreciation and amortization, unrealized and certain realized gains and losses on derivative financial instruments, corporate general and administrative costs, start-up costs, gains and losses on asset sales, currency exchange gains and losses on debt and certain other gains and losses. Intra-entity sales and transfers are recorded at market value. Consolidated cash, net capitalized debt costs, deferred tax assets and assets related to our headquarters offices are not allocated to the segments.
Segment Adjusted EBITDA eliminates from segment income and loss the impact of metal price lag. Commercial margin represents revenues less the hedged cost of metal, or the raw material costs included in our cost of sales, net of the impact of our hedging activities and the effects of metal price lag. Segment Adjusted EBITDA and commercial margin are non-GAAP financial measures that have limitations as analytical tools and should be considered in addition to, and not in isolation, or as a substitute for, or as superior to, our measures of financial performance prepared in accordance with GAAP. Management uses segment Adjusted EBITDA in managing and assessing the performance of our business segments and overall business and believes that segment Adjusted EBITDA provides investors and other users of our financial information with additional useful information regarding the ongoing performance of the underlying business activities of our segments, as well as comparisons between our current results and results in prior periods. Management also uses commercial margin as a performance metric and believes that it provides useful information regarding the performance of our segments because it measures the price at which we sell our aluminum products above the hedged cost of the metal and the effects of metal price lag, thereby reflecting the value-added components of our commercial activities independent of aluminum prices which we cannot control.
For additional information regarding non-GAAP financial measures, see “—Non-GAAP Financial Measures.”
North America
Our North America segment consists of nine manufacturing facilities located throughout the United States that produce rolled aluminum and coated products for the building and construction, truck trailer, automotive, consumer durables, other general industrial and distribution end-uses. Substantially all of our North America segment’s products are manufactured to specific customer requirements, using continuous cast and direct-chill technologies that provide us with significant flexibility to produce a wide range of products. Specifically, those products are integrated into, among other applications, building products, truck trailers, gutters, appliances, cars and recreational vehicles. In connection with the North America ABS Project, the segment has been incurring costs associated with start-up activities, including the design and development of new products and
33
processes, the manufacture of commissioning and trial products, and the development of sales and marketing efforts necessary to enter this new end-use. These start-up costs have been excluded from segment Adjusted EBITDA and segment income.
Key operating and financial information for the segment is presented below:
For the years ended December 31, | ||||||||||||
2017 | 2016 | 2015 | ||||||||||
North America | (dollars in millions, except per ton measures, volume in thousands of tons) | |||||||||||
Metric tons of finished product shipped | 462.0 | 486.3 | 492.8 | |||||||||
Revenues | $ | 1,467.8 | $ | 1,365.1 | $ | 1,532.8 | ||||||
Hedged cost of metal | (895.7 | ) | (792.3 | ) | (936.5 | ) | ||||||
Unfavorable (favorable) metal price lag | 8.5 | (4.7 | ) | 1.1 | ||||||||
Commercial margin | $ | 580.6 | $ | 568.1 | $ | 597.4 | ||||||
Commercial margin per ton shipped | $ | 1,256.6 | $ | 1,168.5 | $ | 1,212.1 | ||||||
Segment income | $ | 88.0 | $ | 86.1 | $ | 107.9 | ||||||
Unfavorable (favorable) metal price lag | 8.5 | (4.7 | ) | 1.1 | ||||||||
Segment Adjusted EBITDA (1) | $ | 96.5 | $ | 81.4 | $ | 109.1 | ||||||
Segment Adjusted EBITDA per ton shipped | $ | 208.8 | $ | 167.3 | $ | 221.0 | ||||||
Start-up costs | $ | 66.6 | $ | 41.5 | $ | 16.0 | ||||||
(1) | Amounts may not foot as they represent the calculated totals based on actual amounts and not the rounded amounts presented in this table. |
Europe
Our Europe segment consists of two world-class aluminum rolling mills, one in Germany and the other in Belgium, and an aluminum cast house in Germany. The segment produces aerospace plate and sheet, ABS, clad brazing sheet (clad aluminum material used for, among other applications, vehicle radiators and HVAC systems) and heat-treated plate for engineered product applications. Substantially all of our Europe segment’s products are manufactured to specific customer requirements using direct-chill ingot cast technologies that allow us to use and offer a variety of alloys and products for a number of technically demanding end-uses.
Key operating and financial information for the segment is presented below:
For the years ended December 31, | ||||||||||||
2017 | 2016 | 2015 | ||||||||||
Europe | (dollars in millions, except per ton measures, volume in thousands of tons) | |||||||||||
Metric tons of finished product shipped | 317.3 | 326.7 | 313.6 | |||||||||
Revenues | $ | 1,300.7 | $ | 1,222.6 | $ | 1,335.3 | ||||||
Hedged cost of metal | (739.1 | ) | (650.3 | ) | (783.9 | ) | ||||||
Unfavorable metal price lag | 0.3 | 1.9 | 17.4 | |||||||||
Commercial margin | $ | 561.9 | $ | 574.2 | $ | 568.8 | ||||||
Commercial margin per ton shipped | $ | 1,771.0 | $ | 1,757.4 | $ | 1,813.9 | ||||||
Segment income | $ | 127.4 | $ | 149.4 | $ | 131.8 | ||||||
Unfavorable metal price lag | 0.3 | 1.9 | 17.4 | |||||||||
Segment Adjusted EBITDA (1) | $ | 127.7 | $ | 151.3 | $ | 149.3 | ||||||
Segment Adjusted EBITDA per ton shipped | $ | 402.4 | $ | 463.0 | $ | 476.0 | ||||||
(1) | Amounts may not foot as they represent the calculated totals based on actual amounts and not the rounded amounts presented in this table. |
Asia Pacific
Our Asia Pacific segment consists of the Zhenjiang rolling mill that produces technically demanding and value-added plate products for aerospace, semiconductor equipment, general engineering, distribution and other end-uses worldwide. Substantially all of our Asia Pacific segment’s products are manufactured to specific customer requirements using direct-chill ingot cast technologies that allow us to use and offer a variety of alloys and products principally for aerospace and also for a number of other technically demanding end-uses.
34
The Zhenjiang rolling mill commenced operations in the first quarter of 2013 and achieved Nadcap certification, an industry standard for the production of aerospace aluminum, in 2014. Since then, the Zhenjiang rolling mill has received qualifications from several industry-leading aircraft manufacturers, including Airbus, Boeing, Bombardier and COMAC.
Key operating and financial information for the segment is presented below:
For the years ended December 31, | ||||||||||||
2017 | 2016 | 2015 | ||||||||||
Asia Pacific | (dollars in millions, except per ton measures, volume in thousands of tons) | |||||||||||
Metric tons of finished product shipped | 26.9 | 22.2 | 21.8 | |||||||||
Revenues | $ | 122.3 | $ | 100.5 | $ | 96.4 | ||||||
Hedged cost of metal | (63.5 | ) | (49.4 | ) | (58.2 | ) | ||||||
Favorable metal price lag | (2.4 | ) | (0.4 | ) | — | |||||||
Commercial margin | $ | 56.4 | $ | 50.7 | $ | 38.2 | ||||||
Commercial margin per ton shipped | $ | 2,101.0 | $ | 2,278.3 | $ | 1,748.6 | ||||||
Segment income | $ | 15.0 | $ | 10.8 | $ | — | ||||||
Favorable metal price lag | (2.4 | ) | (0.4 | ) | — | |||||||
Segment Adjusted EBITDA (1) | $ | 12.6 | $ | 10.4 | $ | — | ||||||
Segment Adjusted EBITDA per ton shipped | $ | 469.7 | $ | 468.1 | * | |||||||
* | Result is not meaningful. |
(1) Amounts may not foot as they represent the calculated totals based on actual amounts and not the rounded amounts presented in this table.
Fiscal 2017 Summary
Listed below are key financial highlights for the year ended December 31, 2017 as compared to 2016:
▪ | Our 2017 revenues increased $193.4 million, or 7%, from the prior year primarily due to the higher average price of aluminum included in our invoiced prices, the favorable impact of a weaker U.S. dollar on the translation of our euro-denominated revenues and improved rolling margins. These increases were partially offset by lower volumes that resulted from the extended planned outage at the Lewisport hot mill in the third quarter undertaken in connection with the North America ABS Project, uneven demand impacting our North America building and construction volumes, and lower European volumes resulting from aerospace supply chain destocking and a shift in automotive program timing. |
▪ | Losses from continuing operations were $214.4 million in 2017 compared to $72.3 million in 2016. Contributing to the increased loss in the current year were: |
▪ | interest expense increased $41.6 million in the current year resulting from increased debt and decreased capitalized interest; |
▪ | the extended planned outage at the Lewisport hot mill resulted in lost shipments and an increase to our loss from continuing operations; |
▪ | start-up costs, primarily related to labor and other expenses associated with the North America ABS Project, increased $27.6 million in 2017; |
▪ | a $22.8 million expense was recorded in 2017 related to the impairment of amounts held in escrow from the sale of our former recycling business to Real Industry, Inc. The amounts in escrow were preferred shares of Real Industry, Inc., which filed for bankruptcy protection in November 2017 (see Note 12, “Derivative and Other Financial Instruments,” to our audited consolidated financial statements included elsewhere in this annual report on Form 10-K); |
▪ | an unfavorable change of $16.0 million in unrealized gains on derivative financial instruments (a gain of $19.0 million in 2016 compared to a gain of $3.0 million in 2017); |
▪ | the net effect of income tax rate changes resulting from U.S. and international tax reform resulted in additional income tax expense of $12.3 million; |
▪ | depreciation expense increased $10.8 million as assets related to the North America ABS Project were placed in service; and |
▪ | a $9.6 million unfavorable change in metal lag, net of realized derivative gains and losses. |
In addition, Adjusted EBITDA decreased approximately $4.5 million. These unfavorable impacts to our results from continuing operations were partially offset by a $12.6 million decrease in debt extinguishment costs.
35
▪ | Adjusted EBITDA was $200.6 million in 2017 compared to $205.1 million in the prior year. Lower volumes, largely driven by the extended planned Lewisport hot mill outage, decreased Adjusted EBITDA approximately $9.0 million. Wage inflation, higher natural gas and repair and maintenance costs, and increased investments in research and development were partially offset with productivity gains, decreasing Adjusted EBITDA approximately $9.0 million. In addition, unfavorable currency exchange rates decreased Adjusted EBITDA approximately $7.0 million. These decreases were partially offset by favorable metal spreads, resulting from rising aluminum prices and improved scrap availability, that increased Adjusted EBITDA approximately $18.0 million and improved rolling margins that increased Adjusted EBITDA approximately $2.0 million; |
▪ | Liquidity at December 31, 2017 was approximately $231.3 million, which consisted of $123.4 million of availability under Aleris International’s ABL Facility (as defined below), $102.4 million of cash and $5.6 million of cash restricted for payments of the China Loan Facility (as defined below). Liquidity does not include $80.0 million of benefits from customer capacity reservation fees expected to be fully realized early in the second quarter of 2018, $40.0 million of which have been realized in the first quarter of 2018. All milestones for the capacity reservation fees have been met. During the year, we completed the issuance of an additional $250.0 million of 9½% Senior Secured Notes (as defined below); and |
▪ | Capital expenditures decreased to $207.7 million in 2017 from $358.1 million in the prior year, as the North America ABS Project nears completion. |
36
Outlook
This “Outlook” section contains various forward-looking statements about our industry, the demand for our products and services and our projected results. See “Forward-Looking Statements.” In particular, statements contained in this “Outlook” section regarding the future financial impact of customer purchase commitments and capital expenditure projects, including our North America ABS Project and certain aerospace projects, are forward-looking statements (the “outlook statements”). These outlook statements are subject to various risks and uncertainties, many of which are beyond our control. For example, we have estimated the future financial impact of certain customer purchase commitments net of their expected costs. Actual costs may exceed our projections, including as a result of increased aluminum, energy, labor or other operating costs or other factors, which could limit the benefits we expect to realize from these customer purchase commitments. We have also made certain assumptions regarding customer purchase commitments based on our historical experience with such customers and industry practice. Some of these commitments are not subject to contractual arrangements, and to the extent these customers seek to reduce or delay their commitments, we will not realize the benefits expected from these commitments. In addition, certain of the anticipated benefits contained in or implied by the outlook statements are not expected to be realized until the successful ramp-up of ABS production at our Lewisport facility and of certain aerospace production at our Koblenz and Zhenjiang facilities. As a result, we expect to realize only a portion of the anticipated benefits contained in or implied by these outlook statements during the year ending December 31, 2018, as ramp-up at these facilities is expected to occur over the next several years. See “Risk Factors” for a discussion of additional risks, uncertainties and other factors that may cause our actual results to differ materially from those expressed in our outlook statements.
The following discusses trends impacting the major end uses we serve as well as the factors anticipated to have a significant impact on our future performance.
Automotive
Aluminum usage in automotive applications has been growing steadily. This growth is due to government regulations targeted at reducing carbon emissions and increasing fuel efficiency. Efforts by original equipment manufacturers (“OEMs”) to reduce vehicle weight in order to meet these regulations has increased the demand for aluminum ABS in applications such as automobile hoods, roofs and doors. Ducker Worldwide estimates the demand for aluminum in North America will increase from 1.2 billion pounds in 2016 to 3.4 billion pounds by 2025 and the aluminum content per light vehicle will increase from 397 pounds in 2015 to 565 pounds by 2028, with ABS per light vehicle increasing from 14 pounds to 61 pounds per vehicle over the same time frame. The expected increase in aluminum content per light vehicle in North America is shown below:
* Source: July 2017 Ducker Worldwide
37
In anticipation of the increase in demand for aluminum for ABS, we have completed the installation, commissioning and qualification of certain alloys at our new wide cold mill and first CALP at the Lewisport facility. We have completed the construction and installation and are significantly through commissioning of the facility’s second CALP. These investments are expected to total approximately $425.0 million and are targeted at enhancing our product offering in North America to enable us to participate in the growing demand for aluminum ABS.
Aluminum ABS products are expected to generate more than twice the commercial margin per ton of the standard distribution sheet currently produced at the Lewisport facility. Over the next several years, this is expected to have a meaningful impact on our profitability. Based on existing long-term customer commitments, which account for over 60% of our ABS capacity through 2025 and include significant “take or pay” obligations, we believe the segment income and Adjusted EBITDA impact of the North America ABS Project could range from $65 million to $75 million in 2019. We expect the full ramp up of ABS shipments from our combined CALP capacity to occur over the next four years as the current strong demand from the automotive sector is expected to enable us to fill the balance of our open capacity in this time frame.
In preparation for us to begin the ramp-up of our ABS production, we have also significantly upgraded the existing asset base at Lewisport. In particular, in 2017 we initiated and successfully completed a major planned hot mill outage. The outage targeted upgrading our ingot scalper, pre-heating furnace capabilities, widening our hot mill and installing state-of-the-art mill controls. This necessary outage took approximately 60 days (together with the commissioning of the hot mill after the outage, effectively 75 days) to complete and impacted our ability to produce and ship products to customers. In preparing for and executing this outage, we estimate that we missed 100 million pounds (45 kilotons) of customer shipments, which, in turn, we estimate reduced our North America segment income and Adjusted EBITDA by approximately $30 million in 2017. Additionally, in Europe we blocked capacity of the CALP at our Duffel facility to supply ABS to North America for customer qualification purposes. We estimate that this lost volume could have increased Europe segment income and Adjusted EBITDA by approximately $4 million in 2017.
In 2018, we expect global automotive volumes to increase as shipments from Lewisport begin to ramp up and as customers launch new models. In addition, customer model launch delays and the blocked capacity discussed above, which negatively impacted Europe automotive volumes in 2017, are not anticipated to impact 2018. However, the impact of the expected increased volume on our North America segment income and Adjusted EBITDA will be limited in the first half of 2018 as the North America ABS volumes are not expected to contribute meaningfully until the first CALP is producing at near run rate volumes, which is expected to be achieved in the second half of 2018.
Aerospace
Despite aerospace softness in 2017, due to continued supply chain destocking, aircraft order backlogs for Airbus and Boeing were over 13,000 planes in December 2017, an all-time high for the industry. Several aircraft OEMs are increasing build rates on many single aisle and regional jets, which we expect to more than offset the impact of lower build rates on larger aircraft. Aircraft backlog trends at Airbus and Boeing as well as historical and estimated future aircraft deliveries are shown below:
38
* Source: Airbus and Boeing websites and build rate estimates (data as of December 31, 2017)
* Source: Airbus and Boeing websites for actual data; Aleris estimates for 2018-2020 data.
During 2016 and 2017, several of our long-term contracts with major aircraft OEMs were successfully renewed. Each contract was renewed with a higher share of the OEM’s aerospace business and with a higher value-added mix of products and alloys. Based upon expected aircraft build rates, these new contracts and products are expected to increase segment income and Adjusted EBITDA by $20 million to $30 million annually, beginning in 2019. The full annual benefit of these contracts is not expected to be realized until 2022; however, we expect to begin to realize some of these benefits after the first half of 2018, when the current inventory destocking is expected to end.
Additionally, both our Koblenz and Zhenjiang facilities allocated equipment run time in 2017, and will allocate additional equipment run time in 2018, for the development and qualification of new wingskin products, which limits capacity available for customer production and shipments. We believe this impacted segment income and Adjusted EBITDA by approximately $4 million in 2017 and will impact segment income and Adjusted EBITDA by approximately $4 million in 2018. We expect to introduce wingskin production at Koblenz in the second half of 2018 and at Zhenjiang in early 2019.
In 2018, we expect improving demand as the OEM inventory destocking ends and benefits from higher aircraft production rates and our new long-term contracts begin to be realized. However, the impact of a significantly weaker U.S. dollar and lower rolling margins are expected to offset much of the positive year-over-year impact from the anticipated volume growth and product mix improvement.
Building and Construction and Scrap Spreads
Housing starts are expected to see another year of growth in 2018, with experts estimating that total housing starts in the U.S will increase from 1,203,000 in 2017 to 1,271,000 in 2018. Importantly, the mix between single-family and multi-family construction is expected to continue to trend favorably for us. Additionally, the demographic trends in the U.S. around population growth and family formation rates continue to suggest strength in this important end use. With growth in housing starts, we expect demand for our building and construction products to increase in 2018.
Many of our building and construction products are able to be produced with aluminum scrap rather than primary aluminum. If the recent trend of increased aluminum prices continues, year-over-year scrap spreads in North America may be favorably impacted, particularly in the first half of 2018. Additionally, past experience suggests that there will likely be increased demand this year coming from the regions that experienced hurricane damage in 2017, as rebuilding efforts continue.
The segment income and Adjusted EBITDA impacts discussed above in “ – Automotive” and “ – Aerospace” have been provided for illustrative purposes only. These impacts are presented, in part, to demonstrate the potential incremental improvements to 2017 Adjusted EBITDA we believe we would have realized if the planned outage at our Lewisport facility and the allocation of equipment run time at our Duffel, Koblenz and Zhenjiang facilities as discussed above did not occur in 2017, and to demonstrate the benefits we expect to receive from certain existing customer commitments in future years. Estimates of the segment income and Adjusted EBITDA impact from certain existing commitments have been determined using a range of
39
expected customer nominated volumes based on existing customer commitments and applying an appropriate estimate of average profitability per ton. To determine an estimate of average North America segment income and Adjusted EBITDA per ton we used the range of rolling margins per ton included in the pricing terms of our existing customer arrangements. These rolling margins were then compared to Lewisport’s average rolling margin per ton in 2017. Profitability per ton also reflects an estimate of incremental cash conversion costs. The estimate of average Europe and Asia Pacific segment income and Adjusted EBITDA per ton was determined using the 2017 Company-wide average Adjusted EBITDA per ton for aerospace products plus an estimate of profitability benefits from fixed cost leverage, which was based on our 2017 aerospace fixed cost absorption and adjusted for the higher production volumes expected to be realized in the future under certain aerospace contracts.
2018 Outlook
For 2018, we expect that segment income and Adjusted EBITDA will be substantially higher than 2017, as North America volumes not only recover from the 2017 Lewisport hot mill outage but also begin to benefit from the mix shift to higher value-added ABS products and a favorable U.S. housing market, while European demand from automotive and aerospace customers is expected to improve. In addition, beginning in 2018, common alloys used in products made by our North America segment may potentially benefit from trade case activity. We expect the year-over-year improvements to accelerate beginning in the second quarter and continue throughout the year. Pre-tax income will be impacted by these factors and the other factors described above in this “– Outlook” as well as the absence of several large, one-time charges recorded in 2017 (as described in the “– Fiscal 2017 Summary” above and “– Results of Operations” below) and substantially lower start-up costs associated with the North America ABS Project. We expect full year capital expenditures of approximately $125.0 million to $140.0 million.
40
Results of Operations
Review of Consolidated Results
Year Ended December 31, 2017 Compared to the Year Ended December 31, 2016
Revenues were approximately $2.9 billion for the year ended December 31, 2017 compared to approximately $2.7 billion for the year ended December 31, 2016. The increase in revenues was primarily due to the following:
▪ | the higher average price of aluminum included in our invoiced prices increased revenues approximately $261.0 million; |
▪ | the weaker U.S. dollar’s impact on the translation of euro-based revenues increased revenues approximately $17.0 million; and |
▪ | improved rolling margins increased revenues approximately $2.0 million. |
These increases were partially offset by lower volumes that decreased revenues approximately $84.0 million. In Europe, aerospace, automotive and regional plate and sheet volume decreases of 9%, 3%, and 5%, respectively, were partially offset by an improved mix of regional plate and sheet products sold. Supply chain destocking resulted in lower aerospace volumes, a shift in automotive program timing resulted in lower automotive volumes and uncertainty due to rising aluminum prices resulted in lower regional plate and sheet volumes. In North America, distribution and building and construction volume decreases of 8% and 3%, respectively, were partially offset by an improved mix of painted products sold. North America distribution volumes were significantly impacted by the extended planned outage at the Lewisport hot mill in the third quarter of 2017 undertaken in connection with the North America ABS Project, while building and construction demand was uneven during the year.
The following table presents the estimated impact of key factors that resulted in the 7% increase in our consolidated revenues from 2016:
North America | Europe | Asia Pacific | Consolidated | ||||||||||||||||||||||||
$ | % | $ | % | $ | % | $ | % | ||||||||||||||||||||
(dollars in millions) | |||||||||||||||||||||||||||
LME / aluminum pass-through | $ | 149.0 | 11 | % | $ | 105.0 | 9 | % | $ | 7.0 | 7 | % | $ | 261.0 | 10 | % | |||||||||||
Commercial price | 9.0 | 1 | (1.0 | ) | — | (6.0 | ) | (6 | ) | 2.0 | — | ||||||||||||||||
Volume/mix | (60.0 | ) | (4 | ) | (43.0 | ) | (4 | ) | 19.0 | 19 | (84.0 | ) | (3 | ) | |||||||||||||
Currency | — | — | 17.0 | 1 | — | — | 17.0 | 1 | |||||||||||||||||||
Other | 4.7 | * | 0.1 | * | 1.8 | * | 6.6 | * | |||||||||||||||||||
Total | $ | 102.7 | 8 | % | $ | 78.1 | 6 | % | $ | 21.8 | 22 | % | $ | 202.6 | 8 | % | |||||||||||
Intra-entity revenues | (9.2 | ) | — | % | |||||||||||||||||||||||
Total | $ | 193.4 | 7 | % | |||||||||||||||||||||||
* Result is not meaningful.
Gross profit for the year ended December 31, 2017 was $259.4 million compared to $287.9 million for the year ended December 31, 2016. The decrease in gross profit was primarily due to the following:
▪ | start-up costs, primarily attributable to the North America ABS Project, increased $32.2 million; |
▪ | depreciation expense increased approximately $12.1 million, as assets related to the North America ABS Project were placed in service; |
▪ | lower volumes, including lost volumes related to the extended planned outage at the Lewisport hot mill, and unfavorable cost absorption, resulting from successful working capital optimization efforts and a related reduction in inventory levels, decreased gross profit approximately $9.0 million; and |
▪ | wage inflation, higher natural gas and repair and maintenance costs, and increased investments in research and development were partially offset by project-specific productivity improvements, resulting in a $7.0 million decrease to gross profit. |
These unfavorable impacts were partially offset by the following:
41
▪ | favorable scrap spreads in North America, resulting from higher aluminum prices, improved scrap availability and strategic metal buying, increased gross profit approximately $18.0 million; |
▪ | metal price lag had an estimated $7.7 million favorable impact on gross profit for the year ended December 31, 2017 when compared to the year ended December 31, 2016. This favorable impact from metal price lag excludes the realized gains and losses on metal derivative financial instruments, which are classified separately in the Consolidated Statements of Operations (see table below); and |
▪ | higher rolling margins increased gross profit approximately $2.0 million. |
The following table presents the estimated impact of metal price lag on our Consolidated Statements of Operations for the years ended December 31, 2017 and 2016:
For the years ended December 31, | |||||||||||||
2017 | 2016 | Change | |||||||||||
Location in Consolidated Statements of Operations | (dollars in millions) | ||||||||||||
Gross profit | Favorable metal price lag | $ | 41.0 | $ | 33.3 | $ | 7.7 | ||||||
Losses on derivative financial instruments | Realized losses on metal derivatives | (47.3 | ) | (30.0 | ) | (17.3 | ) | ||||||
(Unfavorable) favorable metal price lag net of realized derivative gains/losses | $ | (6.3 | ) | $ | 3.3 | $ | (9.6 | ) | |||||
Selling, General and Administrative Expenses
SG&A expenses were $220.8 million for the year ended December 31, 2017 compared to $218.5 million for the year ended December 31, 2016. The $2.3 million increase was primarily due to the following:
▪ | a $9.4 million increase in labor costs related to increased incentive compensation expense and wage inflation; and |
▪ | a $4.3 million increase in stock-based compensation expense resulting from the grant of stock options and restricted stock units in the fourth quarter of 2017. |
These increases were partially offset by the following:
▪ | a $4.7 million decrease in start-up costs, primarily related to labor, consulting and other expenses associated with the North America ABS Project; |
▪ | a $3.1 million decrease in professional fees and travel expenses; and |
▪ | a $1.4 million decrease in depreciation and amortization expense resulting from certain assets becoming fully depreciated. |
Gains and Losses on Derivative Financial Instruments
During the years ended December 31, 2017 and 2016, we recorded realized losses on derivative financial instruments of $47.7 million and $31.0 million, respectively, and unrealized gains of $3.0 million and $18.9 million, respectively. Generally, our realized gains or losses represent the cash paid or received upon settlement of our derivative financial instruments. Unrealized gains or losses reflect the change in the fair value of derivative financial instruments from the later of the end of the prior period or our entering into the derivative instrument as well as the reversal of previously recorded unrealized gains or losses for derivatives that settled during the period. Derivative financial instruments are used to reduce our exposure to fluctuations in commodity prices, including metal and natural gas prices, and currency fluctuations. See “– Critical Measures of Our Financial Performance,” above, and Item 7A. “– Quantitative and Qualitative Disclosures about Market Risk,” below, for additional information regarding our use of derivative financial instruments.
Interest Expense, Net
Net interest expense increased $41.6 million for the year ended December 31, 2017 compared to the year ended December 31, 2016 primarily due to the issuance of $550.0 million of 9½% Senior Secured Notes in the second quarter of 2016, and the issuance of $250.0 million of 9½% Senior Secured Notes in the first quarter of 2017 and a decrease in capitalized interest.
Other Income / Expense
An unfavorable $33.5 million change in other expense (income) included:
42
▪ | a $22.8 million expense recorded in 2017 related to the impairment of amounts held in escrow from the sale of our former recycling business to Real Industry, Inc. The amounts in escrow were preferred shares of Real Industry, Inc., which filed for bankruptcy protection in November 2017; |
▪ | a $9.0 million unfavorable change in currency exchange rate gains and losses (an $8.2 million loss in 2017 compared to a $0.8 million gain in 2016), primarily related to the remeasurement of U.S. dollar working capital and debt balances in Europe; |
▪ | gains of $8.7 million recorded in 2016 related to the favorable resolution of vendor disputes; and |
▪ | a $6.5 million expense from recording a liability for taxes related to prior acquisitions. |
These unfavorable changes were partially offset by a $12.6 million loss on extinguishment of debt in 2016 that did not recur in 2017.
Income Taxes
The provision for income taxes was $40.4 million for the year ended December 31, 2017, compared to a provision for income taxes of $40.0 million for the year ended December 31, 2016. The income tax provision for the year ended December 31, 2017 consisted of income tax expense of $43.8 million from international jurisdictions and an income tax benefit of $3.4 million in the U.S. The income tax provision for the year ended December 31, 2016 consisted of income tax expense of $39.5 million from international jurisdictions and an income tax expense of $0.5 million in the U.S.
At December 31, 2017 and 2016, we had valuation allowances of $257.6 million and $244.9 million, respectively, to reduce certain deferred tax assets to amounts that are more likely than not to be realized. Of the total December 31, 2017 and 2016 valuation allowances, $83.9 million and $72.7 million, respectively, relate primarily to net operating losses in non-U.S. tax jurisdictions, $141.0 million and $154.5 million, respectively, relate primarily to the U.S. federal effects of net operating losses and amortization and $32.7 million and $17.7 million, respectively, relate primarily to the state effects of net operating losses and amortization.
The net increase in the valuation allowance in 2017 is mainly comprised of a $11.2 million increase in non-U.S. tax jurisdictions resulting from additional tax net operating losses. The net increase in the U.S. of $1.5 million is mainly comprised of a $88.3 million increase resulting from additional tax net operating losses, net reversals of other deductible temporary differences and net increases in taxable temporary differences, and a $86.8 million decrease resulting from the remeasurement of U.S. federal net deferred tax assets with valuation allowances against them as a result of the reduction to the federal income tax rate from 35% to 21% enacted by the recent U.S. tax legislation.
We do not expect a cash tax impact in the near future as a result of the recent U.S. tax legislation.
Year Ended December 31, 2016 Compared to the Year Ended December 31, 2015
Revenues for the year ended December 31, 2016 were approximately $2.7 billion compared to approximately $2.9 billion for the year ended December 31, 2015. The decrease in revenues was primarily due to the following:
▪ | the lower average price of aluminum included in our invoiced prices decreased revenues approximately $242.0 million; |
▪ | an unfavorable mix of products sold decreased revenues approximately $37.0 million. The unfavorable mix resulted from decreases of 16% and 9% in North America truck trailer and distribution volumes, respectively, as well as weakness in our European aerospace business in the second half of 2016. These decreases were partially offset by a 7% increase in North America building and construction volumes, as well as increased Asia Pacific aerospace volumes. Production issues, planned outages and bottlenecks prevented the North America segment from realizing the benefits of a strong demand environment; and |
▪ | the stronger U.S. dollar’s impact on the translation of renminbi and euro-based revenues decreased revenues approximately $6.0 million. |
These decreases were partially offset by improved rolling margins that increased revenues approximately $9.0 million.
43
The following table presents the estimated impact of key factors that resulted in the 9% decrease in our consolidated revenues from 2015:
North America | Europe | Asia Pacific | Consolidated | ||||||||||||||||||||||||
$ | % | $ | % | $ | % | $ | % | ||||||||||||||||||||
(dollars in millions) | |||||||||||||||||||||||||||
LME / aluminum pass-through | $ | (139.0 | ) | (9 | )% | $ | (101.0 | ) | (8 | )% | $ | (2.0 | ) | (2 | )% | $ | (242.0 | ) | (8 | )% | |||||||
Commercial price | 5.0 | — | 5.0 | — | (1.0 | ) | (1 | ) | 9.0 | — | |||||||||||||||||
Volume/mix | (30.0 | ) | (2 | ) | (16.0 | ) | (1 | ) | 9.0 | 9 | (37.0 | ) | (1 | ) | |||||||||||||
Currency | — | — | (3.0 | ) | — | (3.0 | ) | (3 | ) | (6.0 | ) | — | |||||||||||||||
Other | (3.7 | ) | * | 2.3 | * | 1.1 | * | (0.3 | ) | * | |||||||||||||||||
Total | $ | (167.7 | ) | (11 | )% | $ | (112.7 | ) | (9 | )% | $ | 4.1 | 4 | % | $ | (276.3 | ) | (9 | )% | ||||||||
Intra-entity revenues | 22.4 | 1 | |||||||||||||||||||||||||
Total | $ | (253.9 | ) | (9 | )% | ||||||||||||||||||||||
* Result is not meaningful.
Gross profit for the year ended December 31, 2016 was $287.9 million compared to $214.9 million for the year ended December 31, 2015. The increase in gross profit was primarily due to the following:
▪ | metal price lag had an estimated $78.5 million favorable impact on gross profit for the year ended December 31, 2016 when compared to the year ended December 31, 2015. This favorable impact from metal price lag excludes the realized gains and losses on metal derivative financial instruments, which are classified separately in the Consolidated Statements of Operations (see table below); |
▪ | higher rolling margins increased gross profit approximately $9.0 million; and |
▪ | a decrease in depreciation expense, due in part to the closure of the Decatur, Alabama facility in 2015, increased gross profit approximately $9.0 million. |
These favorable impacts were partially offset by the following:
▪ | unfavorable scrap spreads, resulting from lower aluminum prices and reduced scrap availability, reduced gross profit approximately $17.0 million; |
▪ | the impact of operational issues as well as inflation in employee, freight and other costs was partially offset by project specific productivity gains and lower natural gas costs, resulting in an $6.0 million decrease to gross profit; and |
▪ | an unfavorable mix of products sold, partially offset by favorable cost absorption, decreased gross profit by approximately $3.0 million. |
The following table presents the estimated impact of metal price lag on our Consolidated Statements of Operations for the years ended December 31, 2016 and 2015:
For the years ended December 31, | |||||||||||||
2016 | 2015 | Change | |||||||||||
Location in Consolidated Statements of Operations | (dollars in millions) | ||||||||||||
Gross profit | Favorable (unfavorable) metal price lag | $ | 33.3 | $ | (45.2 | ) | $ | 78.5 | |||||
Losses on derivative financial instruments | Realized (losses) gains on metal derivatives | (30.0 | ) | 26.6 | (56.6 | ) | |||||||
Favorable (unfavorable) metal price lag net of realized derivative gains/losses | $ | 3.3 | $ | (18.6 | ) | $ | 21.9 | ||||||
Selling, General and Administrative Expenses
SG&A expenses were $218.5 million for the year ended December 31, 2016 compared to $203.5 million for the year ended December 31, 2015. The $15.0 million increase was primarily due to the following:
▪ | a $26.2 million increase in start-up costs primarily related to labor, consulting and other expenses associated with the North America ABS Project; and |
44
▪ | a $2.1 million increase in stock-based compensation expense. |
These increases were partially offset by the following:
▪ | a $9.9 million decrease in depreciation and amortization expense resulting from the closure and sale of certain North America segment facilities in 2015, and certain assets becoming fully depreciated in 2015; and |
▪ | a $5.5 million decrease in professional fees, business development costs and other expenses, as the prior year period includes expenses associated with the sale of our recycling and specification alloys and extrusions businesses. |
Gains and Losses on Derivative Financial Instruments
During the years ended December 31, 2016 and 2015, we recorded realized losses (gains) on derivative financial instruments of $31.0 million and $(23.2) million, respectively, and unrealized (gains) losses of $(18.9) million and $30.1 million, respectively. Generally, our realized gains or losses represent the cash paid or received upon settlement of our derivative financial instruments. Unrealized gains or losses reflect the change in the fair value of derivative financial instruments from the later of the end of the prior period or our entering into the derivative instrument as well as the reversal of previously recorded unrealized gains or losses for derivatives that settled during the period.
Interest Expense, Net
Net interest expense decreased $11.6 million for the year ended December 31, 2016 compared to the year ended December 31, 2015 primarily due to a $17.2 million increase in capitalized interest as a result of the capital expenditures for the North America ABS Project, partially offset by an increase in interest expense due to the issuance of $550.0 million of 9½% Senior Secured Notes in 2016 and additional borrowings under the ABL Facility in 2016.
Other Income / Expense
An unfavorable $9.1 million change in other expense (income) included a $10.5 million increase in losses on the extinguishment of debt, due primarily to the extinguishment of the 7 5/8% Senior Notes in the second quarter of 2016. In addition, currency exchange rate changes resulted in $7.5 million of gains in the prior year compared to $0.8 million of gains in the current year, primarily related to the remeasurement of U.S. dollar working capital and intercompany debt balances in Europe. These unfavorable changes were partially offset by $8.7 million of gains related to the favorable resolution of certain vendor disputes.
Income Taxes
The provision for income taxes was $40.0 million for the year ended December 31, 2016, compared to a benefit from income taxes of $22.7 million for the year ended December 31, 2015. The income tax provision for the year ended December 31, 2016 consisted of income tax expense of $39.5 million from international jurisdictions and income tax expense of $0.5 million in the U.S. The income tax benefit for the year ended December 31, 2015 consisted of an income tax expense of $18.9 million from international jurisdictions and an income tax benefit of $41.6 million in the U.S.
At December 31, 2016 and 2015, we had valuation allowances of $244.9 million and $218.5 million, respectively, to reduce certain deferred tax assets to amounts that are more likely than not to be realized. Of the total December 31, 2016 and 2015 valuation allowances, $72.7 million and $68.9 million, respectively, relate primarily to net operating losses and future tax deductions for pension benefits in non-U.S. tax jurisdictions, $154.5 million and $135.0 million, respectively, relate primarily to the U.S. federal effects of net operating losses and amortization and $17.7 million and $14.6 million, respectively, relate primarily to the state effects of net operating losses and amortization.
The net increase in the valuation allowance in 2016 is mainly comprised of a $22.7 million increase in the U.S. resulting from additional tax net operating losses, net reversals of other deductible temporary differences and net increases in taxable temporary differences.
Gains / Losses from Discontinued Operations, Net of Tax
Loss from discontinued operations, net of tax was $3.3 million for the year ended December 31, 2016 compared to income from discontinued operations, net of tax of $121.1 million for the year ended December 31, 2015. The discontinued operations include the results of our divested recycling and specification alloys and extrusions businesses. The prior year period included two months of operations and the gain on sale of our divested recycling and specification alloys and extrusions businesses. The 2016 loss from discontinued operations includes an incremental loss on sale of $4.6 million related to our estimate of costs related to the indemnification of the buyer of the recycling and specification alloys business for certain potential future damages.
45
The following table presents key financial and operating data on a consolidated basis for the years ended December 31, 2017, 2016 and 2015:
For the years ended December 31, | ||||||||||||
2017 | 2016 | 2015 | ||||||||||
(in millions, except percentages) | ||||||||||||
Revenues | $ | 2,857.3 | $ | 2,663.9 | $ | 2,917.8 | ||||||
Cost of sales | 2,597.9 | 2,376.0 | 2,702.9 | |||||||||
Gross profit | 259.4 | 287.9 | 214.9 | |||||||||
Gross profit as a percentage of revenues | 9.1 | % | 10.8 | % | 7.4 | % | ||||||
Selling, general and administrative expenses | 220.8 | 218.5 | 203.5 | |||||||||
Restructuring charges | 2.9 | 1.5 | 10.3 | |||||||||
Losses on derivative financial instruments | 44.7 | 12.1 | 6.9 | |||||||||
Other operating expense, net | 5.7 | 3.9 | 2.5 | |||||||||
Operating (loss) income | (14.7 | ) | 51.9 | (8.3 | ) | |||||||
Interest expense, net | 124.1 | 82.5 | 94.1 | |||||||||
Other expense (income), net | 35.2 | 1.7 | (7.4 | ) | ||||||||
Loss from continuing operations before income taxes | (174.0 | ) | (32.3 | ) | (95.0 | ) | ||||||
Provision for (benefit from) income taxes | 40.4 | 40.0 | (22.7 | ) | ||||||||
Loss from continuing operations | (214.4 | ) | (72.3 | ) | (72.3 | ) | ||||||
Income (loss) from discontinued operations, net of tax | 3.8 | (3.3 | ) | 121.1 | ||||||||
Net (loss) income | (210.6 | ) | (75.6 | ) | 48.8 | |||||||
Net income from discontinued operations attributable to noncontrolling interest | — | — | 0.1 | |||||||||
Net (loss) income attributable to Aleris Corporation | $ | (210.6 | ) | $ | (75.6 | ) | $ | 48.7 | ||||
Total segment income | $ | 230.4 | $ | 246.3 | $ | 239.7 | ||||||
Depreciation and amortization of continuing operations | (115.7 | ) | (104.9 | ) | (123.8 | ) | ||||||
Corporate general and administrative expenses, excluding depreciation, amortization and start-up costs | (56.3 | ) | (51.8 | ) | (48.4 | ) | ||||||
Restructuring charges | (2.9 | ) | (1.5 | ) | (10.3 | ) | ||||||
Interest expense, net | (124.1 | ) | (82.5 | ) | (94.1 | ) | ||||||
Unallocated gains (losses) on derivative financial instruments | 3.1 | 19.1 | (30.2 | ) | ||||||||
Unallocated currency exchange (losses) gains | (2.5 | ) | (0.5 | ) | 1.2 | |||||||
Start-up costs | (73.6 | ) | (46.0 | ) | (21.1 | ) | ||||||
Loss on extinguishment of debt | — | (12.6 | ) | (2.0 | ) | |||||||
Impairment of amounts held in escrow related to the sale of the recycling business | (22.8 | ) | — | — | ||||||||
Other (expense) income, net | (9.6 | ) | 2.1 | (6.0 | ) | |||||||
Loss from continuing operations before income taxes | $ | (174.0 | ) | $ | (32.3 | ) | $ | (95.0 | ) | |||
Review of Segment Revenues and Shipments
The following tables present revenues and metric tons of finished product shipped by segment:
For the years ended December 31, | ||||||||||||
2017 | 2016 | 2015 | ||||||||||
(dollars in millions, metric tons in thousands) | ||||||||||||
Revenues: | ||||||||||||
North America | $ | 1,467.8 | $ | 1,365.1 | $ | 1,532.8 | ||||||
Europe | 1,300.7 | 1,222.6 | 1,335.3 | |||||||||
Asia Pacific | 122.3 | 100.5 | 96.4 | |||||||||
Intra-entity revenues | (33.5 | ) | (24.3 | ) | (46.7 | ) | ||||||
Consolidated revenues | $ | 2,857.3 | $ | 2,663.9 | $ | 2,917.8 | ||||||
Metric tons of finished product shipped: | ||||||||||||
North America | 462.0 | 486.3 | 492.8 | |||||||||
Europe | 317.3 | 326.7 | 313.6 | |||||||||
Asia Pacific | 26.9 | 22.2 | 21.8 | |||||||||
Intra-entity | (6.6 | ) | (6.2 | ) | (5.8 | ) | ||||||
Total metric tons of finished product shipped | 799.6 | 829.0 | 822.4 | |||||||||
46
North America Revenues
North America revenues for the year ended December 31, 2017 increased $102.7 million compared to the year ended December 31, 2016. This increase was primarily due to the following:
▪ | higher aluminum prices included in the invoiced prices of products sold increased revenues approximately $149.0 million; and |
▪ | improved rolling margins increased revenues approximately $9.0 million. |
These increases were partially offset by lower volumes that decreased revenues approximately $60.0 million. Distribution volumes decreased 8% as a result of the extended planned outage at the Lewisport hot mill. In addition, the impact of a 3% decrease in building and construction volumes resulting from uneven demand was partially offset by an improved mix of painted products sold.
North America revenues for the year ended December 31, 2016 decreased $167.7 million compared to the year ended December 31, 2015. This decrease was primarily due to the following:
▪ | lower aluminum prices included in our invoiced prices decreased revenues approximately $139.0 million; and |
▪ | lower volumes and an unfavorable mix of products sold decreased revenues approximately $30.0 million. Truck trailer volumes decreased 16% following strong demand in 2015 and distribution volumes decreased 9%. These decreases more than offset a 7% increase in building and construction volumes. Planned outages on the Lewisport hot mill related to the North America ABS Project resulted in significant production down time in the third quarter. In addition, production issues and bottlenecks prevented the segment from realizing the benefits of stronger demand. |
These decreases were partially offset by improved rolling margins that increased revenues approximately $5.0 million.
Europe Revenues
Revenues from our Europe segment for the year ended December 31, 2017 increased $78.1 million compared to the year ended December 31, 2016. This increase was primarily due to the following:
▪ | higher aluminum prices included in the invoiced prices of products sold increased revenues approximately $105.0 million; and |
▪ | foreign currency fluctuations increased revenues approximately $17.0 million. |
These increases were partially offset by:
▪ | lower volumes decreased revenues approximately $43.0 million. Supply chain destocking resulted in a 9% decrease in aerospace volumes, a shift in automotive program timing led to a 3% decrease in automotive volumes and uncertainty due to rising aluminum prices led to a 5% decrease in regional plate and sheet volumes; and |
▪ | lower rolling margins decreased revenues approximately $1.0 million. |
Revenues from our Europe segment for the year ended December 31, 2016 decreased $112.7 million compared to the year ended December 31, 2015. This decrease was primarily due to the following:
▪ | lower aluminum prices included in our invoiced prices decreased revenues approximately $101.0 million; |
▪ | an unfavorable mix of products sold, primarily resulting from a 1% decrease in aerospace volumes and a 6% decrease in heat exchanger volumes, decreased revenues approximately $16.0 million. Automotive volumes increased 7% and regional plate and sheet volumes increased 11%, partially offsetting the impact of the weaker aerospace and heat exchanger volumes; and |
▪ | a slightly stronger U.S. dollar decreased revenues approximately $3.0 million. |
These decreases were partially offset by improved rolling margins that increased revenues approximately $5.0 million.
Asia Pacific Revenues
Asia Pacific revenues for the year ended December 31, 2017 increased $21.8 million compared to the year ended December 31, 2016. This increase was primarily due to the following:
▪ | an increase in volumes increased revenues approximately $19.0 million; and |
▪ | higher aluminum prices included in the invoiced prices of products sold increased revenues approximately $7.0 million. |
47
These increases were partially offset by lower rolling margins that decreased revenues approximately $6.0 million.
Asia Pacific revenues for the year ended December 31, 2016 increased $4.1 million compared to the year ended December 31, 2015 as the mix of products sold continued to shift to higher value aerospace volumes, which more than offset the impacts of a temporary shut-down to upgrade and expand capacity at the facility’s horizontal heat treat (“HHT”) furnace in the first quarter of 2016 and a stronger U.S. dollar.
Review of Segment Income and Gross Profit
For the years ended December 31, 2017, 2016 and 2015, segment income and our reconciliation of segment income to gross profit are presented below:
For the years ended December 31, | ||||||||||||
2017 | 2016 | 2015 | ||||||||||
(in millions) | ||||||||||||
Segment income: | ||||||||||||
North America | $ | 88.0 | $ | 86.1 | $ | 107.9 | ||||||
Europe | 127.4 | 149.4 | 131.8 | |||||||||
Asia Pacific | 15.0 | 10.8 | — | |||||||||
Total segment income | 230.4 | 246.3 | 239.7 | |||||||||
Items excluded from segment income and included in gross profit: | ||||||||||||
Depreciation | (105.4 | ) | (93.2 | ) | (102.2 | ) | ||||||
Start-up costs | (33.0 | ) | — | (2.1 | ) | |||||||
Other | 0.9 | — | (4.4 | ) | ||||||||
Items included in segment income and excluded from gross profit: | ||||||||||||
Segment selling, general and administrative expenses | 113.6 | 108.8 | 114.6 | |||||||||
Realized losses on derivative financial instruments | 47.8 | 31.2 | (23.3 | ) | ||||||||
Other expense (income), net | 5.1 | (5.2 | ) | (7.4 | ) | |||||||
Gross profit | $ | 259.4 | $ | 287.9 | $ | 214.9 | ||||||
North America Segment Income
North America segment income for the year ended December 31, 2017 increased $1.9 million compared to the year ended December 31, 2016. This increase was primarily due to the following:
▪ | favorable scrap spreads resulting from rising aluminum prices, improved scrap availability and strategic metal purchasing increased segment income approximately $24.0 million; and |
▪ | improved rolling margins increased segment income approximately $9.0 million. |
These increases were partially offset by the following:
▪ | an unfavorable change in metal price lag compared to the prior year decreased segment income approximately $13.2 million; |
▪ | lower volumes, primarily due to the extended planned outage at the Lewisport hot mill, partially offset by favorable cost absorption, decreased segment income approximately $9.0 million; and |
▪ | increased labor, natural gas and repair and maintenance costs, partially offset by favorable productivity gains, decreased segment income approximately $9.0 million. |
North America segment income for the year ended December 31, 2016 decreased $21.8 million compared to the year ended December 31, 2015. This decrease was primarily due to the following:
▪ | unfavorable scrap spreads resulting from declining aluminum prices and the related tightening of supply decreased segment income approximately $19.0 million; |
▪ | lower volumes and an unfavorable mix of products sold, partially offset by favorable cost absorption resulting from increased fourth quarter production, decreased segment income approximately $7.0 million; and |
▪ | operational issues and inflation more than offset project specific productivity gains and lower natural gas prices, decreasing segment income approximately $7.0 million. |
These decreases were partially offset by the following:
▪ | favorable metal price lag compared to the prior year increased segment income approximately $5.8 million; and |
48
▪ | improved rolling margins increased segment income approximately $5.0 million. |
Europe Segment Income
Europe segment income for the year ended December 31, 2017 decreased $22.0 million compared to the year ended December 31, 2016. This decrease was primarily due to the following:
▪ | lower volumes and unfavorable cost absorption, resulting from successful working capital optimization initiatives, decreased segment income approximately $7.0 million; |
▪ | higher costs for hardeners and an increase in externally purchased slab decreased segment income approximately $6.0 million; |
▪ | the weaker U.S. dollar negatively impacted the revaluation of U.S. dollar working capital balances and margins on U.S. dollar sales, while positively impacting the translation of euro-denominated results. Currency changes decreased segment income approximately $6.0 million; |
▪ | increased labor and natural gas costs as well as additional investments in research and development activities, partially offset by favorable productivity, decreased segment income approximately $2.0 million; and |
▪ | lower rolling margins decreased segment income approximately $1.0 million. |
These decreases were partially offset by favorable metal price lag compared to the prior year that increased segment income approximately $1.6 million.
Europe segment income for the year ended December 31, 2016 increased $17.6 million compared to the year ended December 31, 2015. This increase was primarily due to the following:
▪ | favorable metal price lag compared to the prior year increased segment income approximately $15.5 million; |
▪ | improved rolling margins increased segment income approximately $6.0 million; and |
▪ | productivity savings and lower natural gas costs were partially offset by inflation in employee and other conversion costs, increasing segment income approximately $3.0 million. |
These increases were partially offset by the following:
▪ | an unfavorable mix of products sold, resulting from a decrease in aerospace and heat exchanger volumes, partially offset by favorable cost absorption resulting from higher fourth quarter production, decreased segment income approximately $5.0 million; and |
▪ | a more stable U.S. dollar in 2016 resulted in smaller gains from the revaluation of U.S. dollar working capital balances and reduced segment income approximately $4.0 million. |
Asia Pacific Segment Income
Asia Pacific segment income for the year ended December 31, 2017 increased $4.2 million compared to the year ended December 31, 2016. This increase was primarily due to increased volumes, the ongoing improvement in the mix of products sold toward higher aerospace volumes and productivity improvements. In addition, favorable metal price lag compared to the prior year increased segment income approximately $2.0 million. These increases were partially offset by lower rolling margins.
Asia Pacific segment income for the year ended December 31, 2016 increased $10.8 million compared to the year ended December 31, 2015. This increase was primarily due to a favorable change in the mix of products sold, including increased aerospace volume, in 2016, partially offset by the temporary shut-down of the HHT furnace.
Liquidity and Capital Resources
Summary
We ended 2017 with $102.4 million of cash and cash equivalents, compared with $55.6 million at the end of 2016. Liquidity at December 31, 2017 was $231.3 million, which consisted of $123.4 million of availability under the ABL Facility, $102.4 million of cash and $5.6 million of cash restricted for payments of the China Loan Facility. Liquidity does not include $80.0 million of benefits from customer capacity reservation fees expected to be fully realized early in the second quarter of 2018, $40.0 million of which have been realized in the first quarter of 2018. All milestones for the capacity reservation fees have been met. Both our borrowing base and ABL Facility utilization may fluctuate on a monthly basis due, in part, to changes in seasonal working capital and aluminum prices. In addition, our ability to borrow under the ABL Facility may be restricted by the indentures governing the Senior Notes (as defined below).
49
Based on our current and anticipated levels of operations and the condition in the industries we serve, we believe that our cash on hand, cash flows from operations and availability under the ABL Facility, will enable us to meet our working capital, capital expenditures, debt service and other funding requirements for the foreseeable future. However, our ability to fund our working capital needs, debt payments and other obligations, and to comply with the covenants under our indebtedness, including borrowing base limitations under the ABL Facility and debt incurrence restrictions in our debt agreements, depends on our future operating performance and cash flows and many factors outside of our control, including the costs of raw materials, our ability to access the capital and credit markets, the state of the overall industry and financial and economic conditions and other factors, including those described under Item 1A. – “Risk Factors.” Any future investments, acquisitions, joint ventures or other similar transactions will likely require additional capital and there can be no assurance that any such capital will be available to us on acceptable terms, if at all.
We will need to refinance all or a portion of our indebtedness on or before maturity, which principally occurs in 2020 and 2021. We cannot assure you that we will be able to refinance any of our indebtedness on attractive terms on or before maturity or on commercially reasonable terms or at all.
At December 31, 2017, approximately $62.7 million of our cash and cash equivalents were held by our non-U.S. subsidiaries.
On February 14, 2017, Aleris International issued an additional $250.0 million aggregate principal amount of its 9½% Senior Secured Notes. The additional notes were issued under the 9½% Senior Secured Notes indenture (as defined below). The proceeds from the issuance of the additional notes were $263.8 million, net of underwriter fees, and we used these proceeds for general corporate purposes, including working capital and capital expenditures.
The following discussion provides a summary description of the significant components of our sources of liquidity and long-term debt.
Cash Flows
The following table summarizes our net cash (used) provided by operating, investing and financing activities for the years ended December 31, 2017, 2016 and 2015. The following presentation and discussion of cash flows reflects the combined cash flows from our continuing operations and discontinued operations, as permitted by GAAP. For a summary of depreciation, capital expenditures and significant operating noncash items of discontinued operations for the years ended December 31, 2016 and 2015, see Note 17, “Discontinued Operations,” to our audited consolidated financial statements included elsewhere in this annual report on Form 10-K.
For the years ended December 31, | ||||||||||||
2017 | 2016 | 2015 | ||||||||||
(in millions) | ||||||||||||
Net cash (used) provided by: | ||||||||||||
Operating activities | $ | (31.4 | ) | $ | 12.0 | $ | 119.5 | |||||
Investing activities | (210.7 | ) | (354.6 | ) | 273.7 | |||||||
Financing activities | 290.5 | 338.1 | (359.9 | ) | ||||||||
Cash Flows From Operating Activities
Operating activities used $31.4 million of cash for the year ended December 31, 2017, which was the result of $23.1 million of cash used to fund operating losses and a $8.3 million increase in net operating assets. The significant components of the change in net operating assets included increases of $5.7 million, $58.4 million, $33.7 million and $18.2 million in accounts receivable, inventory, accounts payable and accrued liabilities, respectively. The average days sales outstanding (“DSO”) for the year ended December 31, 2017 remained consistent with the average DSO for the year ended December 31, 2016. The increase in inventory was primarily due to an increase in aluminum prices that more than offset the favorable impacts of working capital optimization efforts. Our average days inventory outstanding (“DIO”) for the year ended December 31, 2017 increased from the average DIO for the year ended December 31, 2016 due to rising aluminum prices as well as lower shipment volumes and the strategic build of inventory in North America in preparation for the planned production outage at the Lewisport hot mill during the third quarter of 2017. The increase in accounts payable was also due in part to the increase in aluminum prices. Our average days payable outstanding (“DPO”) for the year ended December 31, 2017 remained consistent with the average DPO for the year ended December 31, 2016. The increase in accrued liabilities was primarily due to increased accrued interest resulting from the additional 9½% Senior Secured Notes issued in the first quarter of 2017.
Operating activities provided $12.0 million of cash for the year ended December 31, 2016, which was the result of $65.3 million of cash from earnings partially offset by a $53.3 million increase in net operating assets. The significant components of the change in net operating assets included increases of $9.4 million, $70.2 million and $41.7 million in accounts receivable, inventory and accounts payable, respectively, and a decrease of $14.0 million in accrued liabilities. Excluding the impact of our
50
discontinued operations, the average DSO for the year ended December 31, 2016 decreased from the average DSO for the year ended December 31, 2015. The increase in inventory was due in part to an increase in aluminum prices. In addition, inventory increased in the North America segment due to preparation for planned production outages in 2017 associated with the North America ABS Project, quantities to be used for automotive commissioning and qualification, and higher scrap purchases in anticipation of first quarter building and construction demand. Excluding the impact of our discontinued operations, our average DIO for the year ended December 31, 2016 was consistent with the average DIO for the year ended December 31, 2015. The increase in accounts payable was also due in part to the increase in aluminum prices, as well as an increase in average DPO, when excluding discontinued operations, for the year ended December 31, 2016 as compared to the year ended December 31, 2015. The decrease in accrued liabilities was due primarily to a decrease in accrued income taxes.
Operating activities provided $119.5 million of cash for the year ended December 31, 2015, which was the result of $46.7 million of cash from earnings and a $72.8 million decrease in net operating assets. The significant components of the change in net operating assets included increases of $31.3 million and $18.4 million in accounts receivable and other long-term liabilities, respectively, and decreases of $128.0 million, $18.6 million and $9.1 million in inventories, accounts payable and accrued liabilities, respectively. The increase in accounts receivable was primarily due to the increase in the accounts receivable balance of the recycling and specification alloys businesses that were sold. As a result of this increase, we received a cash payment of $60.3 million in connection with the adjustment to the sale price. This payment has been reported in investing activities. The change in inventories was due primarily to the decreased aluminum prices in inventory as compared to the end of 2014 as well as lower inventory levels in North America. In 2015, the average days of working capital from continuing operations decreased by approximately two days versus the prior year due to declining aluminum prices as well as improved working capital management in North America and increased sales from Asia Pacific. The increase in other long-term liabilities was due to the receipt of pre-payments for future production. The decrease in accrued liabilities is driven by lower toll liabilities and a decrease in accrued interest resulting from a reduction in long-term debt.
Cash Flows from Investing Activities
Cash flows used by investing activities were $210.7 million for the year ended December 31, 2017 and included $207.7 million of capital expenditures, primarily resulting from the North America ABS Project and related non-ABS equipment upgrades at the Lewisport facility.
Cash flows used by investing activities were $354.6 million for the year ended December 31, 2016 and included $358.1 million of capital expenditures, primarily resulting from the North America ABS Project and related non-ABS equipment upgrades at the Lewisport facility.
Cash flows provided by investing activities were $273.7 million for the year ended December 31, 2015 and included $587.4 million of cash proceeds, net of cash transferred, from the sales of our former recycling and specification alloys and extrusions businesses. These cash proceeds were partially offset by $313.6 million of capital expenditures, primarily resulting from the North America ABS Project and related non-ABS equipment upgrades at the Lewisport facility.
Cash Flows From Financing Activities
Cash flows provided by financing activities were $290.5 million for the year ended December 31, 2017, and included $263.8 million of net proceeds from the issuance of an additional $250.0 million aggregate principal amount of 9½% Senior Secured Notes in February 2017 and $61.7 million of net borrowings under the ABL Facility. These sources of cash were partially offset by $26.3 million of net repayments under the China Loan Facility and $2.8 million of debt issuance costs, primarily related to the issuance of the additional 9½% Senior Secured Notes.
Cash flows provided by financing activities were $338.1 million for the year ended December 31, 2016, and included $540.4 million of net proceeds from the issuance of $550.0 million aggregate principal amount of 9½% Senior Secured Notes in April 2016 and $255.4 million of net borrowings under the ABL Facility. These sources of cash were partially offset by the completion of the tender offer and redemption for the former 7 5/8% Senior Notes due 2018, which totaled $443.8 million, including the payment of accrued interest, applicable premiums and related fees and expenses, $6.4 million of net repayments under the China Loan Facility and $4.0 million of debt issuance costs related to the issuance of the 9½% Senior Secured Notes.
Cash flows used by financing activities were $359.9 million for the year ended December 31, 2015, and included $224.0 million of net repayments on the former ABL facility, $125.0 million of the former 7 5/8% Senior Notes due 2018 and 7 7/8% Senior Notes (as defined below) purchased in the third quarter of 2015 pursuant to an asset sale offer, $4.6 million of debt issuance costs for the ABL Facility and $2.8 million of net payments on the China Loan Facility.
51
Description of Indebtedness
ABL Facility
On June 15, 2015, Aleris International entered into a credit agreement, as amended and supplemented from time to time, providing for a $600.0 million asset-based revolving credit facility (the “ABL Facility”) which permits multi-currency borrowings up to $600.0 million by Aleris International and its U.S. subsidiaries and up to a combined $300.0 million by Aleris Switzerland GmbH, a wholly owned Swiss subsidiary, Aleris Aluminum Duffel BVBA, a wholly owned Belgian subsidiary, Aleris Rolled Products Germany GmbH, a wholly owned German subsidiary and, upon its accession to the credit agreement, Aleris Casthouse Germany GmbH, a wholly owned German subsidiary (but limited to $600.0 million in total). The availability of funds to the borrowers located in each jurisdiction is subject to a borrowing base for that jurisdiction and the jurisdictions in which certain subsidiaries of such borrowers are located. Both our borrowing base and ABL Facility utilization may fluctuate on a monthly basis due to, in part, changes in seasonal working capital and aluminum prices. The ABL Facility contains, in the aggregate, a $45.0 million sublimit for swingline loans and also provides for the issuance of up to $125.0 million of letters of credit. The credit agreement provides that commitments under the ABL Facility may be increased at any time by an additional $300.0 million, subject to certain conditions.
We estimate that Aleris International had $123.4 million available for borrowing under the ABL Facility as of December 31, 2017. We had outstanding borrowings of $319.3 million under the ABL Facility as of December 31, 2017.
Borrowings under the ABL Facility bear interest at rates equal to the following:
▪ | in the case of borrowings in U.S. dollars, (a) a LIBOR determined by reference to the offered rate for deposits in dollars for the interest period relevant to such borrowing (the “Eurodollar Rate”), plus an applicable margin ranging from 1.50% to 2.00% based on availability under the ABL Facility or (b) a base rate determined by reference to the higher of (1) JPMorgan Chase Bank, N.A.’s prime lending rate and (2) the one month Eurodollar Rate, plus an applicable margin ranging from 0.50% to 1.00% based on excess availability under the ABL Facility; |
▪ | in the case of borrowings in euros, a EURIBOR determined by the administrative agent plus an applicable margin ranging from 1.50% to 2.00% based on excess availability under the ABL Facility; and |
▪ | in the case of borrowings in Sterling, a LIBOR determined by reference to the offered rate for deposits in Sterling for the interest period relevant to such borrowing, plus an applicable margin ranging from 1.50% to 2.00% based on excess availability under the ABL Facility. |
In addition to paying interest on any outstanding principal under the ABL Facility, Aleris International is required to pay a commitment fee in respect of unutilized commitments ranging from 0.250% to 0.375% based on average utilization for the applicable period. Aleris International must also pay customary letter of credit fees and agency fees.
The ABL Facility is subject to mandatory prepayment with (i) 100% of the net cash proceeds of certain asset sales and casualty proceeds relating to the collateral for the ABL Facility under certain circumstances, and (ii) 100% of the net cash proceeds from issuance of debt, other than debt permitted under the ABL Facility.
In addition, if at any time outstanding loans, unreimbursed letter of credit drawings and undrawn letters of credit under the ABL Facility exceed the applicable borrowing base in effect at such time, Aleris International is required to repay outstanding loans or cash collateralize letters of credit in an aggregate amount equal to such excess, with no reduction of the commitment amount.
There is no scheduled amortization under the ABL Facility. The principal amount outstanding will be due and payable in full on June 15, 2020. However, an early maturity provision would be triggered 60 days prior to the stated maturity of Aleris International’s 7 7/8% Senior Notes unless less than $10.0 million of the 7 7/8% Senior Notes remain outstanding and more than $100.0 million is available under the ABL Facility.
Aleris International may voluntarily reduce the unutilized portion of the commitment amount and repay outstanding loans at any time upon three business days’ prior written notice without premium or penalty other than customary “breakage” costs with respect to Eurodollar Rate loans, Sterling LIBOR loans and EURIBOR loans.
The credit agreement governing the ABL Facility contains a number of covenants that, subject to certain exceptions, impose restrictions on Aleris International and certain of its subsidiaries, including without limitation restrictions on its ability to, among other things, incur additional debt, create liens, merge, consolidate or sell assets, make investments, loans and acquisitions, pay dividends and make certain payments, or enter into affiliate transactions.
Although the credit agreement governing the ABL Facility generally does not require us to comply with any financial ratio maintenance covenants, if combined availability is less than the greater of (a) 10% of the lesser of the combined borrowing base and the combined commitments and (b) $40.0 million, a minimum fixed charge coverage ratio (as defined in
52
the credit agreement) of at least 1.0 to 1.0 will apply. The credit agreement also contains certain customary affirmative covenants and events of default. Aleris International was in compliance with all of the covenants set forth in the credit agreement as of December 31, 2017.
The ABL Facility is secured, subject to certain exceptions, by a first-priority security interest in substantially all of Aleris International’s current assets and related intangible assets located in the U.S. and substantially all of the current assets and related intangible assets of substantially all of its wholly owned U.S. subsidiaries under a pledge and security agreement, in each case, excluding Notes Collateral (as defined below). The obligations of the Swiss borrower, the Belgian borrower and the German borrowers are secured by their respective current assets and related intangible assets, if any.
9½% Senior Secured Notes due 2021
On April 4, 2016, Aleris International issued $550.0 million aggregate principal amount of its 9½% Senior Secured Notes due 2021 (together with the $250.0 million of additional notes described below, the “9½% Senior Secured Notes”) and related guarantees in a private offering under Rule 144A and Regulation S of the Securities Act of 1933, as amended. The 9½% Senior Secured Notes were issued under an indenture (as amended and supplemented from time to time, the “9½% Senior Secured Notes Indenture”), dated as of April 4, 2016, among Aleris International, the guarantors named therein and U.S. Bank National Association, as trustee and collateral agent. The 9½% Senior Secured Notes are unconditionally guaranteed on a senior secured basis by us and each of our restricted subsidiaries that are domestic subsidiaries and that guarantees Aleris International’s obligations under the ABL Facility.
On February 14, 2017, Aleris International issued an additional $250.0 million aggregate principal amount of the 9½% Senior Secured Notes, pursuant to the 9½% Senior Secured Notes Indenture. These additional notes, together with the initial notes, are treated as a single series of debt securities for all purposes under the 9½% Senior Secured Notes Indenture, including, without limitation, waivers, amendments, redemptions and offers to purchase.
As of December 31, 2017, Aleris International had $800.0 million aggregate principal amount of 9½% Senior Secured Notes outstanding.
Interest on the 9½% Senior Secured Notes is payable semi-annually in arrears on April 1 and October 1 of each year. The 9½% Senior Secured Notes mature on April 1, 2021. Aleris International used the net proceeds from the original issuance of the 9½% Senior Secured Notes to complete a tender offer and redemption for the former 75/8% Senior Notes due 2018. In addition, a portion of the net proceeds from the original issuance and from the additional $250.0 million issuance were used for general corporate purposes, including for working capital and capital expenditures.
The 9½% Senior Secured Notes are secured by a first-priority lien on substantially all of Aleris International’s and the guarantors’ owned and material U.S. real property, equipment and intellectual property and stock of Aleris International and the guarantors (other than Aleris Corporation) and other subsidiaries (including 100% of the outstanding non-voting stock (if any) and 65% of the outstanding voting stock of certain “first-tier” foreign subsidiaries and certain “first-tier” foreign subsidiary holding companies) (the “Notes Collateral”), but subject to permitted liens and excluding (i) inventory, accounts receivable, deposit accounts and related assets, which assets secure the ABL Facility on a first-priority basis, (ii) the assets associated with our Lewisport, Kentucky facility and (iii) certain other excluded assets.
From and after April 1, 2018, Aleris International may redeem the 9½% Senior Secured Notes, in whole or in part, upon not less than 30 nor more than 60 days’ prior notice, at a redemption price equal to 104.8% of the principal amount, declining ratably to 100.0% of the principal amount on April 1, 2020, plus accrued and unpaid interest, if any, to the applicable redemption date. Prior to April 1, 2018, Aleris International may redeem up to 40% of the aggregate principal amount with funds in an amount equal to all or a portion of the net cash proceeds from certain equity offerings at a redemption price of 109.5%, plus accrued and unpaid interest, if any, to the redemption date. Aleris International may make such redemption so long as, immediately after the occurrence of any such redemption, at least 60% of the aggregate principal amount of the 9½% Senior Secured Notes remains outstanding and such redemption occurs within 180 days of the closing of the applicable equity offering. Additionally, at any time prior to April 1, 2018, Aleris International may redeem some or all of the 9½% Senior Secured Notes at a redemption price equal to 100.0% of the principal amount of the 9½% Senior Secured Notes, plus the applicable premium as provided in the 9½% Senior Secured Notes Indenture and accrued and unpaid interest, if any, to the redemption date.
If Aleris International experiences a “change of control” as specified in the 9½% Senior Secured Notes Indenture, Aleris International must offer to purchase all of the 9½% Senior Secured Notes at a price equal to 101.0% of the principal amount of the 9½% Senior Secured Notes, plus accrued and unpaid interest, if any, to the date of purchase. In addition, if Aleris International or its restricted subsidiaries engage in certain asset sales or experience certain events of loss with respect to the Notes Collateral and do not invest the cash proceeds from such sales or events of loss or permanently reduce certain debt within a specified period of time, subject to certain exceptions, Aleris International will be required to use a portion of the proceeds of such asset sales or events of loss, as the case may be, to make an offer to purchase a principal amount of the 9½% Senior
53
Secured Notes at a price of 100.0% of the principal amount of the 9½% Senior Secured Notes, plus accrued and unpaid interest, if any, to the date of purchase.
Subject to certain limitations and exceptions, the 9½% Senior Secured Notes Indenture contains covenants limiting the ability of Aleris International and its restricted subsidiaries to, among other things: incur additional debt; pay dividends or distributions on Aleris International’s capital stock or redeem, repurchase or retire Aleris International’s capital stock or subordinated debt; issue preferred stock of restricted subsidiaries; make certain investments; create liens on Aleris International’s or its subsidiary guarantors’ assets to secure debt; enter into sale and leaseback transactions; create restrictions on the payment of dividends or other amounts to Aleris International from Aleris International’s restricted subsidiaries that are not guarantors of the 9½% Senior Secured Notes; enter into transactions with affiliates; merge or consolidate with another company; and sell assets, including capital stock of Aleris International’s subsidiaries. The 9½% Senior Secured Notes Indenture also contains customary events of default. Aleris International was in compliance with all covenants set forth in the 9½% Senior Secured Notes Indenture as of December 31, 2017.
7 7/8% Senior Notes due 2020
On October 23, 2012, Aleris International issued $500.0 million of its 7 7/8% Senior Notes and related guarantees under an indenture (as amended and supplemented from time to time, the “7 7/8% Senior Notes Indenture”), dated as of October 23, 2012, among Aleris International, the guarantors named therein and U.S. Bank National Association, as trustee, and on January 31, 2013, Aleris International exchanged the $500.0 million aggregate original principal amount of its 7 7/8% Senior Notes for $500.0 million of its new 7 7/8% Senior Notes that have been registered under the Securities Act of 1933, as amended (the “7 7/8% Senior Notes” and, together with the 9½% Senior Secured Notes, the “Senior Notes”). The 7 7/8% Senior Notes are unconditionally guaranteed on a senior unsecured basis by us and each of our restricted subsidiaries that are domestic subsidiaries and that guarantees Aleris International’s obligations under the ABL Facility. On September 8, 2015, Aleris International purchased $59.9 million aggregate principal amount of the 7 7/8% Senior Notes pursuant to as asset sale offer. As of December 31, 2017, Aleris International had $440.1 million aggregate principal amount outstanding on the 7 7/8% Senior Notes.
Interest on the 7 7/8% Senior Notes is payable in cash semi-annually in arrears on May 1st and November 1st of each year. The 7 7/8% Senior Notes mature on November 1, 2020. Aleris International used a portion of the net proceeds from the sale of the 7 7/8% Senior Notes to pay us cash dividends of approximately $313.0 million during the year ended December 31, 2013, which we then paid as dividends pro rata to our stockholders.
Aleris International may redeem the 7 7/8% Senior Notes, in whole or in part, upon not less than 30 nor more than 60 days’ prior notice, at a redemption price equal to 102.0% of the principal amount, declining annually to 100.0% of the principal amount on November 1, 2018, plus accrued and unpaid interest, if any, to the applicable redemption date.
If Aleris International experiences a “change of control” as specified in the 7 7/8% Senior Notes Indenture, Aleris International must offer to purchase all of the 7 7/8% Senior Notes at a price equal to 101.0% of the principal amount of the 7 7/8% Senior Notes, plus accrued and unpaid interest, if any, to the date of purchase. In addition, if Aleris International or its restricted subsidiaries engage in certain asset sales and do not invest the cash proceeds from such sales or permanently reduce certain debt within a specified period of time, subject to certain exceptions, Aleris International will be required to use a portion of the proceeds of such asset sales to make an offer to purchase a principal amount of the 7 7/8% Senior Notes at a price of 100.0% of the principal amount of the 7 7/8% Senior Notes, plus accrued and unpaid interest, if any, to the date of purchase.
Subject to certain limitations and exceptions, the 7 7/8% Senior Notes Indenture contains covenants limiting the ability of Aleris International and its restricted subsidiaries to, among other things: incur additional debt; pay dividends or distributions on Aleris International’s capital stock or redeem, repurchase or retire Aleris International’s capital stock or subordinated debt; issue preferred stock of restricted subsidiaries; make certain investments; create liens on Aleris International’s or its subsidiary guarantors’ assets to secure debt; enter into sale and leaseback transactions; create restrictions on the payment of dividends or other amounts to Aleris International from Aleris International’s restricted subsidiaries that are not guarantors of the 7 7/8% Senior Notes; enter into transactions with affiliates; merge or consolidate with another company; and sell assets, including capital stock of Aleris International’s subsidiaries. The 7 7/8% Senior Notes Indenture also contains customary events of default. Aleris International was in compliance with all covenants set forth in the 7 7/8% Senior Notes Indenture as of December 31, 2017.
Exchangeable Notes
Aleris International issued $45.0 million aggregate principal amount of 6% senior subordinated exchangeable notes (the “Exchangeable Notes”) in June 2010. The Exchangeable Notes are scheduled to mature on June 1, 2020. The Exchangeable Notes have exchange rights at the holder’s option and are exchangeable at any time for our common stock at a rate equivalent to 59.63 shares of our common stock per $1,000 principal amount of the Exchangeable Notes (after adjustment for the
54
payments of dividends in 2011 and 2013), subject to further adjustment. The Exchangeable Notes may currently be redeemed at Aleris International’s option at specified redemption prices.
The Exchangeable Notes are the unsecured, senior subordinated obligations of Aleris International and rank (i) junior to all of its existing and future senior indebtedness, including the ABL Facility and the Senior Notes; (ii) equally to all of its existing and future senior subordinated indebtedness; and (iii) senior to all of its existing and future subordinated indebtedness.
China Loan Facility
Our wholly owned subsidiary, Aleris Aluminum (Zhenjiang) Co., Ltd (“Aleris Zhenjiang”), maintains a loan agreement comprised of non-recourse multi-currency secured term loan facilities and a revolving facility (collectively, as amended and supplemented from time to time, the “China Loan Facility”). The China Loan Facility consists of a $30.6 million U.S. dollar term loan facility, an RMB 873.8 million (or equivalent to approximately $134.2 million as of December 31, 2017) term loan facility (collectively referred to as the “Zhenjiang Term Loans”) and an RMB 410.0 million (or equivalent to approximately $63.0 million as of December 31, 2017) revolving facility (referred to as the “Zhenjiang Revolver”). The Zhenjiang Revolver has certain restrictions that have limited our ability to borrow funds on the Zhenjiang Revolver and will continue to limit our ability to borrow funds in the future. Although the final maturity date for all borrowings under the Zhenjiang Revolver is May 18, 2021, all amounts outstanding under the Zhenjiang Revolver were repaid in 2017. The interest rate on the U.S. dollar term facility is six month U.S. dollar LIBOR plus 5.0% and the interest rate on the RMB term facility and the Zhenjiang Revolver is 110% of the base rate applicable to any loan denominated in RMB of the same tenor, as announced by the People’s Bank of China. As of December 31, 2017, $170.3 million was outstanding on the Zhenjiang Term Loans. Aleris Zhenjiang and the lenders under the China Facility entered into agreements in December 2016 to, among other things, extend the maturity date, amend the repayment terms under the Zhenjiang Term Loans and secure obligations under the Zhenjiang Term Loans. The lenders agreed to extend the final maturity date for all borrowings under the Zhenjiang Term Loans from May 18, 2021 to May 16, 2024. The repayment of borrowings under the Zhenjiang Term Loans is due semi-annually. The initial repayment period began in 2016. According to the amended repayment schedule, the semi-annual repayment in 2018 will be RMB 18.0 million (or equivalent to approximately $2.8 million as of December 31, 2017) and will increase to RMB 247.3 million (or equivalent to approximately $38.0 million as of December 31, 2017) by 2024.
The China Loan Facility contains certain customary covenants and events of default. The China Loan Facility requires Aleris Zhenjiang to, among other things, maintain a certain ratio of outstanding term loans to invested equity capital. In addition, Aleris Zhenjiang is restricted from, subject to certain exceptions, repaying loans or distributing dividends to stockholders, disposing of assets, providing third party guarantees, or entering into additional financing to expand the capacity of the project, among other things.
Aleris Zhenjiang was in compliance with all of the covenants set forth in the China Loan Facility as of December 31, 2017. Aleris Zhenjiang has had delays in its ability to make timely draws of amounts committed under the China Loan Facility in the past and we cannot be certain that Aleris Zhenjiang will be able to draw any amounts committed under the Zhenjiang Revolver in the future or as to the timing or cost of any such draws.
Non-GAAP Financial Measures
We report our financial results in accordance with GAAP. However, our management believes that certain non-GAAP performance measures, which we use in managing the business, may provide investors with additional meaningful comparisons between current results and results in prior periods. EBITDA, Adjusted EBITDA, segment Adjusted EBITDA and commercial margin are examples of non-GAAP financial measures that we believe provide investors and other users of our financial information with useful information.
Management uses EBITDA, Adjusted EBITDA, segment Adjusted EBITDA and commercial margin as performance metrics and believes these measures provide additional information commonly used by holders of the Senior Notes and parties to the ABL Facility with respect to the ongoing performance of our underlying business activities, as well as our ability to meet our future debt service, capital expenditures and working capital needs. In addition, EBITDA with certain adjustments is a component of certain covenants under the indentures governing the Senior Notes. Adjusted EBITDA, including the impacts of metal price lag, is a component of certain financial covenants under the credit agreement governing the ABL Facility. Management also uses commercial margin as a performance metric and believes that it provides useful information regarding the performance of our segments because it measures the price at which we sell our aluminum products above the hedged cost of the metal and the effects of metal price lag, thereby reflecting the value-added components of our commercial activities independent of aluminum prices which we cannot control.
Our EBITDA calculations represent net income and loss attributable to Aleris Corporation before interest income and expense, provision for and benefit from income taxes, depreciation and amortization and income and loss from discontinued operations, net of tax. Adjusted EBITDA is defined as EBITDA excluding metal price lag, unrealized gains and losses on derivative financial instruments, restructuring charges, currency exchange gains and losses on debt, stock-based compensation
55
expense, start-up costs, loss on extinguishment of debt, impairment of amounts held in escrow related to the sale of the recycling business and certain other gains and losses. Segment Adjusted EBITDA represents Adjusted EBITDA on a per segment basis. EBITDA as defined in the indentures governing the Senior Notes also limits the amount of adjustments for cost savings, operational improvement and synergies for the purpose of determining our compliance with such covenants. Adjusted EBITDA as defined under the ABL Facility also limits the amount of adjustments for restructuring charges and requires additional adjustments be made if certain annual pension funding levels are exceeded. Commercial margin represents revenues less the hedged cost of metal and the effects of metal price lag.
EBITDA, Adjusted EBITDA, segment Adjusted EBITDA and commercial margin (collectively, the “Non-GAAP Measures”), as we use them, may not be comparable to similarly titled measures used by other companies. We calculate the Non-GAAP Measures by eliminating the impact of a number of items we do not consider indicative of our ongoing operating performance and certain other items. You are encouraged to evaluate each adjustment and the reasons we consider it appropriate for supplemental analysis. However, the Non-GAAP Measures are not financial measurements recognized under GAAP, and when analyzing our operating performance, investors should use the Non-GAAP Measures in addition to, and not as an alternative for, net income and loss attributable to Aleris Corporation, operating income and loss or any other performance measure derived in accordance with GAAP, or in addition to, and not as an alternative for, cash flow from operating activities as a measure of our liquidity. The Non-GAAP Measures have limitations as analytical tools, and they should not be considered in isolation, or as a substitute for, or superior to, our measures of financial performance prepared in accordance with GAAP. These limitations include:
▪ | They do not reflect our cash expenditures or future requirements for capital expenditures or contractual commitments; |
▪ | They do not reflect changes in, or cash requirements for, working capital needs; |
▪ | They do not reflect interest expense or cash requirements necessary to service interest expense or principal payments under the ABL Facility, the Senior Notes or the Exchangeable Notes; |
▪ | They do not reflect certain tax payments that may represent a reduction in cash available to us; |
▪ | Although depreciation and amortization are non-cash charges, the assets being depreciated and amortized may have to be replaced in the future, and EBITDA and Adjusted EBITDA, including segment Adjusted EBITDA, do not reflect cash requirements for such replacements; and |
▪ | Other companies, including companies in our industry, may calculate these measures differently and, as the number of differences in the way companies calculate these measures increases, the degree of their usefulness as a comparative measure correspondingly decreases. |
In addition, in evaluating Adjusted EBITDA, including segment Adjusted EBITDA, we may incur expenses in the future that are similar to the adjustments in the below presentation. Our presentation of Adjusted EBITDA, including segment Adjusted EBITDA, should not be construed as an inference that our future results will be unaffected by unusual or non-recurring items.
For reconciliations of EBITDA, Adjusted EBITDA and commercial margin to their most directly comparable financial measures presented in accordance with GAAP, see the tables below. For a reconciliation of segment Adjusted EBITDA to segment income and a reconciliation of commercial margin to revenues, which are the most directly comparable financial measures presented in accordance with GAAP, for the North America, Europe and Asia Pacific segments, see the reconciliations in “– Our Segments.”
56
For the years ended December 31, 2017, 2016 and 2015, our reconciliations of EBITDA and Adjusted EBITDA to net (loss) income attributable to Aleris Corporation and net cash (used) provided by operating activities are presented below:
For the years ended December 31, | ||||||||||||
2017 | 2016 | 2015 | ||||||||||
(in millions) | ||||||||||||
Adjusted EBITDA from continuing operations | $ | 200.6 | $ | 205.1 | $ | 222.8 | ||||||
Unrealized gains (losses) on derivative financial instruments of continuing operations | 3.0 | 19.0 | (30.1 | ) | ||||||||
Restructuring charges (i) | (2.9 | ) | (1.5 | ) | (10.3 | ) | ||||||
Currency exchange (losses) gains on debt | (2.5 | ) | (0.6 | ) | 1.0 | |||||||
Stock-based compensation expense | (11.3 | ) | (7.0 | ) | (4.8 | ) | ||||||
Start-up costs | (73.6 | ) | (46.0 | ) | (21.1 | ) | ||||||
(Unfavorable) favorable metal price lag (ii) | (6.3 | ) | 3.2 | (18.6 | ) | |||||||
Loss on extinguishment of debt | — | (12.6 | ) | (2.0 | ) | |||||||
Impairment of amounts held in escrow related to the sale of the recycling business | (22.8 | ) | — | — | ||||||||
Other (iii) | (18.4 | ) | (4.5 | ) | (14.1 | ) | ||||||
EBITDA from continuing operations | 65.8 | 155.1 | 122.8 | |||||||||
Interest expense, net | (124.1 | ) | (82.5 | ) | (94.1 | ) | ||||||
(Provision for) benefit from income taxes | (40.4 | ) | (40.0 | ) | 22.7 | |||||||
Depreciation and amortization from continuing operations | (115.7 | ) | (104.9 | ) | (123.8 | ) | ||||||
(Loss) income from discontinued operations, net of tax | 3.8 | (3.3 | ) | 121.1 | ||||||||
Net (loss) income attributable to Aleris Corporation | (210.6 | ) | (75.6 | ) | 48.7 | |||||||
Net income from discontinued operations attributable to noncontrolling interest | — | — | 0.1 | |||||||||
Net (loss) income | (210.6 | ) | (75.6 | ) | 48.8 | |||||||
Depreciation and amortization | 115.7 | 104.9 | 123.8 | |||||||||
Provision for deferred income taxes | 32.3 | 21.5 | 34.5 | |||||||||
Stock-based compensation expense | 11.3 | 7.0 | 4.8 | |||||||||
Unrealized (gains) losses on derivative financial instruments | (3.0 | ) | (19.0 | ) | 28.1 | |||||||
Amortization of debt issuance costs | 2.8 | 5.7 | 6.6 | |||||||||
Loss on extinguishment of debt | — | 12.6 | 2.0 | |||||||||
Net loss (gain) on sale of discontinued operations | (4.5 | ) | 3.3 | (191.7 | ) | |||||||
Impairment of amounts held in escrow related to the sale of the recycling business | 22.8 | — | — | |||||||||
Other | 10.1 | 4.9 | (10.2 | ) | ||||||||
Change in operating assets and liabilities: | ||||||||||||
Change in accounts receivable | (5.7 | ) | (9.4 | ) | (31.3 | ) | ||||||
Change in inventories | (58.4 | ) | (70.2 | ) | 128.0 | |||||||
Change in other assets | 3.9 | (1.4 | ) | 3.8 | ||||||||
Change in accounts payable | 33.7 | 41.7 | (18.6 | ) | ||||||||
Change in accrued liabilities | 18.2 | (14.0 | ) | (9.1 | ) | |||||||
Net cash (used) provided by operating activities | $ | (31.4 | ) | $ | 12.0 | $ | 119.5 | |||||
(i) | See Note 3, “Restructuring Charges,” to our audited consolidated financial statements included elsewhere in this annual report on Form 10-K. |
(ii) | Represents the financial impact of the timing difference between when aluminum prices included within our revenues are established and when aluminum purchase prices included in our cost of sales are established. This lag will, generally, increase our earnings and EBITDA in times of rising primary aluminum prices and decrease our earnings and EBITDA in times of declining primary aluminum prices; however, our use of derivative financial instruments seeks to reduce this impact. Metal price lag is net of the realized gains and losses from our derivative financial instruments. We exclude metal price lag from our determination of Adjusted EBITDA because it is not an indicator of the performance of our underlying operations. |
(iii) | Includes gains and losses on the disposal of assets, costs incurred in connection with proposed capital raising transactions, certain acquisition and disposition activities and other business development costs and the write-down of inventories associated with plant closures. |
57
For the years ended December 31, 2017, 2016 and 2015, our reconciliations of revenues to commercial margin are presented below.
For the years ended December 31, | ||||||||||||
2017 | 2016 | 2015 | ||||||||||
(in millions) | ||||||||||||
Revenues | $ | 2,857.3 | $ | 2,663.9 | $ | 2,917.8 | ||||||
Hedged cost of metal | (1,664.7 | ) | (1,467.6 | ) | (1,732.1 | ) | ||||||
Unfavorable (favorable) metal price lag | 6.3 | (3.2 | ) | 18.6 | ||||||||
Commercial margin | $ | 1,198.9 | $ | 1,193.1 | $ | 1,204.3 | ||||||
Exchange Rates
During 2017, the fluctuation of the U.S. dollar against other currencies resulted in unrealized currency translation gains that increased our equity by $82.0 million. Currency translation adjustments are the result of the process of translating an international entity’s financial statements from the entity’s functional currency to U.S. dollars. Currency translation adjustments accumulate in consolidated equity until the disposition or liquidation of the international entities.
The euro is the functional currency of substantially all of our European-based operations and the renminbi is the functional currency of our China operations. In the future, our results of operations will continue to be impacted by the exchange rate between the U.S. dollar and the euro and the U.S. dollar and renminbi. In addition, we have other operations where the functional currency is not our reporting currency, the U.S. dollar, and our results of operations are impacted by currency fluctuations between the U.S. dollar and such other currencies.
Contractual Obligations
We and our subsidiaries are obligated to make future payments under various contracts such as debt agreements, lease agreements, postretirement and pension benefit plans and unconditional purchase obligations. The following table summarizes our estimated significant contractual cash obligations and other commercial commitments at December 31, 2017.
Cash Payments Due by Period | |||||||||||||||||||
(in millions) | |||||||||||||||||||
Total | 2018 | 2019-2020 | 2021-2022 | After 2022 | |||||||||||||||
Long-term debt and capital lease obligations | $ | 1,783.9 | $ | 9.0 | $ | 834.8 | $ | 865.4 | $ | 74.7 | |||||||||
Interest on long-term debt obligations | 393.8 | 123.1 | 237.3 | 31.3 | 2.1 | ||||||||||||||
Estimated postretirement benefit payments | 26.9 | 3.2 | 6.1 | 5.7 | 11.9 | ||||||||||||||
Estimated pension benefit payments | 49.6 | 11.6 | 7.8 | 8.4 | 21.8 | ||||||||||||||
Operating lease obligations | 12.9 | 3.9 | 4.5 | 2.5 | 2.0 | ||||||||||||||
Estimated payments for asset retirement obligations | 7.9 | — | — | — | 7.9 | ||||||||||||||
Purchase obligations | 1,526.0 | 985.0 | 483.2 | 35.3 | 22.5 | ||||||||||||||
Total | $ | 3,801.0 | $ | 1,135.8 | $ | 1,573.7 | $ | 948.6 | $ | 142.9 | |||||||||
Our estimated funding for our funded pension plans and postretirement benefit plans is based on actuarial estimates using benefit assumptions for discount rates, expected long-term rates of return on assets, rates of compensation increases, and health care cost trend rates. For our funded pension plans, estimating funding beyond 2018 would depend upon the performance of the plans’ investments, among other things. As a result, estimating pension funding beyond 2018 is not practicable. Payments for unfunded pension plan benefits and postretirement benefit payments are estimated through 2026.
Operating lease obligations are payment obligations under leases classified as operating. Most of the lease obligations relate to the costs of leasing office space. In addition, some leases relate to items used in our manufacturing processes, which typically are leased for a period of one to five years.
Our estimated payments for asset retirement obligations are based on management’s estimates of the timing and extent of payments to be made to fulfill legal or contractual obligations associated with the retirement of certain long-lived assets. Amounts presented represent the future value of expected payments.
Our purchase obligations represent non-cancellable agreements (short-term and long-term) to purchase goods or services that are enforceable and legally binding on us that specify all significant terms, including fixed or minimum quantities to be purchased; fixed, minimum or variable price provisions; and the approximate timing of the transaction. Purchase obligations include the pricing of anticipated metal purchases using contractual prices or, where pricing is dependent upon the prevailing LME metal prices at the time of delivery, market prices as of December 31, 2017, as well as natural gas and electricity purchases using minimum contractual quantities and either contractual prices or prevailing rates. As a result of the variability in
58
the pricing of many of our metals purchasing obligations, actual amounts paid may vary from the amounts shown above. Purchase obligations also include amounts associated with capital expenditure projects.
The ABL Facility and China Loan Facility carry variable interest rates and variable outstanding amounts for which estimating future interest payments is not practicable.
Environmental Contingencies
Our operations are subject to federal, state, local and international laws, regulations and ordinances. These laws and regulations (1) govern activities or operations that may have adverse environmental effects, such as discharges to air and water, as well as waste handling and disposal practices and (2) impose liability for costs of cleaning up, and certain damages resulting from, spills, disposals or other releases of regulated materials. It can be anticipated that more rigorous environmental laws will be enacted that could require us to make substantial expenditures in addition to those described in this annual report on Form 10-K. See Item 1. – “Business—Environmental.”
From time to time, our operations have resulted, or may result, in certain non-compliance with applicable requirements under such environmental laws. To date, any such non-compliance with such environmental laws have not had a material adverse effect on our financial position, results of operations or cash flows. See Note 14, “Commitments and Contingencies,” to our audited consolidated financial statements included elsewhere in this annual report on Form 10-K.
Critical Accounting Policies and Estimates
The preparation of financial statements in conformity with GAAP requires our management to make estimates and judgments that affect the reported amounts of assets and liabilities and disclosure of contingent assets and liabilities at the date of the financial statements and the reported amounts of revenues and expenses during the reporting period. On an ongoing basis, we evaluate our estimates, including, among others, those related to the valuation of inventory, property and equipment and intangible assets, allowances related to doubtful accounts, income taxes, pensions and other post-retirement benefits and environmental liabilities. Our management bases its estimates on historical experience, actuarial valuations and other assumptions believed to be reasonable under the circumstances. Actual results could differ from those estimates. Our accounting policies are more fully described in Note 2, “Summary of Significant Accounting Policies,” to our audited consolidated financial statements included elsewhere in this annual report on Form 10-K. There have been no significant changes to our critical accounting policies or estimates during the years ended December 31, 2017 or 2016.
The following critical accounting policies and estimates are used to prepare our consolidated financial statements:
Revenue Recognition and Shipping and Handling Costs
Revenues are recognized when title transfers and risk of loss passes to the customer in accordance with the provisions of the Securities and Exchange Commission (“SEC”) Staff Accounting Bulletin (“SAB”) No. 104, “Revenue Recognition.” This occurs at various points in the delivery process. In North America, substantially all revenue is recognized at the point of shipment. In Europe and China, the timing of revenue recognition varies depending on individual customer arrangements. For material that is consigned, revenue is not recognized until the product is used by the customer. We occasionally enter into long-term supply contracts with customers and receive advance payments for product to be delivered in future periods. These advance payments are recorded as deferred revenue, and revenue is recognized as shipments are made and title, ownership, and risk of loss pass to the customer during the term of the applicable contract. In connection with the January 1, 2018 adoption of Accounting Standard Update No. 2014-09, “Revenue from Contracts with Customers (Topic 606)”, our revenue recognition policy will be updated to reflect the new revenue recognition model, which requires the recognition of revenue when a customer obtains control of the product and can obtain substantially all of the benefits from the product. For additional information, see Note 2, “Summary of Significant Accounting Policies,” to our audited consolidated financial statements included elsewhere in this annual report on Form 10-K.
Shipping and handling costs are included within “Cost of sales” in the Consolidated Statements of Operations included elsewhere in this annual report on Form 10-K.
Inventories
Our inventories are stated at the lower of cost or net realizable value. Cost is determined using either an average cost or specific identification method and includes an allocation of manufacturing labor and overhead costs to work-in-process and finished goods. We review our inventory values on a regular basis to ensure that their carrying values can be realized. In assessing the ultimate realization of inventories, we are required to make judgments as to future demand requirements and compare that with the current or committed inventory levels. As the ultimate realizable value of most of inventories is based upon the price of prime or scrap aluminum, future changes in those prices may lead to the determination that the cost of some
59
or all of our inventory will not be realized and we would then be required to record the appropriate adjustment to inventory values.
Derivative Financial Instruments
Derivative contracts are recorded at fair value under ASC 820, “Fair Value Measurements and Disclosures” using quoted market prices and significant other observable and unobservable inputs. Fair value is defined as the price that would be received to sell an asset or paid to transfer a liability in an orderly transaction between market participants at the measurement date. The fair value hierarchy distinguishes between (1) market participant assumptions developed based on market data obtained from independent sources (observable inputs) and (2) an entity’s own assumptions about market participant assumptions developed based on the best information available in the circumstances (unobservable inputs). The fair value hierarchy consists of three broad levels, which gives the highest priority to unadjusted quoted prices in active markets for identical assets or liabilities (Level 1) and the lowest priority to unobservable inputs (Level 3). The three levels of the fair value hierarchy are described below:
Level 1—Unadjusted quoted prices in active markets that are accessible at the measurement date for identical, unrestricted assets or liabilities.
Level 2—Inputs other than quoted prices included within Level 1 that are observable for the asset or liability, either directly or indirectly, including quoted prices for similar assets or liabilities in active markets; quoted prices for identical or similar assets or liabilities in markets that are not active; inputs other than quoted prices that are observable for the asset or liability (e.g., interest rates); and inputs that are derived principally from or corroborated by observable market data by correlation or other means.
Level 3—Inputs that are both significant to the fair value measurement and unobservable.
We endeavor to use the best available information in measuring fair value. To estimate fair value, we apply an industry standard valuation model, which is based on the market approach. Where appropriate, valuations are adjusted for various factors such as liquidity, bid/offer spreads and credit considerations. Such adjustments are generally based on available market evidence and unobservable inputs. Financial assets and liabilities are classified in their entirety based on the lowest level of input that is significant to the fair value measurement.
Impairment of Long-Lived Assets and Amortizable Intangible Assets
We review the carrying value of property, plant and equipment to be held and used as well as amortizable intangible assets when events or circumstances indicate that their carrying value may not be recoverable. Factors that we consider important that could trigger our testing of the related asset groups for an impairment include current period operating or cash flow losses combined with a history of operating or cash flow losses, a projection or forecast that demonstrates continuing losses, significant adverse changes in the business climate within a particular business or current expectations that a long-lived asset will be sold or otherwise disposed of significantly before the end of its estimated useful life. We consider these factors quarterly and may test more frequently if changes in circumstances or the occurrence of events indicates that a potential impairment exists. To test for impairment, we compare the estimated undiscounted cash flows expected to be generated from the use and disposal of the asset or asset group to its carrying value. An asset group is established by identifying the lowest level of cash flows generated by the group of assets that are largely independent of cash flows of other assets. If cash flows cannot be separately and independently identified for a single asset, we will determine whether an impairment has occurred for the group of assets for which we can identify projected cash flows. If these undiscounted cash flows are less than their respective carrying values, an impairment charge would be recognized to the extent that the carrying values exceed estimated fair values. Although third-party estimates of fair value are utilized when available, the estimation of undiscounted cash flows and fair value requires us to make assumptions regarding future operating results, as well as appropriate discount rates, where necessary. The results of our impairment testing are dependent on these estimates which require significant judgment. The occurrence of certain events, including changes in economic and competitive conditions, could impact cash flows eventually realized and our ability to accurately assess whether an asset is impaired.
Indefinite-Lived Intangible Asset
An indefinite-lived intangible asset related to our trade name is not amortized. The indefinite-lived intangible asset is tested for impairment as of October 1st of each year and may be tested more frequently if changes in circumstances or the occurrence of events indicates that a potential impairment exists. As part of the annual impairment test, the non-amortized intangible asset is reviewed to determine if the indefinite status remains appropriate.
The annual impairment test may be completed quantitatively, based on a relief from royalty valuation approach. Significant assumptions used under this approach include the royalty rate, weighted average cost of capital and the terminal growth rate. The annual impairment test may be completed using an optional qualitative assessment in lieu of the quantitative
60
test to determine whether it is more-likely-than-not that the indefinite-lived intangible asset is impaired. The qualitative assessment includes consideration of relevant events and circumstances that could affect the significant inputs used to determine the fair value of the indefinite-lived intangible asset, including our financial performance, macroeconomic conditions, the competitive environment, legal and regulatory factors, and other relevant entity specific considerations. Using the qualitative assessment, we determine whether it is more-likely-than-not that the indefinite-lived intangible asset is impaired. If it is determined that it is more-likely-than-not that the indefinite-lived intangible asset is impaired, a quantitative impairment analysis would be performed.
A quantitative impairment test is completed at least once every three years. A quantitative impairment test was completed at October 1, 2017, and no impairments relating to our indefinite-lived intangible asset was necessary.
Credit Risk
We recognize our allowance for doubtful accounts based on our historical experience of customer write-offs as well as specific provisions for customer receivable balances. In establishing the specific provisions for uncollectible accounts, we make assumptions with respect to the future collectability of amounts currently owed to us. These assumptions are based upon such factors as each customer’s ability to meet and sustain its financial commitments, its current and projected financial condition and the occurrence of changes in its general business, economic or market conditions that could affect its ability to make required payments to us in the future. In addition, we provide reserves for customer rebates, claims, allowances, returns and discounts based on, in the case of rebates, contractual relationships with customers, and, in the case of claims, allowances, returns and discounts, our historical loss experience and the lag time between the recognition of the sale and the granting of the credit to the customer. Our level of reserves for our customer accounts receivable fluctuates depending upon all of these factors. Significant changes in required reserves may occur in the future if our evaluation of a customer’s ability to pay and assumptions regarding the relevance of historical data prove incorrect.
Environmental and Asset Retirement Obligations
Environmental obligations that are not legal or contractual asset retirement obligations and that relate to existing conditions caused by past operations with no benefit to future operations are expensed while expenditures that extend the life, increase the capacity or improve the safety of an asset or that mitigate or prevent future environmental contamination are capitalized in property, plant and equipment. Our environmental engineers and consultants review and monitor environmental issues at our existing operating sites. This process includes investigation and remedial action selection and implementation, as well as negotiations with other potentially responsible parties and governmental agencies. Based on the results of this process, we provide reserves for environmental liabilities when and if environmental assessment and/or remediation costs are probable and can be reasonably estimated in accordance with ASC 410-30 “Environmental Obligations.” While our accruals are based on management’s current best estimate of the future costs of remedial action, these liabilities can change substantially due to factors such as the nature and extent of contamination, changes in the required remedial actions and technological advancements. Our existing environmental liabilities are not discounted to their present values as the amount and timing of the expenditures are not fixed or reliably determinable.
Asset retirement obligations represent obligations associated with the retirement of tangible long-lived assets. Our asset retirement obligations relate primarily to costs related to the future removal of asbestos and costs to remove underground storage tanks. The costs associated with such legal obligations are accounted for under the provisions of ASC 410-20 “Asset Retirement Obligations,” which requires that the fair value of a liability for an asset retirement obligation be recognized in the period in which it is incurred and capitalized as part of the carrying amount of the long-lived asset. These fair values are based upon the present value of the future cash flows expected to be incurred to satisfy the obligation. Determining the fair value of asset retirement obligations requires judgment, including estimates of the credit adjusted interest rate and estimates of future cash flows. Estimates of future cash flows are obtained primarily from independent engineering consulting firms. The present value of the obligations is accreted over time while the capitalized cost is depreciated over the useful life of the related asset.
Deferred Income Taxes
We record deferred income taxes to reflect the net tax effects of temporary differences between the carrying amount of assets and liabilities for financial reporting purposes and the amounts used for income tax purposes. Deferred tax assets are regularly reviewed for recoverability. A valuation allowance is provided to reduce certain deferred tax assets to amounts that, in our estimate, are more likely than not to be realized.
In determining the adequacy of recorded valuation allowances, management assesses our profitability in the applicable jurisdictions by taking into account the current and forecasted amounts of earnings or losses as well as the forecasted taxable income as a result of the reversal of future taxable temporary differences. Subjective positive evidence currently does not exist in the form of forecasted earnings and taxable income in future periods. Additionally, our recent history of losses provides objective negative evidence that management believes outweighs any subjective positive evidence in those jurisdictions.
61
Therefore, we will maintain valuation allowances against certain of our net deferred tax assets in the U.S. and other applicable jurisdictions until sufficient objective positive evidence (for example, cumulative positive earnings and future taxable income) exists to reduce or eliminate the valuation allowance.
Market Risk Management Using Financial Instruments
The procurement and processing of aluminum in our industry involves many risks. Some of these risks include changes in metal and natural gas prices. We attempt to manage these risks by the use of derivative financial instruments and long-term contracts. While these derivative financial instruments reduce, they do not eliminate these risks.
We do not account for derivative financial instruments as hedges. As a result, all of the related gains and losses on our derivative financial instruments are reflected in current period earnings.
The counterparties to our derivative financial instruments expose us to losses in the event of non-performance. All credit parties are evaluated for creditworthiness and risk assessment prior to initiating trading activities. In addition, the fair values of our derivative financial instruments include an estimate of the risk associated with non-performance by either ourselves or our counterparties.
Pension and Postretirement Benefits
Our pension and postretirement benefit costs are accrued based on annual analyses performed by our actuaries. These analyses are based on assumptions such as an assumed discount rate and an expected rate of return on plan assets. Both the discount rate and expected rate of return on plan assets require estimates and projections by management and can fluctuate from period to period. Our objective in selecting a discount rate is to select the best estimate of the rate at which the benefit obligations could be effectively settled. In making this estimate, projected cash flows are developed and matched with a yield curve based on an appropriate universe of high-quality corporate bonds. Assumptions for long-term rates of return on plan assets are based upon historical returns, future expectations for returns for each asset class and the effect of periodic target asset allocation rebalancing. The results are adjusted for the payment of reasonable expenses of the plan from plan assets. The historical long-term return on the plans’ assets exceeded the selected rates and we believe these assumptions are appropriate based upon the mix of the investments and the long-term nature of the plans’ investments.
The weighted average discount rate used to determine the U.S. pension benefit obligation was 3.53% as of December 31, 2017 compared to 4.00% as of December 31, 2016 and 4.19% as of December 31, 2015. The weighted average discount rate used to determine the non-U.S. pension benefit obligation was 2.12% as of December 31, 2017 compared to 1.91% as of December 31, 2016 and 2.59% as of December 31, 2015. The weighted average discount rate used to determine the other postretirement benefit obligation was 3.43% as of December 31, 2017 compared to 3.81% as of December 31, 2016 and 3.96% as of December 31, 2015. The weighted average discount rate used to determine the net periodic benefit cost is the rate used to determine the benefit obligation at the end of the previous year.
Through the year ended December 31, 2015, we used a single weighted-average discount rate approach to develop the interest and service cost components of the net periodic benefit costs. This method represented the constant annual rate that would be required to discount all future benefit payments related to past service from the date of expected future payment to the measurement date such that the aggregate present value equals the obligation. During the fourth quarter of 2015, we updated the method previously used for substantially all of our pension and other post-retirement benefit plans. Beginning with our 2016 fiscal year, we have used an approach that discounts the individual expected cash flows underlying interest and service costs using the applicable spot rates derived from the yield curve used to determine the benefit obligation to the relevant projected cash flows. The election and adoption of this method provides a more precise measurement of service and interest costs by improving the correlation between projected benefit cash flows and the corresponding spot yield curve rates. The change in estimate resulted in a decrease in the service and interest components of net periodic benefit cost in 2016 of approximately $1.5 million, $0.6 million and $0.4 million for the U.S. pension plans, non-U.S. pension plans and postretirement plans, respectively. We have accounted for this change in estimate on a prospective basis.
As of December 31, 2017, an increase in the discount rate of 0.5%, assuming inflation remains unchanged, would result in a decrease of $24.7 million in the pension and other postretirement obligations and a decrease of $1.3 million in the net periodic benefit cost. A decrease in the discount rate of 0.5% as of December 31, 2017, assuming inflation remains unchanged, would result in an increase of $28.0 million in the pension and other postretirement obligations and an increase of $1.8 million in the net periodic benefit cost.
The calculation of the estimate of the expected return on assets and additional discussion regarding pension and other postretirement plans is described in Note 10, “Employee Benefit Plans,” to our audited consolidated financial statements included elsewhere in this annual report on Form 10-K. The weighted average expected return on assets associated with our U.S. pension benefits was 7.75% for 2017 and 2016 and 8.00% for 2015. The weighted average expected return on assets
62
associated with our U.S. pension benefit expense to be recognized in 2018 has been decreased to 7.26%, primarily as a result of our strategy to decrease exposure to equity investments as the funding level of the plans improves. The weighted average expected return on assets associated with our European pension benefits was 2.46% for 2017, 2.78% for 2016 and 2.90% for 2015. The expected return on assets is a long-term assumption whose accuracy can only be measured over a long period based on past experience. A variation in the expected return on assets by 0.5% as of December 31, 2017 would result in a variation of approximately $0.7 million in the net periodic benefit cost.
Unrecognized actuarial gains and losses related to changes in our assumptions and actual experiences differing from them will be recognized over the expected remaining service life of the employee group. As of December 31, 2017, the accumulated amount of unrecognized losses on pension and other postretirement benefit plans was $87.3 million, of which $4.4 million of amortization is expected to be recognized in 2018.
The actuarial assumptions used to determine pension and other postretirement benefits may differ from actual results due to changing market and economic conditions, higher or lower withdrawal rates or longer or shorter life spans of participants. We do not believe differences in actual experience or changes in assumptions will materially affect our financial position or results of operations.
Stock-Based Compensation
We use a Black-Scholes option-pricing model to estimate the grant-date fair value of the stock options awarded. Under this valuation method, the estimate of fair value is affected by the assumptions included in the following table. Expected equity volatility was determined based on historical stock prices and implied and stated volatilities of our peer companies. The following table summarizes the significant assumptions used to determine the fair value of the stock options granted during the year ended December 31, 2017. There were no stock options granted during the year ended December 31, 2016:
Year ended | ||
December 31, 2017 | ||
Weighted-average expected option life in years | 5.5 | |
Risk-free interest rate | 2.1 | % |
Equity volatility factor | 50.0 | % |
Dividend yield | — | % |
Business Combinations
All business combinations are accounted for using the acquisition method as prescribed by ASC 805, “Business Combinations.” The purchase price paid is allocated to the assets acquired and liabilities assumed based on their estimated fair values. Any excess purchase price over the fair value of the net assets acquired is recorded as goodwill.
Discontinued Operations
In accordance with ASC 205-20, “Discontinued Operations,” a component of an entity that is disposed of or classified as held for sale is reported as a discontinued operation if the transaction represents a strategic shift that will have a major effect on an entity’s operations and financial results. The results of discontinued operations are aggregated and presented separately in the Consolidated Statements of Operations. Assets and liabilities of the discontinued operations are aggregated and reported separately as assets and liabilities of discontinued operations in the Consolidated Balance Sheet, including the comparative prior year period.
Amounts presented in discontinued operations have been derived from our consolidated financial statements and accounting records using the historical basis of assets and liabilities to be disposed and historical results of operations related to our former recycling and specification alloys businesses and extrusions business. The discontinued operations exclude general corporate allocations of certain functions historically provided by our corporate offices, such as accounting, treasury, tax, human resources, facility maintenance, and other services. Interest costs have been excluded from discontinued operations except for the interest expense on the debt and capital leases that have been assumed by the buyers. See Note 17, “Discontinued Operations” to our audited consolidated financial statements included elsewhere in this annual report on Form 10-K for more information.
Off-Balance Sheet Transactions
We had no off-balance sheet arrangements at December 31, 2017.
Recently Issued Accounting Standards Updates
63
For a summary of recently issued accounting standards, see Note 2, “Summary of Significant Accounting Policies,” to our audited consolidated financial statements included elsewhere in this annual report on Form 10-K.
ITEM 7A. QUANTITATIVE AND QUALITATIVE DISCLOSURES ABOUT MARKET RISK.
In the ordinary course of our business, we are exposed to earnings and cash flow volatility resulting from changes in the prices of aluminum and, to a lesser extent, hardeners, such as zinc and copper, and natural gas and other fuels, as well as changes in currency and interest rates. For aluminum hedges, we use derivative instruments, such as forwards, futures, options, collars and swaps to manage the effect, both favorable and unfavorable, of such changes. For electricity and some natural gas price exposures, fixed price commitments are used.
Derivative contracts are used primarily to reduce uncertainty and volatility and cover underlying exposures and are held for purposes other than trading. Our commodity and derivative activities are subject to the management, direction and control of our Risk Management Committee, which is composed of our chief financial officer and other officers and employees that the chief executive officer designates. The Risk Management Committee reports to the Audit Committee of our Board of Directors, which has supervisory authority over all of its activities.
We are exposed to losses in the event of non-performance by the counterparties to the derivative contracts discussed below. Although non-performance by counterparties is possible, we do not currently anticipate any nonperformance by any of these parties. Counterparties are evaluated for creditworthiness and risk assessment prior to our initiating contract activities. The counterparties’ creditworthiness is then monitored on an ongoing basis, and credit levels are reviewed to ensure that there is not an inappropriate concentration of credit outstanding to any particular counterparty.
Metal Hedging
Aluminum ingots, copper and zinc are internationally produced, priced and traded commodities, with the LME being the primary exchange. As part of our efforts to preserve margins, we enter into forward, futures and options contracts. For accounting purposes, we do not consider our metal derivative instruments as hedges and, as a result, changes in the fair value of these derivatives are recorded immediately in our consolidated operating results.
The selling prices of the majority of the orders for our products are established at the time of order entry or, for certain customers, under long-term contracts. As the related raw materials used to produce these orders can be purchased several months or years after the selling prices are fixed, margins are subject to the risk of changes in the purchase price of the raw materials used for these fixed price sales. In order to manage this transactional exposure, future, swaps or forward purchase contracts are purchased at the time the selling prices are fixed. As metal is purchased to fill these fixed price sales orders, futures, swaps or forwards contracts are then sold. We also maintain a significant amount of inventory on hand to meet anticipated and unpriced future sales. In order to preserve the value of this inventory, future, swaps or forward contracts are sold at the time inventory is purchased. As sales orders are priced, futures, swaps or forward contracts are purchased. These derivatives generally settle within three months.
We can also use call option contracts, which function in a manner similar to the natural gas call option contracts discussed below, and put option contracts for managing metal price exposures. Option contracts require the payment of a premium which is recorded as a realized loss upon settlement or expiration of the option contract. Upon settlement of a put option contract, we receive cash and recognize a related gain if the LME closing price is less than the strike price of the put option. If the put option strike price is less than the LME closing price, no amount is paid and the option expires.
As of December 31, 2017, we had 0.1 million metric tons and 0.2 million metric tons of metal buy and sell derivative contracts, respectively. As of December 31, 2016, we had 0.1 million metric tons and 0.2 million metric tons of metal buy and sell derivative contracts, respectively.
Energy Hedging
To manage the price exposure for natural gas purchases, we can fix the future price of a portion or all of our natural gas requirements by entering into financial hedge contracts. Additionally, from time to time, we have entered into diesel fuel swaps with financial counterparties to mitigate the impact of the volatility of diesel fuel prices on our freight costs.
We do not consider our natural gas derivatives instruments as hedges for accounting purposes and as a result, changes in the fair value of these derivatives are recorded immediately in our consolidated operating results. Under these contracts, payments are made or received based on the differential between the monthly closing price on the New York Mercantile Exchange (“NYMEX”) and the contractual hedge price. We can also use a combination of call option contracts and put option contracts for managing the exposure to increasing natural gas prices while maintaining the benefit from declining prices. Upon settlement of call option contracts, we receive cash and recognize a related gain if the NYMEX closing price exceeds the strike price of the call option. If the call option strike price exceeds the NYMEX closing price, no amount is received and the option
64
expires unexercised. Upon settlement of a put option contract, we pay cash and recognize a related loss if the NYMEX closing price is lower than the strike price of the put option. If the put option strike price is less than the NYMEX closing price, no amount is paid and the option expires unexercised. Option contracts require the payment of a premium which is recorded as a realized loss upon settlement or expiration of the option contract. Natural gas cost can also be managed through the use of cost escalators included in some of our long-term supply contracts with customers, which limits exposure to natural gas price risk.
As of December 31, 2017 and 2016, we had 3.5 trillion and 2.1 trillion, respectively, of British thermal unit forward buy contracts. We anticipate consuming 5.3 trillion British thermal units of natural gas in our operations in 2018.
We use independent freight carriers to deliver our products. As part of the total freight charge, these carriers include a per mile diesel surcharge based on the Department of Energy, Energy Information Administration’s (“DOE”) Weekly Retail Automotive Diesel National Average Price. From time to time, we enter into over-the-counter DOE diesel fuel swaps with financial counterparties to mitigate the impact of the volatility of diesel fuel prices on our freight costs. Under these swap agreements, we pay a fixed price per gallon of diesel fuel determined at the time the agreements were executed and receive a floating rate payment that is determined on a monthly basis based on the average price of the DOE Diesel Fuel Index during the applicable month. The swaps are designed to offset increases or decreases in fuel surcharges that we pay to our carriers. All swaps are financially settled. There is no possibility of physical settlement. As of December 31, 2017, we had 1.5 million gallons of diesel fuel swap contracts. As of December 31, 2016, we had no diesel fuel swap contracts.
Currency Hedging and Exchange Risks
The financial condition and results of operations of some of our operating entities are reported in various currencies and then translated into U.S. dollars at the applicable exchange rate for inclusion in our consolidated financial statements. As a result, appreciation of the U.S. dollar against these currencies will have a negative impact on reported revenues and operating profit, while depreciation of the U.S. dollar against these currencies will generally have a positive effect on reported revenues and operating profit. In addition, our aerospace and heat exchanger businesses expose the U.S. dollar operating results of our European operations to fluctuations in the euro as sales contracts are generally in U.S. dollars while the costs of production are in euros. As a result, appreciation in the U.S. dollar will have a positive impact on earnings while depreciation of the U.S. dollar will have a negative impact on earnings. In order to mitigate the risk that fluctuations in the euro may have on our business we have entered into forward currency contracts. As of December 31, 2017 and 2016, we had euro forward contracts covering a notional amount of €100.8 million and €34.6 million, respectively.
Fair Values and Sensitivity Analysis
The following table shows the fair values of outstanding derivative contracts at December 31, 2017 and the effect on the fair value of a hypothetical adverse change in the market prices that existed at December 31, 2017:
Impact of | ||||||||
Fair | 10% Adverse | |||||||
Derivative | Value | Price Change | ||||||
Metal | $ | (2.5 | ) | $ | (24.4 | ) | ||
Energy | 0.2 | (1.3 | ) | |||||
Currency | 1.5 | (12.4 | ) | |||||
The following table shows the fair values of outstanding derivative contracts at December 31, 2016 and the effect on the fair value of a hypothetical adverse change in the market prices that existed at December 31, 2016:
Impact of | ||||||||
Fair | 10% Adverse | |||||||
Derivative | Value | Price Change | ||||||
Metal | $ | (3.3 | ) | $ | (16.5 | ) | ||
Energy | 0.7 | (0.8 | ) | |||||
The disclosures above do not take into account the underlying commitments or anticipated transactions. If the underlying items were included in the analysis, the gains or losses on our derivative instruments would be offset by gains and losses realized on the purchase of the physical commodities. Actual results will be determined by a number of factors outside of our control and could vary significantly from the amounts disclosed. For additional information on derivative financial instruments, see Note 2, “Summary of Significant Accounting Policies,” and Note 12, “Derivative and Other Financial Instruments,” to our audited consolidated financial statements included elsewhere in the annual report on Form 10-K.
65
Interest Rate Risks
As of December 31, 2017, approximately 73% of our debt obligations were at fixed rates. We are subject to interest rate risk related to the ABL Facility and the China Loan Facility, to the extent borrowings are outstanding under these facilities. As of December 31, 2017, Aleris International had $319.3 million of borrowings outstanding under the ABL Facility and Aleris Zhenjiang had $164.8 million of borrowings outstanding under the Zhenjiang Term Loans. We estimate that if the market interest rates would have increased by 10%, our interest expense for the year ended December 31, 2017 would have increased by approximately $1.8 million.
66
ITEM 8. FINANCIAL STATEMENTS AND SUPPLEMENTARY DATA.
Index to Consolidated Financial Statements
Index | Page Number |
Consolidated Balance Sheet as of December 31, 2017 and December 31, 2016 | |
Consolidated Statements of Comprehensive (Loss) Income for the years ended December 31, 2017, 2016 and 2015 | |
Consolidated Statements of Changes in Stockholders’ Equity and Redeemable Noncontrolling Interest for the years ended December 31, 2017, 2016 and 2015 | |
67
Management’s Report on Internal Control Over Financial Reporting
Management of the Company is responsible for establishing and maintaining effective internal control over financial reporting as defined in Rule 13a-15(f) under the Securities Exchange Act of 1934. The Company’s internal control over financial reporting is designed to provide reasonable assurance regarding the reliability of financial reporting and the preparation of financial statements for external purposes in accordance with generally accepted accounting principles.
Because of its inherent limitations, internal control over financial reporting may not prevent or detect misstatements. Therefore, even those systems determined to be effective can provide only reasonable assurance with respect to financial statement preparation and presentation.
Management assessed the effectiveness of the Company’s internal control over financial reporting as of December 31, 2017 using the criteria set forth in Internal Control - Integrated Framework (2013) issued by the Committee of Sponsoring Organizations of the Treadway Commission. Based on this assessment, management believes that, as of December 31, 2017, the Company’s internal control over financial reporting was effective based on those criteria.
The effectiveness of internal control over financial reporting as of December 31, 2017, has been audited by Ernst & Young LLP, the independent registered public accounting firm who also audited the Company’s consolidated financial statements. Ernst & Young LLP’s attestation report on the effectiveness of the Company’s internal control over financial reporting is included herein.
/s/ Sean M. Stack |
Sean M. Stack |
Chairman and Chief Executive Officer |
(Principal Executive Officer) |
/s/ Eric M. Rychel |
Eric M. Rychel |
Executive Vice President, Chief Financial Officer and Treasurer |
(Principal Financial Officer) |
68
Report of Independent Registered Public Accounting Firm
To the Stockholders and the Board of Directors of Aleris Corporation
Opinion on the Financial Statements
We have audited the accompanying consolidated balance sheet of Aleris Corporation as of December 31, 2017 and 2016, the related consolidated statements of operations, comprehensive (loss) income, cash flows and changes in stockholders’ equity and redeemable noncontrolling interest for each of the three years in the period ended December 31, 2017, and the related notes (collectively referred to as the “consolidated financial statements”). In our opinion, the consolidated financial statements present fairly, in all material respects, the financial position of the Company at December 31, 2017 and 2016, and the results of its operations and its cash flows for each of the three years in the period ended December 31, 2017, in conformity with U.S. generally accepted accounting principles.
We also have audited, in accordance with the standards of the Public Company Accounting Oversight Board (United States) (PCAOB) and in accordance with auditing standards generally accepted in the United States of America, the Company’s internal control over financial reporting as of December 31, 2017, based on criteria established in Internal Control-Integrated Framework issued by the Committee of Sponsoring Organizations of the Treadway Commission (2013 framework), and our report dated March 20, 2018 expressed an unqualified opinion thereon.
Basis for Opinion
These financial statements are the responsibility of the Company’s management. Our responsibility is to express an opinion on the Company’s financial statements based on our audits. We are a public accounting firm registered with the PCAOB and are required to be independent with respect to the Company in accordance with the U.S. federal securities laws and the applicable rules and regulations of the Securities and Exchange Commission and the PCAOB.
We conducted our audits in accordance with the standards of the PCAOB and in accordance with auditing standards generally accepted in the United States of America. Those standards require that we plan and perform the audit to obtain reasonable assurance about whether the financial statements are free of material misstatement, whether due to error or fraud. Our audits included performing procedures to assess the risks of material misstatement of the financial statements, whether due to error or fraud, and performing procedures that respond to those risks. Such procedures included examining, on a test basis, evidence regarding the amounts and disclosures in the financial statements. Our audits also included evaluating the accounting principles used and significant estimates made by management, as well as evaluating the overall presentation of the financial statements. We believe that our audits provide a reasonable basis for our opinion.
/s/ Ernst & Young LLP
We have served as the Company’s auditor since at least 1988, but we are unable to determine the specific year.
Cleveland, Ohio
March 20, 2018
69
Report of Independent Registered Public Accounting Firm
To the Stockholders and the Board of Directors of Aleris Corporation
Opinion on Internal Control over Financial Reporting
We have audited Aleris Corporation’s internal control over financial reporting as of December 31, 2017, based on criteria established in Internal Control-Integrated Framework issued by the Committee of Sponsoring Organizations of the Treadway Commission (2013 framework) (the COSO criteria). In our opinion, Aleris Corporation (the Company) maintained, in all material respects, effective internal control over financial reporting as of December 31, 2017, based on the COSO criteria.
We also have audited, in accordance with the standards of the Public Company Accounting Oversight Board (United States) (the PCAOB) and in accordance with auditing standards generally accepted in the United States of America, the 2017 consolidated financial statements of the Company and our report dated March 20, 2018 expressed an unqualified opinion thereon.
Basis for Opinion
The Company’s management is responsible for maintaining effective internal control over financial reporting and for its assessment of the effectiveness of internal control over financial reporting included in the accompanying Management’s Report on Internal Control Over Financial Reporting. Our responsibility is to express an opinion on the Company’s internal control over financial reporting based on our audit. We are a public accounting firm registered with the PCAOB and are required to be independent with respect to the Company in accordance with the U.S. federal securities laws and the applicable rules and regulations of the Securities and Exchange Commission and the PCAOB.
We conducted our audit in accordance with the standards of the PCAOB and in accordance with auditing standards generally accepted in the United States of America. Those standards require that we plan and perform the audit to obtain reasonable assurance about whether effective internal control over financial reporting was maintained in all material respects.
Our audit included obtaining an understanding of internal control over financial reporting, assessing the risk that a material weakness exists, testing and evaluating the design and operating effectiveness of internal control based on the assessed risk, and performing such other procedures as we considered necessary in the circumstances. We believe that our audit provides a reasonable basis for our opinion.
Definition and Limitations of Internal Control Over Financial Reporting
A company’s internal control over financial reporting is a process designed to provide reasonable assurance regarding the reliability of financial reporting and the preparation of financial statements for external purposes in accordance with generally accepted accounting principles. A company’s internal control over financial reporting includes those policies and procedures that (1) pertain to the maintenance of records that, in reasonable detail, accurately and fairly reflect the transactions and dispositions of the assets of the company; (2) provide reasonable assurance that transactions are recorded as necessary to permit preparation of financial statements in accordance with generally accepted accounting principles, and that receipts and expenditures of the company are being made only in accordance with authorizations of management and directors of the company; and (3) provide reasonable assurance regarding prevention or timely detection of unauthorized acquisition, use, or disposition of the company’s assets that could have a material effect on the financial statements.
Because of its inherent limitations, internal control over financial reporting may not prevent or detect misstatements. Also, projections of any evaluation of effectiveness to future periods are subject to the risk that controls may become inadequate because of changes in conditions, or that the degree of compliance with the policies or procedures may deteriorate.
/s/ Ernst & Young LLP
Cleveland, Ohio
March 20, 2018
70
ALERIS CORPORATION
CONSOLIDATED BALANCE SHEET
(in millions, except share and per share data)
December 31, | |||||||
ASSETS | 2017 | 2016 | |||||
Current Assets | |||||||
Cash and cash equivalents | $ | 102.4 | $ | 55.6 | |||
Accounts receivable (net of allowances of $4.9 and $7.6 at December 31, 2017 and 2016, respectively) | 245.7 | 218.7 | |||||
Inventories | 631.2 | 538.9 | |||||
Prepaid expenses and other current assets | 36.1 | 33.4 | |||||
Total Current Assets | 1,015.4 | 846.6 | |||||
Property, plant and equipment, net | 1,470.9 | 1,346.0 | |||||
Intangible assets, net | 34.7 | 36.8 | |||||
Deferred income taxes | 70.7 | 88.3 | |||||
Other long-term assets | 52.7 | 72.2 | |||||
Total Assets | $ | 2,644.4 | $ | 2,389.9 | |||
LIABILITIES AND STOCKHOLDERS’ EQUITY | |||||||
Current Liabilities | |||||||
Accounts payable | $ | 299.2 | $ | 246.6 | |||
Accrued liabilities | 197.4 | 201.4 | |||||
Current portion of long-term debt | 9.1 | 27.7 | |||||
Total Current Liabilities | 505.7 | 475.7 | |||||
Long-term debt | 1,771.4 | 1,438.5 | |||||
Deferred income taxes | 4.0 | 2.8 | |||||
Accrued pension benefits | 170.2 | 158.4 | |||||
Accrued postretirement benefits | 34.3 | 34.2 | |||||
Other long-term liabilities | 66.1 | 63.7 | |||||
Total Long-Term Liabilities | 2,046.0 | 1,697.6 | |||||
Stockholders’ Equity | |||||||
Common stock; par value $.01; 45,000,000 shares authorized; 32,001,318 and 31,904,250 shares issued at December 31, 2017 and 2016, respectively | 0.3 | 0.3 | |||||
Preferred stock; par value $.01; 1,000,000 shares authorized; none issued | — | — | |||||
Additional paid-in capital | 436.3 | 428.0 | |||||
Retained (deficit) earnings | (203.4 | ) | 11.8 | ||||
Accumulated other comprehensive loss | (140.5 | ) | (223.5 | ) | |||
Total Equity | 92.7 | 216.6 | |||||
Total Liabilities and Equity | $ | 2,644.4 | $ | 2,389.9 | |||
The accompanying notes are an integral part of these audited consolidated financial statements.
71
ALERIS CORPORATION
CONSOLIDATED STATEMENTS OF OPERATIONS
(in millions)
For the years ended December 31, | |||||||||||
2017 | 2016 | 2015 | |||||||||
Revenues | $ | 2,857.3 | $ | 2,663.9 | $ | 2,917.8 | |||||
Cost of sales | 2,597.9 | 2,376.0 | 2,702.9 | ||||||||
Gross profit | 259.4 | 287.9 | 214.9 | ||||||||
Selling, general and administrative expenses | 220.8 | 218.5 | 203.5 | ||||||||
Restructuring charges | 2.9 | 1.5 | 10.3 | ||||||||
Losses on derivative financial instruments | 44.7 | 12.1 | 6.9 | ||||||||
Other operating expense, net | 5.7 | 3.9 | 2.5 | ||||||||
Operating (loss) income | (14.7 | ) | 51.9 | (8.3 | ) | ||||||
Interest expense, net | 124.1 | 82.5 | 94.1 | ||||||||
Other expense (income), net | 35.2 | 1.7 | (7.4 | ) | |||||||
Loss from continuing operations before income taxes | (174.0 | ) | (32.3 | ) | (95.0 | ) | |||||
Provision for (benefit from) income taxes | 40.4 | 40.0 | (22.7 | ) | |||||||
Loss from continuing operations | (214.4 | ) | (72.3 | ) | (72.3 | ) | |||||
Income (loss) from discontinued operations, net of tax | 3.8 | (3.3 | ) | 121.1 | |||||||
Net (loss) income | (210.6 | ) | (75.6 | ) | 48.8 | ||||||
Net income from discontinued operations attributable to noncontrolling interest | — | — | 0.1 | ||||||||
Net (loss) income attributable to Aleris Corporation | $ | (210.6 | ) | $ | (75.6 | ) | $ | 48.7 | |||
The accompanying notes are an integral part of these audited consolidated financial statements.
72
ALERIS CORPORATION
CONSOLIDATED STATEMENTS OF COMPREHENSIVE (LOSS) INCOME
(in millions)
For the years ended December 31, | ||||||||||||
2017 | 2016 | 2015 | ||||||||||
Net (loss) income | $ | (210.6 | ) | $ | (75.6 | ) | $ | 48.8 | ||||
Other comprehensive income (loss), before tax: | ||||||||||||
Currency translation adjustments | 82.0 | (29.7 | ) | (80.3 | ) | |||||||
Reclassification into earnings due to the sale of businesses | — | — | 45.2 | |||||||||
Pension and other postretirement liability adjustments | 2.7 | (16.1 | ) | 21.6 | ||||||||
Other comprehensive income (loss), before tax | 84.7 | (45.8 | ) | (13.5 | ) | |||||||
Income tax expense (benefit) related to items of other comprehensive loss | 1.7 | (5.0 | ) | 8.3 | ||||||||
Other comprehensive income (loss), net of tax | 83.0 | (40.8 | ) | (21.8 | ) | |||||||
Comprehensive (loss) income | (127.6 | ) | (116.4 | ) | 27.0 | |||||||
Comprehensive income attributable to noncontrolling interest | — | — | 0.1 | |||||||||
Comprehensive (loss) income attributable to Aleris Corporation | $ | (127.6 | ) | $ | (116.4 | ) | $ | 26.9 | ||||
The accompanying notes are an integral part of these audited consolidated financial statements.
73
ALERIS CORPORATION
CONSOLIDATED STATEMENTS OF CASH FLOWS
(in millions)
For the years ended December 31, | |||||||||||
2017 | 2016 | 2015 | |||||||||
Operating activities | |||||||||||
Net (loss) income | $ | (210.6 | ) | $ | (75.6 | ) | $ | 48.8 | |||
Adjustments to reconcile net (loss) income to net cash (used) provided by operating activities: | |||||||||||
Depreciation and amortization | 115.7 | 104.9 | 123.8 | ||||||||
Provision for deferred income taxes | 32.3 | 21.5 | 34.5 | ||||||||
Stock-based compensation expense | 11.3 | 7.0 | 4.8 | ||||||||
Unrealized (gains) losses on derivative financial instruments | (3.0 | ) | (19.0 | ) | 28.1 | ||||||
Amortization of debt issuance costs | 2.8 | 5.7 | 6.6 | ||||||||
Loss on extinguishment of debt | — | 12.6 | 2.0 | ||||||||
Net (gain) loss on sale of discontinued operations | (4.5 | ) | 3.3 | (191.7 | ) | ||||||
Impairment of amounts held in escrow related to the sale of the recycling business | 22.8 | — | — | ||||||||
Other | 10.1 | 4.9 | (10.2 | ) | |||||||
Changes in operating assets and liabilities: | |||||||||||
Change in accounts receivable | (5.7 | ) | (9.4 | ) | (31.3 | ) | |||||
Change in inventories | (58.4 | ) | (70.2 | ) | 128.0 | ||||||
Change in other assets | 3.9 | (1.4 | ) | 3.8 | |||||||
Change in accounts payable | 33.7 | 41.7 | (18.6 | ) | |||||||
Change in accrued liabilities | 18.2 | (14.0 | ) | (9.1 | ) | ||||||
Net cash (used) provided by operating activities | (31.4 | ) | 12.0 | 119.5 | |||||||
Investing activities | |||||||||||
Payments for property, plant and equipment | (207.7 | ) | (358.1 | ) | (313.6 | ) | |||||
Proceeds from the sale of businesses, net of cash transferred | — | 5.0 | 587.4 | ||||||||
Other | (3.0 | ) | (1.5 | ) | (0.1 | ) | |||||
Net cash (used) provided by investing activities | (210.7 | ) | (354.6 | ) | 273.7 | ||||||
Financing activities | |||||||||||
Proceeds from revolving credit facilities | 575.1 | 360.4 | 159.5 | ||||||||
Payments on revolving credit facilities | (536.3 | ) | (107.0 | ) | (380.8 | ) | |||||
Proceeds from senior secured notes, inclusive of premiums and discounts | 263.8 | 540.4 | — | ||||||||
Payments on senior notes, including premiums | — | (443.8 | ) | (125.0 | ) | ||||||
Net payments on other long-term debt | (6.4 | ) | (7.3 | ) | (6.4 | ) | |||||
Debt issuance costs | (2.8 | ) | (4.0 | ) | (4.6 | ) | |||||
Other | (2.9 | ) | (0.6 | ) | (2.6 | ) | |||||
Net cash provided (used) by financing activities | 290.5 | 338.1 | (359.9 | ) | |||||||
Effect of exchange rate differences on cash, cash equivalents and restricted cash | 4.0 | (2.1 | ) | (7.1 | ) | ||||||
Net increase (decrease) in cash, cash equivalents and restricted cash | 52.4 | (6.6 | ) | 26.2 | |||||||
Cash, cash equivalents and restricted cash at beginning of period | 55.6 | 62.2 | 36.0 | ||||||||
Cash, cash equivalents and restricted cash at end of period | 108.0 | 55.6 | 62.2 | ||||||||
Cash and cash equivalents | 102.4 | 55.6 | 62.2 | ||||||||
Restricted cash (included in “Prepaid expenses and other current assets”) | 5.6 | — | — | ||||||||
Cash, cash equivalents and restricted cash | $ | 108.0 | $ | 55.6 | $ | 62.2 | |||||
The accompanying notes are an integral part of these audited consolidated financial statements.
74
ALERIS CORPORATION
CONSOLIDATED STATEMENTS OF CHANGES IN STOCKHOLDERS’ EQUITY AND
REDEEMABLE NONCONTROLLING INTEREST
(in millions)
Common stock | Additional paid-in capital | Retained earnings (deficit) | Accumulated other comprehensive loss | Total Aleris Corporation equity | Noncontrolling interest | Total equity | Redeemable noncontrolling interest | ||||||||||||||||||||||||
Balance at January 1, 2015 | $ | 0.3 | $ | 414.1 | $ | 39.1 | $ | (160.9 | ) | $ | 292.6 | $ | 0.7 | $ | 293.3 | $ | 5.7 | ||||||||||||||
Net income | — | — | 48.7 | — | 48.7 | 0.1 | 48.8 | — | |||||||||||||||||||||||
Other comprehensive loss | — | — | — | (21.8 | ) | (21.8 | ) | — | (21.8 | ) | — | ||||||||||||||||||||
Stock-based compensation activity | — | 2.6 | — | — | 2.6 | — | 2.6 | — | |||||||||||||||||||||||
Conversion of Aleris International preferred stock to common stock | — | 5.6 | — | — | 5.6 | — | 5.6 | (5.6 | ) | ||||||||||||||||||||||
Other | — | (0.4 | ) | (0.1 | ) | — | (0.5 | ) | (0.8 | ) | (1.3 | ) | (0.1 | ) | |||||||||||||||||
Balance at December 31, 2015 | $ | 0.3 | $ | 421.9 | $ | 87.7 | $ | (182.7 | ) | $ | 327.2 | $ | — | $ | 327.2 | $ | — | ||||||||||||||
Net loss | — | — | (75.6 | ) | — | (75.6 | ) | — | (75.6 | ) | — | ||||||||||||||||||||
Other comprehensive loss | — | — | — | (40.8 | ) | (40.8 | ) | — | (40.8 | ) | — | ||||||||||||||||||||
Stock-based compensation activity | — | 6.3 | — | — | 6.3 | — | 6.3 | — | |||||||||||||||||||||||
Other | — | (0.2 | ) | (0.3 | ) | — | (0.5 | ) | — | (0.5 | ) | — | |||||||||||||||||||
Balance at December 31, 2016 | $ | 0.3 | $ | 428.0 | $ | 11.8 | $ | (223.5 | ) | $ | 216.6 | $ | — | $ | 216.6 | $ | — | ||||||||||||||
Net loss | — | — | (210.6 | ) | — | (210.6 | ) | — | (210.6 | ) | — | ||||||||||||||||||||
Other comprehensive income | — | — | — | 83.0 | 83.0 | — | 83.0 | — | |||||||||||||||||||||||
Stock-based compensation activity | — | 8.3 | — | — | 8.3 | — | 8.3 | — | |||||||||||||||||||||||
Adoption of accounting standard | — | — | (4.7 | ) | — | (4.7 | ) | — | (4.7 | ) | — | ||||||||||||||||||||
Other | — | — | 0.1 | — | 0.1 | — | 0.1 | — | |||||||||||||||||||||||
Balance at December 31, 2017 | $ | 0.3 | $ | 436.3 | $ | (203.4 | ) | $ | (140.5 | ) | $ | 92.7 | $ | — | $ | 92.7 | $ | — | |||||||||||||
The accompanying notes are an integral part of these audited consolidated financial statements.
75
ALERIS CORPORATION
NOTES TO CONSOLIDATED FINANCIAL STATEMENTS
(dollars in millions, except share and per share data)
1. | BASIS OF PRESENTATION |
Nature of Operations
Aleris Corporation and all of its subsidiaries (collectively, except where the context otherwise requires, referred to as “Aleris,” “we,” “our,” “us,” and the “Company” or similar terms) is a Delaware corporation with its principal executive offices located in Cleveland, Ohio. The principal business of the Company is the production of aluminum rolled products, including aluminum sheet and fabricated products, using continuous cast and direct-chill processes. Our aluminum sheet products are sold to customers and distributors serving the aerospace, automotive, building and construction, truck trailer, consumer durables, other general industrial and distribution industries.
Basis of Presentation
Aleris Corporation is a holding company and currently conducts its business and operations through its direct wholly owned subsidiary, Aleris International, Inc. and its consolidated subsidiaries. Aleris International, Inc. is referred to herein as Aleris International. The accompanying consolidated financial statements have been prepared in conformity with accounting principles generally accepted in the United States of America (“GAAP”).
2. | SUMMARY OF SIGNIFICANT ACCOUNTING POLICIES |
Use of Accounting Estimates
The consolidated financial statements are prepared in conformity with GAAP and require management to make estimates and assumptions that affect the reported amounts of assets and liabilities, the disclosure of contingent assets and liabilities at the date of the financial statements and the reported amounts of revenues and expenses during the reporting period. Actual results could differ from those estimates. Estimates are inherent in the valuations of derivatives, property, plant and equipment, intangible assets, assets held in escrow, the assumptions used to estimate the fair value of stock-based payments, pension and postretirement benefit obligations, workers’ compensation, medical and environmental liabilities, deferred tax asset valuation allowances, reserves for uncertain tax positions and allowances for uncollectible accounts receivable.
Principles of Consolidation
The accompanying consolidated financial statements include the accounts of the Company and our majority owned subsidiaries. All intercompany accounts and transactions have been eliminated upon consolidation.
Revenue Recognition and Shipping and Handling Costs
Revenues are recognized when title transfers and risk of loss passes to the customer in accordance with the provisions of the Securities and Exchange Commission (“SEC”) Staff Accounting Bulletin (“SAB”) No. 104, “Revenue Recognition” (codified in Accounting Standards Codification (“ASC”) 605). This occurs at various points in the delivery process. In North America, substantially all revenue is recognized at the point of shipment. In Europe and China, the timing of revenue recognition varies depending on individual customer arrangements. For material that is consigned, revenue is not recognized until the product is used by the customer. We occasionally enter into long-term supply contracts with customers and receive advance payments for product to be delivered in future periods. These advance payments are recorded as deferred revenue, and revenue is recognized as shipments are made and title, ownership, and risk of loss pass to the customer during the term of the applicable contract. In connection with the January 1, 2018 adoption of Accounting Standards Update (“ASU”) 2014-09 (defined below), our revenue recognition policy will be updated to reflect the new revenue recognition model, which requires the recognition of revenue when a customer obtains control of the product and can obtain substantially all of the benefits from the product.
Shipping and handling costs are included within “Cost of sales” in the Consolidated Statements of Operations.
Cash Equivalents
All highly liquid investments with a maturity of three months or less when purchased are considered cash equivalents. The carrying amount of cash equivalents approximates fair value because of the short maturity of those instruments.
Restricted Cash
Cash that is reserved for a specific purpose and not available for general business use is considered restricted cash. Restricted cash is classified either in the current assets or in the noncurrent assets section of the balance sheet, depending on the date of availability or disbursement. At December 31, 2017, $5.6 of cash was restricted for payments of the China Loan Facility
76
ALERIS CORPORATION
NOTES TO CONSOLIDATED FINANCIAL STATEMENTS - (CONTINUED)
(dollars in millions, except share and per share data)
(defined below), all of which was included in “Prepaid expenses and other current assets” in the Consolidated Balance Sheet. There was no restricted cash at December 31, 2016.
Accounts Receivable Allowances and Credit Risk
We extend credit to our customers based on an evaluation of their financial condition; generally, collateral is not required. Substantially all of the accounts receivable associated with our European operations and a portion of the accounts receivable associated with our China operations are insured against loss by third party credit insurers. We maintain an allowance against our accounts receivable for the estimated probable losses on uncollectible accounts and sales returns and allowances. The valuation reserve is based upon our historical loss experience, current economic conditions within the industries we serve and our determination of the specific risk related to certain customers. Accounts receivable are charged off against the reserve when, in management’s estimation, further collection efforts would not result in a reasonable likelihood of receipt, or, if later, as proscribed by statutory regulations. The movement of the accounts receivable allowances is as follows:
For the years ended December 31, | ||||||||||||
2017 | 2016 | 2015 | ||||||||||
Balance at beginning of the period | $ | 7.6 | $ | 7.7 | $ | 7.7 | ||||||
Expenses for uncollectible accounts, sales returns and allowances, net of recoveries | 30.8 | 33.0 | 40.3 | |||||||||
Divestitures | — | — | (1.0 | ) | ||||||||
Receivables written off against the valuation reserve | (33.5 | ) | (33.1 | ) | (39.3 | ) | ||||||
Balance at end of the period | $ | 4.9 | $ | 7.6 | $ | 7.7 | ||||||
Concentration of credit risk with respect to trade accounts receivable is limited due to the large number of customers in various industry segments comprising our customer base.
Inventories
Our inventories are stated at the lower of cost or net realizable value. Cost is determined primarily on the average cost or specific identification method and includes material, labor and overhead related to the manufacturing process. We recorded charges associated with lower of cost or net realizable value adjustments of $0.3, $1.5 and $0.6 for the years ended December 31, 2017, 2016 and 2015, respectively. Our consigned inventory held at third party warehouses and customer locations was approximately $32.5 and $19.6 as of December 31, 2017 and 2016, respectively.
Property, Plant and Equipment
Property, plant and equipment is stated at cost, net of asset impairments. The cost of property, plant and equipment acquired in business combinations represents the fair value of the acquired assets at the time of acquisition.
The fair values of asset retirement obligations are capitalized to the related long-lived asset at the time the obligation is incurred and depreciated over the remaining useful life of the related asset. Major renewals and improvements that extend an asset’s useful life are capitalized to property, plant and equipment. Major repair and maintenance projects are expensed over periods not exceeding 18 months while normal maintenance and repairs are expensed as incurred. Depreciation is primarily computed using the straight-line method over the estimated useful lives of the related assets, as follows:
Buildings and improvements | 5 - 38 years | |
Production equipment and machinery | 2 - 25 years | |
Office furniture, equipment and other | 3 - 10 years | |
Interest is capitalized in connection with major construction projects. Capitalized interest costs are as follows:
For the years ended December 31, | ||||||||||||
2017 | 2016 | 2015 | ||||||||||
Capitalized interest | $ | 8.4 | $ | 25.2 | $ | 8.0 | ||||||
Intangible Assets
Intangible assets are primarily related to trade names, technology and customer relationships. Acquired intangible assets are recorded at their estimated fair value in the allocation of the purchase price paid. Intangible assets with indefinite useful lives are not amortized and intangible assets with finite useful lives are amortized over their estimated useful lives, ranging from 15 to 25 years. See Note 6, “Intangible Assets,” for additional information.
77
ALERIS CORPORATION
NOTES TO CONSOLIDATED FINANCIAL STATEMENTS - (CONTINUED)
(dollars in millions, except share and per share data)
Impairment of Property, Plant, Equipment and Finite-Lived Intangible Assets
We review our long-lived assets for impairment when changes in circumstances indicate that the carrying amount may not be recoverable. Once an impairment indicator has been identified, the asset impairment test is a two-step process. The first step consists of determining whether the sum of the estimated undiscounted future cash flows attributable to the specific asset group being tested is less than its carrying value. Estimated future cash flows used to test for recoverability include only the future cash flows that are directly associated with and are expected to arise as a direct result of the use and eventual disposition of the relevant asset group. If the carrying value of the asset group exceeds the future undiscounted cash flows expected from the asset group, a second step is performed to compute the extent of the impairment. Impairment charges are determined as the amount by which the carrying value of the asset group exceeds the estimated fair value of the asset group.
As outlined in ASC 820, “Fair Value Measurements and Disclosures” (“ASC 820”), the fair value measurement of our long-lived assets assumes the highest and best use of the asset by market participants, considering the use of the asset that is physically possible, legally permissible, and financially feasible at the measurement date. Highest and best use is determined based on the use of the asset by market participants, even if the intended use of the asset by the Company is different. The highest and best use of an asset establishes the valuation premise. The valuation premise is used to measure the fair value of an asset. ASC 820-10-35-10 states that the valuation premise of an asset is either of the following:
▪ | In-use: The highest and best use of the asset is in-use if the asset would provide maximum value to market participants principally through its use in combination with other assets as a group (as installed or otherwise configured for use). |
▪ | In-exchange: The highest and best use of the asset is in-exchange if the asset would provide maximum value to market participants principally on a stand-alone basis. |
Once a premise is selected, the approaches considered in the estimation of the fair values of the Company’s long-lived assets tested for impairment, which represent level 3 measurements within the fair value hierarchy, include the income approach, sales comparison approach and the cost approach.
Indefinite-Lived Intangible Asset
Our indefinite-lived intangible asset related to our trade name is tested for impairment as of October 1st of each year and may be tested more frequently if changes in circumstances or the occurrence of events indicates that a potential impairment exists.
Under ASC 350, “Intangibles - Goodwill and Other,” intangible assets determined to have indefinite lives are not amortized, but are tested for impairment at least annually. As part of the annual impairment test, the non-amortized intangible asset is reviewed to determine if the indefinite status remains appropriate. Based on the annual test performed as of October 1, 2017, no impairments relating to our indefinite-lived intangible asset was necessary.
Deferred Financing Costs
The costs related to the issuance of debt are capitalized and amortized over the terms of the related debt agreements as interest expense using the effective interest method.
Research and Development
Our research and development organization includes three locations in Europe, one location in the United States and one location in China, along with support staff focused on new product and alloy offerings and process performance technology. Research and development expenses, included in “Selling, general and administrative expenses” in the Consolidated Statements of Operations, were $16.0, $10.9 and $11.2 for the years ended December 31, 2017, 2016 and 2015, respectively.
Stock-Based Compensation
We recognize compensation expense for stock options, restricted stock units and restricted shares under the provisions of ASC 718, “Compensation—Stock Compensation,” using the non-substantive vesting period approach, in which the expense is recognized ratably over the requisite service period based on the grant date fair value.
The fair value of each new stock option was estimated on the date of grant using a Black-Scholes option pricing model. Determining the fair value of stock options at the grant date requires judgment, including estimates for the average risk-free interest rate, dividend yield and volatility. Subsequent to the adoption of ASU 2016-09, “Compensation-Stock Compensation-Improvements to Employee Share-Based Payment Accounting (“ASU 2016-09”), forfeitures are recognized as they occur and the term of the awards are calculated using the practical expedient that allows for the calculation of the term to be the midpoint between the requisite service period and the contractual term of the award. The fair value of restricted stock units and restricted
78
ALERIS CORPORATION
NOTES TO CONSOLIDATED FINANCIAL STATEMENTS - (CONTINUED)
(dollars in millions, except share and per share data)
shares were based on the estimated fair value of our common stock on the date of grant. The fair value of our common stock was estimated based upon a present value technique using discounted cash flows, forecasted over a five-year period with residual growth rates thereafter, and a market comparable approach. From these two approaches, the discounted cash flow analysis was weighted at 50% and the comparable public company analysis was weighted at 50%.
The discounted cash flow analysis was based on our projected financial information which includes a variety of estimates and assumptions. While we consider such estimates and assumptions reasonable, they are inherently subject to uncertainties and a wide variety of significant business, economic and competitive risks, many of which are beyond our control and may not materialize. Changes in these estimates and assumptions may have a significant effect on the determination of the fair value of our common stock.
The discounted cash flow analysis was based on production volume projections developed by internal forecasts, as well as commercial, wage and benefit and inflation assumptions. The discounted cash flow analysis included the sum of (i) the present value of the projected unlevered cash flows for a five-year period (the “Projection Period”); and (ii) the present value of a terminal value, which represented the estimate of value attributable to periods beyond the Projection Period. For 2017, all cash flows were discounted using a weighted-average cost of capital (“WACC”) percentage of 10.5%. To calculate the terminal value, a perpetuity growth rate approach is used. For 2017, a growth rate of three percent was used and was determined based on research of long-term aluminum demand growth rates. Other significant assumptions include future capital expenditures and changes in working capital requirements.
The comparable public company analysis identified a group of comparable companies giving consideration to, among other relevant characteristics, similar lines of business, business risks, growth prospects, business maturity, market presence, leverage, size and scale of operations. The analysis compared the public market implied fair value for each comparable public company to its historical and projected revenues, and earnings before interest, taxes, depreciation and amortization (“EBITDA”). For the year ended December 31, 2017, the calculated range of multiples for the comparable companies was used to estimate a range of 7.0x to 12.0x and 0.65x to 0.85x, which was applied to our historical and projected EBITDA and revenues, respectively, to determine a range of fair values.
Total stock-based compensation expense included in “Selling, general and administrative expenses” in the Consolidated Statements of Operations for the years ended December 31, 2017, 2016 and 2015 was $11.3, $7.0 and $4.8, respectively.
Derivatives and Hedging
We are engaged in activities that expose us to various market risks, including changes in the prices of primary aluminum, aluminum alloys, scrap aluminum, copper, zinc, natural gas and diesel, as well as changes in currency and interest rates. Certain of these financial exposures are managed as an integral part of our risk management program, which seeks to reduce the potentially adverse effects that the volatility of the markets may have on operating results. We do not hold or issue derivative financial instruments for trading purposes. We maintain a natural gas pricing strategy to minimize significant fluctuations in earnings caused by the volatility of natural gas prices. Our metal pricing strategy is designed to minimize significant, unanticipated fluctuations in earnings caused by the volatility of aluminum prices.
Generally, we enter into master netting arrangements with our counterparties and offset net derivative positions with the same counterparties against amounts recognized for the right to reclaim cash collateral or the obligation to return cash collateral under those arrangements in our Consolidated Balance Sheet. For classification purposes, we record the net fair value of all positions expected to settle in less than one year with these counterparties as a net current asset or liability and all long-term positions as a net long-term asset or liability.
The fair values of our derivative financial instruments are recognized as assets or liabilities at the balance sheet date. Fair values for our metal and energy derivative instruments are determined based on the differences between contractual and forward rates of identical hedge positions as of the balance sheet date. Our currency derivative instruments are valued using observable or market-corroborated inputs such as exchange rates, volatility and forward yield curves. In accordance with the requirements of ASC 820, we have included an estimate of the risk associated with non-performance by either ourselves or our counterparties in developing these fair values. See Note 12, “Derivative and Other Financial Instruments,” for additional information.
The Company does not currently account for its derivative financial instruments as hedges. The changes in fair value of derivative financial instruments that are not accounted for as hedges and the associated gains and losses realized upon settlement are recorded in “Losses on derivative financial instruments” or “Income (loss) from discontinued operations, net of tax” in the Consolidated Statements of Operations. All realized gains and losses are included within “Net cash (used) provided by operating activities” in the Consolidated Statements of Cash Flows.
79
ALERIS CORPORATION
NOTES TO CONSOLIDATED FINANCIAL STATEMENTS - (CONTINUED)
(dollars in millions, except share and per share data)
We are exposed to losses in the event of non-performance by counterparties to derivative contracts. Counterparties are evaluated for creditworthiness and a risk assessment is completed prior to our initiating contract activities. The counterparties’ creditworthiness is then monitored on an ongoing basis, and credit levels are reviewed to ensure there is not an inappropriate concentration of credit outstanding to any particular counterparty. Although non-performance by counterparties is possible, we do not currently anticipate non-performance by any of these parties. At December 31, 2017, substantially all of our derivative financial instruments were maintained with ten counterparties. We have the right to require cash collateral from our counterparties based on the fair value of the underlying derivative financial instruments.
Currency Translation
The majority of our international subsidiaries use the local currency as their functional currency. Individually significant transactions are translated at the applicable currency exchange rate on the date of the transaction. We translate all of the other amounts included in our Consolidated Statements of Operations from our international subsidiaries into U.S. dollars at average monthly exchange rates, which we believe are representative of the actual exchange rates on the dates of the transactions. Adjustments resulting from the translation of the assets and liabilities of our international operations into U.S. dollars at the balance sheet date exchange rates are reflected as a separate component of stockholders’ equity. Currency translation adjustments accumulate in consolidated equity until the disposition or liquidation of the international entities. Except for intercompany debt determined to be of a long-term investment nature, current intercompany accounts and transactional gains and losses associated with receivables, payables and debt denominated in currencies other than the functional currency are included within “Other expense (income), net” or “Income (loss) from discontinued operations, net of tax” in the Consolidated Statements of Operations. The translation of accounts receivables, payables and debt denominated in currencies other than the functional currencies resulted in transactional losses (gains) of $8.2, $(0.8) and $(7.7) for the years ended December 31, 2017, 2016 and 2015, respectively, of which gains of $0.2 have been included within “Income (loss) from discontinued operations, net of tax” for the year ended December 31, 2015 in the Consolidated Statements of Operations.
Income Taxes
We account for income taxes using the asset and liability method, whereby deferred income taxes reflect the tax effect of temporary differences between the carrying amount of assets and liabilities for financial reporting purposes and the amounts used for income tax purposes. In valuing deferred tax assets, we use judgment in determining if it is more likely than not that some portion or all of a deferred tax asset will not be realized and the amount of the required valuation allowance.
Tax benefits from uncertain tax positions are recognized in the financial statements when it is more likely than not that the position is sustainable, based solely on its technical merits and considerations of the relevant taxing authority, widely understood practices and precedents. We recognize interest and penalties related to uncertain tax positions within “Provision for (benefit from) income taxes” in the Consolidated Statements of Operations.
Environmental and Asset Retirement Obligations
Environmental obligations that are not legal or contractual asset retirement obligations and that relate to existing conditions caused by past operations with no benefit to future operations are expensed while expenditures that extend the life, increase the capacity or improve the safety of an asset or that mitigate or prevent future environmental contamination are capitalized in property, plant and equipment. Obligations are recorded when their occurrence is probable and the associated costs can be reasonably estimated in accordance with ASC 410-30, “Environmental Obligations.” While our accruals are based on management’s current best estimate of the future costs of remedial action, these liabilities can change substantially due to factors such as the nature and extent of contamination, changes in the required remedial actions and technological advancements. Our existing environmental liabilities are not discounted to their present values as the amount and timing of the expenditures are not fixed or reliably determinable.
Asset retirement obligations represent obligations associated with the retirement of tangible long-lived assets. Our asset retirement obligations relate primarily to the requirements related to the future removal of asbestos and underground storage tanks. The costs associated with such legal obligations are accounted for under the provisions of ASC 410-20, “Asset Retirement Obligations,” which requires that the fair value of a liability for an asset retirement obligation be recognized in the period in which it is incurred and capitalized as part of the carrying amount of the long-lived asset. These fair values are based upon the present value of the future cash flows expected to be incurred to satisfy the obligation. Determining the fair value of asset retirement obligations requires judgment, including estimates of the credit adjusted interest rate and estimates of future cash flows. Estimates of future cash flows are obtained primarily from engineering consulting firms. The present value of the obligations is accreted over time while the capitalized cost is depreciated over the useful life of the related asset.
80
ALERIS CORPORATION
NOTES TO CONSOLIDATED FINANCIAL STATEMENTS - (CONTINUED)
(dollars in millions, except share and per share data)
Retirement, Early Retirement and Postemployment Benefits
Our defined benefit pension and other postretirement benefit plans are accounted for in accordance with ASC 715, “Compensation—Retirement Benefits.”
Pension and postretirement benefit obligations are actuarially calculated using management’s best estimates of assumptions which include the expected return on plan assets (calculated using the fair value of plan assets), the rate at which plan liabilities may be effectively settled (discount rate), health care cost trend rates and rates of compensation increases. Net actuarial gains or losses are amortized to expense on a plan-by-plan basis when they exceed the accounting corridor, which is set at 10% of the greater of the plan assets or benefit obligations. Gains or losses outside of the corridor are subject to amortization over an average employee future service period that differs by plan. If substantially all of the plan’s participants are no longer actively accruing benefits, the average life expectancy is used.
Benefits provided to employees after employment but prior to retirement are accounted for under ASC 712, “Compensation—Nonretirement Postemployment Benefits” (“ASC 712”). Such postemployment benefits include severance and medical continuation benefits that are offered pursuant to an ongoing benefit arrangement and do not represent a one-time benefit termination arrangement. Under ASC 712, liabilities for postemployment benefits are recorded at the time the obligations are probable of being incurred and can be reasonably estimated. This is typically at the time a triggering event occurs, such as the decision by management to close a facility. Benefits related to the relocation of employees and certain other termination benefits are accounted for under ASC 420, “Exit or Disposal Cost Obligations,” and are expensed over the required service period.
Business Combinations
All business combinations are accounted for using the acquisition method as prescribed by ASC 805, “Business Combinations.” The purchase price paid is allocated to the assets acquired and liabilities assumed based on their estimated fair values. Any excess purchase price over the fair value of the net assets acquired is recorded as goodwill.
Discontinued Operations
In accordance with ASC 205-20, “Discontinued Operations,” a component of an entity that is disposed of or classified as held for sale is reported as a discontinued operation if the transaction represents a strategic shift that will have a major effect on an entity’s operations and financial results. The results of discontinued operations are aggregated and presented separately in the Consolidated Statements of Operations. Assets and liabilities of the discontinued operations are aggregated and reported separately as assets and liabilities of discontinued operations in the Consolidated Balance Sheet, including the comparative prior year period.
Amounts presented in discontinued operations have been derived from our consolidated financial statements and accounting records using the historical basis of assets and liabilities to be disposed and historical results of operations related to our recycling and specification alloys businesses and the extrusions business. The discontinued operations exclude general corporate allocations of certain functions historically provided by our corporate offices, such as accounting, treasury, tax, human resources, facility maintenance and other services. Interest costs have been excluded from discontinued operations except for the interest expense on the debt and capital leases that have been assumed by the buyers. See Note 17, “Discontinued Operations” for more information.
General Guarantees and Indemnifications
It is common in long-term processing agreements for us to agree to indemnify customers for tort liabilities that arise out of, or relate to, the processing of their material. Additionally, we typically indemnify such parties for certain environmental liabilities that arise out of or relate to the processing of their material.
In our equipment financing agreements, we typically indemnify the financing parties, trustees acting on their behalf and other related parties against liabilities that arise from the manufacture, design, ownership, financing, use, operation and maintenance of the equipment and for tort liability, whether or not these liabilities arise out of or relate to the negligence of these indemnified parties, except for their gross negligence or willful misconduct.
We expect that we would be covered by insurance (subject to deductibles) for most tort liabilities and related indemnities described above with respect to equipment we lease and material we process.
Although we cannot estimate the potential amount of future payments under the foregoing indemnities and agreements, we are not aware of any events or actions that will require payment.
81
ALERIS CORPORATION
NOTES TO CONSOLIDATED FINANCIAL STATEMENTS - (CONTINUED)
(dollars in millions, except share and per share data)
Recently Adopted and New Accounting Pronouncements
In March 2017, the Financial Accounting Standards Board (“FASB”) issued ASU No. 2017-07, “Improving the Presentation of Net Periodic Pension Cost and Net Periodic Postretirement Benefit Cost” (“ASU 2017-07”). This guidance requires the presentation of all components of net periodic benefit cost, other than service costs, outside of operating income. Only the service cost component will be included in operating income and eligible for capitalization in assets. The guidance is effective for the Company for fiscal years beginning after December 15, 2017, and will be applied retrospectively. We estimate that upon adoption, approximately $3.2 and $2.8 of pension and postretirement benefit expense will be reclassified from “Operating (loss) income” to “Other expense (income), net” in the Consolidated Statements of Operations for the years ended December 31, 2017 and 2016, respectively.
In November 2016, the FASB issued ASU No. 2016-18, “Restricted Cash” (“ASU 2016-18”). This guidance requires companies to show the changes in the total cash, cash equivalents and restricted cash in the statement of cash flows. We adopted ASU 2016-18 in the first quarter of 2017. The adoption of this guidance resulted in the updated presentation of restricted cash in our current period Consolidated Statements of Cash Flows. As there was no restricted cash in the prior years, the adoption of this guidance had no effect on the prior year presentation of cash flow.
In October 2016, the FASB issued ASU No. 2016-16, “Intra-Entity Transfers of Assets Other Than Inventory” (“ASU 2016-16”). This guidance requires companies to account for the income tax effects of intercompany transfers of assets other than inventory when the transfer occurs. The income tax effects of intercompany inventory transactions will continue to be deferred. We early adopted ASU 2016-16 in the first quarter of 2017. The impact of adopting this guidance on the Company’s consolidated financial statements resulted in credits to “Prepaid expenses and other current assets” and “Accumulated other comprehensive loss” of approximately $8.2 and $0.1, respectively, and debits to “Deferred income taxes” (assets) and “Retained (deficit) earnings” of approximately $3.6 and $4.7, respectively, as of the date of adoption.
In March 2016, the FASB issued ASU 2016-09. This guidance makes several modifications to the accounting for stock-based compensation, including forfeitures, employer tax withholding on stock-based compensation and the financial statement presentation of excess tax benefits or deficiencies. ASU 2016-09 also clarifies the statement of cash flows presentation for certain components of stock-based awards. We adopted ASU 2016-09 in the first quarter of 2017. The tax effects associated with stock-based compensation are now recorded through the income statement. Additionally, forfeitures are now recognized as they occur and the term of awards are calculated as the midpoint between the requisite service period and the contractual term of the award. Prior periods have not been adjusted.
In February 2016, the FASB issued ASU No. 2016-02, “Leases” (“ASU 2016-02”). This guidance requires lessees to put most leases on their balance sheets but recognize expense on the income statement in a manner similar to current guidance. The guidance is effective for the Company for fiscal years beginning after December 15, 2018, and a modified retrospective approach is required for leases that exist or are entered into after the beginning of the earliest comparative period in the financial statements. We are currently evaluating the impact the application of ASU 2016-02 will have on the Company’s consolidated financial statements. We expect that the adoption will result in an increase to our long-term assets and long-term liabilities as a result of substantially all operating leases existing as of the adoption date being capitalized along with the associated obligations.
In May 2014, the FASB issued ASU No. 2014-09, “Revenue from Contracts with Customers (Topic 606)” (“ASU 2014-09”), which was the result of a joint project by the FASB and International Accounting Standards Board to clarify the principles for recognizing revenue and to develop a common revenue standard for GAAP and International Financial Reporting Standards. Subsequent accounting standard updates have been issued which amend and/or clarify the application of ASU 2014-09. The issuance of a comprehensive and converged standard on revenue recognition is expected to enable financial statement users to better understand and consistently analyze an entity’s revenue across industries, transactions and geographies. The standard will require additional disclosures to help financial statement users better understand the nature, amount, timing, and potential uncertainty of the revenue that is recognized. Adoption of ASU 2014-09 will require either retrospective application to each prior reporting period presented or retrospective application with the cumulative effect of initially applying the standard recognized at the date of adoption (the “modified retrospective approach”). The Company adopted ASU 2014-09 on January 1, 2018 and has executed a project plan to guide the implementation of the standard. The project plan included analyzing the Company’s customer contracts, identifying revenue streams, drafting an updated accounting policy and evaluating new disclosure requirements. In addition, the Company is identifying and implementing appropriate changes to its business processes and controls to support recognition and disclosure under the new guidance. In evaluating the impact of the standard, management has concluded that control has transferred on some of the inventory held on consignment at customer locations or in third party warehouses. Subsequent to adoption of the standard, revenue will be recognized when such inventory is delivered into consignment. We adopted this standard using the modified retrospective approach and anticipate that the adoption will result in an increase to the revenue disclosures in our consolidated financial statements. The January 1, 2018
82
ALERIS CORPORATION
NOTES TO CONSOLIDATED FINANCIAL STATEMENTS - (CONTINUED)
(dollars in millions, except share and per share data)
adoption of the standard will result in an increase to accounts receivable, accrued liabilities and deferred income tax liabilities in a range of approximately $28.0 to $30.0, $1.0 to $2.0 and $1.0 to $2.0, respectively, and a decrease in inventory in a range of approximately $22.0 to $24.0. The net impact will be recorded as a decrease to retained deficit in a range of approximately $2.0 to $3.0.
3. RESTRUCTURING CHARGES
2017 Restructuring
During the year ended December 31, 2017, we recorded restructuring charges of $2.9 in the Consolidated Statements of Operations. These charges included $1.6 related to exit and environmental remediation costs of closed facilities within the North America segment. The charges also included $1.3 related to severance and other termination benefits associated with personnel reductions.
2016 Restructuring
During the year ended December 31, 2016, we recorded restructuring charges of $1.5 in the Consolidated Statements of Operations. These charges primarily related to exit and environmental remediation costs of closed facilities within the North America segment.
2015 Restructuring
During the year ended December 31, 2015, we recorded restructuring charges of $10.5, including $0.1 that have been reclassified to “Income (loss) from discontinued operations, net of tax” in the Consolidated Statements of Operations. These charges included $3.4 related to severance and other termination benefits associated with personnel reductions. The personnel reductions included charges of $1.1 related to the Europe segment, $0.5 related to the North America segment, and $1.8 related to our corporate locations. Cash payments associated with these personnel reductions are substantially complete at December 31, 2017 and no further charges are anticipated. The charges also included $6.6 of exit and environmental remediation costs of closed facilities, primarily within the North America segment.
4. INVENTORIES
The components of our “Inventories” as of December 31, 2017 and 2016 are as follows:
December 31, | |||||||
2017 | 2016 | ||||||
Raw materials | $ | 207.6 | $ | 181.7 | |||
Work in process | 210.8 | 195.4 | |||||
Finished goods | 181.6 | 134.0 | |||||
Supplies | 31.2 | 27.8 | |||||
Total inventories | $ | 631.2 | $ | 538.9 | |||
5. PROPERTY, PLANT AND EQUIPMENT
The components of our consolidated property, plant and equipment are as follows:
December 31, | |||||||
2017 | 2016 | ||||||
Land | $ | 93.6 | $ | 85.5 | |||
Buildings and improvements | 395.6 | 206.2 | |||||
Production equipment and machinery | 1,314.9 | 918.5 | |||||
Office furniture and computer software and equipment | 120.9 | 93.6 | |||||
Construction work-in-progress | 152.9 | 525.6 | |||||
Property, plant and equipment | 2,077.9 | 1,829.4 | |||||
Accumulated depreciation | (607.0 | ) | (483.4 | ) | |||
Property, plant and equipment, net | $ | 1,470.9 | $ | 1,346.0 | |||
Capital lease assets totaled $16.4 and $9.0 at December 31, 2017 and 2016, respectively. Accumulated amortization of capital lease assets totaled $7.2 and $4.5 at December 31, 2017 and 2016, respectively. Capital expenditures included in accounts payable totaled $20.4 and $18.0 at December 31, 2017 and 2016, respectively. Capital expenditures included in accrued liabilities totaled $42.6 and $70.1 at December 31, 2017 and 2016, respectively.
83
ALERIS CORPORATION
NOTES TO CONSOLIDATED FINANCIAL STATEMENTS - (CONTINUED)
(dollars in millions, except share and per share data)
Our depreciation expense, including amortization of capital lease assets, and repair and maintenance expense, was as follows:
For the years ended December 31, | |||||||||||
2017 | 2016 | 2015 | |||||||||
Depreciation expense included within selling, general and administrative (“SG&A”) expenses | $ | 8.2 | $ | 9.5 | $ | 17.7 | |||||
Depreciation expense included within cost of sales | 105.4 | 93.2 | 102.2 | ||||||||
Repair and maintenance expense included within loss from continuing operations | 95.5 | 93.1 | 89.4 | ||||||||
Repair and maintenance expense included within income (loss) from discontinued operations, net of tax | — | — | 8.1 | ||||||||
6. INTANGIBLE ASSETS
The following table details our intangible assets as of December 31, 2017 and 2016:
December 31, 2017 | December 31, 2016 | |||||||||||||||||||||||||
Gross | Gross | |||||||||||||||||||||||||
carrying | Accumulated | Net | Average | carrying | Accumulated | Net | ||||||||||||||||||||
amount | amortization | amount | life | amount | amortization | amount | ||||||||||||||||||||
Trade name | $ | 15.9 | $ | — | $ | 15.9 | Indefinite | $ | 15.9 | $ | — | $ | 15.9 | |||||||||||||
Technology | 5.9 | (1.8 | ) | 4.1 | 25 years | 5.9 | (1.6 | ) | 4.3 | |||||||||||||||||
Customer relationships | 28.3 | (13.6 | ) | 14.7 | 15 years | 28.3 | (11.7 | ) | 16.6 | |||||||||||||||||
Total | $ | 50.1 | $ | (15.4 | ) | $ | 34.7 | 17 years | $ | 50.1 | $ | (13.3 | ) | $ | 36.8 | |||||||||||
The following table presents amortization expense, which has been classified within “Selling, general and administrative expenses” in the Consolidated Statements of Operations:
For the years ended December 31, | ||||||||||||
2017 | 2016 | 2015 | ||||||||||
Amortization expense | $ | 2.1 | $ | 2.1 | $ | 3.9 | ||||||
The following table presents estimated amortization expense for the next five years:
2018 | $ | 2.1 | |
2019 | 2.1 | ||
2020 | 2.1 | ||
2021 | 2.1 | ||
2022 | 2.1 | ||
Total | $ | 10.5 | |
7. ACCRUED AND OTHER LONG-TERM LIABILITIES
Accrued liabilities at December 31, 2017 and 2016 consisted of the following:
December 31, | |||||||
2017 | 2016 | ||||||
Employee-related costs | $ | 64.7 | $ | 50.7 | |||
Accrued capital expenditures | 42.6 | 70.1 | |||||
Accrued interest | 26.9 | 20.6 | |||||
Accrued taxes | 16.9 | 10.3 | |||||
Derivative financial instruments | 9.0 | 6.9 | |||||
Accrued professional fees | 7.8 | 8.0 | |||||
Deferred revenue | 3.0 | — | |||||
Other liabilities | 26.5 | 34.8 | |||||
Total accrued liabilities | $ | 197.4 | $ | 201.4 | |||
84
ALERIS CORPORATION
NOTES TO CONSOLIDATED FINANCIAL STATEMENTS - (CONTINUED)
(dollars in millions, except share and per share data)
Other long-term liabilities at December 31, 2017 and 2016 consisted of the following:
December 31, | |||||||
2017 | 2016 | ||||||
Accrued environmental and ARO liabilities | $ | 24.3 | $ | 24.1 | |||
Deferred revenue | 17.0 | 20.0 | |||||
Employee-related costs | 18.2 | 12.4 | |||||
Other long-term liabilities | 6.6 | 7.2 | |||||
Total other long-term liabilities | $ | 66.1 | $ | 63.7 | |||
8. ASSET RETIREMENT OBLIGATIONS
Our asset retirement obligations consist of legal obligations associated with costs to remove asbestos and underground storage tanks and other legal or contractual obligations associated with the ultimate closure of our manufacturing facilities.
The changes in the carrying amount of asset retirement obligations for the years ended December 31, 2017, 2016 and 2015 are as follows:
For the years ended December 31, | ||||||||||||
2017 | 2016 | 2015 | ||||||||||
Balance at the beginning of the period | $ | 4.7 | $ | 4.6 | $ | 13.0 | ||||||
Revisions and liabilities incurred | 1.2 | — | 0.1 | |||||||||
Accretion expense | 0.1 | 0.1 | 0.1 | |||||||||
Payments | — | (0.1 | ) | (0.6 | ) | |||||||
Divestitures | — | — | (7.9 | ) | ||||||||
Translation and other charges | 0.1 | 0.1 | (0.1 | ) | ||||||||
Balance at the end of the period | $ | 6.1 | $ | 4.7 | $ | 4.6 | ||||||
9. LONG-TERM DEBT
Our debt is summarized as follows:
December 31, | |||||||
2017 | 2016 | ||||||
ABL Facility | $ | 319.3 | $ | 255.3 | |||
7 7/8% Senior Notes due 2020, net of discount and deferred issuance costs of $3.3 and $4.5 at December 31, 2017 and December 31, 2016, respectively | 436.7 | 435.5 | |||||
9 1/2% Senior Secured Notes due 2021, inclusive of net premiums and deferred issuance costs of $0.8 at December 31, 2017 and net of discount and deferred issuance costs of $11.6 at December 31, 2016 | 800.8 | 538.4 | |||||
Exchangeable Notes, net of discount of $0.3 and $0.4 at December 31, 2017 and December 31, 2016, respectively | 44.5 | 44.4 | |||||
Zhenjiang Term Loans, net of discount of $0.5 at December 31, 2017 and December 31, 2016 | 169.8 | 164.5 | |||||
Zhenjiang Revolver, net of discount of $0.1 at December 31, 2016 | — | 22.0 | |||||
Other | 9.4 | 6.1 | |||||
Total debt | 1,780.5 | 1,466.2 | |||||
Less: Current portion of long-term debt | 9.1 | 27.7 | |||||
Total long-term debt | $ | 1,771.4 | $ | 1,438.5 | |||
85
ALERIS CORPORATION
NOTES TO CONSOLIDATED FINANCIAL STATEMENTS - (CONTINUED)
(dollars in millions, except share and per share data)
Maturities of Debt
Scheduled maturities of our debt and capital leases subsequent to December 31, 2017 are as follows:
Debt | Capital leases | ||||||
2018 | $ | 5.5 | $ | 3.5 | |||
2019 | 7.4 | 3.1 | |||||
2020 | 822.6 | 1.7 | |||||
2021 | 827.6 | 0.7 | |||||
2022 | 36.9 | 0.2 | |||||
After 2022 | 74.5 | 0.2 | |||||
Total | $ | 1,774.5 | $ | 9.4 | |||
ABL Facility
On June 15, 2015, Aleris International entered into a credit agreement, as amended and supplemented from time to time, providing for a $600.0 asset-based revolving credit facility (the “ABL Facility”) which permits multi-currency borrowings up to $600.0 by Aleris International and its U.S. subsidiaries and up to a combined $300.0 by Aleris Switzerland GmbH, a wholly owned Swiss subsidiary, Aleris Aluminum Duffel BVBA, a wholly owned Belgian subsidiary, Aleris Rolled Products Germany GmbH, a wholly owned German subsidiary and, upon its accession to the credit agreement, Aleris Casthouse Germany GmbH, a wholly owned German subsidiary (but limited to $600.0 in total). The availability of funds to the borrowers located in each jurisdiction is subject to a borrowing base for that jurisdiction and the jurisdictions in which certain subsidiaries of such borrowers are located. The ABL Facility contains, in the aggregate, a $45.0 sublimit for swingline loans and also provides for the issuance of up to $125.0 of letters of credit. The credit agreement provides that commitments under the ABL Facility may be increased at any time by an additional $300.0, subject to certain conditions. As of December 31, 2017, we estimate that we could have borrowed approximately $483.0 on the ABL Facility. After giving effect to outstanding borrowings of $319.3 and outstanding letters of credit of $40.3, Aleris International had $123.4 available for borrowing under the ABL Facility as of December 31, 2017.
Borrowings under the ABL Facility bear interest at rates equal to the following:
▪ | in the case of borrowings in U.S. dollars, (a) a LIBOR determined by reference to the offered rate for deposits in dollars for the interest period relevant to such borrowing (the “Eurodollar Rate”), plus an applicable margin ranging from 1.50% to 2.00% based on availability under the ABL Facility or (b) a base rate determined by reference to the higher of (1) JPMorgan Chase Bank, N.A.’s prime lending rate and (2) the one month Eurodollar Rate, plus an applicable margin ranging from 0.50% to 1.00% based on excess availability under the ABL Facility; |
▪ | in the case of borrowings in euros, a EURIBOR determined by the administrative agent plus an applicable margin ranging from 1.50% to 2.00% based on excess availability under the ABL Facility; and |
▪ | in the case of borrowings in Sterling, a LIBOR determined by reference to the offered rate for deposits in Sterling for the interest period relevant to such borrowing, plus an applicable margin ranging from 1.50% to 2.00% based on excess availability under the ABL Facility. |
In addition to paying interest on any outstanding principal under the ABL Facility, Aleris International is required to pay a commitment fee in respect of unutilized commitments ranging from 0.250% to 0.375% based on average utilization for the applicable period. Aleris International must also pay customary letter of credit fees and agency fees.
The ABL Facility is subject to mandatory prepayment with (i) 100% of the net cash proceeds of certain asset sales and casualty proceeds relating to the collateral for the ABL Facility under certain circumstances, and (ii) 100% of the net cash proceeds from issuance of debt, other than debt permitted under the ABL Facility.
In addition, if at any time outstanding loans, unreimbursed letter of credit drawings and undrawn letters of credit under the ABL Facility exceed the applicable borrowing base in effect at such time, Aleris International is required to repay outstanding loans or cash collateralize letters of credit in an aggregate amount equal to such excess, with no reduction of the commitment amount.
There is no scheduled amortization under the ABL Facility. The principal amount outstanding will be due and payable in full on June 15, 2020. However, an early maturity provision would be triggered 60 days prior to the stated maturity of Aleris International’s 7 7/8% Senior Notes (as defined below) unless less than $10.0 of the applicable Senior Notes remain outstanding and more than $100.0 is available under the ABL Facility.
86
ALERIS CORPORATION
NOTES TO CONSOLIDATED FINANCIAL STATEMENTS - (CONTINUED)
(dollars in millions, except share and per share data)
Aleris International may voluntarily reduce the unutilized portion of the commitment amount and repay outstanding loans at any time upon three business days’ prior written notice without premium or penalty other than customary “breakage” costs with respect to Eurodollar Rate loans, Sterling LIBOR loans and EURIBOR loans.
The credit agreement governing the ABL Facility contains a number of covenants that, subject to certain exceptions, impose restrictions on Aleris International and certain of its subsidiaries, including, without limitation, restrictions on its ability to, among other things:
▪ | incur additional debt; |
▪ | create liens; |
▪ | merge, consolidate or sell assets; |
▪ | make investments, loans and acquisitions; |
▪ | pay dividends and make certain payments; or |
▪ | enter into affiliate transactions. |
Although the credit agreement governing the ABL Facility generally does not require us to comply with any financial ratio maintenance covenants, if combined availability is less than the greater of (a) 10% of the lesser of the combined borrowing base and the combined commitments and (b) $40.0, a minimum fixed charge coverage ratio (as defined in the credit agreement) of at least 1.0 to 1.0 will apply. The credit agreement also contains certain customary affirmative covenants and events of default. Aleris International was in compliance with all of the covenants set forth in the credit agreement as of December 31, 2017.
The ABL Facility is secured, subject to certain exceptions, by a first-priority security interest in substantially all of Aleris International’s current assets and related intangible assets located in the U.S. and substantially all of the current assets and related intangible assets of substantially all of its wholly owned U.S. subsidiaries under a pledge and security agreement, in each case, excluding Notes Collateral (as defined below). The obligations of the Swiss borrower, the Belgian borrower and the German borrowers are secured by their respective current assets and related intangible assets, if any.
9½% Senior Secured Notes due 2021
On April 4, 2016, Aleris International issued $550.0 aggregate principal amount of its 9½% Senior Secured Notes due 2021 (together with the $250.0 of additional notes described below, the “9½% Senior Secured Notes”) and related guarantees in a private offering under Rule 144A and Regulation S of the Securities Act of 1933, as amended. The 9½% Senior Secured Notes were issued under an indenture (as amended and supplemented from time to time, the “9½% Senior Secured Notes Indenture”), dated as of April 4, 2016, among Aleris International, the guarantors named therein and U.S. Bank National Association, as trustee and collateral agent. Net proceeds from the offering were $540.4, prior to the Tender Offer (as defined below).
On February 14, 2017, Aleris International issued an additional $250.0 aggregate principal amount of its 9½% Senior Secured Notes, pursuant to the 9½% Senior Secured Notes Indenture. Net proceeds from the offering were $263.8, prior to fees and expenses. The Company used the net proceeds for general corporate purposes, which included working capital and capital expenditures. These additional notes, together with the initial notes, are treated as a single series of debt securities for all purposes under the 9½% Senior Secured Notes Indenture, including, without limitation, waivers, amendments, redemptions and offers to purchase. As of December 31, 2017, Aleris International had $800.0 aggregate principal amount outstanding on the 9½% Senior Secured Notes. Interest on the 9½% Senior Secured Notes is payable semi-annually in arrears on April 1 and October 1 of each year. The 9½% Senior Secured Notes mature on April 1, 2021.
The 9½% Senior Secured Notes are jointly and severally, irrevocably and unconditionally guaranteed on a senior secured basis, by us and each restricted subsidiary that is a domestic subsidiary and that guarantees Aleris International’s obligations under the ABL Facility, as primary obligor and not merely as surety. The 9½% Senior Secured Notes and the guarantees thereof are Aleris International’s secured senior obligations and rank (i) equally in right of payment to all of Aleris International’s existing and future debt and other obligations that are not, by their terms, expressly subordinated in right of payment to the 9½% Senior Secured Notes (including the 7 7/8% Senior Notes); (ii) effectively subordinated in right of payment to any borrowings under the ABL Facility, to the extent of the value of the assets securing such debt; (iii) effectively senior in right of payment to all of Aleris International’s existing and future debt that is not secured by the Notes Collateral, to the extent of the value of the Notes Collateral; (iv) structurally subordinated to all existing and future debt and other obligations, including trade payables, of each of our subsidiaries that is not a guarantor of the 9½% Senior Secured Notes; and (v) senior in right of payment to Aleris International’s existing and future debt and other obligations that are, by their terms, expressly subordinated in right of payment to the 9½% Senior Secured Notes (including Aleris International’s Exchangeable Notes (as defined below)).
87
ALERIS CORPORATION
NOTES TO CONSOLIDATED FINANCIAL STATEMENTS - (CONTINUED)
(dollars in millions, except share and per share data)
Aleris International is not required to make any mandatory redemption or sinking fund payments with respect to the 9½% Senior Secured Notes, but under certain circumstances, it may be required to offer to purchase the 9½% Senior Secured Notes as described below. Aleris International may from time to time acquire 9½% Senior Secured Notes by means other than redemption, whether by tender offer, in open market purchases, through negotiated transactions or otherwise, in accordance with applicable securities laws.
The 9½% Senior Secured Notes are secured by a first-priority lien on substantially all of Aleris International’s and the guarantors’ owned and material U.S. real property, equipment and intellectual property and stock of Aleris International and the guarantors (other than Aleris Corporation) and other subsidiaries (including 100% of the outstanding non-voting stock (if any) and 65% of the outstanding voting stock of certain “first-tier” foreign subsidiaries and certain “first-tier” foreign subsidiary holding companies) (the “Notes Collateral”), but subject to permitted liens and excluding (i) inventory, accounts receivable, deposit accounts and related assets, which assets secure the ABL Facility on a first-priority basis, (ii) the assets associated with our Lewisport, Kentucky facility and (iii) certain other excluded assets.
From and after April 1, 2018, Aleris International may redeem the 9½% Senior Secured Notes, in whole or in part, upon not less than 30 nor more than 60 days’ prior notice, at a redemption price equal to 104.8% of the principal amount of the 9½% Senior Secured Notes, declining ratably to 100% of the principal amount on April 1, 2020, plus accrued and unpaid interest, if any, to the redemption date. Prior to April 1, 2018, Aleris International may redeem up to 40% of the aggregate principal amount of the 9½% Senior Secured Notes with funds in an amount equal to all or a portion of the net cash proceeds from certain equity offerings at a redemption price of 109.5%, plus accrued and unpaid interest, if any, to the redemption date. Aleris International may make such redemption so long as, immediately after the occurrence of any such redemption, at least 60% of the aggregate principal amount of the 9½% Senior Secured Notes remains outstanding and such redemption occurs within 180 days of the closing of the applicable equity offering. Additionally, at any time prior to April 1, 2018, Aleris International may redeem some or all of the 9½% Senior Secured Notes at a redemption price equal to 100.0% of the principal amount of the 9½% Senior Secured Notes, plus the applicable premium as provided in the 9½% Senior Secured Notes Indenture and accrued and unpaid interest, if any, to the redemption date.
If Aleris International experiences a “change of control” as specified in the 9½% Senior Secured Notes Indenture, Aleris International must offer to purchase all of the 9½% Senior Secured Notes at a price equal to 101.0% of the principal amount of the 9½% Senior Secured Notes, plus accrued and unpaid interest, if any, to the date of purchase. In addition, if Aleris International or its restricted subsidiaries engage in certain asset sales or experience certain events of loss with respect to the Notes Collateral and do not invest the cash proceeds from such sales or events of loss or permanently reduce certain debt within a specified period of time, subject to certain exceptions, Aleris International will be required to use a portion of the proceeds of such asset sales or events of loss, as the case may be, to make an offer to purchase a principal amount of the 9½% Senior Secured Notes at a price of 100% of the principal amount of the 9½% Senior Secured Notes, plus accrued and unpaid interest, if any, to the date of purchase.
The 9½% Senior Secured Notes Indenture contains covenants limiting the ability of Aleris International and its restricted subsidiaries to, among other things:
▪ | incur additional debt; |
▪ | pay dividends or distributions on Aleris International’s capital stock or redeem, repurchase or retire Aleris International’s capital stock or subordinated debt; |
▪ | issue preferred stock of restricted subsidiaries; |
▪ | make certain investments; |
▪ | create liens on Aleris International’s or its subsidiary guarantors’ assets to secure debt; |
▪ | enter into sale and leaseback transactions; |
▪ | create restrictions on the payment of dividends or other amounts to Aleris International from Aleris International’s restricted subsidiaries that are not guarantors of the 9½% Senior Secured Notes; |
▪ | enter into transactions with affiliates; |
▪ | merge or consolidate with another company; and |
▪ | sell assets, including capital stock of Aleris International’s subsidiaries. |
These covenants are subject to a number of important limitations and exceptions.
The 9½% Senior Notes Indenture also provides for events of default, which, if any of them occurs, would permit or require the principal, premium, if any, interest and any other monetary obligations on all outstanding 9½% Senior Notes to be due and payable immediately.
88
ALERIS CORPORATION
NOTES TO CONSOLIDATED FINANCIAL STATEMENTS - (CONTINUED)
(dollars in millions, except share and per share data)
Aleris International was in compliance with all covenants set forth in the 9½% Senior Secured Notes Indenture as of December 31, 2017.
7 7/8% Senior Notes due 2020
On October 23, 2012, Aleris International issued $500.0 aggregate original principal amount of its 7 7/8% Senior Notes due 2020 and related guarantees under an indenture (as amended and supplemented from time to time, the “7 7/8% Senior Notes Indenture”) dated as of October 23, 2012, among Aleris International, the guarantors named therein and U.S. Bank National Association, as trustee, and on January 31, 2013, Aleris International exchanged the $500.0 million aggregate original principal amount of 7 7/8% Senior Notes due 2020 for $500.0 million of its new 7 7/8% Senior Notes due 2020 that have been registered under the Securities Act of 1933, as amended (the “7 7/8% Senior Notes” and, together with the 9½% Senior Secured Notes, the “Senior Notes”). On September 8, 2015, Aleris International purchased $59.9 aggregate principal amount of the 7 7/8% Senior Notes pursuant to an asset sale offer. As of December 31, 2017, Aleris International had $440.1 aggregate principal amount outstanding on the 7 7/8% Senior Notes. Interest on the 7 7/8% Senior Notes is payable in cash semi-annually in arrears on May 1st and November 1st of each year. The 7 7/8% Senior Notes mature on November 1, 2020.
The 7 7/8% Senior Notes are jointly and severally, irrevocably and unconditionally guaranteed on a senior unsecured basis, by us and each restricted subsidiary that is a domestic subsidiary and that guarantees Aleris International’s obligations under the ABL Facility, as primary obligor and not merely as surety. The 7 7/8% Senior Notes and the guarantees thereof are our unsecured senior obligations and rank (i) equally in right of payment to all of Aleris International’s existing and future debt and other obligations that are not, by their terms, expressly subordinated in right of payment to the 7 7/8% Senior Notes (including the 9½% Senior Secured Notes); (ii) effectively subordinated in right of payment to all of Aleris International’s existing and future secured debt (including any borrowings under the ABL Facility and the 9½% Senior Secured Notes), to the extent of the value of the assets securing such debt; (iii) structurally subordinated to all existing and future debt and other obligations, including trade payables, of each of our subsidiaries that is not a guarantor of the 7 7/8% Senior Notes; and (iv) senior in right of payment to Aleris International’s existing and future debt and other obligations that are, by their terms, expressly subordinated in right of payment to the 7 7/8% Senior Notes (including Aleris International’s Exchangeable Notes).
Aleris International is not required to make any mandatory redemption or sinking fund payments with respect to the 7 7/8% Senior Notes, but under certain circumstances, it may be required to offer to purchase the 7 7/8% Senior Notes as described below. Aleris International may from time to time acquire 7 7/8% Senior Notes by means other than redemption, whether by tender offer, in open market purchases, through negotiated transactions or otherwise, in accordance with applicable securities laws.
Aleris International may redeem the 7 7/8% Senior Notes, in whole or in part, upon not less than 30 nor more than 60 days’ prior notice, at a redemption price equal to 102.0% of the principal amount, declining annually to 100.0% of the principal amount on November 1, 2018, plus accrued and unpaid interest, if any, to the applicable redemption date.
If Aleris International experiences a “change of control” as specified in the 7 7/8% Senior Notes Indenture, Aleris International must offer to purchase all of the 7 7/8% Senior Notes at a price equal to 101.0% of the principal amount of the 7 7/8% Senior Notes, plus accrued and unpaid interest, if any, to the date of purchase. In addition, if Aleris International or its restricted subsidiaries engage in certain asset sales and do not invest the cash proceeds from such sales or permanently reduce certain debt within a specified period of time, subject to certain exceptions, Aleris International will be required to use a portion of the proceeds of such asset sales to make an offer to purchase a principal amount of the 7 7/8% Senior Notes at a price of 100.0% of the principal amount of the 7 7/8% Senior Notes, plus accrued and unpaid interest, if any, to the date of purchase.
The 7 7/8% Senior Notes Indenture contains covenants that limit Aleris International’s ability and its restricted subsidiaries’ ability to:
▪ | incur additional debt; |
▪ | pay dividends or distributions on capital stock or redeem, repurchase or retire capital stock or subordinated debt; |
▪ | issue preferred stock of restricted subsidiaries; |
▪ | make certain investments; |
▪ | create liens on its or its subsidiary guarantors’ assets to secure debt; |
▪ | enter into sale and leaseback transactions; |
▪ | create restrictions on the payments of dividends or other amounts to Aleris International from the restricted subsidiaries that are not guarantors of the 7 7/8% Senior Notes; |
▪ | enter into transactions with affiliates; |
▪ | merge or consolidate with another company; and |
▪ | sell assets, including capital stock of Aleris International’s subsidiaries. |
89
ALERIS CORPORATION
NOTES TO CONSOLIDATED FINANCIAL STATEMENTS - (CONTINUED)
(dollars in millions, except share and per share data)
These covenants are subject to a number of important limitations and exceptions.
The 7 7/8% Senior Notes Indenture also provides for events of default, which, if any of them occurs, would permit or require the principal, premium, if any, interest and any other monetary obligations on all outstanding 7 7/8% Senior Notes to be due and payable immediately.
Aleris International was in compliance with all covenants set forth in the 7 7/8% Indenture as of December 31, 2017.
Exchangeable Notes
On June 1, 2010, Aleris International issued $45.0 aggregate principal amount of 6.0% senior subordinated exchangeable notes (the “Exchangeable Notes”). The Exchangeable Notes are scheduled to mature on June 1, 2020. The Exchangeable Notes have exchange rights at the holder’s option and are exchangeable at any time for our common stock at a rate equivalent to 59.63 shares of our common stock per $1,000 principal amount of the Exchangeable Notes (after adjustment for the payments of dividends in 2011 and 2013), subject to further adjustment. The Exchangeable Notes may currently be redeemed at Aleris International’s option at specified redemption prices.
The Exchangeable Notes are the unsecured, senior subordinated obligations of Aleris International and rank (i) junior to all of its existing and future senior indebtedness, including the ABL Facility and Senior Notes; (ii) equally to all of its existing and future senior subordinated indebtedness; and (iii) senior to all of its existing and future subordinated indebtedness.
China Loan Facility
Aleris Aluminum (Zhenjiang) Co., Ltd. (“Aleris Zhenjiang”) maintains a loan agreement comprised of non-recourse multi-currency secured term loan facilities and a revolving facility (collectively, as amended and supplemented from time to time the “China Loan Facility”). The China Loan Facility consists of a $30.6 U.S. dollar term loan facility, an RMB 873.8 million (or equivalent to approximately $134.2 as of December 31, 2017) term loan facility (collectively referred to as the “Zhenjiang Term Loans”) and an RMB 410.0 million (or equivalent to approximately $63.0 as of December 31, 2017) revolving facility (referred to as the “Zhenjiang Revolver”). The Zhenjiang Revolver has certain restrictions that have limited our ability to borrow funds on the Zhenjiang Revolver and will continue to limit our ability to borrow funds in the future. Although the final maturity date for all borrowings under the Zhenjiang Revolver is May 18, 2021, all amounts outstanding under the Zhenjiang Revolver were repaid in 2017. The interest rate on the U.S. dollar term facility is six month U.S. dollar LIBOR plus 5.0% and the interest rate on the RMB term facility and the Zhenjiang Revolver is 110% of the base rate applicable to any loan denominated in RMB of the same tenor, as announced by the People’s Bank of China. As of December 31, 2017 and 2016, $170.3 and $165.0, respectively, was outstanding on the Zhenjiang Term Loans. Aleris Zhenjiang and the lenders under the China Loan Facility entered into agreements in December 2016 to, among other things, extend the maturity date, amend the repayment terms under the Zhenjiang Term Loans and secure obligations under the Zhenjiang Term Loans. The lenders agreed to extend the final maturity date for all borrowings under the Zhenjiang Term Loans from May 18, 2021 to May 16, 2024. The repayment of borrowings under the Zhenjiang Term Loans is due semi-annually. The initial repayment began in 2016. The semi-annual repayment in 2018 will be RMB 18.0 million (or equivalent to approximately $2.8 at December 31, 2017) and will increase to RMB 247.3 million by 2024 (or equivalent to approximately $38.0 at December 31, 2017).
The China Loan Facility contains certain customary covenants and events of default. The China Loan Facility requires Aleris Zhenjiang to, among other things, maintain a certain ratio of outstanding term loans to invested equity capital. In addition, among other things and subject to certain exceptions, Aleris Zhenjiang is restricted in its ability to:
▪ | repay loans extended by the shareholder of Aleris Zhenjiang prior to repaying loans under the China Loan Facility or make the China Loan Facility junior to any other debts incurred of the same class for the project; |
▪ | distribute any dividend or bonus to the shareholder of Aleris Zhenjiang before fully repaying the loans under the China Loan Facility; |
▪ | dispose of any assets in a manner that will materially impair its ability to repay debts; |
▪ | provide guarantees to third parties above a certain threshold that use assets that are financed by the China Loan Facility; |
▪ | permit any individual investor or key management personnel changes that result in a material adverse effect; |
▪ | use any proceeds from the China Loan Facility for any purpose other than as set forth therein; and |
▪ | enter into additional financing to expand or increase the production capacity of the project. |
90
ALERIS CORPORATION
NOTES TO CONSOLIDATED FINANCIAL STATEMENTS - (CONTINUED)
(dollars in millions, except share and per share data)
Aleris Zhenjiang was in compliance with all of the covenants set forth in the China Loan Facility as of December 31, 2017. Aleris Zhenjiang has had delays in its ability to make timely draws of amounts committed under the China Loan Facility in the past and we cannot be certain that Aleris Zhenjiang will be able to draw all amounts committed under the Zhenjiang Revolver in the future or as to the timing or cost of any such draws.
10. EMPLOYEE BENEFIT PLANS
Defined Contribution Pension Plans
The Company’s defined contribution plans cover substantially all U.S. employees not covered under collective bargaining agreements and certain employees covered by collective bargaining agreements. The plans provide both profit sharing and employer matching contributions as well as an age and salary based contribution.
Our match of employees’ contributions under our defined contribution plans and supplemental employer contributions for the years ended December 31, 2017, 2016 and 2015 were as follows:
For the years ended December 31, | ||||||||||||
2017 | 2016 | 2015 | ||||||||||
Company match of employee contributions | $ | 5.4 | $ | 5.2 | $ | 5.0 | ||||||
Supplemental employer contributions | 1.3 | 1.3 | 1.5 | |||||||||
Defined Benefit Pension Plans
Our U.S. defined benefit pension plans cover certain salaried and non-salaried employees at our corporate headquarters and within our North America segment. The plan benefits are based on age, years of service and employees’ eligible compensation during employment for all employees not covered under a collective bargaining agreement and on stated amounts based on job grade and years of service prior to retirement for non-salaried employees covered under a collective bargaining agreement.
Our non-U.S. subsidiaries sponsor various defined benefit pension plans for their employees. These plans are based on final pay and service, but some senior officers are entitled to receive enhanced pension benefits. Benefit payments are typically financed, in part, by contributions to a relief fund which establishes a life insurance contract to secure future pension payments; however, the plans are substantially unfunded plans under local law. The unfunded accrued pension costs are typically covered under a pension insurance association under local law if we are unable to fulfill our obligations.
The components of the net periodic benefit expense for the years ended December 31, 2017, 2016 and 2015 are as follows:
U.S. Pension Benefits | ||||||||||||
For the years ended December 31, | ||||||||||||
2017 | 2016 | 2015 | ||||||||||
Service cost | $ | 3.9 | $ | 3.7 | $ | 3.8 | ||||||
Interest cost | 5.8 | 6.0 | 7.1 | |||||||||
Amortization of net loss | 1.9 | 1.9 | 1.9 | |||||||||
Amortization of prior service cost | 0.2 | 0.2 | 0.2 | |||||||||
Expected return on plan assets | (10.2 | ) | (10.0 | ) | (10.8 | ) | ||||||
Net periodic benefit cost | $ | 1.6 | $ | 1.8 | $ | 2.2 | ||||||
Non-U.S. Pension Benefits | ||||||||||||
For the years ended December 31, | ||||||||||||
2017 | 2016 | 2015 | ||||||||||
Service cost | $ | 2.5 | $ | 2.0 | $ | 2.9 | ||||||
Interest cost | 1.8 | 2.1 | 2.8 | |||||||||
Amortization of net loss | 3.0 | 1.6 | 3.0 | |||||||||
Net periodic benefit cost | 7.3 | 5.7 | 8.7 | |||||||||
Net periodic benefit cost reclassified to income from discontinued operations | — | — | (1.2 | ) | ||||||||
Net periodic benefit cost included in continuing operations | $ | 7.3 | $ | 5.7 | $ | 7.5 | ||||||
91
ALERIS CORPORATION
NOTES TO CONSOLIDATED FINANCIAL STATEMENTS - (CONTINUED)
(dollars in millions, except share and per share data)
The changes in projected benefit obligations and plan assets during the years ended December 31, 2017 and 2016 are as follows:
U.S. Pension Benefits | Non-U.S. Pension Benefits | |||||||||||||||
For the years ended December 31, | For the years ended December 31, | |||||||||||||||
2017 | 2016 | 2017 | 2016 | |||||||||||||
Change in projected benefit obligations | ||||||||||||||||
Projected benefit obligation at beginning of period | $ | 180.6 | $ | 181.3 | $ | 118.9 | $ | 102.8 | ||||||||
Service cost | 3.9 | 3.7 | 2.5 | 2.0 | ||||||||||||
Interest cost | 5.8 | 6.0 | 1.8 | 2.1 | ||||||||||||
Actuarial loss (gain) | 11.2 | 1.5 | (3.7 | ) | 20.0 | |||||||||||
Expenses paid | (1.8 | ) | (1.7 | ) | — | — | ||||||||||
Benefits paid | (10.9 | ) | (10.2 | ) | (4.2 | ) | (3.4 | ) | ||||||||
Translation and other | — | — | 15.0 | (4.6 | ) | |||||||||||
Projected benefit obligation at end of period | $ | 188.8 | $ | 180.6 | $ | 130.3 | $ | 118.9 | ||||||||
Change in plan assets | ||||||||||||||||
Fair value of plan assets at beginning of period | $ | 136.1 | $ | 130.7 | $ | 1.3 | $ | 0.9 | ||||||||
Employer contributions | 1.2 | 8.0 | 4.0 | 3.5 | ||||||||||||
Actual return on plan assets | 19.0 | 9.3 | 0.1 | 0.3 | ||||||||||||
Expenses paid | (1.8 | ) | (1.7 | ) | — | — | ||||||||||
Benefits paid | (10.9 | ) | (10.2 | ) | (4.2 | ) | (3.4 | ) | ||||||||
Translation and other | — | — | 0.1 | — | ||||||||||||
Fair value of plan assets at end of period | $ | 143.6 | $ | 136.1 | $ | 1.3 | $ | 1.3 | ||||||||
Net amount recognized | $ | (45.2 | ) | $ | (44.5 | ) | $ | (129.0 | ) | $ | (117.6 | ) | ||||
92
ALERIS CORPORATION
NOTES TO CONSOLIDATED FINANCIAL STATEMENTS - (CONTINUED)
(dollars in millions, except share and per share data)
The following table provides the amounts recognized in the Consolidated Balance Sheet as of December 31, 2017 and 2016:
U.S. Pension Benefits | Non-U.S. Pension Benefits | |||||||||||||||
December 31, | December 31, | |||||||||||||||
2017 | 2016 | 2017 | 2016 | |||||||||||||
Accrued liabilities | $ | — | $ | — | $ | (4.0 | ) | $ | (3.3 | ) | ||||||
Accrued pension benefits | (45.2 | ) | (44.5 | ) | (125.0 | ) | (114.3 | ) | ||||||||
Net amount recognized | $ | (45.2 | ) | $ | (44.5 | ) | $ | (129.0 | ) | $ | (117.6 | ) | ||||
Amounts recognized in accumulated other comprehensive loss (before tax) consist of: | ||||||||||||||||
Net actuarial loss | $ | 37.7 | $ | 37.2 | $ | 44.7 | $ | 46.7 | ||||||||
Net prior service cost | 1.6 | 1.8 | — | — | ||||||||||||
$ | 39.3 | $ | 39.0 | $ | 44.7 | $ | 46.7 | |||||||||
Amortization expected to be recognized during next fiscal year (before tax): | ||||||||||||||||
Amortization of net actuarial loss | $ | (1.9 | ) | $ | (2.8 | ) | ||||||||||
Amortization of net prior service cost | (0.2 | ) | — | |||||||||||||
$ | (2.1 | ) | $ | (2.8 | ) | |||||||||||
Additional Information | ||||||||||||||||
Accumulated benefit obligation for all defined benefit pension plans | $ | 188.4 | $ | 180.6 | $ | 127.3 | $ | 115.3 | ||||||||
For defined benefit pension plans with projected benefit obligations in excess of plan assets: | ||||||||||||||||
Aggregate projected benefit obligation | 188.9 | 180.6 | 130.4 | 117.8 | ||||||||||||
Aggregate fair value of plan assets | 143.7 | 136.1 | 1.4 | 1.3 | ||||||||||||
For defined benefit pension plans with accumulated benefit obligations in excess of plan assets: | ||||||||||||||||
Aggregate accumulated benefit obligation | 188.4 | 180.6 | 126.1 | 115.3 | ||||||||||||
Aggregate fair value of plan assets | 143.7 | 136.1 | — | 1.3 | ||||||||||||
Projected employer contributions for 2018 | 7.3 | 4.1 | ||||||||||||||
Plan Assumptions. We are required to make assumptions regarding such variables as the expected long-term rate of return on plan assets and the discount rate applied to determine service cost and interest cost. Our objective in selecting a discount rate is to select the best estimate of the rate at which the benefit obligations could be effectively settled. In making this estimate, projected cash flows are developed and matched with a yield curve based on an appropriate universe of high-quality corporate bonds. Through the year ended December 31, 2015, we used a single weighted-average discount rate approach to develop the interest and service cost components of the net periodic benefit costs. This method represented the constant annual rate that would be required to discount all future benefit payments related to past service from the date of expected future payment to the measurement date such that the aggregate present value equals the obligation. During the fourth quarter of 2015, we updated the method previously used for substantially all of our pension plans. Beginning with our 2016 fiscal year, we used an approach that discounts the individual expected cash flows underlying interest and service costs using the applicable spot rates derived from the yield curve used to determine the benefit obligation to the relevant projected cash flows. The election and adoption of this method provides a more precise measurement of service and interest costs by improving the correlation between projected benefit cash flows and the corresponding spot yield curve rates.
Assumptions for long-term rates of return on plan assets are based upon historical returns, future expectations for returns for each asset class and the effect of periodic target asset allocation rebalancing. The results are adjusted for the payment of reasonable expenses of the plan from plan assets. We believe these assumptions are appropriate based upon the mix of the investments and the long-term nature of the plans’ investments.
93
ALERIS CORPORATION
NOTES TO CONSOLIDATED FINANCIAL STATEMENTS - (CONTINUED)
(dollars in millions, except share and per share data)
The weighted average assumptions used to determine benefit obligations are as follows:
U.S. Pension Benefits | |||||||||
As of December 31, | |||||||||
2017 | 2016 | 2015 | |||||||
Discount rate | 3.5 | % | 4.0 | % | 4.2 | % | |||
Non-U.S. Pension Benefits | |||||||||
As of December 31, | |||||||||
2017 | 2016 | 2015 | |||||||
Discount rate | 2.1 | % | 1.9 | % | 2.6 | % | |||
Rate of compensation increases, if applicable | 3.0 | 3.0 | 3.0 | ||||||
The weighted average assumptions used to determine the net periodic benefit cost for the years ended December 31, 2017, 2016 and 2015 are as follows:
U.S. Pension Benefits | |||||||
For the years ended December 31, | |||||||
2017 | 2016 | 2015 | |||||
Discount rates | 3.3% - 4.4% | 3.4% - 4.2% | 3.8 | % | |||
Expected return on plan assets | 7.8 | 7.8 | 8.0 | ||||
Non-U.S. Pension Benefits | ||||||||
For the years ended December 31, | ||||||||
2017 | 2016 | 2015 | ||||||
Discount rates | 1.5% - 2.0% | 2.6 | % | 2.2 | % | |||
Expected return on plan assets | 2.5 | 2.8 | 2.9 | |||||
Rate of compensation increase | 3.0 | 3.0 | 3.0 | |||||
Plan Assets. The weighted average plan asset allocations at December 31, 2017 and 2016 and the target allocations are as follows:
Percentage of Plan Assets | |||||||||
2017 | 2016 | Target Allocation | |||||||
Cash | 12 | % | 2 | % | — | % | |||
Equity | 44 | 61 | 55 | ||||||
Fixed income | 30 | 23 | 35 | ||||||
Real estate | 13 | 13 | 10 | ||||||
Other | 1 | 1 | — | ||||||
Total | 100 | % | 100 | % | 100 | % | |||
The principal objectives underlying the investment of the pension plans’ assets are to ensure that the Company can properly fund benefit obligations as they become due under a broad range of potential economic and financial scenarios, maximize the long-term investment return with an acceptable level of risk based on such obligations, and broadly diversify investments across and within the capital markets to protect asset values against adverse movements in any one market. The Company’s strategy balances the requirement to maximize returns using potentially higher return generating assets, such as equity securities, with the need to control the risk versus the benefit obligations with less volatile assets, such as fixed-income securities.
Investment practices must comply with the requirements of ERISA and any other applicable laws and regulations. The use of derivative instruments is permitted where appropriate and necessary for achieving overall investment policy objectives. Currently, we do not use derivative instruments.
94
ALERIS CORPORATION
NOTES TO CONSOLIDATED FINANCIAL STATEMENTS - (CONTINUED)
(dollars in millions, except share and per share data)
The fair values of the Company’s pension plan assets at December 31, 2017 by asset class are as follows:
Fair Value Measurements at December 31, 2017 Using: | ||||||||||||||||
Quoted Prices in | Significant | Significant | ||||||||||||||
Active Markets for | Observable | Unobservable | ||||||||||||||
Identical Assets | Inputs | Inputs | ||||||||||||||
Asset Class: | Fair Value | (Level 1) | (Level 2) | (Level 3) | ||||||||||||
Cash and Plan Receivables | $ | 17.2 | $ | 17.2 | $ | — | $ | — | ||||||||
Registered Investment Companies: | ||||||||||||||||
Large U.S. Equity | 15.6 | 15.6 | — | — | ||||||||||||
Small / Mid U.S. Equity | 5.6 | 5.6 | — | — | ||||||||||||
International Equity | 13.2 | 13.2 | — | — | ||||||||||||
Other | 1.3 | — | 1.3 | — | ||||||||||||
Total assets in the fair value hierarchy | 52.9 | $ | 51.6 | $ | 1.3 | $ | — | |||||||||
Commingled and Limited Partnership Funds measured at NAV (a): | ||||||||||||||||
Hedged Equity | 3.5 | |||||||||||||||
Core Real Estate | 18.7 | |||||||||||||||
International Large Cap Equity | 12.6 | |||||||||||||||
Core Fixed Income | 44.2 | |||||||||||||||
Small Cap Value Equity | 13.0 | |||||||||||||||
Total assets | $ | 144.9 | ||||||||||||||
(a) In accordance with ASC 820-10, certain investments that were measured at NAV (as defined below) (or its equivalent) have not been classified in the fair value hierarchy. The fair value amounts presented in the table are intended to permit reconciliation of the fair value hierarchy to the total pension plan assets.
The fair values of the Company’s pension plan assets at December 31, 2016 by asset class are as follows:
Fair Value Measurements at December 31, 2016 Using: | ||||||||||||||||
Quoted Prices in | Significant | Significant | ||||||||||||||
Active Markets for | Observable | Unobservable | ||||||||||||||
Identical Assets | Inputs | Inputs | ||||||||||||||
Asset Class: | Fair Value | (Level 1) | (Level 2) | (Level 3) | ||||||||||||
Cash | $ | 2.7 | $ | 2.7 | $ | — | $ | — | ||||||||
Registered Investment Companies: | ||||||||||||||||
Large U.S. Equity | 18.1 | 18.1 | — | — | ||||||||||||
Small / Mid U.S. Equity | 5.7 | 5.7 | — | — | ||||||||||||
International Equity | 12.2 | 12.2 | — | — | ||||||||||||
Other | 1.3 | — | 1.3 | — | ||||||||||||
Total assets in the fair value hierarchy | 40.0 | $ | 38.7 | $ | 1.3 | $ | — | |||||||||
Commingled and Limited Partnership Funds measured at NAV (a): | ||||||||||||||||
Hedged Equity | 19.3 | |||||||||||||||
Core Real Estate | 17.7 | |||||||||||||||
International Large Cap Equity | 12.9 | |||||||||||||||
Core Fixed Income | 32.0 | |||||||||||||||
Small Cap Value Equity | 15.5 | |||||||||||||||
Total assets | $ | 137.4 | ||||||||||||||
(a) In accordance with ASC 820-10, certain investments that were measured at NAV (as defined below) (or its equivalent) have not been classified in the fair value hierarchy. The fair value amounts presented in the table are intended to permit reconciliation of the fair value hierarchy to the total pension plan assets.
The following section describes the valuation methodologies used to measure the fair values of pension plan assets. There have been no changes in the methodologies used at December 31, 2017 and 2016.
▪ | Registered investment companies—These investments are valued at quoted prices from an active market which represents the net asset value of shares at year-end and are categorized within Level 1 of the fair value hierarchy. |
▪ | Commingled and limited partnership funds—These investments are valued at the net asset value (“NAV”) of units held or ownership interest in partners’ capital at year-end. NAV is determined by dividing the fair value of the fund’s net assets by its units outstanding at the valuation date. Partnership interests are also based on the net asset fair value |
95
ALERIS CORPORATION
NOTES TO CONSOLIDATED FINANCIAL STATEMENTS - (CONTINUED)
(dollars in millions, except share and per share data)
at the valuation date. We may redeem the commingled fund and limited partnership investments at NAV in the near term. Each of the commingled funds and limited partnership investments are further described below:
▪ | Hedged Equity—Hedged equity funds are primarily comprised of shares or units in other investment companies or trusts. Trading positions are valued in the investment funds at fair value. |
▪ | Core Real Estate—Core real estate funds are composed primarily of real estate investments owned directly or through partnership interests and mortgage loans on income-producing real estate. |
▪ | International Large Cap Equity—International large cap equity funds invest in equity securities of companies ordinarily located outside the U.S. and Canada. |
▪ | Core Fixed Income—Core fixed income funds primarily invest in fixed income securities. |
▪ | Small Cap Value Equity—Limited partnership invested primarily in equity securities of small capitalization companies. |
Plan Contributions. Our funding policy for funded pensions is to make annual contributions based on advice from our actuaries and the evaluation of our cash position, but not less than minimum statutory requirements. Contributions for unfunded plans were equal to benefit payments.
Expected Future Benefit Payments. The following benefit payments for our pension plans, which reflect expected future service, as appropriate, are expected to be paid for the periods indicated:
U.S. | Non-U.S. | ||||||||
Pension Benefits | Pension Benefits | ||||||||
2018 | $ | 10.9 | $ | 4.3 | |||||
2019 | 10.9 | 3.9 | |||||||
2020 | 11.5 | 3.9 | |||||||
2021 | 11.6 | 3.9 | |||||||
2022 | 11.3 | 4.5 | |||||||
2023 - 2027 | 56.3 | 21.8 | |||||||
Other Postretirement Benefit Plans
We maintain health care and life insurance benefit plans covering certain corporate and North America segment employees. We accrue the cost of postretirement benefits within the covered employees’ active service periods.
96
ALERIS CORPORATION
NOTES TO CONSOLIDATED FINANCIAL STATEMENTS - (CONTINUED)
(dollars in millions, except share and per share data)
The financial status of the plans at December 31, 2017 and 2016 is as follows:
For the years ended December 31, | ||||||||
2017 | 2016 | |||||||
Change in benefit obligations | ||||||||
Benefit obligation at beginning of period | $ | 37.6 | $ | 42.5 | ||||
Service cost | 0.2 | 0.2 | ||||||
Interest cost | 1.1 | 1.3 | ||||||
Benefits paid | (4.3 | ) | (5.1 | ) | ||||
Employee contributions | 1.2 | 0.8 | ||||||
Medicare subsidies received | 0.2 | 0.3 | ||||||
Actuarial gain | (1.7 | ) | (2.4 | ) | ||||
Other | 3.2 | — | ||||||
Benefit obligation at end of period | $ | 37.5 | $ | 37.6 | ||||
Change in plan assets | ||||||||
Fair value of plan assets at beginning of period | $ | — | $ | — | ||||
Employer contributions | 2.9 | 4.0 | ||||||
Employee contributions | 1.2 | 0.8 | ||||||
Medicare subsidies received | 0.2 | 0.3 | ||||||
Benefits paid | (4.3 | ) | (5.1 | ) | ||||
Fair value of plan assets at end of period | $ | — | $ | — | ||||
Net amount recognized | $ | (37.5 | ) | $ | (37.6 | ) | ||
The following table provides the amounts recognized in the Consolidated Balance Sheet as of December 31, 2017 and 2016:
December 31, | ||||||||
2017 | 2016 | |||||||
Accrued liabilities | $ | (3.2 | ) | $ | (3.4 | ) | ||
Accrued postretirement benefits | (34.3 | ) | (34.2 | ) | ||||
Net amount recognized | $ | (37.5 | ) | $ | (37.6 | ) | ||
Amounts recognized in accumulated other comprehensive loss (before tax) consist of: | ||||||||
Net actuarial gain | $ | (3.0 | ) | $ | (1.7 | ) | ||
Net prior service cost | 3.2 | — | ||||||
$ | 0.2 | $ | (1.7 | ) | ||||
Amortization expected to be recognized during next fiscal year (before tax): | ||||||||
Amortization of net actuarial gain | $ | 0.7 | ||||||
Amortization of prior service cost | (0.2 | ) | ||||||
$ | 0.5 | |||||||
The components of net postretirement benefit expense for the years ended December 31, 2017, 2016 and 2015 are as follows:
For the years ended December 31, | ||||||||||||
2017 | 2016 | 2015 | ||||||||||
Service cost | $ | 0.2 | $ | 0.2 | $ | 0.2 | ||||||
Interest cost | 1.1 | 1.3 | 1.7 | |||||||||
Amortization of net (gain) loss | (0.5 | ) | (0.1 | ) | 0.5 | |||||||
Net postretirement benefit expense | $ | 0.8 | $ | 1.4 | $ | 2.4 | ||||||
Plan Assumptions. We are required to make an assumption regarding the discount rate applied to determine service cost and interest cost. Our objective in selecting a discount rate is to select the best estimate of the rate at which the benefit
97
ALERIS CORPORATION
NOTES TO CONSOLIDATED FINANCIAL STATEMENTS - (CONTINUED)
(dollars in millions, except share and per share data)
obligations could be effectively settled. In making this estimate, projected cash flows are developed and are then matched with a yield curve based on an appropriate universe of high-quality corporate bonds. Similar to the changes in the discount rate approach discussed for the pension plans above, beginning with our 2016 fiscal year we have used an approach that discounts the individual expected cash flows underlying interest and service costs using the applicable spot rates derived from the yield curve used to determine the benefit obligation to the relevant projected cash flows.
The weighted average assumptions used to determine net postretirement benefit expense and benefit obligations are as follows:
For the years ended December 31, | |||||||||
2017 | 2016 | 2015 | |||||||
Discount rates | 3.1% - 4.3% | 3.1% - 4.3% | 3.6 | % | |||||
Discount rate used to determine end of period benefit obligations | 3.4 | % | 3.8 | % | 4.0 | % | |||
Health care cost trend rate assumed for next year | 7.4 | % | 7.8 | % | 7.0 | % | |||
Ultimate trend rate | 4.5 | % | 4.5 | % | 4.5 | % | |||
Year rate reaches ultimate trend rate | 2037 | 2037 | 2027 | ||||||
Assumed health care cost trend rates have an effect on the amounts reported for postretirement benefit plans. A one-percentage change in assumed health care cost trend rates would have the following effects:
1% increase | 1% decrease | |||||||
Effect on total service and interest components | $ | 0.1 | $ | (0.1 | ) | |||
Effect on postretirement benefit obligations | 1.8 | (1.5 | ) | |||||
Plan Contributions. Our policy for the plan is to make contributions equal to the benefits paid during the year.
Expected Future Benefit Payments. The following benefit payments are expected to be paid for the periods indicated:
Gross Benefit Payment | Net of Medicare Part D Subsidy | |||||||
2018 | $ | 3.2 | $ | 3.0 | ||||
2019 | 3.1 | 2.9 | ||||||
2020 | 3.0 | 3.0 | ||||||
2021 | 2.9 | 2.9 | ||||||
2022 | 2.8 | 2.8 | ||||||
2023 - 2027 | 11.9 | 11.9 | ||||||
Early Retirement Plans
Our Belgian and German subsidiaries sponsor various unfunded early retirement benefit plans. The obligations under these plans totaled $10.2 and $7.5 at December 31, 2017 and 2016, respectively, of which $2.9, the estimated payments under these plans for the year ending December 31, 2018, was classified as a current liability at December 31, 2017.
11. STOCK-BASED COMPENSATION
On June 1, 2010, the Board of Directors of Aleris Corporation (the “Board”) approved the Aleris Corporation 2010 Equity Incentive Plan (as amended from time to time, the “2010 Equity Plan”). Stock options, restricted stock units and restricted shares have been granted under the 2010 Equity Plan to certain members of senior management of the Company and other non-employee directors. All stock options granted have a life not to exceed ten years and vest over a period not to exceed four years. New shares of common stock are issued upon stock option exercises from available shares of common stock. The restricted stock units also vest over a period not to exceed four years. A portion of the stock options, as well as a portion of the restricted stock units, may vest upon a change in control event should the event occur prior to full vesting of these awards, depending on the amount of vesting that has already occurred at the time of the event in comparison to the change in our largest stockholders’ overall level of the ownership that results from the event.
98
ALERIS CORPORATION
NOTES TO CONSOLIDATED FINANCIAL STATEMENTS - (CONTINUED)
(dollars in millions, except share and per share data)
A summary of stock option activity for the year ended December 31, 2017 is as follows:
Weighted | Weighted average | Weighted | |||||||||||
average | remaining | average | |||||||||||
exercise price | contractual | grant date | |||||||||||
Service-based options | Options | per option | term in years | fair value | |||||||||
Outstanding at January 1, 2017 | 1,999,166 | $ | 24.17 | $ | 10.60 | ||||||||
Granted | 1,588,521 | 17.00 | 7.78 | ||||||||||
Forfeited | (92,713 | ) | 23.86 | 10.48 | |||||||||
Outstanding at December 31, 2017 | 3,494,974 | $ | 20.92 | 6.7 | $ | 9.32 | |||||||
Options exercisable at December 31, 2017 | 2,326,838 | $ | 22.57 | 5.3 | $ | 9.96 | |||||||
The range of exercise prices of options outstanding at December 31, 2017 was $16.78 - $38.45.
The term of the stock options granted during the year ended December 31, 2017 was calculated using the practical expedient provided in ASU 2016-09 that allows for the calculation of the term to be the midpoint between the requisite service period and the contractual term of the award. For stock options granted prior to 2017, we elected to use the simplified method to estimate the expected life of the stock options granted, as allowed by SEC SAB No. 107, and the continued acceptance of the simplified method indicated in SEC SAB No. 110, because we did not have historical stock option exercise experience, excluding former option holders who exercised options in connection with their termination of employment, which would have provided a reasonable basis upon which to estimate the expected life of the stock options.
At December 31, 2017, there was $18.0 of unrecognized compensation expense related to the stock options and restricted stock units. These amounts are expected to be recognized over a weighted-average period of 1.5 years.
The Black-Scholes method was used to estimate the fair value of the stock options granted. Under this method, the estimate of fair value is affected by the assumptions included in the following table. Expected equity volatility was determined based on historical stock prices and implied and stated volatilities of our peer companies. Intrinsic value is measured using the fair value at the date of exercise less the applicable exercise price. The following table summarizes the significant assumptions used to determine the fair value of the stock options granted during the years ended December 31, 2017 and 2015. There were no stock options granted during the year ended December 31, 2016.
For the years ended December 31, | ||||||
2017 | 2015 | |||||
Weighted average expected option life in years | 5.5 | 6.0 | ||||
Weighted average grant date fair value | $7.78 | $10.54 | ||||
Risk-free interest rate | 2.1 | % | 1.5% - 1.6% | |||
Equity volatility factor | 50 | % | 45% - 50% | |||
Dividend yield | — | % | — | % | ||
Intrinsic value of options exercised | N/A | $4.4 | ||||
A summary of restricted stock units activity for the year ended December 31, 2017 is as follows:
Weighted | |||||||
average | |||||||
grant date | |||||||
Restricted Stock Units | Shares | fair value | |||||
Outstanding at January 1, 2017 | 169,536 | $ | 25.64 | ||||
Granted | 836,581 | 17.00 | |||||
Vested | (408,459 | ) | 20.16 | ||||
Outstanding at December 31, 2017 | 597,658 | $ | 17.29 | ||||
The fair value of shares vested during the years ended December 31, 2017, 2016 and 2015 was $8.2, $2.7 and $3.1, respectively. The weighted average grant date fair value of restricted stock units granted during the years ended December 31, 2017, 2016 and 2015 was $17.00, $23.70 and $23.70, respectively. The shares issued for the 264,757 restricted stock units that vested on December 31, 2017 had a January 2, 2018 issuance date.
99
ALERIS CORPORATION
NOTES TO CONSOLIDATED FINANCIAL STATEMENTS - (CONTINUED)
(dollars in millions, except share and per share data)
12. DERIVATIVE AND OTHER FINANCIAL INSTRUMENTS
We use forward contracts and options, as well as contractual price escalators, to reduce the risks associated with our metal, natural gas and other supply requirements, as well as fuel costs and certain currency exposures. Generally, we enter into master netting arrangements with our counterparties and offset net derivative positions with the same counterparties against amounts recognized for the right to reclaim cash collateral or the obligation to return cash collateral under those arrangements in our Consolidated Balance Sheet. For classification purposes, we record the net fair value of each type of derivative position that is expected to settle in less than one year with each counterparty as a net current asset or liability and each type of long-term position as a net long-term asset or liability. No cash collateral was posted at December 31, 2017 or 2016. The amounts shown in the table below represent the gross amounts of recognized assets and liabilities, the amounts offset in the Consolidated Balance Sheet and the net amounts of assets and liabilities presented therein. As of December 31, 2017 and 2016, there were no amounts subject to an enforceable master netting arrangement or similar agreement that have not been offset in the Consolidated Balance Sheet.
Fair Value of Derivatives as of December 31, | ||||||||||||||||
2017 | 2016 | |||||||||||||||
Derivatives by Type | Asset | Liability | Asset | Liability | ||||||||||||
Metal | $ | 33.5 | $ | (36.0 | ) | $ | 8.9 | $ | (12.3 | ) | ||||||
Energy | 0.2 | (0.1 | ) | 0.7 | — | |||||||||||
Currency | 1.6 | (0.1 | ) | — | (2.3 | ) | ||||||||||
Total | 35.3 | (36.2 | ) | 9.6 | (14.6 | ) | ||||||||||
Effect of counterparty netting | (27.2 | ) | 27.2 | (6.6 | ) | 6.6 | ||||||||||
Net derivatives as classified in the balance sheet | $ | 8.1 | $ | (9.0 | ) | $ | 3.0 | $ | (8.0 | ) | ||||||
The fair value of our derivative financial instruments at December 31, 2017 and 2016 are recorded on the Consolidated Balance Sheet as follows:
December 31, | ||||||||||
Asset Derivatives | Balance Sheet Location | 2017 | 2016 | |||||||
Metal | Prepaid expenses and other current assets | $ | 2.2 | $ | 2.3 | |||||
Other long-term assets | 4.3 | — | ||||||||
Energy | Prepaid expenses and other current assets | 0.1 | 0.7 | |||||||
Currency | Prepaid expenses and other current assets | 0.8 | — | |||||||
Other long-term assets | 0.7 | — | ||||||||
Total | $ | 8.1 | $ | 3.0 | ||||||
December 31, | ||||||||||
Liability Derivatives | Balance Sheet Location | 2017 | 2016 | |||||||
Metal | Accrued liabilities | $ | 9.0 | $ | 5.1 | |||||
Other long-term liabilities | — | 0.6 | ||||||||
Currency | Accrued liabilities | — | 1.8 | |||||||
Other long-term liabilities | — | 0.5 | ||||||||
Total | $ | 9.0 | $ | 8.0 | ||||||
Both realized and unrealized gains and losses on derivative financial instruments are included within “Losses on derivative financial instruments” in the Consolidated Statements of Operations. Realized losses (gains) on derivative financial instruments totaled the following during the years ended December 31, 2017, 2016 and 2015:
For the years ended December 31, | ||||||||||||
2017 | 2016 | 2015 | ||||||||||
Metal | $ | 47.3 | $ | 30.0 | $ | (26.0 | ) | |||||
Energy | 1.0 | 0.2 | 3.5 | |||||||||
Currency | (0.6 | ) | 0.8 | 0.4 | ||||||||
Total realized losses (gains) | 47.7 | 31.0 | (22.1 | ) | ||||||||
Realized losses reclassified to income from discontinued operations | — | — | 1.1 | |||||||||
Realized losses (gains) of continuing operations | $ | 47.7 | $ | 31.0 | $ | (23.2 | ) | |||||
100
ALERIS CORPORATION
NOTES TO CONSOLIDATED FINANCIAL STATEMENTS - (CONTINUED)
(dollars in millions, except share and per share data)
Metal Hedging
The selling prices of the majority of the orders for our products are established at the time of order entry or, for certain customers, under long-term contracts. As the related raw materials used to produce these orders are purchased several months or years after the selling prices are fixed, margins are subject to the risk of changes in the purchase price of the raw materials used for these fixed price sales. In order to manage this transactional exposure, future, swaps or forward purchase contracts are purchased at the time the selling prices are fixed. As metal is purchased to fill these fixed price sales orders, future, swaps or forward contracts are then sold. We also maintain a significant amount of inventory on-hand to meet anticipated and unpriced future sales. In order to preserve the value of this inventory, future or forward contracts are sold at the time inventory is purchased. As sales orders are priced, future or forward contracts are purchased. These derivatives generally settle within three months. We can also use call option contracts, which function in a manner similar to the natural gas call option contracts discussed below and put option contracts for managing metal price exposures. Option contracts require the payment of a premium which is recorded as a realized loss upon settlement or expiration of the option contract. Upon settlement of a put option contract, we receive cash and recognize a related gain if the LME closing price is less than the strike price of the put option. If the put option strike price is less than the LME closing price, no amount is paid and the option expires. As of December 31, 2017, we had 0.1 million metric tons and 0.2 million metric tons of metal buy and sell derivative contracts, respectively. As of December 31, 2016, we had 0.1 million metric tons and 0.2 million metric tons of metal buy and sell derivative contracts, respectively.
Energy Hedging
To manage our price exposure for natural gas purchases, we fix the future price of a portion of our natural gas requirements by entering into financial hedge agreements. Under these agreements, payments are made or received based on the differential between the monthly closing price on the New York Mercantile Exchange (“NYMEX”) and the contractual hedge price. We can also use a combination of call option contracts and put option contracts for managing the exposure to increasing prices while maintaining our ability to benefit from declining prices. Upon settlement of call option contracts, we receive cash and recognize a related gain if the NYMEX closing price exceeds the strike price of the call option. If the call option strike price exceeds the NYMEX closing price, no amount is received and the option expires unexercised. Upon settlement of a put option contract, we pay cash and recognize a related loss if the NYMEX closing price is lower than the strike price of the put option. If the put option strike price is less than the NYMEX closing price, no amount is paid and the option expires unexercised. Option contracts require the payment of a premium which is recorded as a realized loss upon settlement or expiration of the option contract. Natural gas cost can also be managed through the use of cost escalators included in some of our long-term supply contracts with customers, which limits exposure to natural gas price risk. As of December 31, 2017 and 2016, we had 3.5 trillion and 2.1 trillion of British thermal unit forward buy contracts, respectively.
We use independent freight carriers to deliver our products. As part of the total freight charge, these carriers include a per mile diesel surcharge based on the Department of Energy, Energy Information Administration’s (“DOE”) Weekly Retail Automotive Diesel National Average Price. From time to time, we may enter into over-the-counter DOE diesel fuel swaps with financial counterparties to mitigate the impact of the volatility of diesel fuel prices on our freight costs. Under these swap agreements, we pay a fixed price per gallon of diesel fuel determined at the time the agreements were executed and receive a floating rate payment that is determined on a monthly basis based on the average price of the DOE Diesel Fuel Index during the applicable month. The swaps are designed to offset increases or decreases in fuel surcharges that we pay to our carriers. All swaps are financially settled. There is no possibility of physical settlement. As of December 31, 2017, we had 1.5 million gallons of diesel fuel swap contracts. As of December 31, 2016, we had no diesel fuel swap contracts.
Currency Hedging
Our aerospace and heat exchanger businesses expose the U.S. dollar operating results of our European operations to fluctuations in the euro as the sales contracts are generally in U.S. dollars while the costs of production are in euros. In order to mitigate the risk that fluctuations in the euro may have on our business, we have entered into forward currency contracts. As of December 31, 2017 and 2016, we had euro forward contracts covering a notional amount of €100.8 million and €34.6 million, respectively.
Credit Risk
We are exposed to losses in the event of non-performance by the counterparties to the derivative financial instruments discussed above; however, we do not anticipate any non-performance by the counterparties. The counterparties are evaluated for creditworthiness and risk assessment prior to initiating trading activities with the brokers and periodically throughout each year while actively trading.
101
ALERIS CORPORATION
NOTES TO CONSOLIDATED FINANCIAL STATEMENTS - (CONTINUED)
(dollars in millions, except share and per share data)
Recurring Fair Value Measurements
Derivative contracts are recorded at fair value under ASC 820 using quoted market prices and significant other observable inputs. Fair value is defined as the price that would be received to sell an asset or paid to transfer a liability in an orderly transaction between market participants at the measurement date. The fair value hierarchy distinguishes between (1) market participant assumptions developed based on market data obtained from independent sources (observable inputs) and (2) an entity’s own assumptions about market participant assumptions developed based on the best information available in the circumstances (unobservable inputs). The fair value hierarchy consists of three broad levels, which gives the highest priority to unadjusted quoted prices in active markets for identical assets or liabilities (Level 1) and the lowest priority to unobservable inputs (Level 3). The three levels of the fair value hierarchy are described below:
Level 1—Unadjusted quoted prices in active markets that are accessible at the measurement date for identical, unrestricted assets or liabilities.
Level 2—Inputs other than quoted prices included within Level 1 that are observable for the asset or liability, either directly or indirectly, including quoted prices for similar assets or liabilities in active markets; quoted prices for identical or similar assets or liabilities in markets that are not active; inputs other than quoted prices that are observable for the asset or liability (e.g., interest rates); and inputs that are derived principally from or corroborated by observable market data by correlation or other means.
Level 3—Inputs that are both significant to the fair value measurement and unobservable.
We endeavor to use the best available information in measuring fair value. Where appropriate, valuations are adjusted for various factors such as liquidity, bid/offer spreads, and credit considerations. Such adjustments are generally based on available market evidence and unobservable inputs. Financial assets and liabilities are classified in their entirety based on the lowest level of input that is significant to the fair value measurement. As of December 31, 2017 and 2016, all of our derivative assets and liabilities represent Level 2 fair value measurements.
Other Financial Instruments
The carrying amount, fair values and level in the fair value hierarchy of our other financial instruments at December 31, 2017 and 2016 are as follows:
December 31, | ||||||||||||||||||||
2017 | 2016 | |||||||||||||||||||
Carrying Amount | Fair Value | Level in the Fair Value Hierarchy | Carrying Amount | Fair Value | Level in the Fair Value Hierarchy | |||||||||||||||
Cash and cash equivalents | $ | 102.4 | $ | 102.4 | Level 1 | $ | 55.6 | $ | 55.6 | Level 1 | ||||||||||
Restricted cash | 5.6 | 5.6 | Level 1 | — | — | N/A | ||||||||||||||
Receivables held in escrow | — | — | N/A | 17.0 | 20.6 | Level 2 | ||||||||||||||
ABL Facility | 319.3 | 319.3 | Level 2 | 255.3 | 255.3 | Level 2 | ||||||||||||||
Exchangeable Notes | 44.5 | 45.4 | Level 3 | 44.4 | 81.4 | Level 3 | ||||||||||||||
7 7/8% Senior Notes | 436.7 | 438.1 | Level 1 | 435.5 | 441.7 | Level 1 | ||||||||||||||
9 ½ % Senior Secured Notes | 800.8 | 847.3 | Level 1 | 538.4 | 594.0 | Level 1 | ||||||||||||||
Zhenjiang Term Loans | 169.8 | 170.3 | Level 3 | 164.5 | 165.0 | Level 3 | ||||||||||||||
Zhenjiang Revolver | — | — | N/A | 22.0 | 22.1 | Level 3 | ||||||||||||||
The receivables held in escrow represent shares of Real Industry Inc.’s Series B non-participating preferred stock issued to the Company in connection with the 2015 sale of our former recycling and specification alloys businesses and which have been held in escrow to secure our indemnification obligations under the sale agreement. In November 2017, Real Industry, Inc., and certain of its operating entities, filed for Chapter 11 bankruptcy protection. As a result, the receivables held in escrow have been fully impaired. We recorded a $22.8 expense in “Other expense (income), net” in Consolidated Statements of Operations related to the impairment. Prior to the bankruptcy, the fair value of the preferred stock was estimated using a lattice model based on the expected time to maturity, cash flows of the preferred stock and an estimated yield using available market data.
The principal amount of the ABL Facility approximates fair value because the interest rate paid is variable and there have been no significant changes in the credit risk of Aleris International subsequent to the borrowings. The fair value of Aleris International’s Exchangeable Notes was estimated using a binomial lattice pricing model based on the fair value of our common stock, a risk-free interest rate of 1.9% and expected equity volatility of 60%. Expected equity volatility was determined based on historical stock prices and implied and stated volatilities of our peer companies. The fair values of the 7
102
ALERIS CORPORATION
NOTES TO CONSOLIDATED FINANCIAL STATEMENTS - (CONTINUED)
(dollars in millions, except share and per share data)
7/8% Senior Notes and the 9½% Senior Secured Notes were estimated using market quotations. The principal amount of the Zhenjiang Term Loans and Zhenjiang Revolver approximates fair value because the interest rate paid is variable, is set for periods of six months or less and there have been no significant changes in the credit risk of Aleris Zhenjiang subsequent to the inception of the China Loan Facility.
13. INCOME TAXES
U.S. Tax Reform Impact
On December 22, 2017, the Tax Cuts and Jobs Act (the “Tax Act”) was enacted into U.S. law. Some of the key tax provisions include the reduction of the corporate income tax rate from 35% to 21% effective January 1, 2018, the limitation on the deductibility of interest expense, the immediate expensing of qualified business assets, the transition of U.S. international taxation from a worldwide tax system to a territorial tax system, the changes to the deductibility of executive compensation and a provision referred to as global intangible low-taxed income (“GILTI”) that imposes a new tax on foreign income in excess of a deemed return on tangible assets of foreign corporations. ASC 740, “Income Taxes” (“ASC 740”), requires us to recognize the effect of the tax law changes in the period of enactment. Also on December 22, 2017, SAB 118 was issued to address the application of U.S. GAAP in situations when a registrant does not have the necessary information available, prepared, or analyzed (including computations) in reasonable detail to complete the accounting for certain income tax effects of the Tax Act. Pursuant to the guidance we recognized the provisional effects of the enactment of the Tax Act for which measurement could be reasonably estimated. We continue to monitor certain aspects of the Tax Act and may refine our assessment as a result of any further related regulatory guidance that may be issued by the U.S. Treasury. Pursuant to SAB 118, adjustments to the provisional amounts recorded as of December 31, 2017 that are identified within a subsequent measurement period of up to one year from the enactment date will be included as an adjustment to tax expense from continuing operations in the period the amounts are determined.
As a result of the Tax Act, we have revalued our U.S. federal deferred tax assets and liabilities to the new tax rate. However, we are still awaiting further related regulatory guidance from the U.S. Treasury on certain aspects of the Tax Act which could potentially affect the measurement of these balances. We recorded a provisional amount of $1.1 of income tax benefit for the remeasurement of the U.S. federal deferred tax liabilities associated with indefinite-lived intangible assets. We recorded a provisional amount of $86.8 to reduce our net U.S. federal deferred tax assets excluding the indefinite-lived intangible assets and the corresponding valuation allowance. The Company will be significantly impacted by the limitation on the tax deductibility of interest expense in the future, however, we expect to utilize our net operating losses to offset this impact, in effect, converting net operating loss deferred tax assets into interest limitation deferred tax assets still subject to a full valuation allowance. We do not expect to be subject to any transition tax from our foreign operations, and therefore have not recognized any provisional amount for the transition tax at December 31, 2017. Our accounting policy will be to record GILTI as a period cost if and when incurred. We will continue to assess the impact of the recently enacted tax law on our business and our consolidated financial statements.
Belgian Tax Reform Impact
The Belgian government enacted in December 2017 a significant tax reform law. The new tax legislation contains several key tax provisions including the reduction of the corporate income tax rate from the current 33.99% to 29.58% in 2018 and 2019 and 25% from 2020. Additionally, the use of net operating losses which could previously offset 100% of taxable income is now limited to offset only 70% of taxable income and will result in the Company having to pay current tax. The remeasured deferred taxes due to the change in the tax rate resulted in $13.4 deferred tax expense in the current year.
The (loss) income before income taxes was as follows:
For the years ended December 31, | ||||||||||||
2017 | 2016 | 2015 | ||||||||||
U.S. | $ | (244.8 | ) | $ | (145.3 | ) | $ | (126.2 | ) | |||
International | 70.8 | 113.0 | 31.2 | |||||||||
Loss from continuing operations before income taxes | (174.0 | ) | (32.3 | ) | (95.0 | ) | ||||||
Income (loss) from discontinued operations before income taxes | 4.5 | (3.3 | ) | 203.3 | ||||||||
Total (loss) income before income taxes | $ | (169.5 | ) | $ | (35.6 | ) | $ | 108.3 | ||||
103
ALERIS CORPORATION
NOTES TO CONSOLIDATED FINANCIAL STATEMENTS - (CONTINUED)
(dollars in millions, except share and per share data)
The provision for (benefit from) income taxes, which reflects the application of the intraperiod tax allocation requirements of ASC 740-20, “Intraperiod Tax Allocation”, was as follows:
For the years ended December 31, | ||||||||||||
2017 | 2016 | 2015 | ||||||||||
Current: | ||||||||||||
Federal | $ | (1.9 | ) | $ | (0.1 | ) | $ | — | ||||
State | — | 0.3 | 0.1 | |||||||||
International | 10.7 | 18.3 | 21.5 | |||||||||
8.8 | 18.5 | 21.6 | ||||||||||
Deferred: | ||||||||||||
Federal | (1.6 | ) | 0.2 | (39.3 | ) | |||||||
State | 0.1 | 0.1 | (2.4 | ) | ||||||||
International | 33.1 | 21.2 | (2.6 | ) | ||||||||
31.6 | 21.5 | (44.3 | ) | |||||||||
Provision for (benefit from) income taxes of continuing operations | 40.4 | 40.0 | (22.7 | ) | ||||||||
Provision for income taxes of discontinued operations | 0.7 | — | 82.2 | |||||||||
Total provision for (benefit from) income taxes | $ | 41.1 | $ | 40.0 | $ | 59.5 | ||||||
The income tax expense (benefit) of continuing operations, computed by applying the federal statutory tax rate to the loss from continuing operations before income taxes, differed from the provision for (benefit from) income taxes of continuing operations as follows:
For the years ended December 31, | ||||||||||||
2017 | 2016 | 2015 | ||||||||||
Income tax benefit at the federal statutory rate | $ | (60.9 | ) | $ | (11.3 | ) | $ | (33.2 | ) | |||
Foreign income tax rate differential and permanent differences, net | (2.5 | ) | (3.0 | ) | 39.2 | |||||||
State income taxes, net | (9.9 | ) | (2.8 | ) | (0.4 | ) | ||||||
Permanent differences, net | 2.4 | 0.8 | — | |||||||||
Tax on deemed dividend of foreign earnings, net of foreign tax credit | 10.5 | 28.5 | 6.0 | |||||||||
Change in uncertain tax position | 1.2 | 0.2 | 0.1 | |||||||||
Effect of statutory rate changes | 99.1 | — | — | |||||||||
Change in valuation allowance - excluding rate change | 86.2 | 28.8 | (34.3 | ) | ||||||||
Change in valuation allowance - rate change | (86.8 | ) | — | — | ||||||||
Other, net | 1.1 | (1.2 | ) | (0.1 | ) | |||||||
Provision for (benefit from) income taxes of continuing operations | $ | 40.4 | $ | 40.0 | $ | (22.7 | ) | |||||
The favorable foreign income tax rate differential in 2017 resulted primarily from the mix of income and tax rates in non-U.S. tax jurisdictions. The favorable foreign income tax rate differential in 2016 resulted primarily from notional interest deductions of certain foreign entities and the mix of income and tax rates in non-U.S. tax jurisdictions. The unfavorable foreign income tax rate differential in 2015 resulted primarily from the elimination of deferred tax assets resulting from the merger of two entities.
The unfavorable effect of rate changes of $99.1 is comprised of a $85.7 unfavorable effect resulting from the remeasurement of U.S. federal net deferred assets due to the reduction to the federal income tax rate from 35% to 21% enacted by the Tax Act and a $13.4 unfavorable effect resulting from the remeasurement of net deferred tax assets in non-U.S. jurisdictions due to reductions in the corporate income tax rates in those non-U.S. jurisdictions. The favorable effect of the change in valuation allowance - rate change of $86.8 results from the remeasurement of U.S. federal valuation allowances established against the U.S. federal net deferred assets due to the reduction to the federal income tax rate. The net effect of rate changes is an unfavorable $12.3, of which a favorable $1.1 relates to the U.S. federal and an unfavorable $13.4 relates to non-U.S. jurisdictions.
Deferred income taxes reflect the net tax effects of temporary differences between the carrying amounts of assets and liabilities for financial reporting purposes and the amounts used for income tax purposes.
104
ALERIS CORPORATION
NOTES TO CONSOLIDATED FINANCIAL STATEMENTS - (CONTINUED)
(dollars in millions, except share and per share data)
Significant components of our deferred tax liabilities and assets are as follows:
December 31, | ||||||||
2017 | 2016 | |||||||
Deferred Tax Liabilities | ||||||||
Property, plant and equipment and intangible assets | $ | 84.5 | $ | 60.8 | ||||
Undistributed foreign earnings | 1.3 | 11.1 | ||||||
Other | 15.4 | 7.0 | ||||||
Total deferred tax liabilities | 101.2 | 78.9 | ||||||
Deferred Tax Assets | ||||||||
Net operating loss carryforwards | 274.6 | 235.0 | ||||||
Property, plant and equipment and intangible assets | 44.5 | 57.0 | ||||||
Deferred revenue | 5.9 | 7.9 | ||||||
Accrued pension benefits | 33.5 | 38.4 | ||||||
Accrued liabilities | 20.8 | 23.6 | ||||||
Other | 46.2 | 47.4 | ||||||
425.5 | 409.3 | |||||||
Valuation allowance | (257.6 | ) | (244.9 | ) | ||||
Total deferred tax assets | 167.9 | 164.4 | ||||||
Net deferred tax assets | $ | 66.7 | $ | 85.5 | ||||
At December 31, 2017 and 2016, we had valuation allowances recorded against deferred tax assets of continuing operations of $257.6 and $244.9, respectively, to reduce certain deferred tax assets to amounts that are more likely than not to be realized. Of the total December 31, 2017 and 2016 valuation allowances, $83.9 and $72.7, respectively, relate primarily to net operating losses in non-U.S. tax jurisdictions, $141.0 and $154.5, respectively, relate primarily to the U.S. federal effects of net operating losses and amortization and $32.7 and $17.7, respectively, relate primarily to the state effects of net operating losses and amortization. The net increase in the valuation allowance is primarily attributable to increases in the tax net operating losses in U.S. and non-U.S. jurisdictions that have valuation allowances against their net deferred tax assets. In the U.S., the increase is partially offset by the remeasurement of the U.S. federal net deferred tax assets with valuation allowances against them as a result of the reduction to the federal income tax rate. We will maintain valuation allowances against our net deferred tax assets in the U.S. and other applicable jurisdictions until objective positive evidence exists to reduce or eliminate the valuation allowance.
The following table summarizes the change in the valuation allowances:
For the years ended December 31, | ||||||||||||
2017 | 2016 | 2015 | ||||||||||
Balance at beginning of the period | $ | 244.9 | $ | 218.5 | $ | 271.8 | ||||||
Additions (reversals) recorded in the provision for (benefit from) income taxes - excluding rate change | 86.2 | 30.3 | (40.6 | ) | ||||||||
Reversals recorded in the provision for (benefit from) income taxes - rate change | (86.8 | ) | — | — | ||||||||
Accumulated other comprehensive (loss) income | 0.6 | (0.5 | ) | (2.9 | ) | |||||||
Currency translation | 5.3 | (3.4 | ) | (9.8 | ) | |||||||
Retained earnings | 7.4 | — | — | |||||||||
Balance at end of the period | $ | 257.6 | $ | 244.9 | $ | 218.5 | ||||||
At December 31, 2017, we had approximately $405.4 of unused net operating loss carryforwards associated with non-U.S. tax jurisdictions, of which $213.0 can be carried forward indefinitely. The non-U.S. net operating loss carryforwards will begin to expire in 2018. In addition, we had $50.0 of unused capital loss carryforwards associated with non-U.S. tax jurisdictions, which can be carried forward indefinitely but can only be offset against capital gains. At December 31, 2017, the U.S. federal net operating loss carryforward was $636.0. The tax benefits associated with state net operating loss carryforwards at December 31, 2017 were $25.9.
At December 31, 2017 we had no undistributed earnings to the U.S. in our non-U.S. investments. There were undistributed earnings of $25.7 between two non-U.S. investments, for which a deferred tax liability of $1.3 was recorded in anticipation of a distribution in 2018.
105
ALERIS CORPORATION
NOTES TO CONSOLIDATED FINANCIAL STATEMENTS - (CONTINUED)
(dollars in millions, except share and per share data)
Aleris Corporation and its subsidiaries file income tax returns in the U.S. federal jurisdiction, and various state and foreign jurisdictions.
The following table summarizes the change in uncertain tax positions, all of which are recorded in continuing operations:
For the years ended December 31, | ||||||||||||
2017 | 2016 | 2015 | ||||||||||
Balance at beginning of the period | $ | 2.5 | $ | 2.4 | $ | 2.7 | ||||||
Additions for tax positions of prior years | 1.3 | 0.1 | — | |||||||||
Reductions for tax positions of prior years | (0.2 | ) | — | (0.3 | ) | |||||||
Additions for tax positions of current year | 0.6 | — | — | |||||||||
Balance at end of period | $ | 4.2 | $ | 2.5 | $ | 2.4 | ||||||
$3.1 of the gross unrecognized tax benefits, if recognized, would affect the annual effective tax rate.
We recognize interest and penalties related to uncertain tax positions within “Provision for (benefit from) income taxes” in the Consolidated Statements of Operations. Interest of $0.8 and $0.4 was accrued on the uncertain tax positions as of December 31, 2017 and 2016, respectively. Total interest of $0.2, $0.2 and $0.1 was recognized as part of the provision for (benefit from) income taxes for the years ended December 31, 2017, 2016 and 2015, respectively. Accrued penalties are not significant.
The 2009 through 2016 tax years remain open to examination. During the fourth quarter of 2013, a non-U.S. taxing jurisdiction commenced an examination of our tax returns for tax years ended December 31, 2012, 2011, 2010 and 2009 that is anticipated to be completed within six months of the reporting date.
During the second quarter of 2017, another non-U.S. taxing jurisdiction commenced an examination of our tax return for tax year ended December 31, 2015 that is anticipated to be completed within six months of the reporting date.
14. COMMITMENTS AND CONTINGENCIES
Operating Leases
We lease various types of equipment and property, primarily office space at various locations and the equipment used in our operations. The future minimum lease payments required under operating leases that have initial or remaining non-cancellable lease terms in excess of one year, which may also contain renewal options, as of December 31, 2017, are as follows:
2018 | 2019 | 2020 | 2021 | 2022 | Thereafter | |||||||||||||||||||
Operating leases | $ | 3.9 | $ | 2.5 | $ | 2.0 | $ | 1.3 | $ | 1.2 | $ | 2.0 | ||||||||||||
Rental expense for the years ended December 31, 2017, 2016 and 2015 was $10.1, $9.9 and $10.3, respectively. Of these amounts, $0.9 has been included within “Income (loss) from discontinued operations, net of tax” in the Consolidated Statements of Operations for the year ended December 31, 2015.
Purchase Obligations
Our non-cancellable purchase obligations are principally for materials, such as metals and fluxes used in our manufacturing operations, natural gas and other services. Our purchase obligations are long-term agreements to purchase goods or services that are enforceable and legally binding on us that specify all significant terms, including fixed or minimum quantities to be purchased; fixed, minimum or variable price provisions; and the approximate timing of the transaction. Purchase obligations include the pricing of anticipated metal purchases using contractual prices or, where pricing is dependent upon the prevailing LME metal prices at the time of delivery, market prices as of December 31, 2017, as well as natural gas and electricity purchases using minimum contractual quantities and either contractual prices or prevailing rates. As a result of the variability in the pricing of many of our metals purchase obligations, actual amounts paid may vary from the amounts shown below. As of December 31, 2017, amounts due under long-term non-cancellable purchase obligations are as follows:
2018 | 2019 | 2020 | 2021 | 2022 | Thereafter | |||||||||||||||||||
Purchase obligations | $ | 307.3 | $ | 274.9 | $ | 208.2 | $ | 30.4 | $ | 4.9 | $ | 22.5 | ||||||||||||
106
ALERIS CORPORATION
NOTES TO CONSOLIDATED FINANCIAL STATEMENTS - (CONTINUED)
(dollars in millions, except share and per share data)
Amounts purchased under long-term purchase obligations during the years ended December 31, 2017, 2016 and 2015 approximated previously projected amounts.
Employees
Approximately 64% of our U.S. employees and substantially all of our non-U.S. employees are covered by collective bargaining agreements.
Environmental Proceedings
Our operations are subject to environmental laws and regulations governing air emissions, wastewater discharges, the handling, disposal and remediation of hazardous substances and wastes and employee health and safety. These laws can impose joint and several liabilities for releases or threatened releases of hazardous substances upon statutorily defined parties, including us, regardless of fault or the lawfulness of the original activity or disposal. Given the changing nature of environmental legal requirements, we may be required, from time to time, to take environmental control measures at some of our facilities to meet future requirements.
We have been named as a potentially responsible party in certain proceedings initiated pursuant to the Comprehensive Environmental Response, Compensation, and Liability Act and similar stated statutes and may be named a potentially responsible party in other similar proceedings in the future. It is not anticipated that the costs incurred in connection with the presently pending proceedings will, individually or in the aggregate, have a material adverse effect on our financial position, results of operations or cash flows.
We are performing operations and maintenance at two Superfund sites for matters arising out of past waste disposal activity associated with closed facilities. We are also under orders to perform environmental remediation by agencies in four states and one non-U.S. country at seven sites.
The changes in our accruals for environmental liabilities are as follows:
For the years ended December 31, | ||||||||||||
2017 | 2016 | 2015 | ||||||||||
Balance at the beginning of the period | $ | 23.8 | $ | 26.2 | $ | 46.7 | ||||||
Revisions and liabilities incurred | (0.1 | ) | (0.3 | ) | 4.0 | |||||||
Payments | (2.0 | ) | (2.0 | ) | (2.3 | ) | ||||||
Divestitures | — | — | (21.7 | ) | ||||||||
Translation and other charges | 0.4 | (0.1 | ) | (0.5 | ) | |||||||
Balance at the end of the period | $ | 22.1 | $ | 23.8 | $ | 26.2 | ||||||
Our reserves for environmental remediation liabilities have been classified as “Other long-term liabilities” and “Accrued liabilities” in the Consolidated Balance Sheet, of which $10.2 and $11.5, respectively, are subject to indemnification by third parties at December 31, 2017 and 2016. These amounts are in addition to our asset retirement obligations discussed in Note 8, “Asset Retirement Obligations,” and represent the most probable costs of remedial actions. We estimate the costs related to currently identified remedial actions will be paid out primarily over the next 10 years.
Legal Proceedings
We are party to routine litigation and proceedings as part of the ordinary course of business and do not believe that the outcome of any existing proceedings would have a material adverse effect on our financial position, results of operations or cash flows. We have established accruals for those loss contingencies, including litigation and environmental contingencies, for which it has been determined that a loss is probable; none of such loss contingencies is material. For those loss contingencies, including litigation and environmental contingencies, which have been determined to be reasonably possible, an estimate of the possible loss or range of loss cannot be determined because the claims, amount claimed, facts or legal status are not sufficiently developed or advanced in order to make such a determination. While we cannot estimate the loss or range of loss at this time, we do not believe that the outcome of any of these existing proceedings would be material to our financial position, results of operations or cash flows.
15. SEGMENT AND GEOGRAPHIC INFORMATION
Our operating structure provides the appropriate focus on our global rolled products end-uses, including aerospace, automotive, building and construction, and commercial and defense plate and heat exchangers, as well as on our regionally-based products and customers. We report three operating segments, each of which is considered a reportable segment. The reportable segments are based on the organizational structure that is used by our chief operating decision maker to evaluate
107
ALERIS CORPORATION
NOTES TO CONSOLIDATED FINANCIAL STATEMENTS - (CONTINUED)
(dollars in millions, except share and per share data)
performance, make decisions on resource allocation and for which discrete financial information is available. Our operating segments are North America, Europe and Asia Pacific.
North America
Our North America segment consists of nine manufacturing facilities located throughout the United States that produce rolled aluminum and coated products for the building and construction, truck trailer, automotive, consumer durables, other general industrial and distribution end-uses. Substantially all of our North America segment’s products are manufactured to specific customer requirements, using continuous cast and direct-chill technologies that provide us with significant flexibility to produce a wide range of products. Specifically, those products are integrated into, among other applications, building products, truck trailers, gutters, appliances, cars and recreational vehicles. In connection with the auto body sheet (“ABS”) project at our Lewisport facility, the North America segment has been incurring labor, consulting and other expenses associated with start-up activities, including the design and development of new products and processes, the manufacture of commissioning and trial products and the development of sales and marketing efforts necessary to enter into this new end-use. These start-up costs are not included in management’s definition of segment income, as defined below.
Europe
Our Europe segment consists of two world-class aluminum rolling mills, one in Germany and the other in Belgium, and an aluminum cast house in Germany, that produce aerospace plate and sheet, ABS, clad brazing sheet (clad aluminum material used for, among other applications, vehicle radiators and HVAC systems) and heat-treated plate for engineered product applications. Substantially all of our Europe segment’s products are manufactured to specific customer requirements using direct-chill cast technologies that allow us to use and offer a variety of alloys and products for a number of technically demanding end-uses.
Asia Pacific
Our Asia Pacific segment consists of the Zhenjiang rolling mill that produces technically demanding and value-added plate products for the aerospace, semiconductor equipment, general engineering, distribution and other end-uses worldwide. Substantially all of our Asia Pacific segment’s products are manufactured to specific customer requirements using direct-chill cast technologies that allow us to use and offer a variety of alloys and products principally for aerospace and also for a number of other technically demanding end-uses.
Measurement of Segment Income or Loss and Segment Assets
The accounting policies of the reportable segments are the same as those described in Note 2, “Summary of Significant Accounting Policies.” Our measure of profitability for our operating segments is referred to as segment income and loss. Segment income and loss includes gross profits, segment specific realized gains and losses on derivative financial instruments, segment specific other income and expense, segment specific selling, general and administrative (“SG&A”) expense and an allocation of certain global functional SG&A expenses. Segment income and loss excludes provisions for and benefits from income taxes, restructuring items, interest, depreciation and amortization, unrealized and certain realized gains and losses on derivative financial instruments, corporate general and administrative costs, start-up costs, gains and losses on asset sales, currency exchange gains and losses on debt and certain other gains and losses. Intra-entity sales and transfers are recorded at market value. Consolidated cash, net capitalized debt costs, deferred tax assets and assets related to our headquarters offices are not allocated to the segments.
108
ALERIS CORPORATION
NOTES TO CONSOLIDATED FINANCIAL STATEMENTS - (CONTINUED)
(dollars in millions, except share and per share data)
Reportable Segment Information
The following table shows our revenues, segment income and other financial information for each of our reportable segments:
North | Asia | Intra-entity | ||||||||||||||||||
America | Europe | Pacific | Revenues | Total | ||||||||||||||||
Year Ended December 31, 2017 | ||||||||||||||||||||
Revenues to external customers | $ | 1,467.8 | $ | 1,272.6 | $ | 116.9 | $ | 2,857.3 | ||||||||||||
Intra-entity revenues | — | 28.1 | 5.4 | $ | (33.5 | ) | — | |||||||||||||
Total revenues | 1,467.8 | 1,300.7 | 122.3 | (33.5 | ) | 2,857.3 | ||||||||||||||
Segment income | 88.0 | 127.4 | 15.0 | 230.4 | ||||||||||||||||
Segment assets | 1,309.9 | 738.4 | 371.4 | 2,419.7 | ||||||||||||||||
Payments for property, plant and equipment | 174.6 | 25.8 | 5.9 | 206.3 | ||||||||||||||||
Year Ended December 31, 2016 | ||||||||||||||||||||
Revenues to external customers | $ | 1,363.5 | $ | 1,206.0 | $ | 94.4 | $ | 2,663.9 | ||||||||||||
Intra-entity revenues | 1.6 | 16.6 | 6.1 | $ | (24.3 | ) | — | |||||||||||||
Total revenues | 1,365.1 | 1,222.6 | 100.5 | (24.3 | ) | 2,663.9 | ||||||||||||||
Segment income | 86.1 | 149.4 | 10.8 | 246.3 | ||||||||||||||||
Segment assets | 1,180.2 | 645.3 | 358.6 | 2,184.1 | ||||||||||||||||
Payments for property, plant and equipment | 299.9 | 46.2 | 8.2 | 354.3 | ||||||||||||||||
Year Ended December 31, 2015 | ||||||||||||||||||||
Revenues to external customers | $ | 1,531.8 | $ | 1,296.0 | $ | 90.0 | $ | 2,917.8 | ||||||||||||
Intra-entity revenues | 1.0 | 39.3 | 6.4 | $ | (46.7 | ) | — | |||||||||||||
Total revenues | 1,532.8 | 1,335.3 | 96.4 | (46.7 | ) | 2,917.8 | ||||||||||||||
Segment income | 107.9 | 131.8 | — | 239.7 | ||||||||||||||||
Payments for property, plant and equipment | 246.3 | 34.4 | 12.4 | 293.1 | ||||||||||||||||
109
ALERIS CORPORATION
NOTES TO CONSOLIDATED FINANCIAL STATEMENTS - (CONTINUED)
(dollars in millions, except share and per share data)
Reconciliations of total reportable segment disclosures to our consolidated financial statements are as follows:
For the years ended December 31, | ||||||||||||
2017 | 2016 | 2015 | ||||||||||
Profits | ||||||||||||
Total segment income | $ | 230.4 | $ | 246.3 | $ | 239.7 | ||||||
Unallocated amounts: | ||||||||||||
Depreciation and amortization | (115.7 | ) | (104.9 | ) | (123.8 | ) | ||||||
Corporate general and administrative expenses, excluding depreciation, amortization and start-up costs | (56.3 | ) | (51.8 | ) | (48.4 | ) | ||||||
Restructuring charges | (2.9 | ) | (1.5 | ) | (10.3 | ) | ||||||
Interest expense, net | (124.1 | ) | (82.5 | ) | (94.1 | ) | ||||||
Unallocated gains (losses) on derivative financial instruments | 3.1 | 19.1 | (30.2 | ) | ||||||||
Unallocated currency exchange (losses) gains | (2.5 | ) | (0.5 | ) | 1.2 | |||||||
Start-up costs | (73.6 | ) | (46.0 | ) | (21.1 | ) | ||||||
Loss on extinguishment of debt | — | (12.6 | ) | (2.0 | ) | |||||||
Impairment of amounts held in escrow related to the sale of the recycling business | (22.8 | ) | — | — | ||||||||
Other (expense) income, net | (9.6 | ) | 2.1 | (6.0 | ) | |||||||
Loss from continuing operations before income taxes | $ | (174.0 | ) | $ | (32.3 | ) | $ | (95.0 | ) | |||
Payments for property, plant and equipment | ||||||||||||
Total payments for property, plant and equipment for reportable segments | $ | 206.3 | $ | 354.3 | $ | 293.1 | ||||||
Other payments for property, plant and equipment | 1.4 | 3.8 | 20.5 | |||||||||
Total consolidated payments for property, plant and equipment | $ | 207.7 | $ | 358.1 | $ | 313.6 | ||||||
Assets | ||||||||||||
Total assets for reportable segments | $ | 2,419.7 | $ | 2,184.1 | ||||||||
Unallocated assets | 224.7 | 205.8 | ||||||||||
Total consolidated assets | $ | 2,644.4 | $ | 2,389.9 | ||||||||
Geographic Information of Continuing Operations
The following table sets forth the geographic breakout of our revenues (based on customer location) and long-lived tangible assets (net of accumulated depreciation and amortization):
For the years ended December 31, | ||||||||||||
2017 | 2016 | 2015 | ||||||||||
Revenues | ||||||||||||
United States | $ | 1,399.5 | $ | 1,324.8 | $ | 1,499.2 | ||||||
International: | ||||||||||||
Asia | 199.3 | 184.3 | 204.0 | |||||||||
Germany | 439.5 | 433.6 | 479.4 | |||||||||
Other Europe | 603.1 | 548.5 | 546.1 | |||||||||
Mexico, Canada and South America | 191.1 | 148.5 | 168.4 | |||||||||
Other | 24.8 | 24.2 | 20.7 | |||||||||
Total international revenues | 1,457.8 | 1,339.1 | 1,418.6 | |||||||||
Consolidated revenues | $ | 2,857.3 | $ | 2,663.9 | $ | 2,917.8 | ||||||
110
ALERIS CORPORATION
NOTES TO CONSOLIDATED FINANCIAL STATEMENTS - (CONTINUED)
(dollars in millions, except share and per share data)
December 31, | ||||||||
2017 | 2016 | |||||||
Long-lived tangible assets | ||||||||
United States | $ | 906.9 | $ | 822.6 | ||||
International: | ||||||||
Asia | 278.9 | 274.1 | ||||||
Europe | 285.1 | 249.3 | ||||||
Total international | 564.0 | 523.4 | ||||||
Consolidated total | $ | 1,470.9 | $ | 1,346.0 | ||||
16. ACCUMULATED OTHER COMPREHENSIVE LOSS
The following table presents the components of “Accumulated other comprehensive loss” in the Consolidated Balance Sheet, which are items that change equity during the reporting period, but are not included in earnings:
Currency | Pension and other | |||||||||||
Total | translation | postretirement | ||||||||||
Balance at January 1, 2015 | $ | (160.9 | ) | $ | (47.2 | ) | $ | (113.7 | ) | |||
Current year currency translation adjustments | (80.3 | ) | (87.9 | ) | 7.6 | |||||||
Reclassification into earnings due to the sale of businesses | 45.2 | 16.4 | 28.8 | |||||||||
Recognition of net actuarial losses | 15.9 | — | 15.9 | |||||||||
Amortization of net actuarial losses and prior service cost | 5.7 | — | 5.7 | |||||||||
Deferred tax expense on pension and other postretirement liability adjustments | (8.3 | ) | — | (8.3 | ) | |||||||
Balance at December 31, 2015 | (182.7 | ) | (118.7 | ) | (64.0 | ) | ||||||
Current year currency translation adjustments | (29.7 | ) | (32.2 | ) | 2.5 | |||||||
Recognition of net actuarial losses | (19.7 | ) | — | (19.7 | ) | |||||||
Amortization of net actuarial losses and prior service cost | 3.6 | — | 3.6 | |||||||||
Deferred tax expense on pension and other postretirement liability adjustments | 5.0 | — | 5.0 | |||||||||
Balance at December 31, 2016 | (223.5 | ) | (150.9 | ) | (72.6 | ) | ||||||
Current year currency translation adjustments | 82.0 | 86.7 | (4.7 | ) | ||||||||
Recognition of net actuarial losses | (2.0 | ) | — | (2.0 | ) | |||||||
Amortization of net actuarial losses and prior service cost | 4.7 | — | 4.7 | |||||||||
Deferred tax expense on pension and other postretirement liability adjustments | (1.7 | ) | — | (1.7 | ) | |||||||
Balance at December 31, 2017 | $ | (140.5 | ) | $ | (64.2 | ) | $ | (76.3 | ) | |||
A summary of reclassifications out of accumulated other comprehensive loss for the year ended December 31, 2017 is provided below:
Description of reclassifications out of accumulated other comprehensive loss | Amount reclassified | ||||
Amortization of net actuarial losses and prior service cost, before tax | $ | (4.7 | ) | (a) | |
Deferred tax benefit on pension and other postretirement liability adjustments | 0.9 | ||||
Losses reclassified into earnings, net of tax | $ | (3.8 | ) | ||
(a) | This component of accumulated other comprehensive loss is included in the computation of net periodic benefit expense and net postretirement benefit expense (see Note 10, “Employee Benefit Plans,” for additional detail). |
17. DISCONTINUED OPERATIONS
On February 27, 2015, we finalized the sale of our North American and European recycling and specification alloys businesses to Real Industry, Inc. (formerly known as Signature Group Holdings, Inc.) and certain of its affiliates. In addition, on March 1, 2015, we finalized the sale of our extrusions business to Sankyo Tateyama (“Sankyo”), a Japanese building products and extrusions manufacturer. The operations of the recycling and specification alloys and the extrusions businesses were reported as discontinued operations in the Consolidated Statements of Operations.
The following table reconciles the major line items constituting “Income (loss) from discontinued operations, net of tax” presented in the Consolidated Statements of Operations:
111
ALERIS CORPORATION
NOTES TO CONSOLIDATED FINANCIAL STATEMENTS - (CONTINUED)
(dollars in millions, except share and per share data)
For the years ended December 31, | |||||||||||
2017 | 2016 | 2015 | |||||||||
Revenues | $ | — | $ | — | $ | 287.7 | |||||
Cost of sales | — | — | 267.8 | ||||||||
Selling, general and administrative expenses | — | — | 8.7 | ||||||||
Other operating (income) expense, net | — | — | (0.4 | ) | |||||||
Operating income from discontinued operations | — | — | 11.6 | ||||||||
Net gain (loss) on sale of discontinued operations | 4.5 | (3.3 | ) | 191.7 | |||||||
Income (loss) from discontinued operations before income taxes | 4.5 | (3.3 | ) | 203.3 | |||||||
Provision for income taxes | 0.7 | — | 82.2 | ||||||||
Income (loss) from discontinued operations, net of tax | $ | 3.8 | $ | (3.3 | ) | $ | 121.1 | ||||
The following table provides the capital expenditures and significant operating noncash items of the discontinued operations that are included in the Consolidated Statements of Cash Flows:
For the years ended December 31, | ||||||||||
2017 | 2016 | 2015 | ||||||||
Payments for property, plant and equipment | — | $ | — | $ | 15.5 | |||||
Net gain (loss) on sale of discontinued operations | 4.5 | (3.3 | ) | 191.7 | ||||||
Provision for deferred income taxes | 0.7 | — | 78.8 | |||||||
We have entered into contractual arrangements with the disposed entities for the purchase and sale of products in the normal course of business. During the years ended December 31, 2017 and 2016 and for the period subsequent to the sales transactions through December 31, 2015, respectively, we have recorded sales to the disposed entities of $34.5, $46.1 and $69.8 and purchases from the disposed entities of $26.3, $22.8 and $21.8. Such transactions will continue as long as commercially beneficial to the parties involved.
In addition, transition services agreements were entered into with each of the disposed entities upon the completion of the transactions. Under these agreements, we continued to provide support services such as information technology, human resources, accounting and other services to the disposed entities. The majority of these service arrangements were discontinued in 2016. During the years ended December 31, 2017 and 2016 and for the period subsequent to the sales transactions through December 31, 2015, respectively, we invoiced $2.8, $3.9 and $10.8 to the disposed entities under the transition services agreements. These amounts are reflected as a reduction of expense in the Consolidated Statements of Operations.
18. SUPPLEMENTAL INFORMATION
Supplemental cash flow information is as follows:
For the years ended December 31, | ||||||||||||
2017 | 2016 | 2015 | ||||||||||
Cash payments for: | ||||||||||||
Interest | $ | 130.2 | $ | 100.9 | $ | 95.8 | ||||||
Income taxes | 8.5 | 29.5 | 4.9 | |||||||||
Non-cash financing activity associated with lease contracts | 5.5 | 3.6 | 4.1 | |||||||||
112
ALERIS CORPORATION
NOTES TO CONSOLIDATED FINANCIAL STATEMENTS - (CONTINUED)
(dollars in millions, except share and per share data)
19. STOCKHOLDERS’ EQUITY
The following table shows changes in the number of our outstanding shares of common stock:
Outstanding common shares | |||
Balance at January 1, 2015 | 31,281,513 | ||
Issuance associated with options exercised | 101,976 | ||
Issuance associated with vested restricted stock units | 80,781 | ||
Issuance upon conversion of Aleris International preferred stock to common stock | 304,549 | ||
Balance at December 31, 2015 | 31,768,819 | ||
Issuance associated with options exercised | 60,094 | ||
Issuance associated with vested restricted stock units | 74,542 | ||
Issuance upon conversion of Exchangeable Notes | 795 | ||
Balance at December 31, 2016 | 31,904,250 | ||
Issuance associated with vested restricted stock units | 97,068 | ||
Balance at December 31, 2017 | 32,001,318 | ||
20. CONDENSED CONSOLIDATING FINANCIAL STATEMENTS
Aleris Corporation, the direct parent of Aleris International, and certain of its subsidiaries (collectively, the “Guarantor Subsidiaries”) are guarantors of the indebtedness under the 7 7/8% Senior Notes. Aleris Corporation and each of the Guarantor Subsidiaries have fully and unconditionally guaranteed (subject, in the case of the Guarantor Subsidiaries, to customary release provisions as described below), on a joint and several basis, to pay principal and interest related to the 7 7/8% Senior Notes and Aleris International and each of the Guarantor Subsidiaries are directly or indirectly 100% owned subsidiaries of Aleris Corporation. For purposes of complying with the reporting requirements of Aleris International and the Guarantor Subsidiaries, presented below are condensed consolidating financial statements of Aleris Corporation, Aleris International, the Guarantor Subsidiaries, and those other subsidiaries of Aleris Corporation that are not guaranteeing the indebtedness under the 7 7/8% Senior Notes (the “Non-Guarantor Subsidiaries”). Aleris Corporation and the Guarantor Subsidiaries are also guarantors under the 9½% Senior Secured Notes. The condensed consolidating balance sheets are presented as of December 31, 2017 and 2016. The condensed consolidating statements of comprehensive (loss) income and cash flows are presented for the years ended December 31, 2017, 2016 and 2015.
Aleris Corporation is a holding company and currently conducts its business and operations through its direct wholly owned subsidiary, Aleris International and its consolidated subsidiaries. Aleris Corporation has no operations of its own. The only material assets held by Aleris Corporation are its investment in Aleris International, and substantially all of its cash flows are provided by dividends paid or distributions made by Aleris International. The cash to pay dividends, if any, to our stockholders is derived from these cash flows. However, none of our subsidiaries are obligated to make funds available to us for payment of dividends to stockholders. Further, the credit agreement governing the ABL Facility, the 7 7/8% Senior Notes Indenture and the 9½% Senior Secured Notes Indenture contain covenants limiting, subject to certain exceptions, the ability of Aleris International and its restricted subsidiaries to, among other things, pay dividends or distributions on capital stock. Dividend payments and distributions for purposes of paying dividends or making distributions to our stockholders are generally limited to certain predefined amounts and/or only permitted to the extent that Aleris International and its subsidiaries maintain certain financial ratios or liquidity measures after the payment of such dividend or distribution.
The guarantee of a Guarantor Subsidiary will be automatically and unconditionally released and discharged in the event of:
▪ | any sale of the Guarantor Subsidiary or of all or substantially all of its assets; |
▪ | a Guarantor Subsidiary being designated as an “unrestricted subsidiary” in accordance with the indentures governing the applicable Senior Notes; |
▪ | the release or discharge of a Guarantor Subsidiary from its guarantee under the ABL Facility or other indebtedness that resulted in the obligation of the Guarantor Subsidiary under the indentures governing the applicable Senior Notes; and |
▪ | the requirements for legal defeasance or covenant defeasance or discharge of the indentures governing the applicable Senior Notes having been satisfied. |
113
ALERIS CORPORATION
NOTES TO CONSOLIDATED FINANCIAL STATEMENTS - (CONTINUED)
(dollars in millions, except share and per share data)
Upon the completion of the sale of the recycling and specification alloys business on February 27, 2015, the guarantees of the Guarantor Subsidiaries that were sold were automatically and unconditionally released.
As of December 31, 2017 | ||||||||||||||||||||||||
Aleris Corporation (Parent) | Aleris International, Inc. | Guarantor Subsidiaries | Non-Guarantor Subsidiaries | Eliminations | Consolidated | |||||||||||||||||||
ASSETS | ||||||||||||||||||||||||
Current Assets | ||||||||||||||||||||||||
Cash and cash equivalents | $ | — | $ | 40.3 | $ | — | $ | 64.2 | $ | (2.1 | ) | $ | 102.4 | |||||||||||
Accounts receivable, net | — | 0.2 | 83.0 | 162.5 | — | 245.7 | ||||||||||||||||||
Inventories | — | — | 286.6 | 344.6 | — | 631.2 | ||||||||||||||||||
Prepaid expenses and other current assets | — | 3.4 | 10.0 | 22.7 | — | 36.1 | ||||||||||||||||||
Intercompany receivables | — | 134.6 | 46.0 | 32.4 | (213.0 | ) | — | |||||||||||||||||
Total Current Assets | — | 178.5 | 425.6 | 626.4 | (215.1 | ) | 1,015.4 | |||||||||||||||||
Property, plant and equipment, net | — | — | 903.7 | 567.2 | — | 1,470.9 | ||||||||||||||||||
Intangible assets, net | — | — | 18.8 | 15.9 | — | 34.7 | ||||||||||||||||||
Deferred income taxes | — | — | — | 70.7 | — | 70.7 | ||||||||||||||||||
Other long-term assets | — | 3.4 | 8.0 | 41.3 | — | 52.7 | ||||||||||||||||||
Investments in subsidiaries | 96.3 | 1,514.4 | 4.5 | — | (1,615.2 | ) | — | |||||||||||||||||
Total Assets | $ | 96.3 | $ | 1,696.3 | $ | 1,360.6 | $ | 1,321.5 | $ | (1,830.3 | ) | $ | 2,644.4 | |||||||||||
LIABILITIES AND STOCKHOLDERS’ EQUITY | ||||||||||||||||||||||||
Current Liabilities | ||||||||||||||||||||||||
Accounts payable | $ | — | $ | 4.3 | $ | 140.7 | $ | 156.3 | $ | (2.1 | ) | $ | 299.2 | |||||||||||
Accrued liabilities | — | 43.9 | 75.8 | 77.7 | — | 197.4 | ||||||||||||||||||
Current portion of long-term debt | — | — | 1.0 | 8.1 | — | 9.1 | ||||||||||||||||||
Intercompany payables | 3.6 | 54.8 | 137.8 | 16.8 | (213.0 | ) | — | |||||||||||||||||
Total Current Liabilities | 3.6 | 103.0 | 355.3 | 258.9 | (215.1 | ) | 505.7 | |||||||||||||||||
Long-term debt | — | 1,497.0 | 1.0 | 273.4 | — | 1,771.4 | ||||||||||||||||||
Deferred income taxes | — | — | 0.2 | 3.8 | — | 4.0 | ||||||||||||||||||
Accrued pension benefits | — | — | 45.2 | 125.0 | — | 170.2 | ||||||||||||||||||
Accrued postretirement benefits | — | — | 34.3 | — | — | 34.3 | ||||||||||||||||||
Other long-term liabilities | — | — | 34.2 | 31.9 | — | 66.1 | ||||||||||||||||||
Total Long-Term Liabilities | — | 1,497.0 | 114.9 | 434.1 | — | 2,046.0 | ||||||||||||||||||
Total Aleris Corporation Equity | 92.7 | 96.3 | 890.4 | 628.5 | (1,615.2 | ) | 92.7 | |||||||||||||||||
Total Liabilities and Equity | $ | 96.3 | $ | 1,696.3 | $ | 1,360.6 | $ | 1,321.5 | $ | (1,830.3 | ) | $ | 2,644.4 | |||||||||||
114
ALERIS CORPORATION
NOTES TO CONSOLIDATED FINANCIAL STATEMENTS - (CONTINUED)
(dollars in millions, except share and per share data)
As of December 31, 2016 | ||||||||||||||||||||||||
Aleris Corporation (Parent) | Aleris International, Inc. | Guarantor Subsidiaries | Non-Guarantor Subsidiaries | Eliminations | Consolidated | |||||||||||||||||||
ASSETS | ||||||||||||||||||||||||
Current Assets | ||||||||||||||||||||||||
Cash and cash equivalents | $ | — | $ | 5.5 | $ | — | $ | 53.3 | $ | (3.2 | ) | $ | 55.6 | |||||||||||
Accounts receivable, net | — | — | 81.0 | 137.7 | — | 218.7 | ||||||||||||||||||
Inventories | — | — | 240.8 | 298.1 | — | 538.9 | ||||||||||||||||||
Prepaid expenses and other current assets | — | — | 15.2 | 18.2 | — | 33.4 | ||||||||||||||||||
Intercompany receivables | — | 897.9 | 296.5 | 164.2 | (1,358.6 | ) | — | |||||||||||||||||
Total Current Assets | — | 903.4 | 633.5 | 671.5 | (1,361.8 | ) | 846.6 | |||||||||||||||||
Property, plant and equipment, net | — | — | 819.1 | 526.9 | — | 1,346.0 | ||||||||||||||||||
Intangible assets, net | — | — | 20.9 | 15.9 | — | 36.8 | ||||||||||||||||||
Deferred income taxes | — | — | — | 88.3 | — | 88.3 | ||||||||||||||||||
Other long-term assets | — | 10.8 | 6.1 | 55.3 | — | 72.2 | ||||||||||||||||||
Investments in subsidiaries | 217.6 | 1,089.6 | 2.8 | — | (1,310.0 | ) | — | |||||||||||||||||
Total Assets | $ | 217.6 | $ | 2,003.8 | $ | 1,482.4 | $ | 1,357.9 | $ | (2,671.8 | ) | $ | 2,389.9 | |||||||||||
LIABILITIES AND STOCKHOLDERS’ EQUITY | ||||||||||||||||||||||||
Current Liabilities | ||||||||||||||||||||||||
Accounts payable | $ | — | $ | 1.8 | $ | 126.1 | $ | 121.9 | $ | (3.2 | ) | $ | 246.6 | |||||||||||
Accrued liabilities | — | 19.8 | 109.3 | 72.3 | — | 201.4 | ||||||||||||||||||
Current portion of long-term debt | — | — | 0.5 | 27.2 | — | 27.7 | ||||||||||||||||||
Intercompany payables | 1.0 | 616.2 | 719.6 | 21.8 | (1,358.6 | ) | — | |||||||||||||||||
Total Current Liabilities | 1.0 | 637.8 | 955.5 | 243.2 | (1,361.8 | ) | 475.7 | |||||||||||||||||
Long-term debt | — | 1,148.4 | 0.6 | 289.5 | — | 1,438.5 | ||||||||||||||||||
Deferred income taxes | — | — | 0.2 | 2.6 | — | 2.8 | ||||||||||||||||||
Accrued pension benefits | — | — | 44.1 | 114.3 | — | 158.4 | ||||||||||||||||||
Accrued postretirement benefits | — | — | 34.2 | — | — | 34.2 | ||||||||||||||||||
Other long-term liabilities | — | — | 36.5 | 27.2 | — | 63.7 | ||||||||||||||||||
Total Long-Term Liabilities | — | 1,148.4 | 115.6 | 433.6 | — | 1,697.6 | ||||||||||||||||||
Total Aleris Corporation Equity | 216.6 | 217.6 | 411.3 | 681.1 | (1,310.0 | ) | 216.6 | |||||||||||||||||
Total Liabilities and Equity | $ | 217.6 | $ | 2,003.8 | $ | 1,482.4 | $ | 1,357.9 | $ | (2,671.8 | ) | $ | 2,389.9 | |||||||||||
115
ALERIS CORPORATION
NOTES TO CONSOLIDATED FINANCIAL STATEMENTS - (CONTINUED)
(dollars in millions, except share and per share data)
For the year ended December 31, 2017 | ||||||||||||||||||||||||
Aleris Corporation (Parent) | Aleris International, Inc. | Guarantor Subsidiaries | Non-Guarantor Subsidiaries | Eliminations | Consolidated | |||||||||||||||||||
Revenues | $ | — | $ | — | $ | 1,467.8 | $ | 1,417.5 | $ | (28.0 | ) | $ | 2,857.3 | |||||||||||
Cost of sales | — | — | 1,405.6 | 1,220.3 | (28.0 | ) | 2,597.9 | |||||||||||||||||
Gross profit | — | — | 62.2 | 197.2 | — | 259.4 | ||||||||||||||||||
Selling, general and administrative expenses | — | 17.0 | 117.5 | 86.3 | — | 220.8 | ||||||||||||||||||
Restructuring charges | — | — | 1.7 | 1.2 | 2.9 | |||||||||||||||||||
Losses on derivative financial instruments | — | — | 42.9 | 1.8 | — | 44.7 | ||||||||||||||||||
Other operating expense, net | — | — | 5.7 | — | — | 5.7 | ||||||||||||||||||
Operating (loss) income | — | (17.0 | ) | (105.6 | ) | 107.9 | — | (14.7 | ) | |||||||||||||||
Interest expense, net | — | — | 95.3 | 28.8 | — | 124.1 | ||||||||||||||||||
Other expense, net | — | 3.2 | 9.6 | 22.4 | — | 35.2 | ||||||||||||||||||
Equity in net loss (earnings) of affiliates | 210.6 | 194.8 | (1.7 | ) | — | (403.7 | ) | — | ||||||||||||||||
(Loss) income before income taxes | (210.6 | ) | (215.0 | ) | (208.8 | ) | 56.7 | 403.7 | (174.0 | ) | ||||||||||||||
(Benefit from) provision for income taxes | — | (0.6 | ) | (1.9 | ) | 42.9 | — | 40.4 | ||||||||||||||||
(Loss) income from continuing operations | (210.6 | ) | (214.4 | ) | (206.9 | ) | 13.8 | 403.7 | (214.4 | ) | ||||||||||||||
Income from discontinued operations, net of tax | — | 3.8 | — | — | — | 3.8 | ||||||||||||||||||
Net (loss) income | $ | (210.6 | ) | $ | (210.6 | ) | $ | (206.9 | ) | $ | 13.8 | $ | 403.7 | $ | (210.6 | ) | ||||||||
Comprehensive (loss) income | $ | (127.6 | ) | $ | (127.6 | ) | $ | (205.3 | ) | $ | 95.1 | $ | 237.8 | $ | (127.6 | ) | ||||||||
For the year ended December 31, 2016 | ||||||||||||||||||||||||
Aleris Corporation (Parent) | Aleris International, Inc. | Guarantor Subsidiaries | Non-Guarantor Subsidiaries | Eliminations | Consolidated | |||||||||||||||||||
Revenues | $ | — | $ | — | $ | 1,364.8 | $ | 1,316.8 | $ | (17.7 | ) | $ | 2,663.9 | |||||||||||
Cost of sales | — | — | 1,276.1 | 1,117.6 | (17.7 | ) | 2,376.0 | |||||||||||||||||
Gross profit | — | — | 88.7 | 199.2 | — | 287.9 | ||||||||||||||||||
Selling, general and administrative expenses | — | 2.0 | 135.9 | 80.6 | — | 218.5 | ||||||||||||||||||
Restructuring charges | — | — | 0.4 | 1.1 | — | 1.5 | ||||||||||||||||||
Losses on derivative financial instruments | — | — | 1.6 | 10.5 | — | 12.1 | ||||||||||||||||||
Other operating expense, net | — | — | 3.3 | 0.6 | — | 3.9 | ||||||||||||||||||
Operating (loss) income | — | (2.0 | ) | (52.5 | ) | 106.4 | — | 51.9 | ||||||||||||||||
Interest expense, net | — | — | 51.5 | 31.0 | — | 82.5 | ||||||||||||||||||
Other expense (income), net | — | 8.2 | 13.0 | (19.5 | ) | — | 1.7 | |||||||||||||||||
Equity in net loss (earnings) of affiliates | 75.6 | 60.5 | (0.8 | ) | — | (135.3 | ) | — | ||||||||||||||||
(Loss) income before income taxes | (75.6 | ) | (70.7 | ) | (116.2 | ) | 94.9 | 135.3 | (32.3 | ) | ||||||||||||||
Provision for income taxes | — | 0.3 | — | 39.7 | — | 40.0 | ||||||||||||||||||
(Loss) income from continuing operations | (75.6 | ) | (71.0 | ) | (116.2 | ) | 55.2 | 135.3 | (72.3 | ) | ||||||||||||||
(Loss) income from discontinued operations, net of tax | — | (4.6 | ) | — | 1.3 | — | (3.3 | ) | ||||||||||||||||
Net (loss) income | $ | (75.6 | ) | $ | (75.6 | ) | $ | (116.2 | ) | $ | 56.5 | $ | 135.3 | $ | (75.6 | ) | ||||||||
Comprehensive (loss) income | $ | (116.4 | ) | $ | (116.4 | ) | $ | (114.2 | ) | $ | 13.8 | $ | 216.8 | $ | (116.4 | ) | ||||||||
116
ALERIS CORPORATION
NOTES TO CONSOLIDATED FINANCIAL STATEMENTS - (CONTINUED)
(dollars in millions, except share and per share data)
For the year ended December 31, 2015 | ||||||||||||||||||||||||
Aleris Corporation (Parent) | Aleris International, Inc. | Guarantor Subsidiaries | Non-Guarantor Subsidiaries | Eliminations | Consolidated | |||||||||||||||||||
Revenues | $ | — | $ | — | $ | 1,530.7 | $ | 1,410.3 | $ | (23.2 | ) | $ | 2,917.8 | |||||||||||
Cost of sales | — | — | 1,449.2 | 1,276.9 | (23.2 | ) | 2,702.9 | |||||||||||||||||
Gross profit | — | — | 81.5 | 133.4 | — | 214.9 | ||||||||||||||||||
Selling, general and administrative expenses | — | 3.8 | 103.4 | 96.3 | — | 203.5 | ||||||||||||||||||
Restructuring charges | — | — | 5.0 | 5.3 | — | 10.3 | ||||||||||||||||||
(Gains) losses on derivative financial instruments | — | — | (2.4 | ) | 9.3 | — | 6.9 | |||||||||||||||||
Other operating expense, net | — | — | 1.7 | 0.8 | — | 2.5 | ||||||||||||||||||
Operating (loss) income | — | (3.8 | ) | (26.2 | ) | 21.7 | — | (8.3 | ) | |||||||||||||||
Interest expense, net | — | — | 55.7 | 38.4 | — | 94.1 | ||||||||||||||||||
Other expense (income), net | — | 1.6 | (4.3 | ) | (4.7 | ) | — | (7.4 | ) | |||||||||||||||
Equity in net (earnings) loss of affiliates | (48.7 | ) | 123.0 | (1.8 | ) | — | (72.5 | ) | — | |||||||||||||||
Income (loss) before income taxes | 48.7 | (128.4 | ) | (75.8 | ) | (12.0 | ) | 72.5 | (95.0 | ) | ||||||||||||||
(Benefit from) provision for income taxes | — | — | (41.7 | ) | 19.0 | — | (22.7 | ) | ||||||||||||||||
Income (loss) from continuing operations | 48.7 | (128.4 | ) | (34.1 | ) | (31.0 | ) | 72.5 | (72.3 | ) | ||||||||||||||
Income (loss) from discontinued operations, net of tax | — | 177.1 | (95.6 | ) | 39.6 | — | 121.1 | |||||||||||||||||
Net income (loss) | 48.7 | 48.7 | (129.7 | ) | 8.6 | 72.5 | 48.8 | |||||||||||||||||
Net income from discontinued operations attributable to noncontrolling interest | — | — | — | 0.1 | — | 0.1 | ||||||||||||||||||
Net income (loss) attributable to Aleris Corporation | $ | 48.7 | $ | 48.7 | $ | (129.7 | ) | $ | 8.5 | $ | 72.5 | $ | 48.7 | |||||||||||
Comprehensive income (loss) | $ | 26.9 | $ | 26.9 | $ | (128.6 | ) | $ | (14.2 | ) | $ | 116.0 | $ | 27.0 | ||||||||||
Comprehensive income attributable to noncontrolling interest | — | — | — | 0.1 | — | 0.1 | ||||||||||||||||||
Comprehensive income (loss) attributable to Aleris Corporation | $ | 26.9 | $ | 26.9 | $ | (128.6 | ) | $ | (14.3 | ) | $ | 116.0 | $ | 26.9 | ||||||||||
117
ALERIS CORPORATION
NOTES TO CONSOLIDATED FINANCIAL STATEMENTS - (CONTINUED)
(dollars in millions, except share and per share data)
For the year ended December 31, 2017 | |||||||||||||||||||||||
Aleris Corporation (Parent) | Aleris International, Inc. | Guarantor Subsidiaries | Non-Guarantor Subsidiaries | Eliminations | Consolidated | ||||||||||||||||||
Net cash provided (used) by operating activities | $ | 2.9 | $ | 505.7 | $ | (499.3 | ) | $ | 121.5 | $ | (162.2 | ) | $ | (31.4 | ) | ||||||||
Investing activities | |||||||||||||||||||||||
Payments for property, plant and equipment | — | — | (175.9 | ) | (31.8 | ) | — | (207.7 | ) | ||||||||||||||
Disbursements of intercompany loans | — | — | — | (14.5 | ) | 14.5 | — | ||||||||||||||||
Repayments from intercompany loans | — | — | — | 135.0 | (135.0 | ) | — | ||||||||||||||||
Equity contributions in subsidiaries | — | (704.7 | ) | (1.0 | ) | — | 705.7 | — | |||||||||||||||
Return of investments in subsidiaries | — | 8.3 | 7.0 | — | (15.3 | ) | — | ||||||||||||||||
Other | — | — | (3.0 | ) | — | — | (3.0 | ) | |||||||||||||||
Net cash (used) provided by investing activities | — | (696.4 | ) | (172.9 | ) | 88.7 | 569.9 | (210.7 | ) | ||||||||||||||
Financing activities | |||||||||||||||||||||||
Proceeds from revolving credit facilities | — | 270.0 | — | 305.1 | — | 575.1 | |||||||||||||||||
Payments on revolving credit facilities | — | (185.0 | ) | — | (351.3 | ) | — | (536.3 | ) | ||||||||||||||
Proceeds from senior secured notes, net of discount | — | 263.8 | — | — | — | 263.8 | |||||||||||||||||
Payments on other long-term debt | — | — | (0.7 | ) | (5.7 | ) | — | (6.4 | ) | ||||||||||||||
Debt issuance costs | — | (2.8 | ) | — | — | — | (2.8 | ) | |||||||||||||||
Proceeds from intercompany loans | — | 14.5 | — | — | (14.5 | ) | — | ||||||||||||||||
Repayments on intercompany loans | — | (135.0 | ) | — | — | 135.0 | — | ||||||||||||||||
Proceeds from intercompany equity contributions | — | — | 680.5 | 25.2 | (705.7 | ) | — | ||||||||||||||||
Dividends paid | — | — | (8.0 | ) | (170.6 | ) | 178.6 | — | |||||||||||||||
Other | (2.9 | ) | — | 0.4 | (0.4 | ) | — | (2.9 | ) | ||||||||||||||
Net cash (used) provided by financing activities | (2.9 | ) | 225.5 | 672.2 | (197.7 | ) | (406.6 | ) | 290.5 | ||||||||||||||
Effect of exchange rate differences on cash and cash equivalents | — | — | — | 4.0 | — | 4.0 | |||||||||||||||||
Net increase in cash and cash equivalents | — | 34.8 | — | 16.5 | 1.1 | 52.4 | |||||||||||||||||
Cash, cash equivalents and restricted cash at beginning of period | — | 5.5 | — | 53.3 | (3.2 | ) | 55.6 | ||||||||||||||||
Cash, cash equivalents and restricted cash at end of period | $ | — | $ | 40.3 | $ | — | $ | 69.8 | $ | (2.1 | ) | $ | 108.0 | ||||||||||
Cash and cash equivalents | $ | — | $ | 40.3 | $ | — | $ | 64.2 | $ | (2.1 | ) | $ | 102.4 | ||||||||||
Restricted cash (included in “Prepaid expenses and other current assets”) | — | — | — | 5.6 | — | 5.6 | |||||||||||||||||
Cash, cash equivalents and restricted cash | $ | — | $ | 40.3 | $ | — | $ | 69.8 | $ | (2.1 | ) | $ | 108.0 | ||||||||||
118
ALERIS CORPORATION
NOTES TO CONSOLIDATED FINANCIAL STATEMENTS - (CONTINUED)
(dollars in millions, except share and per share data)
For the year ended December 31, 2016 | |||||||||||||||||||||||
Aleris Corporation (Parent) | Aleris International, Inc. | Guarantor Subsidiaries | Non-Guarantor Subsidiaries | Eliminations | Consolidated | ||||||||||||||||||
Net cash provided (used) by operating activities | $ | 0.7 | $ | (340.2 | ) | $ | 285.3 | $ | 70.4 | $ | (4.2 | ) | $ | 12.0 | |||||||||
Investing activities | |||||||||||||||||||||||
Payments for property, plant and equipment | — | — | (301.8 | ) | (56.3 | ) | — | (358.1 | ) | ||||||||||||||
Proceeds from the sale of businesses, net of cash transferred | — | 5.0 | — | — | — | 5.0 | |||||||||||||||||
Disbursements of intercompany loans | — | — | — | (135.0 | ) | 135.0 | — | ||||||||||||||||
Equity contributions in subsidiaries | — | (16.4 | ) | — | — | 16.4 | — | ||||||||||||||||
Return of investments in subsidiaries | — | — | 1.8 | — | (1.8 | ) | — | ||||||||||||||||
Other | — | — | (1.7 | ) | 0.2 | — | (1.5 | ) | |||||||||||||||
Net cash used by investing activities | — | (11.4 | ) | (301.7 | ) | (191.1 | ) | 149.6 | (354.6 | ) | |||||||||||||
Financing activities | |||||||||||||||||||||||
Proceeds from revolving credit facilities | — | 235.0 | — | 125.4 | — | 360.4 | |||||||||||||||||
Payments on revolving credit facilities | — | (105.0 | ) | — | (2.0 | ) | — | (107.0 | ) | ||||||||||||||
Proceeds from senior secured notes, net of discount | — | 540.4 | — | — | — | 540.4 | |||||||||||||||||
Payments on senior notes, including premiums | — | (443.8 | ) | — | — | (443.8 | ) | ||||||||||||||||
Payments on other long-term debt | — | (0.5 | ) | (0.6 | ) | (6.2 | ) | — | (7.3 | ) | |||||||||||||
Debt issuance costs | (4.0 | ) | — | — | — | (4.0 | ) | ||||||||||||||||
Proceeds from intercompany loans | — | 135.0 | — | (135.0 | ) | — | |||||||||||||||||
Proceeds from intercompany equity contributions | — | — | 16.4 | — | (16.4 | ) | — | ||||||||||||||||
Dividends paid | — | — | (0.3 | ) | (2.5 | ) | 2.8 | — | |||||||||||||||
Other | (0.7 | ) | — | 0.9 | (0.8 | ) | — | (0.6 | ) | ||||||||||||||
Net cash (used) provided by financing activities | (0.7 | ) | 357.1 | 16.4 | 113.9 | (148.6 | ) | 338.1 | |||||||||||||||
Effect of exchange rate differences on cash and cash equivalents | — | — | — | (2.1 | ) | — | (2.1 | ) | |||||||||||||||
Net increase (decrease) in cash and cash equivalents | — | 5.5 | — | (8.9 | ) | (3.2 | ) | (6.6 | ) | ||||||||||||||
Cash and cash equivalents at beginning of period | — | — | — | 62.2 | — | 62.2 | |||||||||||||||||
Cash and cash equivalents at end of period | $ | — | $ | 5.5 | $ | — | $ | 53.3 | $ | (3.2 | ) | $ | 55.6 | ||||||||||
119
ALERIS CORPORATION
NOTES TO CONSOLIDATED FINANCIAL STATEMENTS - (CONTINUED)
(dollars in millions, except share and per share data)
For the year ended December 31, 2015 | |||||||||||||||||||||||
Aleris Corporation (Parent) | Aleris International, Inc. | Guarantor Subsidiaries | Non-Guarantor Subsidiaries | Eliminations | Consolidated | ||||||||||||||||||
Net cash provided by operating activities | $ | 1.4 | $ | 67.3 | $ | 235.0 | $ | 81.2 | $ | (265.4 | ) | $ | 119.5 | ||||||||||
Investing activities | |||||||||||||||||||||||
Payments for property, plant and equipment | — | — | (258.2 | ) | (55.4 | ) | — | (313.6 | ) | ||||||||||||||
Proceeds from the sale of businesses, net of cash transferred | — | 319.4 | 4.5 | 263.5 | — | 587.4 | |||||||||||||||||
Disbursements of intercompany loans | — | (46.7 | ) | (0.2 | ) | (20.3 | ) | 67.2 | — | ||||||||||||||
Repayments from intercompany loans | — | 46.7 | 3.9 | 34.3 | (84.9 | ) | — | ||||||||||||||||
Equity contributions in subsidiaries | (5.2 | ) | (190.5 | ) | (9.5 | ) | — | 205.2 | — | ||||||||||||||
Return of investments in subsidiaries | 6.0 | 173.6 | 11.5 | — | (191.1 | ) | — | ||||||||||||||||
Other | — | (1.1 | ) | (0.3 | ) | 1.3 | — | (0.1 | ) | ||||||||||||||
Net cash provided (used) by investing activities | 0.8 | 301.4 | (248.3 | ) | 223.4 | (3.6 | ) | 273.7 | |||||||||||||||
Financing activities | |||||||||||||||||||||||
Proceeds from revolving credit facilities | — | 111.0 | — | 48.5 | — | 159.5 | |||||||||||||||||
Payments on revolving credit facilities | — | (335.0 | ) | — | (45.8 | ) | — | (380.8 | ) | ||||||||||||||
Payments on the senior notes | — | (125.0 | ) | — | — | — | (125.0 | ) | |||||||||||||||
Net proceeds from (payments on) other long-term debt | — | 0.1 | (0.4 | ) | (6.1 | ) | — | (6.4 | ) | ||||||||||||||
Debt issuance costs | — | (4.6 | ) | — | — | — | (4.6 | ) | |||||||||||||||
Proceeds from intercompany loans | — | 20.3 | — | 46.9 | (67.2 | ) | — | ||||||||||||||||
Repayments on intercompany loans | — | (34.3 | ) | — | (50.6 | ) | 84.9 | — | |||||||||||||||
Proceeds from intercompany equity contributions | — | 5.2 | 190.4 | 9.6 | (205.2 | ) | — | ||||||||||||||||
Dividends paid | — | (6.0 | ) | (176.7 | ) | (273.8 | ) | 456.5 | — | ||||||||||||||
Other | (2.2 | ) | (0.4 | ) | — | — | — | (2.6 | ) | ||||||||||||||
Net cash (used) provided by financing activities | (2.2 | ) | (368.7 | ) | 13.3 | (271.3 | ) | 269.0 | (359.9 | ) | |||||||||||||
Effect of exchange rate differences on cash and cash equivalents | — | — | — | (7.1 | ) | — | (7.1 | ) | |||||||||||||||
Net increase in cash and cash equivalents | — | — | — | 26.2 | — | 26.2 | |||||||||||||||||
Cash and cash equivalents at beginning of period | — | — | — | 36.0 | — | 36.0 | |||||||||||||||||
Cash and cash equivalents at end of period | $ | — | $ | — | $ | — | $ | 62.2 | $ | — | $ | 62.2 | |||||||||||
ITEM 9. CHANGES IN AND DISAGREEMENTS WITH ACCOUNTANTS ON ACCOUNTING AND FINANCIAL DISCLOSURE.
None.
ITEM 9A. CONTROLS AND PROCEDURES.
Disclosure Controls and Procedures
During the fiscal period covered by this report, the Company’s management, with the participation of the Chief Executive Officer and Chief Financial Officer, completed an evaluation of the effectiveness of the design and operation of the Company’s disclosure controls and procedures (as defined in Rules 13a-15(e) and 15d-15(e) of the Securities and Exchange Act of 1934, as amended (the “Exchange Act”). Based upon this evaluation, the Company’s Chief Executive Officer and Chief Financial Officer have concluded that, as of the end of the fiscal period covered by this report, the disclosure controls and procedures were effective to ensure that information required to be disclosed by the Company in reports that it files or submits under the Exchange Act is recorded, processed, summarized and reported within the time periods specified by the SEC’s rules and forms and that such information is accumulated and communicated to management, including the Chief Executive Officer and Chief Financial Officer, as appropriate, to allow timely decisions regarding required disclosures.
Management’s Annual Report on Internal Control Over Financial Reporting
Management’s annual report on internal control over financial reporting is included in Item 8. – “Financial Statements and Supplementary Data,” of this annual report on Form 10-K.
120
Attestation Report of the Independent Registered Public Accounting Firm
The attestation report of Ernst & Young LLP, our independent registered public accounting firm, on the effectiveness of our internal control over financial reporting is included in Item 8. – “Financial Statements and Supplementary Data,” of this annual report on Form 10-K.
Changes in Internal Control Over Financial Reporting
There were no changes in internal control over financial reporting during the fiscal fourth quarter ended December 31, 2017, that have materially affected, or are reasonably likely to materially affect, our internal control over financial reporting.
ITEM 9B. OTHER INFORMATION.
There was no information required to be disclosed in a Current Report on Form 8-K during the fourth quarter of the fiscal year covered by this annual report on Form 10-K that was not reported.
PART III
ITEM 10. DIRECTORS, EXECUTIVE OFFICERS AND CORPORATE GOVERNANCE.
MANAGEMENT
Name | Age | Position |
Sean M. Stack | 51 | Chairman and Chief Executive Officer |
Eric M. Rychel | 44 | Executive Vice President, Chief Financial Officer and Treasurer |
Jacobus A.J. Govers | 50 | Executive Vice President, President of Europe and Global Markets |
Michael T. Keown | 41 | Executive Vice President, President of Aleris North America |
Christopher R. Clegg | 60 | Executive Vice President, General Counsel and Secretary |
Tamara S. Polmanteer | 52 | Executive Vice President, Chief Human Resources Officer |
Brook D. Hinchman | 35 | Director |
Brian K. Laibow | 40 | Director |
Matthew R. Michelini | 36 | Director |
Donald T. Misheff | 61 | Director |
Robert O’Leary | 47 | Director |
Emily Stephens | 42 | Director |
Lawrence W. Stranghoener | 63 | Director |
Kaj Vazales | 39 | Director |
G. Richard Wagoner, Jr. | 65 | Director |
The following biographies describe the business experience during at least the past five years of the directors and executive officers listed in the table above.
Sean M. Stack - Mr. Stack currently serves as Chairman and Chief Executive Officer. He was appointed Chairman of the Board in December 2016. He was appointed President and Chief Executive Officer in July 2015. He was previously Executive Vice President and Chief Executive Officer, Rolled Products North America where he was responsible for all business and operational activities with respect to our Rolled Products North American business. Prior to that, he served as Executive Vice President and Chief Financial Officer from February 2009 through March 2014. He joined Commonwealth in June 2004 as Vice President and Treasurer and became Senior Vice President and Treasurer in December 2004 upon the merger with IMCO Recycling. During his tenure at Aleris, he has held roles of increasing responsibility including Executive Vice President, Corporate Development and Strategy, and Executive Vice President and President, Aleris Europe. Mr. Stack currently serves on the board of the Aluminum Association and College Now.
Mr. Stack has extensive operational, financial and managerial experience with the Company. His day-to-day leadership of the Company as well as his involvement with various aluminum industry associations provide an in-depth understanding of the aluminum industry generally and unparalled experience with the Company’s operations and corporate transactions.
121
Eric M. Rychel - Mr. Rychel currently serves as Executive Vice President, Chief Financial Officer and Treasurer. From April 2014 through December 2014 he served as Senior Vice President and Chief Financial Officer. He joined Aleris in 2012 and previously served as Vice President and Treasurer with responsibility for treasury, strategy, corporate development and investor relations. Mr. Rychel was a managing director in the Industrials Group at Barclays Capital, Inc., where he ran its Metals industry banking effort as the global head of Steel and Metals corporate finance coverage. Prior to that, Mr. Rychel was a managing director at Deutsche Bank Securities, Inc., from 1998 to 2009, where he ran the Metals industry investment banking effort. Mr. Rychel began his career as an analyst at LSG Advisors, an M&A boutique and predecessor to SG Cowen. Mr. Rychel currently serves a member of the board of directors of Cliff Natural Resources Inc. and the board of trustees for Pangea Properties.
Jacobus A. J. Govers - Mr. Govers serves as Executive Vice President, President of Europe and Global Markets. In this role, Mr. Govers oversees all aspects of the European business as well as the Company’s global automotive and aerospace strategy. Prior to joining the Company in June 2016, Mr. Govers served as General Manager, Global Forms for SABIC, one of the world’s leading petrochemical producers. In this capacity, he was leading a global business team focused on serving and innovating with customers in the automotive, aerospace and consumer electronics markets. He also previously served as general manager of SABIC’s global sheet and film business, which duties included, in part, management board oversight for the Europe region for SABIC Innovative Plastics. Mr. Govers became part of the SABIC team following the Company’s acquisition of GE Plastics in 2007. Previously, he spent 15 years at General Electric, holding various leadership positions in operations, business development, sales and marketing across GE Plastics, GE Capital, and GE Corporate. Mr. Govers holds a Master of Science degree in Mechanical Engineering from the University of Technology in Delft, the Netherlands and graduated as a Navy officer from the Royal Navy Institute in Den Helder, the Netherlands.
Michael T. Keown - Mr. Keown serves as Executive Vice President and President of Aleris North America. Throughout his 19 year career with the Company, Mr. Keown has held various positions in Finance, Metal Procurement, Supply Chain and General Management in North America, Europe, and Asia. Prior to his current role, from November 2015 he served as Senior Vice President and President of Aleris North America. From 2014 through November 2015, Mr. Keown served as Vice President, Supply Chain for North America. Prior to these roles, Mr. Keown spent three years working for the Company in Europe, where he served as Vice President and General Manager for the company's Extrusions business and earlier as Vice President of Supply Chain, Europe and Asia.
Christopher R. Clegg - Mr. Clegg has served as the Executive Vice President, General Counsel and Secretary since January 2007. From 2005 to 2007, he was the Company’s Senior Vice President, General Counsel and Secretary. He joined Commonwealth in June 2004 as Vice President, General Counsel and Secretary, and upon the merger with IMCO Recycling, he became Senior Vice President, General Counsel and Secretary.
Tamara S. Polmanteer - Ms. Polmanteer serves as Executive Vice President and Chief Human Resources Officer. Prior to joining the Company in April 2016, she led human resources strategy and operations at Daymon Worldwide where she spent five years successfully leading the HR team through necessary restructuring efforts to ensure the organization was positioned for continued growth. Ms. Polmanteer earlier spent 17 years at the Kellogg Company where she was Vice President, Human Resources, International and Corporate Functions among other leadership roles. In addition, she was the Executive Sponsor for the Women of Kellogg’s Employee Resource Group for several years. She holds a bachelor’s degree in Business Management from Nazareth College in Kalamazoo, Michigan.
Brook D. Hinchman - Mr. Hinchman has served as a Director since December 2015. He was appointed by the Oaktree Funds. He is an investment professional in Oaktree’s Distressed Debt group, where he serves as a senior vice president. Prior to joining Oaktree in 2010, Mr. Hinchman spent four years at Goldman, Sachs & Co., most recently in the Merchant Banking Division. Mr. Hinchman serves on the board of directors of Genesis Capital and Teleios. Mr. Hinchman received a BBA degree in Finance from the Tippie College of Business at the University of Iowa.
Mr. Hinchman was appointed by the Oaktree Funds to serve as a Director of the Company. As a member of the Oaktree Fund’s team covering the Company, Mr. Hinchman has a solid working knowledge of the Company’s activities and operations.
Brian K. Laibow - Mr. Laibow has served as a Director since June 2010. Mr. Laibow serves as a Managing Director in the Opportunities funds of Oaktree, with primary responsibilities for analyzing companies within the metals and mining, food distribution, education, automotive and commercial and residential real estate sectors. Mr. Laibow joined Oaktree in 2006 following graduation from Harvard Business School, where he received an MBA. Before attending Harvard, Mr. Laibow worked at Caltius Private Equity, a middle market LBO firm in Los Angeles. Prior experience includes director of M&A and Corporate Strategy at EarthLink, Inc., and senior business analyst at McKinsey & Company.
Mr. Laibow was appointed by the Oaktree Funds to serve as a Director of the Company. As a member of the Oaktree Funds’ team covering the Company, Mr. Laibow has a solid working knowledge of the Company’s activities and operations and
122
is also very familiar with the metals sector. Mr. Laibow serves as a member of the Board’s Audit Committee and is Chair of the Board’s Compensation Committee.
Matthew R. Michelini - Mr. Michelini has served as a Director since December 2015. He is a partner at Apollo having joined in 2006. Prior to joining Apollo, Mr. Michelini was a member of the mergers and acquisitions group of Lazard Frères & Co. from 2004 to 2006. Mr. Michelini serves on the board of directors of AAM GP Ltd. where he is a member of the investment committee, Athene Holding Ltd. where he is a member of the executive committee, risk committee and is an observer on the audit committee and Warrior Met Coal, Inc., where he is a member of the audit committee. He previously served on the board of directors of Metals USA and Noranda Aluminum. Mr. Michelini graduated from Princeton University with a BS in Mathematics and a Certificate in Finance and received his MBA from Columbia University.
Mr. Michelini has significant prior board service experience at several different companies. Mr. Michelini serves as a member of the Board’s Compensation Committee.
Donald T. Misheff - Mr. Misheff has served as a Director since December 2013. Mr. Misheff retired in 2011 as managing partner of the Northeast Ohio offices of Ernst & Young LLP, a public accounting firm, where he specialized in accounting/financial reporting for income taxes, purchase accounting, and mergers and acquisitions. Mr. Misheff is a member of FirstEnergy Corp’s board of directors (chairing the audit committee and serving as a member of the compensation committee, and previously serving on the nuclear, finance, and governance committees), The Timken Steel Company’s board of directors (chairing the audit committee and serving on the nominating and governance committee) since July 2014 and Trinseo S.A.’s board of directors (serving on the audit committee and chairing the governance committee) since February 2015. He is also chairman of Buckeye West LLC (d/b/a SunRidge Canyon Golf Club). He has previously served on numerous non-profit boards including Cuyahoga Community College, Ashland University, Team NEO, the Greater Akron Chamber and the United Way.
Mr. Misheff has significant prior board service experience, and extensive financial and corporate governance experience. Mr. Misheff serves as a member of the Board’s Audit Committee.
Robert O’Leary - Mr. O’Leary has served as a Director since December 2011. Mr. O’Leary is a Managing Director in Oaktree’s Distressed Debt group and co-portfolio manager of Oaktree’s newest Opportunities fund. Mr. O’Leary contributes to the analysis, portfolio construction and management of the Distressed Debt, Value Opportunities and Strategic Credit funds. Prior to joining Oaktree in 2002, Mr. O’Leary served as an Associate at McKinsey & Company, where he worked primarily in the Corporate Finance and Strategy practice. Before attending Harvard Business School, Mr. O’Leary worked for two years at Orion Partners, a private equity firm, where he focused on investments in private companies. Prior thereto, he worked at McKinsey & Company as a Business Analyst.
Mr. O’Leary was appointed by the Oaktree Funds to serve as a Director of the Company. Mr. O’Leary has significant experience making and managing investments on behalf of Oaktree’s Opportunities funds and has been actively involved in the Oaktree Funds’ investment in the Company.
Emily Stephens - Ms. Stephens has served as a Director since January 2011. Ms. Stephens serves as a Managing Director in the Distressed Debt group of Oaktree. Prior to joining Oaktree in 2006, Ms. Stephens served as a Vice President and Associate General Counsel at Trust Company of the West. Prior to that, Ms. Stephens spent five years as a Corporate Associate at Munger, Tolles & Olson LLP.
Ms. Stephens was appointed by the Oaktree Funds to serve as a Director of the Company. Her legal background and legal role at Oaktree provide expertise in corporate governance matters.
Lawrence W. Stranghoener - Mr. Stranghoener has served as a Director since January 2011. Prior to his retirement in January 2015, Mr. Stranghoener served in various roles at The Mosaic Company, a public global crop nutrition company. He was executive vice president, strategy and business development from August 2014 until January 2015. He was interim chief executive officer from June 2014 through August 2014 and executive vice president and chief financial officer from September 2004 until June 2014. Previously, he had been executive vice president and chief financial officer for Thrivent Financial. From 1983 to 2000, he held various positions in finance at Honeywell, including vice president and chief financial officer from 1997 to 1999. He also serves as lead independent director for Kennametal Inc., a public company, and as chairman of the board of trustees for Goldman Sachs Closed End Funds and Exchange Traded Funds.
Mr. Stranghoener has extensive corporate finance experience, including 15 years of experience as a chief financial officer at several different companies with full responsibility and accountability for all finance, accounting, tax and related functions. Mr. Stranghoener serves as the Chair of the Board’s Audit Committee and a member of the Board’s Compensation Committee.
Kaj Vazales - Mr. Vazales has served as a Director since November 2016. Mr. Vazales serves as a Managing Director in the Distressed Debt group of Oaktree. He has been a member of the Distressed Debt group since joining Oaktree in 2007. Prior to joining Oaktree, Mr. Vazales served as an analyst in the Financial Restructuring group at Houlihan Lokey. Mr. Vazales
123
currently serves on the board of directors of Pulse Electronics (currently serving on the compensation and audit committees) and Berry Petroleum (currently serving as chairman of the compensation committee). He previously served as a director of Studio City/New Cotai (May 2015 - September 2016) and International Market Centers (2011-2017). Mr. Vazales received an AB degree in economics from Harvard University.
Mr. Vazales was appointed by the Oaktree Funds to serve as a Director of the Company. Mr. Vazales has significant prior board service experience at several different companies.
G. Richard Wagoner, Jr. - Mr. Wagoner has served as a Director since August 2010. Mr. Wagoner retired from General Motors Corporation, a public company, in August 2009 after a 32-year career. He served as chairman and chief executive officer of General Motors from May 2003 through March 2009 and had been president and chief executive officer since June 2000. Mr. Wagoner is a director of Graham Holdings, Invesco, and several privately held companies. He is a member of the Board of Visitors of Virginia Commonwealth University. He is also a member of Duke’s Fuqua School of Business advisory board and the Duke University Health Systems board of directors. Mr. Wagoner is a former chairman of the board of trustees of Duke University. He is also an honorary member of the Mayor of Shanghai, China’s International Business leaders advisory council.
Mr. Wagoner’s long leadership history with General Motors provides a deep understanding of the operational, governance and strategic matters involved in running a large scale global corporation. Mr. Wagoner serves as a member of the Board’s Compensation Committee.
Section 16(a) Beneficial Ownership Reporting Compliance
Since none of our common stock is publicly traded, our executive officers, directors and 10% stockholders are not subject to the reporting obligations under Section 16 of the Securities Exchange Act of 1934, as amended.
Other Matters Concerning Directors and Executive Officers
Messrs. Stack and Clegg served as officers of the Company’s predecessor at the time it filed for protection under Chapter 11 of the Bankruptcy Code in February 2009. On June 1, 2009, General Motors Corporation, and its affiliates, filed voluntary petitions in the United States Bankruptcy Court for the Southern District of New York seeking relief under Chapter 11 of the United States Bankruptcy Code. Mr. Wagoner was not an executive officer or director of General Motors Corporation at the time of such filing.
Codes of Ethics
The Company maintains and enforces a Code of Ethics that applies to our Chief Executive Officer, Chief Financial Officer, Controller, Chief Accounting Officer and Treasurer (the “Senior Officers Code”). The Senior Officers Code was designed to be read and applied in conjunction with the Company’s Code of Business Conduct and Ethics (the “Code of Business Conduct”) applicable to all employees. In instances where the Code of Business Conduct is silent or its terms are inconsistent with or conflict with any of the terms of the Senior Officers Code, then the provisions of the Senior Officers Code control and govern in all respects. Both the Senior Officers Code and the Code of Business Conduct are available at our website (www.aleris.com) by clicking on the following links: “Company” then “Investor Relations” then “Corporate Governance” then “Governance Documents”. Any future changes or amendments to the Senior Officers Code and the Code of Business Conduct, and any waiver of the Senior Officers Code or the Code of Business Conduct that applies to our Chief Executive Officer, Chief Financial Officer or Principal Accounting Officer will be posted to our website at this location. A copy of both the Senior Officers Code and the Code of Business Conduct may also be obtained upon request from the Company’s Secretary.
Board Committees
Our Board of Directors has established an Audit Committee and a Compensation Committee.
Messrs. Stranghoener, Laibow and Misheff are the members of the Audit Committee. Mr. Stranghoener has been appointed Chair of the Audit Committee. While our Board of Directors currently has not made a formal determination as to whether any members of our Audit Committee are considered to be Audit Committee Financial Experts as we are a privately held corporation, we believe all members of our Audit Committee have a beneficial financial background. The Audit Committee is appointed by our Board of Directors to assist our Board of Directors in fulfilling its oversight responsibilities by:
▪ | reviewing and overseeing the administration of the Company’s internal accounting policies and procedures; |
▪ | reviewing and overseeing the preparation of the Company’s financial statements; and |
▪ | consulting with the Company’s independent accountants. |
Messrs. Laibow, Michelini, Stranghoener and Wagoner are the members of the Compensation Committee. Mr. Laibow has been appointed Chair of the Compensation Committee. The Compensation Committee is appointed by our Board of Directors to assist our Board of Directors in fulfilling its oversight responsibilities by:
▪ | developing and approving all elements of compensation with respect to the Company’s executive officers; and |
124
▪ | approving and overseeing the management and administration of all material compensation paid by the Company. |
ITEM 11. EXECUTIVE COMPENSATION
Compensation Discussion and Analysis
Philosophy
As a global leader in the manufacture and sale of aluminum rolled products with a strategic footprint throughout North America, Europe and China, we maintain a multi-faceted executive compensation program. Our compensation philosophy centers on the belief that executive compensation should be directly linked to improvement in corporate performance and the creation of long-term stockholder value. As such, our executive compensation program is designed to support our compensation philosophy by:
▪ | attracting, retaining and motivating key executives and management personnel by providing an appropriate level and mixture of fixed and at risk compensation; |
▪ | linking compensation with performance by providing reasonable incentives to accomplish near term Company-wide (and business unit, if applicable) successes based on our strategic business plan; and |
▪ | rewarding long-term increased Company value and aligning the interests of the executives with our stockholders. |
We describe below the various elements of our executive compensation program for the following named executive officers for the fiscal year ended December 31, 2017:
▪ | Sean M. Stack (Chairman and Chief Executive Officer); |
▪ | Eric M. Rychel (Executive Vice President, Chief Financial Officer and Treasurer); |
▪ | Jacobus A.J. Govers (Executive Vice President, President of Europe and Global Markets); |
▪ | Michael T. Keown (Executive Vice President and President of Aleris North America); |
▪ | Christopher R. Clegg (Executive Vice President, Secretary and General Counsel); and |
▪ | Tamara S. Polmanteer (Executive Vice President, Chief Human Resources Officer) (Messrs. Stack, Rychel, Govers, Keown and Clegg and Ms. Polmanteer, together the “named executive officers”). |
Compensation Committee
The Compensation Committee has responsibility for developing, reviewing, overseeing and approving our executive and senior management compensation plans, policies and programs, and awards thereunder, including making equity grant decisions with respect to our named executive officers. The Compensation Committee regularly reviews the various aspects of our compensation programs, making changes it considers appropriate based on our strategic goals and market changes.
Periodically, the Compensation Committee has retained the services of Frederic W. Cook & Co., Inc. (“FW Cook”) to review and advise on certain aspects of our executive compensation program and for the purpose of obtaining information on the competitive pay mix practices, trends, and compensation program structures of privately held and public companies.
125
FW Cook Services Utilized | Use by Compensation Committee | |
2016 | - Assistance with Ms. Polmanteer’s and Mr. Govers’ compensation packages related to their commencement of employment and appointment as executive officers of the Company. - Assistance in connection with setting the overall transaction bonus budget related to the transaction contemplated by the Merger Agreement (terminated on November 12, 2017). - Assistance in connection with reviewing long-term incentive program design alternatives. - Assistance in connection with developing new compensation strategies for each of our named executive officers that would follow the closing of the transaction described above. | - In making these named executive officer compensation packages, the Compensation Committee considered analysis of competitive pay levels and internal peer comparisons. - In setting the overall transactions bonus budget, the Compensation Committee considered analysis of competitive bonus levels. |
2017 | - Assistance in connection with setting the overall retention bonus budget related to the termination of the Merger Agreement. - Assistance in connection with review of the design and overall budget of the Equity Incentive Plan (as defined below) and equity awards thereunder to named executive officers. - Assistance in connection with developing new compensation strategies for each of our named executive officers, including proposed changes to base salary, annual bonus opportunity and severance. - Assistance with setting Mr. Keown’s initial base salary as an executive officer of the Company in connection with his appointment as Executive Vice President and President of Aleris North America. | - In setting the overall retention bonus budget, the Compensation Committee considered analysis of competitive bonus levels. - In making these named executive officer compensation packages, the Compensation Committee considered analysis of competitive pay levels and internal peer comparisons. |
Key elements of executive compensation program
Our executive compensation program design supports our core philosophy through a range of programs that incorporate a combination of base salary cash compensation, cash incentive awards based primarily on annual and quarterly performance targets, and, generally, grants of time-vesting stock options and time-vesting restricted stock units (“RSUs”) (most of which vest over a three-year period).
The rationale for inclusion of each compensation element in our program is set forth below:
Compensation Element | Rationale |
Base salary | - The base salaries for our named executive officers are used to provide a predictable level of current income and are designed to assist in attracting and retaining qualified executives. - Each named executive officer’s base salary compensation amount has been set to provide a certain amount of financial security to such named executive officer at a level that is believed to be competitive for similar positions in the marketplace in which we compete for talent. |
Short-term cash bonus awards | - The short-term cash bonus awards for our named executive officers are designed to meaningfully reward strong annual and quarterly Company and/or business unit performance, in order to motivate participants to strive for continued growth and productivity. - For 2017 each named executive officer’s short-term cash bonus award was designed to reward such named executive officer for steady, sustained achievement of performance objectives based upon the following: - incremental quarterly and annual financial and/or operational performance objectives; and - individual performance objectives. |
Long-term equity awards | - We believe our equity incentive program is an important element in our ability to retain, motivate and incentivize our named executive officers. Our equity incentive program is considered central to the achievement of our long-range goals, and aligns our named executive officers’ and other management team members’ interests with those of our stockholders. - The equity awards for each of our applicable named executive officers provides share ownership opportunities through stock options and RSUs, which generally vest over time. Mr. Govers’ and Ms. Polmanteer’s employment agreements contemplated equity awards. In lieu of these equity awards, the Compensation Committee awarded these named executive officers retention bonuses (described below in "Cash Bonus Awards - Special cash transaction bonuses and retention bonuses"). In addition, in 2017, each of Mr. Govers and Ms. Polmanteer received equity awards under the Equity Incentive Plan at the same time that grants were made to each of our other named executive officers. |
126
In setting the appropriate compensation levels for our named executive officers, we have considered a variety of factors including our need to attract and retain key personnel in both the United States and our strategic markets abroad, how compensation levels compare to manufacturing companies generally in our industry, and the interests of our stockholders.
For 2017, each of our named executive officers was a party to an agreement providing for compensation tied to the closing of the Merger Agreement which were superseded by a retention bonus agreement (both agreements described below in “Cash Bonus Awards - Special cash transaction bonuses and retention bonuses”).
Base Salary
Each of our named executive officers is a party to an employment agreement which defines the terms of his or her employment, as follows: for Mr. Stack, effective as amended on November 13, 2017 (the “Stack Agreement”); for Mr. Rychel, effective as amended as of November 13, 2017; for Mr. Govers, effective as amended as of November 13, 2017; for Mr. Keown, effective as of November 13, 2017; for Mr. Clegg, effective as amended as of November 13, 2017; and for Ms. Polmanteer, effective as amended as of November 13, 2017 (the agreements for our named executive officers, as amended, the “Employment Agreements”). In connection with the termination of the Merger Agreement, effective as of November 13, 2017, the Company entered into amendments with each of our named executive officers (except for Mr. Keown, who entered into an employment agreement concurrent with his appointment as Executive Vice President and President of Aleris North America), the terms of which are described below under “Employment agreements”.
Pursuant to each named executive officer’s Employment Agreement, the amount of each executive’s base salary is reviewed annually and is subject to adjustment by our Board of Directors, which also has the authority to make discretionary cash bonus awards. Our named executive officers’ base salaries for 2017, including any mid-year adjustments, are described below:
Name | 2017 Base Salary, including mid-year adjustments | |
Current Named Executive Officers | ||
Sean M. Stack | - Following a review of Mr. Stack’s overall compensation, in November 2017 the Compensation Committee approved an increase to Mr. Stack’s base salary from $875,000 to $950,000 effective as of November 13, 2017. | |
Eric M. Rychel | - Following a review of Mr. Rychel’s overall compensation, in November 2017 the Compensation Committee approved an increase to Mr. Rychel’s base salary from $475,000 to $525,000 effective as of November 13, 2017. | |
Michael T. Keown | - In connection with Mr. Keown’s promotion to Executive Vice President and President of Aleris North America, in November 2017 the Compensation Committee set Mr. Keown’s annual base salary at $450,000 effective as of November 13, 2017. | |
Jacobus A.J. Govers | - In connection with joining the Company in June 2016, the Compensation Committee set Mr. Govers’ annual base salary at €500,000. Pursuant to Belgian automatic wage indexations, in May 2017, annual base salary was automatically increased by 2.1% to €510,500. Mr. Govers’ base salary will be subject to additional increases required under these applicable laws. (Mr. Govers is based in Belgium.) | |
Christopher R. Clegg | - Following a review of Mr. Clegg’s cash compensation, in March 2016 the Compensation Committee increased Mr. Clegg’s annual base salary by 2.5% to $430,500, effective April 1, 2016. - Following a review of Mr. Clegg’s overall compensation, in November 2017 the Compensation Committee approved an increase to Mr. Clegg’s base salary to $450,000 effective as of November 13, 2017. | |
Tamara S. Polmanteer | - In connection with joining the Company in April 2016, the Compensation Committee set Ms. Polmanteer’s annual base salary at $385,000. - Following a review of Ms. Polmanteer’s overall compensation, in November 2017 the Compensation Committee approved an increase to Ms. Polmanteer’s base salary to $400,000 effective as of November 13, 2017. | |
Cash Bonus Awards
In order to drive achievement of certain annual performance goals, Aleris International maintains the Amended and Restated Aleris International, Inc. 2004 Annual Incentive Plan under a program referred to as the Management Incentive Plan or “MIP”, in which the named executive officers and certain other management team employees participate. Awards under the MIP represent variable compensation linked to organizational performance, which is a significant component of the Company’s total annual compensation package for key employees, including the named executive officers. The program is designed to reward the employee’s participation in the Company’s achievement of critical financial performance and growth objectives.
For 2017, performance goals and achievement were assessed and MIP bonus amounts were determined in March 2018, subject to the Audit Committee’s approval of 2017 year-end financial results, based on 2017 audited annual financial statements.
Pursuant to the applicable employment agreement, each named executive officer is eligible to receive a target annual bonus amount under the MIP, expressed as a percentage of eligible base salary, as set forth in the table below. Depending on
127
the performance levels achieved, the named executive officer may receive no bonus or a bonus in an amount up to 200% of the executive’s target bonus amount. The chart below sets forth, for each named executive officer, the target bonus amount (expressed as both a percentage of the executive’s eligible base salary and a dollar amount) for the 2017 annual performance period.
Name | Eligible Base Salary | Target Bonus % | Target Bonus | ||||||||
Sean M. Stack | $ | 950,000 | 125 | % | $ | 1,187,500 | |||||
Eric M. Rychel | $ | 525,000 | 85 | % | $ | 446,250 | |||||
Jacobus A.J. Govers (1) | $ | 576,808 | 75 | % | $ | 432,607 | |||||
Michael T. Keown | $ | 450,000 | 75 | % | $ | 337,500 | |||||
Christopher R. Clegg | $ | 450,000 | 75 | % | $ | 337,500 | |||||
Tamara S. Polmanteer | $ | 400,000 | 65 | % | $ | 260,000 | |||||
(1) | Following a review of Mr. Govers’ overall compensation, in November 2017 the Compensation Committee approved an increase to Mr. Govers’ Target Bonus percentage from 70% to 75%. Additionally, the amounts reported reflect the average annual conversion rate used by the Company equaling 1.12989 US$ to 1€ for 2017. |
For 2017, the MIP payouts for our named executive officers were calculated based on (i) annual MIP Net Cash Flow (defined below) calculated on a Company-wide basis (representing 40% of the total bonus opportunity), (ii) quarterly MIP EBITDA (defined below) (representing 40% of the total bonus opportunity) calculated on a Company-wide basis and (iii) annual individual performance goals (representing 20% of the total bonus opportunity). The specific metrics and weightings of these measures as components of the whole target bonus amount, as well as target achievement levels, are determined and adjusted to be aligned with our Company business plan.
Net cash flow reflects the Company’s cash funding of growth initiatives in excess of its current earnings. As such, for 2017 it was a negative number. “MIP Net Cash Flow” for purposes of measuring achievement under the MIP is based on net cash flow calculated as the sum of net cash (used) provided by operating activities plus net cash (used) provided by investing activities less cash payments of scheduled debt maturities. The first two components of net cash flow are included as line items in our Statement of Cash Flows. For 2017, the cash payments of scheduled debt maturities was $26.3 million. Adjustments may be made by the Compensation Committee to take into account certain significant variances in LME and metal prices and certain items that were not anticipated when the targets were set. For 2017, certain adjustments were made to the MIP Net Cash Flow to address the estimated impact on net working capital of significant variances from planned aluminum prices, the timing of cash receipts and certain other items that are generally beyond the control of the Company and considered by the Compensation Committee to be inappropriate to include in the MIP Net Cash Flow calculation.
With respect to our named executive officers’ quarterly target opportunities (other than for Mr. Keown with respect to Q1 through Q3 2017) Adjusted EBITDA for purposes of measuring achievement under the MIP is determined based on the Adjusted EBITDA for the Company or, with respect to Mr. Keown’s Q1 through Q3 2017 quarterly target opportunities, based on the Adjusted EBITDA for the North America (“North America”) business unit. Adjusted EBITDA is a non-GAAP measure (the components of which are more fully explained under the “Management discussion and analysis of financial condition and results of operations” section of this filing under the heading “EBITDA and Adjusted EBITDA”) as that measure may be additionally modified for purposes of the MIP only. Therefore, the Adjusted EBITDA figure used for purposes of the MIP may not be the same as the Adjusted EBITDA figure that may be used or reported by the Company in other contexts. Adjustments for purposes of the MIP may be made by the Compensation Committee to take into account certain significant variances in LME prices and currency exchange rates, or certain items that were not anticipated when the targets were set (the “MIP EBITDA”). For 2017, certain adjustments were made to MIP EBITDA to address the EBITDA impact of currency exchange rate losses / gains on working capital balances.
Actual bonus payment amounts are calculated by combining the achievement attained for each weighted measure, whereby achievement of 100% of target of each of the individual measures would earn a payout of 100% of the participant’s target bonus opportunity. The payout for 200% of target is achievable for performance significantly greater than the budgeted 2017 Aleris business plan. For each of our named executive officers, only Company-wide (and, for Keown, North America) goals and individual performance goals were considered in their bonus calculations. Generally, the targets are established as challenging, but achievable, milestones.
128
We believe that the chosen metrics serve as an appropriate metric on which to base bonus decisions. Use of Net Cash Flow as a metric under the MIP reflects the Company’s focus on cash flow and generating the committed return on its capital investments throughout the Company. Adjusted EBITDA metric is commonly used by our primary stockholders, as well as the banking and investing communities generally, with respect to the performance of fundamental business objectives, and, moreover, this metric appropriately measures our ability to meet future debt service, capital expenditures and working capital needs. The Board of Directors or, for participants other than the named executive officers, the Compensation Committee, has the discretion to decrease awards under the MIP even if incentive targets are achieved.
Each of our named executive officers (other than Mr. Keown with respect to Q1 through Q3 2017) were subject to quarterly performance goals based on Company MIP EBITDA. For Q1 through Q3 2017, Mr. Keown was subject to quarterly performance goals based on North America MIP EBITDA. In Q4 2017, Mr. Keown was subject to quarterly performance goals based on Company MIP EBITDA. The specific goals and achievement attained for 2017 are set forth below. In 2018, Mr. Keown will be subject to the Company MIP EBITDA targets as applicable to each of our other named executive officers.
Performance Targets | Performance Results | |||||||||||||||||||
Threshold | Target | Max | Results | Payout % | ||||||||||||||||
Measure | (millions) | (millions) | (millions) | (millions) | Achieved | |||||||||||||||
Q1 - 10% of Target Opportunity | ||||||||||||||||||||
Company MIP EBITDA | $ | 31.6 | $ | 45.2 | $ | 58.8 | $ | 52.5 | 148 | % | ||||||||||
North America MIP EBITDA | $ | 13.8 | $ | 20.9 | $ | 28.0 | $ | 23.3 | 125 | % | ||||||||||
Q2 - 10% of Target Opportunity | ||||||||||||||||||||
Company MIP EBITDA | $ | 46.4 | $ | 66.4 | $ | 86.3 | $ | 69.3 | 111 | % | ||||||||||
North America MIP EBITDA | $ | 23.6 | $ | 35.0 | $ | 46.4 | $ | 36.4 | 109 | % | ||||||||||
Q3 - 10% of Target Opportunity | ||||||||||||||||||||
Company MIP EBITDA | $ | 37.7 | $ | 53.8 | $ | 69.9 | $ | 46.9 | 65 | % | ||||||||||
North America MIP EBITDA | $ | 15.9 | $ | 24.0 | $ | 32.1 | $ | 21.4 | 76 | % | ||||||||||
Q4 - 10% of Target Opportunity | ||||||||||||||||||||
Company MIP EBITDA | $ | 26.8 | $ | 38.2 | $ | 49.7 | $ | 37.4 | 95 | % | ||||||||||
Annual - 40% of Target Opportunity | ||||||||||||||||||||
MIP Net Cash Flow (2) | $ | (396.5 | ) | $ | (305.0 | ) | $ | (213.5 | ) | $ | (274.0 | ) | 126 | % | ||||||
Individual - 20% of Target Opportunity | ||||||||||||||||||||
Individual | (1) | (1) | ||||||||||||||||||
(1) | Varies by individual as further described below. Please see the information below with respect to each of our named executive officer’s annual payments. |
(2) | The current MIP Net Cash Flow targets are negative numbers. Achievement closer to zero yields a higher payout. |
For 2017, for each of our current named executive officers, the amount of the bonus was also subject to individual performance goals, as set forth in the table below.
Safety Improve- ment | Organiz- ational Culture Improve- ment | Strategic Initiatives | Operational Performance Improvement | Strengthen Capital Structure / Financial Community Interaction | Maintain Strong Financial Controls | Manage SG&A | EBITDA Growth | Free Cash Flow Growth | |
Sean M. Stack | ü | ü | ü | ü | ü | ü | |||
Eric M. Rychel | ü | ü | ü | ü | ü | ü | |||
Jacobus A.J. Govers | ü | ü | ü | ü | ü | ü | |||
Michael T. Keown | ü | ü | ü | ü | ü | ü | |||
Christopher R. Clegg | ü | ü | ü | ||||||
Tamara S. Polmanteer | ü | ü | ü | ü | |||||
Based on the annual performance achievement, the 2017 MIP bonus amounts earned by each of our named executive officers are as set forth in the table below:
129
Target Bonus | Total MIP | Total MIP Award | ||||||||||
Amount | Payout (%) (1) | Amount ($) (2) | ||||||||||
Sean M. Stack | $ | 1,187,500 | 115 | % | $ | 1,367,980 | ||||||
Eric M. Rychel | $ | 446,250 | 115 | % | $ | 514,073 | ||||||
Jacobus A.J. Govers (3) | $ | 432,607 | 115 | % | $ | 528,353 | ||||||
Michael T. Keown | $ | 337,500 | 113 | % | $ | 380,833 | ||||||
Christopher R. Clegg | $ | 337,500 | 115 | % | $ | 388,794 | ||||||
Tamara S. Polmanteer | $ | 260,000 | 116 | % | $ | 302,116 | ||||||
(1) | Total MIP Payout percentage reported above is the approximate aggregate payout percentage for all of the award calculation components, rounded to the nearest whole percentage for reporting purposes. With respect to the individual performance goals, Messrs. Stack, Rychel, Govers, Keown and Clegg and Ms. Polmanteer achieved performance as follows: 115%, 115%, 115%, 110%, 115% and 120%, respectively. |
(2) | For each of our NEOs, the total MIP award amount includes amounts payable in satisfaction of the annual MIP Net Cash Flow target, applicable quarterly MIP EBITDA targets and satisfaction of individual performance goals. |
(3) | Amounts may not foot due to conversion rates. For Mr. Govers, the Target Bonus Amount has been converted using the average annual conversion rate used by the Company (equaling 1.12989 US$ to 1€ for 2017) while the actual Total MIP Award Amount payout was calculated using the December 31, 2017 spot conversion rate used by the Company (equaling 1.1979 US$ to 1€). |
Generally, all MIP award recipients, including our named executive officers, must be an employee of the Company on the date that the annual bonus amount is paid in order to be eligible to receive that bonus amount.
The MIP design and metrics are reviewed each year. Pursuant to each named executive officer’s employment agreement, the target annual bonus amount is reviewed annually and is subject to adjustment by our Board of Directors, which also has the authority to make discretionary cash bonus awards. The target bonus opportunity for each of our named executive officers has not been changed in respect of bonuses to be awarded (if any) in connection with the 2018 performance period.
Special cash transaction bonuses and retention bonuses
On August 28, 2016, contemporaneous with its approval of the Merger Agreement, the Board authorized transaction bonuses to Messrs. Stack, Rychel, Keown, Govers and Clegg and Ms. Polmanteer, in the amount of $2,250,000, $800,000, $500,000, $500,000, $400,000 and $300,000, respectively (the “Transaction Bonuses”), in each case pursuant to a form of Transaction Bonus Agreement and subject to the consummation of the Merger. With respect to the Transaction Bonuses for Mr. Govers and Ms. Polmanteer, the Transaction Bonuses were awarded in lieu of equity awards that would have otherwise been granted pursuant to their employment agreements, and would have been payable in cash in a lump sum within ten days after the closing of the transaction contemplated by the Merger Agreement, and in event that the closing of the merger did not occur, Mr. Govers and Ms. Polmanteer would remain entitled to an equity award having a value equal to that of the transaction bonus amount, as provided under their employment agreements. The Company further amended the terms applicable to the Transaction Bonuses for each of our named executive officers to extend the date by which the transaction was required to be consummated in order to trigger payment of the Transaction Bonuses. On November 12, 2017, the Merger Agreement was terminated, and in connection therewith, the Transaction Bonuses, by the terms of the applicable agreement, became null and void.
On November 13, 2017, the Compensation Committee awarded certain retention bonuses to Messrs. Stack, Rychel, Govers, Keown, and Clegg and Ms. Polmanteer in the amount of $2,250,000, $800,000, $500,000, $500,000, $550,000 and $300,000, respectively (the “Retention Bonuses”), in each case pursuant to a form of Retention Bonus Agreement (the “Retention Bonus Agreement”) and conditioned on continued employment through the applicable Vesting Date (as defined below). For Mr. Govers and Ms. Polmanteer, the Retention Bonuses were granted in lieu of (and not in addition to) certain equity awards contemplated by their applicable Employment Agreements. The Retention Bonus Agreement provides that the Retention Bonus, less applicable taxes, would be paid in cash (i) as to 50% in a lump sum as soon as practicable following the executive’s execution of the Retention Bonus Agreement (the “First Vesting Date”), and (ii) as to 50% in a lump sum as soon as practicable following December 31, 2018 (the “Second Vesting Date”), but in no event later than January 30, 2019. Payment of each installment of the Retention Bonus is subject to the executive’s continued employment through the First Vesting Date and Second Vesting Date, as applicable; provided, however, that if prior to a vesting date, the named executive officer’s employment is terminated for any reason other than (i) by the Company without Cause (as such term is defined in the Equity Incentive Plan), (ii) due to the executive’s death or (iii) by the executive for Good Reason (with the same definition used in the U.S. Employment Agreements described below), the named executive shall forfeit all rights to receive any portion of the Retention Bonus that has not already been received. In the event the named executive officer’s employment is terminated following the First Vesting Date but prior to the Second Vesting Date (i) by the Company without Cause, (ii) due to the executive’s death or (iii) by the executive for Good Reason, the executive will receive that portion of the Retention Bonus not previously paid to him or her in a lump sum in cash within thirty days following the executive’s termination of employment.
130
Cash sign-on bonus
Mr. Govers’ Employment Agreement includes a $350,000 sign-on award which vests and is payable in five equal installments on the first five anniversaries of his starting date. On June 20, 2017, Mr. Govers received payment of $70,000 pursuant to this award.
Equity incentive program
The Company maintains an equity incentive plan, effective as of June 1, 2010 and amended from time to time (as amended, the “Equity Incentive Plan”). The Equity Incentive Plan is designed to attract, retain, incentivize and motivate employees and non-employee directors of the Company, its subsidiaries and affiliates and to promote the success of our businesses by providing such participating individuals with a proprietary interest in the Company. The Equity Incentive Plan allows for the granting of non-qualified stock options (“stock options”), stock appreciation rights, restricted stock, RSUs and other stock-based awards.
The Equity Incentive Plan is administered by the Compensation Committee, and may generally be amended or terminated at any time. Each of our named executive officers has received significant grants of stock options and RSUs, in each case, subject to the Equity Incentive Plan and the terms of an applicable award agreement, which grants were awarded for both their retentive qualities and to provide meaningful incentives related to the Company’s future long-term growth.
As a private company, the Compensation Committee has historically granted and is expected to continue to grant equity awards under the Equity Incentive Plan to its named executive officers which are intended to be multi-year, rather than annual, grants. Consistent with this approach, the Compensation Committee granted stock options and RSUs to each of its named executive officers, each having a three-year vesting schedule, as described below under “Stock option grants” and “RSU grants”.
Stock option grants in 2017
On November 13, 2017, the Board of Directors, acting as the Compensation Committee under the Equity Incentive Plan, granted three-year front-loaded awards of stock options to our named executive officers as set forth below:
Named Executive Officer | # of Stock Options | |
Sean M. Stack | 463,650 | |
Eric M. Rychel | 132,000 | |
Jacobus A.J. Govers | 132,000 | |
Michael T. Keown | 132,000 | |
Christopher R. Clegg | 115,500 | |
Tamara S. Polmanteer | 66,000 | |
These options were granted with an exercise price of $17.00 per share of common stock and are subject to vesting with respect to 33 1/3% on each of December 31, 2017, 2018 and 2019. For a discussion of the effect on these stock options in the event of a Change of Control and each applicable named executive officer’s termination, please see the section entitled “Potential payments upon termination or change in control - Equity award agreements”.
RSU grants in 2017
On November 13, 2017, the Board of Directors, acting as the Compensation Committee under the Equity Incentive Plan, granted three-year front-loaded RSUs to our named executive officers as set forth below:
Named Executive Officer | # of RSUs | |
Sean M. Stack | 231,825 | |
Eric M. Rychel | 66,000 | |
Jacobus A.J. Govers | 66,000 | |
Michael T. Keown | 66,000 | |
Christopher R. Clegg | 57,750 | |
Tamara S. Polmanteer | 33,000 | |
131
These RSU awards are subject to vesting with respect to 33 1/3% on each of December 31, 2017, 2018 and 2019. In connection with the settlement of RSUs, generally, promptly after each vesting date, shares of our common stock are issued to each applicable named executive officer with respect to the number of RSUs that vested on such date, subject to applicable required statutory withholdings. A description of the effect on these RSUs upon a Change of Control and each applicable named executive officer’s termination is below under the heading “Potential payments upon termination or change in control - Equity award agreements”.
Equity Awards are subject to Clawback Provisions
Both the stock options and RSUs, and any shares issued upon exercise or settlement of any such award, as applicable, are subject to a clawback provision in the event any named executive officer materially violates the restrictive covenants in his or her employment agreement relating to non-competition, non-solicitation or non-disclosure or engages in fraud or other willful misconduct that contributes materially to any significant financial restatement or material loss. In such case, the Board of Directors may, within six months of learning of the conduct, cancel the stock options or RSUs or require the applicable named executive officer to forfeit to us any shares received in respect of such stock options or RSUs or to repay to us the after-tax value realized on the exercise or sale of such shares. Any such named executive officer will be provided a 15-day cure period, except in cases where his or her conduct was willful or where injury to us and our affiliates cannot be cured.
Retirement, post-employment benefits and deferred compensation
We offer our executive officers who reside and work in the United States the same retirement benefits as other United States Aleris employees, including participation in the Aleris 401(k) Plan (the “401(k) Plan”) and, for those who qualify as former employees of Commonwealth Industries, Inc., the Aleris Cash Balance Plan (formerly known as the Commonwealth Industries, Inc. Cash Balance Plan) (the “Aleris Cash Balance Plan”). In the United States, Aleris International also sponsors a nonqualified deferred compensation program under which certain executives, including the named executive officers, are eligible to elect to save additional salary amounts for their retirement outside of the 401(k) Plan and/or to elect to defer a portion of their compensation and MIP bonus payments. For a further description of the Deferred Compensation Plan and the payments that were made in 2017, please see the sections entitled “Pension benefits as of December 31, 2017” and “Nonqualified deferred compensation as of December 31, 2017”.
Mr. Govers participates in the Belgian Retirement Plan, which is operated in accordance with applicable Belgian laws. Under the terms of Mr. Govers’ employment agreement, Aleris Duffel contributes an amount equal to 15% of Mr. Govers’ annual salary to the Belgian Retirement Plan. The Belgian Retirement Plan provides that, at the participant’s normal retirement date at age 65, he is (or his eligible heirs are) eligible for a lump sum payment equal to the greater of his account balance or his account balance assuming a nominal minimum rate of return. For a further description of the payments that were made in 2017 under the Belgian Retirement Plan, please see the section entitled “Pension benefits as of December 31, 2017”.
Perquisites
We provide some perquisites to our named executive officers in the United States, including providing payment for financial advisory services and an annual medical examination, as well as a tax gross-up for the additional income tax liability as a result of receiving these benefits. We believe that these perquisites are less extensive than is typical both for entities with whom we compete and in the general market for executives of industrial companies in the United States, especially in the case of our chief executive officer.
We make indoor parking spaces available to certain executives at the Cleveland headquarters, including Messrs. Stack, Rychel, Keown and Clegg and Ms. Polmanteer. We also occasionally invite spouses and family members of certain of our executives, including the named executive officers, to participate in business-related entertainment events arranged by the Company, which sometimes include the executive’s spouse or guest traveling with the executives on commercial flights or on a Company-sponsored aircraft. To the extent any travel or participation in these events by the executive’s spouse or guest results in imputed income to the named executive officer, our chief executive officer may be entitled (subject to approval by the Board), and other named executive officers may be entitled (subject to approval by the chief executive officer) to a tax gross-up payment on such imputed income.
In addition, as part of Mr. Keown’s compensation for services performed on an expatriate assignment in Duffel, Belgium from 2011 to 2013, Mr. Keown receives a tax equalization benefit such that his applicable income taxes for the covered years are no greater than what they would have been had he served in Beachwood, Ohio. In connection with this benefit, the Company agreed to cover the cost of preparing the applicable income tax returns as well as tax gross-up payments on such imputed income.
132
Mr. Govers is provided with the use of a leased company car and other perquisites including reimbursement of up to 16,000 EUR annually for financial planning assistance, and an annual medical examination to be performed with a Belgian health institute.
Change in control and termination arrangements
Each of our U.S. named executive officers is eligible to receive certain benefits upon a change of control of the Company and in connection with certain terminations of employment pursuant to their Employment Agreements and equity award agreements. Under their Employment Agreements generally, in the event of an involuntary termination, the applicable named executive officers are eligible for severance benefits. In the event of a Change of Control, pursuant to the stock option and RSU award agreements, a portion of any unvested awards may vest, with the number of accelerated awards depending on the amount of liquidity gained by the Oaktree Funds in the Change of Control transaction. Also, generally, with respect to each of our named executive officers, if an involuntary termination occurs in anticipation of or within 12 months following a Change of Control, any remaining unvested awards will vest.
Pursuant to applicable Belgian laws, Mr. Govers is entitled to certain payments and benefits upon certain terminations of employment. With respect to his award of stock options and RSUs received in November 2017, Mr. Govers is entitled to equity acceleration in the event of a Change of Control, or upon an involuntary termination that occurs in anticipation of or within 12 months following a Change of Control in the same manner as applicable to our other U.S. named executive officers.
More detailed descriptions of the Change of Control and termination provisions of each of our U.S. named executive officer’s Employment Agreements, stock option and RSU agreements, and Retention Agreements, as applicable, or, with respect to Mr. Govers, as governed by applicable Belgian laws, are set forth below under the section entitled “Potential payments upon termination or change in control”.
SUMMARY COMPENSATION TABLE FOR FISCAL YEAR 2017
The following table sets forth a summary of compensation with respect to our named executive officers for the fiscal year ended December 31, 2017.
Salary | Bonus | Stock Awards | Option Awards | Non-Equity Incentive Plan Compensation | Change In Pension Value and Nonqualified Deferred Compensation Earnings | All Other Compensation | Total | |||||||||||||||||||
Name and Principal Position | Year | ($) | ($)(1) | ($)(2) | ($)(3) | ($) | ($) (4) | ($) (5) | ($) | |||||||||||||||||
Sean M. Stack (Chairman and Chief Executive Officer) | 2017 | 885,241 | 1,125,000 | 3,941,025 | 3,607,197 | 1,367,980 | 7,483 | 132,040 | 11,065,966 | |||||||||||||||||
2016 | 875,000 | — | — | — | 788,582 | 1,623 | 99,655 | 1,764,860 | ||||||||||||||||||
2015 | 689,455 | — | 971,700 | 2,034,220 | 998,032 | — | 77,719 | 4,771,126 | ||||||||||||||||||
Eric M. Rychel (Executive Vice President, Chief Financial Officer & Treasurer) | 2017 | 481,827 | 400,000 | 1,122,000 | 1,026,960 | 514,073 | 32,218 | 59,953 | 3,637,031 | |||||||||||||||||
2016 | 475,000 | — | — | — | 303,228 | 2,869 | 66,245 | 847,343 | ||||||||||||||||||
2015 | 415,000 | 150,000 | 383,940 | 751,848 | 400,056 | — | 53,684 | 2,154,528 | ||||||||||||||||||
Jacobus A.J. Govers (Executive Vice President, President of Europe and Global Markets) (6) (7) | 2017 | 572,853 | 311,438 | 1,122,000 | 1,026,960 | 528,353 | 79,773 | 6,779 | 3,648,157 | |||||||||||||||||
2016 | 262,635 | — | — | — | 138,387 | 36,067 | 7,702 | 444,791 | ||||||||||||||||||
Michael T. Keown (Executive Vice President and President of Aleris North America) (7) | 2017 | 415,679 | 250,000 | 1,122,000 | 1,026,960 | 380,833 | 32,594 | 176,473 | 3,404,539 | |||||||||||||||||
Christopher R. Clegg (Executive Vice President, General Counsel and Secretary) | 2017 | 433,163 | 275,000 | 981,750 | 898,590 | 388,794 | 6,783 | 58,414 | 3,042,493 | |||||||||||||||||
2016 | 427,875 | — | — | — | 241,968 | 1,646 | 67,768 | 739,257 | ||||||||||||||||||
2015 | 420,000 | 100,000 | — | — | 394,825 | 660 | 56,636 | 969,121 | ||||||||||||||||||
Tamara S. Polmanteer (Executive Vice President, Chief Human Resources Officer) (7) | 2017 | 387,048 | 150,000 | 561,000 | 513,480 | 302,116 | 2,634 | 52,791 | 1,969,068 | |||||||||||||||||
2016 | 272,708 | — | — | — | 127,865 | 103 | 24,707 | 425,383 | ||||||||||||||||||
Note: Amounts may not foot due to rounding conventions.
(1) | The amounts in this column for 2017 represent the first installment of the Retention Bonuses which are described above under “Special cash transaction bonuses and retention bonuses”. For Mr. Govers, this column also includes the first payment of his Sign-on Award which is described above under “Cash sign-on bonus”. |
133
(2) | The amounts in this column represent the grant date fair value of the equity award calculated in accordance with FASB ASC Topic 718; however, the grant date fair value amount did not take into account the right of award holders to receive dividends pursuant to dividend equivalent rights with respect to outstanding unvested RSU awards. Details and assumptions used in calculating the grant date fair value of the RSU awards may be found in Note 11, “Stock-based compensation,” to Aleris Corporation’s audited consolidated financial statements included herein. |
(3) | The amounts in this column represent the grant date fair value of the equity award calculated in accordance with FASB ASC Topic 718. The fair value of the stock options will likely vary from the actual value the holder may receive on exercise because the actual value depends on the number of stock options exercised and the market price of our common stock on the date of exercise. Details and assumptions used in calculating the grant date fair value of the stock options may be found in Note 11, “Stock-based compensation,” to Aleris Corporation’s audited consolidated financial statements included herein. |
(4) | The amounts in this column represent each named executive officer’s aggregate earnings under the Deferred Compensation Plan as well as the change in the actuarial present value of such executive’s benefit under the Aleris Cash Balance Plan for Messrs. Stack, Keown and Clegg or, for Mr. Govers, the Belgian Retirement Plan. For additional information see the sections entitled “Pension benefits as of December 31, 2017” and “Nonqualified deferred compensation as of December 31, 2017” below. |
(5) | The Company provides perquisites and certain other compensatory benefits to its executives. See the section entitled “Perquisites” above. The following table below sets forth certain perquisites for 2017 and certain related additional other compensation items, for our named executive officers. Amounts set forth in the table below represent actual costs, other than for parking. A specified number of parking spaces are allocated to the Company in the lease for our Cleveland location. The table sets forth the amounts that would have been paid by the named executive officer for the parking spaces. Tax gross-up payments are made to the named executive officers for annual physicals, financial planning services, spousal travel, entertainment and related expenses, and expatriate tax equalization expenses, as applicable. |
Annual Physical ($) | Financial Planning ($) | Parking ($) | Automobile ($) | Tax Gross-up (a) ($) | ||||||||||
Sean M. Stack | 3,299 | 11,984 | 1,080 | — | 13,799 | |||||||||
Eric M. Rychel | 2,038 | 12,036 | 1,080 | — | 5,847 | |||||||||
Jacobus A.J. Govers (b) | — | — | — | 6,779 | — | |||||||||
Michael T. Keown | — | 12,720 | 1,080 | — | 6,222 | |||||||||
Christopher R. Clegg | — | 12,079 | 1,080 | — | 5,909 | |||||||||
Tamara S. Polmanteer | 4,976 | 14,116 | 1,080 | — | 7,931 | |||||||||
(Continued) | Spousal Travel and Entertainment and Related Tax Gross-up (c) ($) | 401(k) Match Contribution (d) ($) | Nonqualified Deferred Compensation Contribution (e) ($) | Expatriate Tax Equalization Payments and Related Tax Gross-up (f) ($) | Total ($) | |||||||||
Sean M. Stack | 6,830 | 14,775 | 80,273 | — | 132,040 | |||||||||
Eric M. Rychel | — | 12,250 | 26,703 | — | 59,953 | |||||||||
Jacobus A.J. Govers (b) | — | — | — | — | 6,779 | |||||||||
Michael T. Keown | 6,142 | 13,238 | 15,631 | 121,440 | 176,473 | |||||||||
Christopher Clegg | — | 14,775 | 24,571 | — | 58,414 | |||||||||
Tamara S. Polmanteer | — | 14,775 | 9,912 | — | 52,791 | |||||||||
Note: Amounts may not foot due to rounding conventions.
(a) | Tax gross-up payments are made to the named executive officers for annual physicals and financial planning services, as applicable. |
(b) | For Mr.Govers, amounts have been converted using the average annual conversion rate used by the Company (equaling 1.12989 US$ to 1€ for 2017). The amount listed under “Financial Planning” represents financial planning services; and the amount listed under “Automobile” represents the value of the benefit conferred upon Mr. Govers for use of the Company-leased automobile, in accordance with Belgian case law in the context of calculating statutory termination payments (which is different than the value attributed to this benefit). |
(c) | Amounts included in this column represent the incremental cost of our named executive officers’ spouses and guests participating in certain business-related entertainment events and travel in connection with such events. Where a spouse or guest traveled with a named executive officer utilizing a Company-sponsored aircraft on an otherwise scheduled business flight, there was no incremental cost to the Company associated with the spouse’s or guest’s accompaniment. Where a spouse or guest traveled with a named executive officer utilizing commercial flights, the incremental cost has been calculated based on the actual cost to the Company of the ticket and related fees. With respect to entertainment expenses attributed to a named executive officer’s spouse or guest, the incremental cost is calculated based on the cost of meals or individually-purchased event tickets that are attributable to the spouse’s or guest’s attendance. For 2017, only Mr. Keown received a tax gross-up payment on any such imputed income. |
(d) | Amounts included in this column represent restoration matching contributions as well as restoration retirement accrual matching contributions made to the Aleris 401(k) Plan on behalf of our U.S. named executive officers. |
(e) | Amounts included in this column represent restoration matching contributions and restoration retirement accrual contributions made to the Deferred Compensation and Retirement Benefit Restoration Plan on behalf of the U.S. named executive officers. |
(f) | The amount included for Mr. Keown represents certain expatriate tax equalization payments being made to him in connection with his prior service outside of the U.S. |
(6) | To convert compensation values to US$, the average annual conversion rate used by the Company (equaling 1.12989 US$ to 1€ for 2017), was applied to each payment, except with respect to Mr. Govers’ 2017 MIP bonus payout, which was calculated using the December 31, 2017 spot conversion rate used by the Company (equaling 1.1979 US$ to 1€). |
(7) | Mr. Govers and Ms. Polmanteer joined the Company in June 2016 and April 2016, respectively. As such, compensation information with respect to these executives has not been included for 2015. Mr. Keown was appointed to the position of Executive Vice President and President of Aleris North America in November 2017, and therefore his compensation information has only been included for 2017. |
Grants of plan-based awards for fiscal year 2017
The following table provides information concerning the plan-based awards (equity awards and non-equity incentive plan awards) for fiscal year 2017. Actual payments under the MIP that have been paid with respect to 2017 performance are
134
discussed above under the section entitled “Base salary and cash bonus awards” and included in the “Summary compensation table” above.
Name | Grant Date | Type | Estimated future payouts under non-equity incentive plan awards | All other stock awards: Number of shares of stock or units (#) | All other option awards: Number of securities underlying options (#) | Exercise or base price of option awards ($/Sh) | Grant date fair value of stock and option awards ($) | ||||||||||||
Threshold ($) | Target ($) | Maximum ($) | |||||||||||||||||
Sean M. Stack | — | MIP | — | 1,187,500 | 2,375,000 | — | — | — | — | ||||||||||
11/13/2017 | — | — | — | 231,825 | — | — | 3,941,025 | ||||||||||||
11/13/2017 | — | — | — | — | 463,650 | 17.00 | 3,607,197 | ||||||||||||
Eric M. Rychel | — | MIP | — | 446,250 | 892,500 | — | — | — | — | ||||||||||
11/13/2017 | — | — | — | 66,000 | — | — | 1,122,000 | ||||||||||||
11/13/2017 | — | — | — | — | 132,000 | 17.00 | 1,026,960 | ||||||||||||
Jacobus A.J. Govers | — | MIP | — | 432,607 (1) | 865,213 (1) | — | — | — | — | ||||||||||
11/13/2017 | — | — | — | 66,000 | — | — | 1,122,000 | ||||||||||||
11/13/2017 | — | — | — | — | 132,000 | 17.00 | 1,026,960 | ||||||||||||
Michael T. Keown | — | MIP | — | 337,500 | 675,000 | — | — | — | — | ||||||||||
11/13/2017 | — | — | — | 66,000 | — | — | 1,122,000 | ||||||||||||
11/13/2017 | — | — | — | — | 132,000 | 17.00 | 1,026,960 | ||||||||||||
Christopher R. Clegg | — | MIP | — | 337,500 | 675,000 | — | — | — | — | ||||||||||
11/13/2017 | — | — | — | 57,750 | — | — | 981,750 | ||||||||||||
11/13/2017 | — | — | — | — | 115,500 | 17.00 | 898,590 | ||||||||||||
Tamara S. Polmanteer | — | MIP | — | 260,000 | 520,000 | — | — | — | — | ||||||||||
11/13/2017 | — | — | — | 33,000 | — | — | 561,000 | ||||||||||||
11/13/2017 | — | — | — | — | 66,000 | 17.00 | 513,480 | ||||||||||||
(1) | To convert compensation values to US$, the average annual conversion rate used by the Company (equaling 1.12989 US$ to 1€ for 2017) was applied to the estimated possible MIP payouts. |
Employment agreements
We are a party to an Employment Agreement with each of our U.S. executive officers, each of which provides for automatic one-year renewal terms following the end of the current term (one-year current terms for each Messrs. Stack and Clegg and an initial three-year term for Messrs. Rychel and Keown and Ms. Polmanteer) unless either the executive or the Company provides advance written notice of intent not to renew the term. Pursuant to the Employment Agreements, the notice of intent not to renew the employment term must be provided (x) by the named executive officer, at least 60 days prior to the end of the then current term (y) by the Company with respect to Mr. Stack, at least 30 days prior to the end of the then current term and (z) by the Company with respect to each of Messrs. Rychel, Keown and Clegg and Ms. Polmanteer, at least six months prior to the end of the then current term.
We are a party to an Employment Agreement with Mr. Govers which is governed by applicable Belgian laws. Mr. Govers’ Employment Agreement has an indefinite term and generally may be terminated at any time by either party, subject to certain notice provisions and indemnity obligations required by applicable laws. Under applicable Belgian laws, Aleris Aluminum Duffel BVBA (“Aleris Duffel”) is generally required to provide Mr. Govers with notice (based upon his tenure with Aleris Duffel) of its intent to terminate his employment. Aleris Duffel has the option to require Mr. Govers to work during this notice period. If Aleris Duffel determines to not require Mr. Govers’ services during the notice period, his statutory severance payment is due in a lump sum (as described in greater detail under “Potential payments upon termination or change in control”. Additionally, Mr. Govers is required to provide Aleris Duffel at least five weeks’ prior notice of his intent to terminate his employment.
The Employment Agreement for each named executive officer provides for base salary, annual bonus opportunity and, as applicable, the grant of stock options and RSUs, as described herein. Each of the named executive officers is entitled to participate in all employee benefit plans and, as applicable, programs of the Company and in all perquisite and fringe benefits which are from time to time made available to senior employees by the Company. In addition, the Employment Agreement for each named executive officer sets forth the rights and obligations of such individual upon a termination of employment, which provisions are described below under the heading “Potential payments upon termination or change in control”.
With respect to each of our U.S.-based named executive officers, the Company entered into amendments to his or her Employment Agreement on March 16, 2018, in each case to be retroactive to November 13, 2017, for the purpose of providing that the severance to be received by such named executive officer upon a non-renewal of the employment term to be generally equivalent to the severance to be received upon a termination by the Company without cause or by the named executive officer for good reason. Additional details regarding these amendments are described below under the heading “Potential payments upon termination or change in control”.
Stockholders agreement
135
If and when any of the stock options granted under the Equity Incentive Plan are exercised and when shares are issued pursuant to the settlement of RSUs granted under the Equity Incentive Plan, each participant, including our named executive officers, automatically becomes a party to the Stockholders Agreement. The Stockholders Agreement provides that the holder of shares of our common stock may not, except in limited circumstances, transfer any of the shares of common stock that are acquired upon the exercise of stock options or settlement of RSUs. In addition, if (i) the Oaktree Funds propose to transfer more than 2% of their common stock to any person who is not an affiliate of the Oaktree Funds or the Apollo Funds, or (ii) if the Oaktree Funds transfer more than 5% of their common stock to the Apollo Funds and the Apollo Funds in turn transfer such shares to any person who is not an affiliate of the Apollo Funds within 90 days of receiving such shares from the Oaktree Funds, a notice will be issued to provide other stockholders, including the named executive officers, with an opportunity to sell a proportionate number of shares to such person, based on such terms as may be set forth in that notice. Further, if stockholders holding a majority of the outstanding shares of common stock together propose to transfer, in one or a series of transactions, to either (i) a person who is not an affiliate of any of the stockholders in the group proposing such transfer, or (ii) a group that was established to purchase the Company that includes any of the stockholders proposing the transfer or its affiliates, but only if such stockholders proposing the transfer control no more than 10% of the voting securities of such group, the group proposing the transfer will be able to require other stockholders, including the named executive officers, to transfer a proportionate number of their shares of common stock to such person or group. The Stockholders Agreement will terminate upon the consummation of an initial public offering of Aleris Corporation or upon a Change of Control of the Company (neither of which is guaranteed to occur), and will no longer be applicable to shares issued upon the exercise or vesting of stock options or RSUs, respectively.
Outstanding equity awards as of December 31, 2017
The following table provides information concerning outstanding equity awards in respect of shares of common stock of Aleris Corporation as of December 31, 2017 for each of our named executive officers.
Option awards (1) | Stock awards | ||||||||||||||
Name | Number of securities underlying unexercised options exercisable | Number of securities underlying unexercised options unexercisable | Option exercise price ($) | Option expiration date | Number of shares or units of stock that have not vested (2) | Market value of shares or units of stock that have not vested ($)(3) | |||||||||
Sean M. Stack | 183,872 | — | 16.78 | 6/1/2020 | |||||||||||
45,967 | — | 25.16 | 6/1/2020 | ||||||||||||
45,967 | — | 33.56 | 6/1/2020 | ||||||||||||
101,300 | — | 27.20 | 1/21/2024 | ||||||||||||
128,672 | 64,328 | (4) | 23.70 | 10/7/2025 | |||||||||||
154,550 | 309,100 | (5) | 17.00 | 11/13/2027 | |||||||||||
168,217 | (6) | 2,859,689 | |||||||||||||
Eric M. Rychel | 12,631 | — | 38.01 | 7/15/2022 | |||||||||||
9,600 | — | 27.20 | 1/21/2024 | ||||||||||||
15,000 | — | 27.20 | 4/15/2024 | ||||||||||||
18,061 | 17,339 | (7) | 23.70 | 1/20/2025 | |||||||||||
25,423 | 10,577 | (8) | 23.70 | 10/7/2025 | |||||||||||
44,000 | 88,000 | (5) | 17.00 | 11/13/2027 | |||||||||||
50,759 | (9) | 862,903 | |||||||||||||
Jacobus A.J. Govers | 44,000 | 88,000 | (5) | 17.00 | 11/13/2027 | ||||||||||
44,000 | (10) | 748,000 | |||||||||||||
Michael T. Keown | 21,291 | — | 16.78 | 6/1/2020 | |||||||||||
7,095 | — | 25.16 | 6/1/2020 | ||||||||||||
7,095 | — | 33.56 | 6/1/2020 | ||||||||||||
12,000 | — | 27.20 | 1/21/2024 | ||||||||||||
44,000 | 88,000 | (5) | 17.00 | 11/13/2027 | |||||||||||
44,000 | (10) | 748,000 | |||||||||||||
Christopher R. Clegg | 128,662 | — | 16.78 | 6/1/2020 | |||||||||||
32,163 | — | 25.16 | 6/1/2020 | ||||||||||||
32,163 | — | 33.56 | 6/1/2020 | ||||||||||||
46,700 | — | 27.20 | 1/21/2024 | ||||||||||||
38,500 | 77,000 | (5) | 17.00 | 11/13/2027 | |||||||||||
38,500 | (10) | 654,500 | |||||||||||||
Tamara S. Polmanteer | 22,000 | 44,000 | (5) | 17.00 | 11/13/2027 | ||||||||||
22,000 | (10) | 374,000 | |||||||||||||
136
(1) | As applicable and in connection with dividends paid on the Company’s common stock in 2010 and 2013, the stock option exercise prices and number of shares underlying the stock options have been adjusted. |
(2) | The unvested shares reflected in this column are time-vesting RSUs. |
(3) | The amounts shown in this column are based upon the valuation of one share of our common stock on December 31, 2017 of $17.00. |
(4) | The stock options shown in this column will vest on July 11, 2018. |
(5) The stock options shown in this column will vest in two equal installments on each of December 31, 2018 and December 31, 2019.
(6) | Of the total number of RSUs shown in this column, 13,667 will vest on July 11, 2018, and the remaining 154,550 will vest in two equal installments on each of December 31, 2018 and December 31, 2019. |
(7) | The stock options shown in this column vested on January 15, 2018. |
(8) | The stock options shown in this column will vest on October 15, 2018. |
(9) | Of the total number of RSUs shown in this column, 4,996 vested on January 15, 2018, 1,763 will vest on October 15, 2018, and the remaining 44,000 will vest in two equal installments on each of December 31, 2018 and December 31, 2019. |
(10) The RSUs shown in this column will vest in two equal installments on each of December 31, 2018 and December 31, 2019.
Option exercises and stock vested January 1 - December 31, 2017
The number of shares acquired on stock option exercise and/or RSU vesting (inclusive of the number of shares surrendered to pay taxes associated with each executive’s RSU vesting events), as applicable, is reported below. In 2017, none of our named executive officers exercised any stock options.
Option awards | Stock awards | |||||||||
Name | Number of shares acquired on exercise (#) | Value realized on exercise ($) | Number of shares acquired on vesting (#) | Value realized on vesting ($) | ||||||
Sean M. Stack (1) | — | — | 104,592 | 2,100,951 | ||||||
Eric M. Rychel (2) | — | — | 31,448 | 646,291 | ||||||
Jacobus A.J. Govers (3) | — | — | 22,000 | 374,000 | ||||||
Michael T. Keown (4) | — | — | 25,000 | 460,460 | ||||||
Christopher R. Clegg (5) | — | — | 25,550 | 508,816 | ||||||
Tamara S. Polmanteer (6) | — | — | 11,000 | 187,000 | ||||||
(1) | In connection with Mr. Stack’s RSU vesting events, 51,941 shares were issued to the executive and 52,651 shares were surrendered to pay required withholding obligations associated with such vesting events. |
(2) | In connection with Mr. Rychel’s RSU vesting events, 22,031 shares were issued to the executive and 9,417 shares were surrendered to pay required withholding obligations associated with such vesting events. |
(3) | In connection with Mr. Govers’ RSU vesting events, 19,124 shares were issued to the executive and 2,876 shares were surrendered to pay required withholding obligations associated with such vesting events. |
(4) | In connection with Mr. Keown’s RSU vesting events, 16,438 shares were issued to the executive and 8,562 shares were surrendered to pay required withholding obligations associated with such vesting events. |
(5) | In connection with Mr. Clegg’s RSU vesting events, 16,977 shares were issued to the executive and 8,573 shares were surrendered to pay required withholding obligations associated with such vesting events. |
(6) | In connection with Ms. Polmanteer’s RSU vesting events, 7,771 shares were issued to the executive and 3,229 shares were surrendered to pay required withholding obligations associated with such vesting events. |
Pension benefits as of December 31, 2017
The following table provides information with respect to each pension plan that provides for payments or other benefits at, following, or in connection with retirement. This includes tax-qualified defined benefit plans and supplemental executive retirement plans, but does not include defined contribution plans (whether tax-qualified or not). Values reflect the actuarial present value of the named executive officer’s accumulated benefit under the retirement plans, computed as of December 31, 2017. In making this calculation for Messrs. Stack, Keown and Clegg, we used the same economic assumptions that we use for financial reporting purposes (except that retirement is assumed to occur at age 62). These assumptions include the following: (a) retirement age of 62 (the earliest allowable retirement age under the plan without a reduction in benefits); (b) discount rate of 3.38%; (c) cash balance interest crediting rates of 2.72% for 2017 and 3.50% for periods after 2017; and (d) a lump sum form of payment. In order to calculate the present value for Mr. Govers’ accumulated benefit, the following assumptions were applied: interest crediting rate of 1.75%, a retirement age of 65 and a discount rate of 1.9%.
137
Name | Plan name | Number of years credited service (#) | Present value of accumulated benefit ($) | Payments during last Fiscal Year ($) | |||||||||||
Sean M. Stack | Aleris Cash Balance Plan | 2.6 | 31,095 | — | |||||||||||
Eric M. Rychel | None | — | — | — | |||||||||||
Jacobus A.J. Govers | Belgian Retirement Plan | 1.5 | 125,659 (1) | — | |||||||||||
Michael T. Keown | Aleris Cash Balance Plan | 8.4 | 37,756 | — | |||||||||||
Christopher R. Clegg | Aleris Cash Balance Plan | 2.5 | 44,479 | — | |||||||||||
Tamara S. Polmanteer | None | — | — | — | |||||||||||
(1) | To convert the present value of accumulated benefit to US$, the December 31, 2017 spot conversion rate used by the Company (equaling 1.1979 US$ to 1€ for 2017) was applied. |
Aleris Cash Balance Plan
As former Commonwealth Industries, Inc. employees, Messrs. Stack, Keown and Clegg are participants in the Aleris Cash Balance Plan, which was previously a plan of that predecessor entity. The Aleris Cash Balance Plan is a qualified defined benefit plan under the U.S. Internal Revenue Code of 1986, as amended (the “Internal Revenue Code”). Participants’ benefits are determined on the basis of a notional account. Accounts are credited with pay credits of 3.5% and 8.0% of earnings for each year of credited service based on the participant’s age. Interest is credited based on applicable rates of interest on U.S. Treasury bonds, subject to a minimum interest rate defined in the Aleris Cash Balance Plan. Compensation and benefits are limited to applicable Internal Revenue Code limits. Pay credits were ceased effective December 31, 2006.
Benefits are available to participants as either an annuity or lump sum with an equivalent value to the participant’s account at the time of distribution. Normal retirement is age 65 and unreduced benefits are available at age 62. Benefits are available at earlier ages as long as the participant is vested in the plan. Three years of service is required for vesting. Earnings include base pay and annual incentive payments. The value of stock options and other long-term compensation items are not included.
The plan provides grandfathered benefits to certain participants based on a previous plan benefit formula. None of our named executive officers are eligible for these benefits. Benefit accruals in this plan were frozen effective December 31, 2006 for all participants including our applicable named executive officers.
Belgian Retirement Plan
Mr. Govers is not a participant in the Aleris Cash Balance Plan. He participates in the Belgian Retirement Plan, an occupational pension plan operated in accordance with applicable Belgian laws. Under the terms of Mr. Govers’ Employment Agreement, Aleris Duffel contributes an amount equal to 15% of his annual salary is the Belgian Retirement Plan. The Belgian Retirement Plan provides that upon Mr. Govers’ retirement, at the normal retirement date at age 65, he is (or his eligible heirs are) eligible for a lump sum payment equal to the greater of his account balance or his account balance assuming a nominal minimum rate of return. No further contributions will be provided after retirement.
Nonqualified deferred compensation as of December 31, 2017
The following table provides information with respect to the Aleris Deferred Compensation and Retirement Benefit Restoration Plan (the “Deferred Compensation Plan”).
Name | Executive contributions in last FY ($)(1) | Registrant contributions in last FY ($)(2) | Aggregate earnings in last FY ($)(3) | Aggregate withdrawals/ distributions ($) | Aggregate balance at last FYE ($)(4) | ||||||||||
Sean M. Stack | 83,691 | 80,273 | 4,058 | — | 574,682 | ||||||||||
Eric M. Rychel | 24,091 | 26,703 | 32,218 | — | 208,282 | ||||||||||
Jacobus A.J. Govers (5) | — | — | — | — | — | ||||||||||
Michael T. Keown | 28,557 | 15,631 | 27,285 | — | 200,336 | ||||||||||
Christopher R. Clegg | 33,757 | 24,571 | 3,192 | — | 373,752 | ||||||||||
Tamara S. Polmanteer | 19,352 | 9,912 | 2,634 | — | 45,143 | ||||||||||
(1) | This amount reflects a portion of salary that the indicated executive elected to defer during 2017. This amount is included in the “Salary” column of the “Summary compensation table”. |
(2) | The full amounts reported as Company contributions have been reported in the “All other compensation” columns in the “Summary compensation table”. Amounts included in this column represent the following contributions made to the Deferred Compensation Plan: (a) restoration matching contributions on behalf of Messrs. Stack, Rychel, Keown and Clegg and Ms. Polmanteer in the amounts of $56,153, $20,602, $12,045, $16,205 and $9,797 respectively, and (b) restoration retirement accrual contributions on behalf of Messrs. Stack, Rychel, Keown, Clegg and Ms. Polmanteer in the amounts of $24,120, $6,100, $3,585, $8,366 and $116, respectively. |
138
(3) | Includes amounts reported in the “Change in Pension Value and Nonqualified Deferred Compensation Earnings” column of the “Summary compensation table.” |
(4) | Of the totals in this column, amounts previously reported in the “Summary compensation table” for previous years are $246,590, $46,547, $185,645 and $411, respectively, for Messrs. Stack, Rychel and Clegg and Ms. Polmanteer. |
(5) | Mr. Govers was not a participant in our Deferred Compensation Plan in 2017. |
Our named executive officers based in the United States are eligible to participate in the Deferred Compensation Plan that benefits only a select group of United States management employees. The Deferred Compensation Plan uses a hypothetical account for each participant who elects to defer income. The participant selects investment funds from a broad range of options. Earnings and losses on each account are determined based on the performance of the investment funds selected by the participant. A participant may elect to defer a minimum of 10% but not more than 50% of his or her annual base compensation and between 10-95% of his or her bonus awarded pursuant to the MIP as compensation deferrals. In addition, the participant may elect to defer between 1-5% of his or her annual base compensation and between 1-5% of his or her bonus awarded pursuant to the MIP as restoration deferrals. With respect to amounts contributed to the plan by the participant as restoration deferrals, the Company provides certain matching contributions and employer contributions. The employer contributions are subject to vesting conditions. As of December 31, 2017, Ms. Polmanteer was 33 1/3% vested with respect to her employer contributions, and our other applicable named executive officers were 100% vested with respect to their employer contributions. Distributions under the Deferred Compensation Plan may be made as a single lump sum, on a fixed date or schedule, or in equal installments over periods of five or ten years, depending on distribution’s triggering event and the participant’s elections, in compliance with the election and timing rules of Internal Revenue Code Section 409A.
Potential payments upon termination or change in control
As discussed elsewhere in the “Compensation discussion and analysis”, the named executive officers are eligible for severance benefits under their employment agreements, as described below, in the event of certain terminations of employment. In addition, certain provisions are trigged pursuant to the stock option and RSU award agreements in the event of a Change of Control or termination of employment.
U.S. named executive officers
Under the terms of the applicable Employment Agreement, each U.S. named executive officer’s employment may be terminated at any time by either party, subject to certain notice provisions and severance obligations in the event of certain specified terminations described herein. The payments and benefits upon each termination of employment scenario as described herein (other than accrued benefits) are generally conditioned upon the execution of a general release of claims against the Company and the executive’s compliance with certain restrictive covenants discussed below.
Accrued benefits (1) | Earned annual bonus for the prior year | Cash severance payment (2) | Pro-rata bonus (3) | Nonrenewal payment (4) | Continuation of medical benefits (5) | |
Upon a termination by the Company without Cause or by the executive for Good Reason (each as defined below) | ü | ü | ü | ü | ü | |
Upon a termination by the Company for Cause or by the executive without Good Reason | ü | |||||
Upon a termination due to the executive’s death or disability | ü | ü | ü | |||
Upon a termination by the Company due to nonrenewal (6) | ü | ü | ü | |||
Upon a termination by the executive due to nonrenewal (7) | ü | ü | ||||
(1) | To the extent accrued benefits (i.e., business expenses and vacation) have not yet been paid or used, as applicable, prior to the date of termination, these benefits will be paid as soon as practicable following the date of termination. |
(2) | The cash severance payment is equal to 3 times (for Mr. Stack) or 1.5 times (for Messrs. Rychel, Keown, Clegg and Ms. Polmanteer) the sum of the (x) executive’s base salary and (y) annual target bonus. It is payable in substantially equal installments consistent with Aleris International’s payroll practices over a period of 24 months for Mr. Stack and 18 months for Messrs. Rychel, Keown, Clegg and Ms. Polmanteer following the date of termination. However, in the event of a termination of employment by the Company without Cause or by the executive for Good Reason in anticipation of or within 12 months following a Change of Control (as defined in the Plan), the cash severance payment will be paid in a cash lump sum within 30 days following the date of termination, to the extent permissible without penalty under the applicable tax rules. |
(3) | The pro-rata bonus is determined based on the executive’s annual target bonus adjusted for the number of days the executive was employed during the calendar year. |
(4) | After giving effect to the amendment to the Employment Agreement entered into with each of our U.S. named executive officers, (i) for Mr. Stack, the nonrenewal payment is calculated and paid in the same manner as the cash severance payment and (ii) for Messrs. Rychel, Keown and Clegg and Ms. Polmanteer, the nonrenewal payment is equal to the sum of the (x) executive’s base salary and (y) annual target bonus. |
139
(5) | In connection with a termination by the Company without Cause or by the executive for Good Reason, medical coverage continues for 24 months for Mr. Stack or 18 months for Messrs. Rychel, Keown and Clegg and Ms. Polmanteer. In connection with a termination by the Company due to nonrenewal, medical coverage continues for 24 months for Mr. Stack or 12 months for Messrs. Rychel, Keown and Clegg, and Ms. Polmanteer. |
(6) | The Company must provide at least six months’ notice (30 days’ notice for Mr. Stack) in the event it elects not to renew any such named executive officer’s employment at the end of the then-outstanding term in accordance with the terms of the Employment Agreement. |
(7) | Each executive is required to provide at least 60 days’ notice in the event they elect to not renew his or her Employment Agreement at the end of the then-outstanding term in accordance with the terms of the Employment Agreement. |
The Employment Agreements provide that in the event that any of the named executive officers (other than Mr. Govers) is terminated by the Company without Cause or by the executive for Good Reason in anticipation of or within 12 months following a Change of Control, the cash portion of any severance entitlements (as described above) will be paid in a lump sum payment. In addition, upon a Change of Control, an executive’s termination of employment in connection with a Change of Control may, in certain instances, result in acceleration of vesting of any such executive’s equity award holdings, if applicable, and as described below.
Mr. Govers
Pursuant to applicable Belgian laws, Mr. Govers is entitled to certain payments and benefits upon termination which are described and quantified below.
Restrictive Covenants
Each named executive officer agreed in their Employment Agreement to be bound by certain restrictive covenants, including a confidentiality provision. Each Employment Agreement also obligates each such named executive officer to agree to not (i) solicit, hire, or encourage any such person to terminate employment with Aleris International (Aleris Duffel for Mr. Govers,) or its affiliates, anyone employed by Aleris International (Aleris Duffel for Mr. Govers), within six months of such hiring date, for a period of 24 months (for Mr. Stack), 36 months (for Mr. Govers), or 18 months (for Messrs. Rychel, Keown and Clegg and Ms. Polmanteer) following the executive’s termination; (ii) compete with Aleris International for a period of 24 months (for Mr. Stack), 18 months (for Mr. Govers, which would require payment of a lump sum indemnity equal to 39 weeks of Govers Weekly Severance (described below)) or 18 months (for Messrs. Rychel, Keown and Clegg and Ms. Polmanteer) following the executive’s termination; and (iii) defame or disparage Aleris International (Aleris Duffel for Mr. Govers), its affiliates and their respective officers, directors, members and executives.
Certain definitions
In each U.S. named executive officer’s Employment Agreement, and for Mr. Govers, in his equity award agreements, “Cause” is generally defined to mean the occurrence of any of the following, if the executive has not cured such behavior, where applicable, within 30 days after receiving notice from the Company:
▪ | a material breach by the executive of the Employment Agreement; |
▪ | other than as a result of physical or mental illness or injury, the executive’s continued failure to substantially perform the executive’s duties; |
▪ | gross negligence or willful misconduct by the executive which causes or reasonably should be expected to cause material harm to Company and its subsidiaries; |
▪ | material failure by the executive to use best reasonable efforts to follow lawful instructions of the Board of Directors or, for the named executive officers other than Mr. Stack, the executive’s direct supervisor; or |
▪ | the executive’s indictment for, or plea of nolo contendere to, a felony involving moral turpitude or other serious crime involving moral turpitude. |
For determining the Belgian statutory indemnity obligations applicable to Mr. Govers, “Cause” is defined by reference to Article 35 of the Belgian Employment Act of July 3, 1978, which is defined therein as “the serious fault which renders any further professional collaboration between employer and employee immediately and definitively impossible”. The Belgian labor court makes the final determination as to whether the circumstances of a termination amount to a termination for “Cause”.
In each U.S. named executive officer’s employment agreement, and for Mr. Govers, in his equity award agreements, “Good Reason” is defined to mean the occurrence of any of the following, without the named executive officer’s prior written consent, if Aleris International has not cured such behavior within 60 days after receiving notice from the executive:
▪ | a material reduction in base salary or annual bonus opportunity; |
▪ | a material diminution in position, duties, responsibilities or reporting relationships; |
▪ | a material breach by the Company of any material economic obligation under the Employment Agreement or any applicable stock option or RSU award agreements; or |
▪ | a change of principal place of employment to a location more than 75 miles from such principal place of employment as of the effective date of the applicable Employment Agreement. |
140
“Change of Control” (defined as “Change of Control” in the Equity Incentive Plan) is defined as the occurrence of any one of the following events:
▪ | the acquisition by any “person” or “group” (as such terms are used in Sections 13(d) of the Securities Exchange Act of 1934) other than the Initial Investors and their affiliates (including among such affiliates, for purposes of this definition, for the avoidance of doubt, any entity that the Initial Investors beneficially own more than 50% of the then-outstanding securities entitled to vote generally in the election of directors of such entity) of more than 50% of the then-outstanding securities entitled to vote generally in the election of directors of the Company (“Voting Securities”); |
▪ | any merger, consolidation, reorganization, recapitalization, tender or exchange offer or any other transaction with or affecting the Company following which any person or group, other than the Initial Investors and their affiliates, beneficially owns more than 50% of the Voting Securities of the surviving entity; |
▪ | the sale, lease, exchange, transfer or other disposition of all, or substantially all, of the assets of the Company and its consolidated subsidiaries, other than to a successor entity of which the Initial Investors and their affiliates beneficially own 50% or more of the Voting Securities; or |
▪ | a change in the composition of the Board of Directors over a period of 36 months or less, such that a majority of the individuals who constitute the Board of Directors as of the beginning of such period (the “Incumbent Directors”) cease for any reason to constitute at least a majority of the Board of Directors; provided that any person becoming a Director subsequent to the beginning of such period, whose election or nomination for election was approved by a vote of at least a majority of the Incumbent Directors, including those directors whose election or nomination for election was previously so approved, shall be deemed to be an Incumbent Director. |
Notwithstanding the foregoing, (A) a person shall not be deemed to have beneficial ownership of securities subject to a stock purchase agreement, merger agreement or similar agreement (or voting or option agreement related thereto) until the consummation of the transactions contemplated by such agreement, and (B) any holding company whose only material asset is equity interests of the Company or any of its direct or indirect parent companies shall be disregarded for purposes of determining beneficial ownership under clause (ii) above and (C) the term “Change of Control” shall not include (x) a merger or consolidation of the Company with or the sale, assignment, conveyance, transfer, lease or other disposition of all or substantially all of the Company’s assets to an affiliate of the Company incorporated or organized solely for the purpose of reincorporating or reorganizing the Company in another jurisdiction and/or for the sole purpose of forming a holding company or (y) the completion of the transactions contemplated by Aleris’ restructuring in 2010.
Equity award agreements
Under the Equity Incentive Plan and equity award agreements, upon a Change of Control, each of our named executive officer’s stock options and the RSUs, if applicable, would vest to the extent necessary to make the aggregate percentage of the stock options and the RSUs that have become vested as of the date of such Change of Control at least equal to the percentage by which the Initial Investors have reduced their combined common stock interest in the Company. The remaining unvested awards, if applicable, would continue to vest in accordance with their terms. If the Initial Investors’ combined common stock interest in the Company is reduced by 75% or more, then all of the stock options and the RSUs will fully vest. The applicable percentage will be measured by comparing the number of shares held collectively by the Initial Investors as of June 1, 2010 and still held by them immediately following the Change of Control to the number of shares they held on June 1, 2010 (to be adjusted for stock splits, stock dividends and similar events).
Upon a voluntary termination of employment by each of our named executive officers without Good Reason, such named executive officer would forfeit all unvested stock options and RSUs immediately and would have the lesser of 90 days or the remaining term to exercise all vested stock options. Upon a termination of employment by the Company for Cause, the named executive officer would forfeit all stock options (whether vested or unvested) and unvested RSUs.
Upon a termination of employment by the Company without Cause or by the named executive officer for Good Reason (including due to the non-extension of any applicable employment term by the Company) for each named executive officer, each tranche, if applicable, of unvested stock options and all unvested RSUs would become immediately vested: as to 50% of Mr. Stack’s equity awards granted in 2015 and Mr. Rychel’s stock options granted in 2015; and as to 33 1/3% of the RSUs granted to Mr. Rychel in 2015. The named executive officer (including other named executive officers who hold outstanding vested stock options) would then have six months to exercise all vested stock options. In addition, for Messrs. Stack (in respect of his equity awards granted in 2015 and 2014), Rychel (in respect of only his equity awards granted in 2015), and Clegg (in respect of his equity award granted in 2014), if such named executive officer’s employment is terminated by the Company without Cause or by the named executive officer for Good Reason in each case, in anticipation of or within 12 months following a Change of Control, any unvested stock options and all RSUs would become vested immediately with any stock options remaining exercisable for the shorter of 12 months from the date of the termination of employment or the length of the remaining term to exercise all vested stock options. For awards granted to Mr. Stack and Mr. Clegg, in 2010, in the event terminated by the Company without Cause or by the named executive officer for Good Reason in
141
each case, in anticipation of or within 12 months following a Change of Control, any vested stock options will remain exercisable for the shorter of 6 months from the date of the termination of employment or the length of the remaining term to exercise all vested stock options. Stock options granted to Mr. Keown and Mr. Rychel, respectively, before he was an executive officer do not have additional extended exercisability provisions in the event of termination of employment in anticipation of or within 12 months following a Change of Control. In all cases, if the named executive officer’s employment is terminated as a result of death or disability, all unvested stock options and RSUs would be forfeited immediately and the named executive officer would have the shorter of one year or the length of the remaining term to exercise all vested stock options.
With respect to the RSUs granted to each of our named executive officers on November 13, 2017, upon a termination of employment by the Company without Cause or by the named executive for Good Reason, 33 1/3% (50% for Mr. Stack) of the portion of the named executive’s RSUs that remains unvested as of the date of termination will become vested as of the date of such termination, provided, however, that if such termination occurs in anticipation of or within 12 months following a Change of Control, the named executive officer’s RSUs will become fully vested as of the date of such termination. With respect to the stock options granted to each of our named executive officers on November 13, 2017, upon a termination of employment by the Company without Cause or by the named executive for Good Reason, 50% of the portion of the named executive officer’s stock options that remains unvested as of the date of termination will become vested as of the date of such termination and remain exercisable for the shorter of the six-month period following termination and the remainder of the option term, provided, however, that if such termination occurs in anticipation of or within 12 months following a Change of Control, the named executive officer’s stock options will become fully vested as of the date of such termination and remain exercisable for the shorter of three-year period following termination and the remainder of the option term.
Calculation of named executive officer’s potential payments
The payments and benefits to which our named executive officers would be entitled in the event of certain termination of employment events, or as a result of a Change of Control, are set forth in the table below, following a description of these payments and benefits, assuming the event occurred on December 31, 2017. For this purpose, we have assumed a value of $17.00 per share of our common stock.
Termination by Co. for Cause or by Exec. without Good Reason | Termination by Co. due to Non-Renewal of Term | Termination by Co. without Cause or by Exec. for Good Reason | Death or disability | Change in control | ||||||||||
Payment ($)(1) | Cash and benefits ($)(2) | Cash and benefits ($)(3) | Value of equity acceleration ($)(4) | Cash and benefits ($)(5) | Value of equity acceleration ($)(6) | |||||||||
Sean M. Stack | 73,077 | 7,874,963 | 7,874,963 | 1,429,845 | 1,260,577 | 2,859,689 | ||||||||
Eric M. Rychel | 40,385 | 1,507,963 | 2,027,388 | 431,452 | 486,635 | 862,903 | ||||||||
Jacobus A.J. Govers (7) | ||||||||||||||
Michael T. Keown | 34,615 | 1,226,569 | 1,612,757 | 374,000 | 372,115 | 748,000 | ||||||||
Christopher R. Clegg | 34,615 | 1,228,885 | 1,624,188 | 327,250 | 372,115 | 654,500 | ||||||||
Tamara S. Polmanteer | 30,769 | 1,023,919 | 1,327,611 | 187,000 | 290,769 | 380,754 | ||||||||
(1) | The amounts in this column include only payment of vacation, as of December 31, 2017. |
(2) | The amount of Cash and Benefits in the event of a termination by Aleris International due to non-renewal of the employment term (calculated under the terms of each executive’s Employment Agreement assuming the termination occurred on December 31, 2017) includes the payment of the executive’s nonrenewal payment, the 2017 earned MIP bonus, accrued an unused vacation and an estimated value of continued medical benefits. |
(3) | The amount of Cash and Benefits in the event of a termination by Aleris International without Cause or by the Executive for Good Reason (calculated under the terms of each executive’s Employment Agreement assuming the termination occurred on December 31, 2017) includes, in addition to the amounts described in Note 5 below, the payment of the executive’s cash severance payment and an estimated value of continued medical benefits. |
(4) | Upon termination by Aleris International without Cause or by the executive for Good Reason, the named executive officers’ remaining unvested stock options and RSUs will vest as described above. |
(5) | The amounts in this column include payment of vacation for all named executive officers as of December 31, 2017, as well as a cash payment equal to each executive’s 2017 MIP bonus (assuming payout at target level and termination on December 31, 2017). |
(6) | The Change in Control equity valuation assumes that the Oaktree Funds would reduce their combined common stock interest of the Company by more than 75%, triggering the full vesting of outstanding equity awards. Assuming such a Change in Control, these amounts would become payable, regardless of whether the named executive officer experienced a termination of employment. For Ms. Polmanteer, amount also includes vesting of her employer contributions in the deferred compensation plan. |
(7) | The payments and benefits to which Mr. Govers would be entitled in the event of certain termination from employment events is governed by Belgian laws and described separately below. |
With respect to the Retention Bonuses, in the event the named executive officer’s employment is terminated following the First Vesting Date but prior to the Second Vesting Date (i) by the Company without Cause, (ii) due to the executive’s
142
death or (iii) by the executive for Good Reason, the executive will receive that portion of the Retention Bonus not previously paid to him or her in a lump sum in cash within 30 days following the executive’s termination of employment. For purposes of the amounts included in the table and narrative disclosure above and below regarding certain payments and benefits that our named executive officers would become entitled to upon certain termination events or in connection with a Change in Control, the remaining amounts of the Retention Bonuses were not included.
Pursuant to applicable Belgian law, Mr. Govers is entitled to certain payments and benefits upon certain termination events, as described and quantified below, in each case assuming a termination date of December 31, 2017. Upon all termination events, Mr. Govers would be entitled to payment of accrued benefits (the “Govers Accrued Benefits”). In accordance with applicable Belgian laws, the additional amounts Mr. Govers would be entitled to receive upon various types of termination are based upon his tenure with the Company and the actual compensation received during the 12 months preceding his termination (calculated on a per week basis, the “Govers Weekly Severance”). Upon a termination by the Company without Cause, he would be entitled to, in addition to the Govers Accrued Benefits, 10 weeks’ notice (or payment equal to 10 times the Govers Weekly Severance in a lump sum in lieu thereof) equaling $290,591; or if the Company elects to enforce his noncompetition covenant, he would be entitled to a lump sum payment equal to 39 times the Govers Weekly Severance for a total payment (including the 10 weeks’ notice amount) of $1,423,896; provided, further, that, if a Belgian labor court finds that termination of the employment contract was not sufficiently motivated or unfair, the executive may additionally be entitled to up to a maximum lump sum payment equal to 17 times the Govers Weekly Severance. Upon a termination by Mr. Govers without Cause, he would be required to provide the Company five weeks’ notice. In the event that Mr. Govers is terminated by the Company without Cause on a date subsequent to a Change in Control, the Govers Weekly Severance calculation may include additional one-time exceptional amounts received by Mr. Govers in connection with such Change in Control (including potentially the accelerated vesting of some/or all of his then outstanding equity awards and/or payment of any remaining portion of his Retention Bonus), and the resulting severance payments that may become payable to Mr. Govers (calculated in accordance with the formulas set forth above) may be higher than the amounts payable absent such Change in Control. Based upon present Belgian laws, if Mr. Govers was terminated on January 1, 2018 following a Change in Control that occurred on December 31, 2017, the Govers Weekly Severance amount could increase such that Mr. Govers would be entitled to a total lump sum payment equal to $482,514 (equal to the 10 weeks’ notice amount); or if the Company elects to enforce his noncompetition covenant, the lump sum payment could increase to $2,364,319 (equal to 39 times the increased Govers weekly severance amount and including the 10 weeks’ notice amount). (To convert values to US$, the average annual conversion rate used by the Company (equaling 1.12989 US$ to 1€ for 2017), was applied to each payment.) Assuming a Change in Control, Mr Govers’ equity grants would become payable, regardless of whether Mr. Govers experienced a termination of employment. The amount attributed to this event at December 31, 2017, assuming a value of $17.00 per share of our common stock, was $748,000.
Compensation Committee Report
The Compensation Committee has reviewed and discussed the above Compensation Discussion and Analysis. Based on its review and discussion with management, the Compensation Committee recommended to our Board of Directors that the Compensation Discussion and Analysis be included in the Company’s Annual Report on Form 10-K for 2017.
Brian Laibow
Matthew Michelini
Lawrence W. Stranghoener
G. Richard Wagoner, Jr.
Compensation Committee Interlocks and Insider Participation
Other than Mr. Stack, none of our directors have ever been one of our officers or employees. Following the establishment of our Compensation Committee, Messrs. Laibow, Michelini, Stranghoener and Wagoner serve as the members of our Compensation Committee. During 2017, none of our executive officers served as a member of the board of directors or compensation committee of an entity that has an executive officer serving as a member of our Compensation Committee, and none of our executive officers served as the member of the compensation committee of an entity that has an executive officer serving as a director on our Board.
Director compensation
On January 15, 2014, the Board of Directors set, effective as of January 1, 2014, the annual cash retainer at $90,000 for each director, payable in calendar quarterly installments, and also set, effective as of January 1, 2014, Mr. Lawrence W. Stranghoener’s additional cash payment for his service as Chair of our Audit Committee at $18,750, payable in calendar quarterly installments. These amounts were set to more closely align our director compensation program with competitive market practice.
143
On December 12, 2017, each non-executive member of the Board of Directors (except Mr. Michelini) received an award of 5,294 RSUs which became vested as to 100% on January 1, 2018.
For each of the directors appointed by the Oaktree Funds (the “Oaktree Directors”), all cash and non-cash compensation paid to each Oaktree Director with respect to their service as one of our directors is turned over to an Oaktree affiliate pursuant to an agreement between the Oaktree Funds and the Oaktree Director as part of his or her employment with the Oaktree Funds.
Director compensation for fiscal year 2017
The following table sets forth a summary of compensation with respect to our non-executive directors’ service on our Board of Directors and the Board of Directors of Aleris International for the year ended December 31, 2017.
Name | Fees earned or paid in cash ($) | Stock awards ($) | Total ($) | ||||||
Brook Hinchman (1) | 90,000 | 89,998 | 179,998 | ||||||
Brian Laibow (1) | 90,000 | 89,998 | 179,998 | ||||||
Matthew R. Michelini (2) | — | — | — | ||||||
Donald T. Misheff (3) | 90,000 | 89,998 | 179,998 | ||||||
Robert O’Leary (1) | 90,000 | 89,998 | 179,998 | ||||||
Emily Stephens (1) | 90,000 | 89,998 | 179,998 | ||||||
Lawrence W. Stranghoener (4) | 108,750 | 89,998 | 198,748 | ||||||
Kaj Vazales (1)(5) | 90,000 | 89,998 | 179,998 | ||||||
G. Richard Wagoner, Jr. (5) | 90,000 | 89,998 | 179,998 | ||||||
(1) | Messrs. Brook Hinchman, Brian Laibow, Robert O’Leary and Kaj Vazales and Ms.Emily Stephens were appointed to the Board of Directors by the Oaktree Funds. All remuneration paid to the Oaktree Directors is turned over to an affiliate of Oaktree and is not kept by the individual. Messrs. Hinchman, Laibow, O’Leary and Vazales and Ms.Stephens were granted equity awards. As such, as of December 31, 2017, each of Messrs. Hinchman, Laibow, O’Leary, Vazales and Ms. Stephens (a) held 0 shares of Aleris Corporation common stock; (b) had 5,294 unvested RSUs (which vested on January 1, 2018); and (c) held 0, 21,291, 37,263, 0 and 26,616, respectively, outstanding stock option awards, all of which were vested. |
(2) | Mr. Matthew R. Michelini is a partner of the Apollo Funds but has not been appointed to our Board by the Apollo Funds, and he has advised the Corporation that he waives all cash and non-cash compensation (including equity awards) with respect to his service as one of our directors. On December 31, 2017, Mr. Michelini held 0 shares of Aleris Corporation common stock. |
(3) | On December 31, 2017, Mr. Donald T. Misheff held 10,902 shares of Aleris Corporation common stock and 5,294 unvested RSUs (which vested on January 1, 2018). |
(4) | On December 31, 2017, Mr. Lawrence W. Stranghoener held 13,902 shares of Aleris Corporation common stock, 5,294 unvested RSUs (which vested on January 1, 2018) and 26,616 outstanding stock option awards all of which were vested. |
(5) | On December 31, 2017, Mr. G. Richard Wagoner held 30,902 shares of Aleris Corporation common stock and 5,294 unvested RSUs (which vested on January 1, 2018). |
With respect to all of the equity awards, the following terms generally apply:
▪ | Generally directors do not have any rights with respect to the shares underlying their RSUs, until each RSU becomes vested and the director is issued a share of common stock in settlement of the RSU; however, the RSUs granted to the directors include a dividend equivalent right, pursuant to which the director is entitled to receive, for each RSU, a payment equal in amount to any dividend or distribution made with respect to a share of our common stock, at the same time the dividend or distribution is made to our stockholders. |
▪ | The RSUs will be settled through the issuance of shares of our common stock equal to the number of RSUs that have vested. |
▪ | If the stockholders of the Company do not re-elect or reappoint a director to our Board of Directors and the Board of Directors of Aleris International prior to the end of the applicable vesting period, all restrictions will lapse with respect to restricted stock and all RSUs will vest. If board service ceases for any other reason, all unvested restricted shares or RSUs are forfeited. |
▪ | In the event of, among other events, an extraordinary distribution, stock dividend, recapitalization, stock split, reorganization, merger, spin-off or other similar transaction, the Board of Directors shall make appropriate and equitable adjustments to the number, exercise price, class and kind of shares or other consideration underlying awards that have been granted under the Equity Incentive Plan, including the stock options and restricted stock awarded to directors. |
144
▪ | All outside director stock options are 100% vested. They will terminate as follows: (1) if the stockholders of the Company do not re-elect or reappoint the director to the Board of Directors of the Company and Aleris International or the director is removed from service on the Board of Directors of the Company and Aleris International, the stock option will terminate six months after service ends; (2) if the board service ends due to death, the stock option will terminate 12 months after the date of death; and (3) if board service ends for any other reason, the stock option will terminate 90 days after service ends. |
▪ | After service ends, the Company has the right, but not the obligation, to purchase any shares acquired by the director upon lapsing of restrictions on restricted stock or RSUs or exercise of the stock options. The call right may be exercised, in whole or in part, from time to time and the individual will be paid the fair market value of the shares on the call settlement date. |
If a director is serving on the Board of Directors of the Company at the time of a Change of Control, his or her then restricted shares, RSUs or stock options will vest to the extent necessary to make the cumulative percentage of the award granted that has become vested as of such Change of Control at least equal to the percentage by which the Oaktree Funds have reduced their combined common stock interest in the Company. If the Oaktree Funds’ combined common stock interest in the Company is reduced by 75% or more, then all stock options and the RSUs will fully vest. The applicable percentage will be measured by comparing the number of shares acquired by the Oaktree Funds on June 1, 2010 and still held by them immediately following the Change of Control to the number of shares of our common stock that they held as of June 1, 2010 (to be adjusted for stock splits, stock dividends, and similar events).
CEO Pay Ratio
Under the Dodd-Frank Wall Street Reform and Consumer Protection Act, we are required to disclose the median of the annual total compensation of our employees, the annual total compensation of our Chief Executive Officer, and the ratio of these two amounts.
Using the methodology described below, and calculated in accordance to Item 402(u) of Regulation S-K, the total compensation for our CEO in 2017 was approximately 171 times the total compensation of a reasonable estimate of the total compensation of our median permanent employee.
We identified the median employee by examining the 2017 base pay (including generally base salary, salary-replacement compensation and cash compensation) for all individuals, excluding our CEO. We did not include equity grants in this analysis as they are made to a small portion of our employees. Our calculation includes all permanent employees as of October 31, 2017 who were not excluded by the de minimis exception permitting non-U.S. employees to be excluded, by jurisdiction, if, in the aggregated the employees in such jurisdictions comprise less than 5% of the Company’s workforce. The total number of employees in the jurisdictions identified in the table below are less than 5% of the total workforce of 5,475 employees and have been excluded from the analysis, while the employees in four jurisdictions have been included in the analysis.
145
Location | Total Employees | % of Total | ||
Excluded due to De Minimis exemption | ||||
Switzerland | 6 | .10% | ||
Italy | 4 | .07% | ||
France | 3 | .05% | ||
Japan | 3 | .05% | ||
Netherlands | 2 | .03% | ||
United Kingdom | 2 | .03% | ||
Denmark | 1 | .01% | ||
Malaysia | 1 | .01% | ||
Poland | 1 | .01% | ||
Singapore | 1 | .01% | ||
Subtotal | 24 | .44% | ||
Included in basis for identification of Median Employee | ||||
USA | 2,432 | 44.42% | ||
Germany | 1,521 | 27.78% | ||
Belgium | 968 | 17.68% | ||
China | 530 | 9.68% | ||
Subtotal | 5,451 | 99.56% | ||
Grand Total | 5,475 | 100.00% | ||
As a result, 5,451 employees from the U.S., Belgium, China, and Germany were analyzed. To identify the median employee, we considered in our analysis the 2017 base pay of all 5,361 active employees (excluding 90 employees who were either inactive, suspended, on leave or new hires who have not yet received compensation) in these countries as of October 31, 2017. The base pay information from the Company’s payroll records was annualized for any full-time employees that were hired after January 1, 2017. For purposes of the median employee calculation, a Euro to U.S. dollar and Yuan Renminbi to U.S. dollar exchange rate was applied for those paid in local currency.
After identifying the estimated median employee using base pay, we calculated annual total compensation for such employee using the same methodology we use for our named executive officers as set forth in the Summary Compensation Table in this annual report on Form 10-K. The median employee is identified as a salaried employee who works at our headquarters in Cleveland, Ohio.
Total compensation for the CEO was approximately $11,065,966 and the reasonably estimated total compensation of the median employee was $64,608. Our 2017 CEO to median employee estimated pay ratio is 171:1.
We believe the pay ratio provides a reasonable estimate of the required information calculated in manner consistent with Item 402(u) of Regulation S-K. The SEC rules for identifying the median employee and calculating that employee’s annual total compensation allows companies to make reasonable assumptions and estimates, and to apply a variety of methodologies and exclusions that reflect their compensation practices. Pursuant to Item 402(u) of Regulation S-K, the above calculation of total compensation for the CEO takes into account compensation elements that, under the SEC’s rules, must be included in the Summary Compensation Table for 2017 but were, in part, due to unusual events and therefore may not be reflective of the CEO’s annual compensation package for a typical year. These elements include one-half of a special retention award paid in November 2017 following the termination of the Merger Agreement and the full grant date fair value of a long-term equity award that was intended by the Board to be a multi-year grant (since the Company grants equity on a periodic basis rather than on an annual basis). If these items are “normalized” such that the CEO’s compensation does not include the one-time retention award payment and the grant date fair value of what might be considered one-year’s portion of the long-term equity grant (i.e., an option to purchase 154,550 shares with a grant date fair value of $1,202,399 and an RSU grant in respect of 77,275 shares and a grant date fair value of $1,313,675), the CEO’s compensation is $4,908,818. Using this “normalized” calculation for 2017, an alternate ratio of the CEO’s compensation to median employee’s compensation 76:1.
This information is being provided for compliance purposes. Neither the Compensation Committee nor management of the company used the pay ratio measure in making compensation decisions. In light of the various assumptions, estimates, methodologies and exclusions that may be used in accordance with the pay ratio disclosure rules, the pay ratio reported by other companies may not be comparable to the pay ratio, or the alternate pay ratio calculation, reported above, as other companies may have different compensation practices, and may utilize different assumptions, estimates, methodologies and exclusions in calculating their own pay ratios.
146
Equity Incentive Plan
Number of securities to be issued upon exercise of outstanding options, warrants and rights | Weighted-average exercise price of outstanding options, warrants and rights | Number of securities remaining available for future issuance under equity compensation plans (excluding securities reflected in column (a)) | |||||
Plan Category | (a) | (c) | |||||
Equity compensation plans approved by security holders | |||||||
Equity compensation plans not approved by security holders (1) (2) | 4,092,632 | (3) | 20.92 | (4) | 299,209 | ||
Total | 4,092,632 | 20.92 | (4) | 299,209 | |||
(1) | Represents Aleris Corporation’s 2010 Equity Incentive Plan, as amended from time to time. |
(2) | The number of shares of common stock of Aleris Corporation authorized under the 2010 Equity Incentive Plan was 5,328,875 as of December 31, 2017. |
(3) | Includes 3,494,974 outstanding stock options and 597,658 unvested RSUs granted under Aleris Corporation’s 2010 Equity Incentive Plan. |
(4) | Weighted average exercise price is based on 3,494,974 outstanding stock options. Calculation excludes RSUs. |
The Equity Incentive Plan was established to attract, retain, incentivize and motivate officers and employees of, and non-employee directors providing services to the Company and its subsidiaries and affiliates and to promote the success of the Company by providing such participating individuals with a proprietary interest in the performance of the Company. As of December 31, 2017, awards of stock options, restricted stock and RSUs have been granted in respect of Aleris Corporation common stock.
Administration. The Equity Incentive Plan is administered by the Board of Directors or, at its election, by a committee (currently the Compensation Committee). Subject to the express limitations of the Equity Incentive Plan, the committee has the authority to determine (i) which employees, consultants or directors of the Company, its subsidiaries and affiliates may be granted awards, (ii) the timing of granting awards, (iii) the number of shares subject to each award, (iv) the vesting schedule of the award and (v) any other terms and conditions of the award (which may vary among participants and awards). The committee is also authorized to interpret the Equity Incentive Plan, to establish, amend and rescind any rules and regulations relating to the Equity Incentive Plan, and to make any other determinations it deems necessary or desirable for the administration of the Equity Incentive Plan. Any decision of the committee in the interpretation or administration of the Equity Incentive Plan is made in the sole and absolute discretion of the committee and shall be, if made reasonably and in good faith, final, conclusive and binding.
Stock Subject to the Plan. As of December 31, 2017, the maximum number of shares of Aleris Corporation’s common stock issuable in connection with all types of awards under the Equity Incentive Plan, including any grants made to employees outside of the United States, was 5,328,875, and of that amount, grants of RSUs were limited to 1,367,979 shares.
Option Grants. Stock options granted under the Equity Incentive Plan are non-qualified stock options subject to the terms and conditions determined by the committee and set forth in the applicable stock option agreement. All stock options outstanding as of December 31, 2017 were granted with an exercise price equal to either the fair market value of a share of Aleris Corporation common stock on the date of grant, or a “premium” or “super premium” exercise price (equal to 1.5 times or 2 times, respectively, the fair market value of a share of Aleris Corporation common stock on the date of grant). Stock options granted have a variety of vesting schedules (e.g., quarterly, annually, cliff and ratable vesting) over a period not to exceed four years with adjustments to the standard vesting installments to reflect actual hire and/or promotion dates as of the date of grant.
Restricted Stock Unit Awards. RSUs awarded under the Equity Incentive Plan consist of a grant by the Company of a specified number of units, which on the date of grant each represent one hypothetical share of Aleris Corporation common stock credited to an account of the award recipient, with no actual shares of Aleris Corporation common stock being issued until the RSU award has vested and are settled or the RSUs are otherwise settled in accordance with the RSU Agreement. All RSUs outstanding have a variety of vesting schedules (e.g., quarterly, annually, cliff and ratable vesting) over a period not to exceed four years with adjustments to the standard vesting installments to reflect actual hire and/or promotion dates as of the date of grant.
Non-Transferability of Awards. Awards, including stock options and RSUs, granted under the Equity Incentive Plan may not be transferred or assigned, other than by will or the laws of descent and distribution, unless the committee determines otherwise.
Adjustment of Shares and Change of Control. In the event of, among other events, an extraordinary distribution, stock dividend, recapitalization, stock split, reorganization, merger, spin-off, or other similar transaction, the number and kind of shares, in the aggregate, reserved for issuance under the Equity Incentive Plan will be adjusted to reflect the event. In
147
addition, the committee may make adjustments to the number, exercise price, class, and kind of shares or other consideration underlying the awards. In the event of a Change of Control (as defined in the Equity Incentive Plan), unless otherwise prohibited under applicable law or unless specified in an award agreement, the committee is authorized, but not obligated, with respect to any or all awards, to make adjustments in the terms and conditions of outstanding awards, including, but not limited to, causing the awards, as part of the Change of Control triggering event, to be continued, substituted, or canceled for a cash payment (or a payment in the same form that other stockholders are receiving in the Change of Control triggering event). In the event the awards are canceled, the payment would be equal to (i) for RSUs, the fair market value of the shares underlying the RSUs being canceled and (ii) for stock options, the excess, if any, between the fair market value of the shares underlying the stock options over the exercise price of the stock options being canceled. The committee may also accelerate the vesting of outstanding stock options or RSUs or adjust the expiration of any outstanding stock options. With respect to all outstanding awards, in the event that the Company is involved in a Change of Control, a portion of an award holder’s awards that remains unvested at such time will become vested and/or exercisable based on a formula that, after it is applied at the time of the Change of Control event, results in the percentage of the holder’s cumulative awards that are vested and/or exercisable equaling the percentage by which the Initial Investors (as defined in the Equity Incentive Plan) reduced their collective ownership in the Company as part of the Change of Control (as defined in the Equity Incentive Plan and generally described below). If the Initial Investors collectively reduce their ownership in the Company by 75% or more, then any unvested awards will vest, and/or become exercisable, in full.
Clawback. Subject to the terms of an award agreement that may provide otherwise, the Company may cancel any stock options or RSUs, or require that the participant repay to the Company any gain that may have been realized when the stock options were exercised or when the RSUs were settled in the event that the participant violates any non-competition, non-solicitation or non-disclosure covenant or agreement that applies to such participant or if the participant engages in fraud or other misconduct that contributes materially to any financial restatement or material loss.
Amendments or Termination. The Board of Directors may amend, modify, alter, suspend, discontinue or terminate the Equity Incentive Plan or any portion of the Equity Incentive Plan or any award, including a stock option or RSU, at any time, subject to any applicable stockholder approval requirements. However, no such action by the Board of Directors may be made without the consent of a participant if such action would materially diminish any of the rights of such participant under any award granted to such participant under the Equity Incentive Plan, unless an amendment is required to comply with applicable laws, in which case the committee may amend the Equity Incentive Plan or any award agreement.
ITEM 12. SECURITY OWNERSHIP OF CERTAIN BENEFICIAL OWNERS AND MANAGEMENT AND RELATED STOCKHOLDER MATTERS.
The following table sets forth information as to the beneficial ownership of our common stock as of February 15, 2018 by (1) each person or group who is known to us to own beneficially more than 5% of the outstanding shares of our common stock; (2) each director and named executive officer; and (3) all directors and executive officers as a group.
Percentage of class beneficially owned is based on 32,219,528 shares of common stock outstanding as of February 15, 2018, together with the applicable options (1) to purchase shares of common stock for each stockholder exercisable on February 15, 2018 or within 60 days thereafter and the number of shares issuable upon the vesting of restricted stock units held by the stockholder that is scheduled to occur within 60 days of February 15, 2018 and (2) the number of shares issuable upon exchange of Aleris International’s 6% senior subordinated exchangeable notes into shares of Aleris corporation common stock. Shares of common stock issuable upon the exercise of options currently exercisable or exercisable 60 days after February 15, 2018, upon the vesting of restricted stock units within 60 days after February 15, 2018 and upon exchange of Aleris International’s 6% senior subordinated exchangeable notes into shares of Aleris Corporation common stock are deemed outstanding for computing the percentage ownership of the person holding the options, restricted stock units, or exchangeable notes, as the case may be, but are not deemed outstanding for computing the percentage of any other person. The amounts and percentages of common stock beneficially owned are reported on the basis of regulations of the SEC governing the determination of beneficial ownership of securities. Under the rules of the SEC, a person is deemed to be a “beneficial owner” of a security if that person has or shares “voting power,” which includes the power to vote or to direct the voting of such security, or “investment power,” which includes the power to dispose of or to direct the disposition of such security. A person is also deemed to be a beneficial owner of any securities of which that person has a right to acquire beneficial ownership within 60 days. Under these rules, more than one person may be deemed to be a beneficial owner of such securities as to which such person has voting or investment power. Except as described in the footnotes below, to our knowledge, each of the persons named in the table below have sole voting and investment power with respect to the shares of common stock owned, subject to community property laws where applicable.
148
Name and Address of Owner (1) | Direct or Indirect Ownership | Securities That Can Be Acquired By Holder (2) | Total | Percent of Class | ||||||||||
Oaktree Funds (3)(4) | 18,216,988 | 1,748,938 | 19,965,926 | 58.8% | ||||||||||
Apollo Funds (3)(5) | 5,553,946 | 510,016 | 6,063,962 | 18.5% | ||||||||||
Bain Capital Credit Funds (3)(6) | 2,904,773 | 261,946 | 3,166,719 | 9.7% | ||||||||||
Caspian Funds (3)(7) | 2,560,889 | 136,358 | 2,697,247 | 8.3% | ||||||||||
Sean M. Stack | 92,113 | 660,328 | 752,441 | 2.3% | ||||||||||
Christopher R. Clegg | 34,117 | 278,188 | 312,305 | * | ||||||||||
Eric M. Rychel | 35,950 | 142,054 | 188,004 | * | ||||||||||
Michael T. Keown | 20,866 | 91,481 | 112,347 | * | ||||||||||
Jacobus A.J. Govers | 19,124 | 44,000 | 63,124 | * | ||||||||||
Lawrence Stranghoener | 19,196 | 26,616 | 45,812 | * | ||||||||||
G. Richard Wagoner | 36,196 | — | 36,196 | * | ||||||||||
Tamara S. Polmanteer | 7,771 | 22,000 | 29,771 | * | ||||||||||
Donald T. Misheff | 16,196 | — | 16,196 | * | ||||||||||
Brook Hinchman (8) | — | — | — | * | ||||||||||
Brian Laibow (8) | — | — | — | * | ||||||||||
Matthew R. Michelini | — | — | — | * | ||||||||||
Robert O’Leary (8) | — | — | — | * | ||||||||||
Emily Stephens (8) | — | — | — | * | ||||||||||
Kaj Vazales (8) | — | — | — | * | ||||||||||
All current executive officers and directors as a group (15 persons) | 281,529 | 1,264,666 | 1,556,195 | 4.6% | ||||||||||
* Less than 1%
(1) | Unless otherwise indicated, the address of each person listed is c/o Aleris Corporation, 25825 Science Park Drive, Suite 400, Cleveland, Ohio 44122-7392. |
(2) | Represents the number of shares of common stock issuable upon the exercise of options currently exercisable or exercisable 60 days after February 15, 2018, upon the vesting of restricted stock units within 60 days after February 15, 2018, and upon exchange of Aleris International’s 6% senior subordinated exchangeable notes into shares of Aleris Corporation common stock. |
(3) | Aleris Corporation and each of its stockholders is a party to the stockholders agreement discussed in Item 13. - “Certain Relationships and Related Party Transactions-Stockholders Agreement.” Aleris Corporation and the Oaktree Funds, the Apollo Funds, the Bain Capital Credit Funds, the Caspian Funds and holders of at least 5% of outstanding Aleris Corporation common stock are each a party to the Registration Rights Agreement discussed in Item 13 - “Certain relationships and related party transactions-Registration rights agreement.” |
(4) | Represents all equity interests owned by OCM Opportunities ALS Holdings, L.P., OCM High Yield Plus ALS Holdings, L.P., Oaktree European Credit Opportunities Holdings, Ltd., and OCM FIE, LLC. Of the shares included, 16,848,918 are held by OCM Opportunities ALS Holdings, L.P.; 999,065 are held by OCM High Yield Plus ALS Holdings, L.P.; 270,336 are held by Oaktree European Credit Opportunities Holdings, Ltd.; and 98,669 are held by OCM FIE, LLC, which includes 85,170 shares which may be acquired upon exercise of options that are vested. In addition the Oaktree Funds hold $27,901,538 aggregate principal amount of Aleris International’s 6% senior subordinated exchangeable notes (convertible into 1,663,768 shares of Aleris Corporation common stock). Since June 1, 2013, Aleris International’s 6% senior subordinated exchangeable notes are exchangeable for shares of Aleris Corporation common stock at any time at the holder’s option. Therefore, the shares reported as beneficially owned in the above table include the number of shares of common stock issuable to Nominees of the Oaktree Funds upon exchange of Aleris International’s 6% senior subordinated exchangeable notes. The mailing address for the owners listed above is 333 S. Grand Avenue, 28th Floor, Los Angeles, CA 90071. |
The general partner of OCM Opportunities ALS Holdings, L.P. and OCM Opportunities ALS Holdings, L.P. is Oaktree Fund GP, LLC. The managing member of Oaktree Fund GP, LLC is Oaktree Fund GP I, L.P. The general partner of Oaktree Fund GP I, L.P. is Oaktree Capital I, L.P. The general partner of Oaktree Capital I, L.P. is OCM Holdings I, LLC. The managing member of OCM Holdings I, LLC is Oaktree Holdings, LLC. The managing member of Oaktree Holdings, LLC is Oaktree Capital Group, LLC. The duly elected manager of Oaktree Capital Group, LLC is Oaktree Capital Group Holdings GP, LLC. The members of Oaktree Capital Group Holdings GP, LLC are Howard Marks, Bruce Karsh, Jay Wintrob, John Frank and Sheldon Stone who, by virtue of their membership interests in Oaktree Capital Group Holdings GP, LLC may be deemed to share voting and dispositive
149
power with respect to the shares of common stock held by OCM Opportunities ALS Holdings, L.P. Each of the general partners, managing members, unit holders and members described above disclaims beneficial ownership of any shares of common stock beneficially or of record owned by OCM Opportunities ALS Holdings, L.P., except to the extent of any pecuniary interest therein. The address for all of the entities and individuals identified above is 333 S. Grand Avenue, 28th Floor, Los Angeles, CA 90071.
The general partner of OCM High Yield Plus ALS Holdings, L.P. is Oaktree Fund GP IIA, LLC. The managing member of Oaktree Fund GP IIA, LLC is Oaktree Fund GP II, L.P. The general partner of Oaktree Fund GP II, L.P. is Oaktree Capital II, L.P. The general partner of Oaktree Capital II, L.P. is Oaktree Holdings, Inc. The sole shareholder of Oaktree Holdings, Inc. is Oaktree Capital Group, LLC. The duly elected manager of Oaktree Capital Group, LLC is Oaktree Capital Group Holdings GP, LLC. The members of Oaktree Capital Group Holdings GP, LLC are Howard Marks, Bruce Karsh, Jay Wintrob, John Frank and Sheldon Stone who, by virtue of their membership interests in Oaktree Capital Group Holdings GP, LLC may be deemed to share voting and dispositive power with respect to the shares of common stock held by OCM High Yield Plus ALS Holdings, L.P. Each of the general partners, managing members, unit holders and members described above disclaims beneficial ownership of any shares of common stock beneficially or of record owned by OCM High Yield Plus ALS Holdings, L.P., except to the extent of any pecuniary interest therein. The address for all of the entities and individuals identified above is 333 S. Grand Avenue, 28th Floor, Los Angeles, CA 90071.
The director of Oaktree European Credit Opportunities Holdings, Ltd. is Oaktree Europe GP, Ltd. Oaktree Europe GP, Ltd. is also the general partner of Oaktree Capital Management (UK) LLP, which is the portfolio manager to Oaktree European Credit Opportunities II, Ltd. The sole shareholder of Oaktree Europe GP, Ltd. is Oaktree Capital Management (Cayman), L.P. The general partner of Oaktree Capital Management (Cayman), L.P. is Oaktree Holdings, Ltd. The sole shareholder of Oaktree Holdings, Ltd. is Oaktree Capital Group, LLC. The duly elected manager of Oaktree Capital Group, LLC is Oaktree Capital Group Holdings GP, LLC. The members of Oaktree Capital Group Holdings GP, LLC are Howard Marks, Bruce Karsh, Jay Wintrob, John Frank, and Sheldon Stone, who, by virtue of their membership interests in Oaktree Capital Group Holdings GP, LLC may be deemed to share voting and dispositive power with respect to the shares of common stock held by Oaktree European Credit Opportunities Holdings, Ltd. Each of the directors, general partners, managers, shareholders, unit holders and members described above disclaims beneficial ownership of any shares of common stock beneficially or of record owned by each of Oaktree European Credit Opportunities Holdings, Ltd., except to the extent of any pecuniary interest therein. The address for Oaktree Capital Management (UK) LLP is 27 Knightsbridge, 4th Floor, London SW1X 7LY, United Kingdom, and the address for all other entities and individuals identified above is 333 S. Grand Avenue, 28th Floor, Los Angeles, CA 90071.
The managing member of OCM FIE, LLC is Oaktree Capital Management, L.P. The general partner of Oaktree Capital Management, L.P. is Oaktree Holdings, Inc. The sole shareholder of Oaktree Holdings, Inc. is Oaktree Capital Group, LLC. The duly elected manager of Oaktree Capital Group, LLC is Oaktree Group Holdings GP, LLC. The members of Oaktree Capital Group Holdings GP, LLC are Howard Marks, Bruce Karsh, Jay Wintrob, John Frank and Sheldon Stone, who, by virtue of their membership interests in Oaktree Capital Group Holdings GP, LLC may be deemed to share voting and dispositive power with respect to the shares of common stock held by OCM FIE, LLC. Each of the general partners, managing members, shareholders, unit holders and members described above disclaims beneficial ownership of any shares of common stock beneficially or of record owned by OCM FIE, LLC except to the extent of any pecuniary interest therein. The address for all of the entities and individuals identified above is 333 S. Grand Avenue, 28th Floor, Los Angeles, CA 90071.
(5) | Represents 5,553,946 shares of common stock held of record by Apollo ALS Holdings II, L.P. (“Apollo ALS Holdings”). Since June 1, 2013, Aleris International’s 6% senior subordinated exchangeable notes are exchangeable for shares of Aleris Corporation common stock at any time at the holder’s option. Therefore, the shares reported as beneficially owned by the Apollo Funds in the above table include 510,016 shares of common stock issuable upon exchange of the $8,553,015 aggregate principal amount of Aleris International’s 6% senior subordinated exchangeable notes that are held by Apollo ALS Holdings. |
The general partner of Apollo ALS Holdings is Apollo ALS Holdings II GP, LLC (“Apollo ALS Holdings GP”). The managers of Apollo ALS Holdings GP are Apollo Management VI, L.P. (“Management VI”), Apollo Management VII, L.P. (“Management VII”) and Apollo Credit Opportunity Management, LLC (“ACO Management”). AIF VI Management, LLC (“AIF VI Management”) is the general partner of Management VI, and AIF VII Management, LLC (“AIF VII Management”) is the general partner of Management VII. Apollo Management, L.P. (“Apollo Management”) is the sole member and manager of each of AIF VI Management and AIF VII Management. Apollo Management GP, LLC (“Management GP”) is the general partner of Apollo Management. Apollo Capital Management, L.P. (“Capital Management”) is the sole member and manager of ACO Management, and Apollo Capital Management GP, LLC (“Capital Management GP”) is the general partner of Capital Management. Apollo Management Holdings, L.P. (“Management Holdings”) is the sole member and manager of Management GP and of Capital Management GP. Apollo Management Holdings GP, LLC (“Management Holdings GP”) is the general partner of Management Holdings. Leon Black, Joshua Harris and Marc Rowan are the managers, as well as executive officers, of Management Holdings GP, and as such may be deemed to have voting and dispositive control of the shares of common stock held by Apollo ALS Holdings. The address of Apollo ALS Holdings and Apollo ALS Holdings GP is One Manhattanville Road, Suite 201, Purchase, New York 10577. The address of each of Management VI, Management VII, ACO Management, AIF VI Management, AIF VII Management, Apollo Management, Management GP, Capital Management, Capital Management GP, Management Holdings and Management Holdings GP, and Messrs. Black, Harris and Rowan, is 9 West 57th Street, 43rd Floor, New York, New York 10019.
150
(6) | Represents all equity interests of 111 Capital Grantor Trust, Nash Point CLO, Prospect Harbor Designated Investments, L.P., Sankaty Beacon Investment Partners, L.P., Race Point II CLO, Limited, Race Point III CLO Limited, Race Point IV CLO, Ltd., Sankaty Credit Opportunities (Offshore Master) IV, L.P., Sankaty Credit Opportunities II, L.P., Sankaty Credit Opportunities III, L.P., Sankaty Credit Opportunities IV, L.P., Sankaty Special Situations I Grantor Trust, Sankaty Credit Opportunities Grantor Trust, Sankaty High Yield Partners II Grantor Trust, Sankaty High Yield Partners III Grantor Trust and SR Group, LLC (collectively, the “Bain Capital Credit Funds”). The mailing address of the Bain Capital Credit Funds is c/o Bain Capital Credit, LP, 200 Clarendon Street, Boston, MA 02116. |
In addition, the Bain Capital Credit Funds hold $4,392,855 aggregate principal amount of Aleris International’s 6% senior subordinated exchangeable notes (convertible into 261,946 shares of Aleris Corporation common stock). Since June 1, 2013, Aleris International’s 6% senior subordinated exchangeable notes are exchangeable for shares of Aleris Corporation common stock at any time at the holder’s option. Therefore, the shares reported as beneficially owned in the above table include the number of shares of common stock issuable to the Bain Capital Credit Funds upon exchange of Aleris International’s 6% senior subordinated exchangeable notes.
Bain Capital Credit, LP, a Delaware limited partnership (“Bain Capital Credit”), is the collateral manager to Nash Point CLO, an Irish public unlimited company (“NP”), Race Point II CLO, Limited, a Cayman Islands exempted company (“RP II”), Race Point III CLO Limited, an Irish public unlimited company (“RP III”), and Race Point IV CLO, Ltd., a Cayman Islands exempted company (“RP IV”). By virtue of these relationships, Bain Capital Credit may be deemed to have voting and dispositive power with respect to the shares of common stock held by each of NP, RP II, RP III, and RP IV. Bain Capital Credit disclaims beneficial ownership of such securities except to the extent of its pecuniary interest therein.
111 Capital Investors, LLC, a Delaware limited liability company (“111 Capital Investors”), is the trustee of 111 Capital Grantor Trust (“111”). Sankaty Credit Opportunities Investors, LLC, a Delaware limited liability company (“SCOI”), is the trustee of Sankaty Credit Opportunities Grantor Trust (“COPs”). Sankaty Credit Opportunities Investors II, LLC, a Delaware limited liability company (“SCOI II”), is the sole general partner of Sankaty Credit Opportunities II, L.P., a Delaware limited partnership (“COPs II”). Sankaty Credit Opportunities Investors III, LLC, a Delaware limited liability company (“SCOI III”), is the sole general partner of Sankaty Credit Opportunities III, L.P., a Delaware limited partnership (“COPs III”). Sankaty Credit Opportunities Investors IV, LLC, a Delaware limited liability company (“SCOI IV”), is the sole general partner of Sankaty Credit Opportunities IV, L.P., a Delaware limited partnership (“COPs IV”). Sankaty Beacon Investors, LLC, a Delaware limited liability company (“Beacon Investors”) is the sole general partner of Prospect Harbor Designated Investments, L.P. (“Prospect Harbor”) and Sankaty Beacon Investment Partners, L.P. (“Beacon”). Sankaty Special Situations Investors I, LLC, a Delaware limited liability company (“SSS I Investors”), is the trustee of Sankaty Special Situations I Grantor Trust (“SSS I”). Bain Capital Credit Member, LLC, a Delaware limited liability company (“BCCM”), is the managing member of 111 Capital Investors, SCOI, SCOI II, SCOI III, SCOI IV, Beacon Investors and SSS I Investors. By virtue of these relationships, BCCM may be deemed to share voting and dispositive power with respect to the shares of common stock held by 111, COPs, COPs II, COPs III, COPs IV, Prospect Harbor, Beacon and SSS I. BCCM and each of the entities noted above disclaim beneficial ownership of such securities except to the extent of its pecuniary interest therein.
Sankaty Credit Opportunities Investors (Offshore) IV, L.P., a Cayman Islands exempted limited partnership (“SCOIO IV”), is the sole general partner of Sankaty Credit Opportunities (Offshore Master) IV, L.P., a Cayman Islands exempted limited partnership (“COPs IV Offshore”). Bain Capital Credit Member II, Ltd., a Cayman Islands exempted limited partnership (“BCCMII”) is the sole general partner of SCOIO IV. By virtue of these relationships, BCCMII may be deemed to share voting and dispositive power with respect to the shares of common stock held by COPs IV Offshore. BCCMII and each of the entities noted above disclaim beneficial ownership of such securities except to the extent of its pecuniary interest therein.
Sankaty High Yield Asset Investors II, LLC, a Delaware limited liability company (“SHYA II”), is the trustee of Sankaty High Yield Partners II Grantor Trust (“Sankaty II”). Sankaty Investors II, LLC, a Delaware limited liability company (“SI II”), is the managing member of SHYA II. Sankaty High Yield Asset Investors III, LLC, a Delaware limited liability company (“SHYA III”), is the trustee of Sankaty High Yield Partners III Grantor Trust (“Sankaty III”). Sankaty Investors III, LLC, a Delaware limited liability company (“SI III”), is the managing member of SHYA III. By virtue of these relationships, SI II and SI III may be deemed to share voting and dispositive power with respect to the shares of common stock held by Sankaty II and Sankaty III. SI II, Sankaty III and each of the entities noted above disclaim beneficial ownership of such securities except to the extent of its pecuniary interest therein.
Bain Capital Credit is the sole member of SR Group, LLC, a Delaware limited liability company (“SR”). Bain Capital Credit may be deemed to share voting and dispositive power with respect to the shares of common stock held by SR. Bain Capital Credit disclaims beneficial ownership of such securities except to the extent of its pecuniary interest therein.
The business address of each of the entities above is c/o Bain Capital Credit, LP, 200 Clarendon Street, Boston, MA 02116.
(7) | Represents all equity interests of Caspian HLSC1 LLC, Caspian Select Credit Master Fund Ltd., Caspian Solitude Master Fund L.P., Caspian SC Holdings LP, Mariner LDC and one other account advised by Caspian Capital LP (collectively, the “Caspian Funds”). The mailing address of all Caspian Funds except Mariner LDC is 767 Fifth Avenue, 45th Floor, New York, New York 10153. The mailing address of Mariner LDC is c/o Mariner Investment Group, 500 Mamaroneck Avenue, Harrison, New York |
151
10528. Since June 1, 2013, Aleris International’s 6% exchangeable senior subordinated exchangeable notes are exchangeable for shares of Aleris Corporation common stock at any time at the holder’s option. Therefore, the shares reported as beneficially owned in the above table include the number of shares of common stock issuable upon exchange of the $2,286,729 aggregate principal amount of Aleris International’s 6% senior subordinated exchangeable notes (convertible into 136,358 shares of Aleris Corporation common stock) held by the Caspian Funds. Mr. Adam Cohen and Mr. David Corleto each have sole voting and dispositive power with respect to the shares of common stock reported as beneficially owned by the Caspian Funds. Mr. Cohen and Mr. Corleto disclaim beneficial ownership of such securities except to the extent of their pecuniary interest therein.
(8) | With respect to the less than 1% of shares held directly by each of Ms. Stephens and Messrs. Hinchman, Laibow, O’Leary and Vazales, these shares are held for the benefit of OCM FIE, LLC (“FIE”), a wholly owned subsidiary of Oaktree. |
Each of Ms. Stephens and Messrs. Hinchman, Laibow, O’Leary and Vazales is an officer of one or more Oaktree entities. As part of her or his employment with Oaktree and pursuant to the policies of Oaktree Capital Management, L.P., each of Ms. Stephens and Messrs. Hinchman, Laibow, O’Leary and Vazales must hold such shares, if applicable, on behalf of and for the sole benefit of FIE and has assigned all economic, pecuniary and voting rights to FIE. Each of Ms. Stephens and Messrs. Hinchman, Laibow, O’Leary and Vazales disclaims beneficial ownership of such securities, except to the extent of any indirect pecuniary interest therein.
152
ITEM 13. CERTAIN RELATIONSHIPS AND RELATED TRANSACTIONS AND, DIRECTOR INDEPENDENCE.
Stockholders Agreement
On June 1, 2010, Aleris Corporation entered into a stockholders agreement with the Investors and each other holder of Aleris Corporation’s common stock (together with the Investors, the “Stockholders”) that provides for, among other things,
▪ | a right of the Oaktree Funds to designate a certain number of directors to our board of directors; |
▪ | certain limitations on the transfer of Aleris Corporation’s common stock, including limitations on transfers to competitors or affiliates of competitors of Aleris; |
▪ | information rights for the Investors with respect to financial statements of Aleris Corporation and its subsidiaries; |
▪ | the ability of a Stockholder to “tag-along” their shares of Aleris Corporation common stock to sales by the Oaktree Funds or, under certain limited circumstances, the Apollo Funds to a non-affiliated third party entity, and the ability of Stockholders to “drag-along” Aleris Corporation’s common stock held by the other Stockholders under certain circumstances; and |
▪ | the right of certain Stockholders to purchase a pro rata portion of new securities offered by Aleris Corporation in certain circumstances. |
Registration Rights Agreement
On June 1, 2010, Aleris Corporation entered into a registration rights agreement with the Oaktree Funds, the Apollo Funds and holders of at least 5% of Aleris Corporation’s outstanding common stock pursuant to which the Investors and other 10% Stockholders have certain demand registration rights with respect to Aleris Corporation’s common stock. Under this agreement, Aleris Corporation agreed to assume the fees and expenses (other than underwriting discounts and commissions) associated with registration. The registration rights agreement also contains customary provisions with respect to registration proceedings, underwritten offerings and indemnity and contribution rights. There are no cash penalties under the Registration Rights Agreement.
Composition of Our Board of Directors
Our Board of Directors consists of ten directors, one of which is our Chairman and Chief Executive Officer and five of which were appointed by the Oaktree Funds which own indirectly a majority of our outstanding equity. The five directors appointed by the Oaktree Funds are Messrs. Hinchman, Laibow, O’Leary and Vazales and Ms. Stephens. Our bylaws provide that our directors will be elected at the annual meeting of the stockholders and each director will be elected to serve until his or her successor is elected.
Director Independence
Because of our status as a voluntary filer and because we are a privately held corporation, we have not formally reviewed the independence of each of our directors in accordance with current listing standards. We consider Mr. Stack an “executive director” due to his employment relationship with us. We consider Messrs. Hinchman, Laibow, O’Leary and Vazales and Ms. Stephens “Oaktree affiliated directors” as they were designated as directors by the Oaktree Funds, our largest indirect stockholder owning a majority of our outstanding equity, pursuant to our Stockholders Agreement. We consider Messrs. Michelini, Misheff, Stranghoener and Wagoner to be “non-Oaktree affiliated directors” since they were appointed as directors in the normal course.
Related Party Transactions
Transactions with our directors, executive officers, principal stockholders or affiliates must be at terms that are no less than favorable to us than those available from third parties and must be approved in advance by a majority of disinterested members of our Board of Directors. While not in writing, this is a policy that the Board of Directors follows with respect to related party transactions and any approval with respect to a particular transaction is appropriately evidenced in Board of Director proceedings.
153
ITEM 14. PRINCIPAL ACCOUNTING FEES AND SERVICES.
The aggregate fees billed for professional services by Ernst & Young LLP in 2017 and 2016 were:
Type of Fees | 2017 | 2016 | ||||||
(in thousands) | ||||||||
Audit fees | $ | 3,741 | $ | 3,867 | ||||
Audit related fees | 13 | 230 | ||||||
Tax fees | — | 35 | ||||||
Total | $ | 3,754 | $ | 4,132 | ||||
In the above table, in accordance with the SEC’s definitions and rules, “audit fees” are fees the Company paid Ernst & Young LLP for professional services for the audit of the Company’s consolidated financial statements included in its annual report, the audit of the Company’s internal control over financial reporting and the review of the Company’s quarterly financial statements included in quarterly reports on Form 10-Q, as well as for services that are normally provided by the accounting firm in connection with statutory and regulatory filings or engagements, including foreign statutory audits, and for services provided in connection with the 2017 and 2016 debt offerings. “Audit related fees” are fees for assurance and related services that are reasonably related to the performance of the audit or review of Aleris’s financial statements. “Tax fees” are fees for tax compliance, tax advice and tax planning.
The Audit Committee has adopted pre-approval policies and procedures requiring the Audit Committee, or its Chairman in some cases, to pre-approve all audit and non-audit services to be provided by Ernst & Young LLP.
PART IV
ITEM 15. EXHIBITS AND FINANCIAL STATEMENT SCHEDULES.
(a)(1) Financial Statements
See Item 8. – “Financial Statements and Supplementary Data.”
(a)(2) Financial Statement Schedules
We have omitted financial statement schedules because they are not required or are not applicable, or the required information is shown in the consolidated financial statements or the notes to the consolidated financial statements. See Item 8. – “Financial Statements and Supplementary Data.”
(a)(3) Exhibits
The exhibits that are incorporated by reference in the annual report on Form 10-K, or are filed with this annual report on Form 10-K, are listed in the EXHIBIT INDEX following the signature page of this Report.
ITEM 16. 10-K SUMMARY.
None.
154
SIGNATURES
Pursuant to the requirements of Section 13 or 15(d) of the Securities Exchange Act of 1934, the registrant has duly caused this report to be signed on its behalf by the undersigned, thereunto duly authorized.
ALERIS CORPORATION | ||
March 20, 2018 | By: | /s/ Eric M. Rychel |
Eric M. Rychel Executive Vice President, Chief Financial Officer and Treasurer | ||
Pursuant to the requirements of the Securities Exchange Act of 1934, this report has been signed below by the following persons on behalf of the registrant and in the capacities and on the dates indicated.
155
Signature | Title | Date | ||
/s/ Sean M. Stack | Chairman and Chief Executive Officer and Director | March 20, 2018 | ||
Sean M. Stack | (Principal Executive Officer) | |||
/s/ Eric M. Rychel | Executive Vice President, Chief | March 20, 2018 | ||
Eric M. Rychel | Financial Officer and Treasurer | |||
(Principal Financial Officer) | ||||
/s/ I. Timothy Trombetta | Vice President and Controller | March 20, 2018 | ||
I. Timothy Trombetta | (Principal Accounting Officer) | |||
/s/ Brook D. Hinchman | Director | March 20, 2018 | ||
Brook D. Hinchman | ||||
/s/ Brian K. Laibow | Director | March 20, 2018 | ||
Brian K. Laibow | ||||
/s/ Matthew R. Michelini | Director | March 20, 2018 | ||
Matthew R. Michelini | ||||
/s/ Donald T. Misheff | Director | March 20, 2018 | ||
Donald T. Misheff | ||||
Director | March 20, 2018 | |||
Robert O’Leary | ||||
/s/ Emily Stephens | Director | March 20, 2018 | ||
Emily Stephens | ||||
Director | March 20, 2018 | |||
Lawrence W. Stranghoener | ||||
/s/ Kaj Vazales | Director | March 20, 2018 | ||
Kaj Vazales | ||||
/s/ G. Richard Wagoner, Jr. | Director | March 20, 2018 | ||
G. Richard Wagoner, Jr. | ||||
156
Exhibit Index | ||
Exhibit | ||
Number | Description | |
2.1 | First Amended Joint Plan of Reorganization of Aleris International, Inc. and its Affiliated Debtors, as modified, Mar. 19, 2010 (filed as Exhibit 2.1 to Aleris International, Inc.’s Registration Statement on Form S-4 (File No. 333-173180), and incorporated herein by reference). |
2.2 | Purchase and Sale Agreement, dated October 17, 2014, among Aleris Corporation, Aleris International, Inc., Aleris Aluminum Netherlands B.V., Aleris Deutschland Holding GmbH, Aleris Holding Canada Limited, Dutch Aluminum C.V., Aleris Deutschland Vier GmbH Co KG, SGH Acquisition Holding, Inc., Evergreen Holding Germany GmbH and Signature Group Holdings, Inc. (filed as Exhibit 2.1 to Aleris Corporation’s Current Report on Form 8-K (File No. 333-185443) filed October 23, 2014, and incorporated herein by reference). |
2.2.1 | Amendment No. 1 to the Purchase and Sale Agreement dated as of January 26, 2015, by and among Aleris Corporation and Real Alloy Holding, Inc. (f/k/a SGH Acquisition Holdco, Inc.) (filed as Exhibit 2.1 to Aleris Corporation’s Quarterly Report on Form 10-Q (File No. 333-185443) filed August 4, 2015, and incorporated herein by reference). |
2.2.2 | Amendment No. 2 to the Purchase and Sale Agreement dated as of February 26, 2015, by and among Aleris Corporation and Real Alloy Holding, Inc. (f/k/a SGH Acquisition Holdco, Inc.) (filed as Exhibit 2.2 to Aleris Corporation’s Quarterly Report on Form 10-Q (File No. 333-185443) filed August 4, 2015, and incorporated herein by reference). |
2.3 | Backstop Agreement, dated October 17, 2014, between Aleris Corporation and Signature Group Holdings, Inc. (filed as Exhibit 2.2 to Aleris Corporation’s Current Report on Form 8-K (File No. 333-185443) filed October 23, 2014, and incorporated herein by reference). |
3.1 | Certificate of Incorporation of Aleris Corporation, as amended (filed as Exhibit 3.1 to Aleris Corporation’s Annual Report on Form 10-K (File No. 333-185443) filed March 14, 2014, and incorporated by reference herein). |
3.2 | Amended and Restated Bylaws of Aleris Holding Company (n/k/a Aleris Corporation) (filed as Exhibit 3.2 to Aleris Corporation’s Annual Report on Form 10-K (File No. 333-185443) filed March 14, 2014, and incorporated by reference herein). |
4.1 | Stockholders Agreement, dated June 1, 2010, between Aleris Holding Company and the stockholders of Aleris Holding Company named therein (filed as Exhibit 10.9 to Aleris International, Inc.’s Registration Statement Form on S-4 (File No. 333-173180), and incorporated herein by reference). |
4.2 | Registration Rights Agreement, dated June 1, 2010, among Aleris Holding Company and the parties listed therein (filed as Exhibit 10.3.1 to Aleris International, Inc.’s Registration Statement on Form S-4 (File No. 333-173180), and incorporated herein by reference). |
4.3 | Indenture, dated as of October 23, 2012, among Aleris International, Inc., as issuer, the guarantors named therein and U.S. Bank National Association, as trustee (filed as Exhibit 4.1 to Aleris International, Inc.’s Current Report on Form 8-K (File No. 333-173170) filed October 25, 2012, and incorporated herein by reference). |
4.3.1 | First Supplemental Indenture, dated as of December 12, 2012, among Aleris Corporation, Aleris International, Inc., the guarantors named therein and U.S. Bank National Association, as trustee, to the Indenture dated as of October, 23, 2012, among the Company, the guarantors named therein, and U.S. Bank National Association, as trustee (filed as Exhibit 4.10 to Aleris International, Inc.’s Registration Statement on Form S-4 (File No. 333-185443), and incorporated herein by reference). |
4.3.2 | Form of 7 7/8% Senior Notes due 2020 (included as part of Exhibit 4.3 above). |
4.4 | Indenture, dated as of April 4, 2016, among Aleris International, Inc., as issuer, the guarantors named therein and U.S. Bank National Association, as trustee and collateral agent (filed as Exhibit 4.1 to Aleris |
157
Exhibit | ||
Number | Description | |
Corporation’s Current Report on Form 8-K (File No. 333-185443) filed April 8, 2016, and incorporated herein by reference).
4.4.1 | First Supplemental Indenture, dated as of February 14, 2017, among Aleris International, Inc., Aleris Corporation, the guarantors named therein and U.S. Bank National Association, as trustee and collateral agent (filed as Exhibit 4.2 to Aleris Corporation’s Current Report on Form 8-K (File No. 333-185443) filed February 16, 2017, and incorporated herein by reference). |
4.4.2 | Form of 9½% Senior Secured Notes due 2021 (included as part of Exhibit 4.4 above). |
10.1 | Security Agreement, dated as of April 4, 2016, among Aleris International, Inc., as issuer, the guarantors party thereto and U.S. Bank National Association, as collateral agent (filed as Exhibit 10.1 to Aleris Corporation’s Current Report on Form 8-K (File No. 333-185443) filed April 7, 2016, and incorporated herein by reference). |
10.2 | Syndicated Facility Agreement, dated as of August 8, 2012, between Aleris Dinsheng Aluminum (Zhenjiang) Co. Ltd. (n/k/a Aleris Aluminum (Zhenjiang) Co., Ltd.), as borrower, with Bank of China Limited, Zhenjiang Branch, as lead arranger; Agricultural Bank of China Limited, Zhenjiang Branch, as secondary arranger; Bank of China Limited, Zhenjiang Jingkou Sub-Branch, as facility agent and security agent; and Bank of China Limited, Zhenjiang Jingkou Sub-Branch, Agricultural Bank of China Limited, Zhenjiang Runshou Sub-Branch, and Shanghai Pudong Development Bank, Luwan Sub-Branch (as lenders) (English translation) (filed as Exhibit 10.3 to Aleris Corporation’s Annual Report on Form 10-K (File No. 333-185443) filed March 5, 2013, and incorporated herein by reference). |
10.2.1 | Agreement on New Syndicated Loan Amortization Schedule for Syndicated Loan, dated as of December 21, 2016, among Aleris Aluminum (Zhenjiang) Co., Ltd., Bank of China Limited, Zhenjiang Jingkou Sub-branch and Agricultural Bank of China Limited, Zhenjiang Jingkou Sub-branch (English translation) (filed as Exhibit 10.2.1 to Aleris Corporation’s Annual Report on Form 10-K (File No. 333-185443) filed March 3, 2017, and incorporated herein by reference). |
10.2.2 | Mortgage Agreement, dated as of December 21, 2016, between Aleris Aluminum (Zhenjiang) Co., Ltd., as mortgagor, and Bank of China Limited, Zhenjiang Jingkou Sub-branch, as security agent (English translation) (filed as Exhibit 10.2.2 to Aleris Corporation’s Annual Report on Form 10-K (File No. 333-185443) filed March 3, 2017, and incorporated herein by reference). |
10.2.3 | Deposit Pledge Agreement, dated as of December 21, 2016, between Aleris Aluminum (Zhenjiang) Co., Ltd., as pledgor, and Bank of China Limited, Zhenjiang Jingkou Sub-branch, as pledgee (English translation) (filed as Exhibit 10.2.3 to Aleris Corporation’s Annual Report on Form 10-K (File No. 333-185443) filed March 3, 2017, and incorporated herein by reference). |
10.2.4 | Supplemental Agreement to Working Capital Loan Agreement, dated as of December 21, 2016, between Aleris Aluminum (Zhenjiang) Co., Ltd., and Bank of China Limited, Zhenjiang Jingkou Sub-branch (English translation) (filed as Exhibit 10.2.4 to Aleris Corporation’s Annual Report on Form 10-K (File No. 333-185443) filed March 3, 2017, and incorporated herein by reference). |
10.2.5 | Maximum Pledge Contract, dated as of January 24, 2017, by and between Aleris Aluminum (Zhenjiang) Co. Ltd., as borrower, and Bank of China Limited, Zhenjiang Jingkou Sub-Branch, as the lender (English translation) (filed as Exhibit 10.1 to Aleris Corporation’s Quarterly Report on Form 10-Q (File No. 333-185443) filed May 4, 2017, and incorporated herein by reference). |
10.2.6 | Contract for Tax Refund VAT Account Pledge, dated as of January 24, 2017, by and between Aleris Aluminum (Zhenjiang) Co. Ltd., as borrower, and Bank of China Limited, Zhenjiang Jingkou Sub-Branch, as the lender (English translation) (filed as Exhibit 10.2 to Aleris Corporation’s Quarterly Report on Form 10-Q (File No. 333-185443) filed May 4, 2017, and incorporated herein by reference). |
10.3 | Revolving Loan Facility Agreement, dated as of August 22, 2012, between Aleris Dingsheng Aluminum (Zhenjiang) Co. Ltd. (n/k/a Aleris Aluminum (Zhenjiang) Co., Ltd.), as borrower, and Bank of China Limited, |
158
Exhibit | ||
Number | Description | |
Zhenjiang Jingkou Sub-Branch, as the lender (English translation) (filed as Exhibit 10.29 to Aleris Corporation’s Annual Report on Form 10-K (File No. 333-185443) filed March 5, 2013 and incorporated herein by reference).
10.3.1 | Amendment Agreement to Facility Agreement, dated as of March 25, 2013, between Aleris Aluminum (Zhenjiang) Co. Ltd., as borrower, and Bank of China Limited, Zhenjiang Jingkou Sub-Branch, as the lender (English translation) (filed as Exhibit 10.1 to Aleris Corporation’s Quarterly Report on Form 10-Q (File No. 333-185443) filed May 9, 2013, and incorporated herein by reference). |
10.4 | Credit Agreement, dated June 15, 2015, among Aleris International, Inc., the other Domestic Borrowers party thereto, the European Borrowers and other Loan Parties party thereto, JPMorgan Chase Bank, N.A., as Administrative Agent, and the Lenders and other parties party thereto (filed as Exhibit 10.1 to Aleris Corporation’s Current Report on Form 8-K (File No. 333-185443) filed June 19, 2015, and incorporated herein by reference). |
10.4.1 | Amendment No. 1 to Credit Agreement, dated as of March 18, 2016, by and between Aleris International, Inc. and JP Morgan Chase Bank, N.A. (as Administrative Agent) (filed as exhibit 10.4.1 to Aleris Corporations Quarterly Report on Form 10-Q (File No. 333-185443) filed May 5, 2016, and incorporated herein by reference). |
10.4.2 | Amendment No. 2 to Credit Agreement, dated as of February 8, 2017, by and between Aleris International, Inc., the other Domestic Borrowers party thereto, the European Borrowers and other Loan Parties party thereto, JP Morgan Chase Bank, N.A. (as Administrative Agent), and the Lenders and other parties party thereto (filed as Exhibit 10.4.2 to Aleris Corporation’s Annual Report on Form 10-K (File No. 333-185443) filed March 3, 2017, and incorporated herein by reference). |
10.4.3 | Form of Amendment No. 3 to Credit Agreement, dated as of December 22, 2017, by and among Aleris International, Inc., the other borrowers and loan parties thereto, the lenders party thereto, JP Morgan Chase Bank, N.A., as administrative agent, J.P. Morgan Europe Limited, as European Agent, Bank of America, N.A., as syndication agent, and Barclays Bank PLC and Deutsche Bank Securities Inc., as syndication agents (filed as Exhibit 10.1 to Aleris Corporation’s Current Report on Form 8-K (File No. 333-185443) filed December 28, 2017, and incorporated herein by reference). |
10.5 | Pledge and Security Agreement, dated June 15, 2015, among Aleris International, Inc., the other Domestic Borrowers party thereto, the other Loan Parties party thereto and JPMorgan Chase Bank, N.A., as Administrative Agent (filed as Exhibit 10.2 to Aleris Corporation’s Current Report on Form 8-K (File No. 333-185443) filed June 19, 2015, and incorporated herein by reference). |
10.6† | Amended and Restated Employment Agreement, effective as of July 11, 2015, by and among Aleris Corporation, Aleris International, Inc. and Sean Stack (filed as Exhibit 10.1 to Aleris Corporation’s Current Report on Form 8-K (File No. 333-185443) filed October 13, 2015, and incorporated herein by reference). |
10.6.1† | Form of Amendment, dated November 13, 2017, to the Amended and Restated Employment Agreement, effective as of July 11, 2015, by and among Aleris International, Inc. and Sean Stack (filed as Exhibit 10.1 to Aleris Corporation’s Current Report on Form 8-K (File No. 333-185443) filed November 15, 2017, and incorporated herein by reference). |
10.7† | Form of Executive Employment Agreement with Aleris International, Inc. and the Company (filed as Exhibit 10.39 to Aleris Corporation’s Annual Report on Form 10-K (File No. 333-185443) filed March 27, 2015, and incorporated herein by reference). |
10.7.1† | Form of Amendment to U.S. Executive Agreement (filed as Exhibit 10.3 to Aleris Corporation’s Current Report on Form 8-K (File No. 333-185443) filed November 15, 2017, and incorporated herein by reference). |
10.7.2†* | Form of Amendment to U.S. Executive Agreement with Sean M. Stack, Eric M. Rychel, Michael T. Keown, Christopher R. Clegg and Tamara S. Polmanteer. |
159
Exhibit | ||
Number | Description | |
10.8† | Form of Employment Agreement dated as of June 1, 2010 by and between Aleris International, Inc., Aleris Holding Company and Christopher R. Clegg (filed as Exhibit 10.7 to Aleris International, Inc.’s Registration Statement on Form S-4 (File No. 333-173180), and incorporated herein by reference). |
10.8.1† | Form of Amendment of Form of Employment Agreement by and between Aleris Corporation and Christopher R. Clegg (filed as Exhibit 10.6.1 to Aleris Corporation’s Amendment No. 9 to Registration Statement on Form S-1 (File No. 333-173721), and incorporated herein by reference). |
10.8.2† | Form of Amendment to Employment Agreement by and between Aleris International, Inc., Aleris Corporation and Christopher R. Clegg, (filed as Exhibit 10.6 to Aleris Corporation’s Current Report on Form 8-K (File No. 333-173721) filed January 22, 2014, and incorporated herein by reference). |
10.9† | Form of Employment Agreement For Employee, between Aleris Aluminum Duffel BVBA and Mr. Jack (Jacobus A. J.) Govers (filed as Exhibit 10.9 to Aleris Corporation’s Annual Report on Form 10-K (File No. 333-185443) filed March 3, 2017, and incorporated herein by reference). |
10.9.1† | Form of Amendment 1 to the Employment Agreement between Aleris Aluminum Duffel BVBA and Mr. Jack (Jacobus A. J.) Govers (filed as Exhibit 10.4 to Aleris Corporation’s Current Report on Form 8-K (File No. 333-185443) filed November 15, 2017, and incorporated herein by reference). |
10.10† | Aleris Holding Company (n/k/a Aleris Corporation) 2010 Equity Incentive Plan, effective as of June 1, 2010 (filed as Exhibit 10.8 to Aleris International’s Registration Statement on Form S-4 (File No. 333-173180), and incorporated herein by reference). |
10.10.1† | Amendment to Aleris Holding Company (n/k/a Aleris Corporation) 2010 Equity Incentive Plan, effective as of September 15, 2013 (filed as Exhibit 10.5 to Aleris Corporation’s Quarterly Report on Form 10-Q (File No. 333-185443), filed November 7, 2013, and incorporated herein by reference). |
10.10.2† | Amendment to Aleris Holding Company (n/k/a Aleris Corporation) 2010 Equity Incentive Plan, effective as of January 15, 2014 (filed as Exhibit 10.1 to Aleris Corporation’s Current Report on Form 8-K (File No. 333-185443), filed January 22, 2014, and incorporated herein by reference). |
10.10.3† | Amendment to Aleris Holding Company (n/k/a Aleris Corporation) 2010 Equity Incentive Plan, effective as of January 21, 2014 (filed as Exhibit 10.2 to Aleris Corporation’s Current Report on Form 8-K (File No. 333-185443), filed January 22, 2014, and incorporated herein by reference). |
10.11† | Form of Aleris Holding Company (n/k/a Aleris Corporation) 2010 Equity Incentive Plan Stock Option Agreement, dated as of June 1, 2010 between Aleris Holding Company and each of Sean M. Stack and Christopher R. Clegg (filed as Exhibit 10.11 to Aleris International, Inc.’s Registration Statement on Form S-4 (File No. 333-173180), and incorporated herein by reference). |
10.11.1† | Form of Amendment 1 to the Aleris Corporation 2010 Equity Incentive Plan Stock Option Agreement between Aleris Corporation and each of Sean M. Stack and Christopher R. Clegg (filed as Exhibit 10.10.1 to Aleris International, Inc.’s Amendment No. 3 to Registration Statement on Form S-4 (File No. 333-173180), and incorporated herein by reference). |
10.11.2† | Form of Amendment 2 to the Aleris Corporation 2010 Equity Incentive Plan Stock Option Agreement between Aleris Corporation and each of Sean M. Stack and Christopher R. Clegg (filed as Exhibit 10.9.2 to Aleris Corporation’s Amendment No. 9 to Registration Statement on Form S-1 (File No. 333-173721), and incorporated herein by reference). |
10.12† | Form of Aleris Corporation 2010 Equity Incentive Plan Management Restricted Stock Unit Award Agreement (filed as Exhibit 10.1 to Aleris Corporation’s Current Report on Form 8-K/A (File No. 333-185443, SEC Accession No. 0001518587-14-000028) filed April 21, 2014, and incorporated herein by reference). |
10.13† | Aleris Holding Company (n/k/a Aleris Corporation) 2010 Equity Incentive Plan Restricted Stock Unit Agreement, dated as of June 1, 2010 between Aleris Holding Company and Sean M. Stack (filed as Exhibit 10.15 to Aleris International, Inc.’s Registration Statement on Form S-4 (File No. 333-173180), and incorporated herein by reference). |
160
Exhibit | ||
Number | Description | |
10.13.1† | Amendment 2 to the Aleris Corporation 2010 Equity Incentive Plan Restricted Stock Unit Agreement between Aleris Corporation and Sean M. Stack (filed as Exhibit 10.13.1 to Aleris Corporation’s Amendment No. 9 to Registration Statement on Form S-1 (File No. 333-185443), and incorporated herein by reference). |
10.14† | Form of Aleris Holding Company (n/k/a Aleris Corporation) 2010 Equity Incentive Plan Restricted Stock Unit Agreement dated as of June 1, 2010 between Aleris Holding Company and Christopher R. Clegg (filed as Exhibit 10.14 to Aleris International, Inc.’s Registration Statement on Form S-4 (File No. 333-173180), and incorporated herein by reference). |
10.14.1† | Form of Amendment 1 to the Aleris Corporation 2010 Equity Incentive Plan Restricted Stock Unit Agreement between Aleris Corporation and Christopher R. Clegg (filed as Exhibit 10.14.1 to Aleris Corporation’s Amendment No. 9 to Registration Statement on Form S-1 (File No. 333-173721), and incorporated herein by reference). |
10.15† | Form of Aleris Corporation 2010 Equity Incentive Plan Management Stock Option Award Agreement (filed as Exhibit 10.2 to Aleris Corporation’s Current Report on Form 8-K/A (File No. 333-185443, SEC Accession No. 0001518587-14-000028) filed April 21, 2014, and incorporated herein by reference). |
10.16† | Aleris International, Inc. Deferred Compensation and Retirement Benefit Restoration Plan, effective January 1, 2009 (filed as Exhibit 10.19 to Aleris International, Inc.’s Registration Statement on Form S-4 (File No. 333-173180), and incorporated herein by reference). |
10.17† | Restated Aleris Cash Balance Plan, as amended and restated as of January 1, 2016 (filed as Exhibit 10.19.1 to Aleris Corporation’s Annual Report on Form 10-K (File No. 333-185443) filed March 9, 2016, and incorporated herein by reference). |
10.18† | Addendum No. 7 to the Group Insurance Plan of February 20, 1996 for Aleris Belgium Duffel BVBA effective as of May 1, 2016 (English translation) (filed as Exhibit 10.18 to Aleris Corporation’s Annual Report on Form 10-K (File No. 333-185443) filed March 3, 2017, and incorporated herein by reference). |
10.19† | Form of Transaction Bonus Agreement between Aleris Corporation and each of Sean M. Stack, Eric M. Rychel, Jack (Jacobus A. J.) Govers, Christopher R. Clegg and Tamara S. Polmanteer (filed as Exhibit 10.19 to Aleris Corporation’s Annual Report on Form 10-K (File No. 333-185443) filed March 3, 2017, and incorporated herein by reference). |
10.19.1† | Form of Transaction Bonus Amendment between Aleris Corporation and each of Sean M. Stack, Eric M. Rychel, Jack (Jacobus A. J.) Govers, Christopher R. Clegg and Tamara S. Polmanteer (filed as Exhibit 10.1 to Aleris Corporation’s Quarterly Report on Form 10-Q (File No. 333-185443) filed August 9, 2017, and incorporated herein by reference). |
10.20† | Form of Aleris Holding Company (n/k/a Aleris Corporation) 2010 Equity Incentive Plan Director Stock Option Award Agreement with Brian Laibow (filed as Exhibit 10.23 to Aleris International, Inc.’s Registration Statement on Form S-4 (File No. 333-173180), and incorporated herein by reference). |
10.20.1† | Form of Amendment 2 to the Aleris Corporation 2010 Equity Incentive Plan Director Stock Option Award Agreement with Brian Laibow (filed as Exhibit 10.21.2 to Aleris Corporation’s Amendment No. 9 to Registration Statement on Form S-1 (File No. 333-173721), and incorporated herein by reference). |
10.21† | Form of Aleris Holding Company (n/k/a Aleris Corporation) 2010 Equity Incentive Plan Director Restricted Stock Unit Award Agreement with Brian Laibow (filed as Exhibit 10.24 to Aleris International, Inc.’s Registration Statement on Form S-4 (File No. 333-173180), and incorporated herein by reference). |
10.22† | Form of Aleris Holding Company (n/k/a Aleris Corporation) 2010 Equity Incentive Plan Director Stock Option Award Agreement with each of Lawrence Stranghoener and Emily Alexander (n/k/a Emily Stephens) (filed as Exhibit 10.25 to Aleris International, Inc.’s Registration Statement on Form S-4 (File No. 333-173180), and incorporated herein by reference). |
10.22.1† | Form of Amendment 2 to the Aleris Corporation 2010 Equity Incentive Plan Director Stock Option Award Agreement with each of Lawrence Stranghoener and Emily Stephens (filed as Exhibit 10.23.2 to Aleris |
161
Exhibit | ||
Number | Description | |
Corporation’s Amendment No. 9 to Registration Statement on Form S-1 (File No. 333-173721), and incorporated herein by reference).
10.23† | Form of Aleris Holding Company (n/k/a Aleris Corporation) 2010 Equity Incentive Plan Director Restricted Stock Unit Award Agreement with each of Lawrence Stranghoener and Emily Stephens (filed as Exhibit 10.26 to Aleris International, Inc.’s Registration Statement on Form S-4 (File No. 333-173180), and incorporated herein by reference). |
10.24† | Aleris Holding Company (n/k/a Aleris Corporation) 2010 Equity Incentive Plan Director Restricted Stock Award Agreement with G. Richard Wagoner, Jr. (filed as Exhibit 10.27 to Aleris International, Inc.’s Registration Statement on Form S-4 (File No. 333-173180), and incorporated herein by reference). |
10.25† | Form of Aleris Corporation 2010 Equity Incentive Plan Director Restricted Stock Unit Award Agreement (filed as Exhibit 10.30 to Aleris Corporation’s Amendment No. 9 to Registration Statement on Form S-1 (File No. 333-173721), and incorporated herein by reference). |
10.26† | Form of Aleris Corporation 2010 Equity Incentive Plan Director Stock Option Award Agreement (filed as Exhibit 10.31 to Aleris Corporation’s Amendment No. 9 to Registration Statement on Form S-1 (File No. 333-173721), and incorporated herein by reference). |
10.27† | Form of Aleris Corporation 2010 Equity Incentive Plan Director Stock Option Award Agreement Amendment (regarding equitable dividend adjustments) (filed as Exhibit 10.34 to Aleris Corporation’s Amendment No. 9 to Registration Statement on Form S-1 (File No. 333-173721), and incorporated herein by reference). |
10.28† | Form of Aleris Corporation 2010 Equity Incentive Plan Stock Option Award Agreement Amendment (regarding equitable dividend adjustments) (filed as Exhibit 10.35 to Aleris Corporation’s Amendment No. 9 to Registration Statement on Form S-1 (File No. 333-185443), and incorporated herein by reference). |
10.29† | Form of Aleris Corporation 2010 Equity Incentive Plan Executive Stock Option Agreement (filed as Exhibit 10.4 to Aleris Corporation’s Current Report on Form 8-K (File No. 333-173721) filed January 22, 2014, and incorporated herein by reference). |
10.30† | Form of Aleris Corporation 2010 Equity Incentive Plan Executive Restricted Stock Unit Agreement (filed as Exhibit 10.5 to Aleris Corporation’s Current Report on Form 8-K (File No. 333-173721) filed January 22, 2014, and incorporated herein by reference). |
10.31† | Form of Aleris Corporation 2010 Equity Incentive Plan Non-Employee Director Restricted Stock Unit Agreement (filed as Exhibit 10.7 to Aleris Corporation’s Current Report on Form 8-K (File No. 333-185443) filed January 22, 2014, and incorporated herein by reference). |
10.32† | Form of Retention Bonus Agreement between Aleris Corporation and each of Sean M. Stack, Eric M. Rychel, Jack (Jacobus A. J.) Govers, Christopher R. Clegg and Tamara S. Polmanteer (filed as Exhibit 10.5 to Aleris Corporation’s Current Report on Form 8-K (File No. 333-185443) filed November 15, 2017, and incorporated herein by reference). |
10.33† | Form of Aleris Corporation 2010 Equity Incentive Plan Executive Stock Option Agreement (filed as Exhibit 10.1 to Aleris Corporation’s Current Report on Form 8-K (File No. 333-185443) filed November 15, 2017, and incorporated herein by reference). |
21.1* | List of Subsidiaries of Aleris Corporation as of December 31, 2017. |
31.1* | Rule 13a-14(a)/15d-14(a) Certification of Aleris Corporation’s Chief Executive Officer. |
31.2* | Rule 13a-14(a)/15d-14(a) Certification of Aleris Corporation’s Chief Financial Officer. |
32.1* | Certification Pursuant to 18 U.S.C. Section 1350, as Adopted Pursuant to Section 906 of the Sarbanes-Oxley Act of 2002. |
101.INS* | XBRL Instance Document |
162
Exhibit | ||
Number | Description | |
101.SCH* | XBRL Taxonomy Extension Schema |
101.CAL* | XBRL Taxonomy Extension Calculation Linkbase |
101.DEF* | XBRL Taxonomy Extension Definition Linkbase |
101.LAB* | XBRL Taxonomy Extension Label Linkbase |
101.PRE* | XBRL Taxonomy Extension Presentation Linkbase |
________________________________________
† | Management contract or compensatory plan or arrangement |
* | Filed herewith. |
163